Image Quality and Interpretation of [18F]-FES-PET: Is There any Effect of Food Intake?


 ,
,  and
and 
Abstract
:1. Introduction
2. Materials and Methods
2.1. Patients
- (1)
- Chocolate group (used as a fatty meal), which included 20 prospectively collected, consecutive patients who ate a chocolate bar directly after tracer injection and before [18F]-FES-PET imaging. The weight of the milk chocolate bar was 47 g, and contained 248 kcal (1036 kJ). The amount of fat was 14 g, or 20% of total daily fat intake.
- (2)
- Fasting group (n = 20), which included retrospectively collected patients without any food intake at least 4–6 h prior to the [18F]-FES-PET scan, and patients who were instructed to fast due to combined contrast-enhanced CT-scan.
- (3)
- Control group without any diet restrictions prior to tracer injection (which was our standard patient preparation; n = 20). This group was also retrospectively selected from a larger database.
2.2. Study Design
2.3. [18F]-FES-PET
2.4. [18F]-FES-PET Data Analysis
2.5. Statistical Analysis
3. Results
3.1. Patients
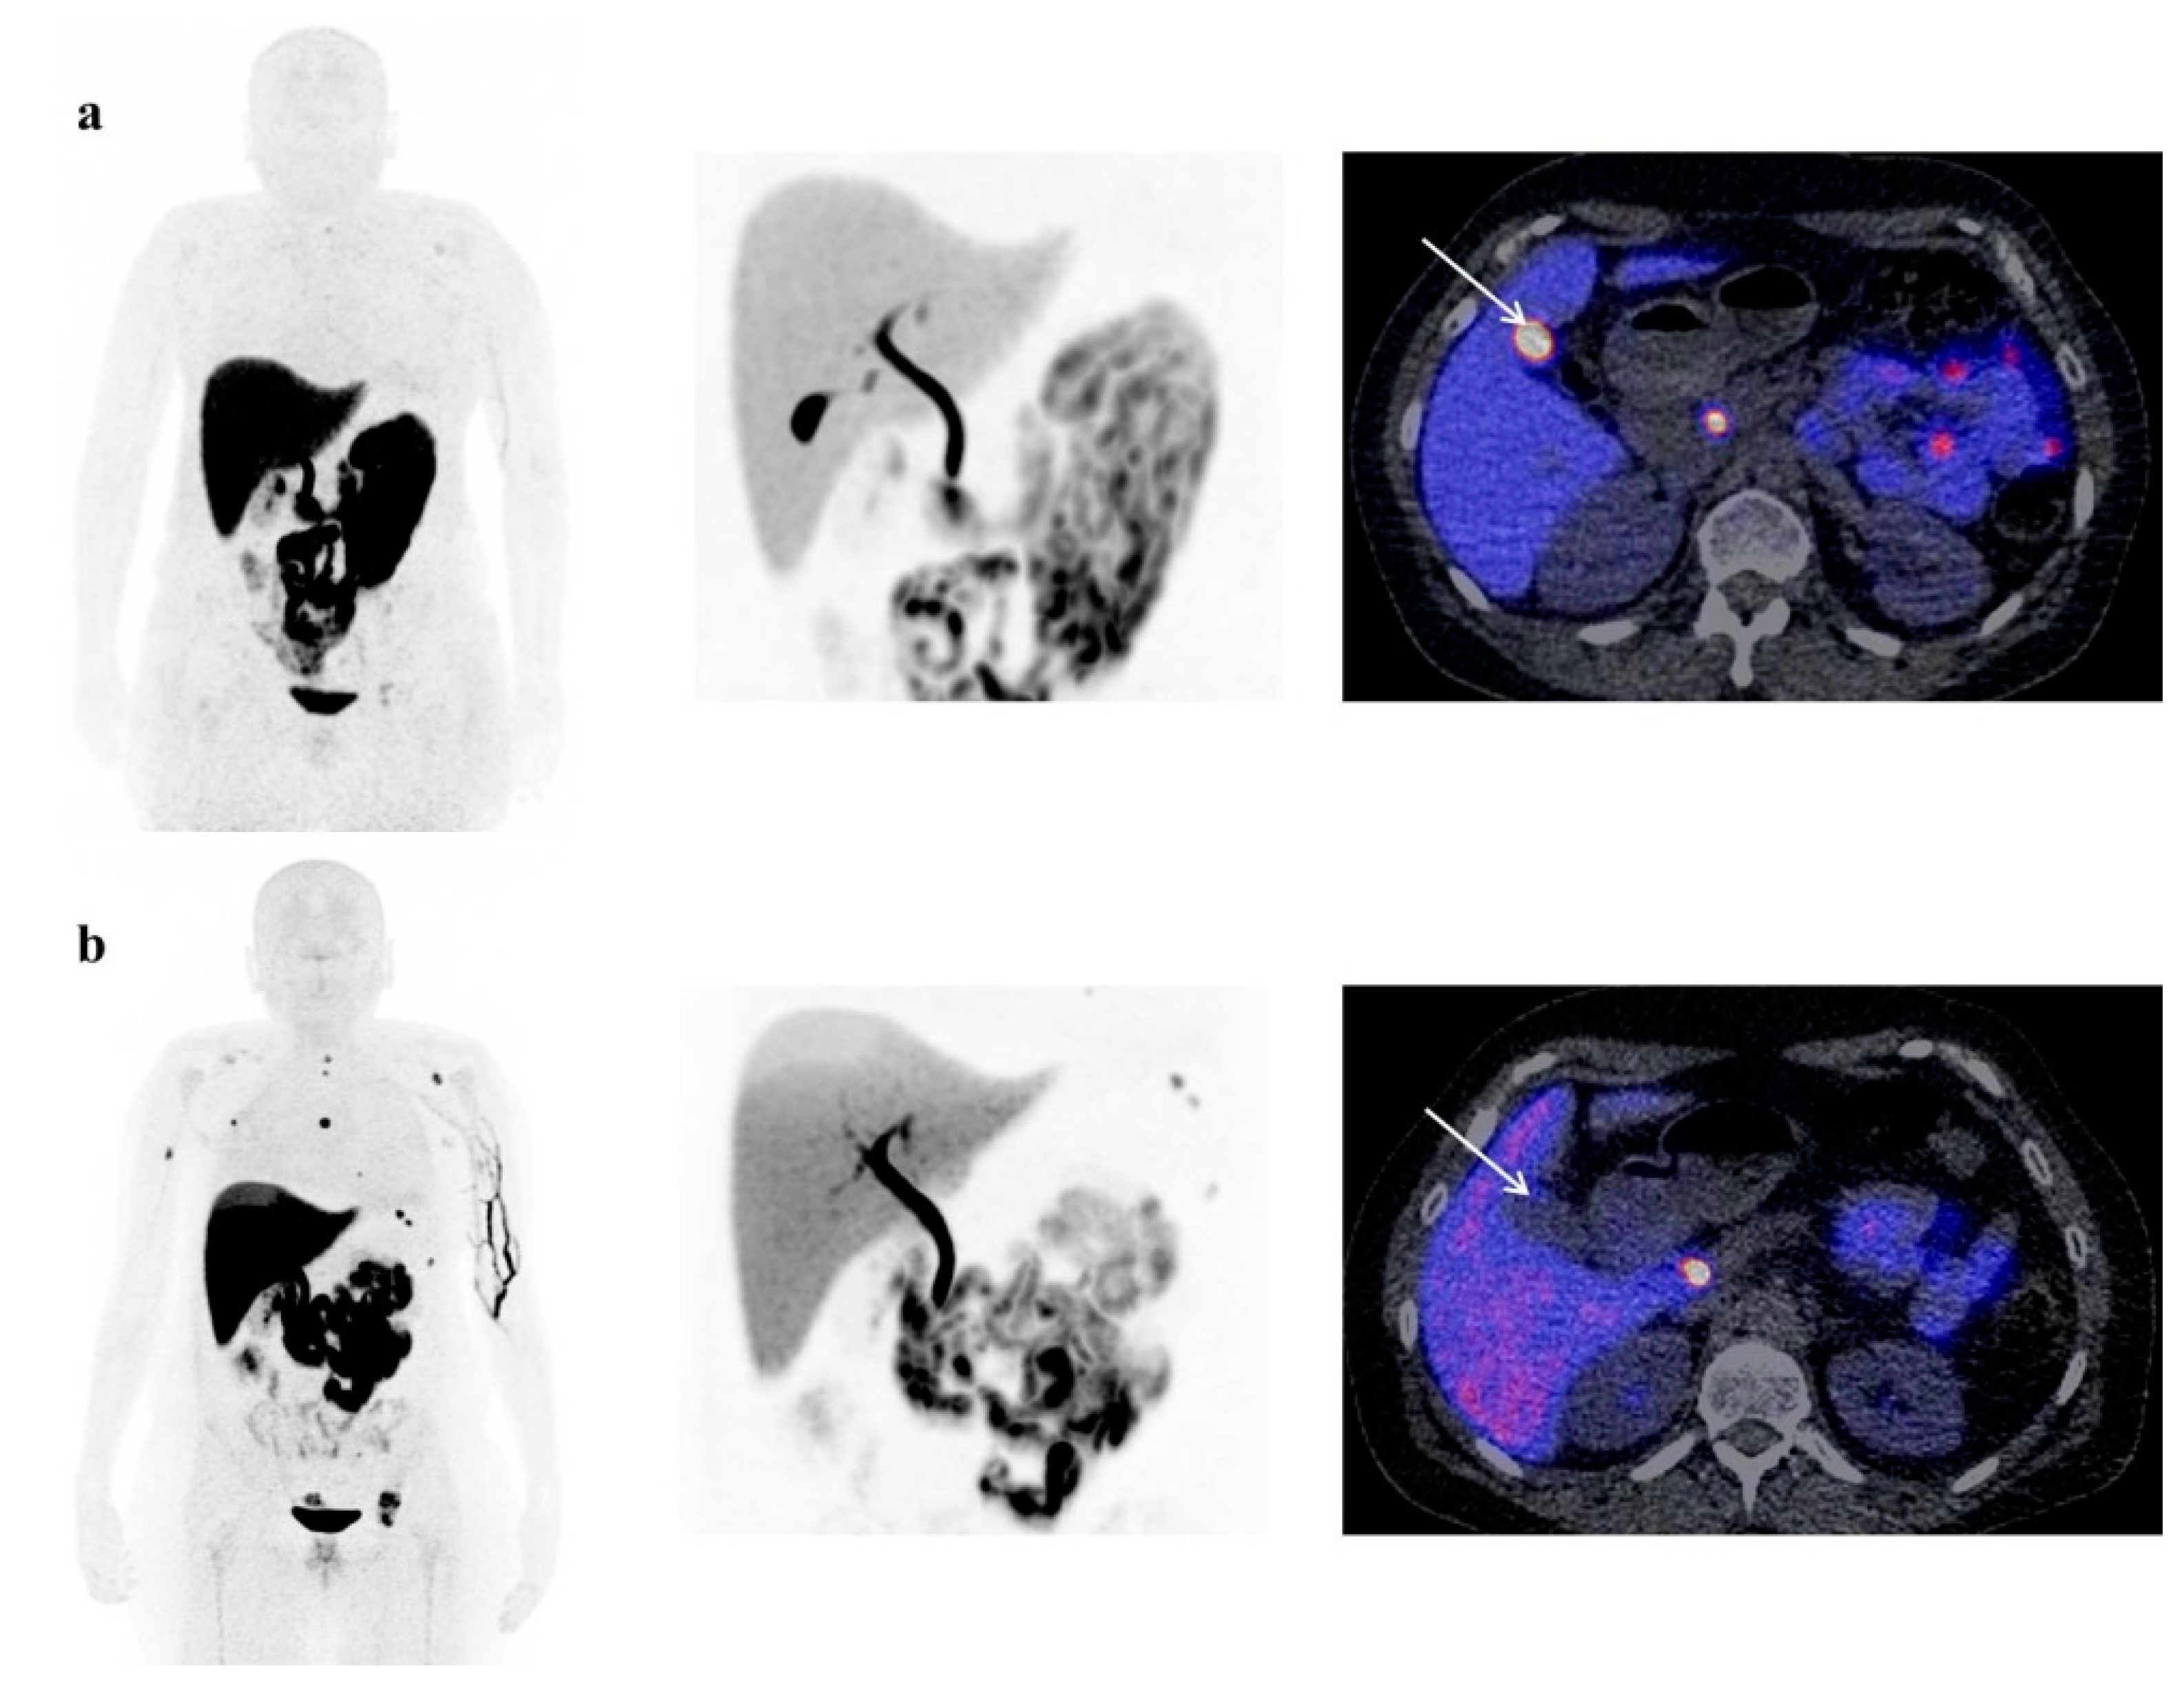
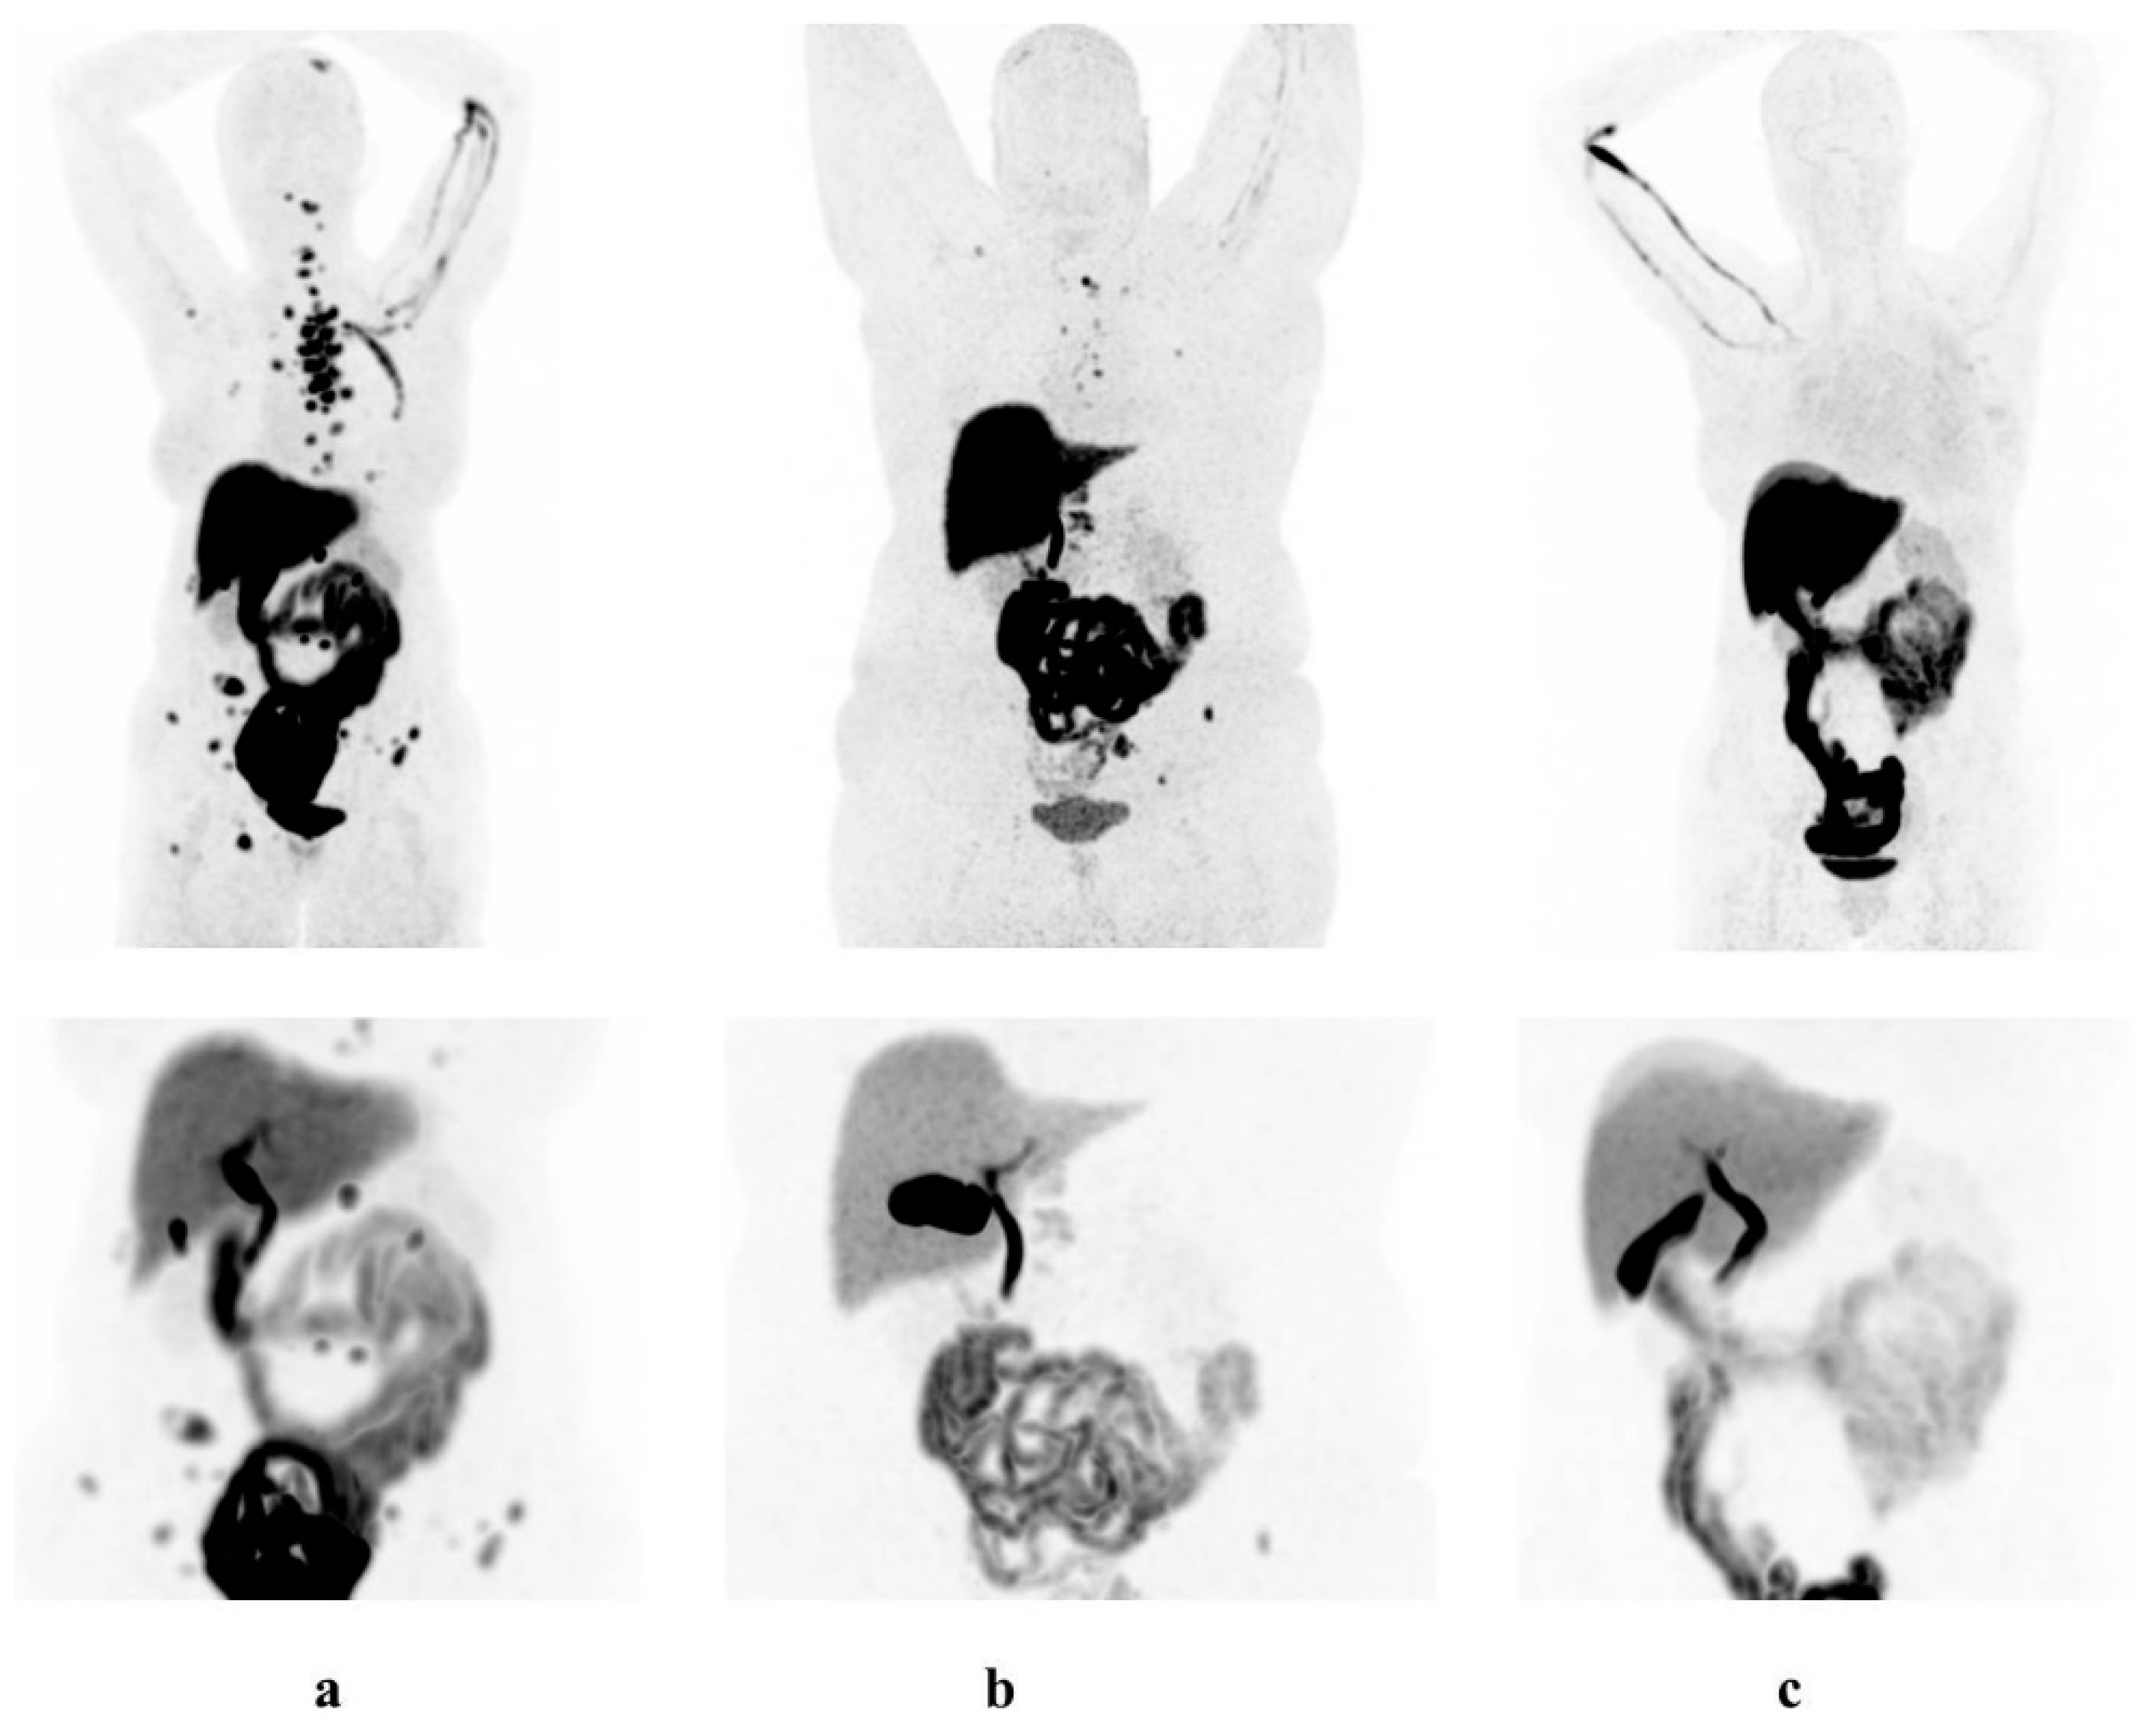
3.2. Physiological [18F]-FES Uptake
4. Discussion
Author Contributions
Funding
Conflicts of Interest
References
- Bigaard, J.; Stahlberg, C.; Jensen, M.-B.; Ewertz, M.; Kroman, N. Breast cancer incidence by estrogen receptor status in Denmark from 1996 to 2007. Breast Cancer Res. Treat. 2012, 136, 559–564. [Google Scholar] [CrossRef] [PubMed]
- Van Kruchten, M.; Glaudemans, A.W.J.M.; De Vries, E.F.J.; Beets-Tan, R.G.H.; Schröder, C.P.; Dierckx, R.A.; De Vries, E.G.E.; Hospers, G.A.P. PET Imaging of Estrogen Receptors as a Diagnostic Tool for Breast Cancer Patients Presenting with a Clinical Dilemma. J. Nucl. Med. 2012, 53, 182–190. [Google Scholar] [CrossRef] [PubMed] [Green Version]
- Sun, Y.; Yang, Z.; Zhang, Y.; Xue, J.; Wang, M.; Shi, W.; Zhu, B.; Hu, S.; Yao, Z.; Pan, H.; et al. The Preliminary Study of 16α-[18F]fluoroestradiol PET/CT in Assisting the Individualized Treatment Decisions of Breast Cancer Patients. PLoS ONE 2015, 10, e0116341. [Google Scholar] [CrossRef] [PubMed] [Green Version]
- Van Kruchten, M.; De Vries, E.F.J.; Arts, H.J.G.; Jager, N.M.; Bongaerts, A.H.H.; Glaudemans, A.W.J.M.; Hollema, H.; De Vries, E.G.E.; Hospers, G.A.P.; Reyners, A.K.L. Assessment of Estrogen Receptor Expression in Epithelial Ovarian Cancer Patients Using 16alpha-18F-fluoro-17beta-estradiol PET/CT. J. Nucl. Med. 2014, 56, 50–55. [Google Scholar] [CrossRef] [PubMed] [Green Version]
- Hesse, B.; Tägil, K.; Cuocolo, A.; Anagnostopoulos, C.; Bardiés, M.; Bax, J.; Bengel, F.; Sokole, E.B.; Davies, G.; Dondi, M.; et al. EANM/ESC procedural guidelines for myocardial perfusion imaging in nuclear cardiology. Eur. J. Nucl. Med. Mol. Imaging 2005, 32, 855–897. [Google Scholar] [CrossRef]
- Hurwitz, G.A.; Clark, E.M.; Slomka, P.J.; Siddiq, S.K. Investigation of Measures to Reduce Interfering Abdominal Activity on Rest Myocardial Images With Tc-99m Sestamibi. Clin. Nucl. Med. 1993, 18, 735–741. [Google Scholar] [CrossRef]
- Purbhoo, K.; Di Tamba, M.; Vangu, W. Efficacy of full-fat milk and diluted lemon juice in reducing infra-cardiac activity of 99mTc sestamibi during myocardial perfusion imaging. Cardiovasc. J. Afr. 2015, 26, 171–176. [Google Scholar] [CrossRef] [Green Version]
- Hofman, M.; McKay, J.; Nandurkar, D. Efficacy of milk versus water to reduce interfering infra-cardiac activity in 99mTc-sestamibi myocardial perfusion scintigraphy. Nucl. Med. Commun. 2006, 27, 837–842. [Google Scholar] [CrossRef]
- Vieira, L.O.; Almeida, P.; Costa, D.C. Image quality of myocardial perfusion-gated studies: Effect of ingestion of different fat content in the reduction of extra-myocardial abdominal signal. Comput. Methods Biomech. Biomed. Eng. Imaging Vis. 2013, 1, 61–68. [Google Scholar] [CrossRef] [Green Version]
- Harvey, I. Milk chocolate as the fatty meal in oral cholecystography. Clin. Radiol. 1977, 28, 635–636. [Google Scholar] [CrossRef]
- Gong, C.; Yang, Z.; Sun, Y.; Zhang, J.; Zheng, C.; Wang, L.; Zhang, Y.; Xue, J.; Yao, Z.; Pan, H.; et al. A preliminary study of 18F-FES PET/CT in predicting metastatic breast cancer in patients receiving docetaxel or fulvestrant with docetaxel. Sci. Rep. 2017, 7, 6584. [Google Scholar] [CrossRef] [PubMed] [Green Version]
- Chae, S.Y.; Ahn, S.H.; Kim, S.-B.; Han, S.; Lee, S.H.; Oh, S.J.; Lee, S.J.; Kim, H.J.; Ko, B.S.; Lee, J.W.; et al. Diagnostic accuracy and safety of 16α-[18F]fluoro-17β-oestradiol PET-CT for the assessment of oestrogen receptor status in recurrent or metastatic lesions in patients with breast cancer: A prospective cohort study. Lancet Oncol. 2019, 20, 546–555. [Google Scholar] [CrossRef]
- Boers, J.; Venema, C.M.; De Vries, E.F.; Glaudemans, A.W.; Kwee, T.C.; Schuuring, E.; Martens, J.W.; Elias, S.G.; Hospers, G.A.; Schröder, C.P. Molecular imaging to identify patients with metastatic breast cancer who benefit from endocrine treatment combined with cyclin-dependent kinase inhibition. Eur. J. Cancer 2020, 126, 11–20. [Google Scholar] [CrossRef] [PubMed]
- Venema, C.M.; Apollonio, G.; Hospers, G.A.; Schröder, C.P.; Dierckx, R.A.; De Vries, E.F.; Glaudemans, A.W. Recommendations and Technical Aspects of 16α-[18F]Fluoro-17β-Estradiol PET to Image the Estrogen Receptor In Vivo. Clin. Nucl. Med. 2016, 41, 844–851. [Google Scholar] [CrossRef] [PubMed]
- Boellaard, R.; Delgado-Bolton, R.; Oyen, W.J.; Giammarile, F.; Tatsch, K.; Eschner, W.; Verzijlbergen, F.J.; Barrington, S.; Pike, L.C.; Weber, W.A.; et al. FDG PET/CT: EANM procedure guidelines for tumour imaging: Version 2.0. Eur. J. Nucl. Med. Mol. Imaging 2014, 42, 328–354. [Google Scholar] [CrossRef] [PubMed]
- Mankoff, D.A.; Tewson, T.J.; Eary, J.F. Analysis of blood clearance and labeled metabolites for the estrogen receptor tracer [F-18]-16α-Fluorestradiol (FES). Nucl. Med. Biol. 1997, 24, 341–348. [Google Scholar] [CrossRef]
- Tu, D.-G.; Chen, C.-R.; Wang, Y.-W.; Tu, C.-W.; Huang, Y.C. Bowel-cleansing methods affecting PET-CT image interpretation. Nucl. Med. Commun. 2011, 32, 570–574. [Google Scholar] [CrossRef]
- Montagna, E.; Pirola, S.; Maisonneuve, P.; De Roberto, G.; Cancello, G.; Palazzo, A.; Viale, G.; Colleoni, M. Lobular Metastatic Breast Cancer Patients With Gastrointestinal Involvement: Features and Outcomes. Clin. Breast Cancer 2017, 18, e401–e405. [Google Scholar] [CrossRef]
- Venema, C.; De Vries, E.; Glaudemans, A.; Poppema, B.; Hospers, G.; Schröder, C. 18F-FES PET Has Added Value in Staging and Therapy Decision Making in Patients With Disseminated Lobular Breast Cancer. Clin. Nucl. Med. 2017, 42, 612–614. [Google Scholar] [CrossRef]
- Kanne, J.P.; Mankoff, D.A.; Baird, G.S.; Minoshima, S.; Livingston, R.B. Gastric Linitis Plastica from Metastatic Breast Carcinoma: FDG and FES PET Appearances. Am. J. Roentgenol. 2007, 188, W503–W505. [Google Scholar] [CrossRef]
- Wesołowska, M.; Pawlik, P.; Jagodziński, P.P. The clinicopathologic significance of estrogen receptors in human gastric carcinoma. Biomed. Pharmacother. 2016, 83, 314–322. [Google Scholar] [CrossRef] [PubMed]
- Xu, C.Y.; Guo, J.L.; Jiang, Z.N.; Xie, S.D.; Shen, J.G.; Wang, L.B.; Shen, J.Y. Prognostic Role of Estrogen Receptor α and Estrogen Receptor β in Gastric Cancer. Ann. Surg. Oncol. 2010, 17, 2503–2509. [Google Scholar] [CrossRef] [PubMed]
- Saeidi, H.; Nasiri, M.R.G.; Shahidsales, S.; Kermani, A.T.; Hematti, S.; Roodbari, S.S.; Shahri, M.H.M.; Chagharvand, S. Evaluation of estrogen receptor expression and its relationship with clinicopathologic findings in gastric cancer. Adv. Biomed. Res. 2015, 4. [Google Scholar] [CrossRef]
- Zhao, Z.; Yoshida, Y.; Kurokawa, T.; Kiyono, Y.; Mori, T.; Okazawa, H. 18F-FES and 18F-FDG PET for Differential Diagnosis and Quantitative Evaluation of Mesenchymal Uterine Tumors: Correlation with Immunohistochemical Analysis. J. Nucl. Med. 2013, 54, 499–506. [Google Scholar] [CrossRef] [Green Version]
- Yamamoto, M.; Tsujikawa, T.; Yamada, S.; Kurokawa, T.; Shinagawa, A.; Chino, Y.; Mori, T.; Kiyono, Y.; Okazawa, H.; Yoshida, Y. 18F-FDG/18F-FES standardized uptake value ratio determined using PET predicts prognosis in uterine sarcoma. Oncotarget 2017, 8, 22581–22589. [Google Scholar] [CrossRef] [Green Version]
- Tsujikawa, T.; Okazawa, H.; Yoshida, Y.; Mori, T.; Kobayashi, M.; Tsuchida, T.; Fujibayashi, Y. Differential diagnosis of endometrial hyperplasia and cancer using combined 18F-FES and 18F-FDG PET. J. Nucl. Med. 2007, 48 (Suppl. 2), 386. [Google Scholar]
- Ur-Rahman, M.S.; Cao, J. Estrogen receptors in gastric cancer: Advances and perspectives. World J. Gastroenterol. 2016, 22. [Google Scholar] [CrossRef]
- Xu, L.; Liang, S.; Yan, N.; Zhang, L.; Gu, H.; Fei, X.; Xu, Y.; Zhang, F. Metastatic gastric cancer from breast carcinoma: A report of 78 cases. Oncol. Lett. 2017, 14, 4069–4077. [Google Scholar] [CrossRef] [Green Version]


| Characteristics | Overall (n = 60) | Chocolate (n = 20) | Fasting (n = 20) | Control (n = 20) | p-Value |
|---|---|---|---|---|---|
| Age, years | 68 (30–83) | 69 (40–77) | 66 (30–74) | 69 (40–83) | 0.33 |
| Weight, kg | 76 ± 15 | 76 ± 14 | 77 ± 19 | 73 ± 12 | 0.72 |
| Height, cm | 167 ± 7 | 166 ± 8 | 169 ± 6 | 166 ± 6 | 0.50 |
| BMI, kg/m2 | 28 ± 5 | 28 ± 4 | 27 ± 6 | 27 ± 4 | 0.84 |
| Menopausal status | 0.87 | ||||
| Peri/premenopausal | 8 (13) | 2 (10) | 3 (15) | 3 (15) | |
| Postmenopausal | 52 (87) | 18 (90) | 17 (85) | 17 (85) | |
| Cholecystectomy | 7 (12) | 5 (25) | 2 (10) | - | |
| Treatment [18F]-FES-PET | |||||
| Aromatase inhibitor | 19 (32) | 5 (25) | 7 (35) | 7 (35) | |
| Chemotherapy | 3 (5) | 1 (5) | 1 (5) | 1 (5) | |
| None | 38 (63) | 14 (70) | 12 (60) | 12 (60) | |
| [18F]-FES-PET result ¶ | |||||
| Positive | 38 (63) | 13 (65) | 11 (55) | 14 (70) | |
| Negative | 22 (37) | 7 (35) | 9 (45) | 6 (30) | |
| Stage | |||||
| Adjuvant | 13 (22) | 5 (25) | 1 (5) | 7 (35) | |
| Metastatic † | 47 (78) | 15 (75) | 19 (95) | 13 (65) |
| Organ | Total | Chocolate | Fasting | Control | p-Value |
|---|---|---|---|---|---|
| Aortic arch | 1.5 (1.2–1.8) | 1.3 (1.1–1.7) | 1.5 (1.1–1.9) | 1.5 (1.3–1.8) | 0.65 |
| Thoracic aorta | 1.4 (1.2–1.7) | 1.3 (1.2–1.6) | 1.5 (1.2–1.9) | 1.5 (1.2–1.7) | 0.36 |
| Liver | 12 (9.8–14) | 10 (9.4–14) | 11 (9.9–15) | 13 (11–14) | 0.18 |
| Gall bladder or bile ducts | 81 (62–109) | 71 (38–91) | 102 (68–140) | 85 (62–128) | 0.015 |
| Stomach wall | 0.73 (0.62–0.91) | 0.67 (0.46–0.88) | 0.84 (0.66–1.05) | 0.72 (0.60–0.81) | 0.099 |
| Stomach lumen | 0.70 (0.37–0.93) | 0.55 (0.19–0.80) | 0.90 (0.67–1.11) | 0.65 (0.48–0.92) | 0.011 |
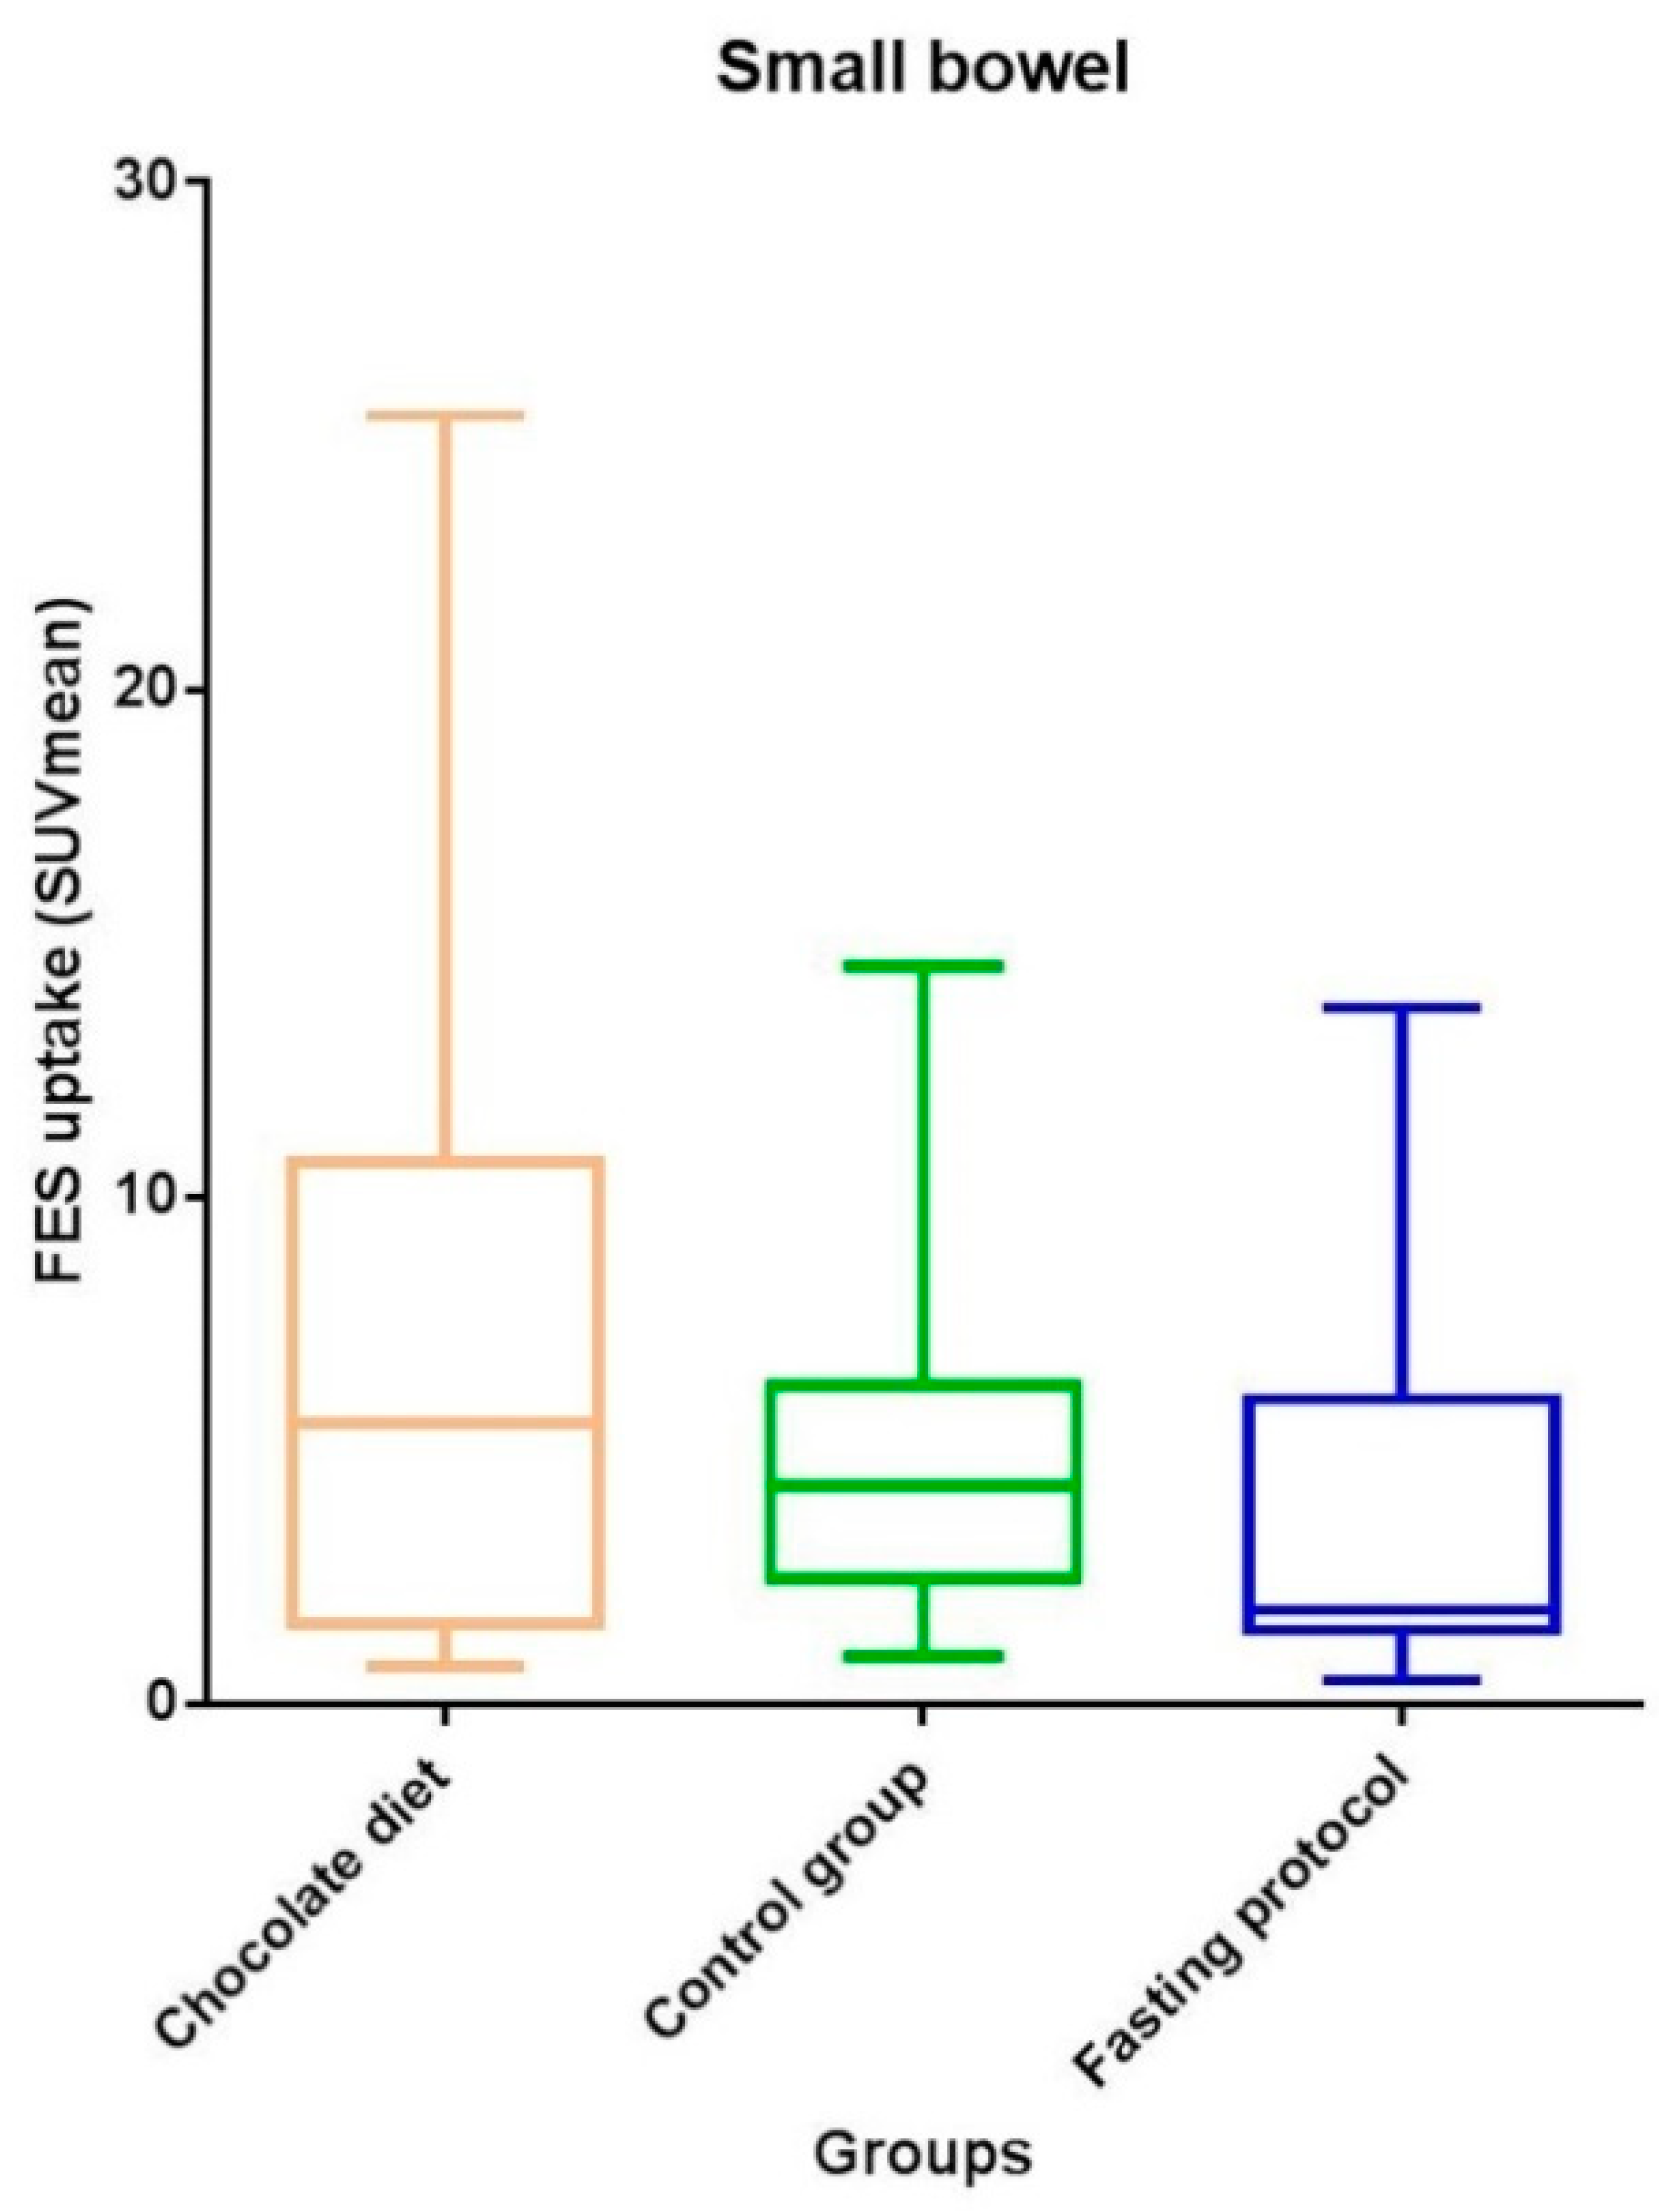
| Small bowel | 3.9 (1.5–7.1) | 5.5 (1.5–10.8) | 1.9 (1.3–6.1) | 4.3 (2.4–6.4) | 0.17 |
| Cecum | 0.57 (0.40–1.17) | 0.59 (0.46–1.27) | 0.49 (0.37–0.66) | 0.57 (0.36–2.14) | 0.52 |
| Ascending colon | 0.54 (0.41–0.74) | 0.52 (0.40–0.64) | 0.60 (0.39–0.78) | 0.62 (0.44–0.78) | 0.46 |
| Transverse colon | 0.56 (0.41–0.78) | 0.52 (0.40–0.72) | 0.59 (0.41–0.83) | 0.60 (0.41–0.82) | 0.68 |
| Descending colon | 0.51 (0.38–0.70) | 0.57 (0.40–0.64) | 0.50 (0.41–0.72) | 0.44 (0.28–0.75) | 0.63 |
| Sigmoid | 0.52 (0.41–0.63) | 0.49 (0.39–0.56) | 0.52 (0.41–0.65) | 0.58 (0.44–0.69) | 0.33 |
| Rectum * | 0.43 (0.26–0.61) | 0.35 (0.25–0.60) | 0.48 (0.37–0.64) | 0.42 (0.29–0.61) | 0.42 |
© 2020 by the authors. Licensee MDPI, Basel, Switzerland. This article is an open access article distributed under the terms and conditions of the Creative Commons Attribution (CC BY) license (http://creativecommons.org/licenses/by/4.0/).
Share and Cite
Boers, J.; Giatagana, K.; Schröder, C.P.; Hospers, G.A.P.; de Vries, E.F.J.; Glaudemans, A.W.J.M. Image Quality and Interpretation of [18F]-FES-PET: Is There any Effect of Food Intake? Diagnostics 2020, 10, 756. https://doi.org/10.3390/diagnostics10100756
Boers J, Giatagana K, Schröder CP, Hospers GAP, de Vries EFJ, Glaudemans AWJM. Image Quality and Interpretation of [18F]-FES-PET: Is There any Effect of Food Intake? Diagnostics. 2020; 10(10):756. https://doi.org/10.3390/diagnostics10100756
Chicago/Turabian StyleBoers, Jorianne, Katerina Giatagana, Carolina P. Schröder, Geke A.P. Hospers, Erik F.J. de Vries, and Andor W.J.M. Glaudemans. 2020. "Image Quality and Interpretation of [18F]-FES-PET: Is There any Effect of Food Intake?" Diagnostics 10, no. 10: 756. https://doi.org/10.3390/diagnostics10100756
APA StyleBoers, J., Giatagana, K., Schröder, C. P., Hospers, G. A. P., de Vries, E. F. J., & Glaudemans, A. W. J. M. (2020). Image Quality and Interpretation of [18F]-FES-PET: Is There any Effect of Food Intake? Diagnostics, 10(10), 756. https://doi.org/10.3390/diagnostics10100756