Article

Genome-Wide Characterization of the GRAS Gene Family in Three Apiaceae Vegetables with Evolutionary Implications Across Representative Plants

1
Library/School of Life Sciences/School of Basic Medical Sciences, North China University of Science and Technology, Tangshan 063210, China
2
National Engineering Research Center for Vegetables, Beijing Vegetable Research Center, Beijing Academy of Agriculture and Forestry Sciences, Beijing 100097, China
3
Beijing Key Laboratory of Vegetable Germplasm Improvement, Beijing Academy of Agriculture and Forestry Sciences, Beijing 100097, China
4
College of Horticulture, Nanjing Agricultural University, Nanjing 210095, China
5
Department of Food Science, Aarhus University, 8200 Aarhus, Denmark
*
Authors to whom correspondence should be addressed.
These authors contributed equally to this work.
Life 2026, 16(7), 1113; https://doi.org/10.3390/life16071113
Submission received: 28 May 2026 / Revised: 28 June 2026 / Accepted: 30 June 2026 / Published: 3 July 2026
(This article belongs to the Section Plant Science)

Abstract

GRAS transcription factors are crucial regulators governing plant growth and stress adaptation, yet no systematic genome-wide investigation of the GRAS gene family has been reported for coriander, celery and carrot, three economically and medicinally important Apiaceae vegetables, which creates a critical research gap for comparative and functional genomics in Apiales. Here, we performed a multi-tiered bioinformatic pipeline integrating gene identification, phylogenetic classification, chromosomal mapping, gene duplication analysis, transcriptome profiling, co-expression network construction and large-scale evolutionary tracing across 406 plant genomes. In total, 87, 74 and 74 GRAS genes were identified from coriander, celery and carrot, respectively, which were divided into 13 subfamilies. WGD/segmental duplication drove GRAS expansion in coriander and carrot, while dispersed duplication dominated in celery. Tissue-specific expression and cross-TF regulatory networks uncovered core GRAS hub genes participating in developmental and stress pathways. Wide-range phylogeny further validated that GRAS genes originated from Zygnematophyceae algae and massively expanded in Penium margaritaceum. This study fills the research gap of GRAS family analysis in Apiaceae, provides abundant high-throughput data resources, and offers fundamental evolutionary clues for future functional verification and genetic improvement of horticultural crops.

1. Introduction

Transcription factors play a very important role in plant growth and response to various abiotic stresses [1,2,3,4,5,6]. Among them, GRAS transcription factors play an invaluable role in many processes of plant growth and development, such as the formation of axillary bud meristems, and root radial formation [7,8,9,10]. The GRAS name comes from the first three identified characteristic members, GAI, RGA, and SCR [11]. GRAS usually consists of 400–700 amino acids, and its C-terminal sequence is highly homologous due to five highly conserved motifs (LHR I, VHIID, LHR II, PHYRE, and SAW) [12,13,14]. Among these motifs, the VHIID motif is the most important, and there are several amino acids, such as V-valine, H-histidine, I-isoleucine, and D-aspartic acid. Of these amino acids, only histidine and aspartic acid are conserved, and the VHIID motif is present in all members of the GRAS family [12,15]. The VHIID motif is flanked by two leucine heptapeptide repeats (LHRI and LHRII), which are critical for protein-protein interactions [13]. Although the C-terminal sequences of GRAS family proteins are highly conserved, their N-terminal sequences are highly divergent [16,17]. The N-terminus of GRAS family proteins contains homopolymeric extensions of certain amino acid residues, such as proline, glutamic acid, and tyrosine, and these variable sequences determine the specificity of GRAS family protein function [16,18].
At present, a large number of GRAS family genes have been reported, such as the eight previously reported GRAS family genes, DELLA, HAM, LISCL, PAT1, LAS, SCR, SHR, and SCL3, and the functions of these GRAS family genes have been described in detail [19]. However, some GRAS family genes in grape, tomato, and other species could not be grouped with the above eight types of genes, and 5 novel types of genes appeared (GRAS8, GRASV1, GRASV2, GRASV3, and SCL26) [12,20]. As an indispensable transcription factor for plant growth and development, GRAS has been reported in many plants, such as Arabidopsis (32 GRAS genes), rice (57) [21], grape (52) [12], tomato (53/54) [20,22], Chinese cabbage (48) [13], Prunus mume (46) [23], Fragaria vesca (54) [24], Setaria italica (57) [25], Sorghum bicolor (81) [26], Gossypium hirsutum (150) [27], Hordeum vulgare (62) [28], Panicum virgatum (144) [29], Citrus sinensis (50) [30], Camellia sinensis (52) [31], Pyrus bretschneideri (99) [32], Cucumis sativus (37) [33], Nelumbo nucifera (38) [34], Ipomoea trifida (70) [35], Glycine max (117) [36], Medicago sativa (51) [37], Capsicum annuum (50) [38], Juglans regia (52) [16], Zea mays (86) [39], Brassica juncea (88) [40], Malus domestica (127) [41], Litchi chinensis (48) [42], Solanum melongena (48) [43], Lagenaria siceraria (37) [44], and Medicago truncatula (59) [45].
Coriander (Coriandrum sativum), celery (Apium gravelolens), and carrot (Daucus carota) are three of the most representative vegetable crops in the Apiaceae family. As a crucial class of transcription factors in plants, the GRAS family has not yet been systematically investigated in these three Apiaceae vegetables. The recent completion of whole-genome sequencing for these species has laid a foundational basis, enabling genome-wide studies on the characteristics, evolution, and potential functions of their GRAS gene families [46,47]. Coriander, commonly known as cilantro, has a mild fragrance. It is not only consumed as an edible ingredient but also recognized for its significant utility value and substantial benefits to human health [48]. Celery, cultivated worldwide, is an important vegetable crop; its parts can be used as a medicinal material to treat certain human diseases [49,50]. Carrots, rich in α-carotene and β-carotene, are also an excellent source of vitamin K and vitamin B6—nutrients that help the human body combat specific illnesses [51].
In general, these three plants serve dual purposes: they are consumed as vegetables and utilized as medicinal materials. Consequently, they are globally renowned, widely favored by people, and have become indispensable ingredients in daily diets. This study intends to conduct a comprehensive analysis of the GRAS gene family in these three species through in-depth bioinformatics approaches, and further explore the evolutionary imprints and origins of GRAS family genes across the plant kingdom. In this study, we adopted a multi-layered species selection strategy to fulfill distinct research objectives. Coriander, celery and carrot, three typical edible and medicinal Apiaceae crops, were set as core research subjects for comprehensive GRAS gene characterization. To conduct reliable phylogenetic comparison, we further incorporated Arabidopsis thaliana and grape, two well-studied model plants with abundant GRAS functional evidence, as well as lettuce, a species with close phylogenetic affinity to Apiales, forming a six-species dataset for phylogenetic tree construction. Multi-tissue RNA-seq data were only available for celery and coriander, so their transcriptomic profiles and co-expression regulatory networks were analyzed to reveal tissue-specific expression patterns. Furthermore, a total of 406 high-quality genomes spanning algae, bryophytes, ferns, gymnosperms and angiosperms were collected to systematically trace the ancient evolutionary origin of the GRAS gene family. Using integrated bioinformatics pipelines including gene identification, phylogenetic reconstruction, chromosomal localization, duplication type analysis, expression profiling and large-scale evolutionary comparison, we systematically uncovered the classification, expansion mechanism, tissue expression characteristics and evolutionary origin of Apiaceae GRAS genes, providing valuable genomic resources for subsequent functional verification and crop genetic improvement.

2. Materials and Methods

2.1. Collection of Genome Sequences and Identification of GRAS Gene Family

The sequences of celery, coriander, carrot, and lettuce were downloaded from our TVIR (http://tvir2.bio2db.com) (accessed on 28 May 2026) and TAGR database (http://tagr.bio2db.com) (accessed on 28 May 2026) [52,53,54,55]. The A. thaliana gene sequence was downloaded from the Arabidopsis Information Source (TAIR, https://www.arabidopsis.org/) (accessed on 28 May 2026) [56]. In addition, the whole-genome protein sequences of other species were downloaded from the PlantGIR database (http://plantgir.cn) (accessed on 28 May 2026) [57].
GRAS gene family members of all species were identified using the Pfam database integrated within the InterPro (EMBL-EBI) platform (https://www.ebi.ac.uk/interpro/) (accessed on 28 May 2026) numbered PF03514 (E-value <1 × 10⁻⁵) [58,59,60]. To ensure the accuracy of the results, domain validation was performed using the SMART (http://smart.embl-heidelberg.de/) (accessed on 28 May 2026) database and CDD (https://www.ncbi.nlm.nih.gov/Structure/cdd) (accessed on 28 May 2026) [61,62].

2.2. Chromosomal Localization, Gene Structure, and Conserved Motif Analyses

The location information of the GRAS family genes in the chromosomes of coriander, celery, and carrot was obtained from the General Feature Format (gff) file and then visualized by MapChart software (MapChart v6.5.1) [17]. The gene structure analysis, including the position of exons, introns, and untranslated regions (UTRs), was conducted using Gene Structure Displayer Server v2.0 (GSDS, http://gsds.gao-lab.org) (accessed on 28 May 2026) [63]. The conservation of amino acid sequences among carrot, celery, and coriander was performed using Multiple Expectation Maximization for Motif Elicitation (MEME, https://meme-suite.org/meme/) (accessed on 28 May 2026) [64].

2.3. Phylogenetic Analysis of GRAS Family Gene and Identification of Homologous Genes

The phylogenetic tree was constructed using the amino acid sequences of GRAS family genes. The protein sequences of GRAS family genes from related species were aligned using the MAFFT program (--maxiterate 1000) [65,66]. Then, the maximum likelihood tree was constructed by FastTree software (v2.2) with 1000 bootstrap replicates [67].
Orthologous and paralogous pairs in the coriander, celery, and carrot GRAS gene families were identified by the software OrthoMCL 2.0 (https://orthomcl.org/orthomcl/) (accessed on 28 May 2026) [68], and then the relationship between the orthologous and paralogous pairs was drawn using the Circos program (http://circos.ca/) (accessed on 28 May 2026) [69].

2.4. Analysis of Duplication and Loss of GRAS Family Genes During Evolution

The duplication or loss of genes in the process of evolution is assessed by reconciling the species tree and gene tree using the Notung software (v2.9) (http://amberjack.compbio.cs.cmu.edu/Notung/download.html) (accessed on 28 May 2026) [70]. First, a species tree was constructed according to the relationship among six species (coriander, celery, carrot, Arabidopsis, lettuce, grape), and then the species tree and gene tree were reconciled by Notung software.

2.5. Analysis of Collinearity and Gene Duplication Type

The collinearity of coriander, celery, and carrot GRAS family genes was analyzed using MCScanX software (v1.0) [71,72]. First, the whole-genome sequences of three species were aligned by the Blastp program (e-value was set to 1 × 10⁻⁵). Then, collinear genes were detected by MCScanX (parameter settings: −k 50, −s 5, −m 25). Finally, GRAS family genes located on the collinear block were extracted by a Perl script. The duplication type of GRAS family genes was identified using the MCScanX downstream program duplicate_gene_classifier.

2.6. GO Enrichment Analysis

To further elucidate the potential biological functions of differentially expressed GRAS genes, Gene Ontology (GO) enrichment analysis [73] was performed for A. graveolens, C. sativum and D. carota using the R package clusterProfiler v4.0 [74]. Custom gene-to-GO annotation files were generated by mapping whole-genome protein sequences against the eggNOG database, and all protein-coding genes with valid GO annotations in each genome were defined as the background gene universe. Over-representation analysis (ORA) based on the hypergeometric distribution was implemented via the enricher function to identify enriched GO terms, which were classified into three core ontologies: biological process (BP), cellular component (CC), and molecular function (MF). The Benjamini–Hochberg false discovery rate (FDR) method was used for multiple testing correction.

2.7. Tissue Differential Expression Analysis of GRAS Family Genes

To explore the expression patterns of GRAS family genes in coriander and celery in different tissues, we used the RNA-seq data obtained in our laboratory for analysis according to the previous reports [75,76,77]. These expression data contained three tissues (roots, petioles, and leaves) with three replications. Root, petiole and leaf tissues were collected from healthy plants at the full flowering stage under standard cultivation conditions. The expression values were normalized as reads per kilobase per million reads (RKPM). Gene expression abundances were quantified using HTSeq 2.0 [78], and differentially expressed genes (DEGs) were screened via DESeq with the adjusted p-value threshold set as padj < 0.05 [79]. Finally, cluster analysis was performed using TBtools (v2.0) [80].

2.8. Correlation and Co-Expression Network Construction

All the transcription factor families were identified using PlantTFDB according to previous reports [81,82]. The Pearson correlation coefficient (PCC) method was used to analyze the correlation within or between GRAS family genes and other transcription factor families according to previous reports [83,84]. It was defined as positive or negative co-expression when the PCC value of gene pairs was greater than 0.99 or lower than −0.99, respectively. Then, the interaction networks were constructed using Gephi (https://gephi.org) (accessed on 28 May 2026) software (v0.11.2) according to PCC values [83].

3. Results

3.1. Identification, Classification, and Phylogenetic Analysis of GRAS Genes

A total of 87, 74, and 74 GRAS genes were identified in coriander, celery, and carrot, respectively (Table S1). Additionally, 34, 72, and 53 GRAS genes were detected in Arabidopsis (A. thaliana), lettuce (Lactuca sativa), and grape (Vitis vinifera), respectively (Table S1). Arabidopsis and grape were selected as representative model species in this study, given their well-characterized GRAS gene families and extensive prior research. Lettuce was included due to its close phylogenetic relationship with Apiaceae species, facilitating evolutionary comparisons.
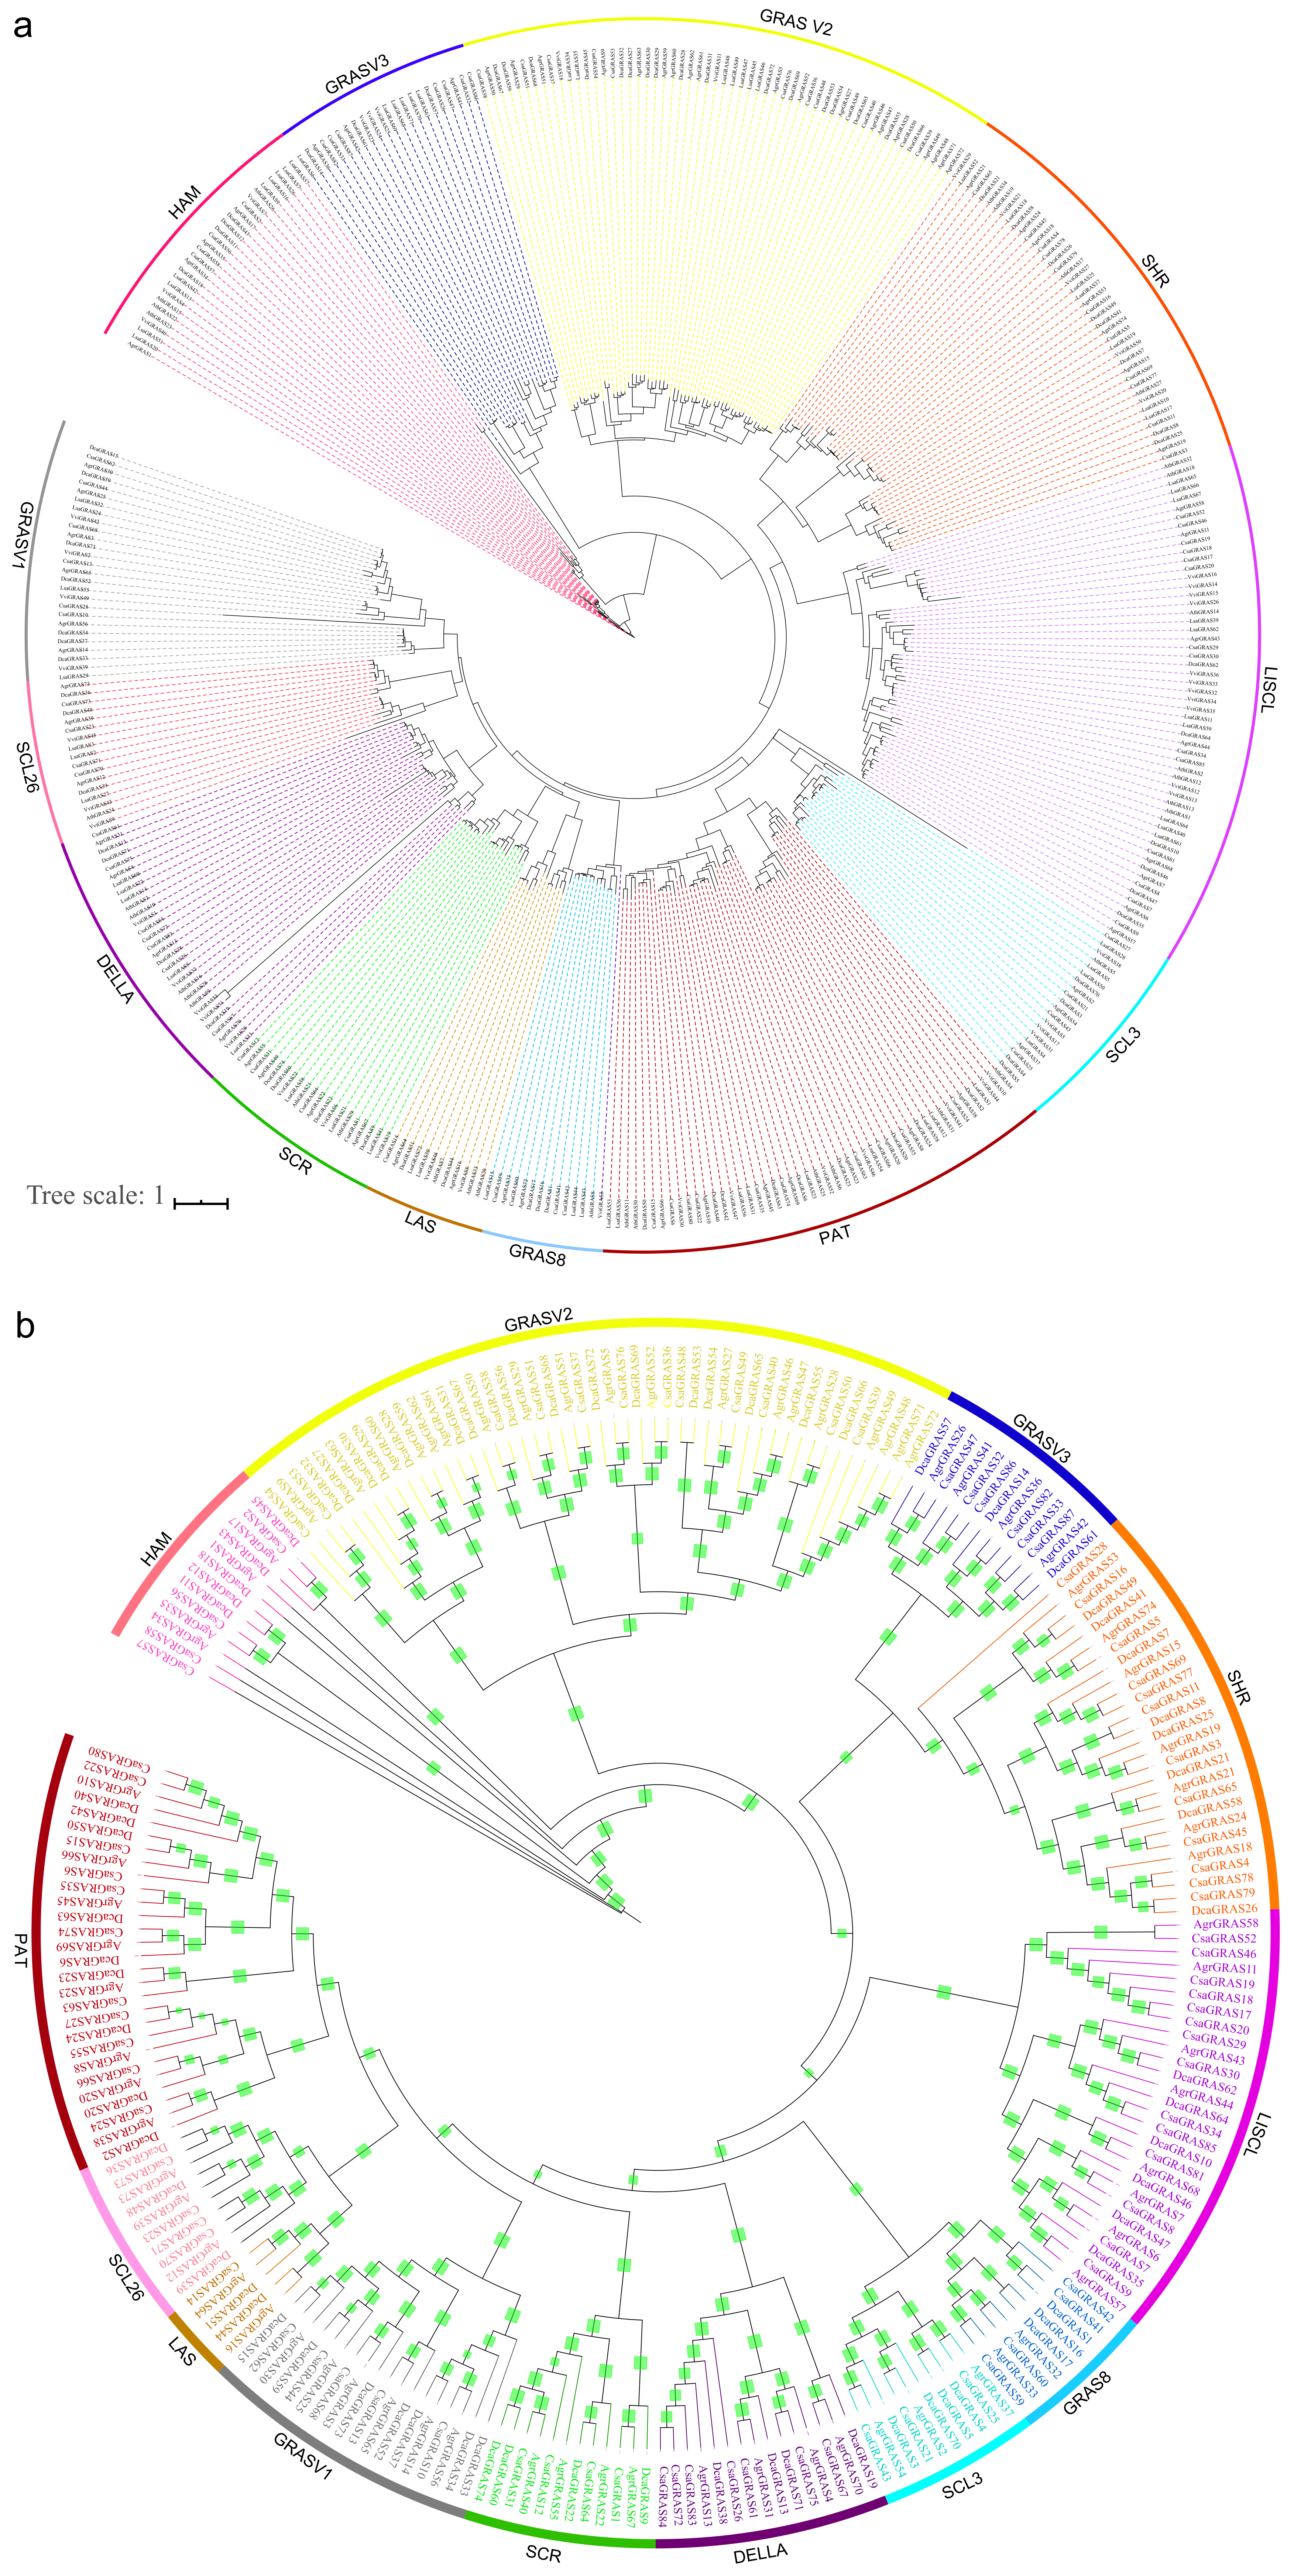
To investigate the evolutionary dynamics of the GRAS gene family, a phylogenetic tree was constructed using the GRAS genes identified across these six species (Figure 1a). Based on three key criteria—phylogenetic tree topology, conserved domain characteristics, and the established classification framework of GRAS family members in grape and Arabidopsis—the GRAS genes were categorized into 13 distinct subclasses, namely HAM, DELLA, LISCL, PAT, LS, SCR, SHR, SCL3, SCL26, GRASV1, GRASV2, GRASV3, and an additional subclass consistent with prior nomenclature (Figure 1a, Table S2) [12].
To further investigate the evolutionary history of the GRAS family in Apiaceae, phylogenetic trees were constructed using GRAS genes from coriander, celery, and carrot (Figure 1b). Consistent with grape, the three Apiaceae species were found to harbor a large number of GRAS genes in the PAT and LISCL subclasses (Figure 1). In contrast, a striking difference was observed in the GRASV2 subclass: grape contained the fewest GRASV2 genes, whereas the three Apiaceae species exhibited the highest gene counts in this subclass. This discrepancy is likely attributed to significant expansion of the GRASV2 subgroup driven by genome duplication events during Apiaceae evolution.
To assess the conservation of GRAS family genes, we analyzed their conserved motifs and gene structure. A total of 10 conserved motifs were identified, among which six (motifs 1, 2, 3, 7, 8, and 9) were ubiquitous across all GRAS genes (Figure S1a). These six core motifs corresponding to the characteristic GRAS domains (LHRI, VHIID, LHRII) are highly conserved across all GRAS proteins. The histidine (H) and aspartic acid (D) residues within the VHIID motif are fully conserved. However, motif absence was observed in specific subclasses: for instance, motif 5 was absent in most SCL3 subclass genes, while motifs 4, 8, and 10 were missing from GRASV3 subclass genes. The expanded PAT, LISCL and GRASV2 subfamilies possess unique motif combinations associated with their functional divergence (Figure S1a).
Gene structure analysis, conducted using the GSDS program (Figure S1b), revealed that most GRAS genes contained only one or two exons. Notably, two SCL3 subclass genes—DcaGRAS3 and DcaGRAS4—exhibited unusual exon counts, with 16 and 10 exons, respectively.
Collectively, GRAS genes belonging to the same class or subclass shared similar conserved motif profiles and gene structures. These results provide strong support for the reliability of our earlier phylogenetic classification of the GRAS family.

3.2. Chromosomal Localization Analysis of the GRAS Gene Family

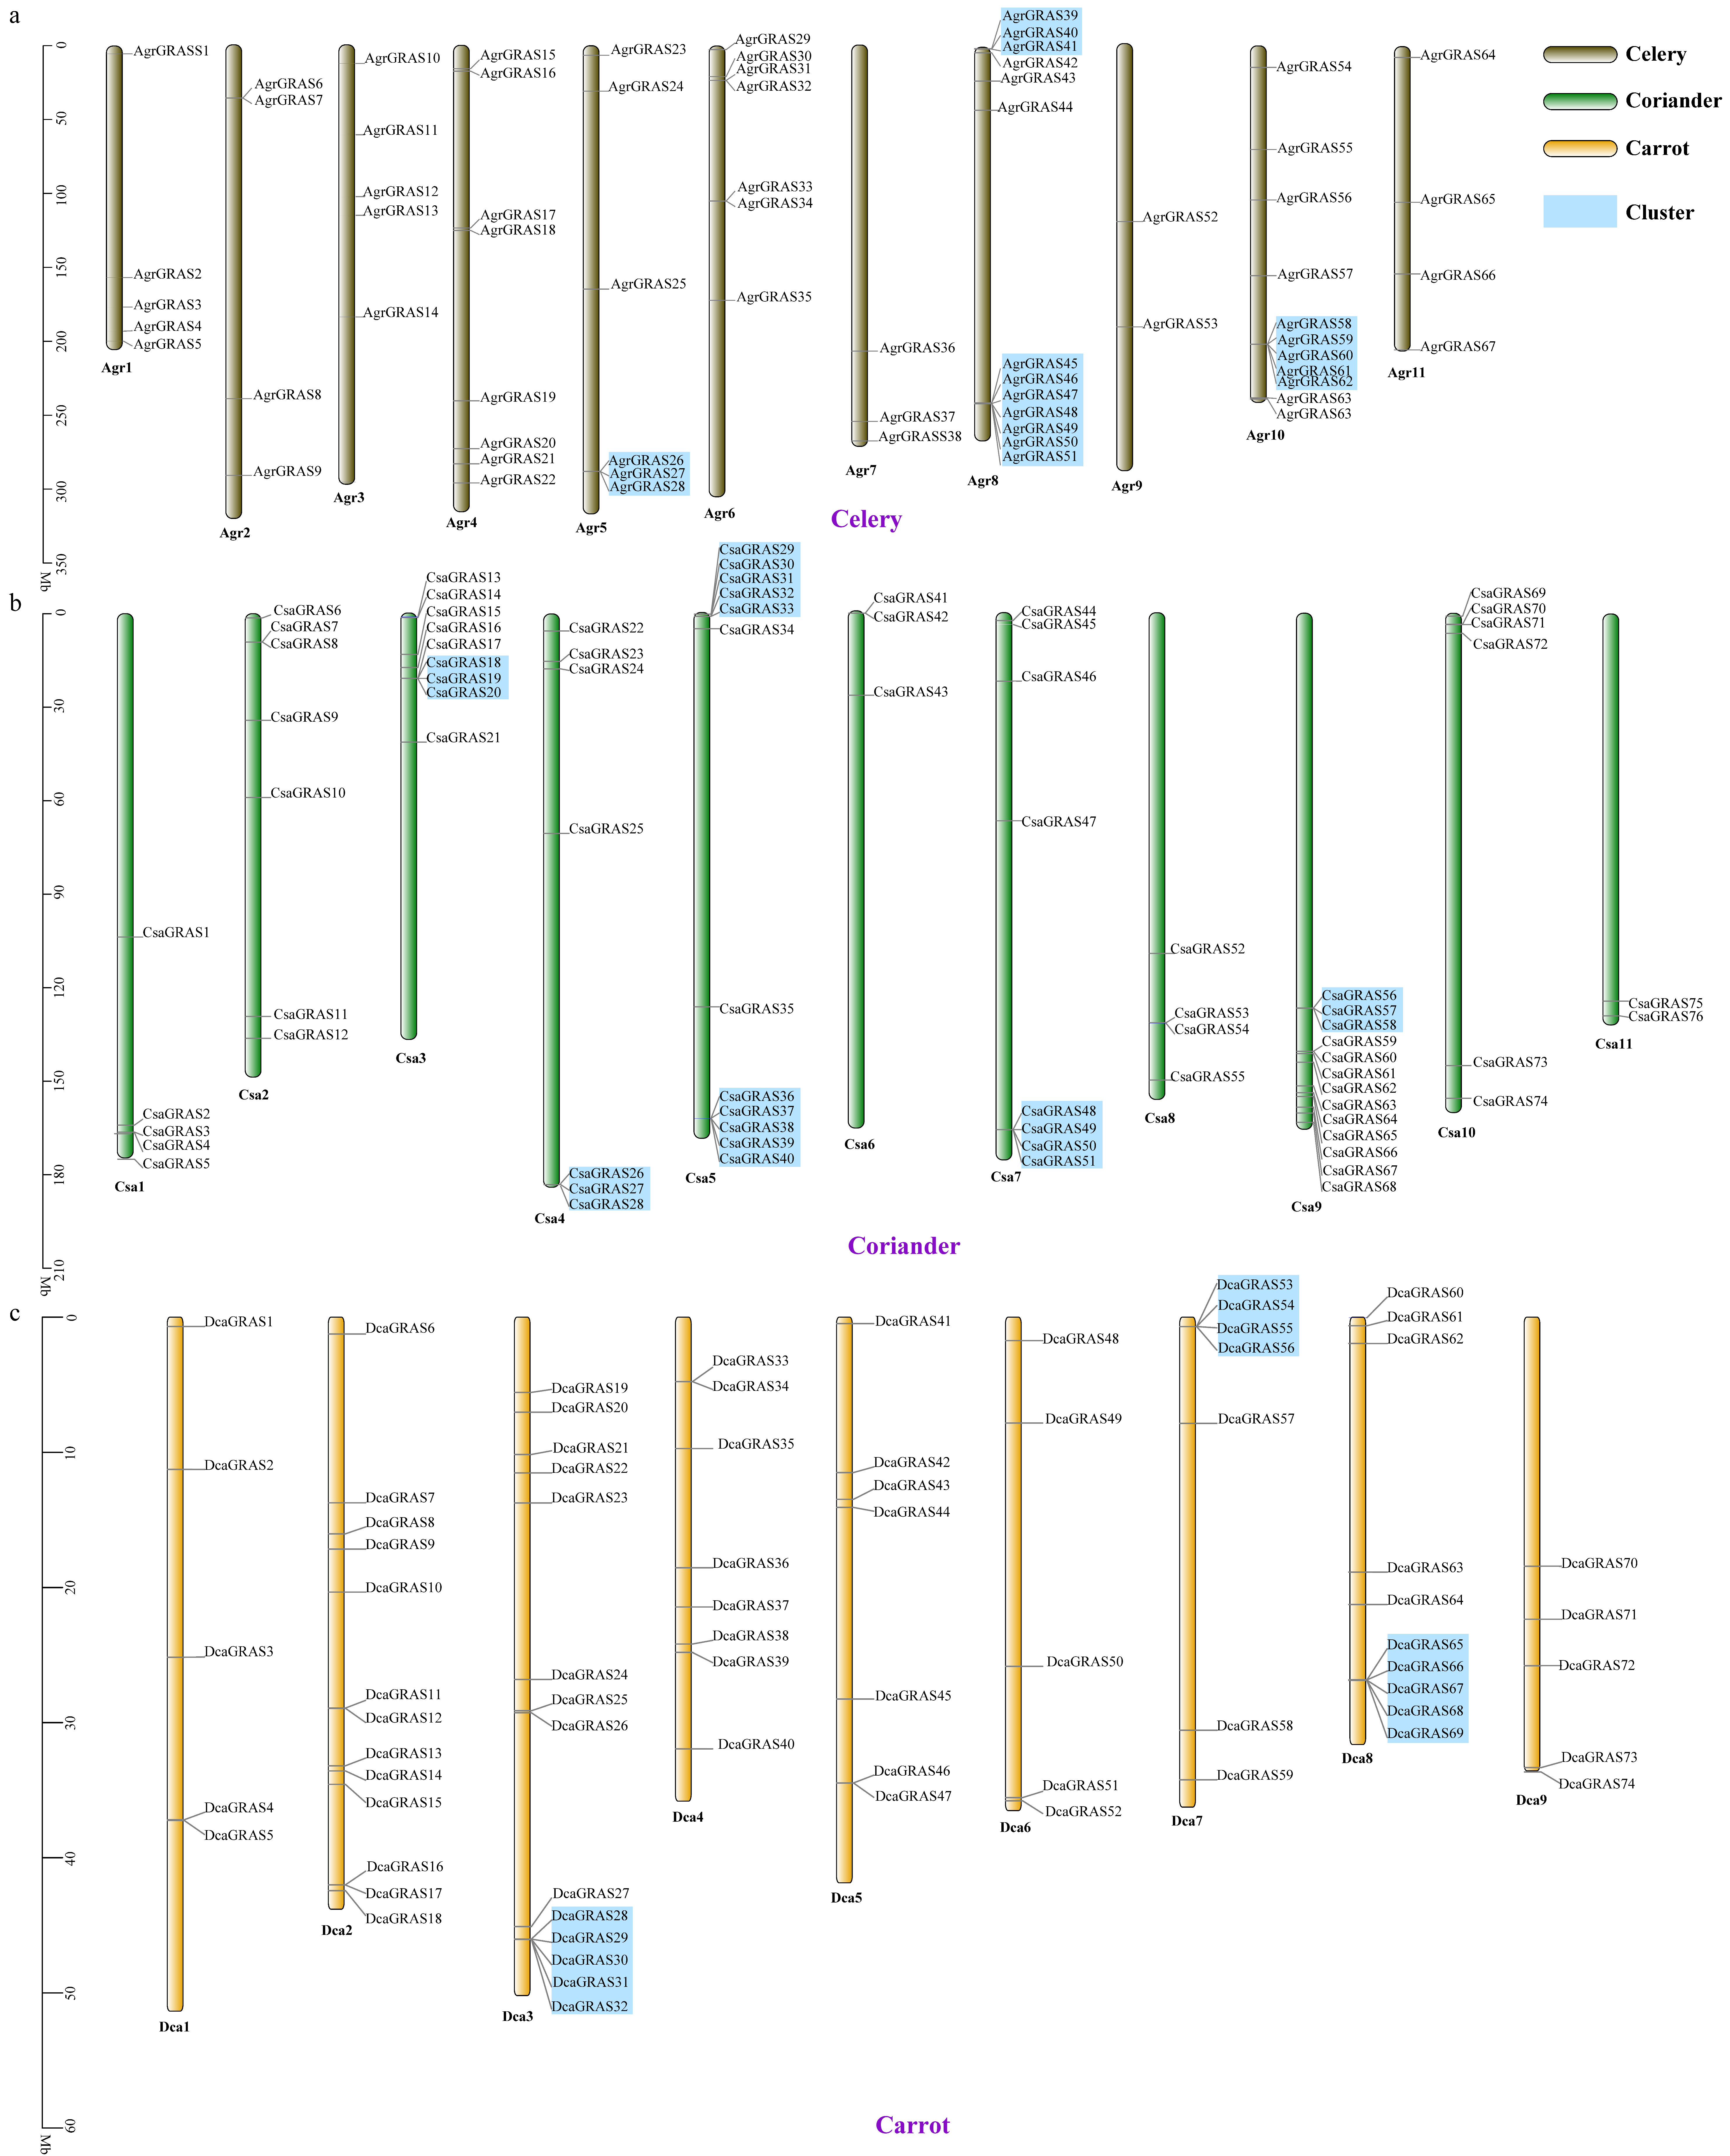
Using chromosomal location data for the three Apiaceae vegetables, we mapped the distribution of GRAS family genes across their chromosomes (Figure 2).
In celery, 4 out of the 74 identified GRAS genes could not be assigned to any chromosome; the remaining 70 genes were unevenly distributed across 11 chromosomes (Figure 2a). Chromosome 8 harbored the highest number of GRAS genes (13), followed by chromosome 10 (11). In contrast, chromosomes 7 and 9 contained the fewest GRAS genes, with 3 and 2 genes, respectively. Additionally, four GRAS gene clusters—comprising 18 genes in total—were detected at the proximal ends of chromosomes 5, 8, and 10; this clustering pattern is likely a result of gene duplication events.
For coriander, the 11 unlocalized coriander GRAS genes are anchored to unassembled scaffold contigs that cannot be mapped to assembled chromosomes, while the remaining 76 genes were unevenly distributed across 11 chromosomes (Figure 2b). Coriander exhibited more GRAS gene clusters than celery: a total of 6 clusters (23 genes) were found on chromosomes 3, 4, 5, 7, and 9. Chromosome 9 had the highest GRAS gene count (13), whereas chromosome 11 had the lowest (2).
In carrot, all 74 GRAS genes were mapped to its 9 chromosomes, though their distribution was uneven (Figure 2c). Chromosomes 1 and 6 contained the fewest GRAS genes (5 each), while chromosomes 2 and 3 had the highest counts (13 and 14, respectively). Only 3 GRAS gene clusters (14 genes total) were detected in carrot, located on chromosomes 3, 7, and 8. Similar to celery and coriander, most of these clusters in carrot were positioned near chromosome ends.
Collectively, these analyses revealed that GRAS family genes exhibit clustered distribution patterns in coriander, celery, and carrot. This clustering is likely driven by gene duplication—an important mechanism underlying the expansion of the GRAS gene family in these Apiaceae vegetables.

3.3. Identification of Homologous Genes in the GRAS Family Across Three Apiaceae Vegetables

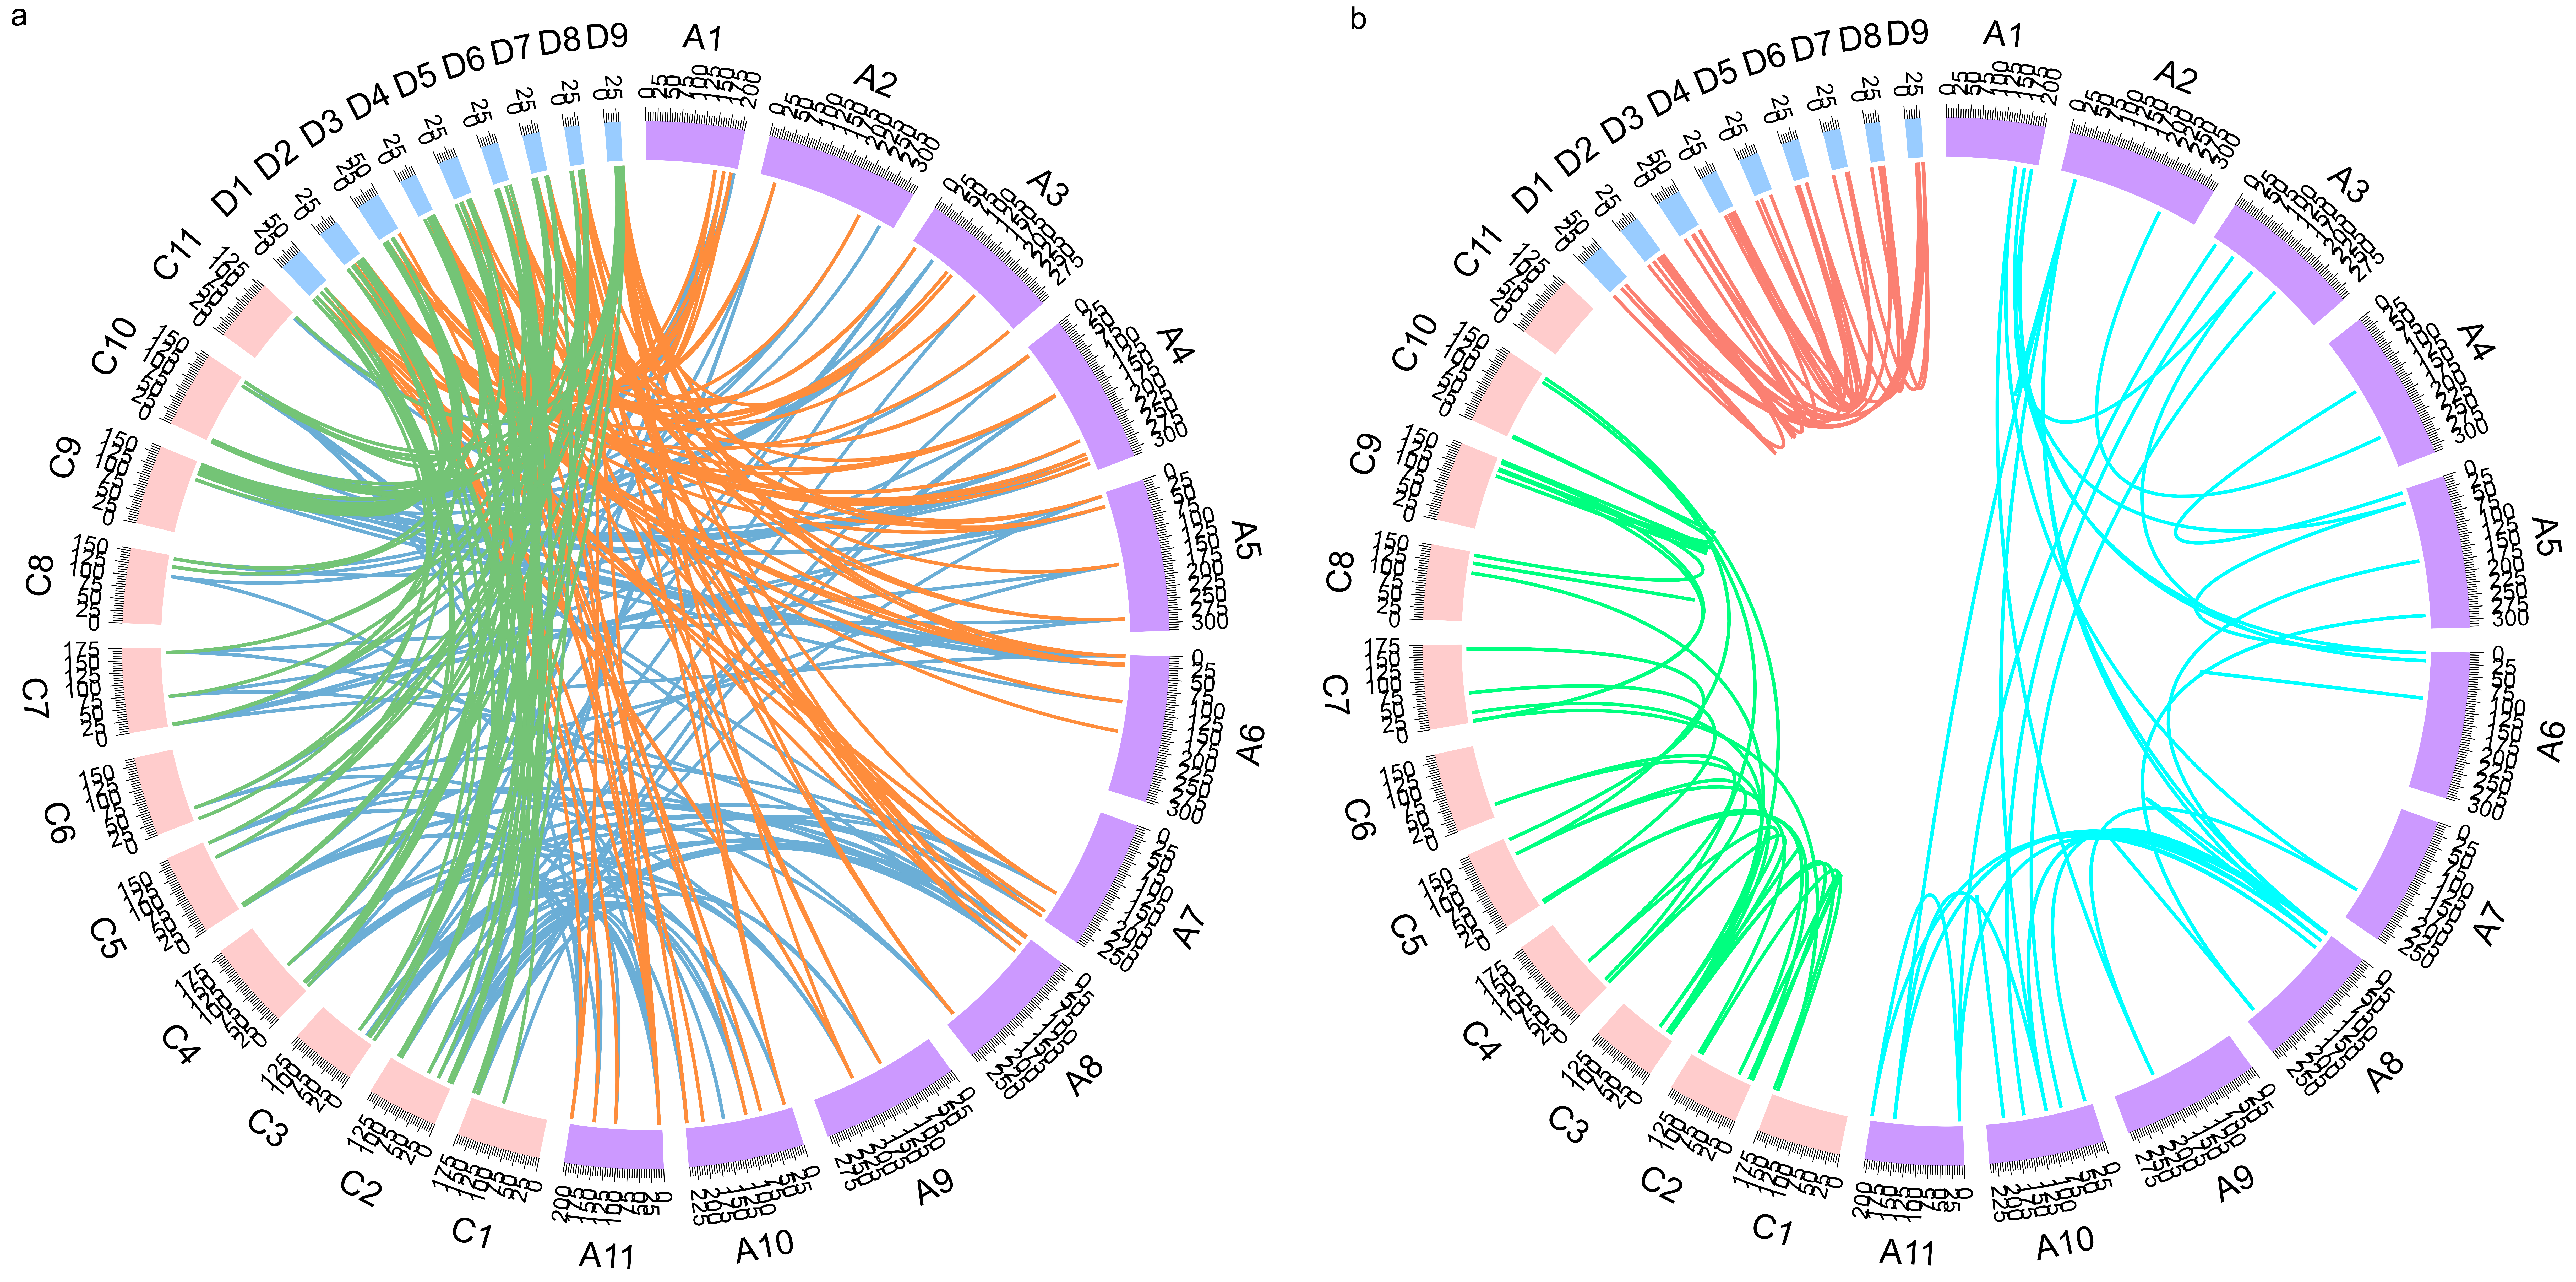
Homologous genes consist of two categories: orthologs (genes derived from a common ancestral gene and separated by speciation events) and paralogs (genes originating from gene duplication within a single genome). To gain deeper insights into the evolutionary origins and diversification of the GRAS family in the three Apiaceae vegetables, we systematically identified orthologous and paralogous gene pairs among them (Figure 3a, Table S3).
Orthologous gene analysis revealed 131 ortholog pairs between coriander and celery, 110 between celery and carrot, and 123 between coriander and carrot. The high number of orthologous pairs across all three species indicates that the GRAS family has remained highly conserved during the evolutionary divergence of Apiaceae, reflecting its functional importance in these plants.
In addition to orthologs, we identified paralogous gene pairs within each species: 46 in celery, 39 in coriander, and 43 in carrot (Figure 3b, Table S4). These paralogs likely arose from lineage-specific gene duplication events, which may have contributed to the functional expansion of the GRAS family in individual Apiaceae vegetables.

3.4. Analysis of GRAS Gene Duplication Types in Three Apiaceae Vegetables

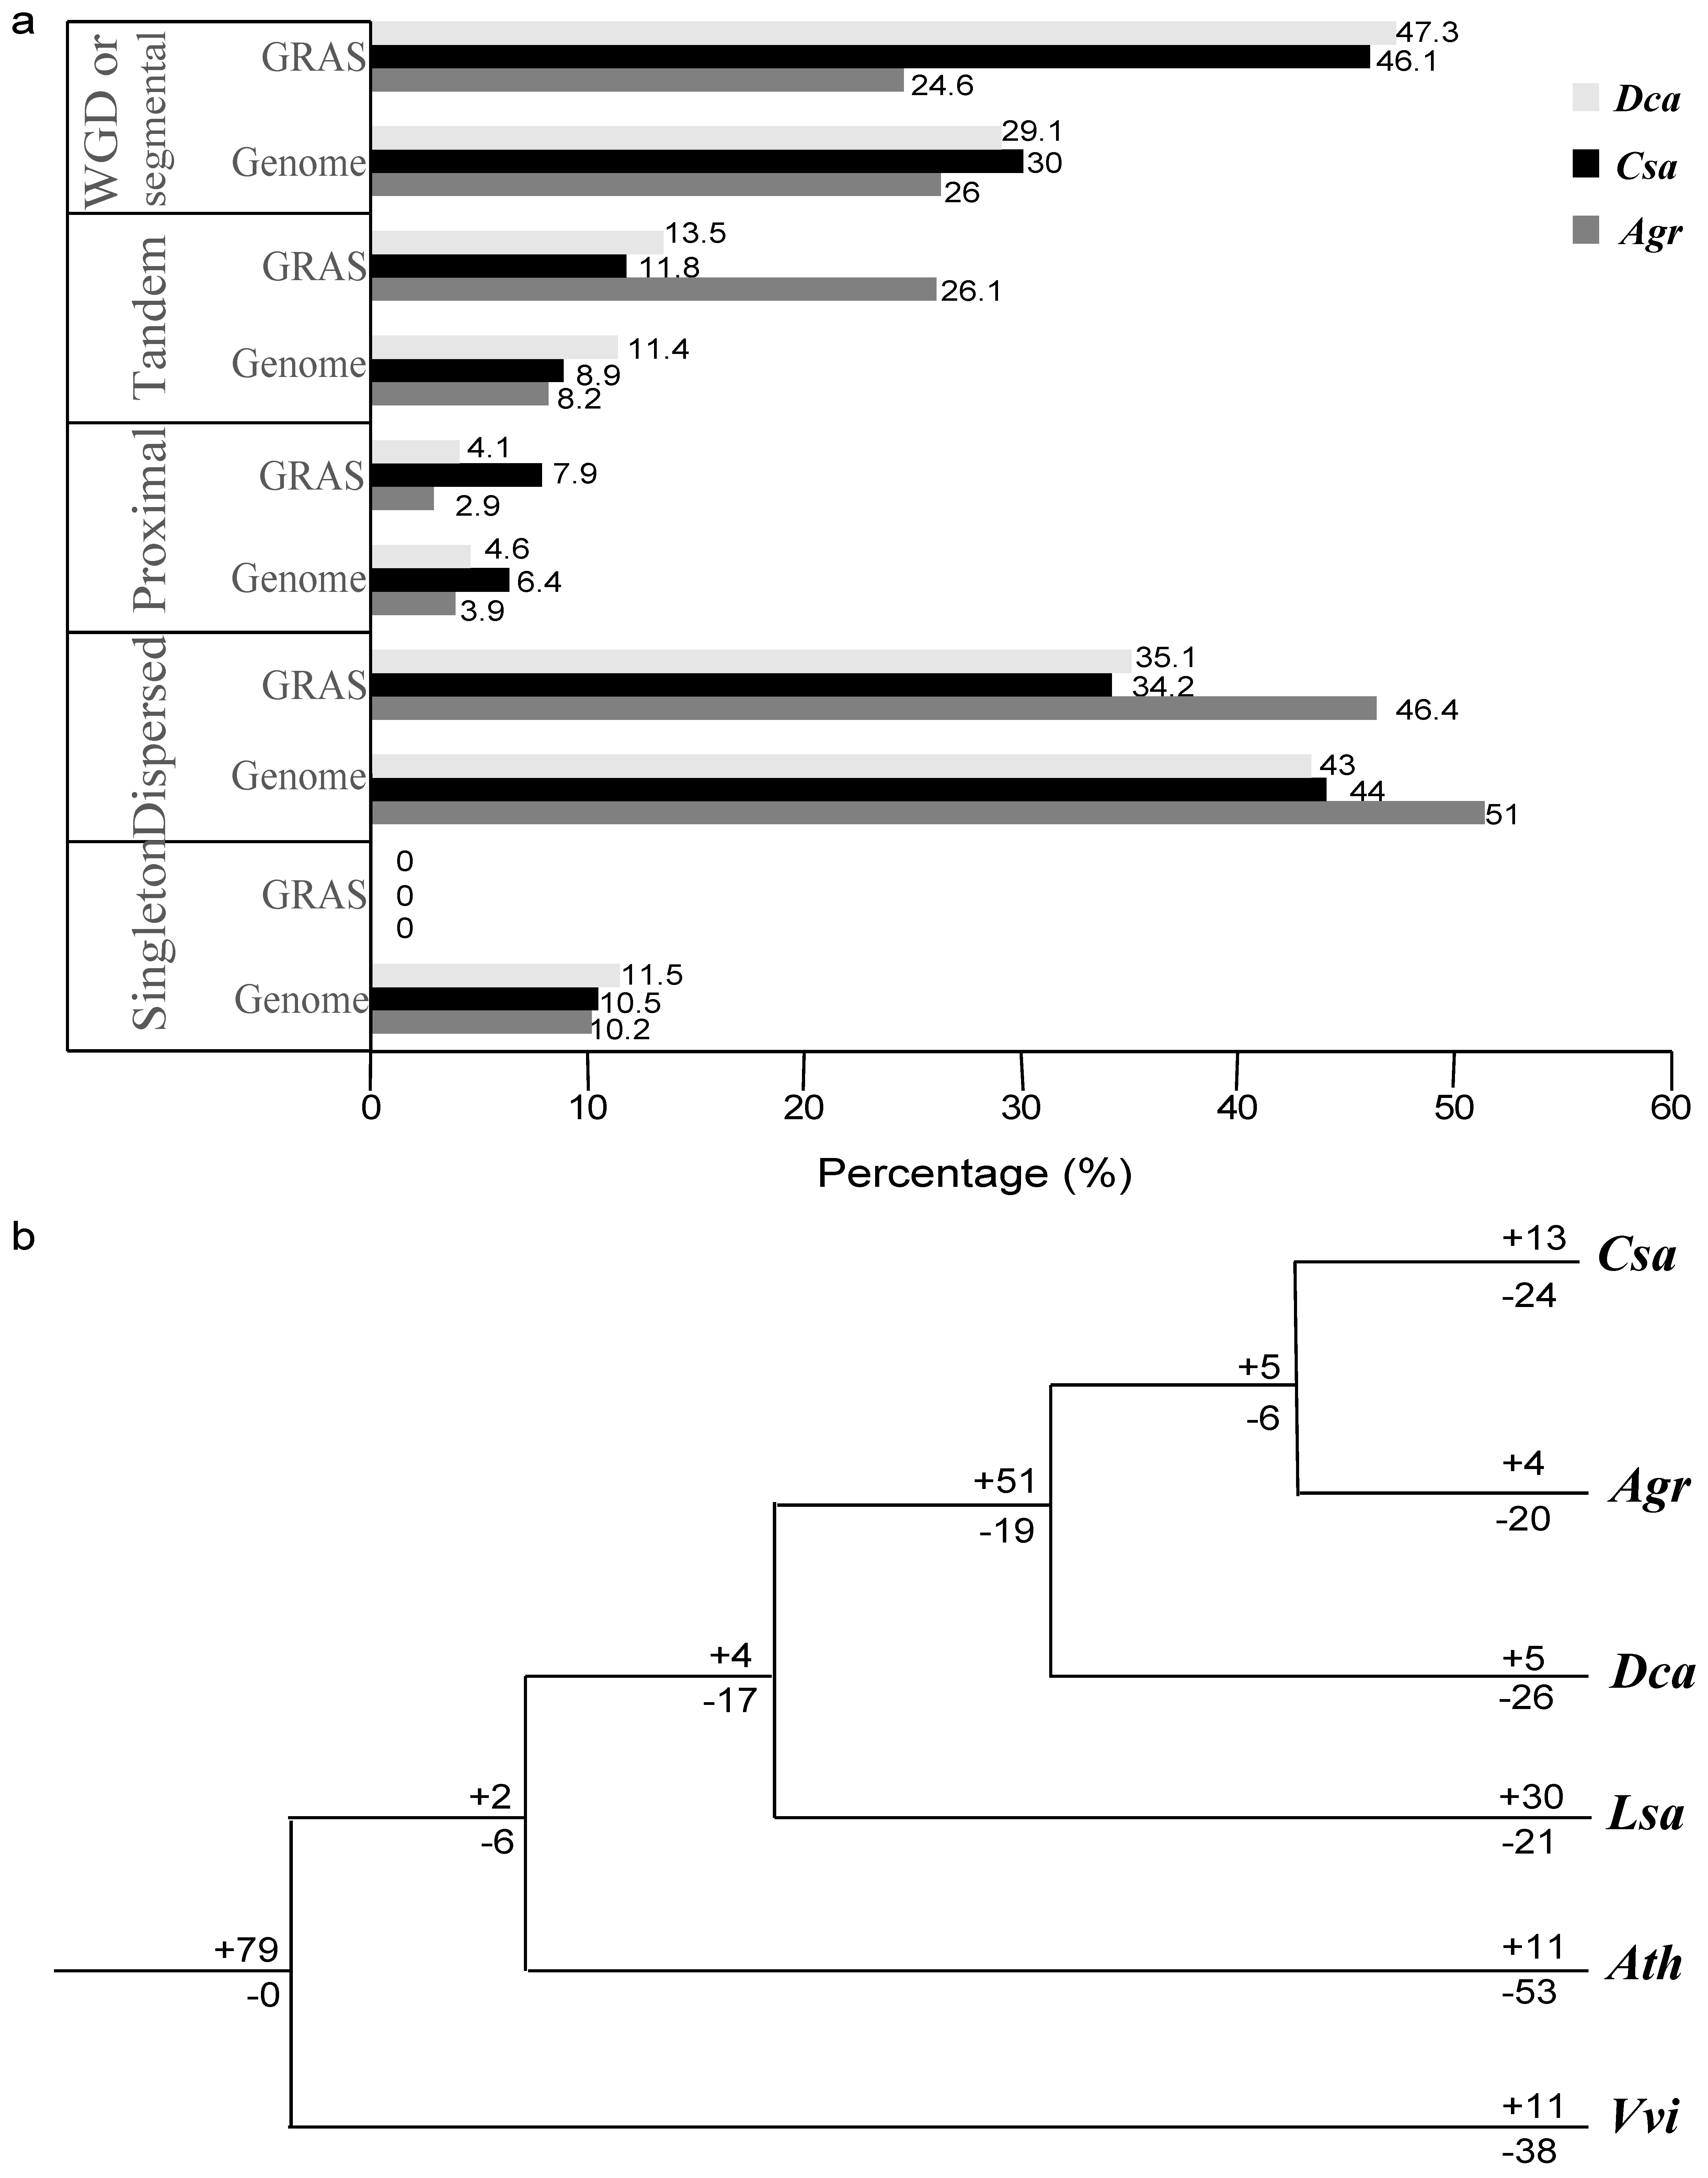
Gene duplication is a key driver of gene family expansion. To investigate the mechanisms underlying the diversification of the GRAS family in the three Apiaceae vegetables, we analyzed the duplication types of identified GRAS genes using MCScanX (Figure 4a, Table 1 and Table S5). Five distinct duplication types were classified: singleton, proximal, dispersed, tandem, and whole-genome duplication/segmental duplication (WGD/Segmental).
In celery, dispersed duplication was the dominant type, accounting for 46.38% (32/69) of all GRAS genes. In coriander and carrot, WGD/Segmental duplication prevailed: it contributed to 46.05% (35/76) of GRAS genes in coriander and 47.30% (35/74) in carrot (Table 1 and Table S5). Notably, no GRAS genes were classified as “singleton” (genes with no detectable duplication history) across all three species. These results indicate that the expansion of the GRAS gene family has been shaped by distinct duplication mechanisms in celery versus coriander and carrot: dispersed duplication drove GRAS family expansion in celery, while WGD/segmental duplication played a central role in coriander and carrot.

3.5. Detection of GRAS Gene Family Duplications and Losses

To reconstruct the evolutionary dynamics of gains and losses in the GRAS family, we employed Notung software—a tool specialized for reconciling gene trees with species trees to infer duplication and loss events under the parsimony principle. Using our reconstructed species tree and GRAS gene tree, we quantified GRAS gene duplications and losses across the six studied species (Figure 4b).
In the common ancestor of coriander and celery, 5 GRAS gene duplications and 6 gene losses were detected. In the deeper common ancestor of coriander, celery, and carrot, a more pronounced expansion occurred, with 51 duplications outweighing 19 losses. Notably, coriander harbored more GRAS genes than celery and carrot. This disparity can be explained by two complementary patterns in gene turnover: first, coriander exhibited a higher net duplication count (+13) compared to celery (+4) and carrot (+5); second, coriander experienced fewer gene losses (−24) than carrot (−26). Among all six species, lettuce showed the most extreme duplication event, with 30 GRAS gene duplications—far exceeding the counts in the other five species. This dramatic expansion is consistent with prior reports of whole-genome triplication (WGT) in the lettuce genome, suggesting that WGT-driven duplication was a major force shaping the GRAS family in this lineage [85].

3.6. GO Pathway Enrichment Analyses of GRAS Family Genes

Gene Ontology (GO) enrichment analysis was conducted on differentially expressed GRAS genes from celery (A. graveolens), coriander (C. sativum) and carrot (D. carota) (Table S6). Across the three species, molecular function (MF) terms were predominantly enriched in transcription coregulator activity and transcription coactivator activity, which aligns with the inherent transcription factor characteristics of GRAS proteins. Cellular component (CC) enrichment terms were limited in number, mainly annotated to endosome and nuclear membrane structures with weak overall enrichment signals. Biological process (BP) exhibited highly conserved enriched pathways across all three crops, including gibberellic acid-mediated signaling (GO:0009740) and regulation of seed dormancy (GO:2000033), indicating that GRAS genes perform conserved biological functions in gibberellin signal transduction and seed developmental regulation. Meanwhile, distinct species-specific BP enrichment patterns were detected: GRAS genes from celery were significantly enriched in pathways associated with arbuscular mycorrhiza and symbiotic fungal responses; coriander GRAS genes were prominently enriched in processes responding to xenobiotic stimuli and photooxidative stress; carrot GRAS genes showed specific enrichment in salicylic acid-mediated hormone signaling pathways, which demonstrates functional divergence of GRAS family genes in stress adaptation among the three tested crops.

3.7. Differential Expression Analysis and Co-Expression Network Construction of GRAS Family Genes in Coriander and Celery

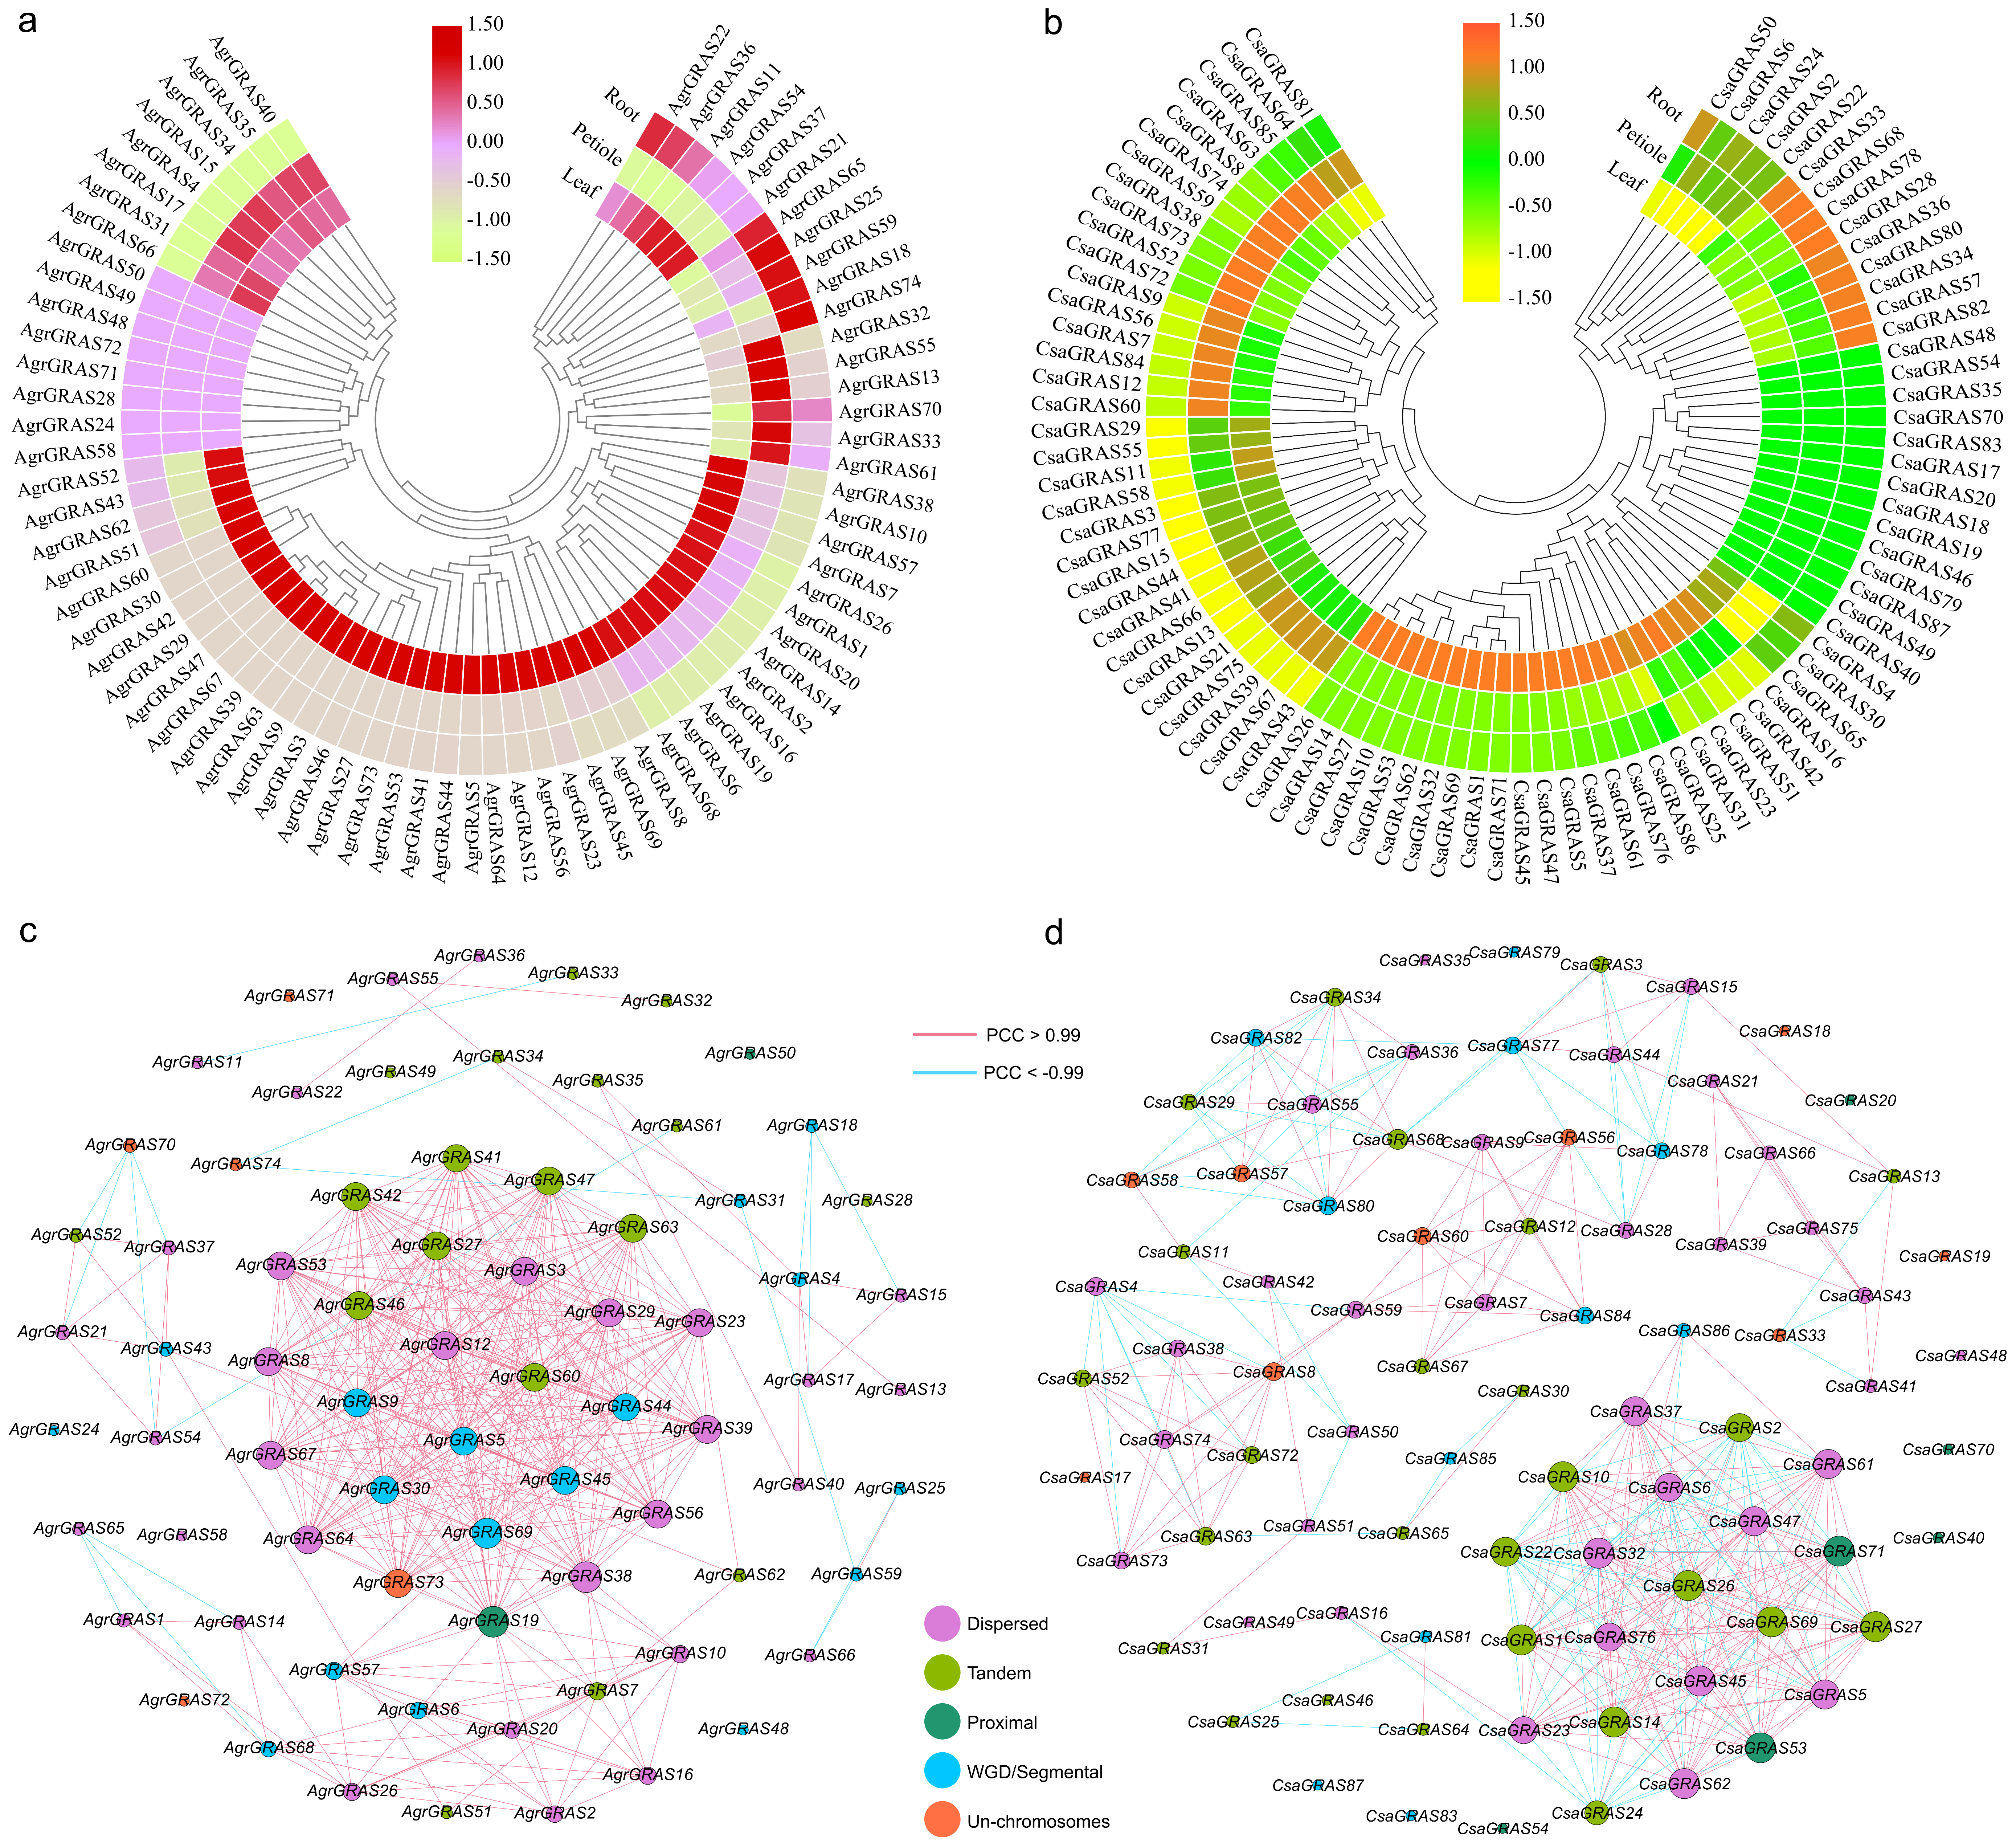
To explore the expression patterns of GRAS family genes in coriander and celery, we analyzed the gene expression differences between the two species across three tissues (root, petiole, and leaf) (Figure 5, Table S7). In celery, the gene AgrGRAS4 exhibited significantly higher expression levels in all three tissues compared to other genes, with RPKM values of 248.09, 284.45, and 150.53 in roots, petioles, and leaves, respectively. This suggests that AgrGRAS4 may play a crucial role in the growth and development of celery (Figure 5a, Table S7). Eight genes (AgrGRAS58, AgrGRAS24, AgrGRAS28, AgrGRAS71, AgrGRAS72, AgrGRAS48, AgrGRAS49, AgrGRAS50) showed no detectable expression in roots, petioles, or leaves, indicating that these genes might not function in these tissues at the sampling stage of this study. The celery GRAS family genes displayed distinct tissue-specific expression characteristics: 11 genes were exclusively expressed in roots, 2 genes were not expressed in roots, and 3 genes were not expressed in petioles. In the coriander GRAS gene family, CsaGRAS75 had significantly higher expression levels in roots and leaves than other genes, implying that this gene may be of great importance for the growth and development of coriander (Figure 5b, Table S7). Additionally, 15 other GRAS genes in coriander showed no detectable expression in roots, petioles, or leaves.
In celery, the leaf vs. root (LR) comparison yielded the largest number of differentially expressed GRAS genes, including 13 upregulated and 8 downregulated transcripts (Table S8); the leaf vs. petiole (LP) group contained six upregulated and 11 downregulated genes, while five upregulated and nine downregulated GRAS genes were detected in the root vs. petiole (RP) group. Three GRAS genes exhibited significant expression differences across all three tissue pairs, revealing stable tissue-specific expression patterns. Most celery GRAS genes showed substantially higher expression levels in leaves than in roots and petioles, which was consistent with the conserved functions in gibberellin signaling and seed development revealed by GO enrichment analysis.
For coriander, the leaf vs. petiole (LP) comparison exhibited the most striking transcriptional divergence, with 11 upregulated and one downregulated GRAS genes (Table S9). Six upregulated and five downregulated members were found in the root vs. petiole (RP) group, and six upregulated alongside two downregulated transcripts were identified in the leaf vs. root (LR) set. Only one GRAS gene maintained differential expression across all three tissue comparisons, suggesting narrower tissue expression specificity in coriander relative to celery. Consistent with the prominent enrichment of pathways responding to xenobiotics and photooxidative stress in GO analysis, most coriander GRAS genes were highly expressed in leaf tissues.
Cross-species comparison uncovered both conserved and divergent expression features of GRAS family genes. The conserved trait was that the majority of differentially expressed GRAS genes were highly expressed in leaves, implying conserved roles of GRAS proteins in leaf development and physiological regulation. Obvious interspecific divergence was also observed: celery GRAS genes displayed greater expression fluctuations in root-related tissue contrasts, matching its enrichment of pathways associated with symbiotic fungal responses, whereas coriander GRAS genes presented more dramatic expression changes in petiole-related comparisons, reflecting lineage-specific functional adaptation to distinct growth conditions.
Based on the expression values of GRAS family genes in celery and coriander, we calculated the Pearson correlation coefficients (PCCs) between every pair of GRAS genes and constructed co-expression networks using these PCC values. After filtering, the celery co-expression network contained 66 GRAS family genes (nodes) with 414 connections (edges) where |PCC| > 0.99 (Figure 5c, Tables S8 and S10). Among these connections, only 17 (4.11%) were negative regulatory interactions (PCC < −0.99), while the remaining 397 were positive relationships (Figure 5c, Table S11). Furthermore, AgrGRAS19 exhibited the highest number of connections (29), followed by AgrGRAS38 and AgrGRAS69 (Figure 5c and Figure S2a, Table S10). These results suggest that GRAS genes with more connections may serve as core regulators in the celery co-expression network.
In coriander, the co-expression network included 73 GRAS family genes (nodes) with 340 connections (edges) satisfying |PCC| > 0.99 (Figure 5d, Tables S12 and S13). Of these connections, 109 (32.06%) were negative regulatory interactions (PCC < −0.99), and the other 231 were positive relationships (Figure 5d and Figure S2b, Table S13). Thus, the proportion of negative connections in coriander was significantly higher than that in celery. These co-expression networks clearly reveal the regulatory relationships among GRAS family genes in celery and coriander, laying a foundation for future experimental studies on the functional interactions of the GRAS gene family.

3.8. Construction of Co-Expression Networks Between GRAS Family Genes and Other Transcription Factor Families in Coriander and Celery

To explore the regulatory relationships between GRAS family genes and other transcription factor (TF) families, we first identified all TFs from the celery and coriander genomes using the PlantTFDB database. In celery, a total of 1738 TFs belonging to 57 gene families were identified, while 2291 TFs from 58 gene families were detected in coriander. Based on the expression profiles of GRAS family genes and these identified TFs, we calculated the PCCs between each GRAS gene and every TF in both species, and subsequently constructed inter-family co-expression networks using these PCC values.
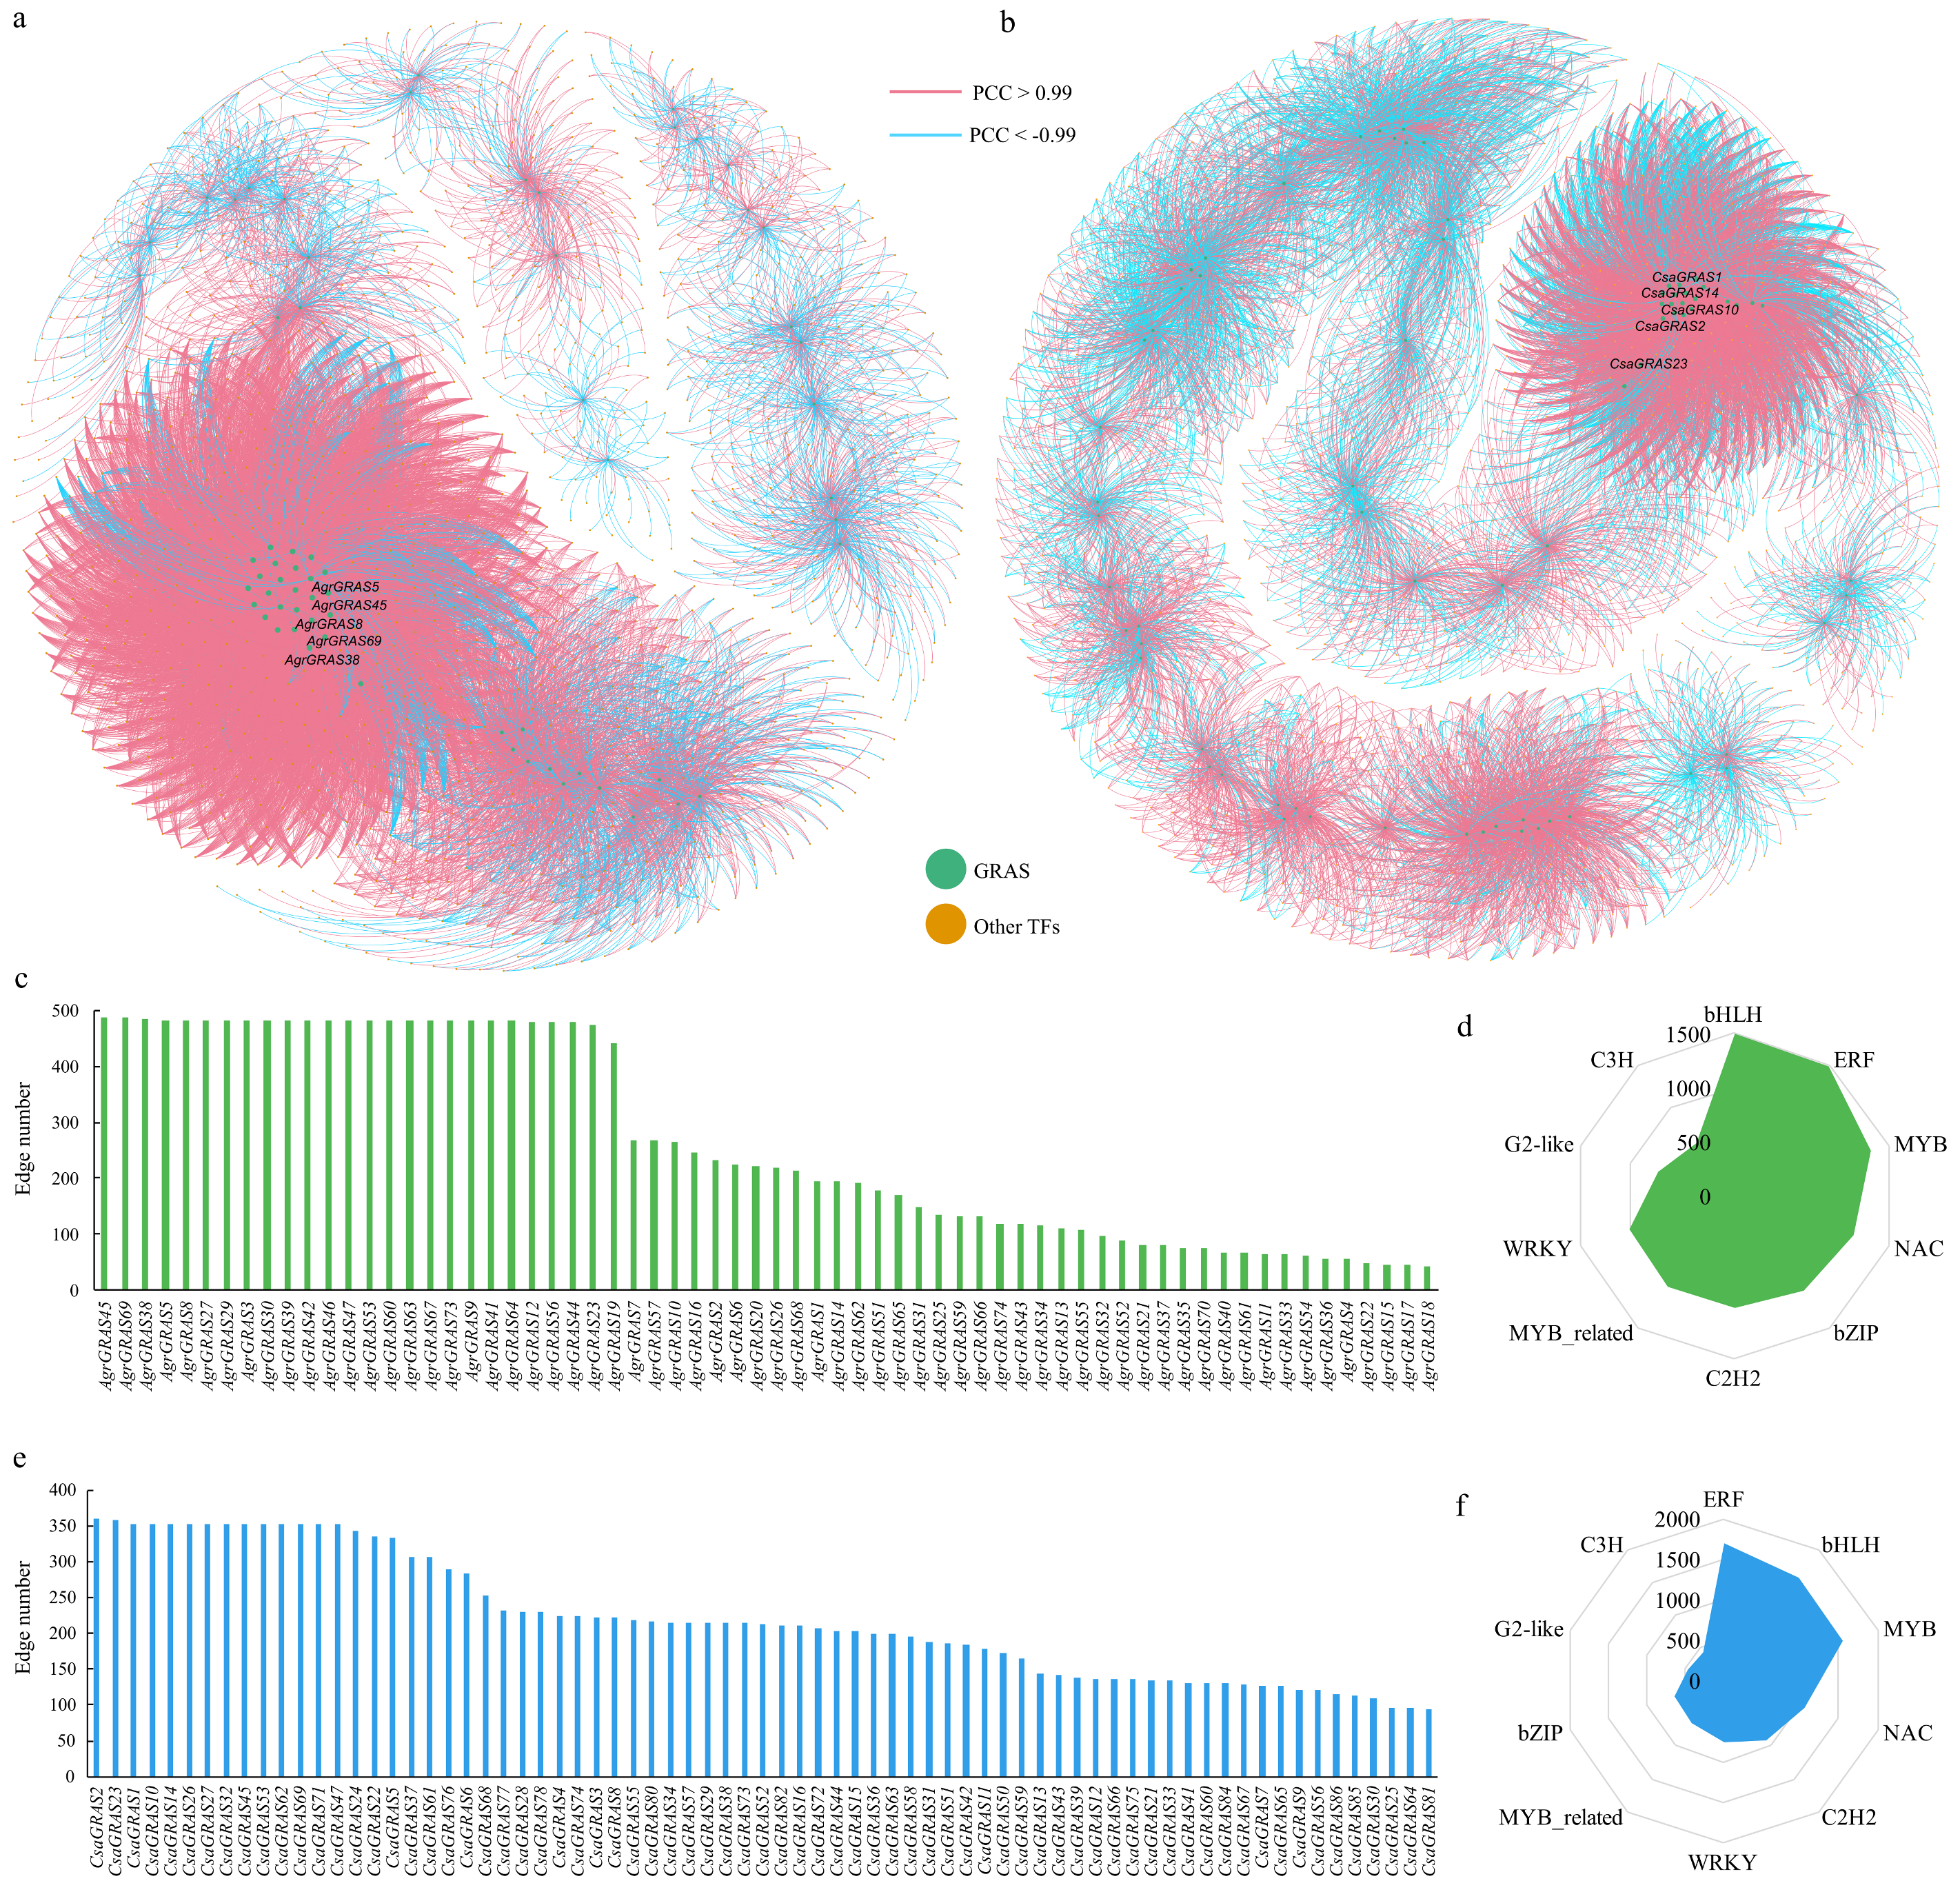
In celery, the co-expression network between GRAS family genes and other TF families contained 66 GRAS genes and 56 TF families as nodes, with a total of 17,817 connections (edges) meeting the threshold of |PCC| > 0.99 (Figure 6a, Tables S14 and S15). Among these connections, only 2637 (14.80%) represented negative regulatory interactions (PCC < −0.99), while the remaining 15,180 (85.20%) were positive relationships (Figure 6a, Table S12). For GRAS family genes, AgrGRAS45 exhibited the highest number of connections (487), followed by AgrGRAS69 and AgrGRAS38 (Figure 6c, Table S14). Among non-GRAS TF families, the bHLH family had the most connections with GRAS genes (1493), followed by the ERF family (1481) and MYB family (1337) (Figure 6d, Table S14).
In coriander, the corresponding co-expression network included 73 GRAS genes and 57 TF families as nodes, with 16,151 connections (edges) satisfying |PCC| > 0.99 (Figure 6b, Tables S16 and S17). Of these connections, 5067 (31.37%) were negative regulatory interactions (PCC < −0.99), and the other 11,084 (68.63%) were positive relationships (Figure 6b, Table S17). For GRAS family genes, CsaGRAS2 had the most connections (360), followed by CsaGRAS23 (Figure 6e, Table S16). Among non-GRAS TF families, the ERF family formed the largest number of connections with GRAS genes (1698), followed by the bHLH family (1577) and MYB family (1556) (Figure 6f, Table S16).
These co-expression networks comprehensively reveal the regulatory relationships between GRAS family genes and other TF families in celery and coriander. Specifically, GRAS genes extensively interact with bHLH, ERF and MYB transcription factor families, all of which participate in hormone signal transduction and stress responses; hub GRAS genes with high connectivity coordinate pathways governing plant growth, development and stress adaptation. These findings lay a solid foundation for future experimental investigations into the functional interactions of GRAS genes with other transcription factor families.

3.9. Large-Scale Exploration of the Evolutionary Signatures of GRAS Family Genes

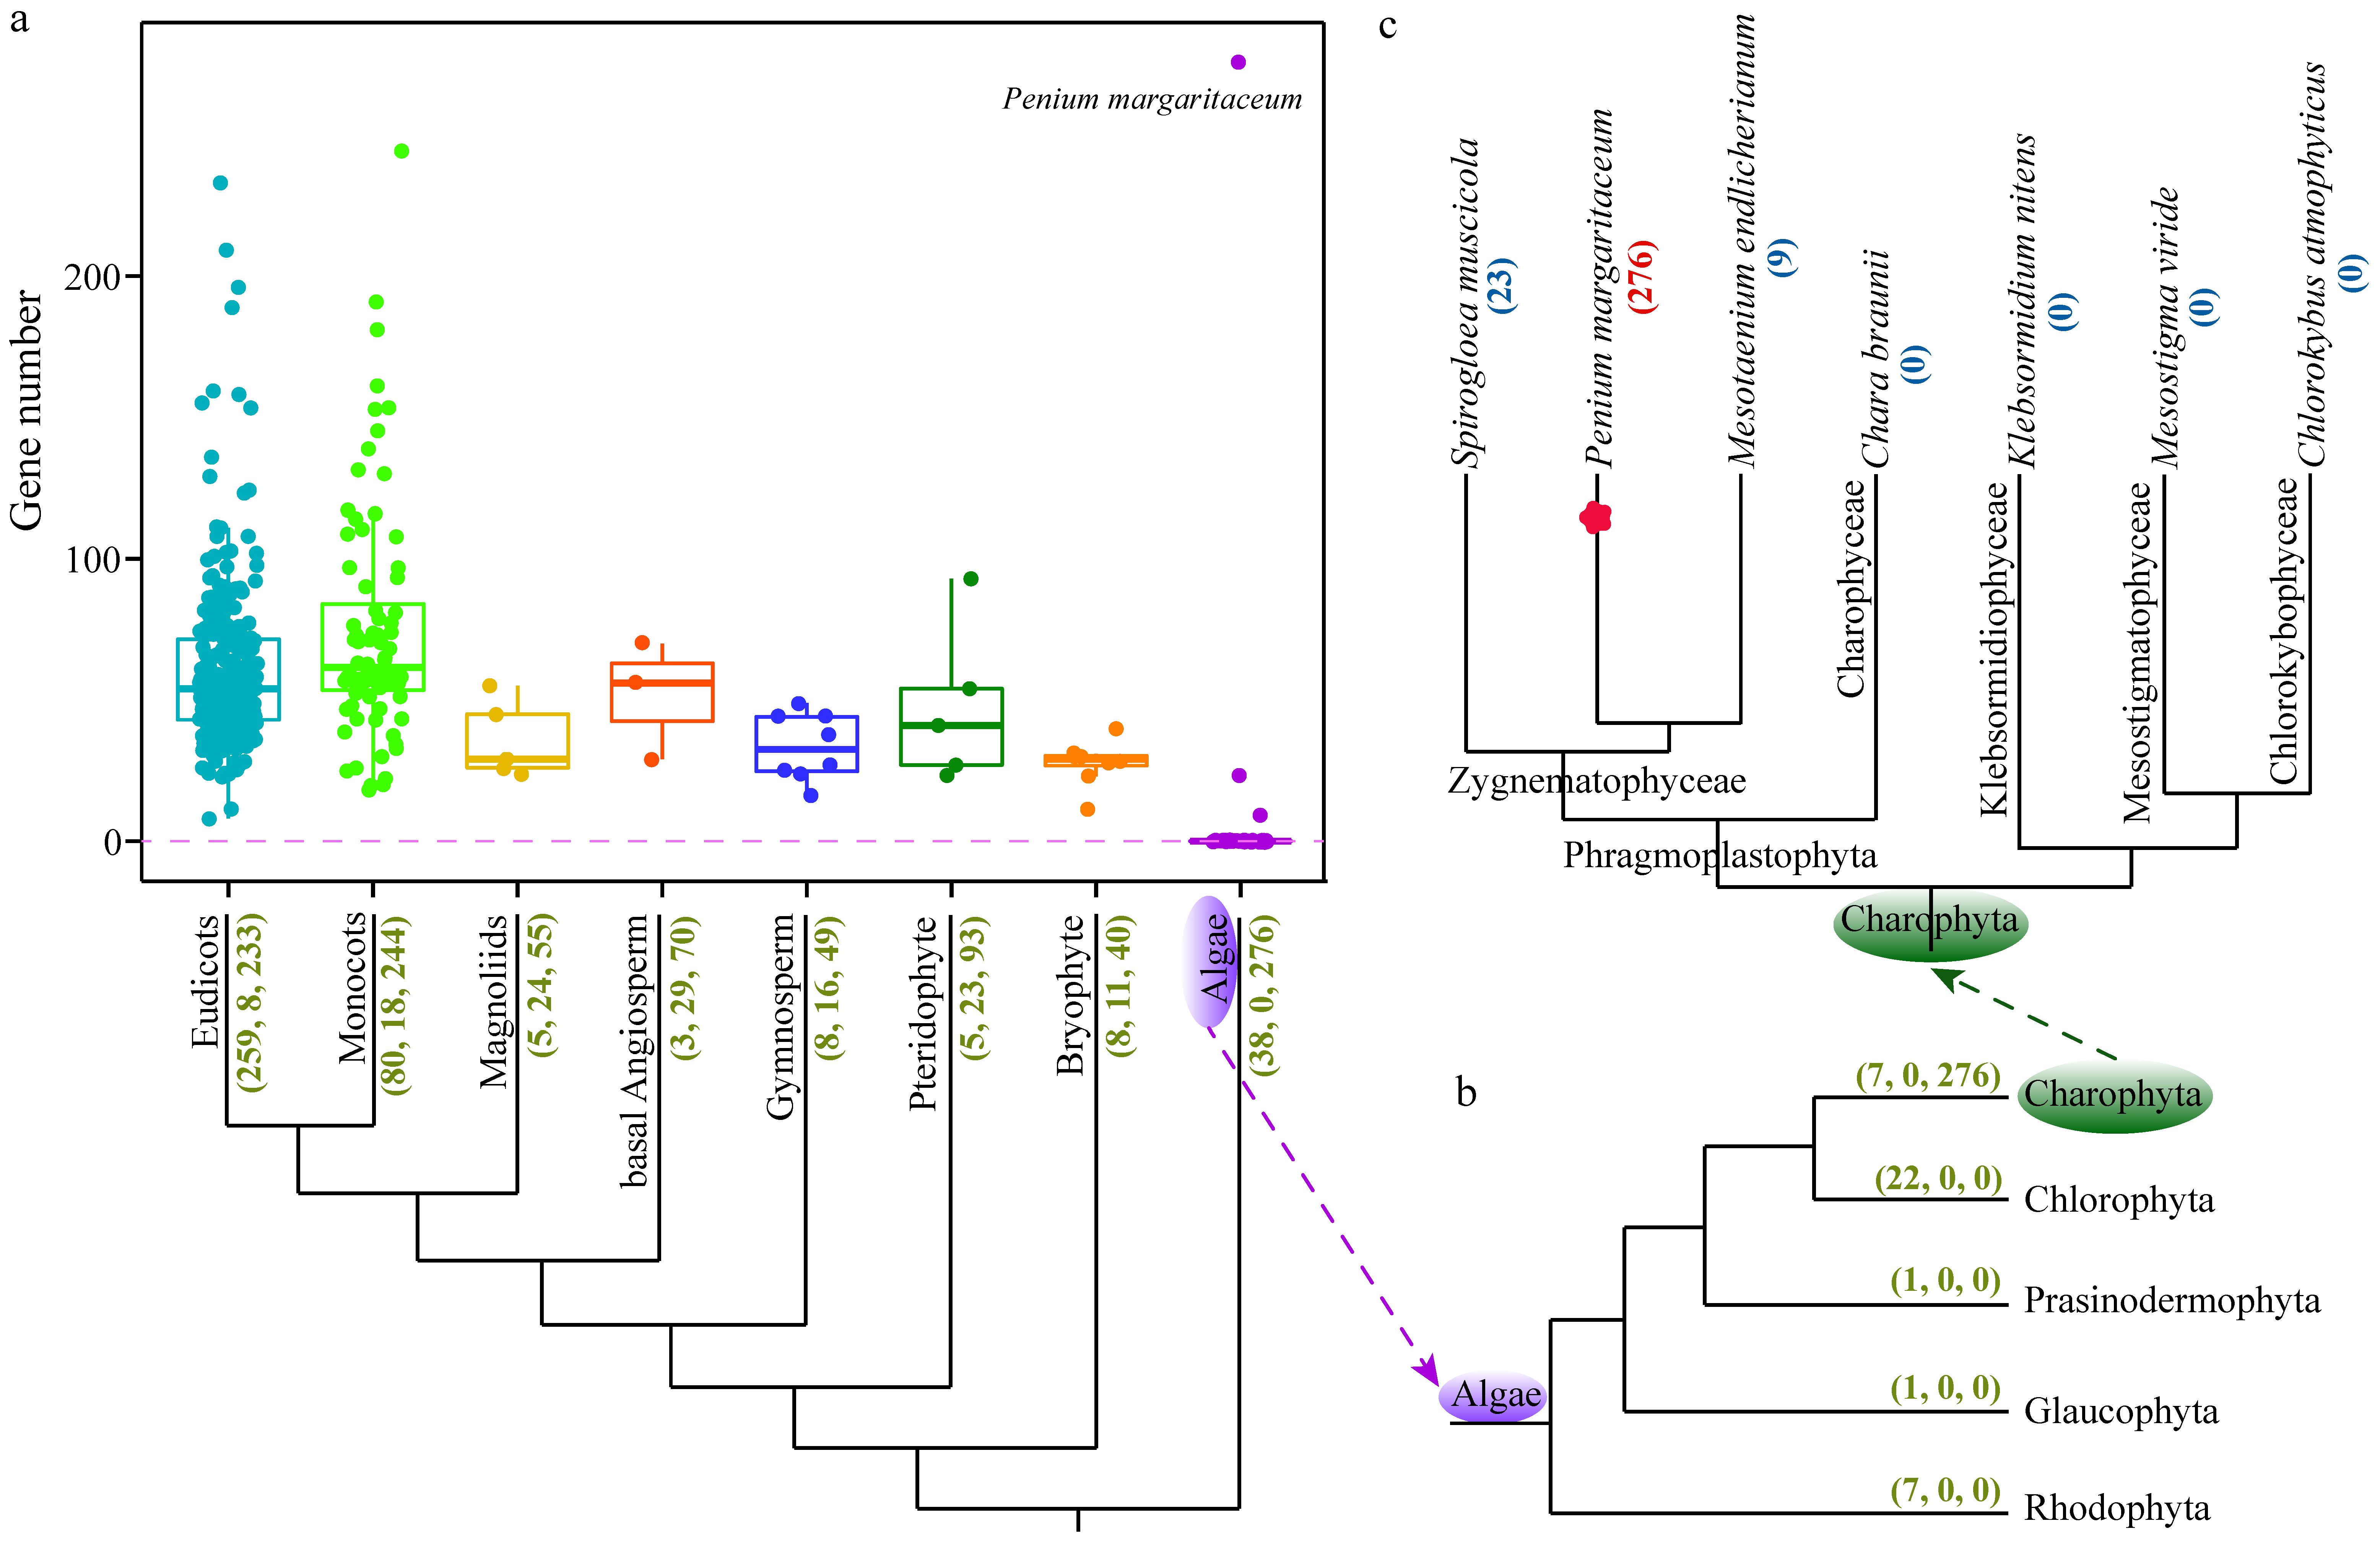
A total of 23,240 GRAS family genes were identified across 406 species with fully sequenced and well-annotated genomes (Figure 7a, Table S18). These species contained 259 eudicots, 80 monocots, 5 magnoliids, 3 basal angiosperms, 8 gymnosperms, 5 ferns, 8 mosses, and 38 algae (Figure 7a, Table S18). All surveyed higher plants contained GRAS genes: the eudicot Amaranthus hypochondriacus had the fewest (8 GRAS genes), while the monocot Dendrocalamus latiflorus had the most (244 GRAS genes). GRAS gene numbers ranged from 8 to 233 in eudicots and 18 to 244 in monocots, with most monocots and eudicots harboring more GRAS genes than other taxonomic groups. Notably, GRAS gene counts varied drastically among the 38 lower plant algae examined (Figure 7b, Table S18). No GRAS family genes were detected in 35 algae, whereas Penium margaritaceum contained 276 GRAS genes—more than any of the other 405 species in this study (Figure 7a,b, Table S18).
Further analysis of GRAS genes in the 38 algae revealed their presence exclusively in Charophyta; no GRAS genes were found in the 31 more basal algae (Figure 7b, Table S18). Among the 7 Charophyta species, GRAS genes were detected in 3 species of Zygnematophyceae, but absent from 4 species belonging to Charophyceae and other more basal families within Charophyta (Figure 7c, Table S18). These results suggest that GRAS family genes likely originated in Zygnematophyceae and underwent significant expansion in P. margaritaceum during evolutionary progression.
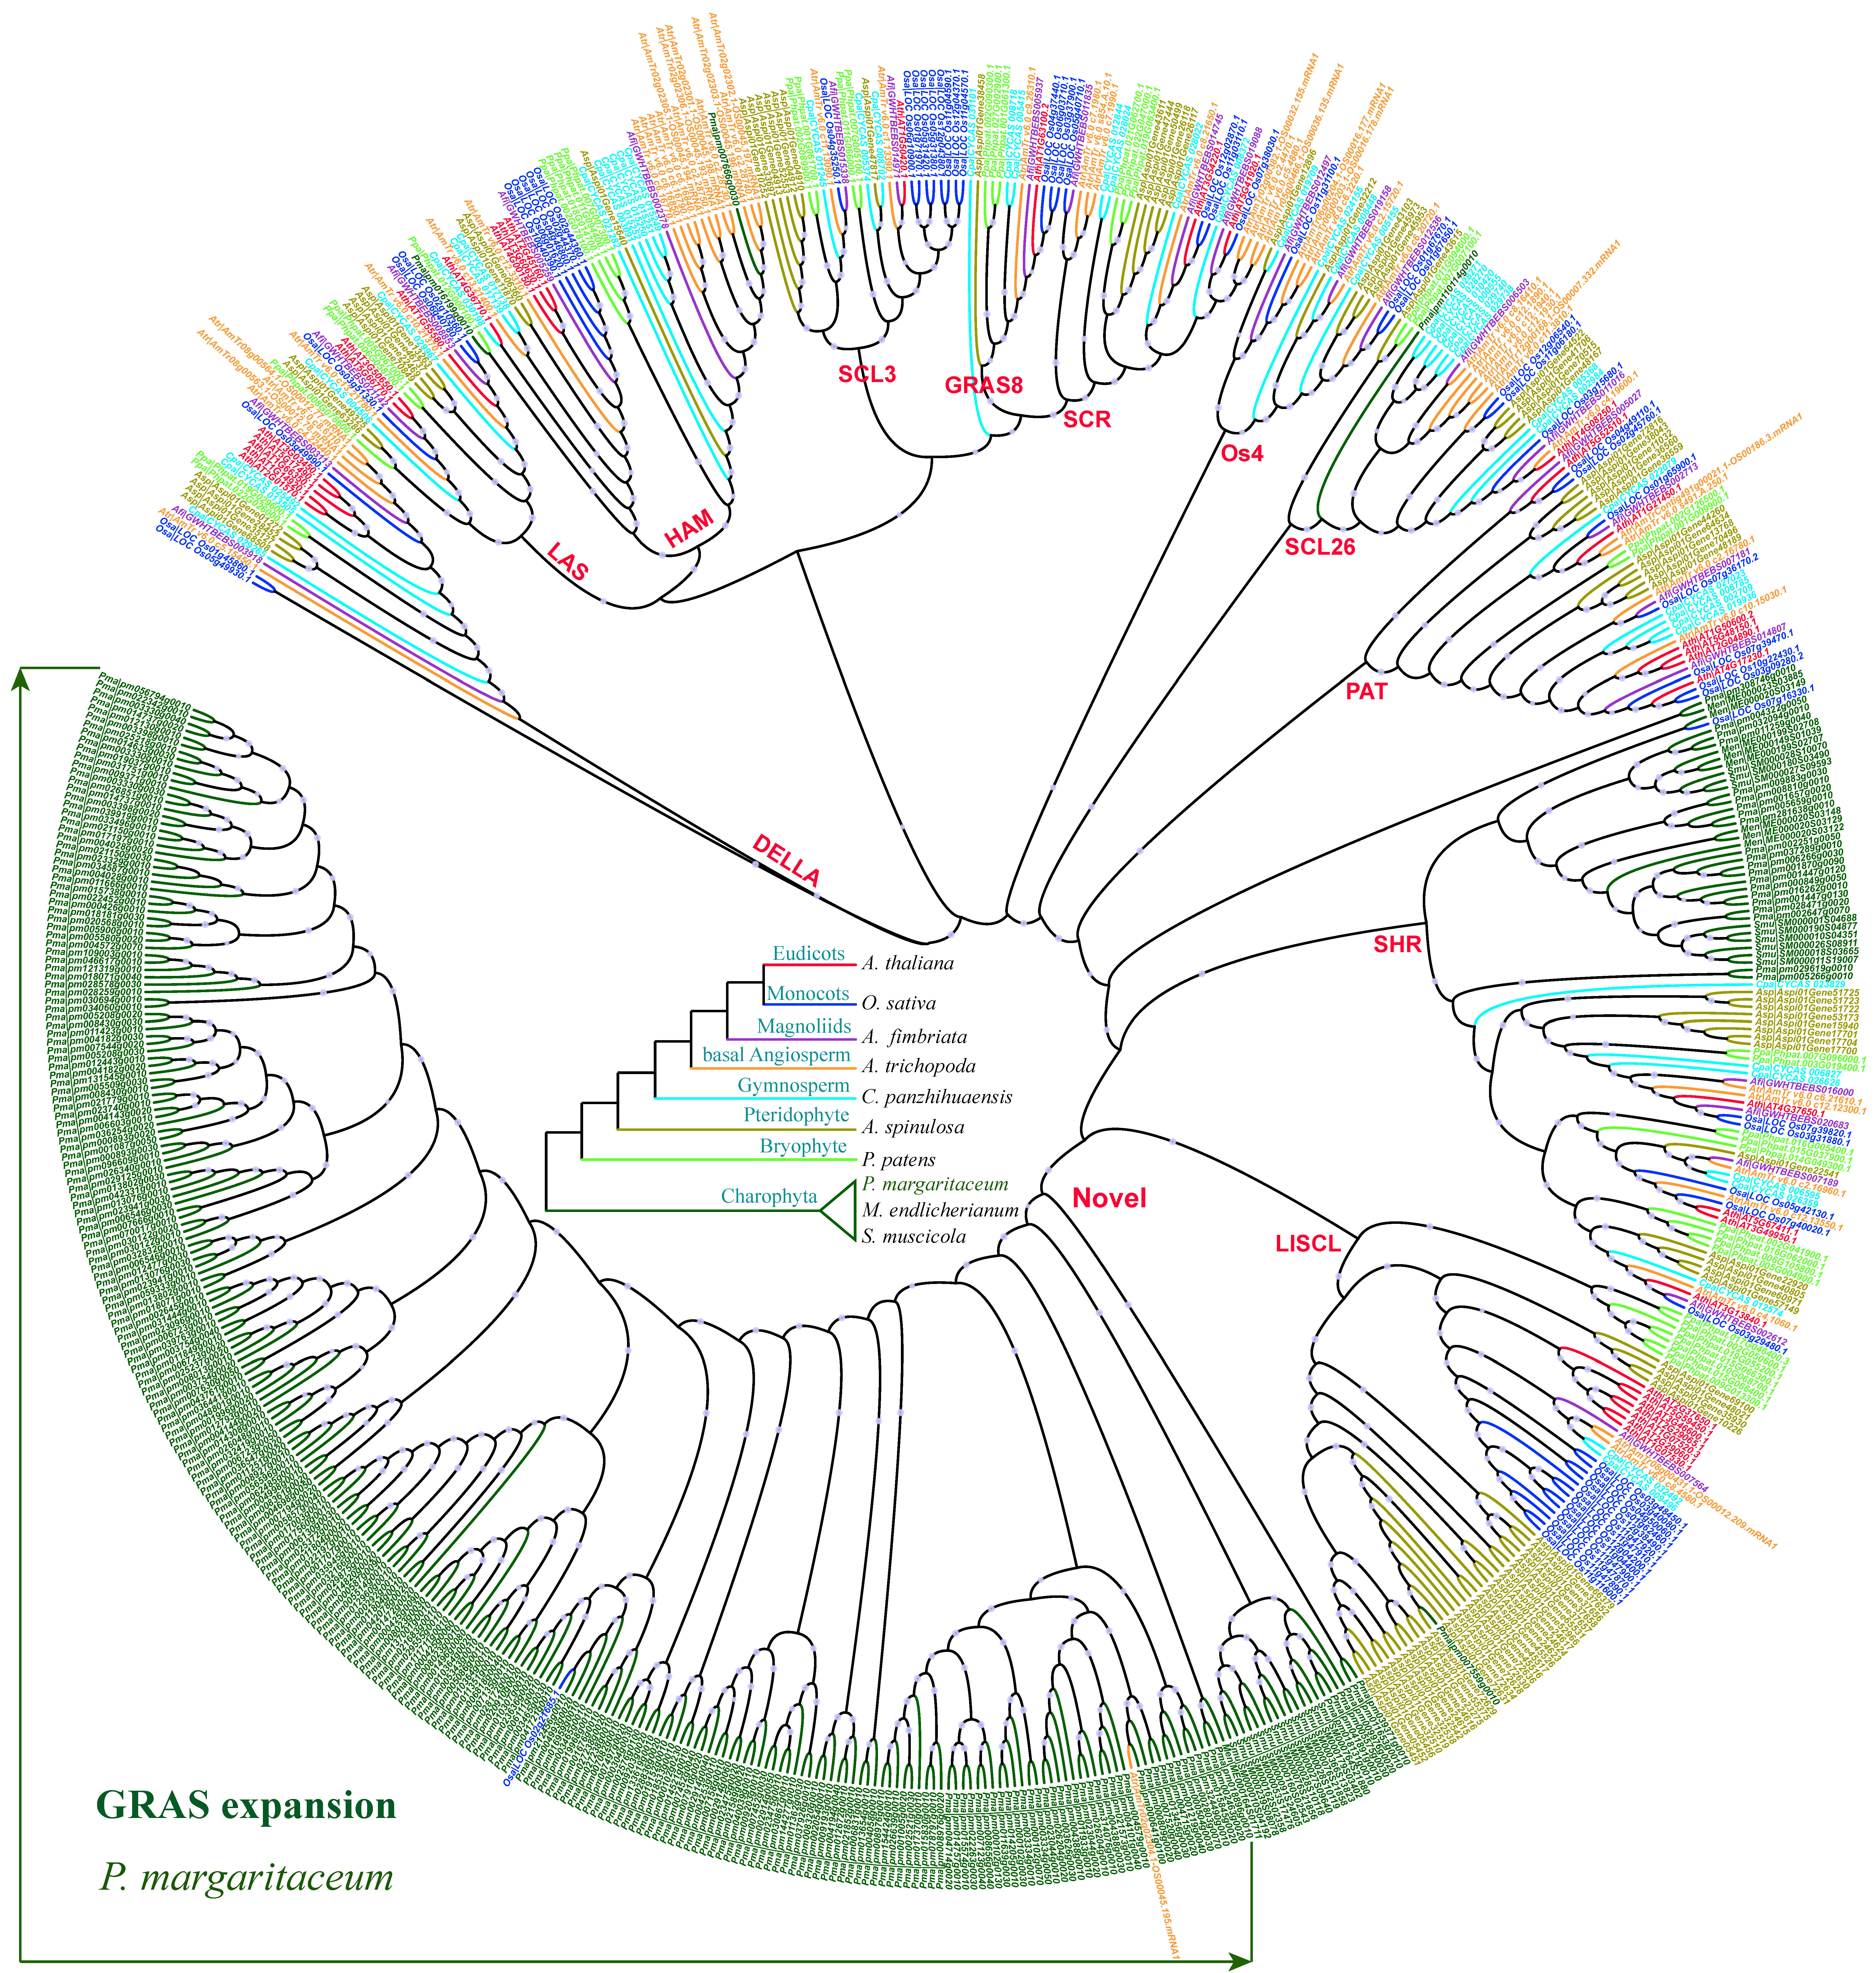
To further investigate the evolutionary origin and diversification of GRAS genes, we selected 7 representative species covering major evolutionary lineages, combined with the 3 Charophyta species harboring GRAS genes, to construct a phylogenetic tree (Figure 8). The selected representative species included the eudicot model A. thaliana, the monocot model Oryza sativa, the magnoliid Aristolochia fimbriata, the basal angiosperm Amborella trichopoda, the gymnosperm Cycas panzhihuaensis, the fern Alsophila spinulosa, and the bryophyte Physcomitrella patens. Based on previous GRAS classification systems and the topology of our phylogenetic tree, we divided the GRAS family into 12 groups. Among these, the HAM, SHR, LISCL, and CHARO groups all contained Charophyta-derived GRAS genes, while the DELLA, LAS, SCL3, GRAS8, SCR, OS4, SCL26, and PAT8 groups lacked Charophyta members. Except for the OS4 group, the other 8 groups all included GRAS genes from the bryophyte P. patens, indicating that these groups originated in bryophytes. The OS4 group emerged later, first appearing in ferns, and was not represented in the eudicot A. thaliana. For Charophyta GRAS genes, the vast majority belonged to the SHR and CHARO groups. Notably, the CHARO group is a novel subgroup identified and named in this study, which has not been reported previously. Almost all members of the CHARO group were derived from the lower plant Charophyta, and this group played a crucial role in the expansion of the GRAS gene family in P. margaritaceum.

4. Discussion

GRAS family genes are widely distributed across most plant lineages and play pivotal roles in regulating various aspects of plant growth and development [8,86]. Accumulated functional studies illustrate that GRAS proteins coordinate stress adaptation via cross-talk with multiple stress-related transcription factors and hormone pathways. In A. thaliana, the functional characterization of most GRAS family members has been well established. For instance, the Arabidopsis GRAS gene AtSCL14 (At1g07530) is essential for activating stress-inducible promoters, and its overexpression or functional activation confers enhanced tolerance to toxic concentrations of 2,4,6-triiodobenzoic acid and the chemical isonicotinic acid [87]. Similarly, the GRAS transcription factor PAT1 (VIT_219s0014g04940) from grapevine regulates jasmonic acid biosynthesis in response to cold stress, a function conserved in Arabidopsis [88,89]. These well-characterized GRAS genes from Arabidopsis and grapevine provide valuable references for inferring the functions of GRAS family members in Apiaceae through bioinformatics analysis. Phylogenetic analysis revealed that grapevine PAT1 (VviGRAS46), a key regulator of cold stress responses, clusters closely with CsaGRAS63, AgrGRAS23, and DcaGRAS23 from Apiaceae (Figure 1a). Based on this evolutionary affinity, we hypothesize that these three Apiaceae GRAS genes may be involved in mediating cold stress tolerance. Similarly, Apiaceae GRAS genes classified into the LISCL subfamily form a monophyletic clade with AtSCL14 (Figure 1a), a gene implicated in tolerance to toxic compounds. Thus, it is reasonable to speculate that most LISCL subfamily genes in Apiaceae might contribute to plant tolerance against toxic substances. However, the precise biological functions of these Apiaceae GRAS genes, including their regulatory mechanisms and physiological roles, require further experimental validation in future studies.
Our analysis revealed that most duplicated GRAS family genes exhibit conserved expression patterns across different tissues. However, a subset of duplicated genes showed distinct expression divergence. For example, in celery, three duplicated genes—AgrGRAS26, AgrGRAS27, and AgrGRAS28—displayed notably different expression profiles across the three tested tissues (Figure 5a). Similarly, within another duplicated gene set, AgrGRAS39 and AgrGRAS41 shared similar expression patterns, while both differed significantly from the third duplicated paralog, AgrGRAS40 (Figure 5a). This observed expression divergence among duplicated GRAS genes suggests that functional differentiation of these paralogs occurred during celery evolution, which aligns with previous reports documenting functional divergence of duplicated genes in plants [90,91]. According to established evolutionary models, duplicated genes typically undergo one of several fates, including subfunctionalization, neofunctionalization, functional conservation, or specialization [1,90,92,93]. Collectively, the expression patterns of duplicated GRAS genes identified in this study provide a critical foundation for subsequent functional characterization of these gene families in Apiaceae.
Previously, the GRAS gene family has been extensively characterized in a wide range of plant species; however, no systematic investigation of this family has been conducted in Apiaceae. The recent release of genome sequences for carrot, celery, and coriander has greatly facilitated the present study [46,47,75]. Here, we identified 74, 87, and 74 GRAS genes in the genomes of celery, coriander, and carrot, respectively. For comparative analysis with these three Apiaceae species, we also identified 34, 72, and 53 GRAS genes in A. thaliana, lettuce, and grapevine genomes, respectively.
To explore the evolutionary relationships of GRAS genes, we constructed a phylogenetic tree using GRAS protein sequences from coriander, celery, carrot, lettuce, Arabidopsis, and grapevine. Analyses of conserved motifs and gene structures revealed that GRAS family genes within the same group or subgroup shared similar structural features—a finding consistent with previous reports on GRAS gene families in other plants [94,95,96]. Furthermore, we found that whole-genome duplication/segmental duplication (WGD/Segmental) was the primary mode of gene duplication for GRAS genes in coriander and carrot, whereas dispersed duplication was the dominant type in celery.
To date, only a limited number of gene family studies have been reported in Apiaceae species [1,90,97]. This study represents the first systematic analysis of the GRAS gene family across three Apiaceae vegetables. Investigating these GRAS family genes will facilitate the understanding of the molecular genetic regulatory mechanisms underlying the genetic improvement of Apiaceae crops, while also providing functional gene resources for gene editing and transgenic research. Furthermore, this work enhances our insights into the impacts of gene duplication and loss events during the evolutionary process of Apiaceae species. Overall, our study offers valuable resources for future investigations on the evolution and functional characterization of the GRAS gene family in Apiaceae vegetables.

5. Conclusions

In the present study, we systematically identified and characterized the GRAS transcription factor family in three economically valuable Apiaceae vegetables: coriander (C. sativum), celery (A. graveolens), and carrot (D. carota). In total, 87, 74, and 74 GRAS genes were retrieved from their respective genomes, and all 235 GRAS members were divided into 13 distinct subclades based on phylogenetic topology, conserved motif composition, and gene structural features. Chromosomal mapping revealed an obvious clustered distribution of GRAS genes across the chromosomes of the three species, and 11 unanchored coriander GRAS genes were proven to be located on unassembled genome scaffolds that cannot be assigned to assembled chromosomes. Inter-species orthologous gene pairs and intra-species paralogs were extensively screened, demonstrating that GRAS families remain highly conserved during the speciation of Apiaceae crops yet underwent lineage-specific expansion via distinct duplication mechanisms. WGD/segmental duplication acted as the primary driving force for GRAS expansion in coriander and carrot, while dispersed duplication dominated the amplification of celery GRAS genes; across all three vegetables, gene duplication events far outnumbered gene loss events over evolutionary time.
Tissue transcriptome profiling uncovered widespread expression of GRAS genes in roots, petioles and leaves, with a subset of members showing striking tissue-specific expression patterns. Core hub genes such as AgrGRAS4 in celery and CsaGRAS75 in coriander exhibited extremely high transcript abundance in multiple tissues, implying their central roles in plant growth and development. We further constructed two layers of co-expression networks for celery and coriander: intra-family regulatory networks among GRAS members, and inter-family interaction networks linking GRAS proteins to bHLH, ERF, MYB and other key stress-related transcription factors. These network datasets provide clear clues for exploring how GRAS proteins coordinate plant stress adaptation and developmental regulation.
By leveraging genome resources from 406 plant species covering algae, bryophytes, ferns, gymnosperms and angiosperms, we traced the deep evolutionary origin of the GRAS gene family. Phylogenetic evidence strongly supports that GRAS genes first emerged in Zygnematophyceae charophyte algae and experienced massive independent expansion in P. margaritaceum. A novel CHARO subfamily unique to early charophyte algae was identified in this work, which contributes to the huge GRAS gene repertoire of this alga. Several GRAS subclades, including SHR, HAM and LISCL, originated in basal streptophytes and were retained throughout plant terrestrialization, while subgroups such as OS4 arose later in fern lineages.
Collectively, this work represents the first comprehensive genome-wide investigation of the GRAS family across three typical Apiaceae medicinal and edible vegetables. Our multi-dimensional results clarify the classification, chromosomal distribution, duplication modes, tissue expression profiles, co-regulatory networks and deep evolutionary trajectory of plant GRAS transcription factors. The abundant genomic resources and evolutionary evidence generated here lay a solid foundation for subsequent gene functional verification, genetic improvement and comparative genomic research of GRAS genes in Apiaceae and other crop species.

Supplementary Materials

The following supporting information can be downloaded at: https://www.mdpi.com/article/10.3390/life16071113/s1.

Author Contributions

X.S., X.M. and Y.L. conceived the project and were responsible for the project initiation. Data generation and bioinformatics analysis were led by X.S., X.M., Q.P., M.S., X.L., D.G., X.Z., Z.M. and R.Z. The manuscript was organized, written and revised by X.S., X.M., Q.P., M.S. and Y.L. All authors have read and agreed to the published version of the manuscript.

Funding

This work was supported by Tangshan Talent Funding Program (B202305014), Basic research expenses for provincial universities (JJC2024001), Tangshan Science and Technology Plan Project (24130219C), National Natural Science Foundation of China (32573037), S&T Program of Hebei (23372505D), and Hebei Natural Science Foundation (H2023209084).

Institutional Review Board Statement

Not applicable.

Informed Consent Statement

Not applicable.

Data Availability Statement

The expression datasets analyzed in this study are available in the Beijing Institute of Genomics (BIG) Data Center under accession numbers CRA001996 and CRA001658, which are publicly accessible at http://bigd.big.ac.cn/gsa (accessed on 28 May 2026). All materials and related data in this study are provided in the Supplementary Materials.

Conflicts of Interest

The authors declare no competing interests.

References

  1. Pei, Q.; Yu, T.; Wu, T.; Yang, Q.; Gong, K.; Zhou, R.; Cui, C.; Yu, Y.; Zhao, W.; Kang, X.; et al. Comprehensive identification and analyses of the Hsf gene family in the whole-genome of three Apiaceae species. Hortic. Plant J. 2021, 7, 457–468. [Google Scholar] [CrossRef]
  2. Song, X.M.; Huang, Z.N.; Duan, W.K.; Ren, J.; Liu, T.K.; Li, Y.; Hou, X.L. Genome-wide analysis of the bHLH transcription factor family in Chinese cabbage (Brassica rapa ssp. pekinensis). Mol. Genet. Genom. 2014, 289, 77–91. [Google Scholar] [CrossRef] [PubMed]
  3. Dhatterwal, P.; Sharma, N.; Prasad, M. Decoding the functionality of plant transcription factors. J. Exp. Bot. 2024, 75, 4745–4759. [Google Scholar] [CrossRef] [PubMed]
  4. Song, L.; Li, W.; Chen, X. Transcription factor is not just a transcription factor. Trends Plant Sci. 2022, 27, 1087–1089. [Google Scholar] [CrossRef] [PubMed]
  5. Kaufmann, K.; Pajoro, A.; Angenent, G.C. Regulation of transcription in plants: Mechanisms controlling developmental switches. Nat. Rev. Genet. 2010, 11, 830–842. [Google Scholar] [CrossRef] [PubMed]
  6. Rabeh, K.; Hnini, M.; Oubohssaine, M. A comprehensive review of transcription factor-mediated regulation of secondary metabolites in plants under environmental stress. Stress Biol. 2025, 5, 15. [Google Scholar] [CrossRef]
  7. Khan, Y.; Xiong, Z.; Zhang, H.; Liu, S.; Yaseen, T.; Hui, T. Expression and roles of GRAS gene family in plant growth, signal transduction, biotic and abiotic stress resistance and symbiosis formation—A review. Plant Biol. 2022, 24, 404–416. [Google Scholar] [CrossRef] [PubMed]
  8. Jaiswal, V.; Kakkar, M.; Kumari, P.; Zinta, G.; Gahlaut, V.; Kumar, S. Multifaceted roles of GRAS transcription factors in growth and stress responses in plants. iScience 2022, 25, 105026. [Google Scholar] [CrossRef] [PubMed]
  9. Waseem, M.; Nkurikiyimfura, O.; Niyitanga, S.; Jakada, B.H.; Shaheen, I.; Aslam, M.M. GRAS transcription factors emerging regulator in plants growth, development, and multiple stresses. Mol. Biol. Rep. 2022, 49, 9673–9685. [Google Scholar] [CrossRef] [PubMed]
  10. Neves, C.; Ribeiro, B.; Amaro, R.; Expósito, J.; Grimplet, J.; Fortes, A.M. Network of GRAS transcription factors in plant development, fruit ripening and stress responses. Hortic. Res. 2023, 10, uhad220. [Google Scholar] [CrossRef] [PubMed]
  11. Pysh, L.D.; Wysocka-Diller, J.W.; Camilleri, C.; Bouchez, D.; Benfey, P.N. The GRAS gene family in Arabidopsis: Sequence characterization and basic expression analysis of the SCARECROW-LIKE genes. Plant J. 1999, 18, 111–119. [Google Scholar] [CrossRef] [PubMed]
  12. Grimplet, J.; Agudelo-Romero, P.; Teixeira, R.T.; Martinez-Zapater, J.M.; Fortes, A.M. Structural and Functional Analysis of the GRAS Gene Family in Grapevine Indicates a Role of GRAS Proteins in the Control of Development and Stress Responses. Front. Plant Sci. 2016, 7, 353. [Google Scholar] [CrossRef] [PubMed]
  13. Song, X.M.; Liu, T.K.; Duan, W.K.; Ma, Q.H.; Ren, J.; Wang, Z.; Li, Y.; Hou, X.L. Genome-wide analysis of the GRAS gene family in Chinese cabbage (Brassica rapa ssp. pekinensis). Genomics 2014, 103, 135–146. [Google Scholar] [CrossRef] [PubMed]
  14. Xu, W.; Chen, Z.; Ahmed, N.; Han, B.; Cui, Q.; Liu, A. Genome-Wide Identification, Evolutionary Analysis, and Stress Responses of the GRAS Gene Family in Castor Beans. Int. J. Mol. Sci. 2016, 17, 1004. [Google Scholar] [CrossRef] [PubMed]
  15. Bolle, C. The role of GRAS proteins in plant signal transduction and development. Planta 2004, 218, 683–692. [Google Scholar] [CrossRef] [PubMed]
  16. Quan, S.; Niu, J.; Zhou, L.; Xu, H.; Ma, L.; Qin, Y. Genome-wide Identification, Classification, Expression and Duplication Analysis of GRAS Family Genes in Juglans regia L. Sci. Rep. 2019, 9, 11643. [Google Scholar] [CrossRef] [PubMed]
  17. Sun, X.; Xue, B.; Jones, W.T.; Rikkerink, E.; Dunker, A.K.; Uversky, V.N. A functionally required unfoldome from the plant kingdom: Intrinsically disordered N-terminal domains of GRAS proteins are involved in molecular recognition during plant development. Plant Mol. Biol. 2011, 77, 205–223. [Google Scholar] [CrossRef] [PubMed]
  18. Hirsch, S.; Kim, J.; Munoz, A.; Heckmann, A.B.; Downie, J.A.; Oldroyd, G.E. GRAS proteins form a DNA binding complex to induce gene expression during nodulation signaling in Medicago truncatula. Plant Cell 2009, 21, 545–557. [Google Scholar] [CrossRef] [PubMed]
  19. Lee, M.H.; Kim, B.; Song, S.K.; Heo, J.O.; Yu, N.I.; Lee, S.A.; Kim, M.; Kim, D.G.; Sohn, S.O.; Lim, C.E.; et al. Large-scale analysis of the GRAS gene family in Arabidopsis thaliana. Plant Mol. Biol. 2008, 67, 659–670. [Google Scholar] [CrossRef] [PubMed]
  20. Huang, W.; Xian, Z.; Kang, X.; Tang, N.; Li, Z. Genome-wide identification, phylogeny and expression analysis of GRAS gene family in tomato. BMC Plant Biol. 2015, 15, 209. [Google Scholar] [CrossRef] [PubMed]
  21. Tian, C.; Wan, P.; Sun, S.; Li, J.; Chen, M. Genome-wide analysis of the GRAS gene family in rice and Arabidopsis. Plant Mol. Biol. 2004, 54, 519–532. [Google Scholar] [CrossRef] [PubMed]
  22. Niu, Y.; Zhao, T.; Xu, X.; Li, J. Genome-wide identification and characterization of GRAS transcription factors in tomato (Solanum lycopersicum). PeerJ 2017, 5, e3955. [Google Scholar] [CrossRef] [PubMed]
  23. Lu, J.; Wang, T.; Xu, Z.; Sun, L.; Zhang, Q. Genome-wide analysis of the GRAS gene family in Prunus mume. Mol. Genet. Genom. 2015, 290, 303–317. [Google Scholar] [CrossRef] [PubMed]
  24. Chen, H.; Li, H.; Lu, X.; Chen, L.; Liu, J.; Wu, H. Identification and Expression Analysis of GRAS Transcription Factors to Elucidate Candidate Genes Related to Stolons, Fruit Ripening and Abiotic Stresses in Woodland Strawberry (Fragaria vesca). Int. J. Mol. Sci. 2019, 20, 4593. [Google Scholar] [CrossRef] [PubMed]
  25. Fan, Y.; Wei, X.; Lai, D.; Yang, H.; Feng, L.; Li, L.; Niu, K.; Chen, L.; Xiang, D.; Ruan, J.; et al. Genome-wide investigation of the GRAS transcription factor family in foxtail millet (Setaria italica L.). BMC Plant Biol. 2021, 21, 508. [Google Scholar] [CrossRef] [PubMed]
  26. Fan, Y.; Yan, J.; Lai, D.; Yang, H.; Xue, G.; He, A.; Guo, T.; Chen, L.; Cheng, X.B.; Xiang, D.B.; et al. Genome-wide identification, expression analysis, and functional study of the GRAS transcription factor family and its response to abiotic stress in sorghum [Sorghum bicolor (L.) Moench]. BMC Genom. 2021, 22, 509. [Google Scholar] [CrossRef] [PubMed]
  27. Zhang, B.; Liu, J.; Yang, Z.E.; Chen, E.Y.; Zhang, C.J.; Zhang, X.Y.; Li, F.G. Genome-wide analysis of GRAS transcription factor gene family in Gossypium hirsutum L. BMC Genom. 2018, 19, 348. [Google Scholar] [CrossRef] [PubMed]
  28. To, V.T.; Shi, Q.; Zhang, Y.; Shi, J.; Shen, C.; Zhang, D.; Cai, W. Genome-Wide Analysis of the GRAS Gene Family in Barley (Hordeum vulgare L.). Genes 2020, 11, 553. [Google Scholar] [CrossRef] [PubMed]
  29. Wang, X.; Li, G.; Sun, Y.; Qin, Z.; Feng, P. Genome-wide analysis and characterization of GRAS family in switchgrass. Bioengineered 2021, 12, 6096–6114. [Google Scholar] [CrossRef] [PubMed]
  30. Zhang, H.; Mi, L.; Xu, L.; Yu, C.; Li, C.; Chen, C. Genome-wide identification, characterization, interaction network and expression profile of GRAS gene family in sweet orange (Citrus sinensis). Sci. Rep. 2019, 9, 2156. [Google Scholar] [CrossRef] [PubMed]
  31. Wang, Y.X.; Liu, Z.W.; Wu, Z.J.; Li, H.; Wang, W.L.; Cui, X.; Zhuang, J. Genome-wide identification and expression analysis of GRAS family transcription factors in tea plant (Camellia sinensis). Sci. Rep. 2018, 8, 3949. [Google Scholar] [CrossRef] [PubMed]
  32. Wang, X.; Manzoor, M.A.; Wang, M.; Zhao, Y.; Feng, X.; Alam, P.; Chi, X.; Cai, Y. Integrative Analysis of the GRAS Genes from Chinese White Pear (Pyrus bretschneideri): A Critical Role in Leaf Regeneration. Front. Plant Sci. 2022, 13, 898786. [Google Scholar] [CrossRef] [PubMed]
  33. Lu, X.; Liu, W.; Xiang, C.; Li, X.; Wang, Q.; Wang, T.; Liu, Z.; Zhang, J.; Gao, L.; Zhang, W. Genome-Wide Characterization of GRAS Family and Their Potential Roles in Cold Tolerance of Cucumber (Cucumis sativus L.). Int. J. Mol. Sci. 2020, 21, 3857. [Google Scholar] [CrossRef] [PubMed]
  34. Wang, Y.; Shi, S.; Zhou, Y.; Zhou, Y.; Yang, J.; Tang, X. Genome-wide identification and characterization of GRAS transcription factors in sacred lotus (Nelumbo nucifera). PeerJ 2016, 4, e2388. [Google Scholar] [CrossRef] [PubMed]
  35. Chen, Y.; Zhu, P.; Wu, S.; Lu, Y.; Sun, J.; Cao, Q.; Li, Z.; Xu, T. Identification and expression analysis of GRAS transcription factors in the wild relative of sweet potato Ipomoea trifida. BMC Genom. 2019, 20, 911. [Google Scholar] [CrossRef] [PubMed]
  36. Wang, L.; Ding, X.; Gao, Y.; Yang, S. Genome-wide identification and characterization of GRAS genes in soybean (Glycine max). BMC Plant Biol. 2020, 20, 415. [Google Scholar] [CrossRef] [PubMed]
  37. Zhang, H.; Liu, X.; Wang, X.; Sun, M.; Song, R.; Mao, P.; Jia, S. Genome-Wide Identification of GRAS Gene Family and Their Responses to Abiotic Stress in Medicago sativa. Int. J. Mol. Sci. 2021, 22, 7729. [Google Scholar] [CrossRef] [PubMed]
  38. Liu, B.; Sun, Y.; Xue, J.; Jia, X.; Li, R. Genome-wide characterization and expression analysis of GRAS gene family in pepper (Capsicum annuum L.). PeerJ 2018, 6, e4796. [Google Scholar] [CrossRef] [PubMed]
  39. Guo, Y.; Wu, H.; Li, X.; Li, Q.; Zhao, X.; Duan, X.; An, Y.; Lv, W.; An, H. Identification and expression of GRAS family genes in maize (Zea mays L.). PLoS ONE 2017, 12, e0185418. [Google Scholar] [CrossRef] [PubMed]
  40. Li, M.; Sun, B.; Xie, F.; Gong, R.; Luo, Y.; Zhang, F.; Yan, Z.; Tang, H. Identification of the GRAS gene family in the Brassica juncea genome provides insight into its role in stem swelling in stem mustard. PeerJ 2019, 7, e6682. [Google Scholar] [CrossRef] [PubMed]
  41. Fan, S.; Zhang, D.; Gao, C.; Zhao, M.; Wu, H.; Li, Y.; Shen, Y.; Han, M. Identification, Classification, and Expression Analysis of GRAS Gene Family in Malus domestica. Front. Physiol. 2017, 8, 253. [Google Scholar] [CrossRef] [PubMed]
  42. Chen, J.; Yan, Q.; Li, J.; Feng, L.; Zhang, Y.; Xu, J.; Xia, R.; Zeng, Z.; Liu, Y. The GRAS gene family and its roles in seed development in litchi (Litchi chinensis Sonn). BMC Plant Biol. 2021, 21, 423. [Google Scholar] [CrossRef] [PubMed]
  43. Yang, T.; Li, C.; Zhang, H.; Wang, J.; Xie, X.; Wen, Y. Genome-wide identification and expression analysis of the GRAS transcription in eggplant (Solanum melongena L.). Front. Genet. 2022, 13, 932731. [Google Scholar] [CrossRef] [PubMed]
  44. Sidhu, N.S.; Pruthi, G.; Singh, S.; Bishnoi, R.; Singla, D. Genome-wide identification and analysis of GRAS transcription factors in the bottle gourd genome. Sci. Rep. 2020, 10, 14338. [Google Scholar] [CrossRef] [PubMed]
  45. Zhang, H.; Cao, Y.; Shang, C.; Li, J.; Wang, J.; Wu, Z.; Ma, L.; Qi, T.; Fu, C.; Bai, Z.; et al. Genome-wide characterization of GRAS family genes in Medicago truncatula reveals their evolutionary dynamics and functional diversification. PLoS ONE 2017, 12, e0185439. [Google Scholar] [CrossRef] [PubMed]
  46. Song, X.; Wang, J.; Li, N.; Yu, J.; Meng, F.; Wei, C.; Liu, C.; Chen, W.; Nie, F.; Zhang, Z.; et al. Deciphering the high-quality genome sequence of coriander that causes controversial feelings. Plant Biotechnol. J. 2020, 18, 1444–1456. [Google Scholar] [CrossRef] [PubMed]
  47. Iorizzo, M.; Ellison, S.; Senalik, D.; Zeng, P.; Satapoomin, P.; Huang, J.; Bowman, M.; Iovene, M.; Sanseverino, W.; Cavagnaro, P.; et al. A high-quality carrot genome assembly provides new insights into carotenoid accumulation and asterid genome evolution. Nat. Genet. 2016, 48, 657–666. [Google Scholar] [CrossRef] [PubMed]
  48. Prachayasittikul, V.; Prachayasittikul, S.; Ruchirawat, S.; Prachayasittikul, V. Coriander (Coriandrum sativum): A promising functional food toward the well-being. Food Res. Int. 2018, 105, 305–323. [Google Scholar] [CrossRef] [PubMed]
  49. Daoud, G.; Ahsan, F.; Mahmood, T.; Bano, S.; Ansari, V.A.; Zaidi, S.M.H.; Ansari, J.A. Therapeutic potential and bioactive compounds of Apium graveolens: A phytopharmacological review. Pharmacol. Res. Rep. 2025, 3, 100039. [Google Scholar] [CrossRef]
  50. Khairullah, A.R.; Solikhah, T.I.; Ansori, A.N.M.; Hidayatullah, A.R.; Hartadi, E.B.; Ramandinianto, S.C.; Fadholly, A. Review on the Pharmacological and Health Aspects of Apium graveolens or Celery: An Update. Syst. Rev. Pharm. 2021, 12, 606–612. [Google Scholar]
  51. Ikram, A.; Rasheed, A.; Ahmad Khan, A.; Khan, R.; Ahmad, M.; Bashir, R.; Hassan Mohamed, M. Exploring the health benefits and utility of carrots and carrot pomace: A systematic review. Int. J. Food Prop. 2024, 27, 180–193. [Google Scholar] [CrossRef]
  52. Yu, T.; Ma, X.; Liu, Z.; Feng, X.; Wang, Z.; Ren, J.; Cao, R.; Zhang, Y.; Nie, F.; Song, X. TVIR: A comprehensive vegetable information resource database for comparative and functional genomic studies. Hortic. Res. 2022, 9, uhac213. [Google Scholar] [CrossRef] [PubMed]
  53. Yu, T.; Ma, X.; Liu, Z.; Su, T.; Zhang, C.; Guo, L.; Meng, Z.; Guo, D.; Yao, N.; Zhang, Y.; et al. TVIR 2.0: An Enhanced Database of The Vegetables Information Resources. Hortic. Res. 2025, 12, uhaf239. [Google Scholar] [CrossRef] [PubMed]
  54. Fu, Y.; Yu, T.; Ma, X.; Liu, Z.; Li, C.; Shen, S.; Zhou, R.; Zhang, Y.; Song, X. Comprehensive genomic analysis and database construction for Apiales. J. Adv. Res. 2025, 85, 51–64. [Google Scholar] [CrossRef] [PubMed]
  55. Zhang, C.; Cao, R.; Yu, T.; He, J.; Guo, L.; Meng, Z.; Ma, X.; Guo, D.; Song, X. Fifteen years of vegetable crop genome sequencing: Achievements, challenges, and prospects. Hortic. Plant J. 2026, in press. [Google Scholar] [CrossRef]
  56. Swarbreck, D.; Wilks, C.; Lamesch, P.; Berardini, T.Z.; Garcia-Hernandez, M.; Foerster, H.; Li, D.; Meyer, T.; Muller, R.; Ploetz, L.; et al. The Arabidopsis Information Resource (TAIR): Gene structure and function annotation. Nucleic Acids Res. 2008, 36, D1009–D1014. [Google Scholar] [CrossRef] [PubMed]
  57. Liu, Z.; Zhang, C.; He, J.; Li, C.; Fu, Y.; Zhou, Y.; Cao, R.; Liu, H.; Song, X. plantGIR: A genomic database of plants. Hortic. Res. 2024, 11, uhae342. [Google Scholar] [CrossRef] [PubMed]
  58. Paysan-Lafosse, T.; Andreeva, A.; Blum, M.; Chuguransky, S.R.; Grego, T.; Pinto, B.L.; Salazar, G.A.; Bileschi, M.L.; Llinares-Lopez, F.; Meng-Papaxanthos, L.; et al. The Pfam protein families database: Embracing AI/ML. Nucleic Acids Res. 2025, 53, D523–D534. [Google Scholar] [CrossRef] [PubMed]
  59. Blum, M.; Andreeva, A.; Florentino, L.C.; Chuguransky, S.R.; Grego, T.; Hobbs, E.; Pinto, B.L.; Orr, A.; Paysan-Lafosse, T.; Ponamareva, I.; et al. InterPro: The protein sequence classification resource in 2025. Nucleic Acids Res. 2025, 53, D444–D456. [Google Scholar] [CrossRef] [PubMed]
  60. Shen, S.; Meng, Z.; Garcia, P.; Zhang, X.; Zhang, C.; Zhou, R.; Guo, D.; Zhang, Y.; Song, X. Ancestral chromosome karyotype construction and large-scale analysis of CAM biosynthesis genes in ice plant and representative plants. Veg. Res. 2025, 5, e040. [Google Scholar] [CrossRef]
  61. Letunic, I.; Doerks, T.; Bork, P. SMART 7: Recent updates to the protein domain annotation resource. Nucleic Acids Res. 2012, 40, D302–D305. [Google Scholar] [CrossRef] [PubMed]
  62. Marchler-Bauer, A.; Derbyshire, M.K.; Gonzales, N.R.; Lu, S.; Chitsaz, F.; Geer, L.Y.; Geer, R.C.; He, J.; Gwadz, M.; Hurwitz, D.I.; et al. CDD: NCBI’s conserved domain database. Nucleic Acids Res. 2015, 43, D222–D226. [Google Scholar] [CrossRef]
  63. Hu, B.; Jin, J.; Guo, A.Y.; Zhang, H.; Luo, J.; Gao, G. GSDS 2.0: An upgraded gene feature visualization server. Bioinformatics 2015, 31, 1296–1297. [Google Scholar] [CrossRef] [PubMed]
  64. Bailey, T.L.; Johnson, J.; Grant, C.E.; Noble, W.S. The MEME Suite. Nucleic Acids Res. 2015, 43, W39–W49. [Google Scholar] [CrossRef] [PubMed]
  65. Nakamura, T.; Yamada, K.D.; Tomii, K.; Katoh, K. Parallelization of MAFFT for large-scale multiple sequence alignments. Bioinformatics 2018, 34, 2490–2492. [Google Scholar] [CrossRef] [PubMed]
  66. Zhang, Y.; Quan, J.; Dong, Y.; Han, B.; Nan, Z.; Zhu, H.; Guo, D.; Chen, H.; Song, X. Genome-wide identification, molecular evolution, and expression analysis of the bHLH gene family in Mesembryanthemum crystallinum. Veg. Res. 2025, 5, e045. [Google Scholar] [CrossRef]
  67. Price, M.N.; Dehal, P.S.; Arkin, A.P. FastTree: Computing large minimum evolution trees with profiles instead of a distance matrix. Mol. Biol. Evol. 2009, 26, 1641–1650. [Google Scholar] [CrossRef]
  68. Chen, F.; Mackey, A.J.; Stoeckert, C.J., Jr.; Roos, D.S. OrthoMCL-DB: Querying a comprehensive multi-species collection of ortholog groups. Nucleic Acids Res. 2006, 34, D363–D368. [Google Scholar] [CrossRef] [PubMed]
  69. Krzywinski, M.; Schein, J.; Birol, I.; Connors, J.; Gascoyne, R.; Horsman, D.; Jones, S.J.; Marra, M.A. Circos: An information aesthetic for comparative genomics. Genome Res. 2009, 19, 1639–1645. [Google Scholar] [CrossRef] [PubMed]
  70. Chen, K.; Durand, D.; Farach-Colton, M. NOTUNG: A program for dating gene duplications and optimizing gene family trees. J. Comput. Biol. 2000, 7, 429–447. [Google Scholar] [CrossRef] [PubMed]
  71. Wang, Y.; Tang, H.; Debarry, J.D.; Tan, X.; Li, J.; Wang, X.; Lee, T.H.; Jin, H.; Marler, B.; Guo, H.; et al. MCScanX: A toolkit for detection and evolutionary analysis of gene synteny and collinearity. Nucleic Acids Res. 2012, 40, e49. [Google Scholar] [CrossRef] [PubMed]
  72. Guo, D.; Liu, Q.; Song, Y.; Cheng, Y.; Zhang, A.; Cui, Y.; Zhang, J.; Tong, W.; Sun, Y.; Tian, M.; et al. Genome-wide identification, evolution and expression analysis of the PP2C gene family in ice plant. Veg. Res. 2025, 5, e019. [Google Scholar] [CrossRef]
  73. Young, M.D.; Wakefield, M.J.; Smyth, G.K.; Oshlack, A. Gene ontology analysis for RNA-seq: Accounting for selection bias. Genome Biol. 2010, 11, R14. [Google Scholar] [CrossRef] [PubMed]
  74. Wu, T.; Hu, E.; Xu, S.; Chen, M.; Guo, P.; Dai, Z.; Feng, T.; Zhou, L.; Tang, W.; Zhan, L.; et al. clusterProfiler 4.0: A universal enrichment tool for interpreting omics data. Innovation 2021, 2, 100141. [Google Scholar] [CrossRef] [PubMed]
  75. Song, X.; Sun, P.; Yuan, J.; Gong, K.; Li, N.; Meng, F.; Zhang, Z.; Li, X.; Hu, J.; Wang, J.; et al. The celery genome sequence reveals sequential paleo-polyploidizations, karyotype evolution and resistance gene reduction in apiales. Plant Biotechnol. J. 2021, 19, 731–744. [Google Scholar] [CrossRef] [PubMed]
  76. Wu, T.; Feng, S.-Y.; Yang, Q.-H.; Bhetariya, P.J.; Gong, K.; Cui, C.-L.; Song, J.; Ping, X.-R.; Pei, Q.-Y.; Yu, T.; et al. Integration of the metabolome and transcriptome reveals the metabolites and genes related to nutritional and medicinal value in Coriandrum sativum. J. Integr. Agric. 2021, 20, 1807–1818. [Google Scholar] [CrossRef]
  77. Li, C.; Zhang, C.; Zhang, Y.; Liu, Z.; Fu, Y.; Zhang, J.; Chen, W.; Song, X. Large-scale identification and analysis of cis-RCNEs in the whole genomes of Brassicaceae. Hortic. Plant J. 2025, in press. [Google Scholar] [CrossRef]
  78. Putri, G.H.; Anders, S.; Pyl, P.T.; Pimanda, J.E.; Zanini, F. Analysing high-throughput sequencing data in Python with HTSeq 2.0. Bioinformatics 2022, 38, 2943–2945. [Google Scholar] [CrossRef] [PubMed]
  79. Love, M.I.; Huber, W.; Anders, S. Moderated estimation of fold change and dispersion for RNA-seq data with DESeq2. Genome Biol. 2014, 15, 550. [Google Scholar] [CrossRef] [PubMed]
  80. Chen, C.; Chen, H.; Zhang, Y.; Thomas, H.R.; Frank, M.H.; He, Y.; Xia, R. TBtools: An Integrative Toolkit Developed for Interactive Analyses of Big Biological Data. Mol. Plant 2020, 13, 1194–1202. [Google Scholar] [CrossRef] [PubMed]
  81. Zhang, Y.; Zhang, Y.; Li, B.; Tan, X.; Zhu, C.; Wu, T.; Feng, S.; Yang, Q.; Shen, S.; Yu, T.; et al. Polyploidy events shaped the expansion of transcription factors in Cucurbitaceae and exploitation of genes for tendril development. Hortic. Plant J. 2022, 8, 562–574. [Google Scholar] [CrossRef]
  82. Jin, J.; Tian, F.; Yang, D.C.; Meng, Y.Q.; Kong, L.; Luo, J.; Gao, G. PlantTFDB 4.0: Toward a central hub for transcription factors and regulatory interactions in plants. Nucleic Acids Res. 2017, 45, D1040–D1045. [Google Scholar] [CrossRef] [PubMed]
  83. Song, X.; Hu, J.; Wu, T.; Yang, Q.; Feng, X.; Lin, H.; Feng, S.; Cui, C.; Yu, Y.; Zhou, R.; et al. Comparative analysis of long noncoding RNAs in angiosperms and characterization of long noncoding RNAs in response to heat stress in Chinese cabbage. Hortic. Res. 2021, 8, 48. [Google Scholar] [CrossRef] [PubMed]
  84. Yu, T.; Bai, Y.; Liu, Z.; Wang, Z.; Yang, Q.; Wu, T.; Feng, S.; Zhang, Y.; Shen, S.; Li, Q.; et al. Large-scale analyses of heat shock transcription factors and database construction based on whole-genome genes in horticultural and representative plants. Hortic. Res. 2022, 9, uhac035. [Google Scholar] [CrossRef] [PubMed]
  85. Reyes-Chin-Wo, S.; Wang, Z.; Yang, X.; Kozik, A.; Arikit, S.; Song, C.; Xia, L.; Froenicke, L.; Lavelle, D.O.; Truco, M.J.; et al. Genome assembly with in vitro proximity ligation data and whole-genome triplication in lettuce. Nat. Commun. 2017, 8, 14953. [Google Scholar] [CrossRef] [PubMed]
  86. Liu, M.; Sun, W.; Li, C.; Yu, G.; Li, J.; Wang, Y.; Wang, X. A multilayered cross-species analysis of GRAS transcription factors uncovered their functional networks in plant adaptation to the environment. J. Adv. Res. 2021, 29, 191–205. [Google Scholar] [CrossRef] [PubMed]
  87. Fode, B.; Siemsen, T.; Thurow, C.; Weigel, R.; Gatz, C. The Arabidopsis GRAS protein SCL14 interacts with class II TGA transcription factors and is essential for the activation of stress-inducible promoters. Plant Cell 2008, 20, 3122–3135. [Google Scholar] [CrossRef] [PubMed]
  88. Wang, Z.; Wong, D.C.J.; Wang, Y.; Xu, G.; Ren, C.; Liu, Y.; Kuang, Y.; Fan, P.; Li, S.; Xin, H.; et al. GRAS-domain transcription factor PAT1 regulates jasmonic acid biosynthesis in grape cold stress response. Plant Physiol. 2021, 186, 1660–1678. [Google Scholar] [CrossRef] [PubMed]
  89. Yuan, Y.; Fang, L.; Karungo, S.K.; Zhang, L.; Gao, Y.; Li, S.; Xin, H. Overexpression of VaPAT1, a GRAS transcription factor from Vitis amurensis, confers abiotic stress tolerance in Arabidopsis. Plant Cell Rep. 2016, 35, 655–666. [Google Scholar] [CrossRef] [PubMed]
  90. Pei, Q.Y.; Li, N.; Yang, Q.H.; Wu, T.; Feng, S.Y.; Feng, X.H.; Jing, Z.G.; Zhou, R.; Gong, K.; Yu, T.; et al. Genome-Wide Identification and Comparative Analysis of ARF Family Genes in Three Apiaceae Species. Front. Genet. 2021, 11, 590535. [Google Scholar] [CrossRef] [PubMed]
  91. Song, X.; Wang, J.; Ma, X.; Li, Y.; Lei, T.; Wang, L.; Ge, W.; Guo, D.; Wang, Z.; Li, C.; et al. Origination, Expansion, Evolutionary Trajectory, and Expression Bias of AP2/ERF Superfamily in Brassica napus. Front. Plant Sci. 2016, 7, 1186. [Google Scholar] [CrossRef] [PubMed]
  92. Wang, J.; Tao, F.; Marowsky, N.C.; Fan, C. Evolutionary Fates and Dynamic Functionalization of Young Duplicate Genes in Arabidopsis Genomes. Plant Physiol. 2016, 172, 427–440. [Google Scholar] [CrossRef] [PubMed]
  93. Assis, R.; Bachtrog, D. Neofunctionalization of young duplicate genes in Drosophila. Proc. Natl. Acad. Sci. USA 2013, 110, 17409–17414. [Google Scholar] [CrossRef] [PubMed]
  94. Song, X.; Li, Y.; Hou, X. Genome-wide analysis of the AP2/ERF transcription factor superfamily in Chinese cabbage (Brassica rapa ssp. pekinensis). BMC Genom. 2013, 14, 573. [Google Scholar]
  95. Wang, T.; Hu, J.; Ma, X.; Li, C.; Yang, Q.; Feng, S.; Li, M.; Li, N.; Song, X. Identification, evolution and expression analyses of whole genome-wide TLP gene family in Brassica napus. BMC Genom. 2020, 21, 264. [Google Scholar] [CrossRef]
  96. Song, X.; Ma, X.; Li, C.; Hu, J.; Yang, Q.; Wang, T.; Wang, L.; Wang, J.; Guo, D.; Ge, W.; et al. Comprehensive analyses of the BES1 gene family in Brassica napus and examination of their evolutionary pattern in representative species. BMC Genom. 2018, 19, 346. [Google Scholar] [CrossRef] [PubMed]
  97. Pei, Q.; Li, N.; Bai, Y.; Wu, T.; Yang, Q.; Yu, T.; Wang, Z.; Liu, Z.; Li, Q.; Lin, H.; et al. Comparative analysis of the TCP gene family in celery, coriander and carrot (family Apiaceae). Veg. Res. 2021, 1, 5. [Google Scholar] [CrossRef]
Figure 1. Phylogenetic analysis of GRAS family genes. (a) Phylogenetic tree of GRAS family genes in 3 Apiaceae (celery, carrot, and coriander), lettuce, Arabidopsis, and grape. (b) Phylogenetic tree of GRAS family genes in celery, carrot, and coriander. The phylogenetic tree was constructed using FastTree with maximum likelihood (ML) methods. The bootstrap value was set to 1000, and values > 40% were shown on the tree.
Life 16 01113 g001
Figure 2. Distribution of GRAS family genes on each chromosome of three Apiaceae species. (a) celery. (b) coriander. (c) carrot.
Life 16 01113 g002
Figure 3. Circle plot of orthologous and paralogous GRAS family gene pairs among coriander, celery and carrot. (a) Orthologous genes. (b) Paralogous genes.
Life 16 01113 g003
Figure 4. Duplication type and gene loss or duplication analysis of GRAS family genes. (a) The percentage of duplication type for GRAS family genes and whole-genome genes in three Apiaceae species. Dca, D. carota (carrot); Csa, C. sativum (coriander); Agr, A. graveolens (celery). (b) The duplication or loss analysis of GRAS family genes in three Apiaceae species and three other representative species. The “+” and “−” indicate duplication and loss, respectively. The number after “+” and “−” represents the number of genes. Lsa, L. sativa (lettuce); Ath, A. thaliana (Arabidopsis); Vvi, V. vinifera (grape).
Life 16 01113 g004
Figure 5. Expression heatmap and co-expression network of GRAS family genes in root, petiole, and leaf of celery and coriander. (a) Hierarchical gene expression clustering of GRAS family genes in celery. Expression values were normalized as RPKM and transformed by log2. (b) Hierarchical gene expression clustering of GRAS family genes in coriander. (c) The co-expression network of GRAS family genes in celery. The red and blue lines represent positive (PCC > 0.99) and negative (PCC < −0.99) regulation, respectively. The nodes of different colors represent each duplication type of GRAS family genes. (d) The co-expression network of GRAS family genes in coriander.
Life 16 01113 g005
Figure 6. The co-expression network and statistics of GRAS family genes in celery and coriander. (a) The co-expression network of GRAS family genes and other transcription factor families in celery. The red and blue lines represent positive (PCC > 0.99) and negative (PCC < −0.99) regulation, respectively. The nodes of green and orange colors represent GRAS family genes and other TFs, respectively. (b) The co-expression network of GRAS family genes and other transcription factor families in coriander. (c) The edge number of each GRAS family gene in the network constructed using GRAS family genes and other transcription factor families in celery. (d) The edge number of the top 10 transcription factor families in the network constructed using GRAS family genes and other transcription factor families in celery. (e) The edge number of each GRAS family gene in the network constructed using GRAS family genes and other transcription factor families in coriander. (f) The edge number of the top 10 transcription factor families in the network constructed using GRAS family genes and other transcription factor families in coriander.
Life 16 01113 g006
Figure 7. The statistics of GRAS family gene numbers at a large scale. (a) The boxplot of GRAS family gene number of eudicots, monocots, magnolias, Basal angiosperms, gymnosperms, ferns, mosses, and algae. The first number in parentheses represents the number of species in the classification. The second and third represent the minimum and maximum GRAS genes contained in the species. (b) The statistics of GRAS family gene number of different taxonomies of Algae. (c) The statistics of GRAS family gene number of different taxonomies of Charophyta. The number in parentheses represents the number of GRAS genes in the related species.
Life 16 01113 g007
Figure 8. Phylogenetic tree of GRAS family genes in 7 selected typical species that can represent evolutionary branches and 3 Charophyta species. The phylogenetic tree was constructed using FastTree with ML methods. The bootstrap value was set to 1000, and values > 40% were shown on the tree.
Life 16 01113 g008
Table 1. The identification of duplicated types for GRAS family genes and all genes in A. graveolens (celery), C. sativum (coriander), and D. carota (carrot).
SpeciesSingletonDispersedProximalTandemWGD or SegmentalTotal
AllGRASAllGRASAllGRASAllGRASAllGRASPercentageAllGRAS
Celery3028015,258321167224261877871724.6%29,66669
Coriander3577014,96326216163032910,2003546.1%33,93376
Carrot3543013,378261428335011089743547.3%30,82474
Disclaimer/Publisher’s Note: The statements, opinions and data contained in all publications are solely those of the individual author(s) and contributor(s) and not of MDPI and/or the editor(s). MDPI and/or the editor(s) disclaim responsibility for any injury to people or property resulting from any ideas, methods, instructions or products referred to in the content.