Article

Explaining Productivity Differences Among Tree Species via Biotic and Abiotic Factors

1
College of Materials and Energy Engineering, Lishui University, Lishui 323000, China
2
College of Agriculture and Biotechnology, Lishui University, Lishui 323000, China
3
Zhejiang Lishui Songyang County Environmental Monitoring Station, Lishui 323400, China
*
Author to whom correspondence should be addressed.
Life 2026, 16(2), 277; https://doi.org/10.3390/life16020277
Submission received: 12 January 2026 / Revised: 27 January 2026 / Accepted: 3 February 2026 / Published: 5 February 2026
(This article belongs to the Section Biodiversity, Ecology and Evolution)

Abstract

Greenhouse gases emitted by humans have exacerbated global climate change. Forests can effectively sequester atmospheric carbon dioxide through photosynthesis, and afforestation has been widely adopted worldwide to mitigate climate change. Cunninghamia lanceolata and Pinus massoniana, as major afforestation tree species, are extensively cultivated in southern China. However, the mechanisms by which climate, topography, biodiversity, forest structure, and forest growth status affect the productivity of these two species remain unclear. This study used forest inventory data from Lishui City combining the Biomod2 model with a structural equation model (SEM) to investigate the differential effects of biotic and abiotic factors on the productivity of the two tree species. The results showed that at the same diameter at breast height (DBH), the biomass of P. massoniana reached 384.67 kg, accounting for 188.75% of that of C. lanceolata (211.07 kg). The dominant climatic factors affecting C. lanceolata and P. massoniana were different; the most important climatic factors affecting C. lanceolata were Bio 17, Bio 15, Bio 05, Bio 08, and Bio 02, while those affecting P. massoniana were Bio 18, Bio 04, and Bio 01. Furthermore, the explanatory power of the structural equation model (SEM) optimized by the Biomod2 model was effectively improved. Biodiversity and forest growth factors were the most important biotic factors affecting C. lanceolata (p < 0.01), while structural diversity and forest growth factors were the most important biotic factors affecting P. massoniana (p < 0.05). Biodiversity and structural diversity exerted divergent effects on C. lanceolata and P. massoniana in different growth stages, exerting negative effects in the early growth stage and positive effects in the late growth stage. These outcomes were jointly driven by the selection effect and niche complementarity. This study recommends the forest management practices should select tree species based on local conditions.

1. Introduction

Combustion of fossil fuels has led to an increase in the atmospheric concentrations of various greenhouse gases including CO2, exacerbating global climate change and posing new challenges to forest ecosystems [1,2,3]. Forests can effectively sequester atmospheric CO2 through photosynthesis. As the main component of terrestrial carbon sequestration, they are crucial for regulating atmospheric carbon concentrations [4]. Expanding forest areas will effectively reduce atmospheric greenhouse gas levels and mitigate the impacts of climate change [5]. Currently, countries worldwide are adopting afforestation measures to address climate change. The global area of planted forests increased by more than 1.05 × 10⁸ ha from 1990 to 2015, reaching a total area of 2.91 × 10⁸ ha [6]. It is projected that China’s forest coverage rate will rise to 26% by 2050 [7]. From the perspective of forest management, the approaches to effectively enhance forest productivity remain unclear. Biotic and abiotic factors may give rise to low-efficiency forests, resulting in the waste of resources [8,9,10]. Therefore, assessing the relationship between environmental conditions and biomass is of great significance for forest management and the efficient utilization of resources.
The relationship between forest diversity and forest productivity is mainly driven by abiotic and biotic factors, among which the abiotic include climate and topography [11,12,13]. Forest productivity at different scales exhibits divergent responses to environmental conditions, climate acts as the dominant environmental factor in large-scale forests [14], and topography exerts more pronounced effects in small-scale forests [12,15]. Biotic factors encompass biodiversity, structural diversity, and forest growth factors [3,16,17]. The linkages among these factors are primarily mediated by two mechanisms, namely niche complementarity and the selection effect [18,19]. Niche complementarity refers to the phenomenon where differences in species niches enable more efficient resource utilization, thereby further enhancing resource use efficiency and forest productivity [20]. The selection effect describes the scenario in which dominance by species with high productivity or key ecological functions exerts positive impacts on the productivity of forest ecosystems [21]. The combined effects of these factors regulate the productivity of trees in forest ecosystems. However, the underlying mechanisms governing this phenomenon remain unclear, thus warranting further investigation.
Cunninghamia lanceolata and Pinus massoniana are the most common coniferous tree species in southern China. They have been widely adopted as ideal afforestation species, owing to their rapid growth rate, strong adaptability, and considerable economic and ecological benefits [22]. At present, the plantation areas of C. lanceolata and P. massoniana in southern China have reached as large as 9.90 × 10⁶ ha and 2.51 × 10⁶ ha, respectively. Large-scale afforestation projects, however, may give rise to a series of ecological problems, including simplified forest composition, water resource scarcity, and intensified conflicts between farmland and forest land in some regions [7,23]. Notably, the inherent biological traits of plants result in distinct ecological requirements across different growth stages, such as those associated with root systems [15,24] and altitudinal gradients [25,26]. These ecological requirements, in conjunction with environmental conditions and forest diversity, jointly regulate tree productivity [26]. Understanding the mechanisms underlying these combined effects is crucial for enhancing forest productivity. Therefore, it is imperative to further elucidate these interactive mechanisms.
This study focuses on the impacts of climate, topography, biodiversity, structural diversity, and forest growth factors on the productivity of C. lanceolata and P. massoniana, while exploring in depth their actual effects and the underlying response mechanisms. Two hypotheses are proposed in this study: (1) Topography and climate exert differential impacts on the growth of C. lanceolata and P. massoniana. (2) The ecological mechanisms governing the biomass of C. lanceolata and P. massoniana are distinct. By centering on the effects of biotic and abiotic factors on conifer productivity, this study aims to provide scientific guidance for the efficient and sustainable utilization of forest resources.

2. Materials and Methods

2.1. Study Area and Field Work

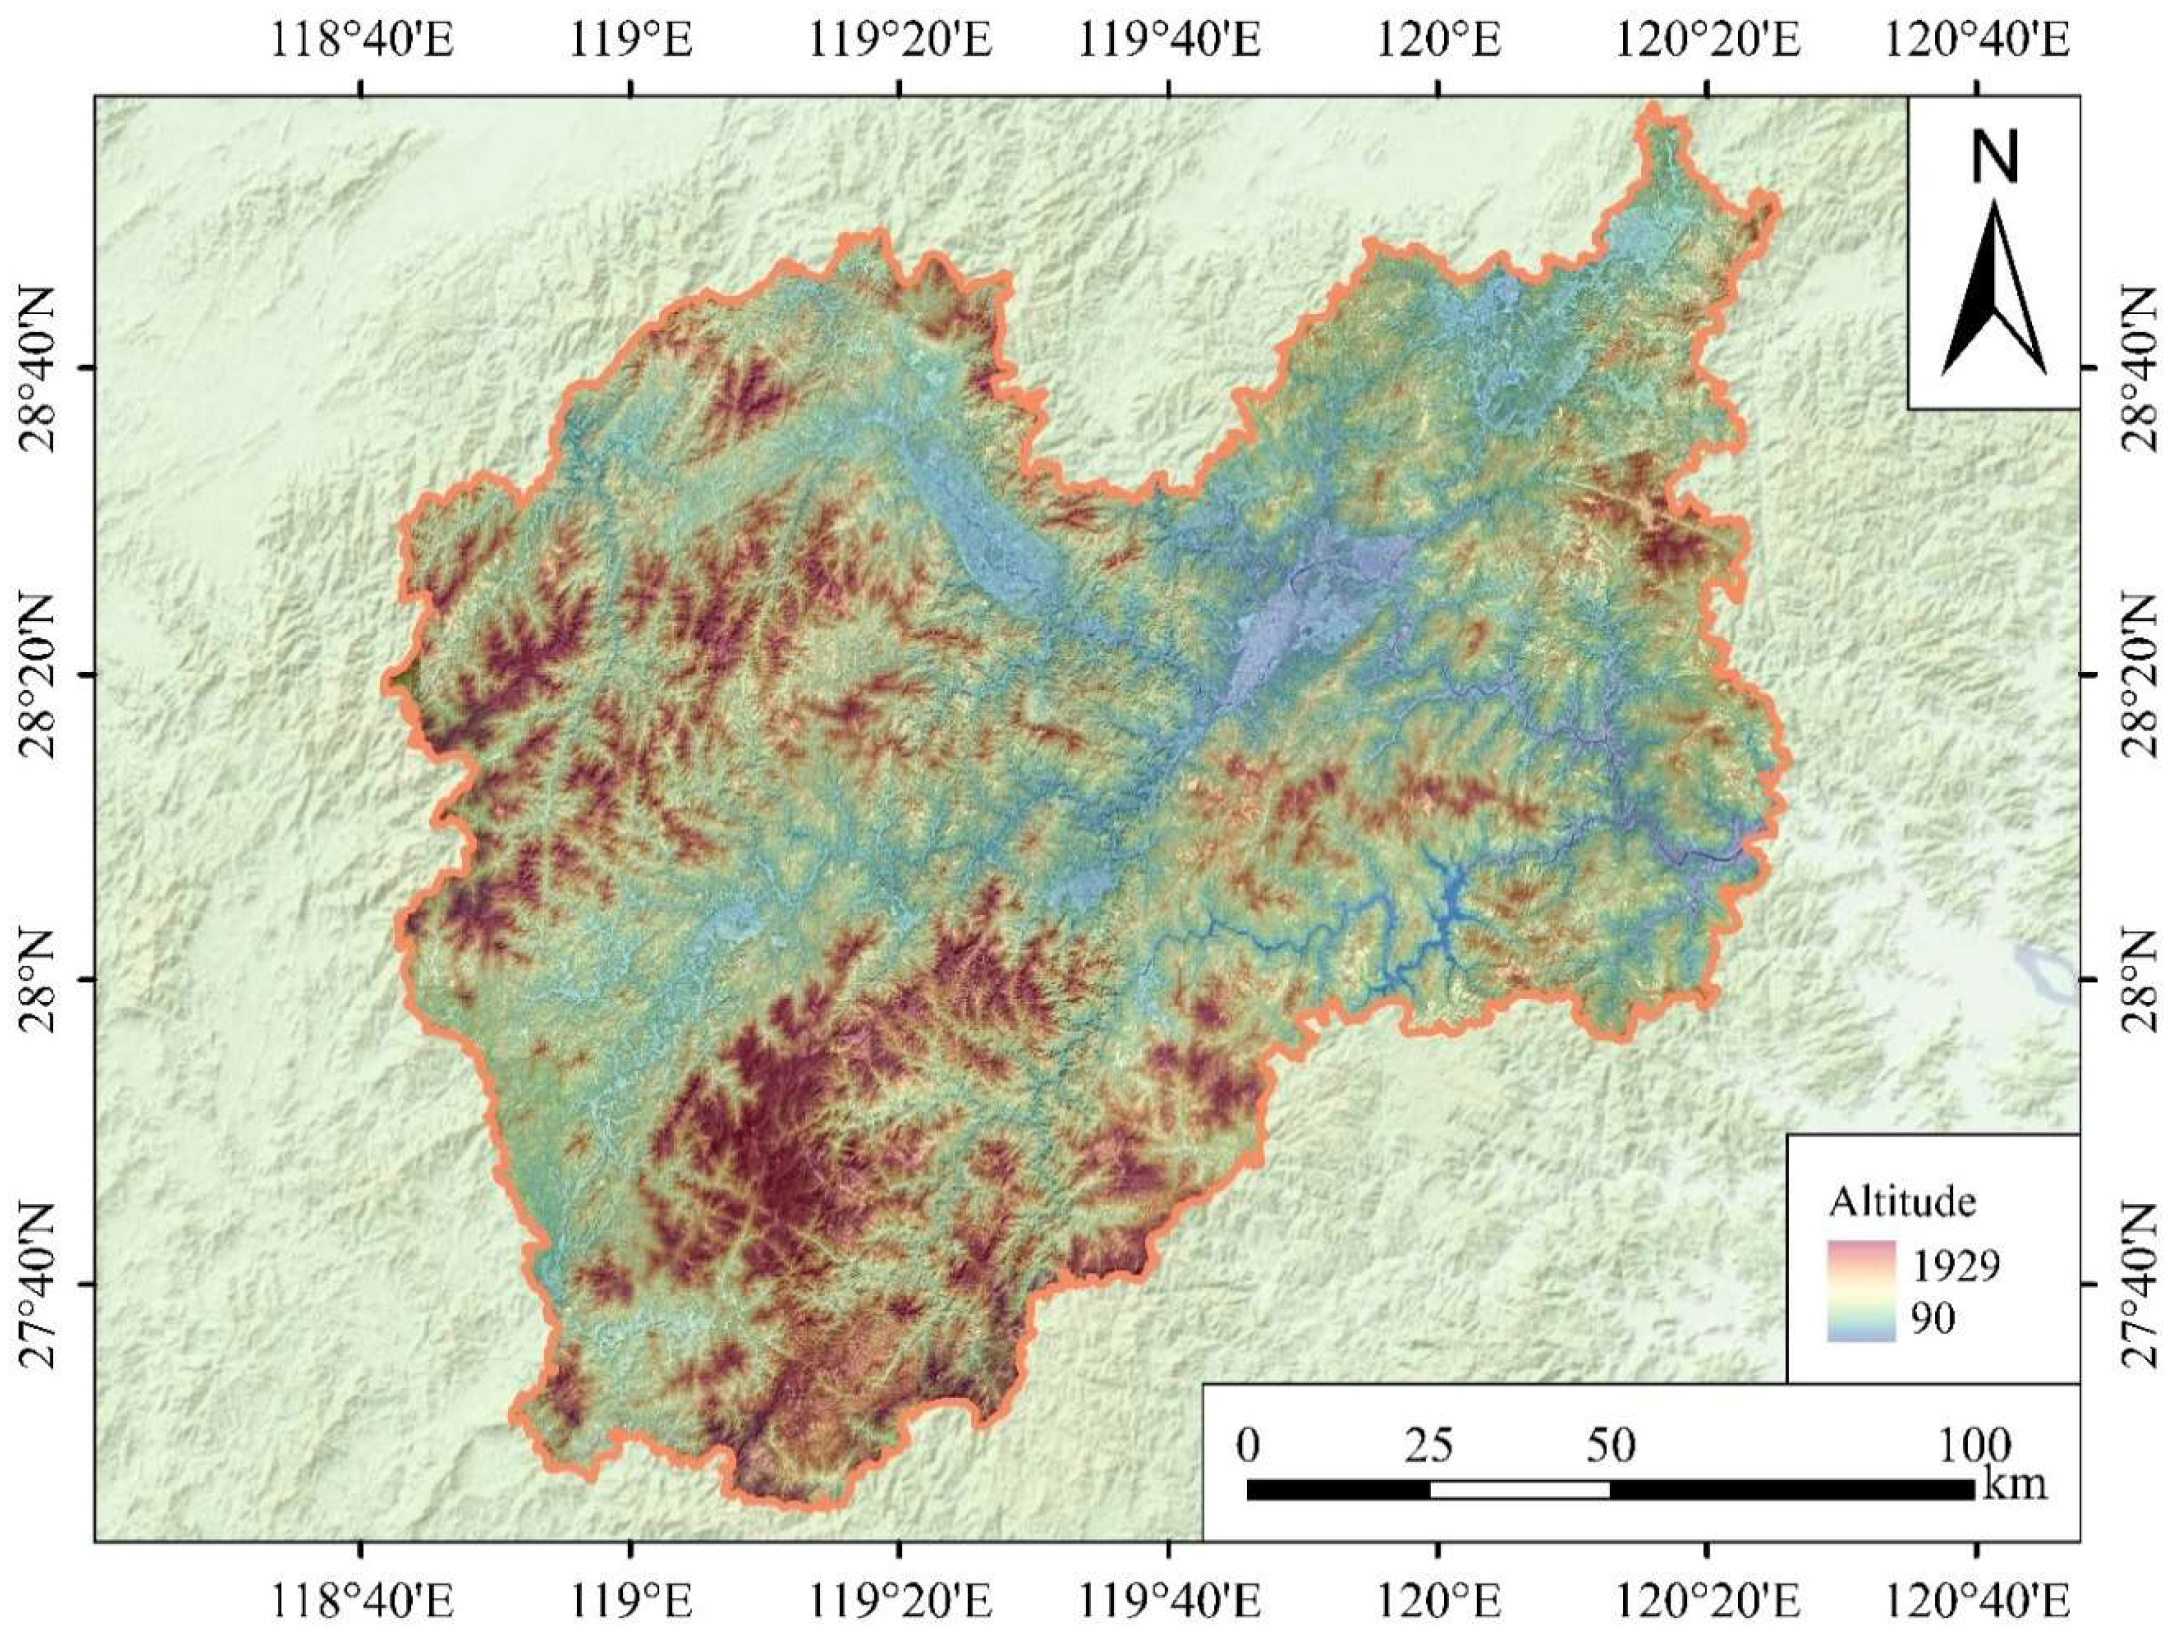
Lishui City, Zhejiang Province, is located in the southwestern part of Zhejiang Province, with geographic coordinates ranging from 27°25′ to 28°57′ N latitude and from 118°41′ to 120°26′ E longitude. The landform of this region is dominated by mountainous areas featuring high mountains and steep slopes, and the terrain slopes downward from the southwest to the northeast. The highest peak in Zhejiang Province is situated in Lishui City, with a maximum altitude of 1929 m (Figure 1). The total area of Lishui City is 1.73 × 10⁴ km. It falls within the mid-subtropical monsoon climate zone, characterized by a warm and humid climate, abundant precipitation, and typical mountain climate features. Such topographic and climatic conditions endow Lishui with abundant biodiversity resources.
The data used in this study were derived from the forest resource survey conducted in Lishui City from August to October 2024, in which the surveyed forest types included coniferous forests, broad-leaved forests, and mixed coniferous–broad-leaved forests. To investigate the current status of biomass accumulation of C. lanceolata and P. massoniana under different natural environments, this study selected forest plots containing these two species, including 85 plots of C. lanceolata and 54 plots of P. massoniana. All of these plots were distributed across different natural habitats (Table 1). Each forest plot had a size of 20 m × 20 m. In each plot, we recorded the following indicators of woody plants with a diameter at breast height (DBH) ≥ 5 cm: species, DBH (cm), tree height (TH, m), and crown length (CW, m).

2.2. Biomass and Diversity Indices

The allometric equation method was adopted in this study to separately calculate the stem biomass, root biomass, crown biomass, and total biomass of C. lanceolata and P. massoniana (kg, Table S1) [27]. In order to facilitate the statistical analysis of data, the DBH of standing trees was classified into multiple diameter classes at intervals of 5 cm for segmented analysis [28,29]. The natural-break classification method (Jenks) was used to identify the DBH corresponding to the critical points of biomass variation in C. lanceolata and P. massoniana [30].
The Shannon–Wiener index (H) was employed to quantify the species diversity across different plots [3]. The coefficient of variation in tree height (CVTH, %) within each plot was selected to represent the structural diversity [3,31]. The basal area (BA) of trees in each plot was used to indicate the forest growth index [16,32].
H = P i ln P i
B A = π D B H 2 2 / 400
where Pi indicates the proportion of individuals of a given species relative to the total number of individuals in the community.

2.3. Climate Variable Screening and Topographic Factors

Climate is an important factor affecting plant growth. In this study, climatic variables were derived from WorldClim (http://www.worldclim.org), which includes 19 climatic variables (Table S2). This study employed the Biomod2 species distribution model to screen climatic variables and construct the potential distribution areas of C. lanceolata and P. massoniana in Lishui City. The detailed methods for model construction are provided in the Supplementary Material. To avoid high multicollinearity in the model, pre-modeling processing was first performed for C. lanceolata and P. massoniana to obtain the initial contribution of each factor. Pearson correlation analysis of climatic factors was conducted using R software (Figure S1). Based on the results of the initial model contribution and Pearson correlation analysis, factors with a correlation coefficient |r| ≥ 0.7 were excluded to reduce model multicollinearity [33]. The screened climatic factors were used to construct the final Biomod2 model, and the most important climatic factors output by the final ensemble model were selected for subsequent analyses.
Topographic data were recorded using RTK (Real-Time Kinematic, South Surveying and Mapping, Guangzhou, China) instruments in the sample plots, including altitude, slope gradient, and slope aspect (Table 1).

2.4. Statistical Analysis and Structural Equation Model

Linear regression and least-significant-difference (LSD) tests were used to assess the statistical significance of environmental effects on biomass (p < 0.05). Principal component analysis (PCA) was employed for dimensionality reduction in environmental factors, and the dimensionality-reduced data were used for subsequent analyses. In this study, the “bestnormsize” package was utilized to improve the normality of the data, and Z-score transformation was performed on all variables to facilitate the interpretation of parameter estimates on a comparable scale.
Based on the variable relationships among environmental factors (climate and topography), species diversity (H), stand structural diversity (CVTH), the forest growth index (BA), and species biomass [34], the “piecewiseSEM” package was used to construct separate structural equation models (SEMs) for the two species. The fit criteria for the SEMs were defined as follows: p > 0.05, a goodness-of-fit index (GFI) > 0.9, a comparative fit index (CFI) > 0.95, and a standardized root mean square residual (SRMR) < 0.08. When these criteria were satisfied, the model was considered to have good statistical validity [3]. All plotting and statistical analyses were conducted using R (v 4.3.1).

3. Results

3.1. Forest Biomass

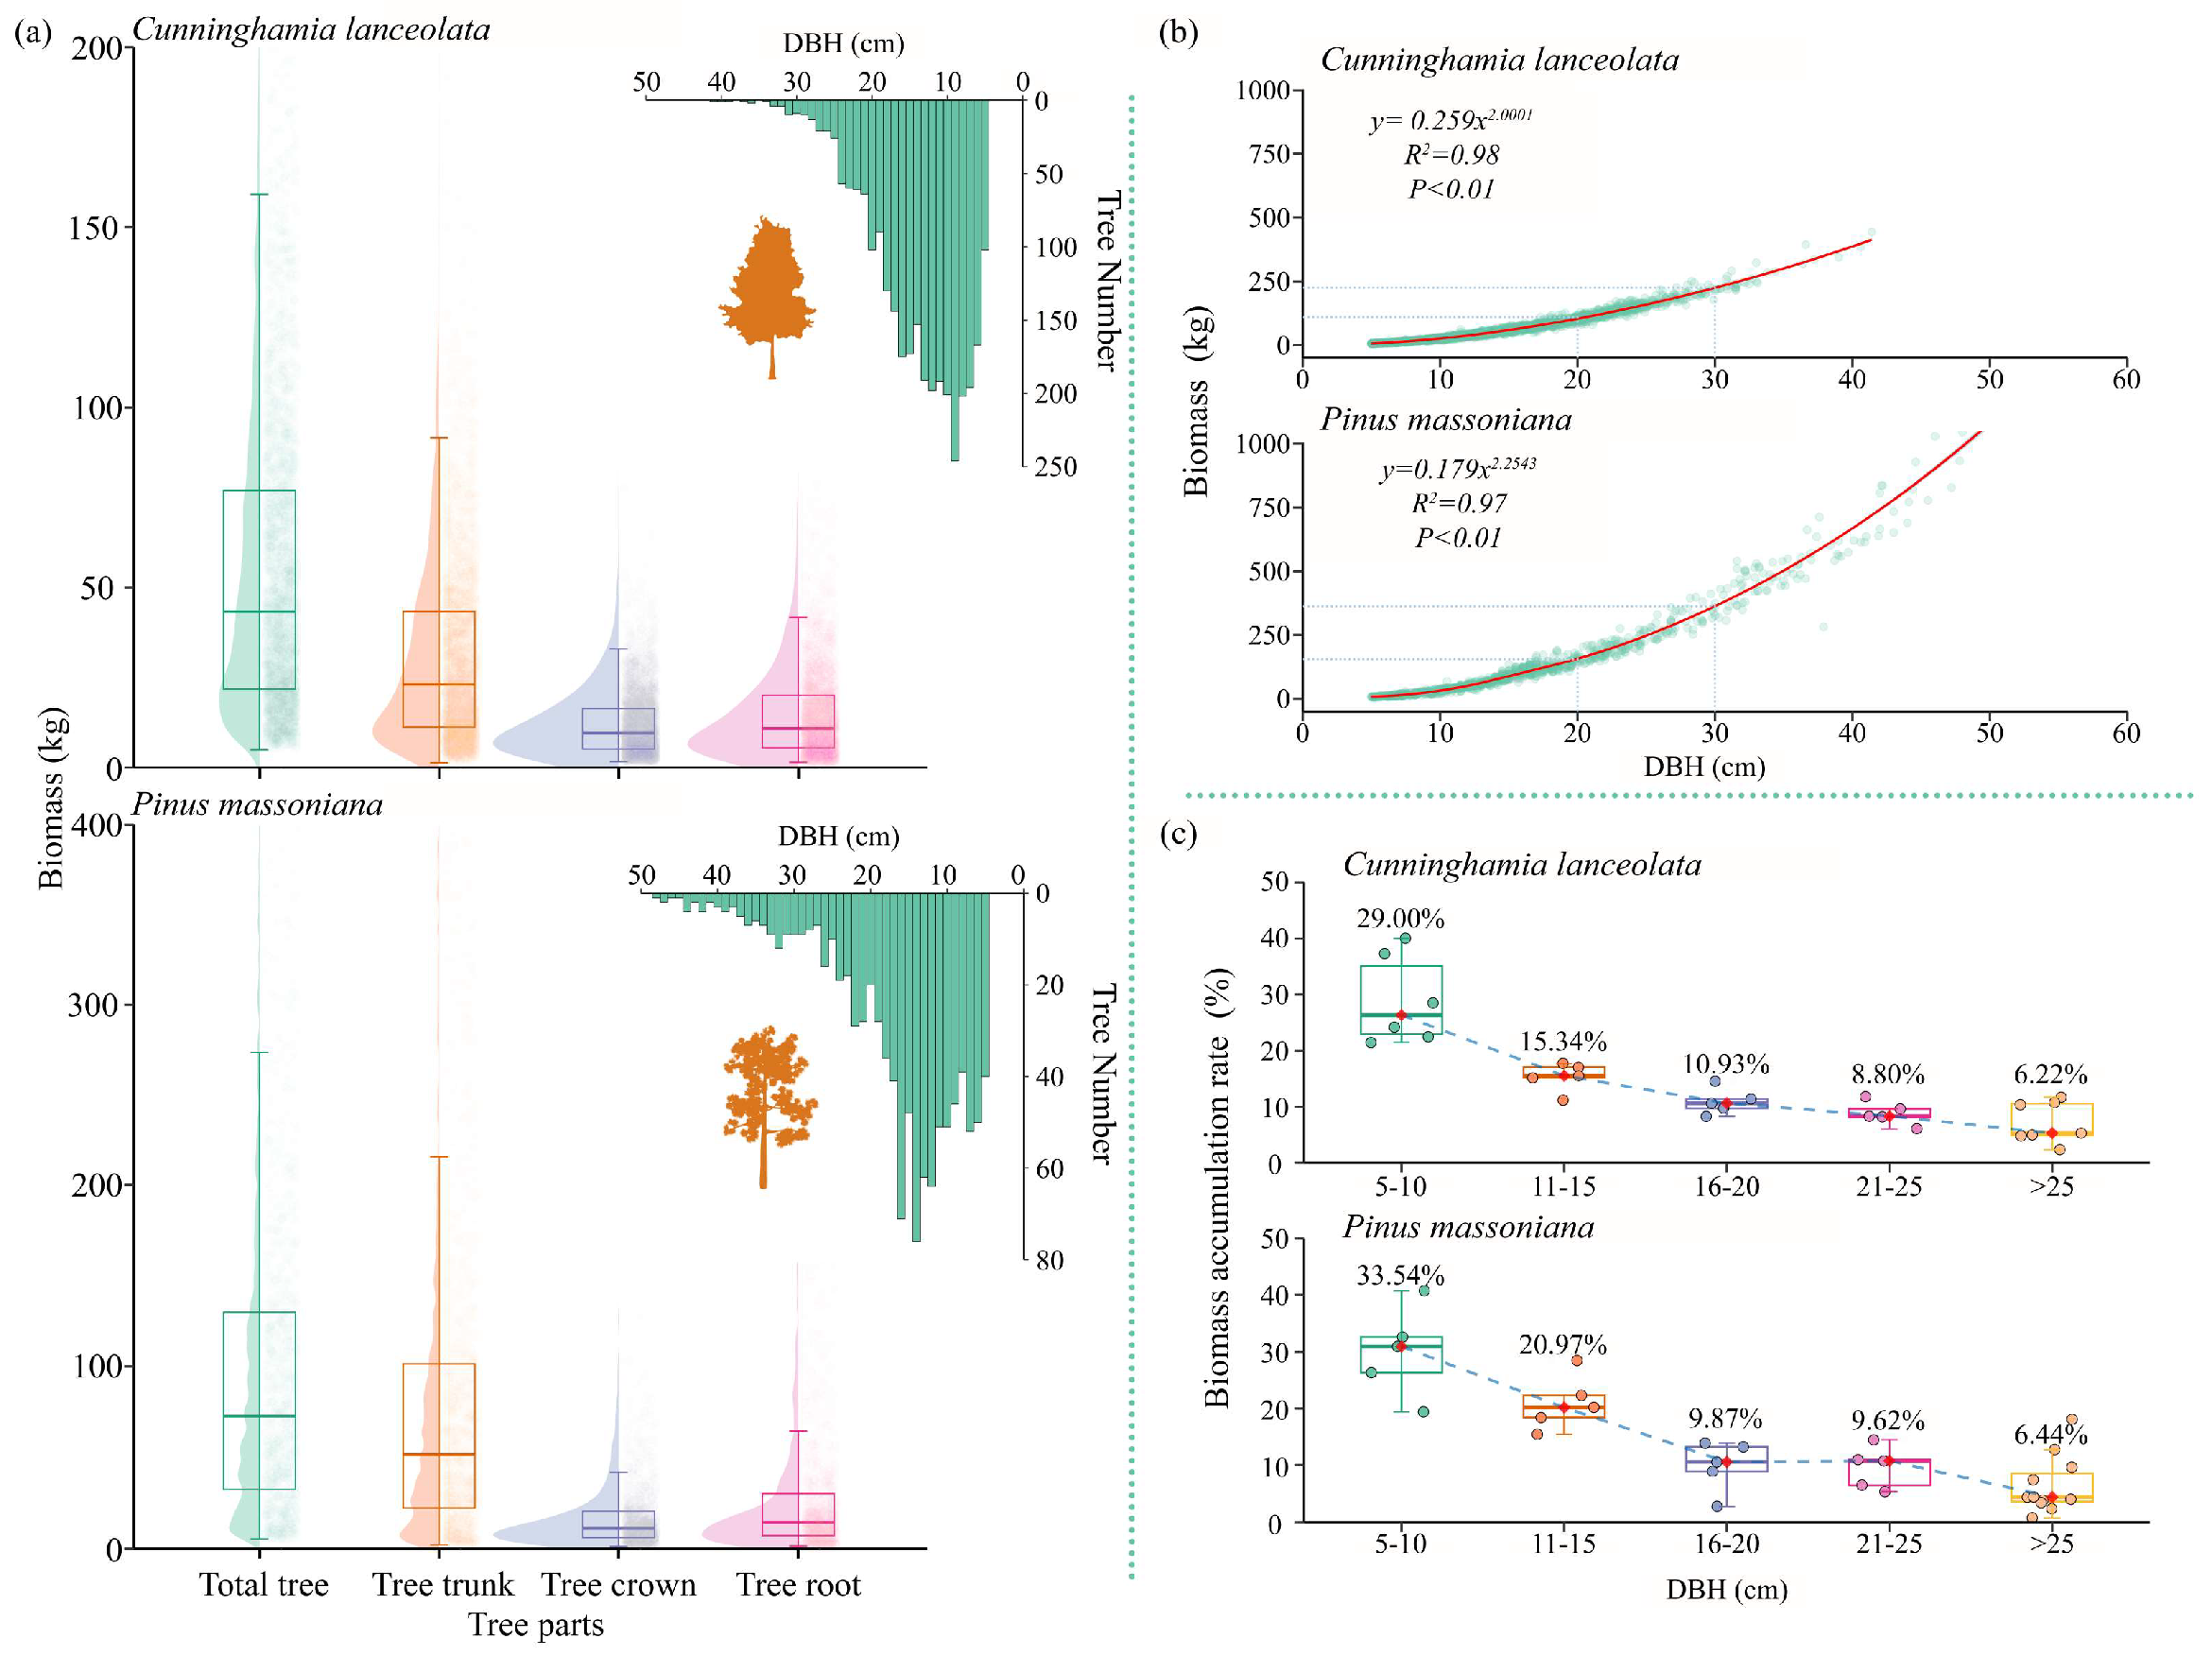
The results of this study showed that there were significant differences in biomass and the accumulation rate between the two coniferous species. The total biomass of P. massoniana was higher than that of C. lanceolata (Table 2, Figure 2b). The biomass of P. massoniana with a DBH of 25–30 cm was 384.67 kg, which was 188.75% of the biomass of C. lanceolata with the same DBH (211.07 kg). The DBH distributions of both P. massoniana and C. lanceolata followed a J distribution (Figure 2a). P. massoniana had a higher total biomass accumulation, with an average of 231.79% that of C. lanceolata. Additionally, P. massoniana exhibited a higher biomass accumulation rate (Figure 2c). Specifically, when DBH ranged from 11 to 15 cm, the biomass accumulation rate of P. massoniana was 5.36% higher than that of C. lanceolata, leading to its higher overall biomass—this result is consistent with that in Figure 2a. For both tree species, the coefficient of variation in biomass was larger at a small DBH and gradually decreased with tree growth, indicating a trend toward more stable growth. Jenks results showed that the critical DBH values corresponding to biomass variation in C. lanceolata and P. massoniana were 11 cm and 10 cm, respectively (Figure S2). This study hypothesizes that there may be a certain threshold effect during the growth of the two tree species, and their response factors to the environment are variable; subsequent studies will be conducted based on this hypothesis.

3.2. Environmental Factors and Forest Diversity

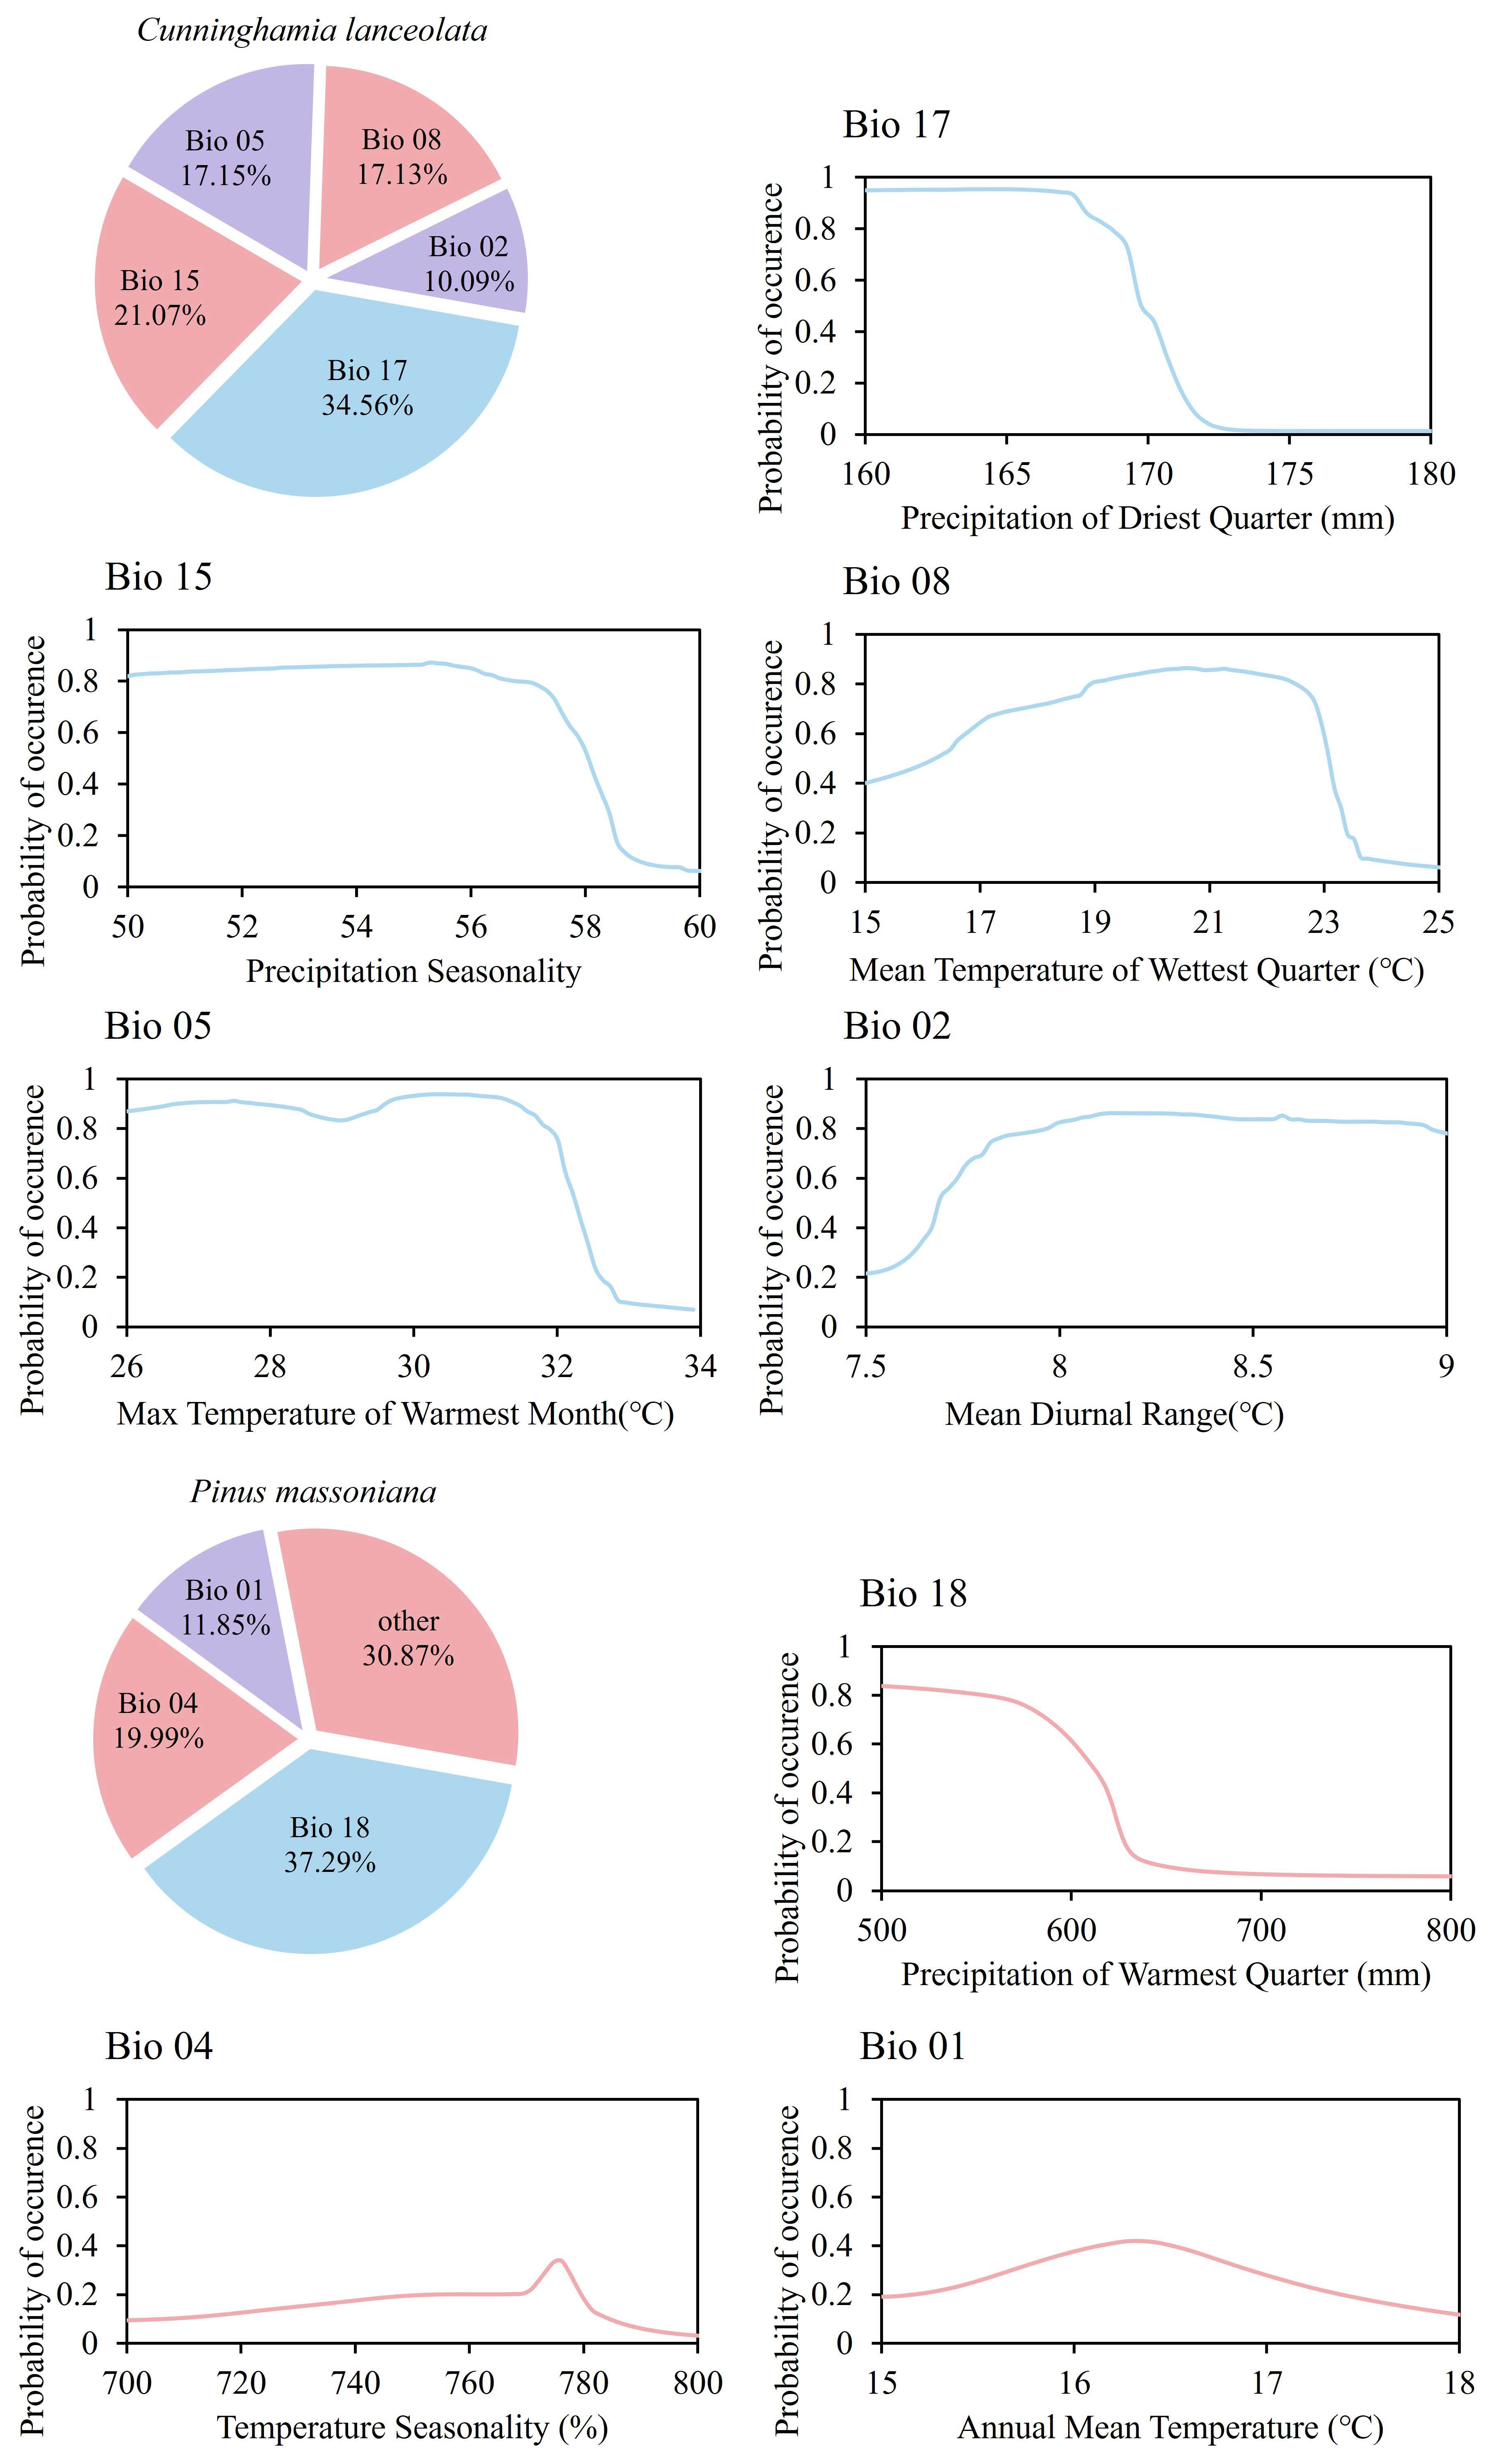
The Biomod2 ensemble model exhibited good fitting performance, with the area under the curve (AUC) and the true skill statistics (TSS) higher than those of single models; therefore, the ensemble model was reliable (Table S3). Model results indicated that the primary factors influencing the distribution of C. lanceolata were Bio 17 (34.56%), Bio 15 (21.07%), Bio 05 (17.15%), Bio 08 (17.13%), and Bio 02 (10.09%). For P. massoniana, the dominant distribution-influencing factors were Bio 18 (37.29%), Bio 04 (19.99%), and Bio 01 (11.85%), while the contribution rates of the remaining factors were all below 10%. Therefore, this study selected these climatic factors as predictor variables for subsequent analyses (Figure 3).
The Biomod2 ensemble model results showed that the suitable areas of C. lanceolata and P. massoniana were 9809.90 km2 and 7514.12 km2, respectively (Figure S4). C. lanceolata had a larger suitable area, with the difference mainly distributed in the southwestern part of Lishui City.
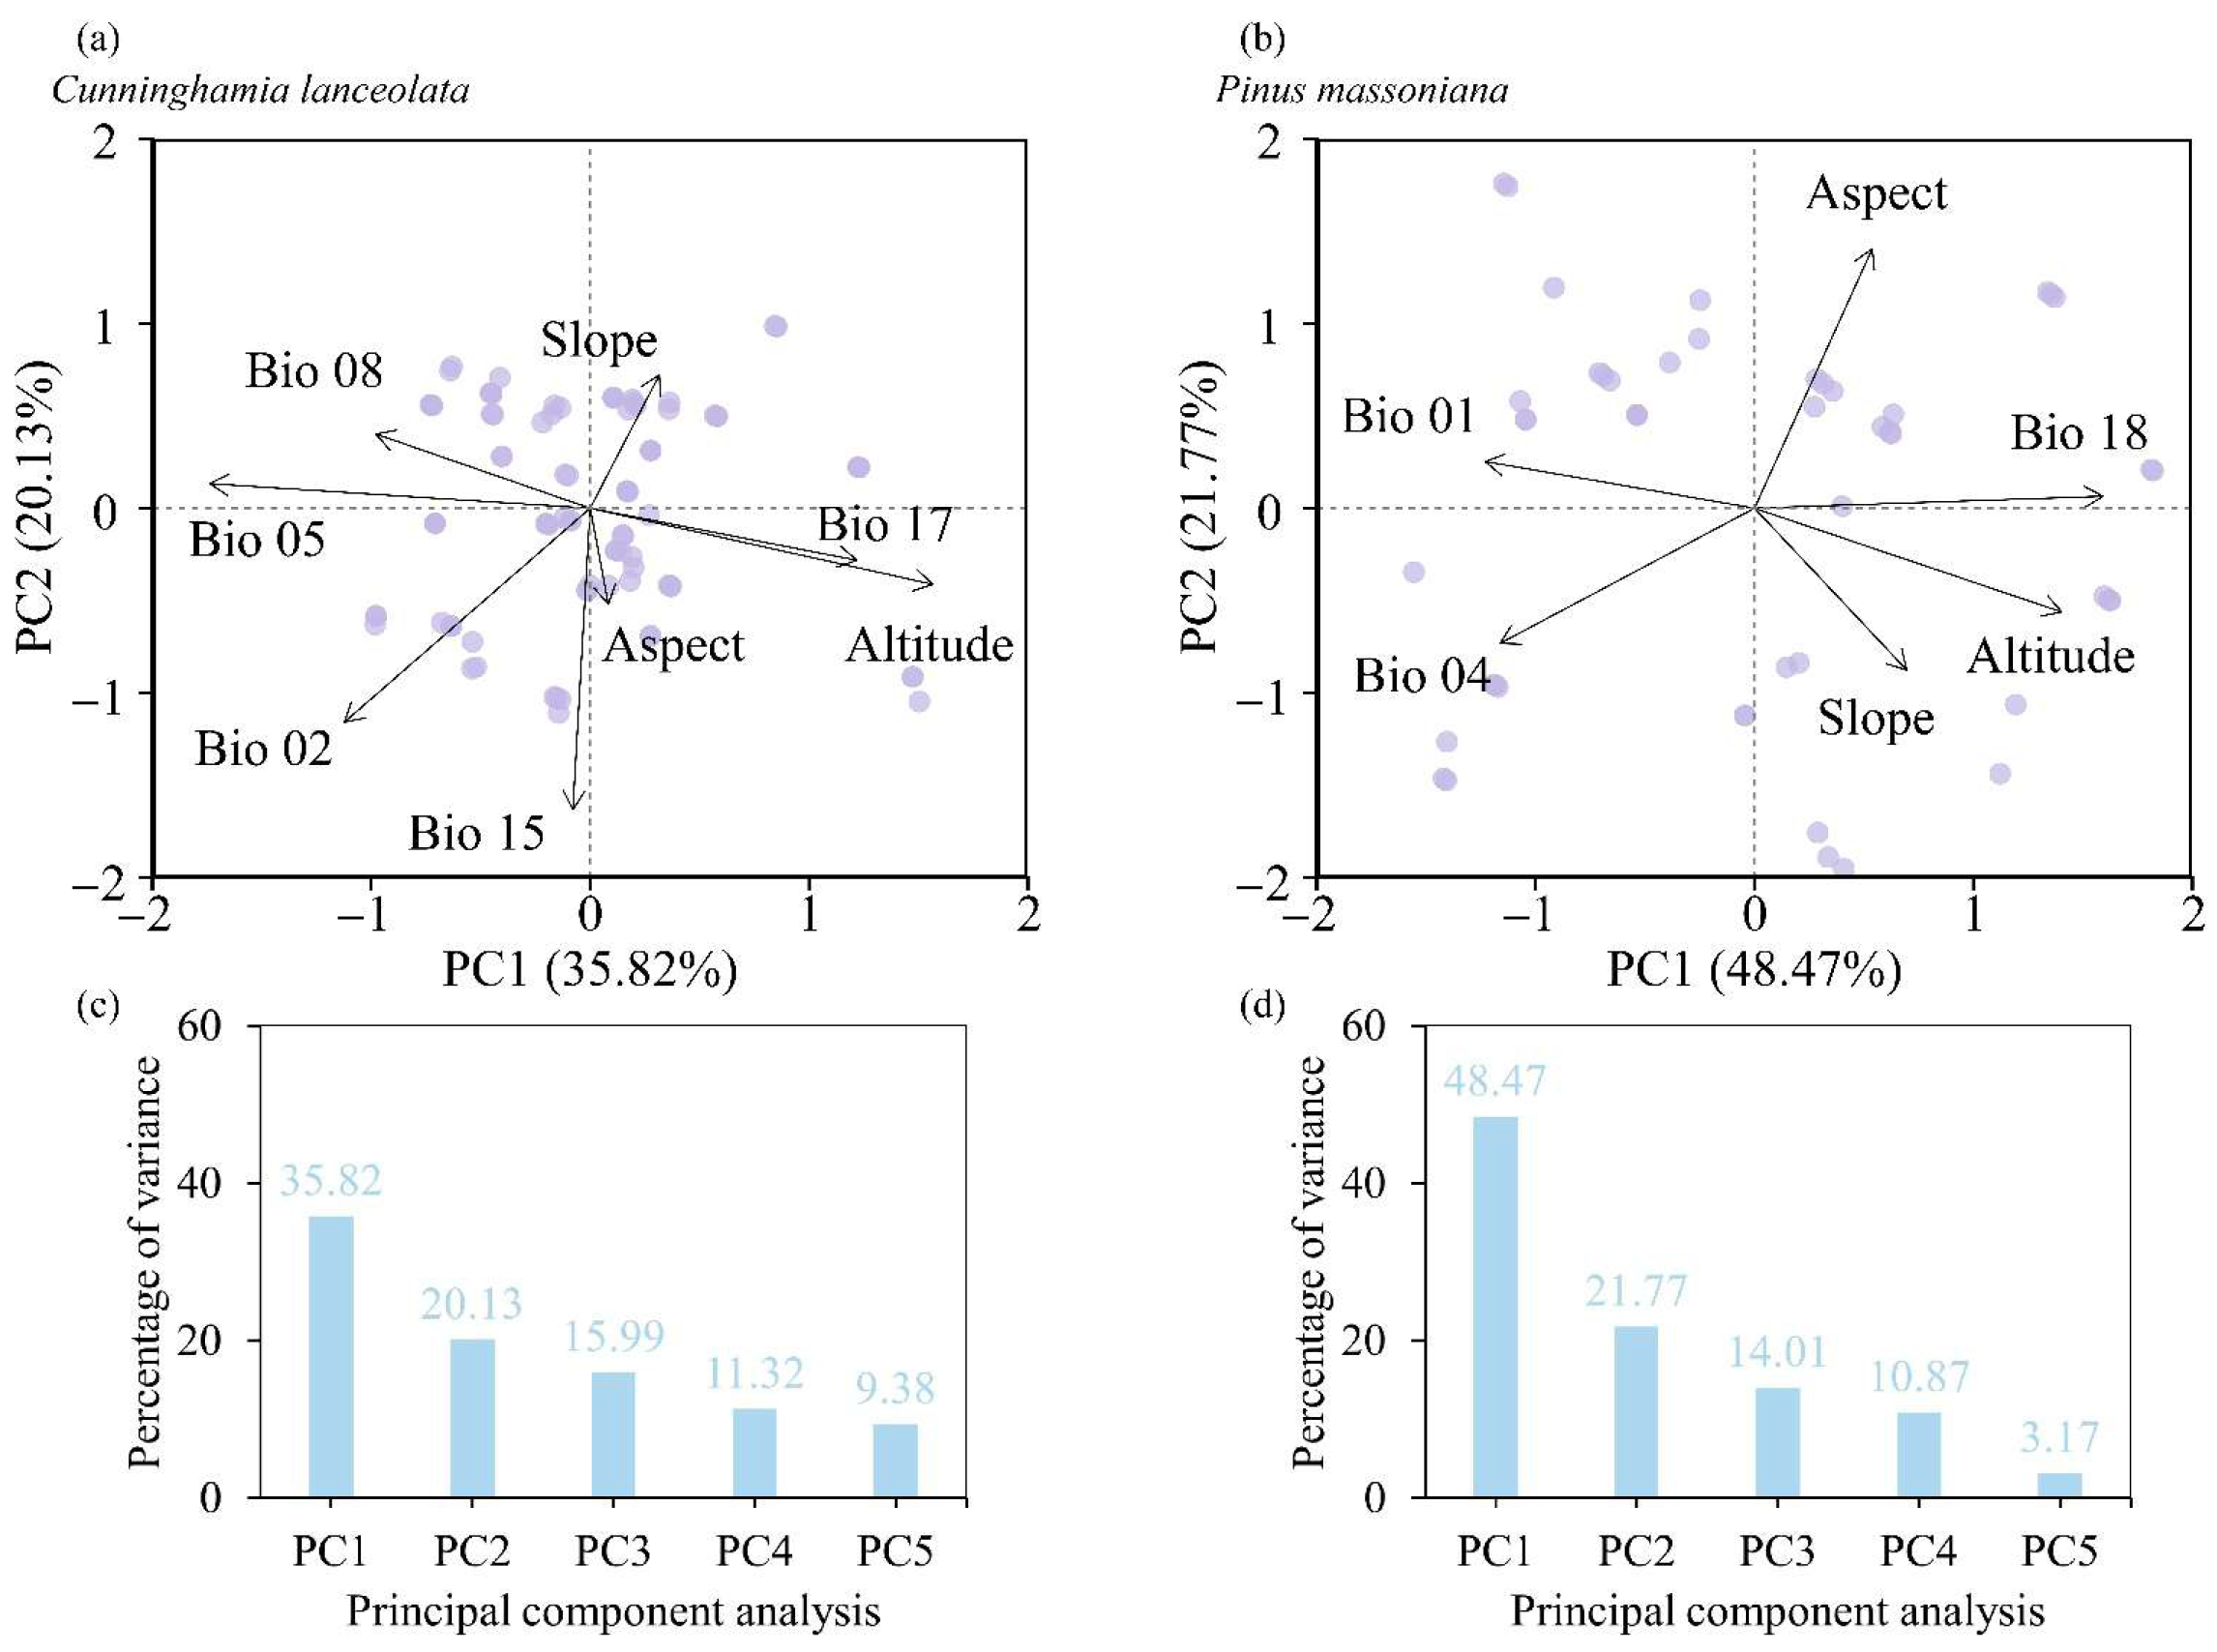
Principal component analysis (PCA) was performed to analyze environmental factors (Figure 4a). The results indicated that the cumulative explanatory power of the two axes for C. lanceolata and P. massoniana was 55.95% and 70.25%, respectively (Figure 4b). The first axis (environmental PC1, Env PC1) and the second axis (environmental PC2, Env PC2) of the PCA were used as predictor variables for subsequent analyses (Table 3).
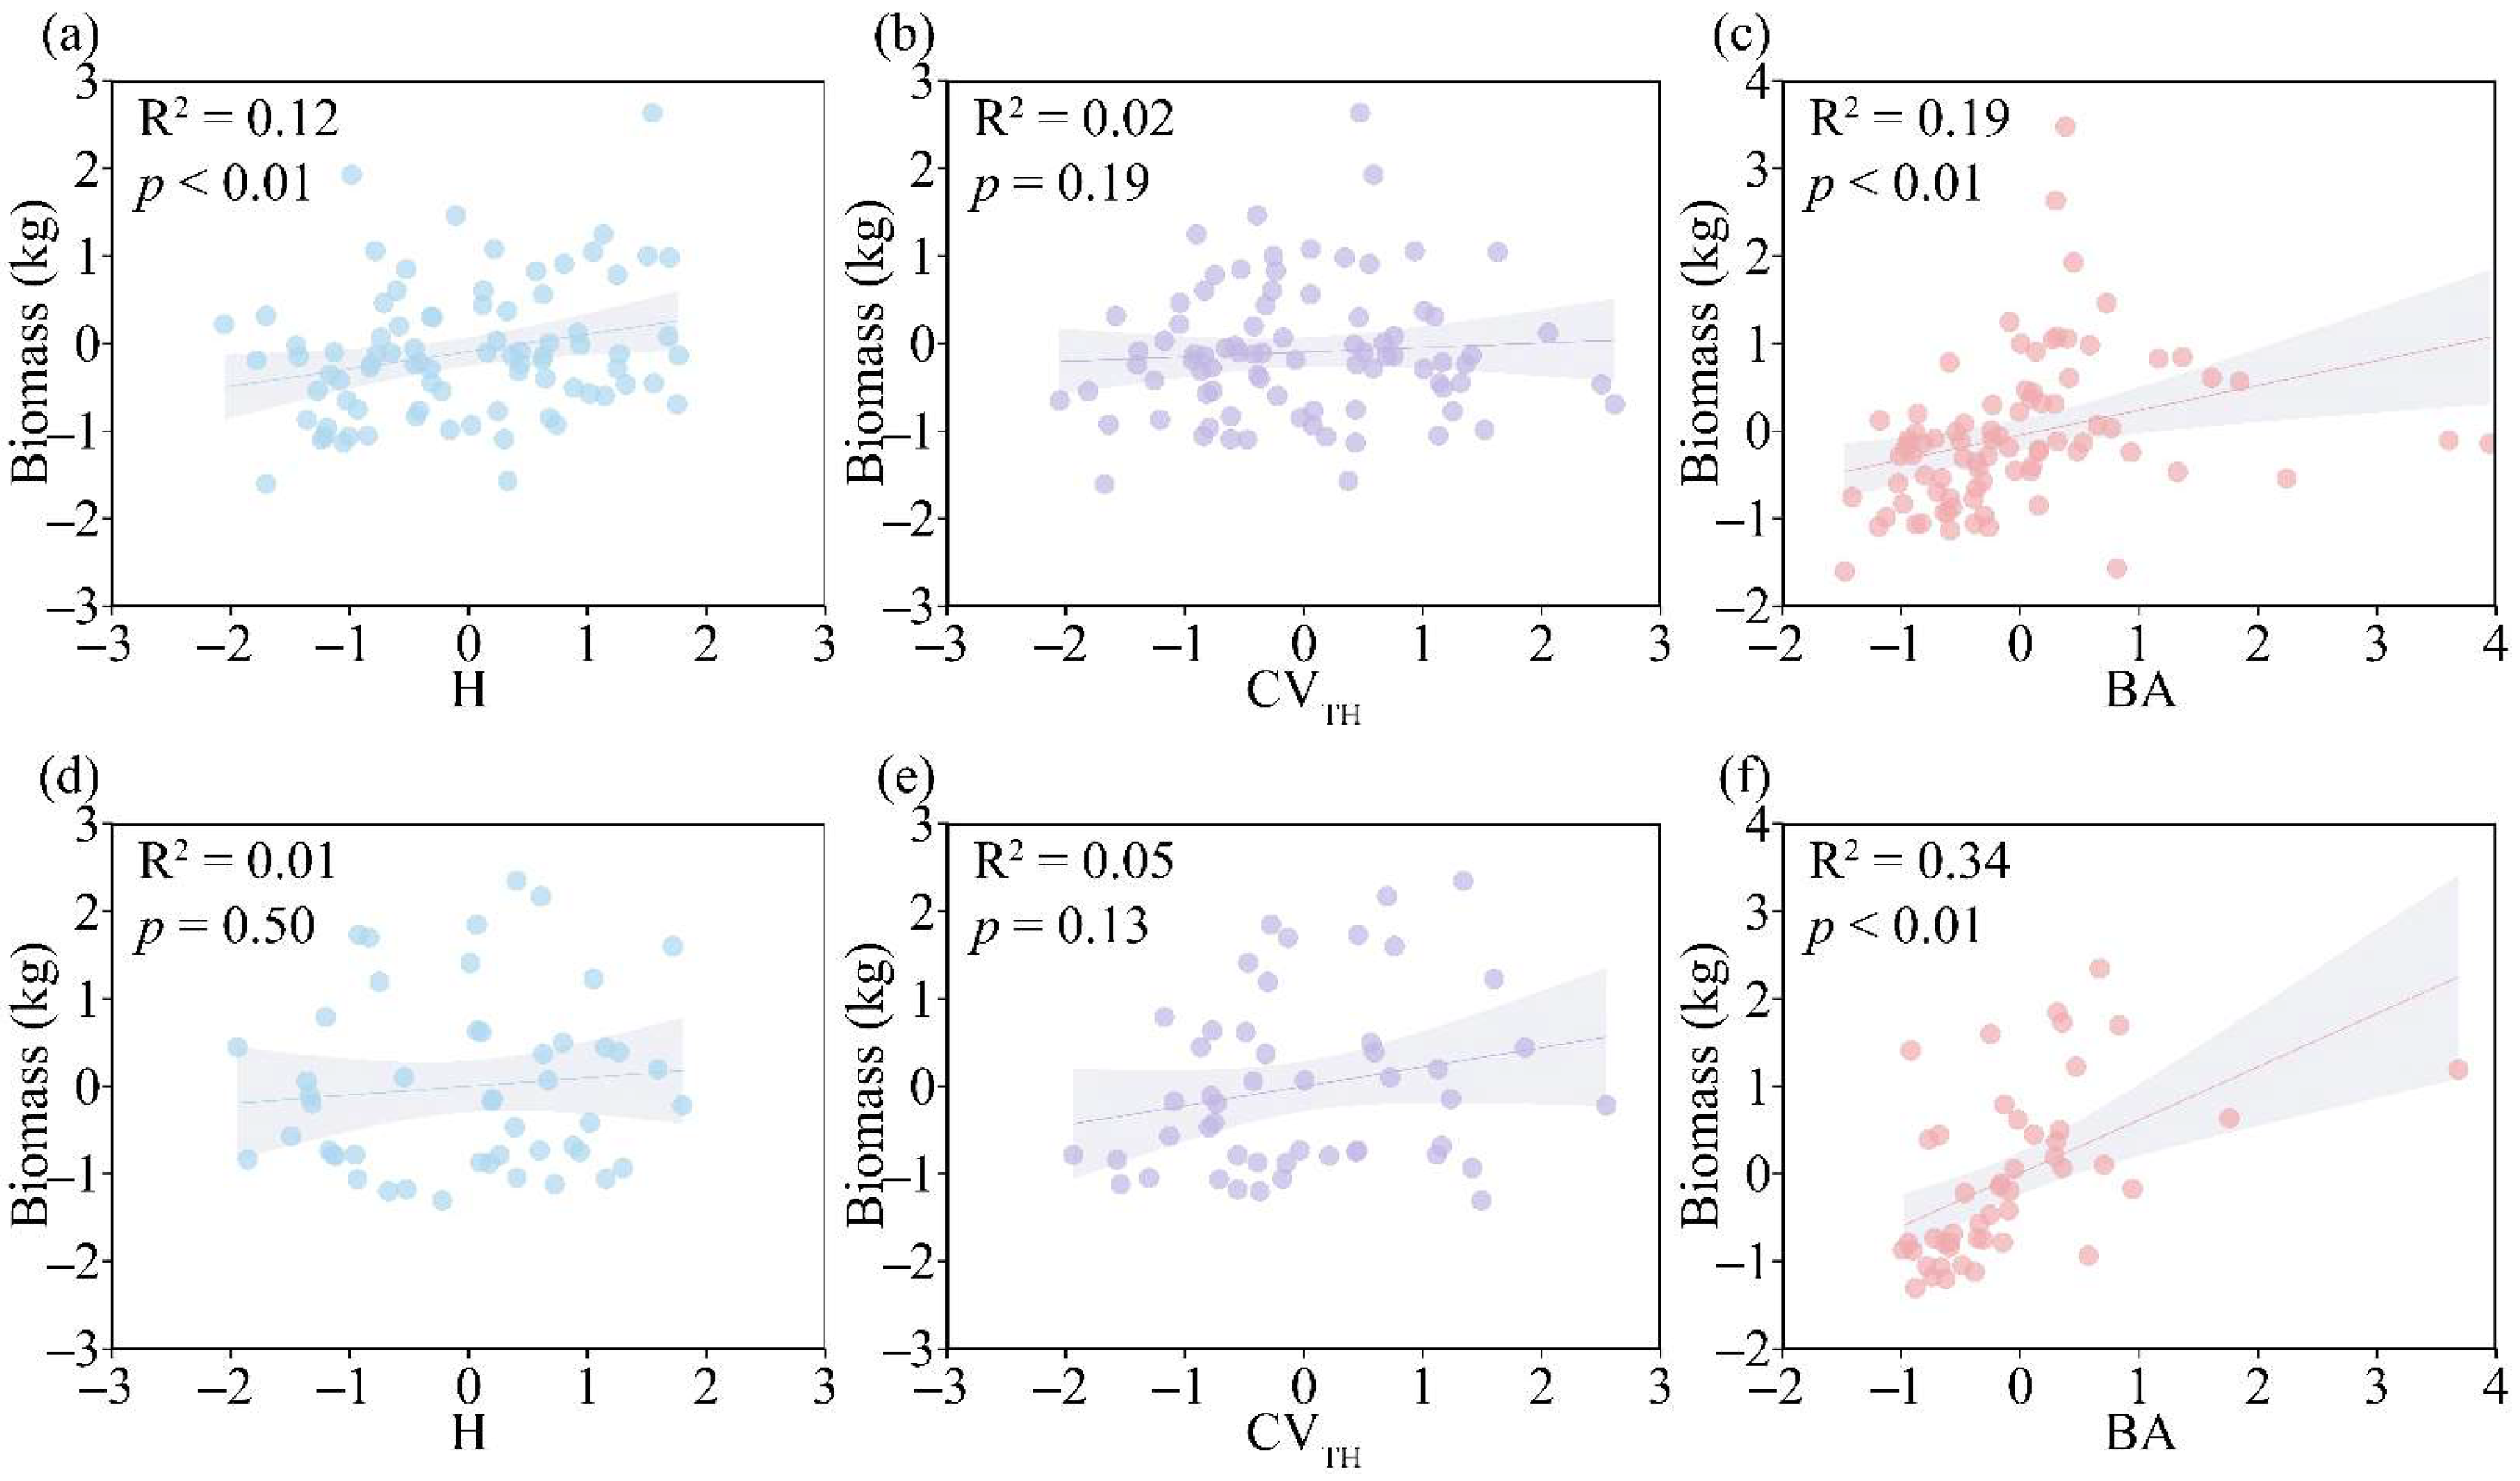
Forest diversity exerted different effects on the biomass of the two coniferous species. Specifically, biodiversity (H) showed a significant positive correlation with the biomass of C. lanceolata (Figure 5a; p < 0.01) but had no significant effect on that of P. massoniana (Figure 5d). Structural diversity (CVTH) exerted positive effects on the biomass of both C. lanceolata and P. massoniana (Figure 5b,e). Forest growth factors exhibited significant positive effects on the biomass of both tree species (Figure 5c,f; p < 0.01). These results indicated that the three biotic factors collectively promoted the biomass of both species. In this study, we incorporated forest factors and environmental factors to further analyze the driving factors.

3.3. Driving Factor Analysis of Forest Biomass

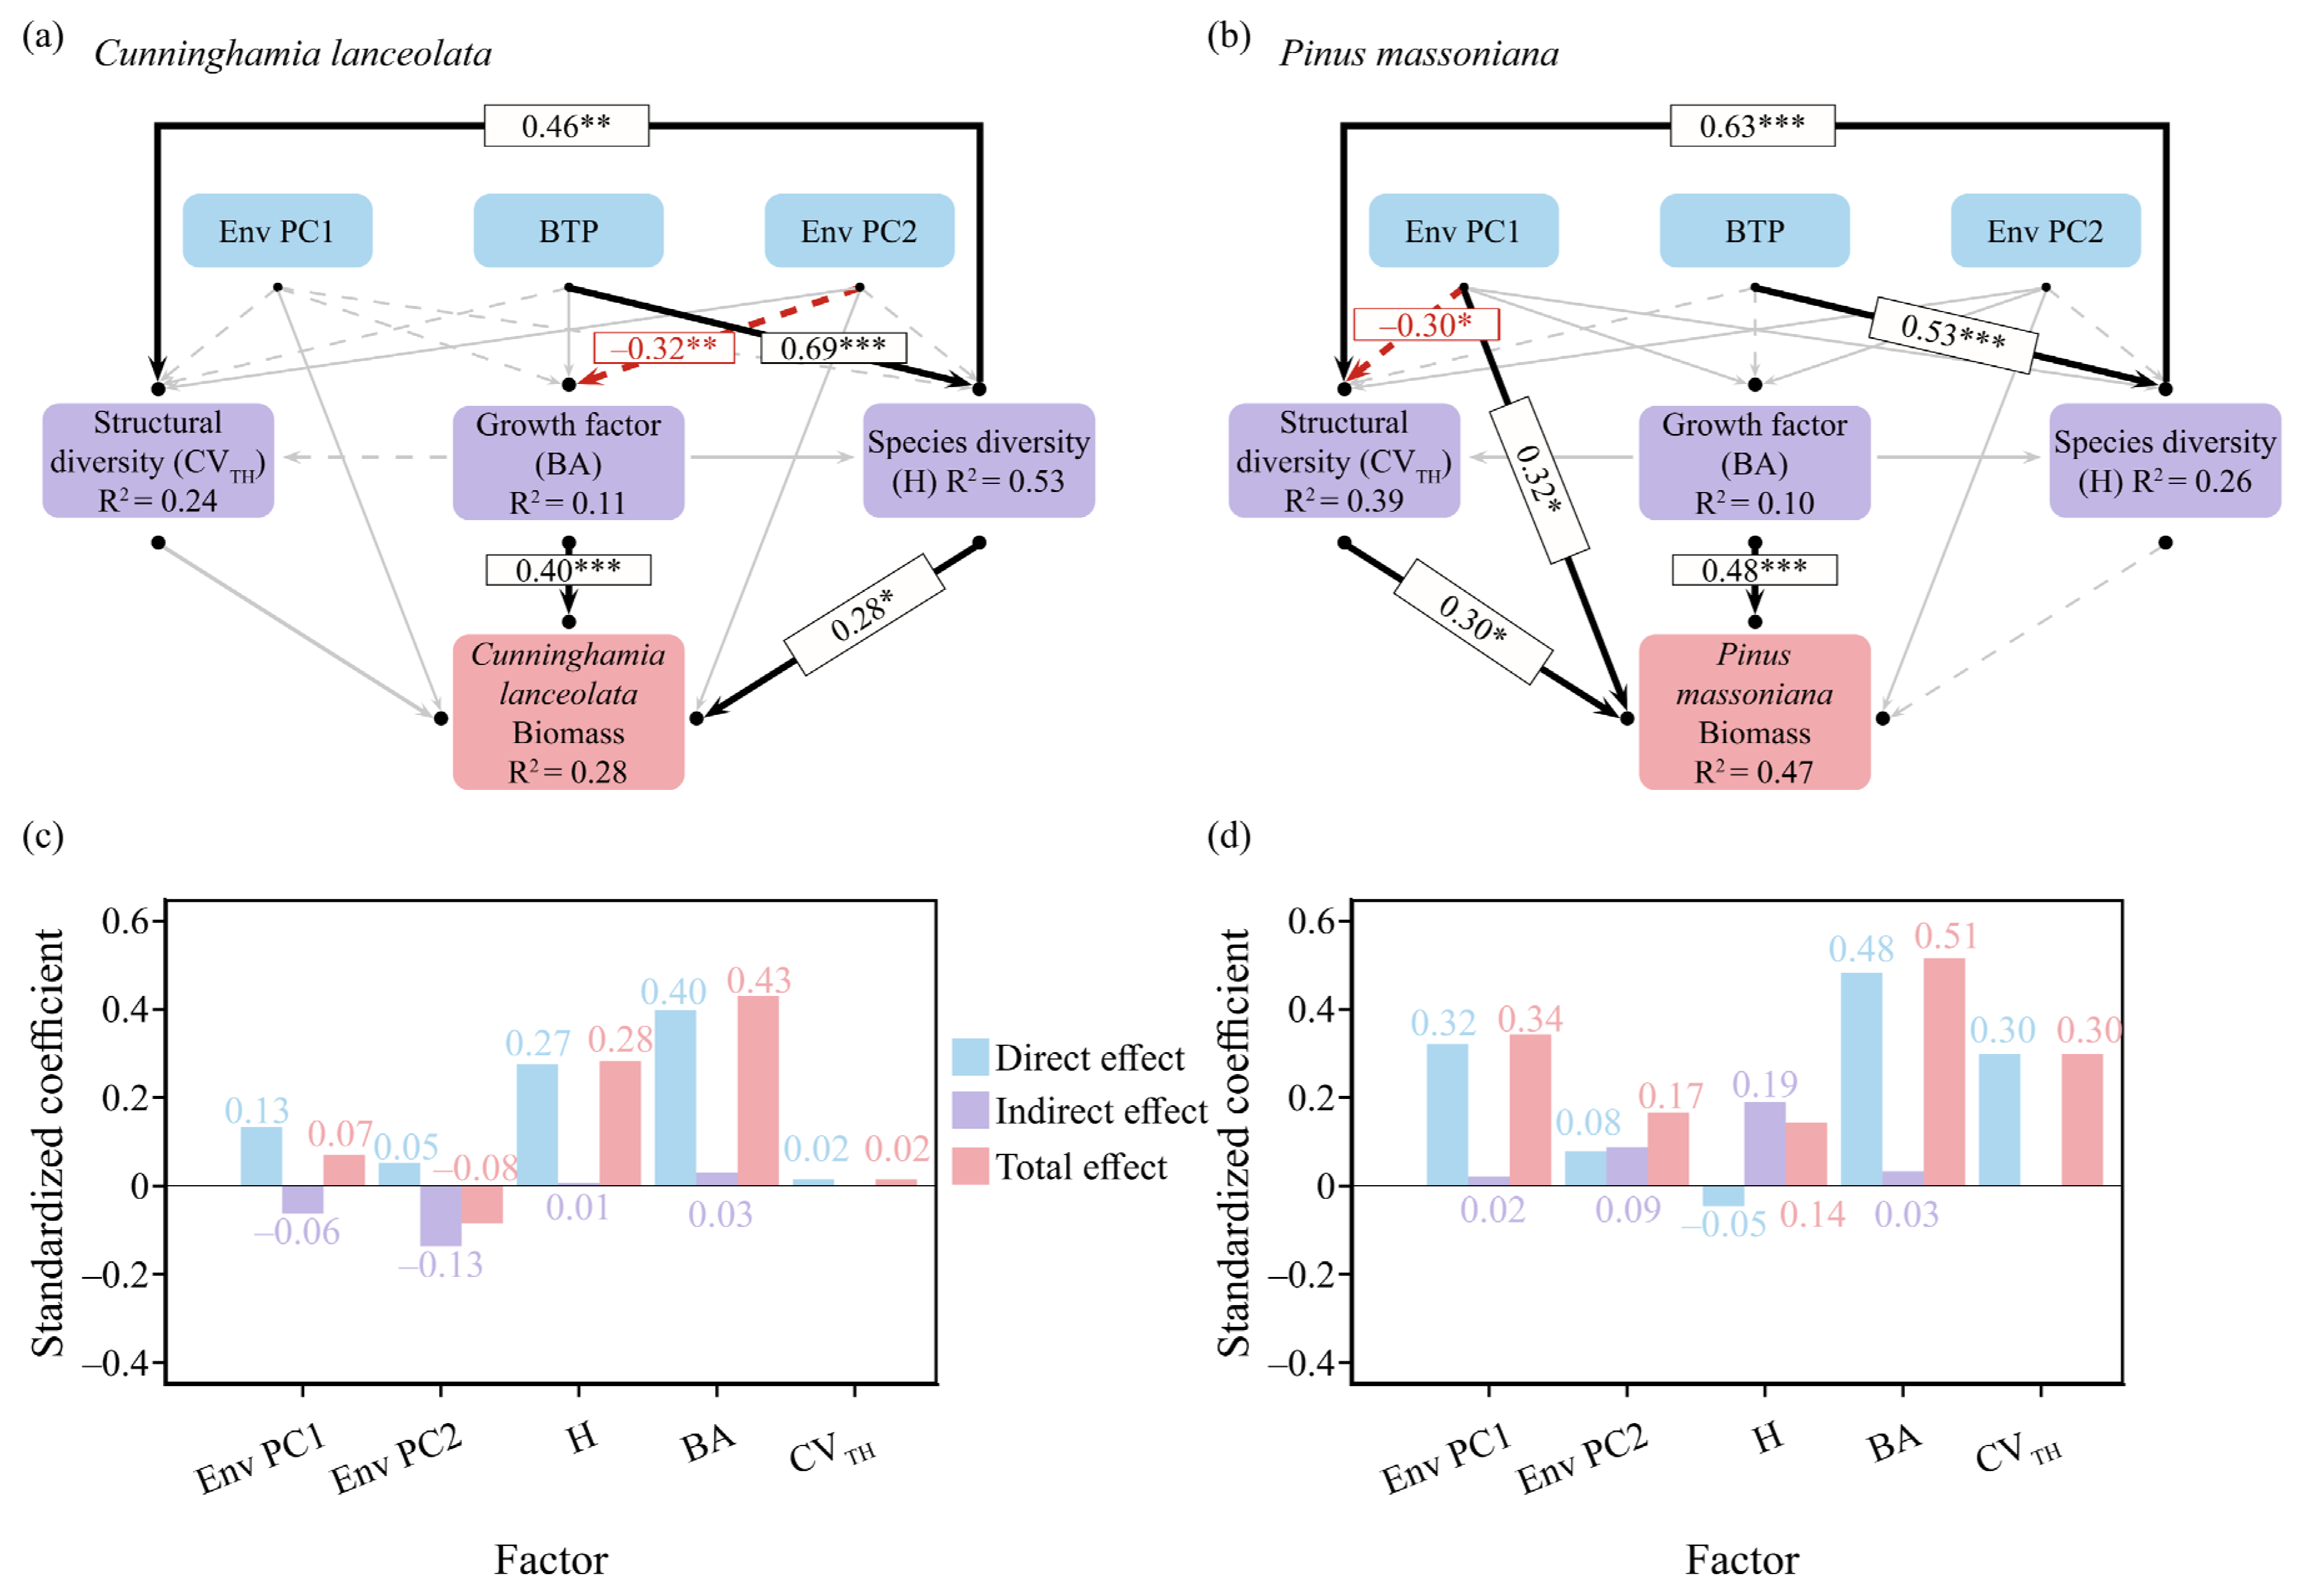
The structural equation models (SEMs) for the biomass of C. lanceolata and P. massoniana both exhibited good fitting performance (Table S5). The SEM constructed using mean annual temperature and mean annual precipitation as environmental factors explained 27% and 44% of the biomass variation in C. lanceolata and P. massoniana, respectively (Figure S4). In contrast, the SEM constructed using the screened environmental factors accounted for 28% and 47% of the biomass variation in the two species, respectively (Figure 6a,b). The explanatory power of the optimized model was improved; thus, the optimized SEM was adopted for all subsequent analyses.
The most significant factors affecting the biomass of C. lanceolata were H and BA, whereas the most significant factors influencing the biomass of P. massoniana were Env PC1, CVTH, and BA. All these factors exerted promoting effects on biomass, and the results were consistent with those of the linear regression analysis. The variable effect analysis plots revealed the direct effects, indirect effects, and total effects between the factors and biomass. Environmental factors exerted positive direct and total effects on the biomass of C. lanceolata but negative indirect effects. In contrast, structural diversity, species diversity, and forest growth factors all showed positive effects on the biomass of C. lanceolata (Figure 6c). All factors exhibited positive effects on the biomass of P. massoniana.; however, H had a weak negative direct effect, with its total effect being positive (Figure 6d). These results indicated that forest growth factors had substantial effects on the biomass of both species. Species diversity exerted a greater impact on the biomass of C. lanceolata, while structural diversity had a more pronounced effect on the biomass of P. massoniana.
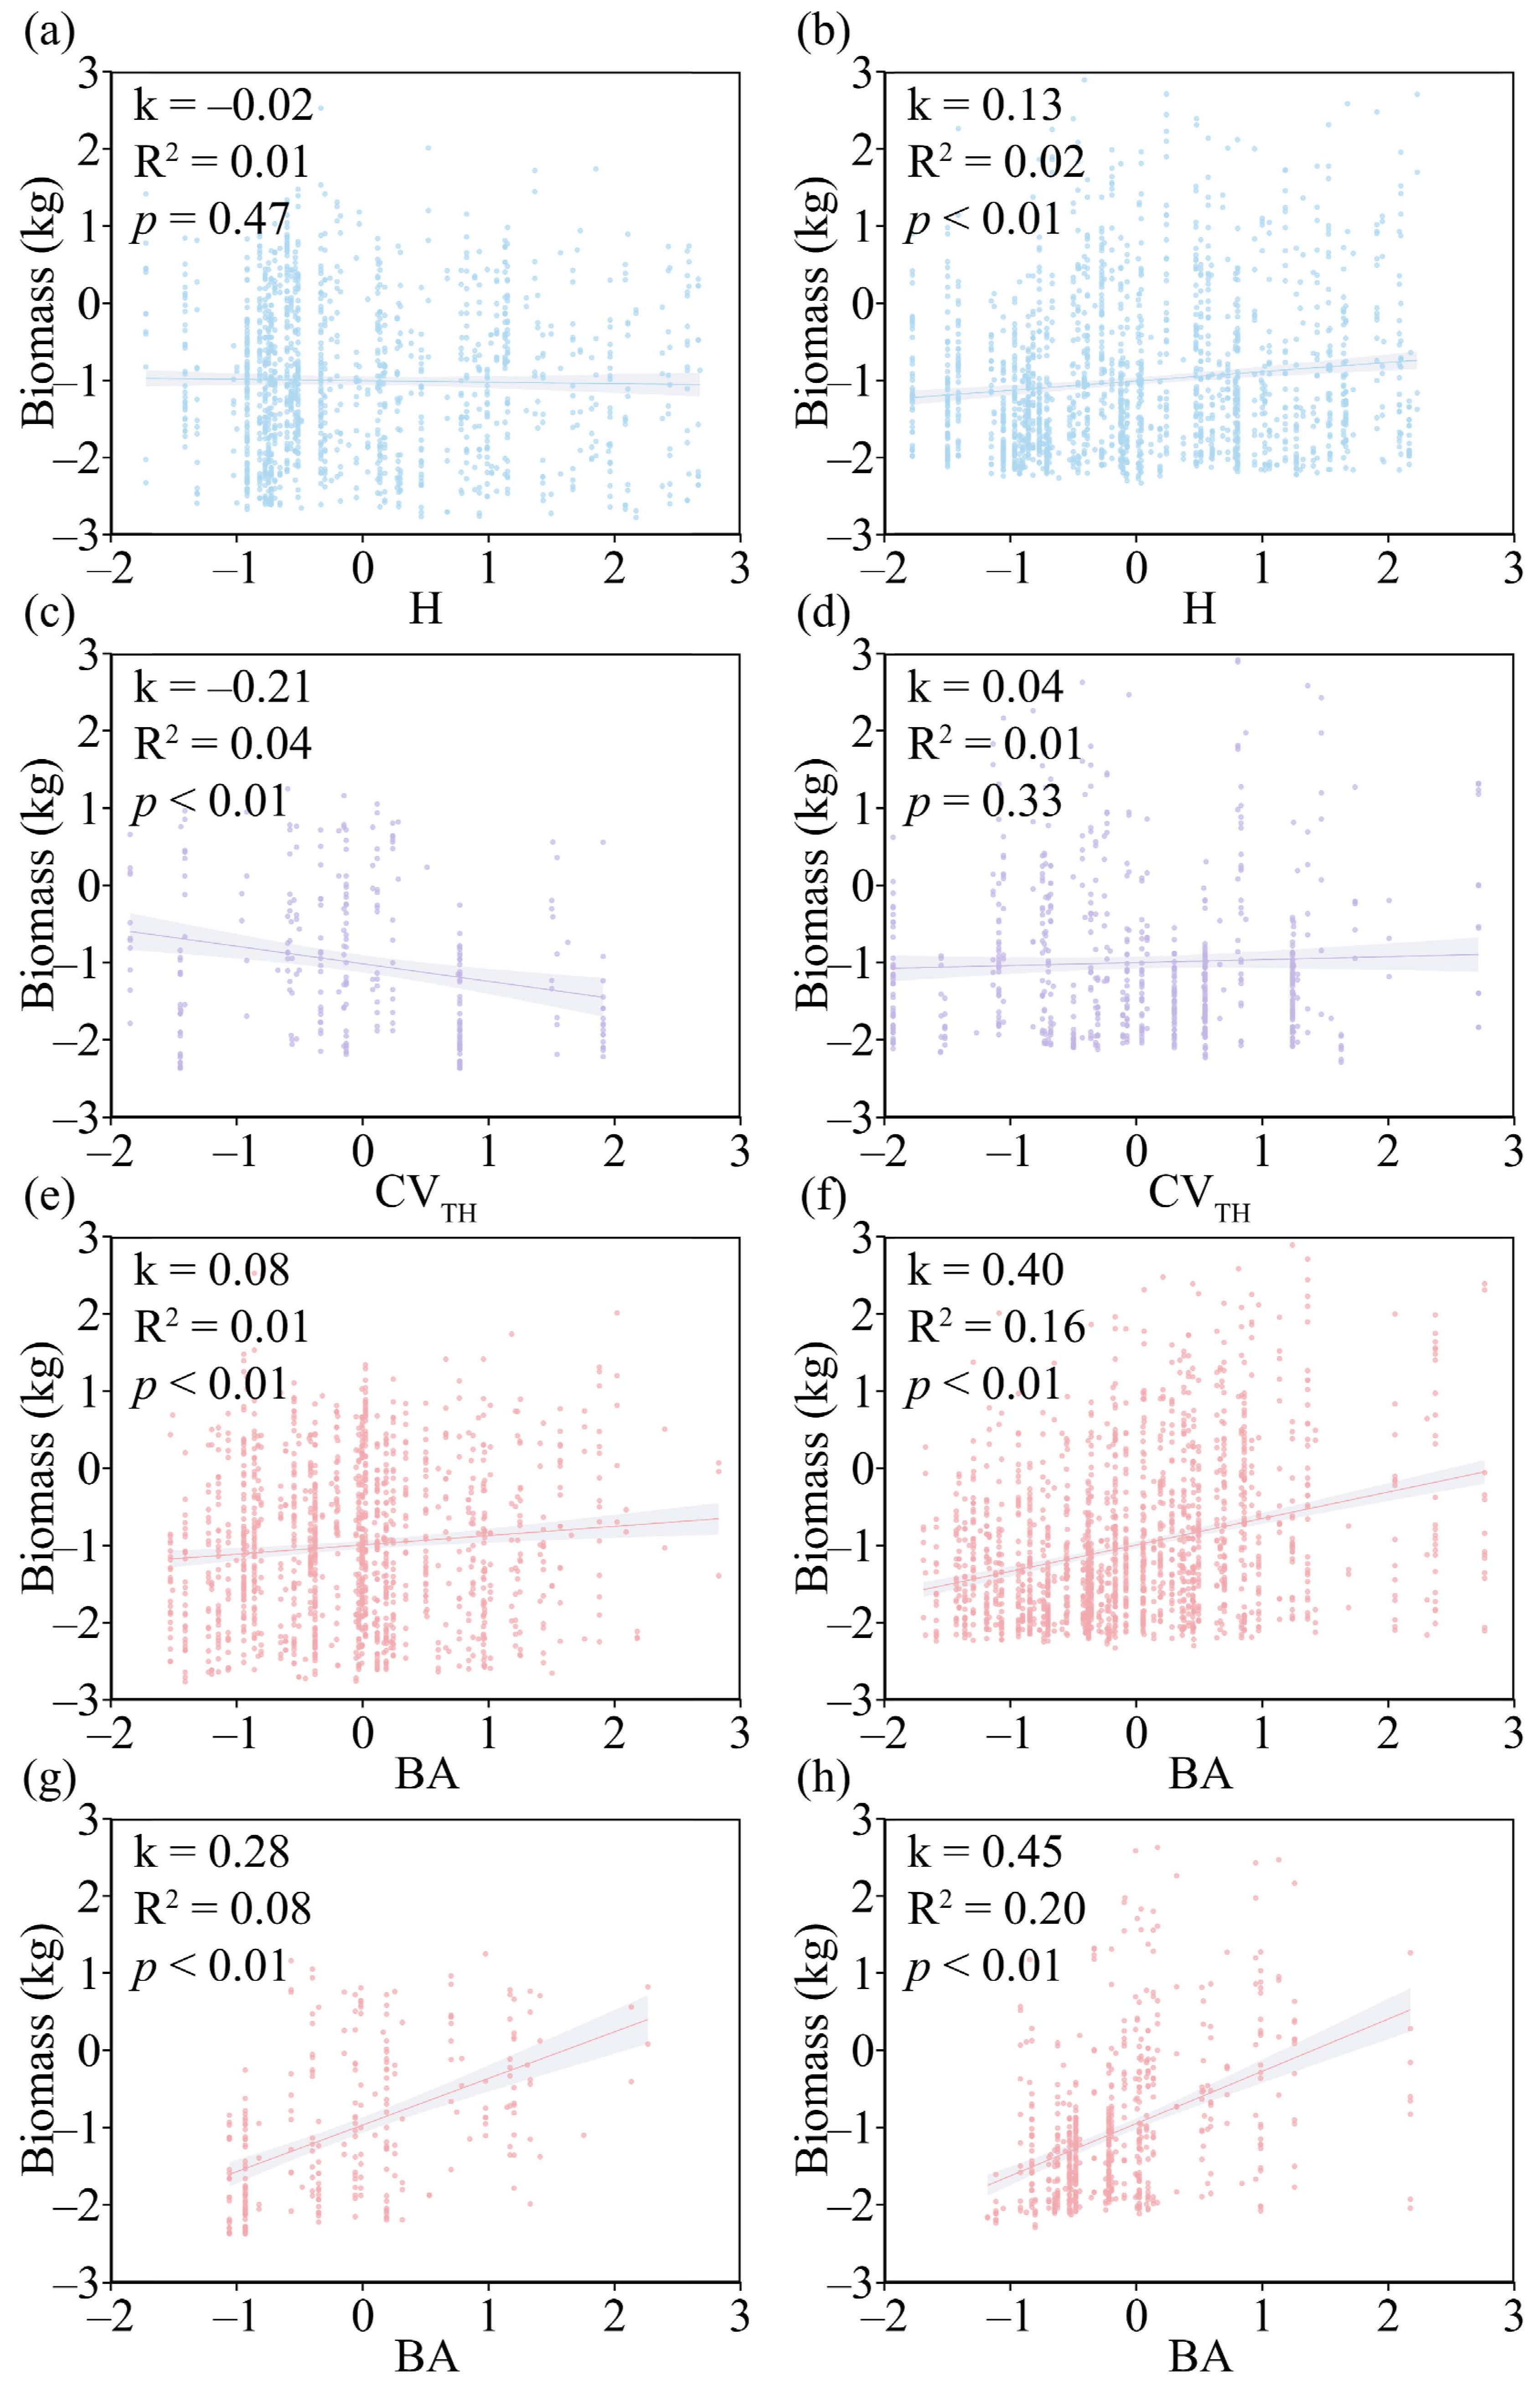
Forest diversity and forest growth factors exerted consistent effects on C. lanceolata and P. massoniana across different growth stages. In the early growth stage of C. lanceolata, H exerted a negative effect on its biomass (Figure 7a). In the middle and late growth stages, H showed a significant positive effect on its biomass (Figure 7b; p < 0.05). For P. massoniana, CVTH exerted a significant negative effect on its biomass in the early growth stage (Figure 7c; p < 0.05), whereas CVTH exerted a positive effect on its biomass in the middle and late growth stages (Figure 7d). BA exerted a significant promoting effect on both C. lanceolata and P. massoniana across all growth stages (Figure 7e–h; p < 0.05).

4. Discussion

4.1. Difference Analysis of Growth of C. lanceolata and P. massoniana

C. lanceolata and P. massoniana are the most common coniferous tree species in southern China, and they are recognized as ideal afforestation species due to their considerable economic and ecological benefits [22]. In this study, field survey data were used to quantify the biomass of C. lanceolata and P. massoniana in natural environments, with DBH serving as the independent variable to explore the relationship between DBH and biomass. Existing studies have demonstrated that tree age is significantly correlated with DBH [35]. Tree age is positively associated with DBH and biomass accumulation over time [36], which indicates that the direct use of DBH as an analysis indicator has good theoretical significance. In natural forests, trees of the same species with identical DBH may exhibit variations in age [37]. This is because trees adopt different resource utilization strategies during different forest developmental stages, leading to temporal variations in growth even within the same species [38]. In addition, obtaining tree increment cores is a destructive sampling approach. When sampling thousands of trees, even the advanced increment bore coring (IBC) technique may cause tree mortality [39], resulting in potential ecological damage. Therefore, this study focused on the relationship between DBH and biomass in natural environments based on DBH data, thereby avoiding the interference caused by tree age heterogeneity and destructive sampling, as well as the adverse impacts on forest ecosystems.
The results presented in Figure 2 show that the biomass and accumulation rate of P. massoniana were higher than those of C. lanceolata. This finding is inconsistent with the results of analyses conducted in southeastern (SE) China [40] but closely consistent with the data obtained from forests under near-natural conditions [41]. This discrepancy is attributable to differences in spatial scales and geographical regions, and the study area is characterized by extensive Karst landforms, dominated by mountain forests with steep slopes (Figure 1). C. lanceolata is a shallow-rooted plant. In steep-slope habitats, although the root biomass of C. lanceolata increases significantly, the low root–shoot ratio (R:S) of plants in subtropical environments causes most biomass to be allocated to above-ground parts [42]. The steep slopes contribute to reduced growth performance of C. lanceolata [15], thereby diminishing its biomass accumulation rate. In contrast, P. massoniana has a distinct taproot system, which enables it to grow well in rocky crevices and slopes with exposed bedrock [24]. The soil in the study area is acidic. C. lanceolata prefers loose, deep, humus-rich soils, whereas P. massoniana favors acidic soil conditions [40]. Owing to the interspecific differences in topographic and edaphic adaptations, P. massoniana exhibits a higher biomass accumulation rate.

4.2. The Model Optimization, and Effects of Environmental Factors on the Biomass of C. lanceolata and P. massoniana

Current studies typically adopt Bio 01 and Bio 12 as variables to investigate the effects of climatic conditions on forest productivity [3]. However, the study area of the present research is relatively small, so the actual impacts of these two climatic factors across the entire region may be limited [14]. In addition, different tree species exhibit divergent responses to climatic conditions, meaning that the same set of climatic factors cannot be used to explain the growth dynamics of different species [43,44]. As an ensemble model, Biomod2 has superior predictive ability compared to single models [33,45]. In this study, Biomod2 was employed to screen the most influential factors for C. lanceolata and P. massoniana, which were then used as the climatic variables for subsequent analyses. The SEMs presented in Figure 6 and Figure S4 were constructed using the screened factors and conventional climatic factors, respectively. The results showed that constructing SEMs with the screened climatic factors could improve the explanatory power (with an increase of 0.01 for C. lanceolata and 0.03 for P. massoniana), thus verifying the effectiveness of this method. Nevertheless, the explanatory power of the SEMs remained relatively low, probably due to the lack of soil property data, belowground biomass data, and long-term forest monitoring data. Previous studies have shown that the inclusion of soil property data can increase the model’s explanatory power to 51% [3]. Therefore, this study still has room for further improvement.
The results of the Biomod2 model showed that the climatic potential suitable area for C. lanceolata was larger and more extensive in the study area, and this is attributed to the effect of altitude. The results of the field survey indicated that the maximum recorded altitude of C. lanceolata reached 1141.35 m, whereas that of P. massoniana was only 667.29 m. Current studies have demonstrated that C. lanceolata has a higher altitudinal adaptability than P. massoniana, with a maximum altitude tolerance of up to 2200.00 m [26]. Although P. massoniana can grow well on steep slopes [24], the low mean temperature and winter frost at high altitudes result in a distinct altitudinal upper limit for this species (Figure 3) [25]. These results are consistent with the first hypothesis proposed in this study. Therefore, this study suggests that forest management practices should take into account the adaptability of tree species, which can effectively enhance the growth performance of the target species.

4.3. The Effects of Forest Factors on the Biomass of C. lanceolata and P. massoniana

The SEM results indicated that forest diversity and forest growth indices exert significant effects on the biomass of C. lanceolata and P. massoniana. Specifically, C. lanceolata exhibits significant responses to H and BA, whereas P. massoniana shows significant responses to CVTH and BA. Across different growth stages of the two tree species, biodiversity and structural diversity exhibit divergent responses.
The biodiversity affects forest plants mainly through the mechanisms of niche complementarity and the selection effect [18,19]. C. lanceolata exhibits divergent responses to H across different DBH classes. As DBH increases, the effect of species diversity gradually shifts from negative to positive. This is because in the early growth stage of C. lanceolata, the individuals are small-sized and require more sunlight for growth. Higher species diversity leads to an increase in plant density within the forest and a gradual reduction in canopy gaps [46], thus intensifying interspecific competition. In addition, other plants with well-developed root systems can absorb water from deeper soil layers during this period, and the singularity of water sources may exacerbate the intensity of competition [47,48]. Research showed that the reduction in productivity is primarily induced by of selection effect [49]. In the late growth stage of C. lanceolata, competition intensity weakens; accordingly, increasing species diversity can promote the biomass accumulation of C. lanceolata. Current practices have demonstrated that introducing broad-leaf tree species and shrubs into C. lanceolata pure stands can effectively increase species diversity and thus enhance forest productivity in most regions [48,50]. The results presented in Figure 6a also support this view, as the broad-leaf tree proportion (BTP) exerts a significant promoting effect on the biomass of C. lanceolata. This is because an appropriate proportion of broad-leaf trees can improve forest biodiversity and further enhance the efficient utilization of forest resources [3]. Furthermore, the formation of coniferous–broad-leaf mixed forests can effectively ameliorate the forest microclimate, reduce soil evaporation, and increase precipitation infiltration [51]. These improvements enable C. lanceolata, a shallow-rooted plant, to acquire more resources and thereby further improve its productivity, which reflects the niche complementarity effect in forest ecosystems [20].
Forest structural diversity affects tree biomass through multiple pathways, including light availability, wind dynamics, and other disturbances [17]. Current studies have demonstrated that DBH structural diversity and crown width structural diversity exert significant effects only at large spatial scales [3,30,52], Therefore, this study adopted only CVTH as the indicator of structural diversity. CVTH reflects the complexity of the vertical structure of forest stands. Due to resource limitations and narrow forest space, low structural diversity prevents the coexistence of species with similar functional traits, whereas species with distinct differences in functional traits can coexist [8,9,10]. This leads to intense competition among under-story and mid-story plants in the vertical structure, reducing their resource acquisition and further decreasing their biomass. In contrast, after surviving competition, over-story and mid-story plants can obtain more resources, thereby increasing their biomass more effectively [53]. The results of this study (Figure 7c,d) showed that P. massoniana exhibited divergent responses to CVTH across different DBH classes. As DBH increased, the effect of structural diversity gradually shifted from negative to positive. Light is the most direct environmental factor affecting the survival and early growth of young trees [54]. A higher CVTH may reduce the light available to under-story and mid-story plants in the forest [17,55], which explains the extremely significant negative correlation observed in Figure 7c (p < 0.01). The reduction in light availability further decreases the biomass of P. massoniana in the early growth stage, which is a consequence induced by the selection effect [3]. When P. massoniana grows further and reaches the over-story and mid-story layers of the forest, the complex vertical structure enables P. massoniana to utilize light and water resources more efficiently [56], thus facilitating higher biomass accumulation. These results are consistent with the second hypothesis of this study.
BA is defined as the ratio of the total cross-sectional area at breast height of all trees in a stand to the plot area. It serves as a direct indicator of forest growth status, as it integrates the number and size of trees and is thus directly related to tree biomass [16]. The results showed that BA exerted significant positive effects on both tree species, with larger BA corresponding to higher biomass for the two species. BA reflects the abundance of growth resources and the maturity of the forest within the plot [57]. Abundant resources can support the vigorous growth of trees, thereby enhancing the overall productivity level of the forest stand.

5. Conclusions

Based on natural data of 4042 coniferous trees, this study comprehensively explored the effects of biotic and abiotic factors on the biomass of Cunninghamia lanceolata and Pinus massoniana. The results indicated that screening climatic factors using the Biomod2 model could effectively improve the explanatory power of the structural equation model (SEM). C. lanceolata has a broader suitable planting area, and increasing biodiversity after forest establishment can enhance its productivity. In contrast, P. massoniana can grow on steeper slopes due to its well-developed root system, and improving structural diversity after forest establishment can promote its productivity. This study recommends that forest management should the adaptability of tree species and that mixed planting of coniferous and broad-leaved trees will contribute to the more efficient utilization of forest resources. However, this study still has several limitations. It focused on a geographical region or ecosystem with a limited spatial scale, which may restrict the general applicability of its findings. Therefore, it is necessary to expand the research to a broader spatial scale. Moreover, the low explanatory power of the SEM may be attributed to the lack of soil data, belowground biomass data, and long-term forest monitoring data. Future studies should focus on these aspects for in-depth research.

Supplementary Materials

The following supporting information can be downloaded at https://www.mdpi.com/article/10.3390/life16020277/s1. There are total of five tables and four figures in the Supplementary Material. Table S1: Biomass model table. Table S2: Environmental factors used for modeling. Table S3: Model accuracy table. Table S4: Suitable habitat area. Table S5: Model fit statistic summary of the tested SEM for carbon stocks. Figure S1: Pearson correlation analysis diagram of climatic factors. Figure S2: Natural-break classification (Jenks) map of biomass accumulation rate of C. lanceolata and P. massoniana. Figure S3: Suitable habitat distribution map of C. lanceolata and P. massoniana. Figure S4: Unoptimized structural equation model. References [58,59] are cited in the supplementary materials.

Author Contributions

L.W.: Conceptualization, Validation, Funding acquisition, Resources, Writing—review and editing; L.T.: Methodology, Data curation, Formal analysis, Writing—original draft; K.C.: Writing—original draft, Data curation, Investigation, Visualization; X.Z.: Supervision, Funding acquisition, Resources; K.W.: Investigation, Supervision, Project administration; H.S.: Validation; L.M.: Investigation, Project administration, Software, Writing—review and editing. All authors have read and agreed to the published version of the manuscript.

Funding

This work was supported by the Scientific Research Project of Baishanzu National Park (Grant No. 2021KFLY01); the National Natural Science Foundation of China (Grant No. 32001243); the Lishui University (No. HXZKB2024106, No. HXZKB2024107, No. HXZKB2024175, and No. HXZKB2024176); and the Lishui University Graduate Research and Innovation Programs (No. YKY25011).

Institutional Review Board Statement

Not applicable.

Informed Consent Statement

Not applicable.

Data Availability Statement

The datasets generated and/or analyzed during the current study are available in the Supplementary Material. The climate data (mean annual temperature and mean annual precipitation) in this study were accessed through the WorldClim database (http://www.worldclim.org/) (accessed on 6 April 2023).

Acknowledgments

We express our sincere gratitude to Weijun Jiang and Yixuan Wang of the Lishui Ecological Environment Monitoring Center, Zhejiang Province, for their guidance in field monitoring. Special thanks are extended to Jianxin Zhang and Wenwen Pan of Lishui Polytechnic College for their substantial support during the monitoring campaign. We also acknowledge the contributions of Kuntai Chai, Liang Zhang, Tairong Xu, Chengpu Lu, Daomin Chen, Fengying Cai, Jian Xu, and other students from the Environmental Engineering program at Lishui University in conducting field plot surveys.

Conflicts of Interest

The authors declare no conflicts of interest.

References

  1. Schneider, S.H. The greenhouse effect: Science and policy. Science 1989, 243, 771–781. [Google Scholar] [CrossRef] [Scilit]
  2. Friedlingstein, P.; O’Sullivan, M.; Jones, M.W.; Andrew, R.M.; Gregor, L.; Hauck, J.; Le Quéré, C.; Luijkx, I.T.; Olsen, A.; Peters, G.P. Global carbon budget 2022. Earth Syst. Sci. Data 2022, 14, 4811–4900. [Google Scholar] [CrossRef] [Scilit]
  3. Wu, Y.; Zheng, J.; Gao, J.; He, X.; Liu, X.; Chen, Y.; Liu, J.; Li, C. Functional diversity explains ecosystem carbon storage in subtropical forests. Glob. Change Biol. 2025, 31, e70120. [Google Scholar] [CrossRef] [Scilit]
  4. Pan, Y.; Birdsey, R.A.; Fang, J.; Houghton, R.; Kauppi, P.E.; Kurz, W.A.; Phillips, O.L.; Shvidenko, A.; Lewis, S.L.; Canadell, J.G. A large and persistent carbon sink in the world’s forests. Science 2011, 333, 988–993. [Google Scholar] [CrossRef] [Scilit]
  5. Bai, Y.; Ding, G. Estimation of changes in carbon sequestration and its economic value with various stand density and rotation age of Pinus massoniana plantations in China. Sci. Rep. 2024, 14, 16852. [Google Scholar] [CrossRef] [Scilit] [PubMed]
  6. MacDicken, K.G. Global forest resources assessment 2015: What, why and how? For. Ecol. Manag. 2015, 352, 3–8. [Google Scholar] [CrossRef] [Scilit]
  7. Yu, Z.; Liu, S.; Wang, J.; Wei, X.; Schuler, J.; Sun, P.; Harper, R.; Zegre, N. Natural forests exhibit higher carbon sequestration and lower water consumption than planted forests in China. Glob. Change Biol. 2019, 25, 68–77. [Google Scholar] [CrossRef] [Scilit]
  8. Cavender-Bares, J.; Keen, A.; Miles, B. Phylogenetic structure of Floridian plant communities depends on taxonomic and spatial scale. Ecology 2006, 87, S109–S122. [Google Scholar] [CrossRef] [Scilit]
  9. Slingsby, J.; Verboom, G. Phylogenetic relatedness limits co-occurrence at fine spatial scales: Evidence from the Schoenoid Sedges (Cyperaceae: Schoeneae). S. Afr. J. Bot. 2007, 73, 313. [Google Scholar] [CrossRef] [Scilit]
  10. Yang, J.; Zhang, G.; Ci, X.; Swenson, N.G.; Cao, M.; Sha, L.; Li, J.; Baskin, C.C.; Slik, J.F.; Lin, L. Functional and phylogenetic Assembly in a Chinese tropical tree community across size classes, spatial scales and habitats. Funct. Ecol. 2014, 28, 520–529. [Google Scholar] [CrossRef] [Scilit]
  11. Ameray, A.; Cavard, X.; Bergeron, Y. Climate change may increase Quebec boreal forest productivity in high latitudes by shifting its current composition. Front. For. Glob. Change 2023, 6, 1020305. [Google Scholar] [CrossRef] [Scilit]
  12. Zhang, L.; Qi, S.; Li, P.; Zhou, P. Influence of stand and environmental factors on forest productivity of Platycladus orientalis plantations in Beijing’s mountainous areas. Ecol. Indic. 2024, 158, 111385. [Google Scholar] [CrossRef] [Scilit]
  13. Gao, J.; Ji, Y.; Zhang, X. Net primary productivity exhibits a stronger climatic response in planted versus natural forests. For. Ecol. Manag. 2023, 529, 120722. [Google Scholar] [CrossRef] [Scilit]
  14. Sun, J.; Jiao, W.; Wang, Q.; Wang, T.; Yang, H.; Jin, J.; Feng, H.; Guo, J.; Feng, L.; Xu, X. Potential habitat and productivity loss of Populus deltoides industrial forest plantations due to global warming. For. Ecol. Manag. 2021, 496, 119474. [Google Scholar] [CrossRef] [Scilit]
  15. Li, L.; Yan, X.; Tian, Y.; Zhao, Z.; Wu, S.; Farooq, T.H.; Li, M.; Ma, X.; Wu, P. Root spatial distribution and architectural formation of Chinese fir plantations: Changes in soil water and nutrients based on different slope positions. Eur. J. For. Res. 2025, 144, 1645–1657. [Google Scholar] [CrossRef] [Scilit]
  16. Torres, A.B.; Lovett, J.C. Using basal area to estimate aboveground carbon stocks in forests: La Primavera Biosphere’s Reserve, Mexico. Forestry 2013, 86, 267–281. [Google Scholar] [CrossRef] [Scilit]
  17. Zhai, L.; Will, R.E.; Zhang, B. Structural diversity is better associated with forest productivity than species or functional diversity. Ecology 2024, 105, e4269. [Google Scholar] [CrossRef] [Scilit] [PubMed]
  18. Gogoi, R.R.; Adhikari, D.; Upadhaya, K.; Barik, S. Tree diversity and carbon stock in a subtropical broadleaved forest are greater than a subtropical pine forest occurring in similar elevation of Meghalaya, north-eastern India. Trop. Ecol. 2020, 61, 142–149. [Google Scholar] [CrossRef] [Scilit]
  19. Ouyang, S.; Gou, M.; Lei, P.; Liu, Y.; Chen, L.; Deng, X.; Zhao, Z.; Zeng, Y.; Hu, Y.; Peng, C. Plant functional trait diversity and structural diversity co-underpin ecosystem multifunctionality in subtropical forests. For. Ecosyst. 2023, 10, 100093. [Google Scholar] [CrossRef] [Scilit]
  20. Mensah, S.; du Toit, B.; Seifert, T. Diversity–biomass relationship across forest layers: Implications for niche complementarity and selection effects. Oecologia 2018, 187, 783–795. [Google Scholar] [CrossRef] [Scilit]
  21. Rodríguez-Hernández, D.I.; Deane, D.C.; Wang, W.; Chen, Y.; Li, B.; Luo, W.; Chu, C. Direct effects of selection on aboveground biomass contrast with indirect structure-mediated effects of complementarity in a subtropical forest. Oecologia 2021, 196, 249–261. [Google Scholar] [CrossRef] [Scilit]
  22. Ge, X.; Yang, Z.; Zhou, B.; Cao, Y.; Xiao, W.; Wang, X.; Li, M.-H. Biochar fertilization significantly increases nutrient levels in plants and soil but has no effect on biomass of Pinus massoniana (Lamb.) and Cunninghamia lanceolata (Lamb.) Hook Saplings during the first growing season. Forests 2019, 10, 612. [Google Scholar] [CrossRef] [Scilit]
  23. Xiang, W.; Xu, L.; Lei, P.; Ouyang, S.; Deng, X.; Chen, L.; Zeng, Y.; Hu, Y.; Zhao, Z.; Wu, H. Rotation age extension synergistically increases ecosystem carbon storage and timber production of Chinese fir plantations in southern China. J. Environ. Manag. 2022, 317, 115426. [Google Scholar] [CrossRef] [Scilit]
  24. Qin, G. Maweisong Peiyu Ji Liyong (Masson Pine Cultivation and Utilization); Beijing Jindun Publishing Company: Beijing, China, 1997. [Google Scholar]
  25. Nie, K.; Xu, M.; Zhang, J. Changes in soil carbon, nitrogen, and phosphorus in Pinus massoniana forest along altitudinal gradients of subtropical karst mountains. PeerJ 2023, 11, e15198. [Google Scholar] [CrossRef] [Scilit]
  26. Zhao, Y.; Xu, L.; Zhang, Y.; Wen, Y.; Zhang, D. Climate-change impacts on distribution, habitats, sustainability and cultivation planning of two economically and ecologically important forest trees (China fir and Masson pine) in China. Glob. Ecol. Conserv. 2025, 57, e03349. [Google Scholar] [CrossRef] [Scilit]
  27. Wang, J.; Ji, B.; Wang, Z.; Zhu, C. Influence of Subtropical Forest Landscape Pattern on Forest Carbon Density in Lishui City of Zhejiang Province. J. Zhejiang A&F Univ. 2024, 41, 30–40. [Google Scholar]
  28. Yan, S.; Hong, W.; Wu, C. Population Structure and Spatial Pattern of Celtis sinensis on Langqi Island of Minjiang Estuary. China J. Ecol. 2011, 30, 221. [Google Scholar]
  29. Jiang, C. Structure and Spatial Distribution of Natural Regeneration Casuarina equisetifolia Population in Coastal Shelter Forest. J. Fujian For. Sci. Technol. 2021, 48, 39–44. [Google Scholar]
  30. Tong, L.; Wang, Y.; Zhu, Z.; Chen, Z.; Tang, S.; Zhao, X.; Chen, K.; Wang, L. Effects of Species and Structural Diversity on Carbon Storage in Subtropical Forests. Biology 2025, 15, 79. [Google Scholar] [CrossRef] [Scilit]
  31. Lu, S.; Zhang, D.; Wang, L.; Dong, L.; Liu, C.; Hou, D.; Chen, G.; Qiao, X.; Wang, Y.; Guo, K. Comparison of plant diversity-carbon storage relationships along altitudinal gradients in temperate forests and shrublands. Front. Plant Sci. 2023, 14, 1120050. [Google Scholar] [CrossRef] [Scilit]
  32. Bettinger, P.; Boston, K.; Siry, J.P.; Grebner, D.L. Forest Management and Planning; Academic Press: San Diego, CA, USA, 2016. [Google Scholar]
  33. Chen, K.; Shao, W.; Li, Y.; Wang, L.; Lin, Z.; Guo, L.; Wei, L. Biomod2 Modeling for Predicting Suitable Distribution of Bamboo Bat (Tylonycteris pachypus) Under Climate Change. Animals 2025, 15, 1164. [Google Scholar] [CrossRef] [Scilit] [PubMed]
  34. Li, F.; Shi, Z.; Liu, S.; Chen, M.; Xu, G.; Chen, J.; Xing, H. Stand structural diversity and edaphic properties regulate aboveground biomass of Abies fargesii var. faxoniana primary forest on the eastern Qinghai-Tibetan Plateau. Eur. J. For. Res. 2024, 143, 1401–1410. [Google Scholar] [CrossRef] [Scilit]
  35. Su, R.; Wu, Q.; Yang, Y.; Hu, T. Relationship between diameter at breast height and tree age in populations of a rare and endangered plant, Davidia involucrata. Pol. J. Ecol. 2021, 69, 84–95. [Google Scholar] [CrossRef] [Scilit]
  36. Xiang, W.; Li, L.; Ouyang, S.; Xiao, W.; Zeng, L.; Chen, L.; Lei, P.; Deng, X.; Zeng, Y.; Fang, J. Effects of stand age on tree biomass partitioning and allometric equations in Chinese fir (Cunninghamia lanceolata) plantations. Eur. J. For. Res. 2021, 140, 317–332. [Google Scholar] [CrossRef] [Scilit]
  37. Hu, Y.; Kang, X.; Zhao, J. Variable Relationship between Tree Age and Diameter at Breast Height for Natural Forests in Changbai Mountains. J. Northeast. For. Univ. 2009, 37, 38–42. [Google Scholar]
  38. Zhang, X.; Chen, X.; Ji, Y.; Wang, R.; Gao, J. Forest age drives the resource utilization indicators of trees in planted and natural forests in China. Plants 2024, 13, 806. [Google Scholar] [CrossRef] [Scilit] [PubMed]
  39. Tsen, E.W.; Sitzia, T.; Webber, B.L. To core, or not to core: The impact of coring on tree health and a best-practice framework for collecting dendrochronological information from living trees. Biol. Rev. 2016, 91, 899–924. [Google Scholar]
  40. Chen, Y.; Chai, Z. Comparative analysis of volume growth processes of Masson pine and Chinese fir forests in different regions of southern China. PeerJ 2025, 13, e18706. [Google Scholar] [CrossRef] [Scilit]
  41. Ming, A.; Yang, Y.; Liu, S.; Nong, Y.; Li, H.; Tao, Y.; Sun, D.; Lei, L.; Zeng, J.; An, N. The impact of near natural forest management on the carbon stock and sequestration potential of Pinus massoniana (Lamb.) and Cunninghamia lanceolata (Lamb.) Hook. plantations. Forests 2019, 10, 626. [Google Scholar] [CrossRef] [Scilit]
  42. Ye, J.; Yue, C.; Hu, Y.; Ma, H. Spatial patterns of global-scale forest root-shoot ratio and their controlling factors. Sci. Total Environ. 2021, 800, 149251. [Google Scholar] [CrossRef] [Scilit]
  43. He, Y.; Ma, J.; Chen, G. Potential geographical distribution and its multi-factor analysis of Pinus massoniana in China based on the maxent model. Ecol. Indic. 2023, 154, 110790. [Google Scholar] [CrossRef] [Scilit]
  44. Li, Y.; Li, M.; Li, C.; Liu, Z. Optimized maxent model predictions of climate change impacts on the suitable distribution of Cunninghamia lanceolata in China. Forests 2020, 11, 302. [Google Scholar] [CrossRef] [Scilit]
  45. Chen, K.; Ma, L.; Jiang, W.; Wang, L.; Wei, L.; Zhang, H.; Yang, R. Anthropogenic Disturbance and Climate Change Impacts on the Suitable Habitat of Sphenomorphus incognitus in China. Ecol. Evol. 2025, 15, e70848. [Google Scholar] [CrossRef] [Scilit]
  46. Liu, Q.; Huang, Z.; Zou, X.; Ma, X.; Liu, B. Adaptation strategies of Cunninghamia lanceolata seedlings to light intensity gradients based on morpho-physiological trade-offs. Front. Plant Sci. 2025, 16, 1646842. [Google Scholar] [CrossRef] [Scilit]
  47. Chen, Y.; Helliker, B.R.; Tang, X.; Li, F.; Zhou, Y.; Song, X. Stem water cryogenic extraction biases estimation in deuterium isotope composition of plant source water. Proc. Natl. Acad. Sci. USA 2020, 117, 33345–33350. [Google Scholar] [CrossRef] [Scilit]
  48. Liu, Z.; Wang, X.; Jia, G.; Jiang, J.; Liao, B. Introduction of broadleaf tree species can promote the resource use efficiency and gross primary productivity of pure forests. Plant Cell Environ. 2024, 47, 5252–5264. [Google Scholar] [CrossRef] [Scilit]
  49. Loreau, M. Biodiversity and ecosystem functioning: A mechanistic model. Proc. Natl. Acad. Sci. USA 1998, 95, 5632–5636. [Google Scholar] [CrossRef] [Scilit] [PubMed]
  50. Tetzlaff, D.; Buttle, J.; Carey, S.K.; Kohn, M.J.; Laudon, H.; McNamara, J.P.; Smith, A.; Sprenger, M.; Soulsby, C. Stable isotopes of water reveal differences in plant–soil water relationships across northern environments. Hydrol. Process. 2021, 35, e14023. [Google Scholar] [CrossRef] [Scilit]
  51. Mathias, J.M.; Thomas, R.B. Global tree intrinsic water use efficiency is enhanced by increased atmospheric CO2 and modulated by climate and plant functional types. Proc. Natl. Acad. Sci. USA 2021, 118, e2014286118. [Google Scholar] [CrossRef] [Scilit] [PubMed]
  52. Ali, A.; Yan, E.-R.; Chen, H.Y.; Chang, S.X.; Zhao, Y.-T.; Yang, X.-D.; Xu, M.-S. Stand structural diversity rather than species diversity enhances aboveground carbon storage in secondary subtropical forests in Eastern China. Biogeosciences 2016, 13, 4627–4635. [Google Scholar] [CrossRef] [Scilit]
  53. Wen, G.; Ma, J.; Xu, W.; Wang, J.; He, W.; Wang, Y.; Wang, X.; Li, T.; Ye, M.; Chen, G. Response of understory plant functional groups to changes in stand spatial structure in Masson pine (Pinus massoniana Lamb.) plantations depends on thinning mode and intensity. J. Environ. Manag. 2025, 376, 124441. [Google Scholar] [CrossRef] [Scilit]
  54. Wang, H.; Wu, F.; Li, M.; Zhu, X.; Shi, C.; Ding, G. Morphological and physiological responses of Pinus massoniana seedlings to different light gradients. Forests 2021, 12, 523. [Google Scholar] [CrossRef] [Scilit]
  55. Kovács, B.; Tinya, F.; Ódor, P. Stand structural drivers of microclimate in mature temperate mixed forests. Agric. For. Meteorol. 2017, 234, 11–21. [Google Scholar] [CrossRef] [Scilit]
  56. Cheng, F.; Zhao, X.; Luo, Y.; Tian, J.; Sun, Y.; Wang, H.; Wang, Q.; Zhu, J.; Yang, C.; He, H. Effects of thinning on canopy structure, forest productivity, and productivity stability in mixed conifer-broadleaf forest: Insights from a LiDAR survey. J. Environ. Manag. 2025, 385, 125707. [Google Scholar] [CrossRef] [Scilit] [PubMed]
  57. Clark, D.B.; Clark, D.A. Landscape-scale variation in forest structure and biomass in a tropical rain forest. For. Ecol. Manag. 2000, 137, 185–198. [Google Scholar] [CrossRef] [Scilit]
  58. Gama, M.; Crespo, D.; Dolbeth, M.; Anastácio, P.M. Ensemble forecasting of Corbicula fluminea worldwide distribution: Projections of the impact of climate change. Aquat. Conserv. 2017, 27, 675–684. [Google Scholar] [CrossRef] [Scilit]
  59. Coetzee, B.W.; Robertson, M.P.; Erasmus, B.F.; Van Rensburg, B.J.; Thuiller, W. Ensemble models predict Important Bird Areas in southern Africa will become less effective for conserving endemic birds under climate change. Glob. Ecol. Biogeogr. 2009, 18, 701–710. [Google Scholar] [CrossRef] [Scilit]
Figure 1. Study area.
Life 16 00277 g001
Figure 2. Relationship diagram of DBH and biomass in C. lanceolata and P. massoniana. (a) Biomass allocation by organs and DBH histogram for C. lanceolata and P. massoniana; (b) relationship between DBH and biomass of C. lanceolata and P. massoniana; (c) statistical chart of biomass accumulation rate for C. lanceolata and P. massoniana. Biomass accumulation rate: rate of increase in biomass per 5 cm increase in DBH.
Life 16 00277 g002
Figure 3. Factor contribution degrees and response curve diagrams of C. lanceolata and P. massoniana.
Life 16 00277 g003
Figure 4. Principal component analysis (PCA) plot of environmental factors. (a) Environmental factors in C. lanceolata; (b) environmental factors in P. massoniana; (c) PCA percentage of variance in C. lanceolata; (d) PCA percentage of variance in P. massoniana.
Life 16 00277 g004
Figure 5. The relationship between the species diversity, structural diversity, basal area, and biomass of two coniferous species. (a) The relationship between the species diversity and biomass of C. lanceolata. (b) The relationship between the structural diversity and biomass of C. lanceolata. (c) The relationship between the basal area and biomass of C. lanceolata. (d) The relationship between the species diversity and biomass of P. massoniana. (e) The relationship between the structural diversity and biomass of P. massoniana. (f) The relationship between the basal area and biomass of P. massoniana. H, Shannon–Wiener index; BA, forest basal area. CVTH, coefficient of variation in tree height.
Life 16 00277 g005
Figure 6. Structural equation model after optimization presenting the effects of environmental variables, broad-leaved tree proportion, plant species diversity, forest basal area, and stand structural diversity on biomass. (a) Path diagrams of factors influencing changes in C. lanceolata biomass; (b) path diagrams of factors influencing changes in P. massoniana. (c) Total direct and indirect effects combined in C. lanceolata biomass. (d) Total direct and indirect effects combined in P. massoniana biomass. Env PC1, environmental PC1; Env PC2, environmental PC2; H, Shannon–Wiener index; BTP, broad-leaved tree proportion; BA, forest basal area. CVTH, coefficient of variation in tree height. All variables were Z-score-transformed prior to analysis. *: p < 0.05,**: p < 0.01,***: p < 0.001.
Life 16 00277 g006
Figure 7. Responses of different growth stages of C. lanceolata and P. massoniana to biodiversity, structural diversity, and biological growth factors. (a) The impact of H on the biomass of C. lanceolata with a diameter at DBH less than 11 cm; (b) The impact of H on the biomass of C. lanceolata with a diameter at DBH greater than 11 cm; (c) The impact of CVTH on the biomass of P. massoniana with a diameter at DBH less than 10 cm; (d) The impact of CVTH on the biomass of P. massoniana with a diameter at DBH greater than 10 cm; (e) The impact of BA on the biomass of C. lanceolata with a diameter at DBH less than 11 cm; (f) The impact of BA on the biomass of C. lanceolata with a diameter at DBH greater than 11 cm; (g) The impact of BA on the biomass of P. massoniana with a diameter at DBH less than 10 cm; (h) The impact of BA on the biomass of P. massoniana with a diameter at DBH greater than 10 cm.
Life 16 00277 g007
Table 1. Detailed information of the study sites.
Study SiteC. lanceolataP. massoniana
Number of sample plots8554
Number of trees30291013
Longitude (°)118.80–120.28118.80–120.28
Latitude (°)27.58–28.7127.78–28.71
Altitude (m)136–1141136–667
Mean annual temperature (°C)13.24–17.5915.15–17.59
Mean annual precipitation (mm)1478–19471478–1758
Table 2. The relationship between different DBH classes and biomass of C. lanceolata and P. massoniana.
SpeciesDBH (cm)Average BiomassTotal Biomass CV (%)Tree Number
Trunk (kg)Crown (kg)Root (kg)Total (kg)
Cunninghamia lanceolata5–109.424.374.5418.3438.711114
11–1525.4210.1411.7047.2624.06907
16–2046.2517.6921.9685.9017.83641
21–2574.1427.4436.11137.6913.80268
25–30111.7241.3757.98211.0712.3695
>30194.3572.15110.27376.77/4
Pinus massoniana5–1012.213.814.1820.2154.06278
11–1544.859.5212.3266.6930.55301
16–2086.8716.4323.12126.4318.83196
21–25138.6825.4241.05205.1517.04104
25–30264.8942.5677.21384.6715.7392
>30481.0274.67155.48711.17/42
Table 3. Component loadings and eigenvalues of principal components (PCs) chosen from PCA for environmental factors.
SpeciesEnvironmental FactorsEnv PC1Env PC2
Cunninghamia lanceolataAltitude (m) 0.51 −0.18
Slope (°)0.100.32
Aspect (°)0.03−0.23
Bio 02−0.37−0.51
Bio 05−0.570.06
Bio 08−0.320.18
Bio 15−0.03−0.71
Bio 170.40−0.12
Cumulative proportion explained35.8255.95
Pinus massonianaAltitude (m)0.49−0.29
Slope (°)0.24−0.46
Aspect (°)0.190.73
Bio 01−0.430.13
Bio 04−0.41−0.38
Bio 180.560.03
Cumulative proportion explained48.4770.25
Disclaimer/Publisher’s Note: The statements, opinions and data contained in all publications are solely those of the individual author(s) and contributor(s) and not of MDPI and/or the editor(s). MDPI and/or the editor(s) disclaim responsibility for any injury to people or property resulting from any ideas, methods, instructions or products referred to in the content.