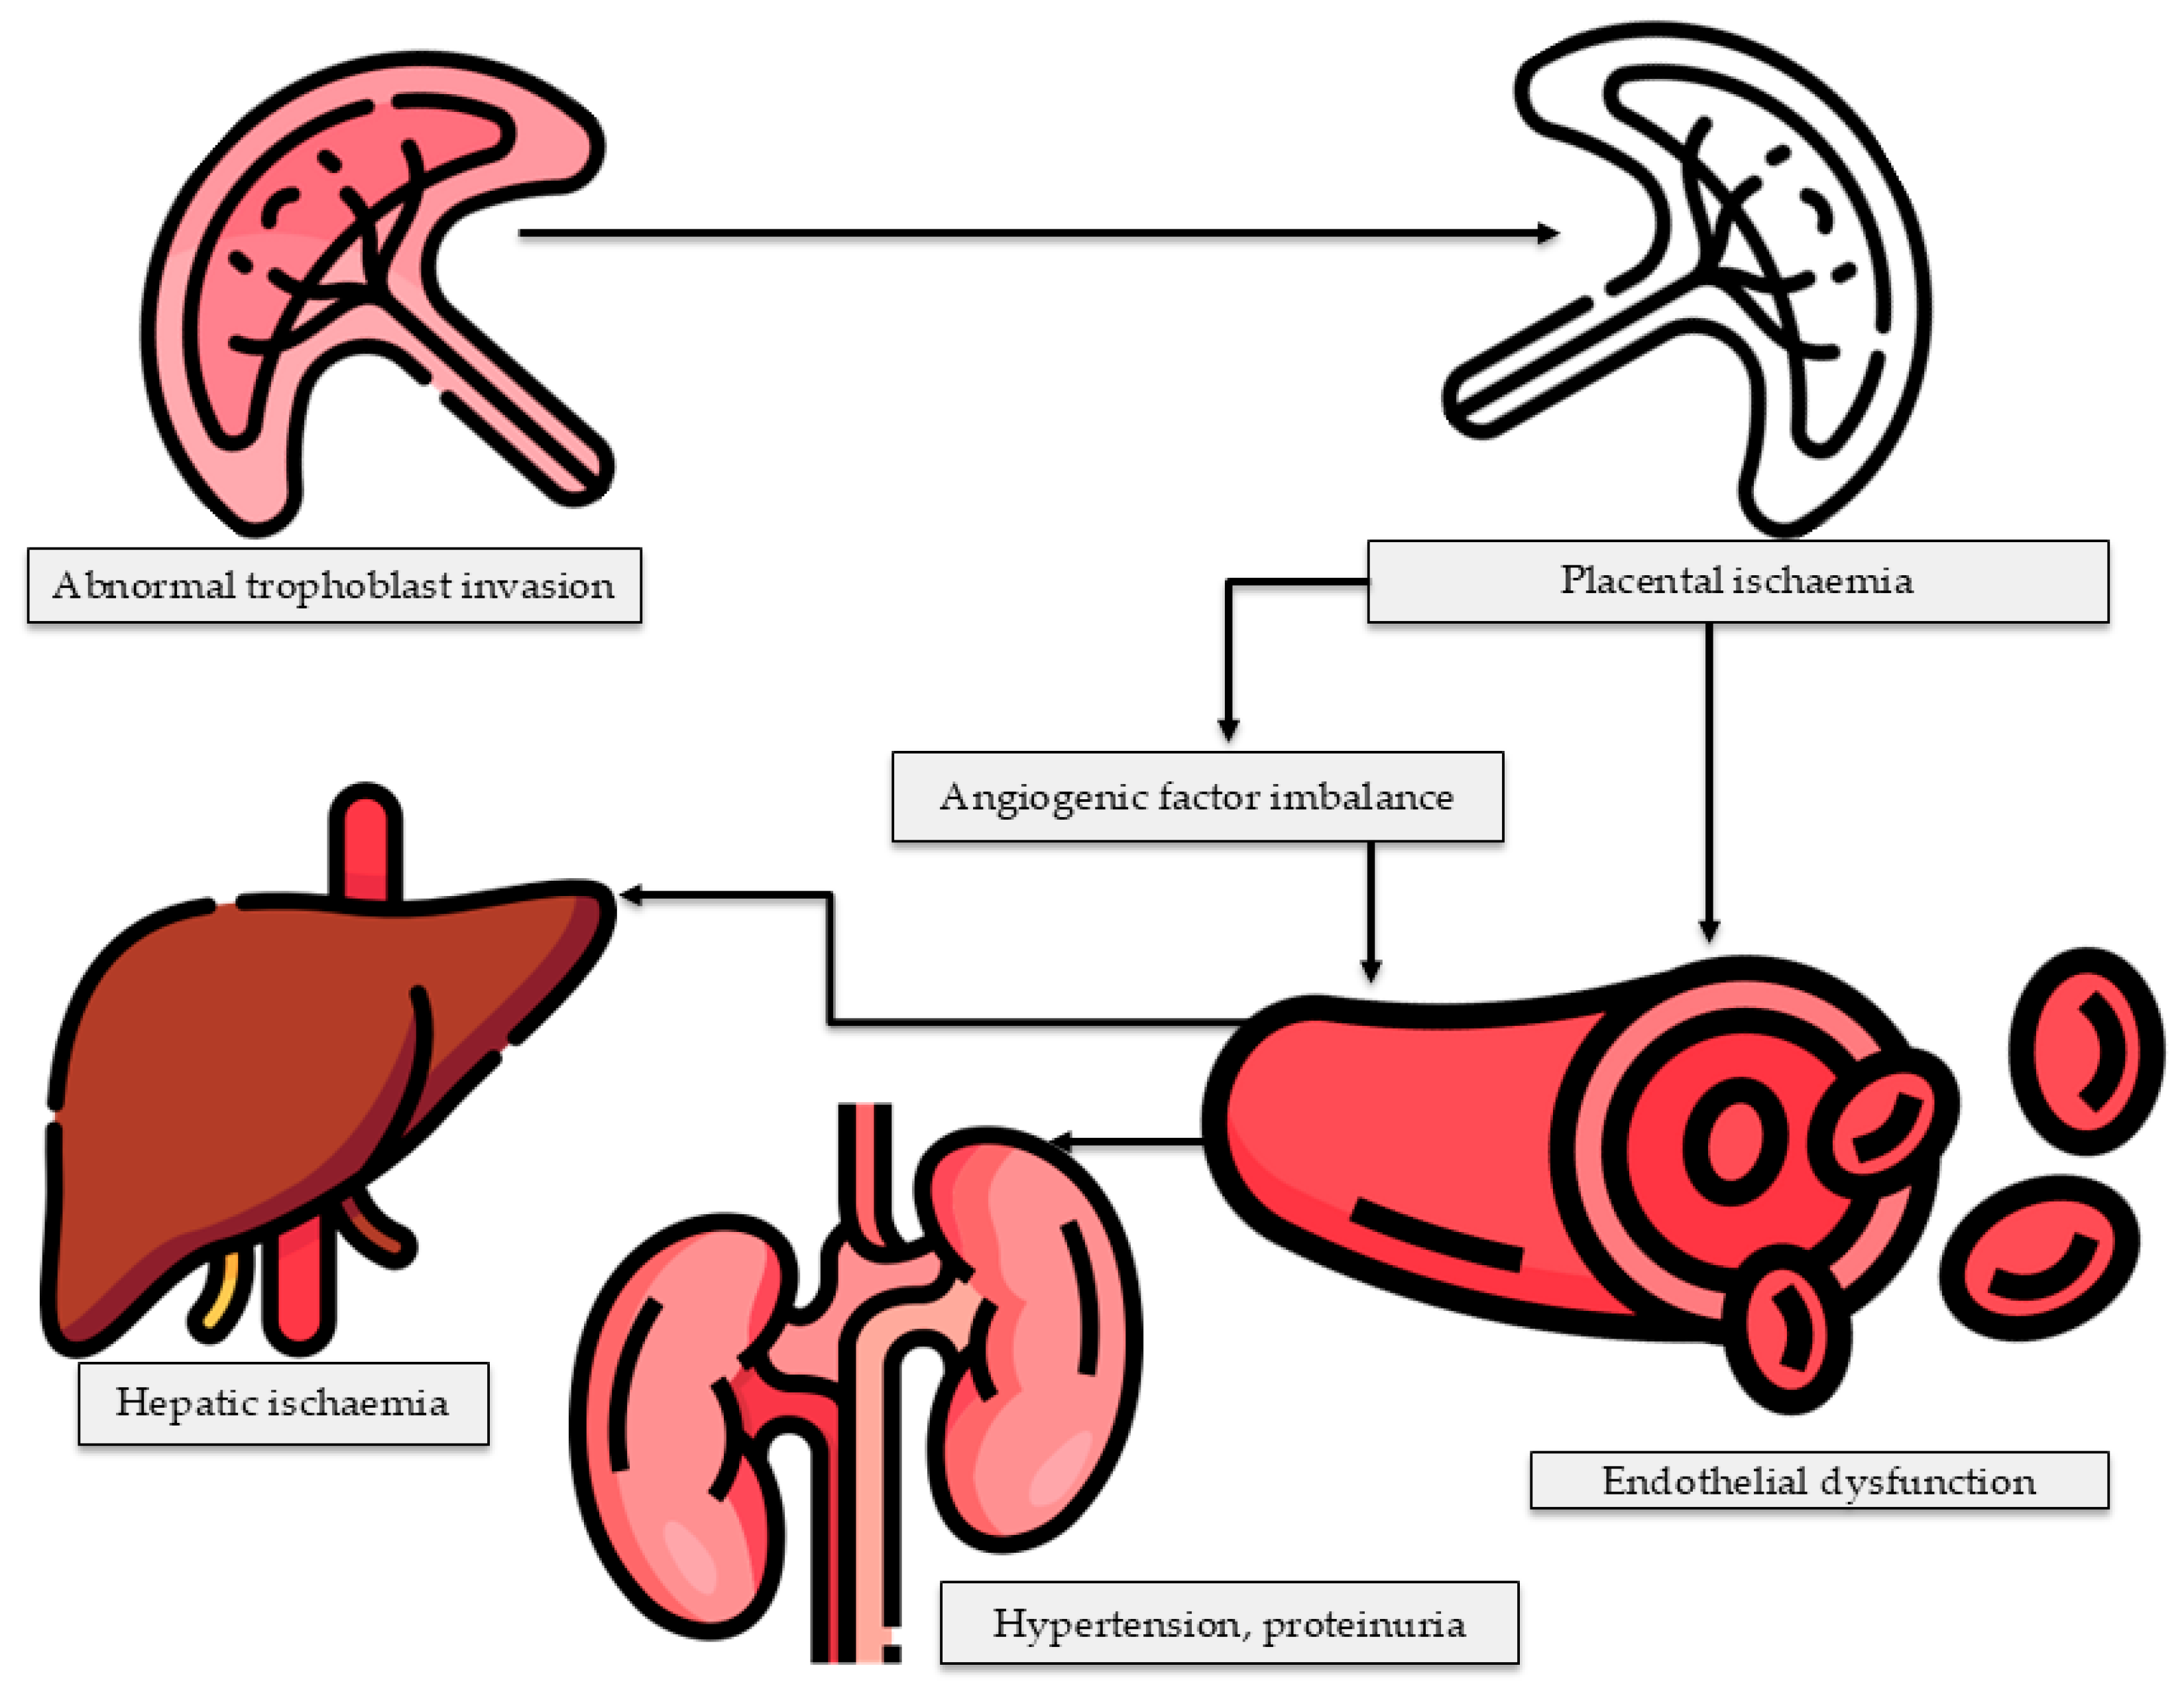
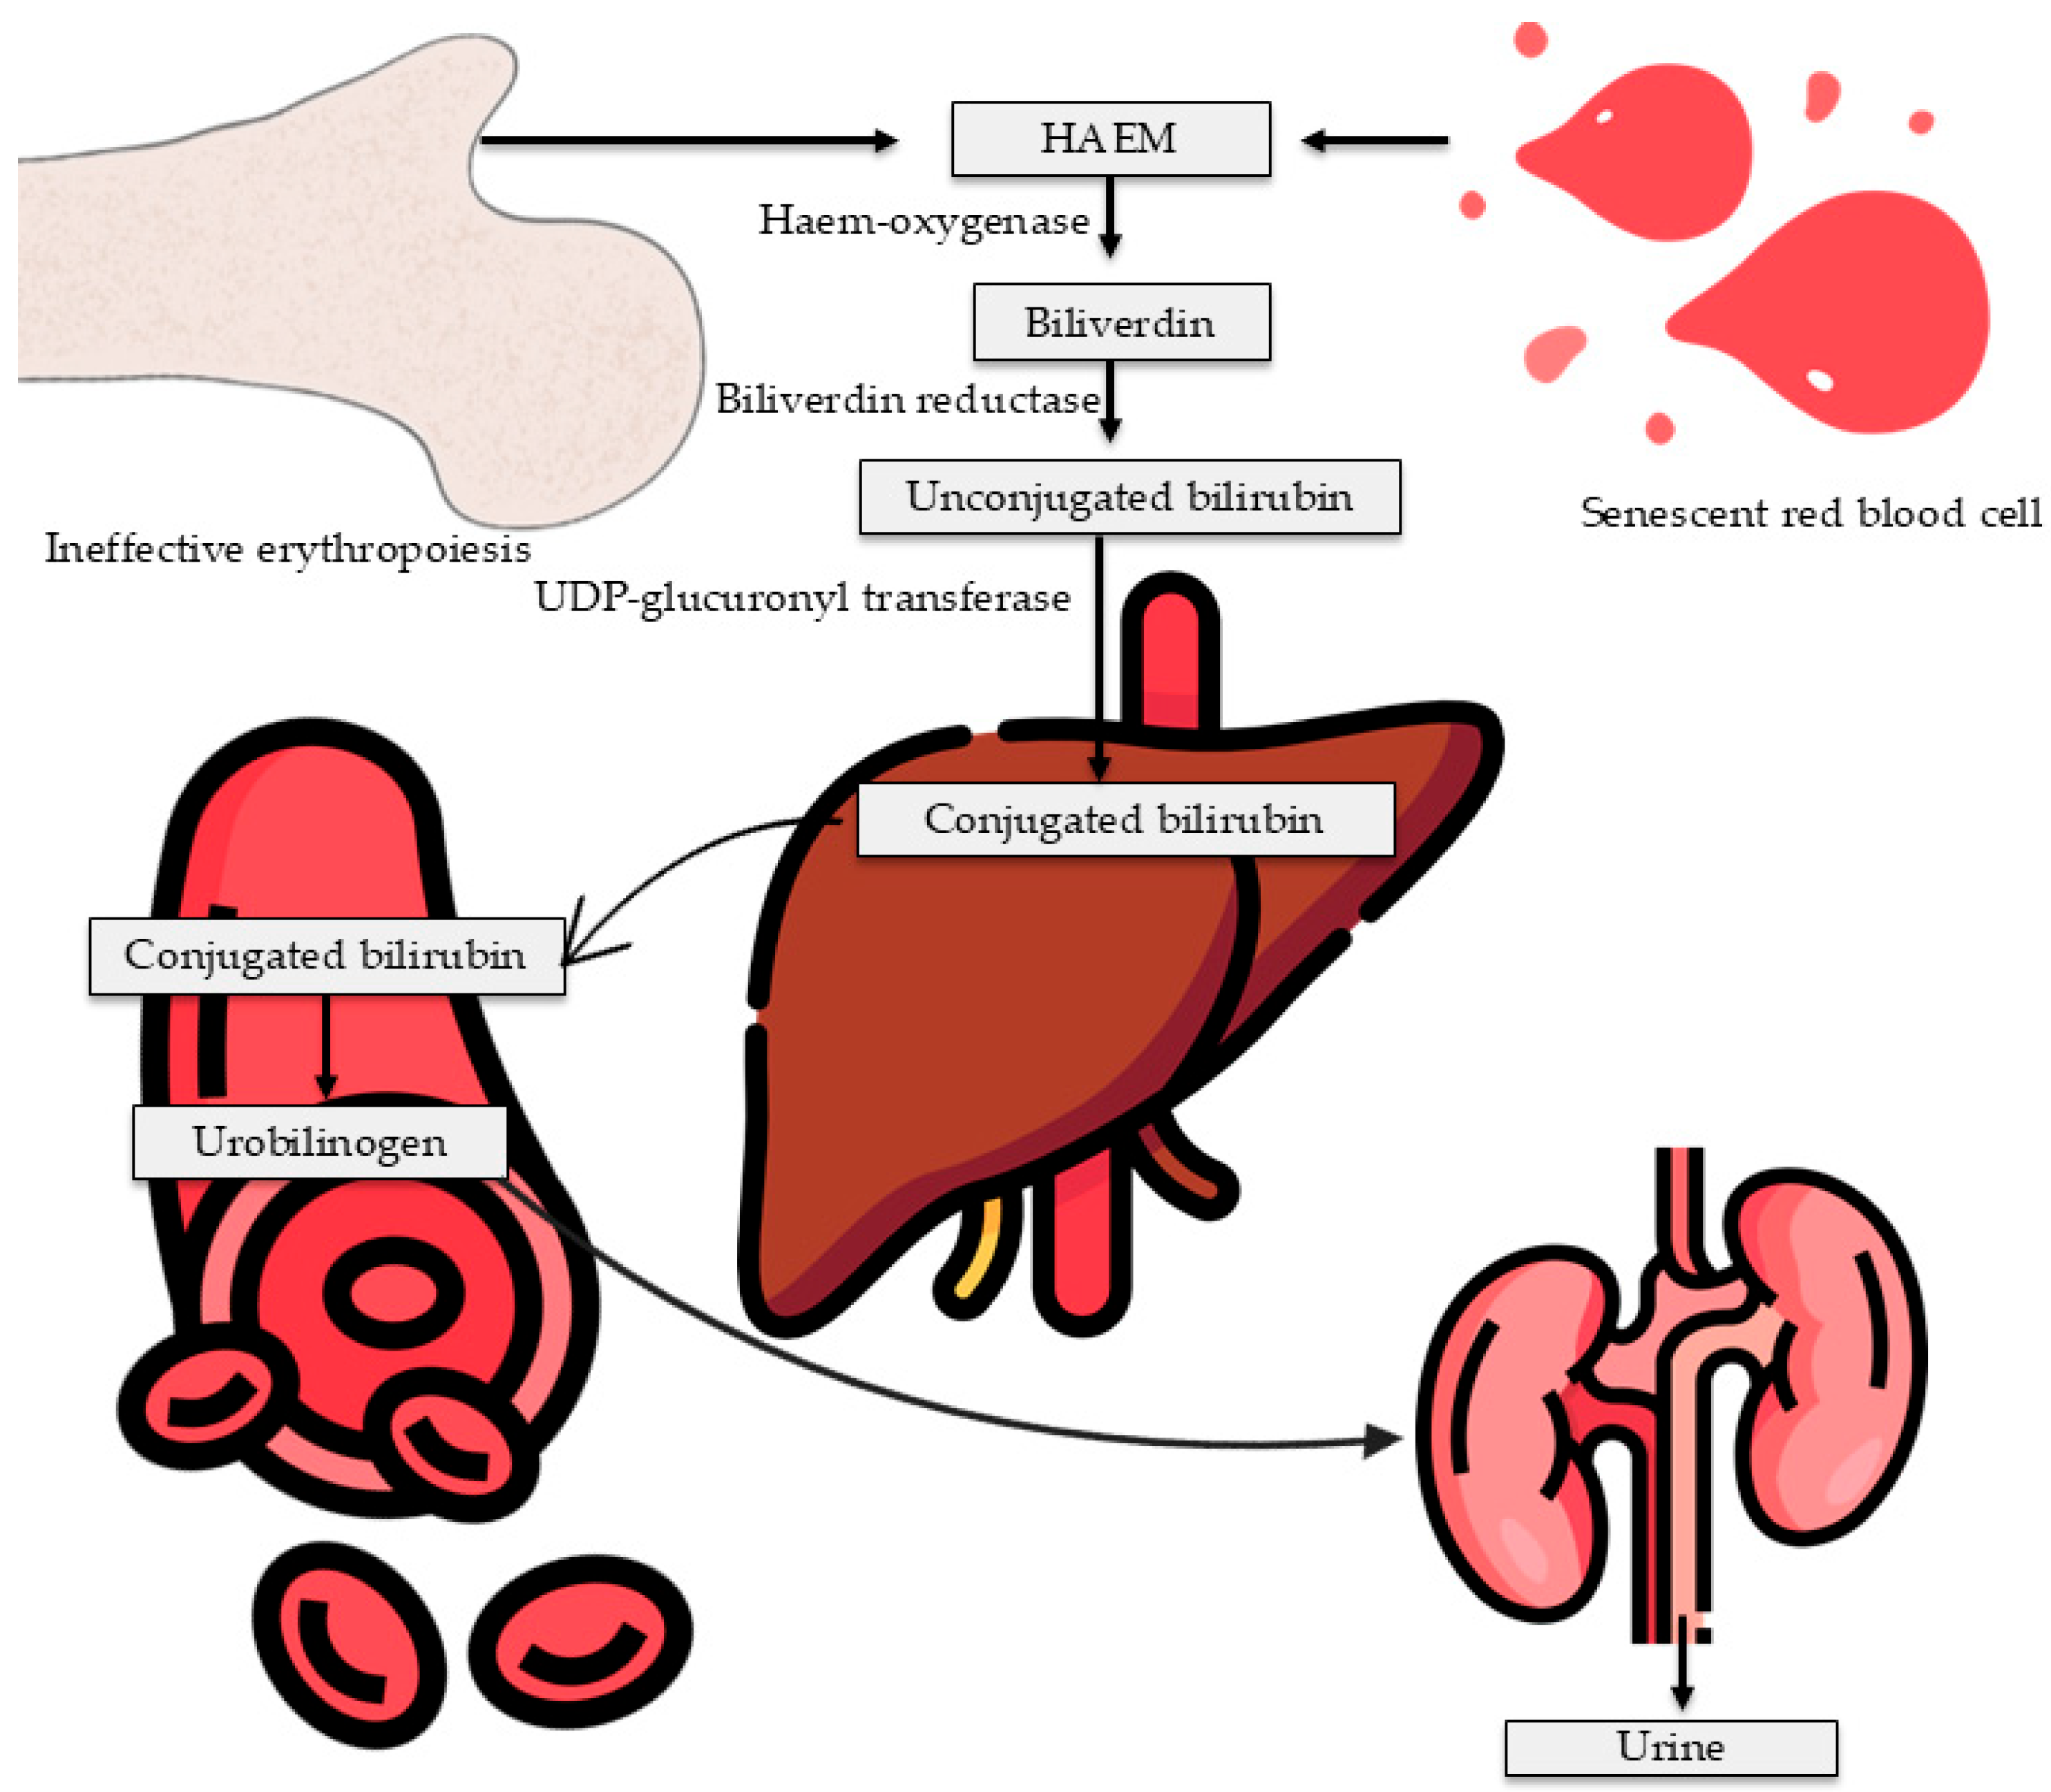
Pre-Eclampsia-Induced Maternal Liver Dysfunction: Systematic Review, Meta-Analysis and Meta-Regression of Observation Studies

Abstract
1. Introduction
2. Methodology
2.1. Study Design
2.2. Search Strategy, Literature Search, and Selection Criteria
2.3. Data Extraction and Quality Assurance
2.4. Statistical Analysis
3. Results
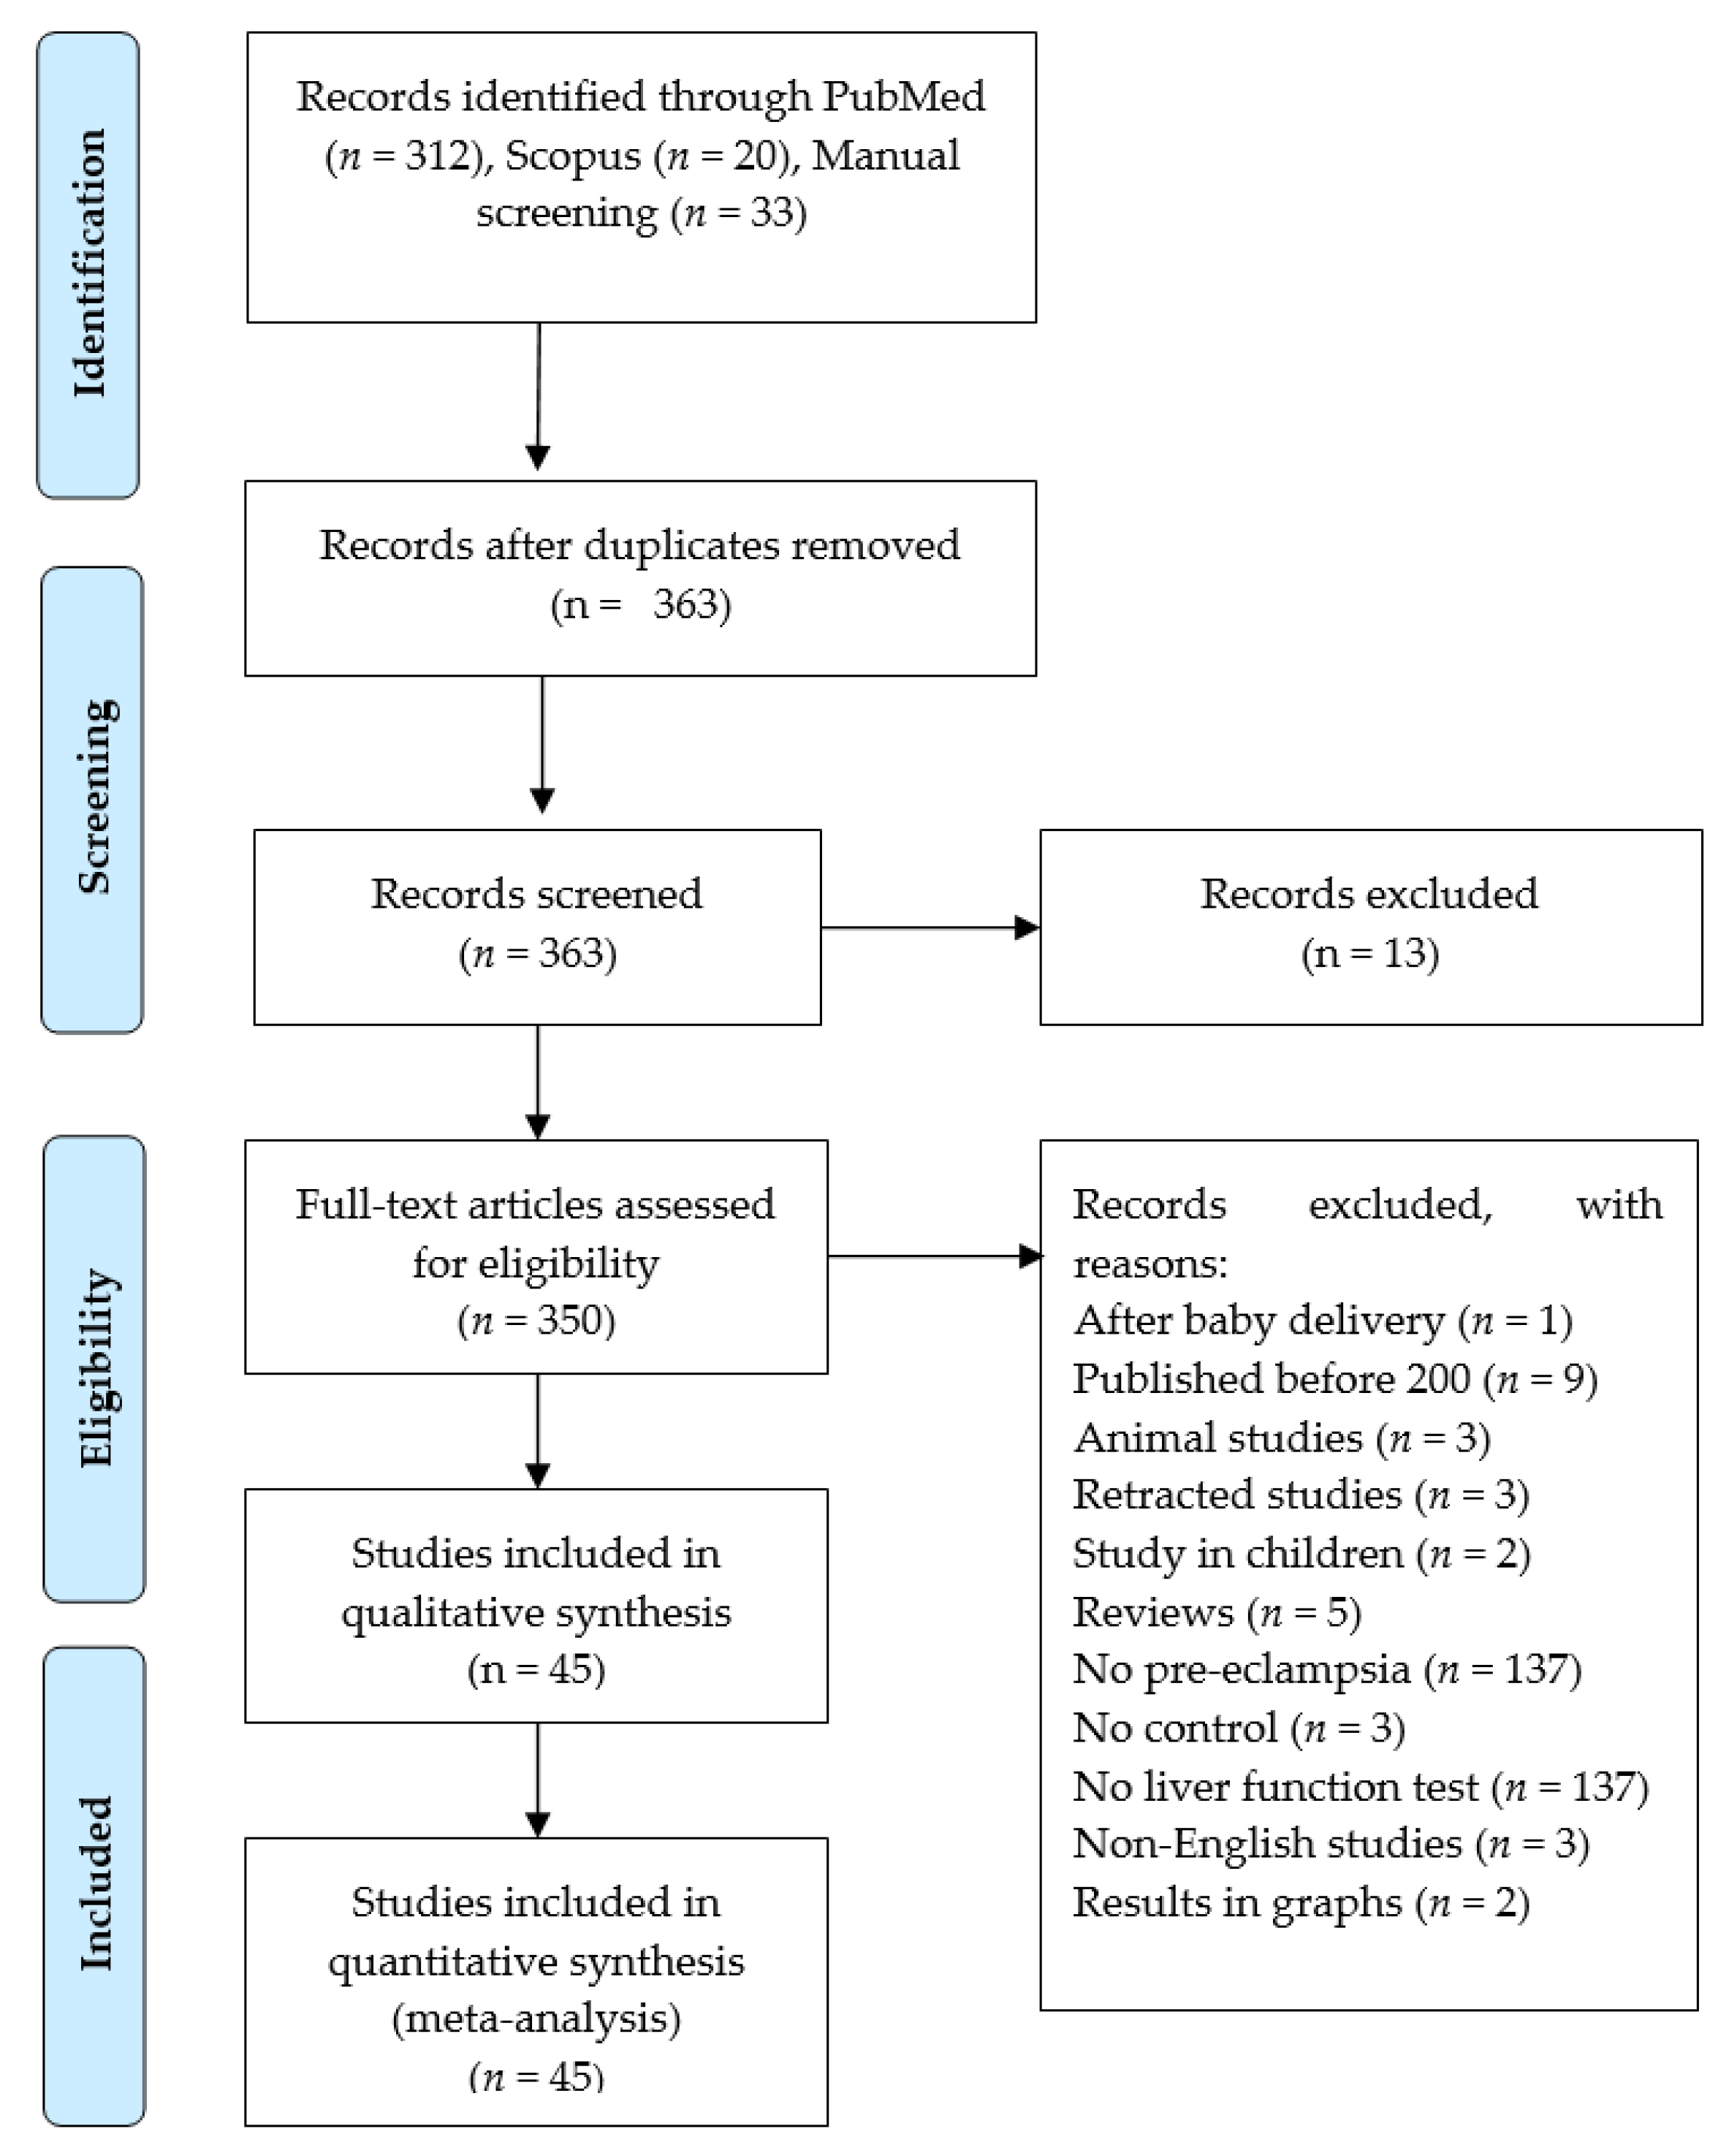
3.1. Literature Search and Screening
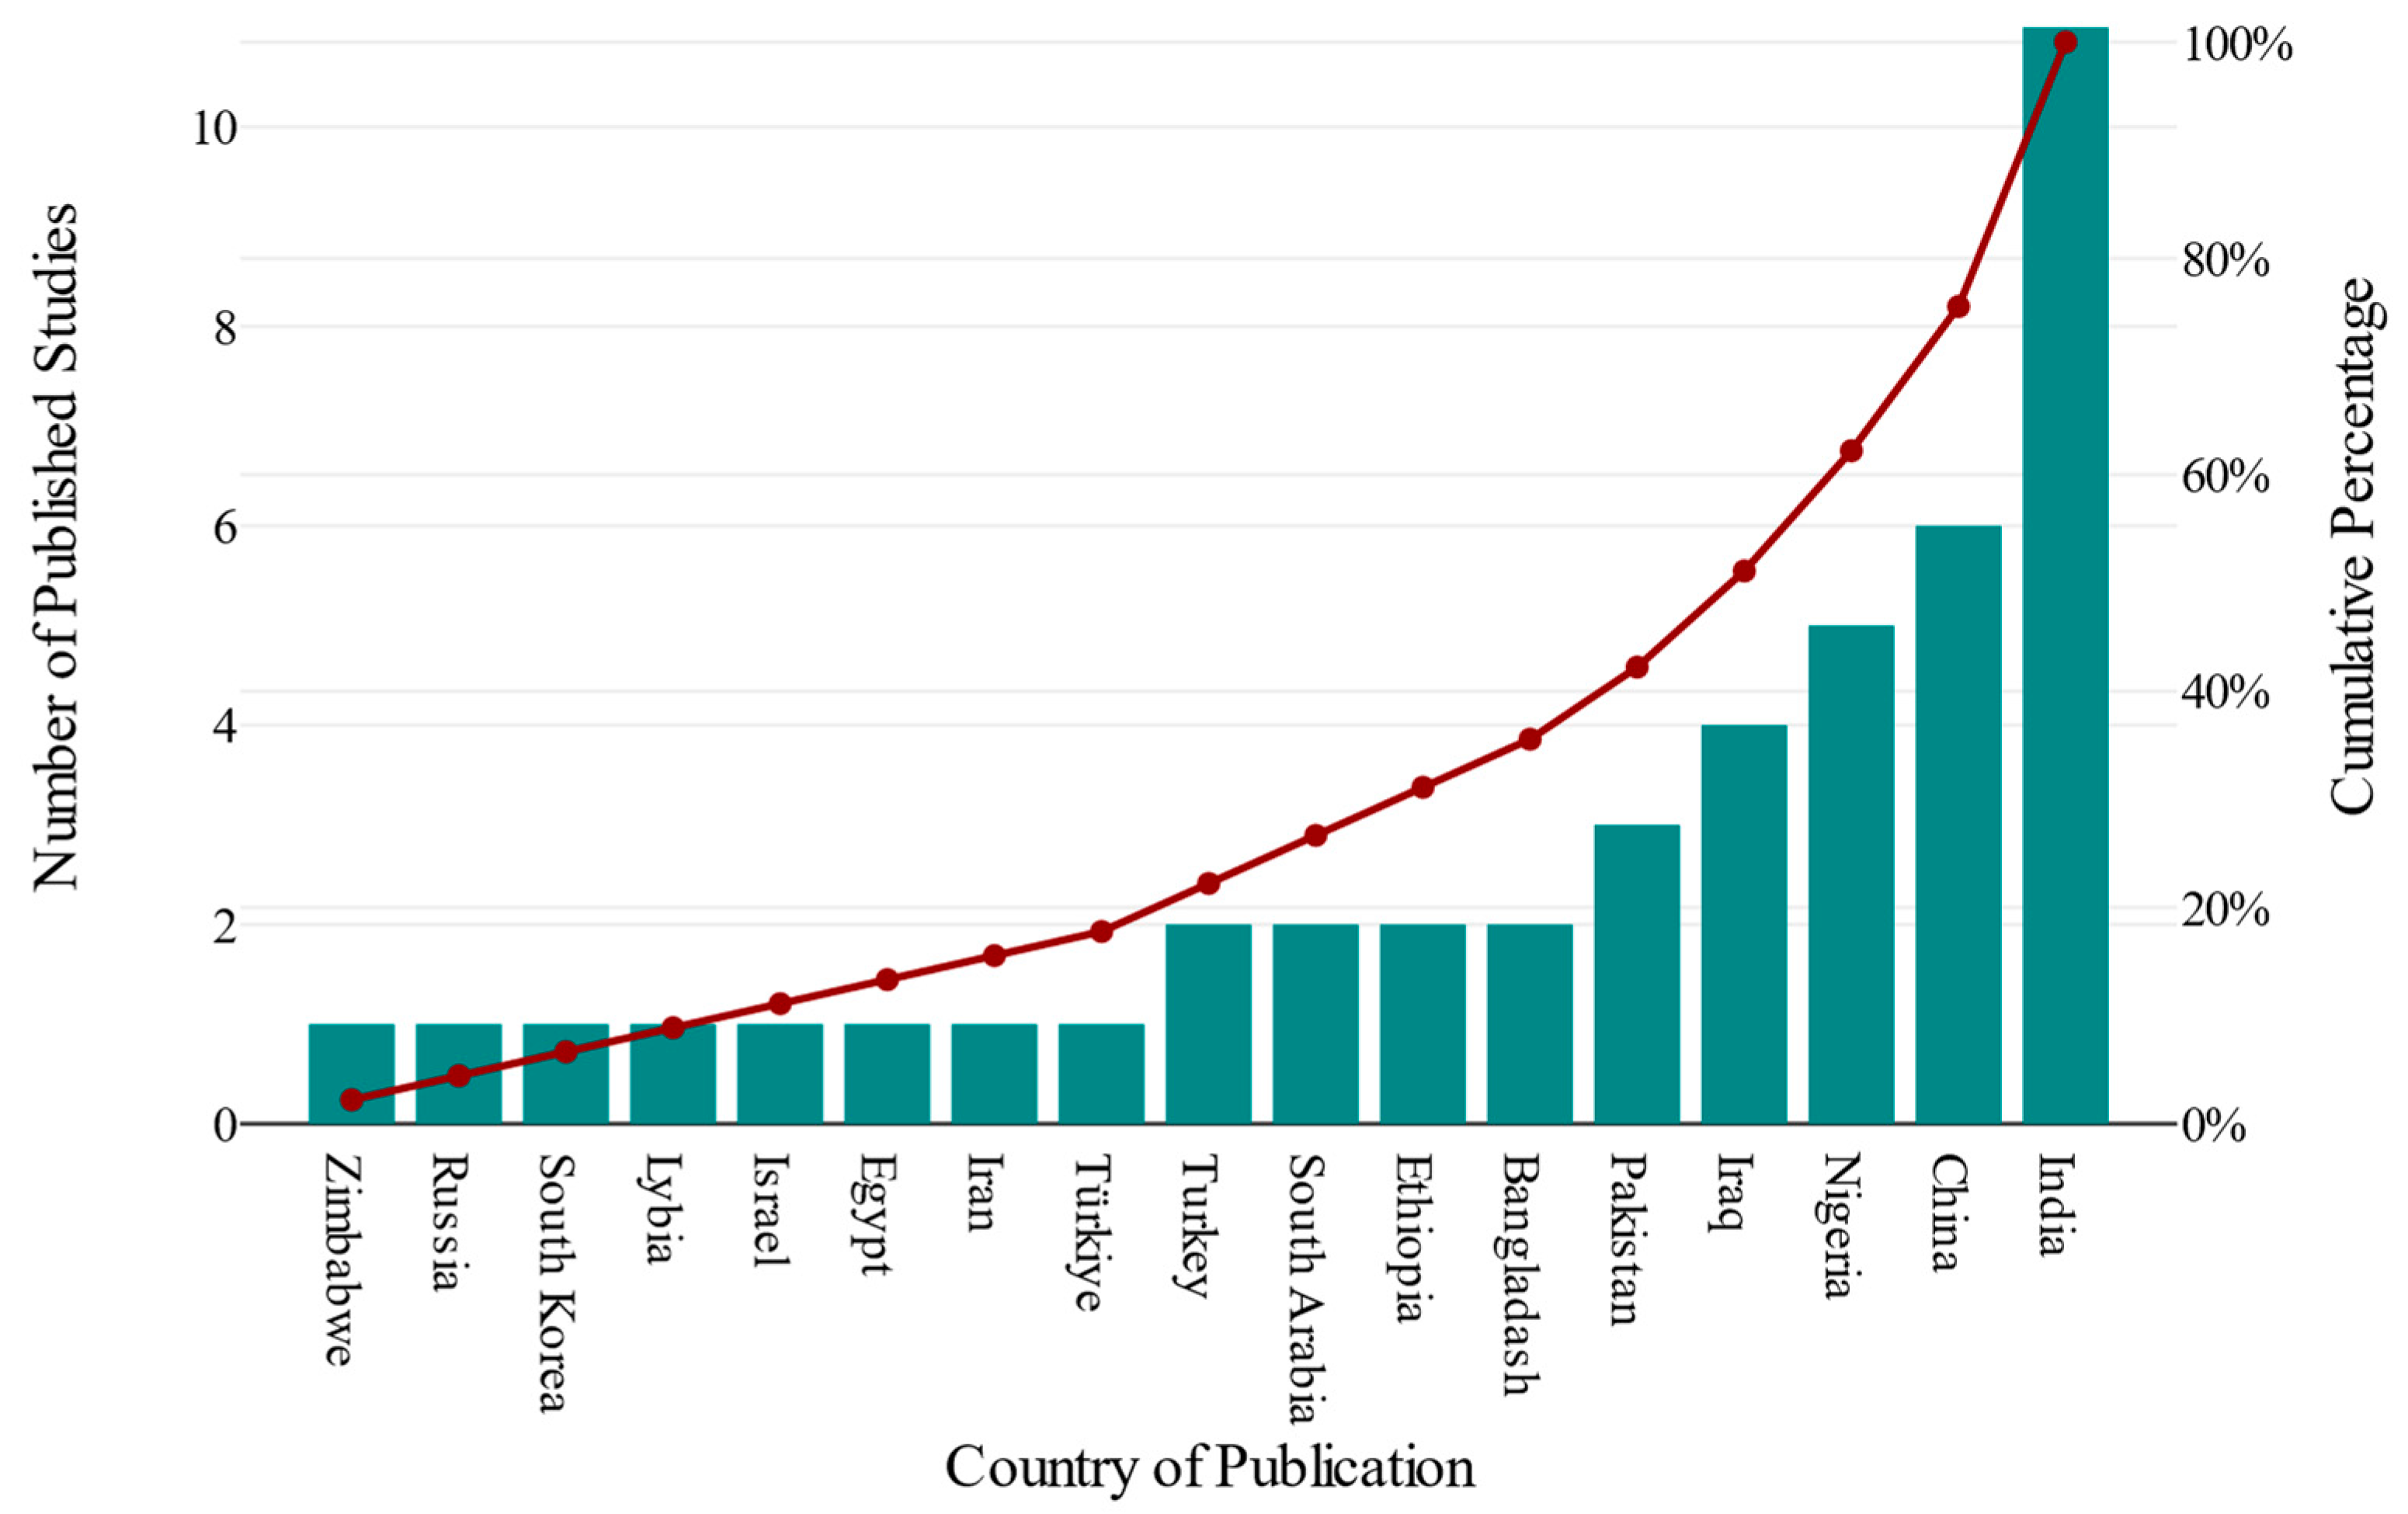
3.2. Characteristics of the Studies Included
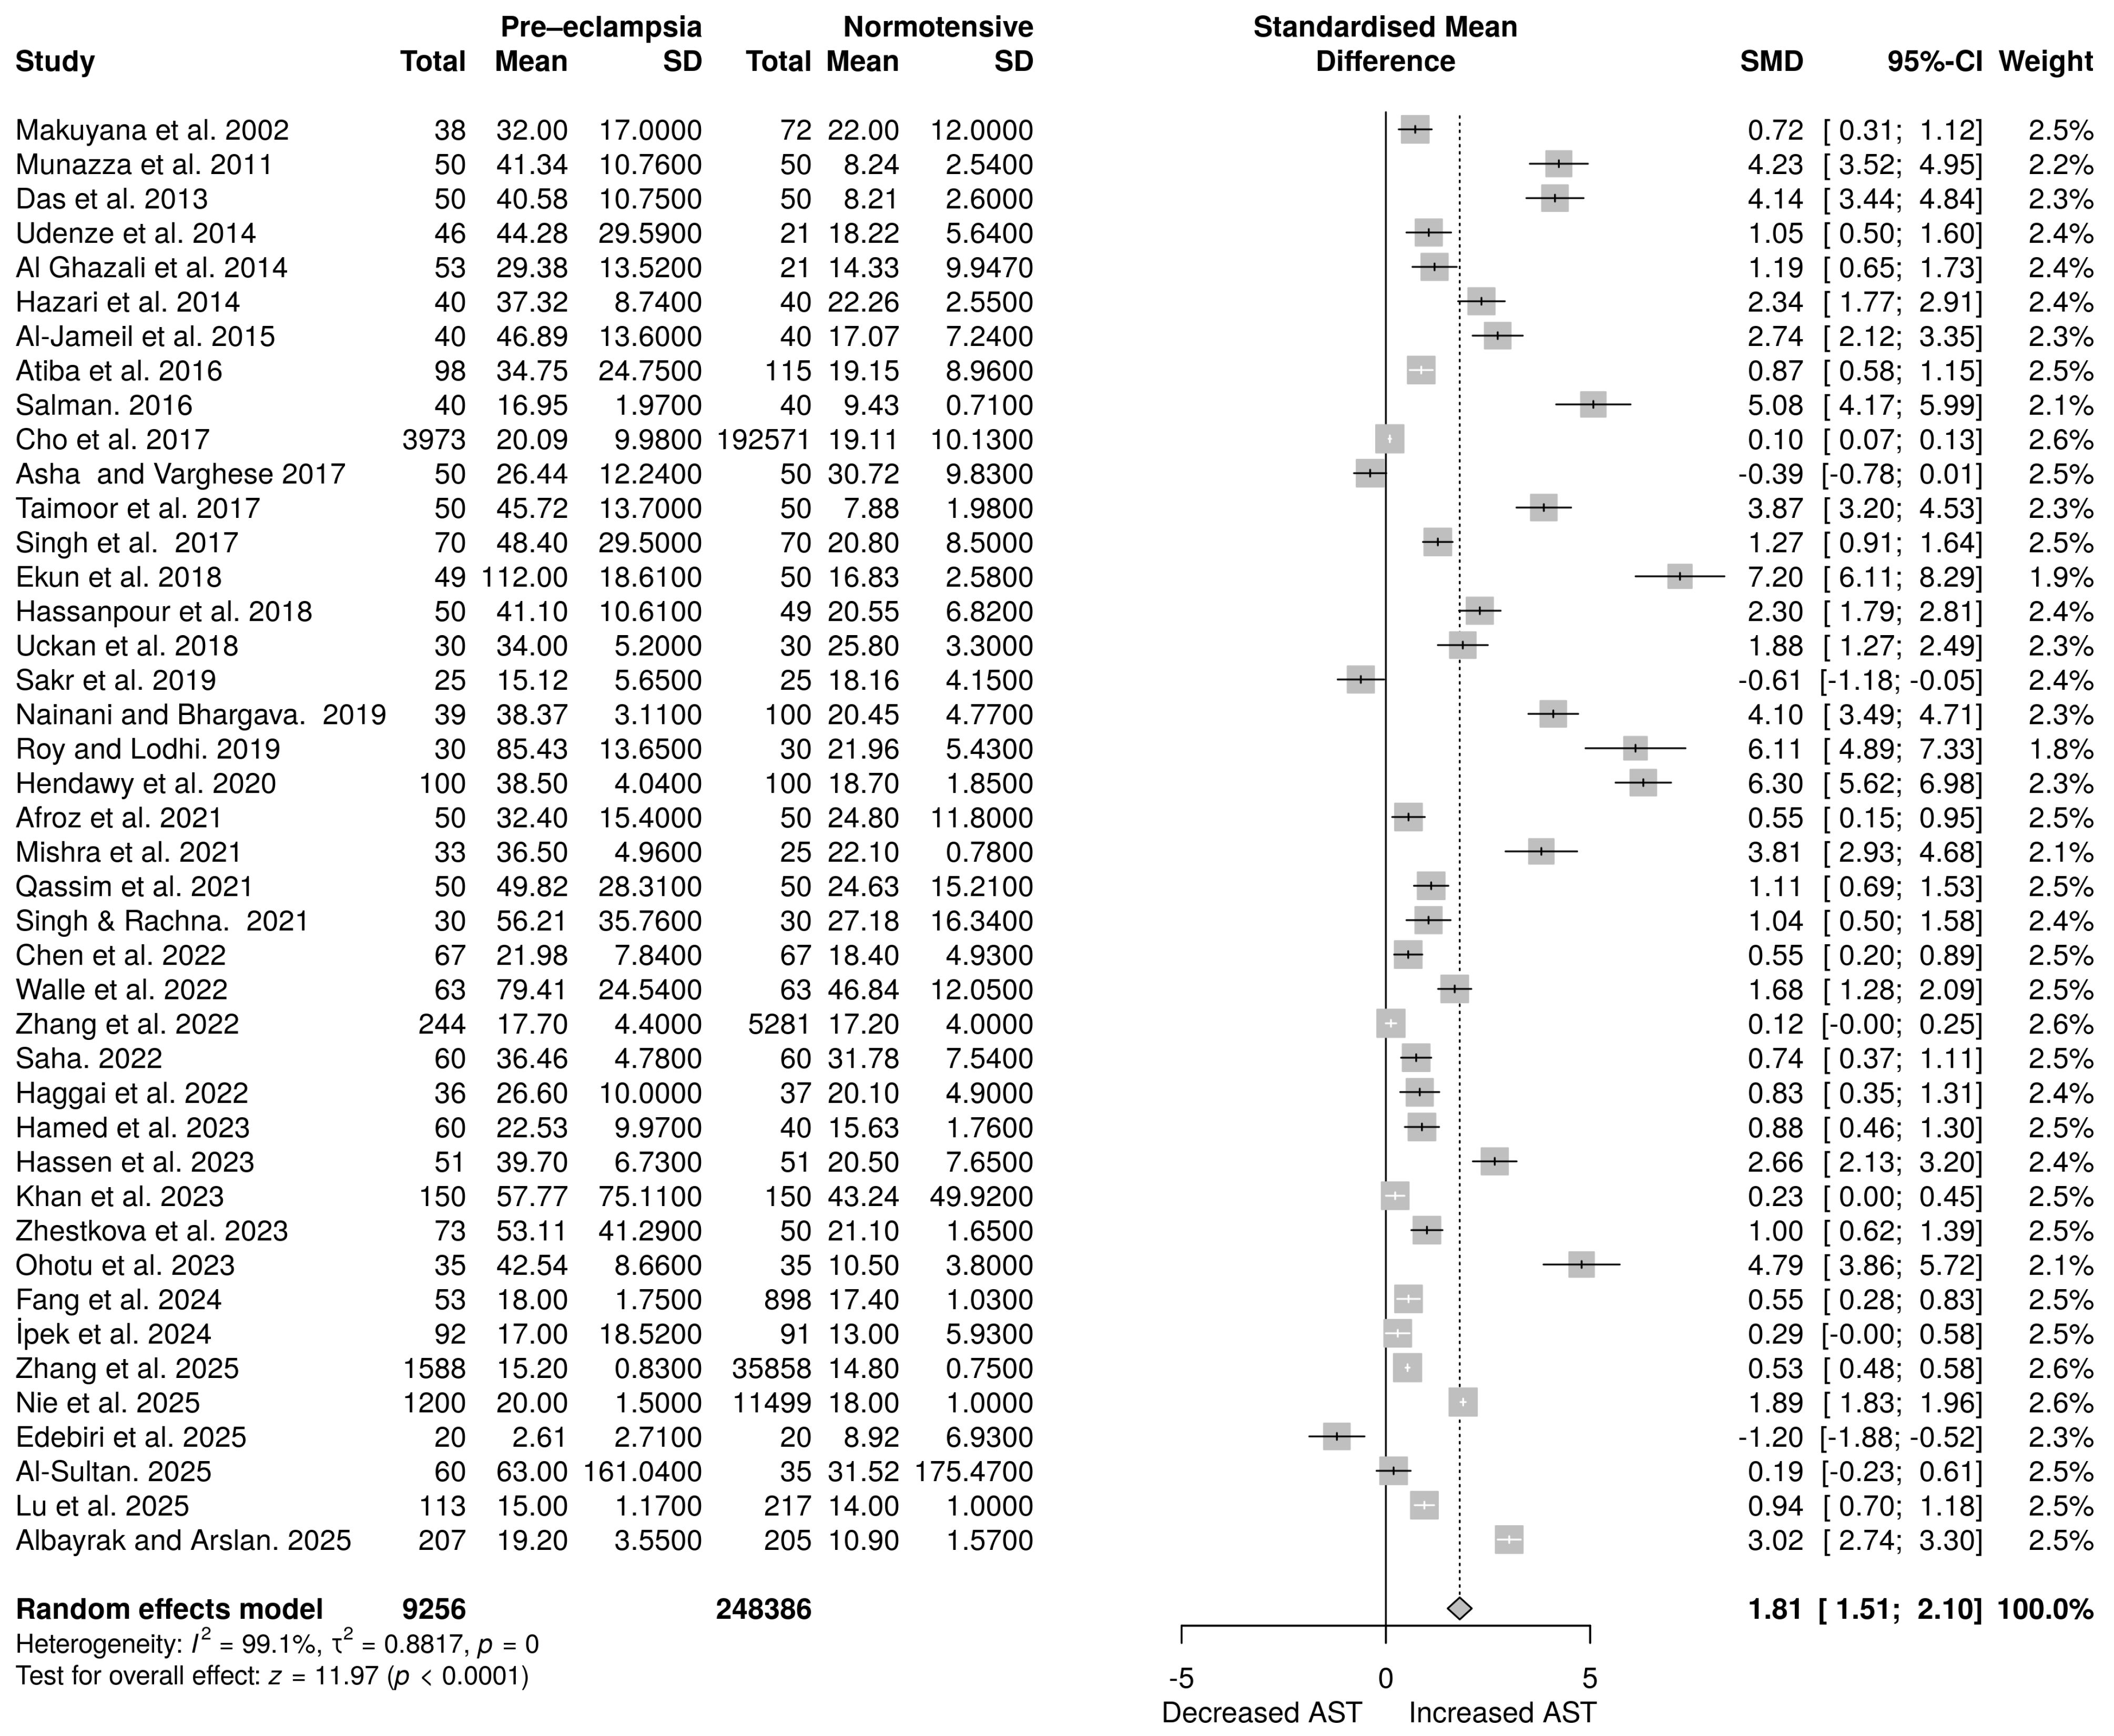
3.3. AST Levels in Pregnant Women with Pre-Eclampsia Versus Normotensive Pregnant Women
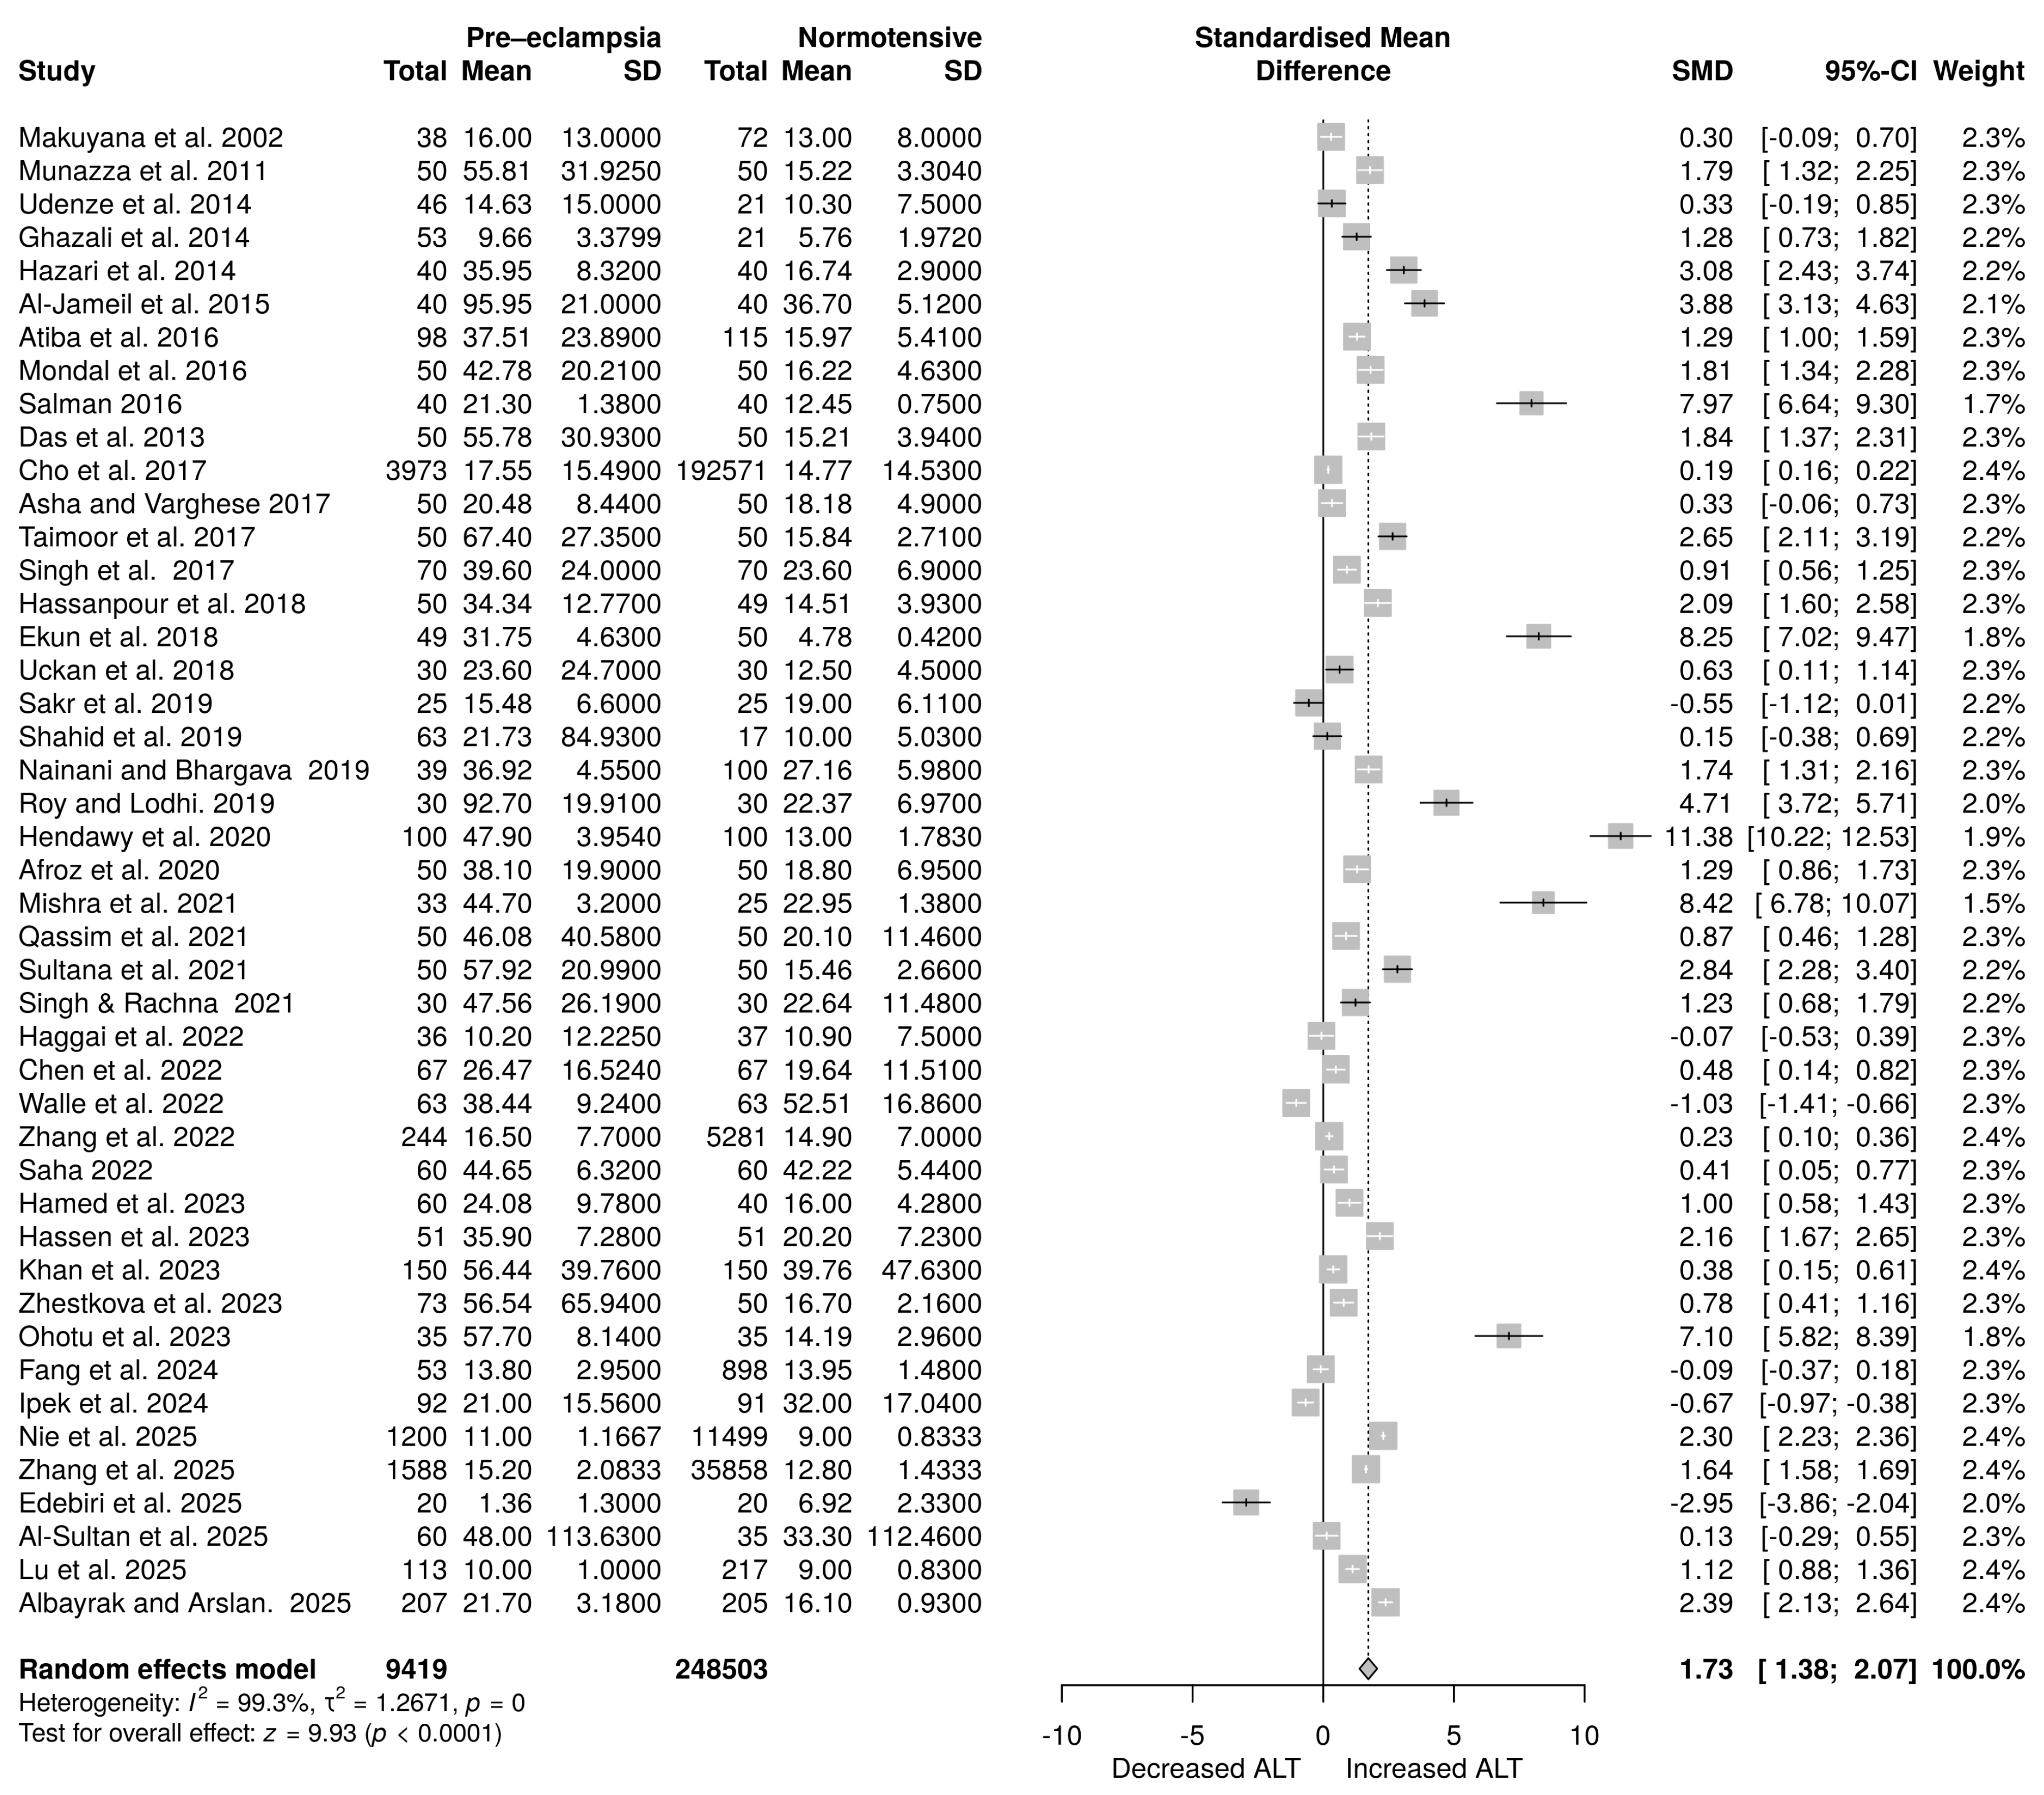
3.4. ALT Levels in Pre-Eclampsia Compared to Normotensive
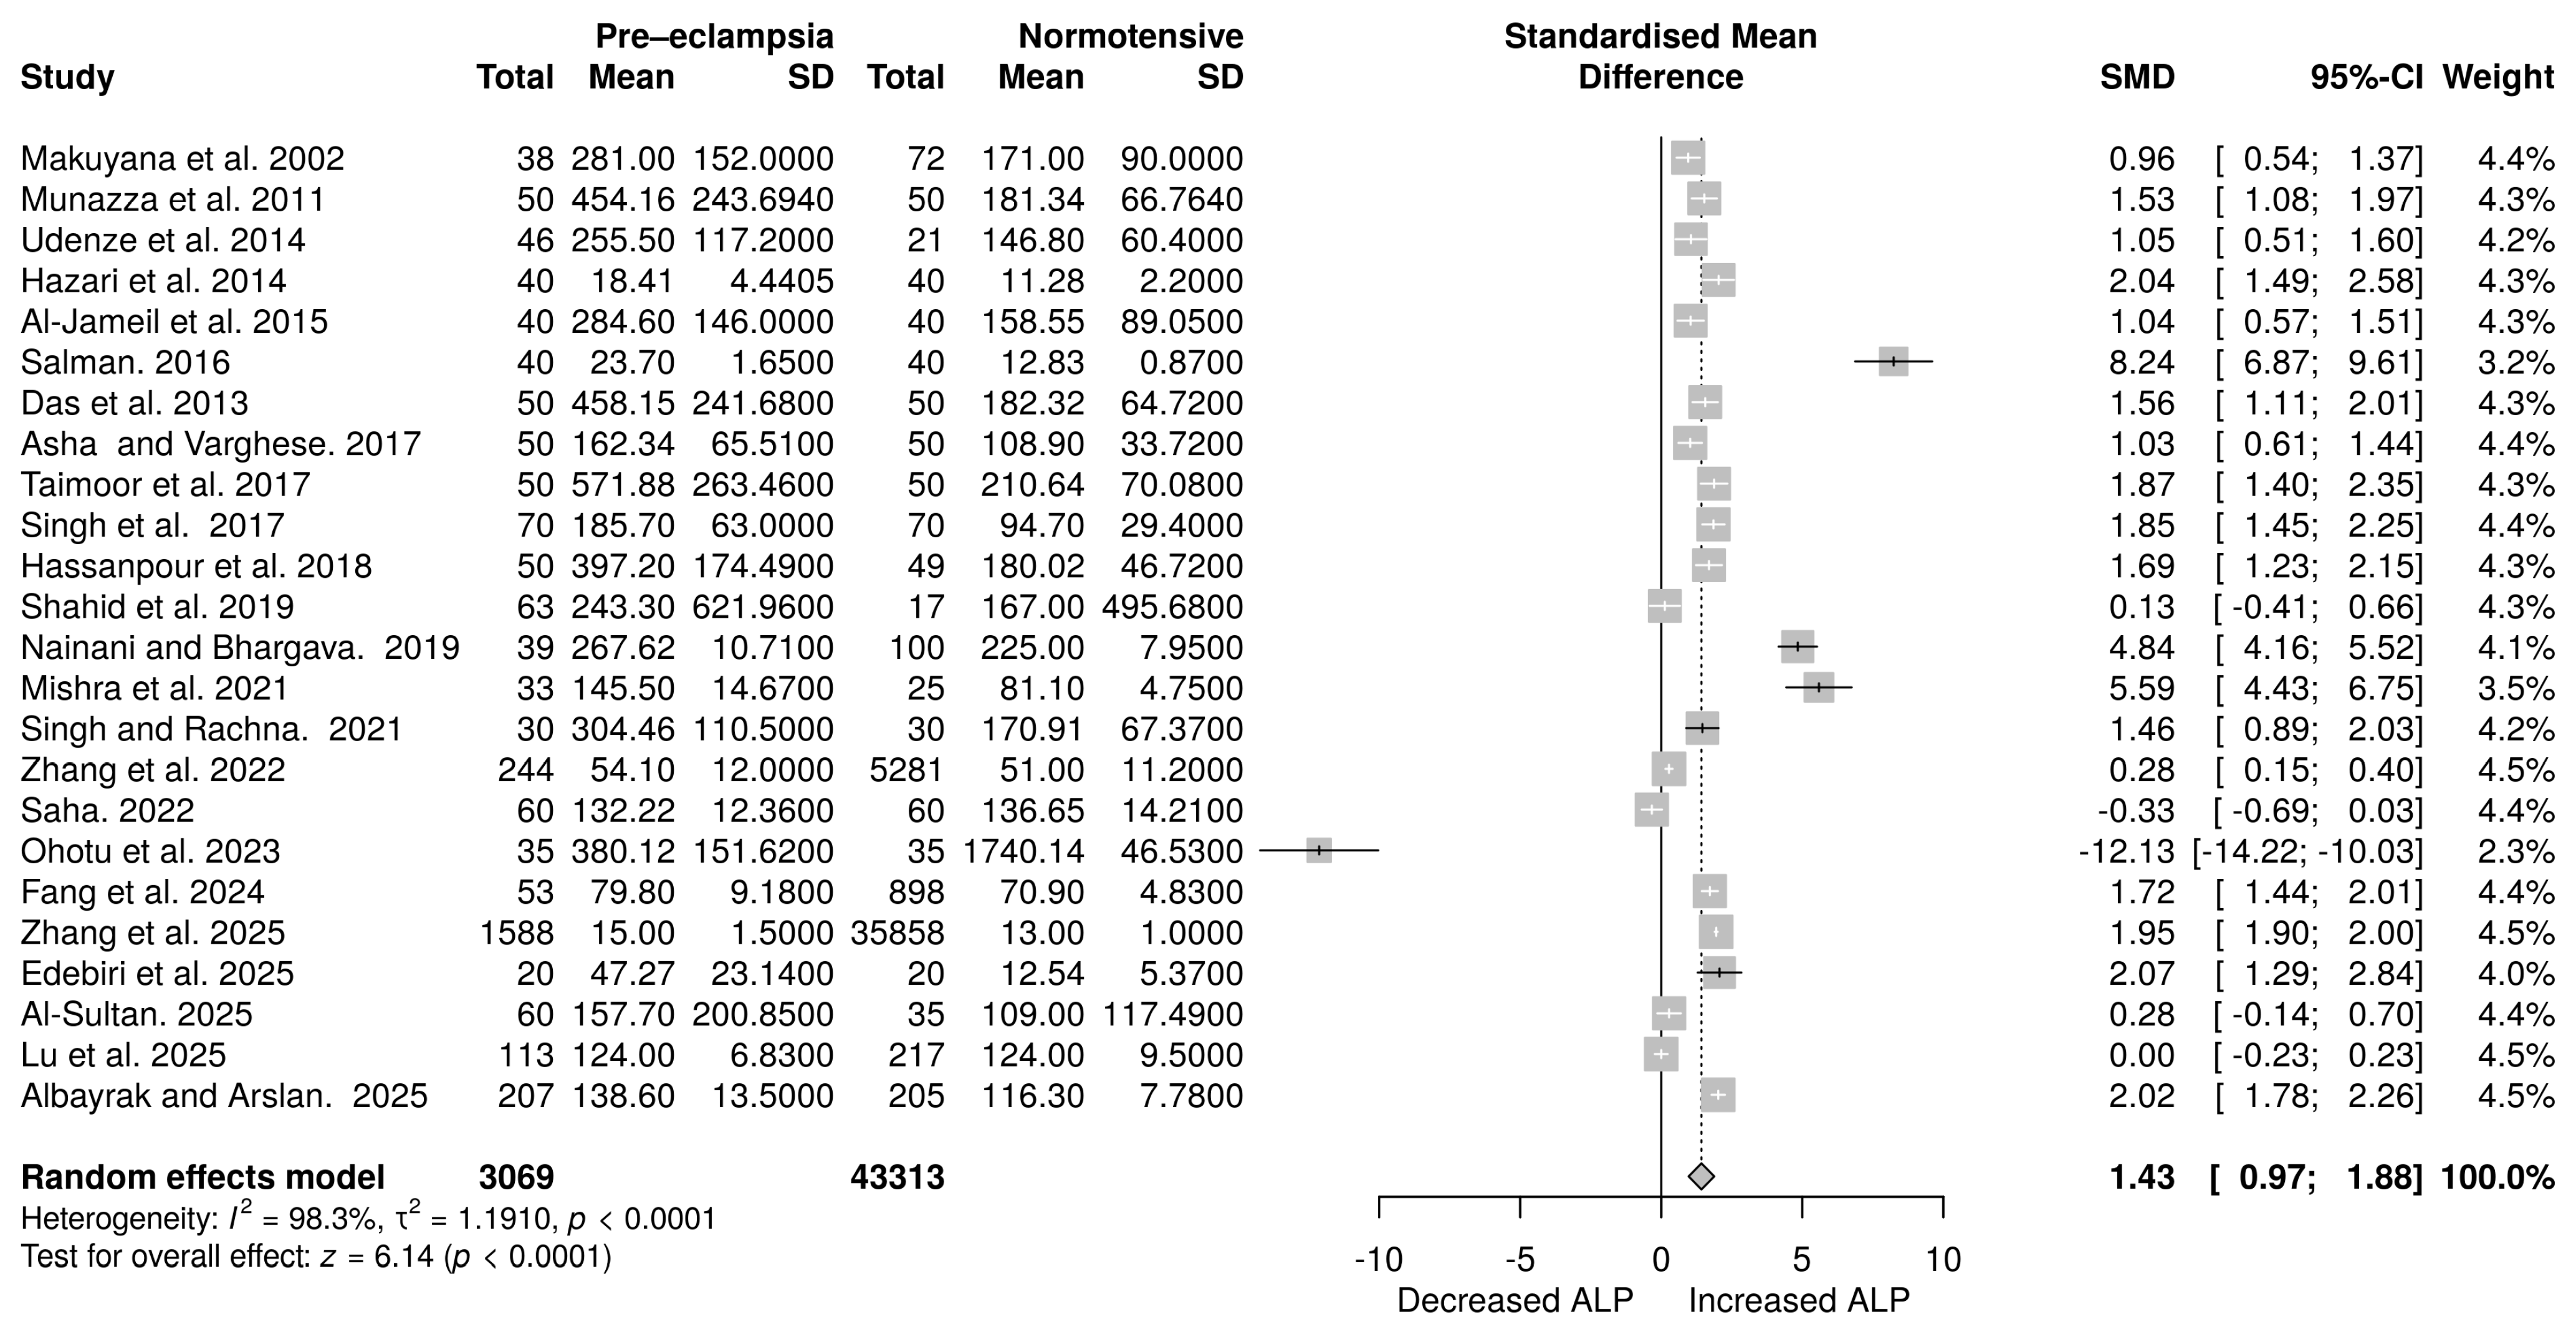
3.5. ALP Levels in Pre-Eclampsia Compared to Normotensive Pregnant Women
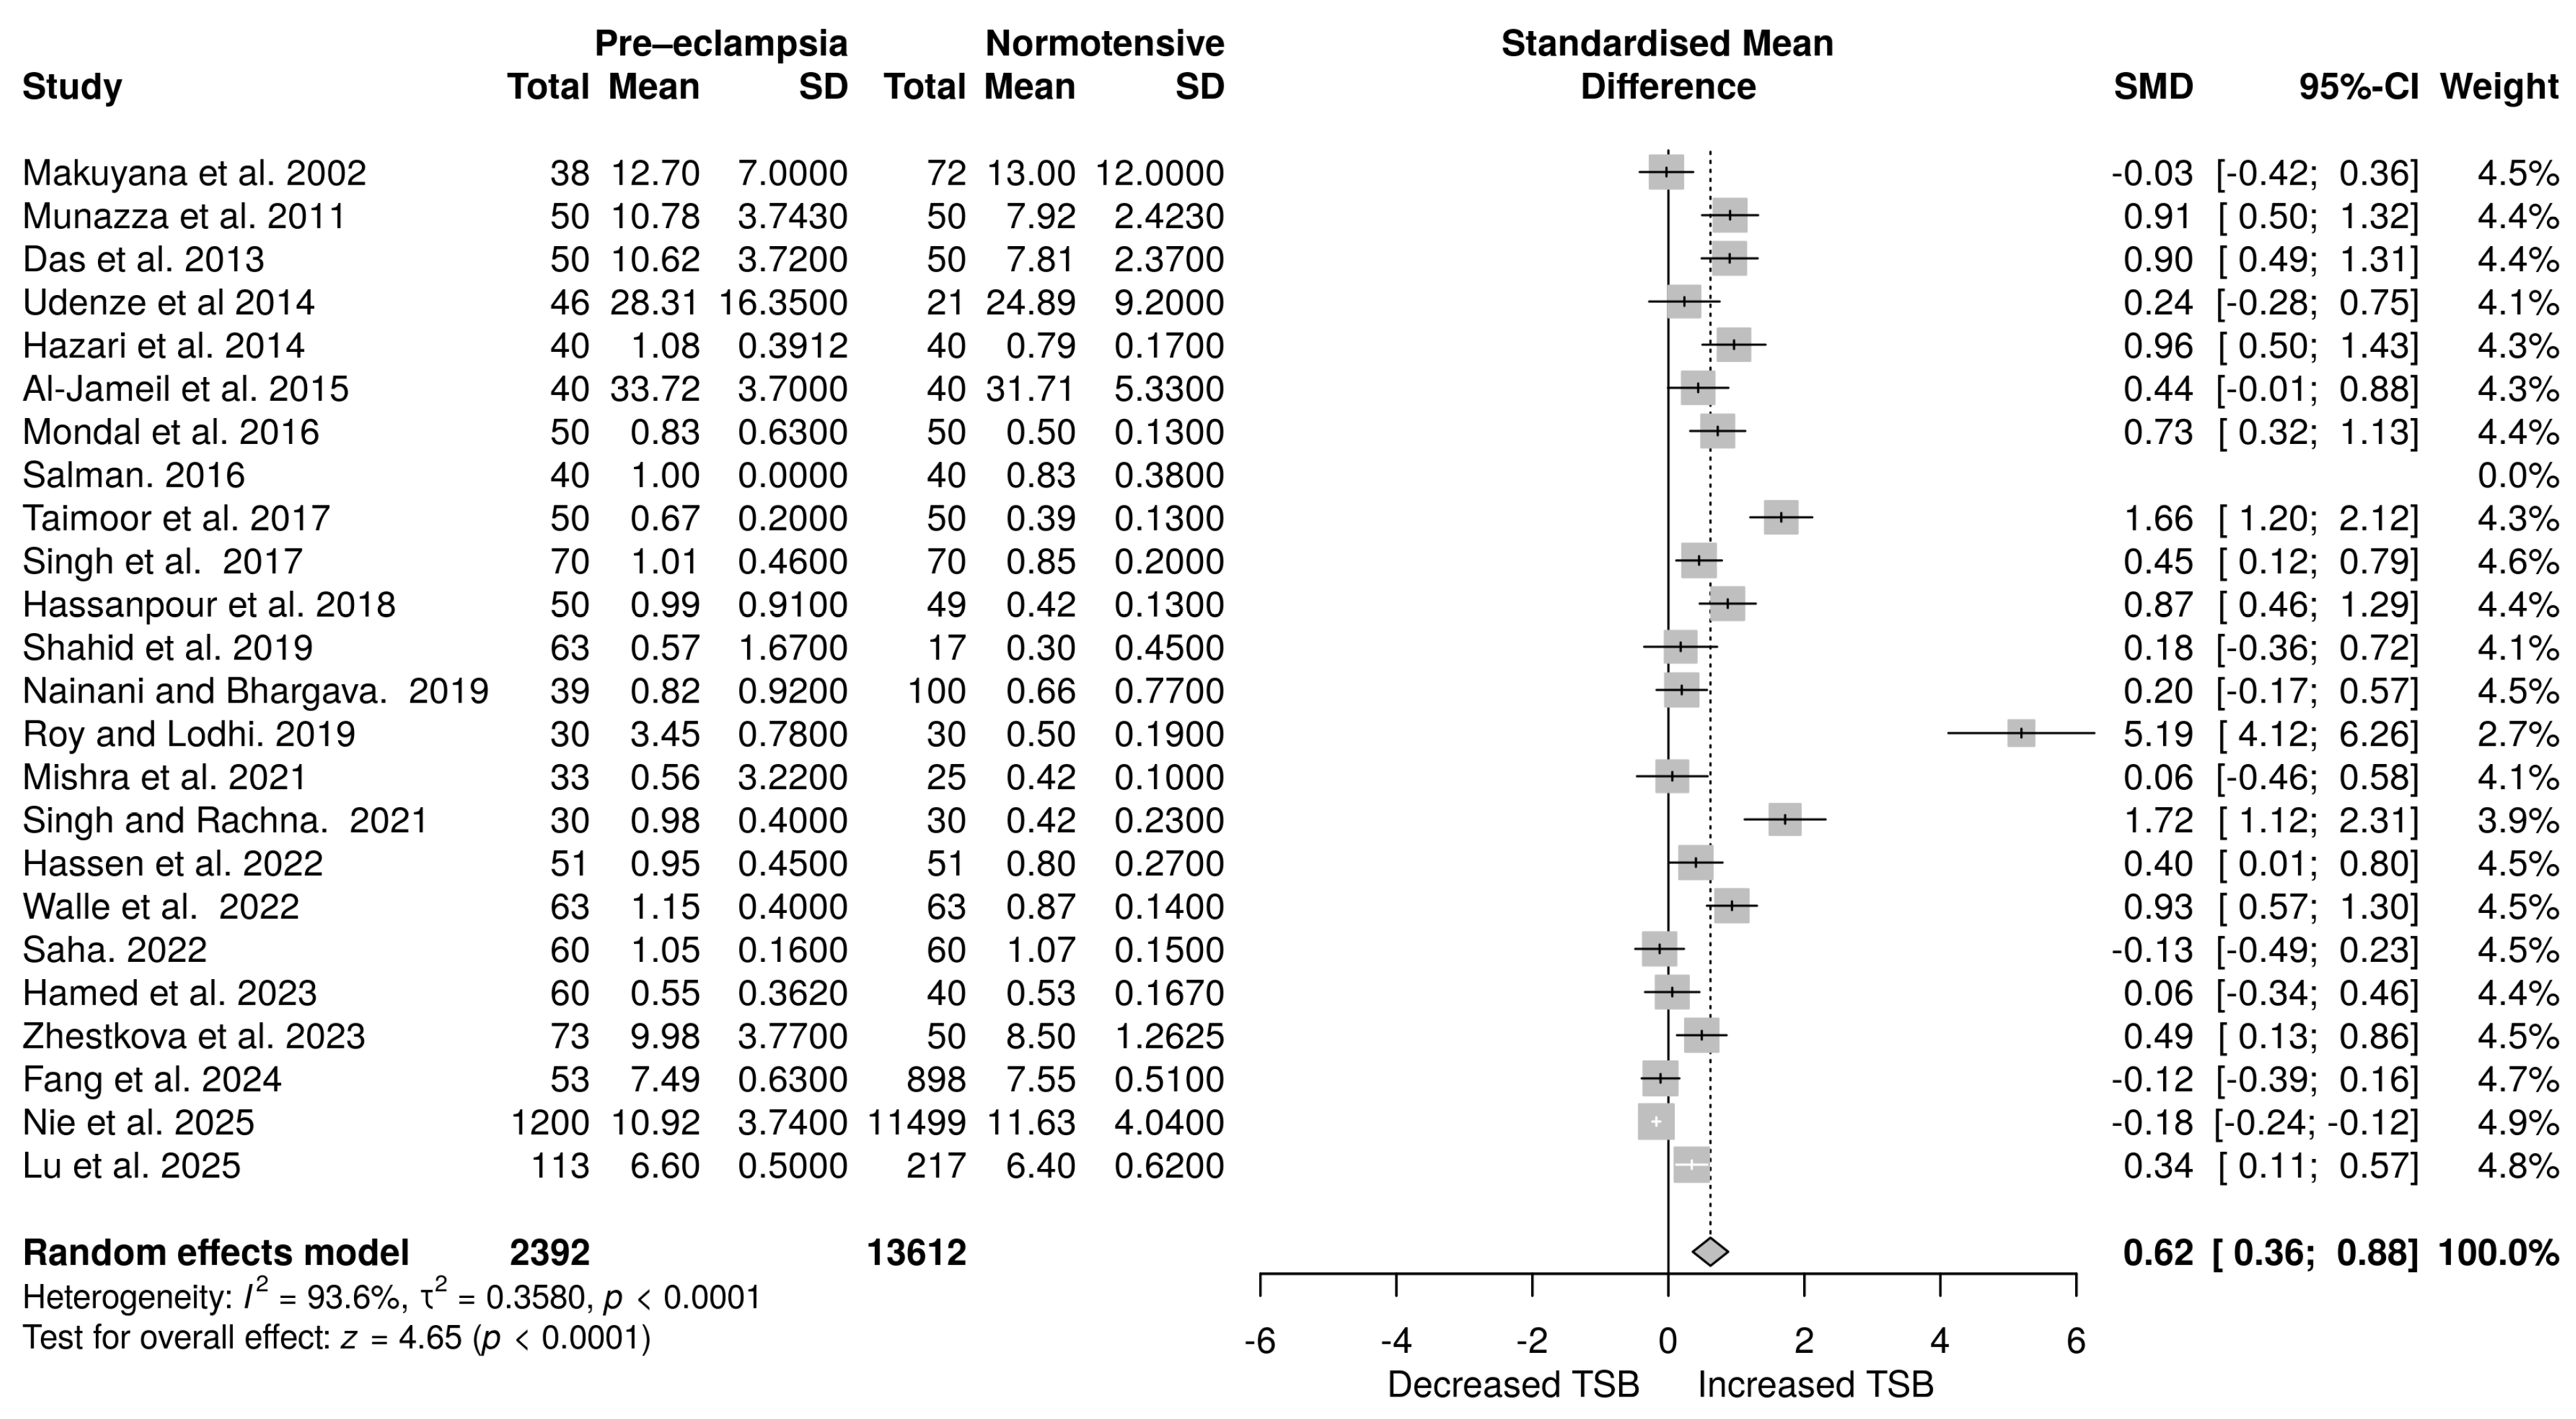
3.6. Total Bilirubin Levels in Pre-Eclampsia Versus Normotensive Pregnant Women
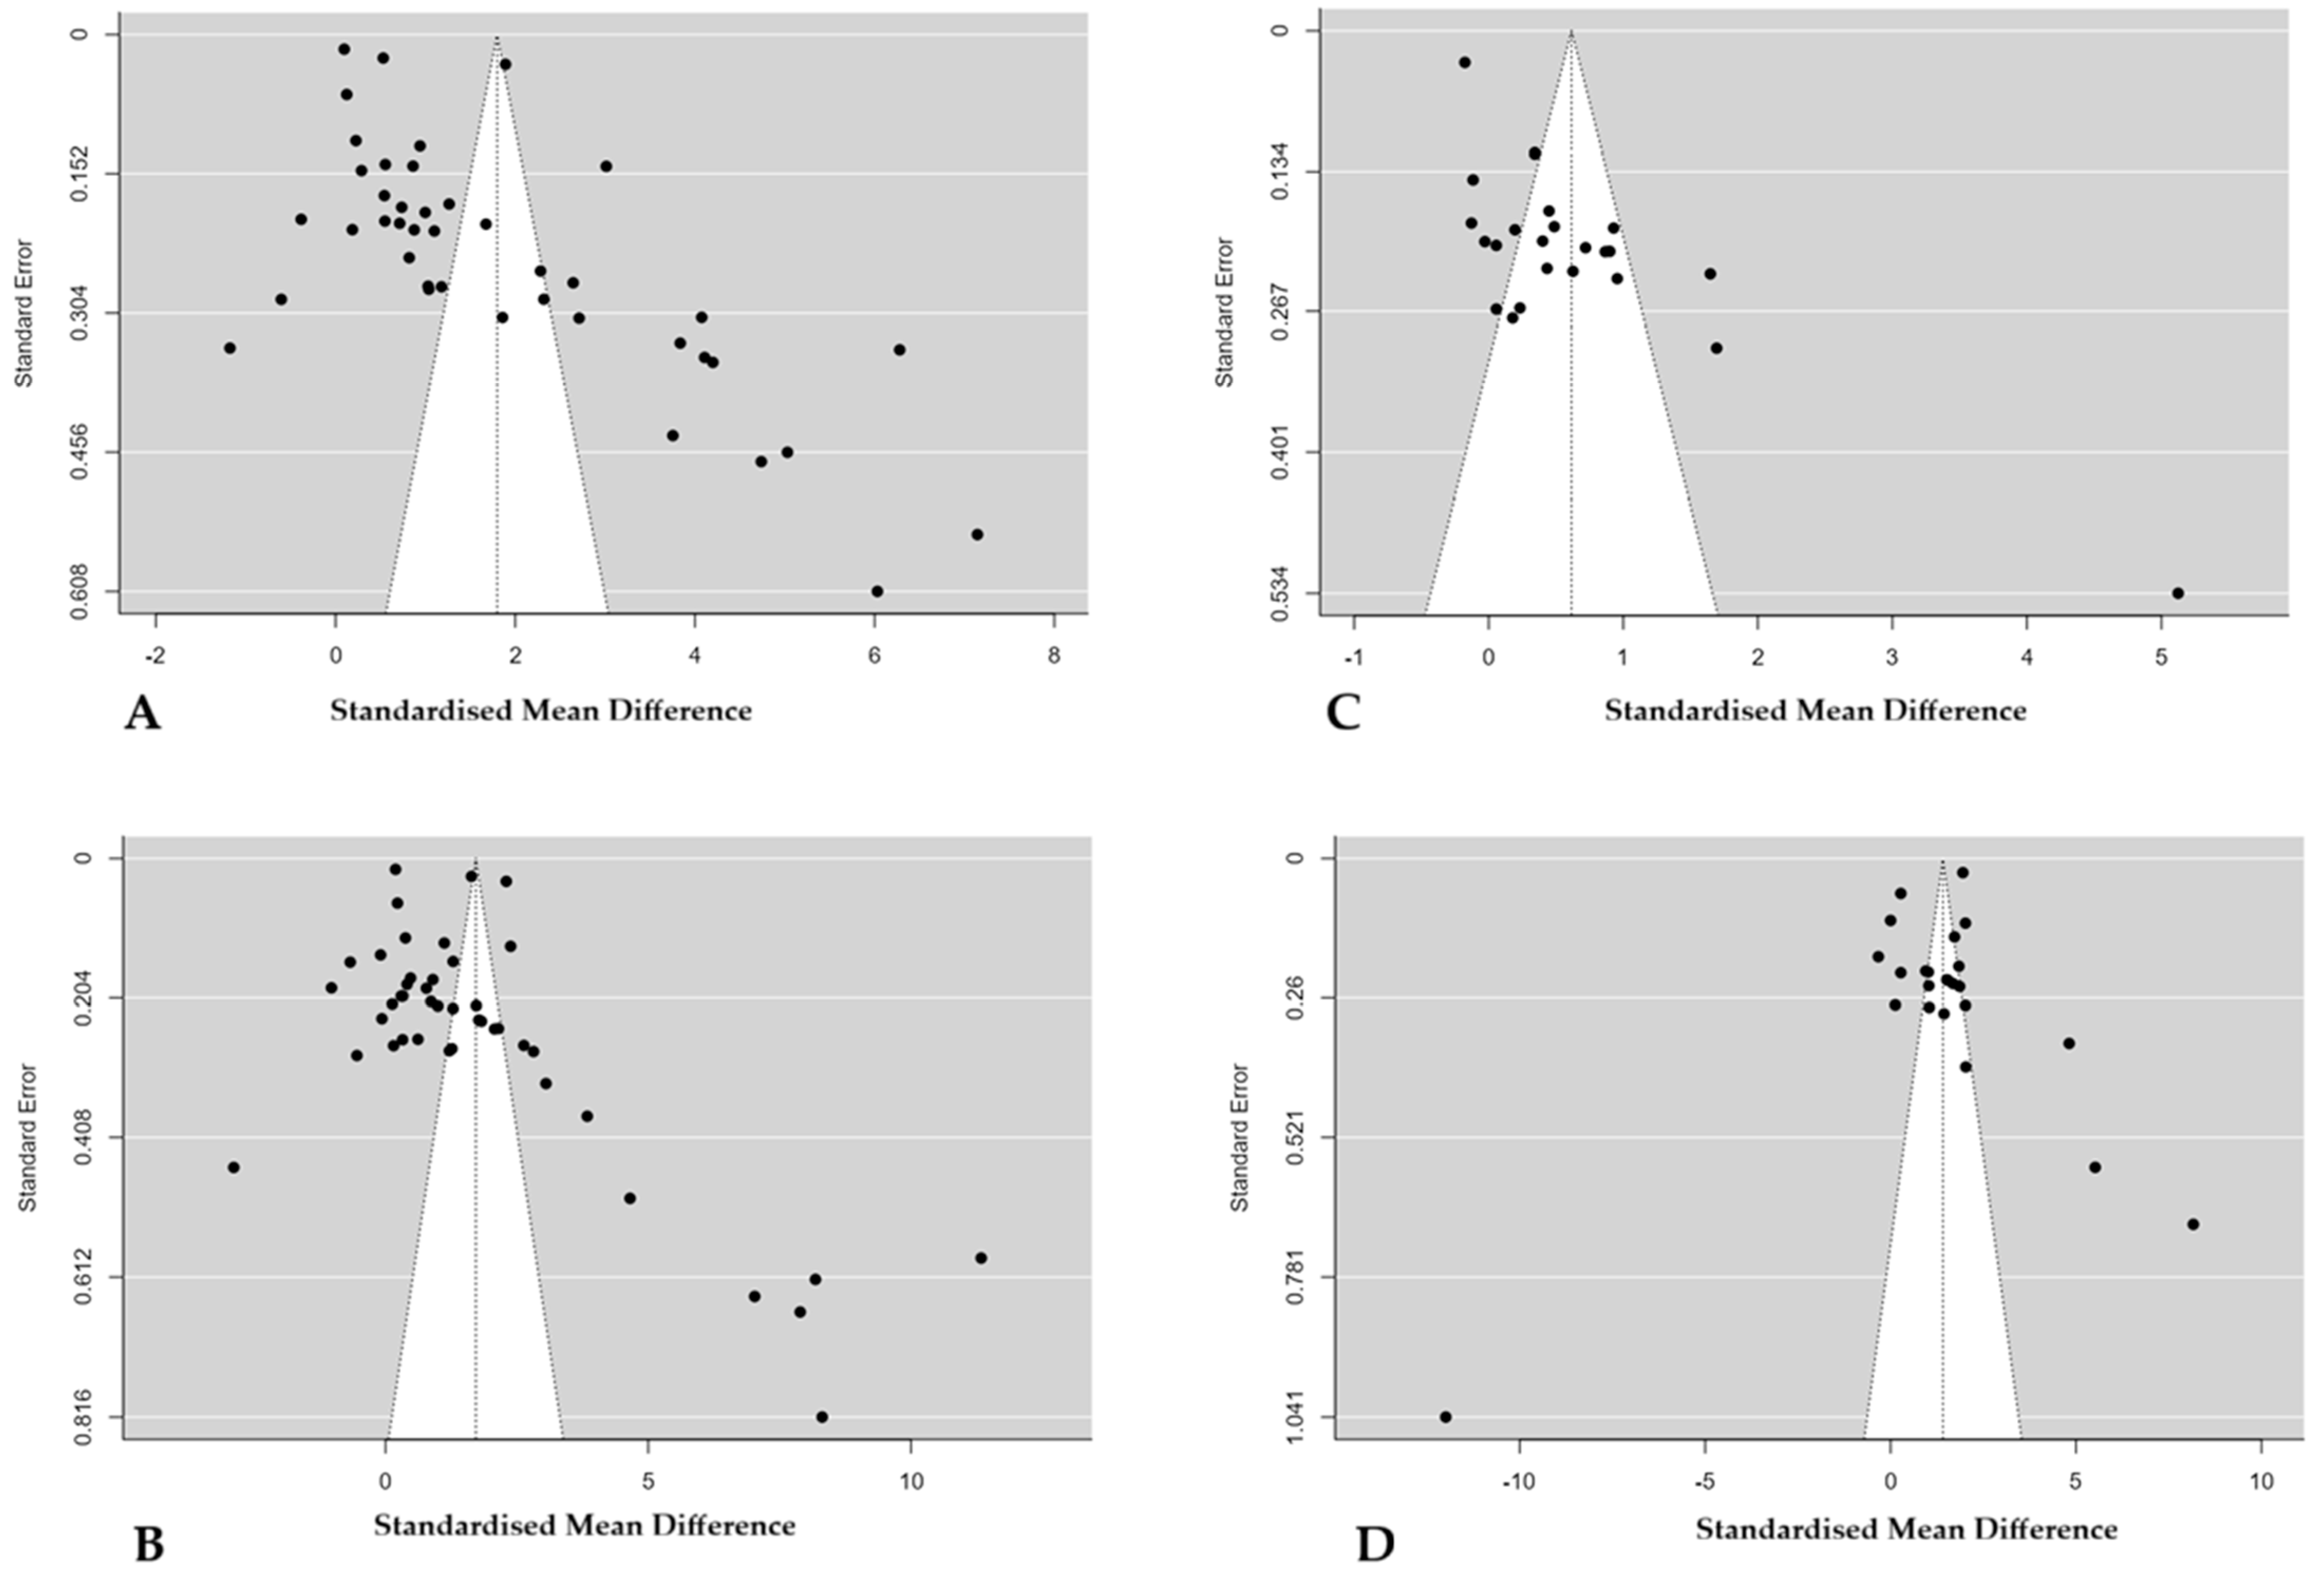
3.7. Publication Bias Assessments
3.8. Subgroup Analysis
3.9. Meta-Regression
3.10. The Sensitivity Analysis for Robustness and Stability of Effect Size
3.11. Quality Assessment of Included Observational Studies
4. Discussion
5. Conclusions
Supplementary Materials
Author Contributions
Funding
Institutional Review Board Statement
Data Availability Statement
Acknowledgments
Conflicts of Interest
References
- Tranquilli, A.L.; Brown, M.A.; Zeeman, G.G.; Dekker, G.; Sibai, B.M. The Definition of Severe and Early-Onset Preeclampsia. Statements from the International Society for the Study of Hypertension in Pregnancy (ISSHP). Pregnancy Hypertens. 2013, 3, 44–47. [Google Scholar] [CrossRef] [PubMed]
- Magee, L.A.; Brown, M.A.; Hall, D.R.; Gupte, S.; Hennessy, A.; Karumanchi, S.A.; Kenny, L.C.; McCarthy, F.; Myers, J.; Poon, L.C.; et al. The 2021 International Society for the Study of Hypertension in Pregnancy Classification, Diagnosis & Management Recommendations for International Practice. Pregnancy Hypertens. 2022, 27, 148–169. [Google Scholar] [CrossRef] [PubMed]
- Brown, M.A.; Magee, L.A.; Kenny, L.C.; Karumanchi, S.A.; McCarthy, F.P.; Saito, S.; Hall, D.R.; Warren, C.E.; Adoyi, G.; Ishaku, S. The Hypertensive Disorders of Pregnancy: ISSHP Classification, Diagnosis & Management Recommendations for International Practice. Pregnancy Hypertens. 2018, 13, 291–310. [Google Scholar]
- Duley, L. The Global Impact of Pre-Eclampsia and Eclampsia. Semin. Perinatol. 2009, 33, 130–137. [Google Scholar] [CrossRef] [PubMed]
- Soma-Pillay, P.; Nelson-Piercy, C.; Tolppanen, H.; Mebazaa, A. Physiological Changes in Pregnancy. Cardiovasc. J. Afr. 2016, 27, 89–94. [Google Scholar] [CrossRef]
- Guerby, P.; Tasta, O.; Swiader, A.; Pont, F.; Bujold, E.; Parant, O.; Vayssiere, C.; Salvayre, R.; Negre-Salvayre, A. Role of Oxidative Stress in the Dysfunction of the Placental Endothelial Nitric Oxide Synthase in Preeclampsia. Redox Biol. 2021, 40, 101861. [Google Scholar] [CrossRef]
- McElwain, C.J.; Tuboly, E.; McCarthy, F.P.; McCarthy, C.M. Mechanisms of Endothelial Dysfunction in Pre-Eclampsia and Gestational Diabetes Mellitus: Windows Into Future Cardiometabolic Health? Front. Endocrinol. 2020, 11, 655. [Google Scholar] [CrossRef]
- Michalczyk, M.; Celewicz, A.; Celewicz, M.; Wozniakowska-Gondek, P.; Rzepka, R. The Role of Inflammation in the Pathogenesis of Preeclampsia. Mediat. Inflamm. 2020, 2020, 3864941. [Google Scholar] [CrossRef]
- Robinson, M.W.; Harmon, C.; O’Farrelly, C. Liver Immunology and Its Role in Inflammation and Homeostasis. Cell. Mol. Immunol. 2016, 13, 267–276. [Google Scholar] [CrossRef]
- Mohajan, H.K. A Study on Functions of Liver to Sustain a Healthy Liver. Innov. Sci. Technol. 2025, 4, 77–87. [Google Scholar] [CrossRef]
- Trefts, E.; Gannon, M.; Wasserman, D.H. The Liver. Curr. Biol. 2017, 27, R1147–R1151. [Google Scholar] [CrossRef]
- Ling, S.; Diao, H.; Lu, G.; Shi, L. Associations between Serum Levels of Liver Function Biomarkers and All-Cause and Cause-Specific Mortality: A Prospective Cohort Study. BMC Public Health 2024, 24, 3302. [Google Scholar] [CrossRef]
- Lim, E.; Mouyis, M.; MacKillop, L. Liver Diseases in Pregnancy. Clin. Med. J. R. Coll. Physicians Lond. 2021, 21, E441–E445. [Google Scholar] [CrossRef]
- Thibaut, R.; Gage, M.C.; Pineda-Torra, I.; Chabrier, G.; Venteclef, N.; Alzaid, F. Liver Macrophages and Inflammation in Physiology and Physiopathology of Non-Alcoholic Fatty Liver Disease. FEBS J. 2022, 289, 3024–3057. [Google Scholar] [CrossRef]
- Ma, Y.; Yang, M.; He, Z.; Wei, Q.; Li, J. The Biological Function of Kupffer Cells in Liver Disease. In Biology of Myelomonocytic Cells; InTech: London, UK, 2017. [Google Scholar]
- Torres-Torres, J.; Espino-y-Sosa, S.; Martinez-Portilla, R.; Borboa-Olivares, H.; Estrada-Gutierrez, G.; Acevedo-Gallegos, S.; Ruiz-Ramirez, E.; Velasco-Espin, M.; Cerda-Flores, P.; Ramirez-Gonzalez, A.; et al. A Narrative Review on the Pathophysiology of Preeclampsia. Int. J. Mol. Sci. 2024, 25, 7569. [Google Scholar] [CrossRef]
- Mei, J.Y.; Afshar, Y. Hypertensive Complications of Pregnancy: Hepatic Consequences of Preeclampsia through HELLP Syndrome. Clin. Liver Dis. 2023, 22, 195–199. [Google Scholar] [CrossRef]
- Stroup, D.F.; Berlin, J.A.; Morton, S.C.; Olkin, I.; Williamson, G.D.; Rennie, D.; Moher, D.; Becker, B.J.; Sipe, T.A.; Thacker, S.B. Meta-Analysis of Observational Studies in Epidemiology: A Proposal for Reporting. Meta-Analysis of Observational Studies in Epidemiology (MOOSE) Group. JAMA 2000, 283, 2008–2012. [Google Scholar] [CrossRef] [PubMed]
- Page, M.J.; McKenzie, J.E.; Bossuyt, P.M.; Boutron, I.; Hoffmann, T.C.; Mulrow, C.D.; Shamseer, L.; Tetzlaff, J.M.; Akl, E.A.; Brennan, S.E.; et al. The PRISMA 2020 Statement: An Updated Guideline for Reporting Systematic Reviews. BMJ 2021, 372, n71. [Google Scholar] [CrossRef] [PubMed]
- Wells, G.A.; Shea, B.; O’Connell, D.; Peterson, J.; Welch, V.; Losos, M.; Tugwell, P. The Newcastle-Ottawa Scale (NOS) for Assessing the Quality of Nonrandomized Studies in Meta-Analyses. Available online: https://www.ohri.ca/programs/clinical_epidemiology/oxford.asp (accessed on 28 May 2023).
- Fekete, J.T.; Győrffy, B. MetaAnalysisOnline.Com: Web-Based Tool for the Rapid Meta-Analysis of Clinical and Epidemiological Studies. J. Med. Internet Res. 2025, 27, e64016. [Google Scholar] [CrossRef] [PubMed]
- Hozo, S.P.; Djulbegovic, B.; Hozo, I. Estimating the Mean and Variance from the Median, Range, and the Size of a Sample. BMC Med. Res. Methodol. 2005, 5, 13. [Google Scholar] [CrossRef]
- Lee, D.K.; In, J.; Lee, S. Standard Deviation and Standard Error of the Mean. Korean J. Anesthesiol. 2015, 68, 220–223. [Google Scholar] [CrossRef]
- Huedo-Medina, T.B.; Sánchez-Meca, J.; Marín-Martínez, F.; Botella, J. Assessing Heterogeneity in Meta-Analysis: Q Statistic or I 2 Index? Psychol. Methods 2006, 11, 193–206. [Google Scholar] [CrossRef]
- Spineli, L.M.; Pandis, N. Statistical Heterogeneity: Notion and Estimation in Meta-Analysis. Am. J. Orthod. Dentofac. Orthop. 2020, 157, 856–859.e2. [Google Scholar] [CrossRef]
- Higgins, J.P.T.; Thompson, S.G. Quantifying Heterogeneity in a Meta-Analysis. Stat. Med. 2002, 21, 1539–1558. [Google Scholar] [CrossRef]
- Mathur, M.B.; VanderWeele, T.J. Sensitivity Analysis for Publication Bias in Meta-Analyses. J. R. Stat. Soc. Ser. C Appl. Stat. 2020, 69, 1091–1119. [Google Scholar] [CrossRef] [PubMed]
- Atiba, A.S.; Abbiyesuku, F.M.; Oparinde, D.P.; ‘Niran-Atiba, T.A.; Akindele, R.A. Plasma Malondialdehyde (MDA): An Indication of Liver Damage in Women with Pre-Eclamsia. Ethiop. J. Health Sci. 2016, 26, 479–486. [Google Scholar] [CrossRef] [PubMed]
- Hassen, F.S.; Malik, T.; Dejenie, T.A. Evaluation of Serum Uric Acid and Liver Function Tests among Pregnant Women with and without Preeclampsia at the University of Gondar Comprehensive Specialized Hospital, Northwest Ethiopia. PLoS ONE 2022, 17, e0272165. [Google Scholar] [CrossRef] [PubMed]
- Mondal, B.R.; Ahmed, S.; Saha, S.; Parveen, S.I.; Sultana, T.; Rahman, M.Q.; Sarker, U.K.; Aminotransferase, A.A.N.A.; Bilirubin, T. Concentration in Preeclampsia and Eclampsia. Mymensingh Med. J. 2016, 25, 85–90. [Google Scholar]
- Khan, J.A.; Ashraf, A.; Fayaz, F.; Qureshi, W.; Sheikh, A.T. Liver and Renal Biochemical Parameters in Preeclampsia: A Cross Sectional Study. Int. J. Res. Med. Sci. 2023, 11, 929–935. [Google Scholar] [CrossRef]
- Chen, L.; Pi, Y.; Chang, K.; Luo, S.; Peng, Z.; Chen, M.; Yu, L. Screening Models Combining Maternal Characteristics and Multiple Markers for the Early Prediction of Preeclampsia in Pregnancy: A Nested Case–Control Study. J. Obstet. Gynaecol. 2022, 42, 1889–1896. [Google Scholar] [CrossRef]
- Mishra, J.; Srivastava, S.K.; Pandey, K.B. Compromised Renal and Hepatic Functions and Unsteady Cellular Redox State during Preeclampsia and Gestational Diabetes Mellitus. Arch. Med. Res. 2021, 52, 635–640. [Google Scholar] [CrossRef] [PubMed]
- Qassim, A.A.; Ameen, M.A. Evaluation of the Effect of Preeclampsia on Liver and Renal Function Biomarkers Level. Biochem. Cell. Arch. 2021, 21, 4887–4891. [Google Scholar]
- Sultana, R.; Ahmed, S.; Sultana, N.; Diba, F. ALT in Preeclampsia. Delta Med. Col. J. 2021, 9, 65–68. [Google Scholar] [CrossRef]
- Uckan, K.; Sahin, H.G. Serum Amyloid A, Procalcitonin, Highly Sensitive C Reactive Protein and Tumor Necrosis Factor Alpha Levels and Acute Inflammatory Response in Patients with Hemolysis, Elevated Liver Enzymes, Low Platelet Count (HELLP) and Eclampsia. J. Obstet. Gynaecol. Res. 2018, 44, 440–447. [Google Scholar] [CrossRef]
- Udenze, I.; Arikawe, A.; Azinge, E.; Egbuagha, E. Liver Function Tests in Nigerian Women with Severe Preeclampsia. J. Clin. Sci. 2014, 11, 7. [Google Scholar] [CrossRef]
- Hendawy, M.O.; Hussein, S.; Harahsheh, E.A. Relationship between Pre-Eclampsia, Renal Impairment and Hepatic Insufficiency among Pregnant Women in Al-Jouf Area. J. Pharm. Nutr. Sci. 2020, 10, 295–301. [Google Scholar] [CrossRef]
- Al Ghazali, B.; Al-Taie, A.A.-H.; Hameed, R.J. Study of the Clinical Significance of Serum Albumin Level in Preeclampsia and in the Detection of Its Severity. Am. J. Biomed. 2014, 2, 964–974. [Google Scholar] [CrossRef]
- Nie, L.; Zhang, Z.; Yao, Q.; Chen, H.; Xu, C.; Chen, L.; Liu, C.; Tu, L.; Yi, Y.; Huang, T.; et al. The New Era of Risk Assessment for Hypertension in Pregnancy: From Clinical to Biochemical Markers in a Comprehensive Predictive Model. Taiwan J. Obstet. Gynecol. 2025, 64, 253–264. [Google Scholar] [CrossRef]
- Shahid, S.; Khalid, E.; Fatima, S.S.; Khan, G.M. Evaluation of Soluble TNF-like Weak Inducer of Apoptosis (STWEAK) Levels to Predict Preeclampsia in Early Weeks of Pregnancy. Eur. J. Obstet. Gynecol. Reprod. Biol. 2019, 234, 165–170. [Google Scholar] [CrossRef]
- Cho, G.J.; Kim, H.Y.; Park, J.H.; Ahn, K.H.; Hong, S.C.; Oh, M.J.; Kim, H.J. Prepregnancy Liver Enzyme Levels and Risk of Preeclampsia in a Subsequent Pregnancy: A Population-Based Cohort Study. Liver Int. 2018, 38, 949–954. [Google Scholar] [CrossRef]
- Zhang, L.; Gao, S.; Luan, Y.; Su, S.; Zhang, E.; Liu, J.; Xie, S.; Zhang, Y.; Yue, W.; Liu, R.; et al. Predictivity of Hepatic Steatosis Index for Gestational Hypertension and Preeclampsia: A Prospective Cohort Study. Int. J. Med. Sci. 2025, 22, 834–844. [Google Scholar] [CrossRef] [PubMed]
- Haggai, C.M.; Inshirah, S.; Jacob, B.; Marwan, O.; Lior, L.; Maya, F.W. Liver Stiffness and Steatosis in Preeclampsia as Shown by Transient Elastography–a Prospective Cohort Study. Am. J. Obstet. Gynecol. 2022, 227, 515.e1–515.e9. [Google Scholar] [CrossRef] [PubMed]
- İpek, G.; Tanaçan, A.; Ağaoğlu, Z.; Gülçin Baştemur, A.; Gülen Yıldız, E.; Şahin, D. The Role of Aspartate Aminotransferase to Platelet Ratio Index (APRI) in the First Trimester for the Prediction of Superimposed Preeclampsia: A Case-Control Study from a Tertiary Center. Pregnancy Hypertens. 2024, 37, 101132. [Google Scholar] [CrossRef] [PubMed]
- Hamed, S.; Hamed, S.S.M.; Khalifa, T.; Ali, M.S. Preeclampsia Symptoms and Liver Function Tests in Women with Pre-Eclampsia: Comparison with a Normal Pregnant Woman. Sci. J. Fac. Sci.-Sirte Univ. 2023, 3, 141–148. [Google Scholar]
- Fang, Y.; Liu, H.; Li, Y.; Cheng, J.; Wang, X.; Shen, B.; Wang, Q.; Chen, H. A Prediction Model of Preeclampsia in Hyperglycemia Pregnancy. Diabetes Metab. Syndr. Obes. 2024, 17, 1321–1333. [Google Scholar] [CrossRef]
- Hassanpour, S.H.; Zeinab Karami, S. Evaluation of Hepatic Biomarkers in Pregnant Women with Preeclampsia. Gynecol. Obstet. 2018, 8, 1000487. [Google Scholar] [CrossRef]
- Walle, M.; Getu, F.; Gelaw, Y.; Getaneh, Z. The Diagnostic Value of Hepatic and Renal Biochemical Tests for the Detection of Preeclampsia Among Pregnant Women Attending the Antenatal Care Clinic at the University of Gondar Comprehensive Specialized Hospital, Gondar, Northwest Ethiopia. Int. J. Gen. Med. 2022, 15, 7761–7771. [Google Scholar] [CrossRef]
- Taimoor, A.; Nazir, A.; Raza, N.; Qureshi, S.A.; Ayub, M.; Shirwany, T.A.K. Liver function tests in second and third Trimester Primigravida in normal Pregnancy and Preeclampsia. Pak. J. Physiol. 2017, 13, 25–28. [Google Scholar]
- Sakr, I.H.; Khowailed, A.A.; Kamel, M.M.; Farghaly, E.M.; Farid, Z.E. Endothelial-Platelet Dysfunction as an Indicator of Pre-Eclampsia and Its Severity. Med. J. Cairo Univ. 2019, 87, 1775–1782. [Google Scholar] [CrossRef]
- Munazza, B.; Raza, N.; Naureen, A.; Khan, S.A.; Fatima, F.; Ayub, M.; Sulaman, M. Liver Function Tests in Preeclampsia. J. Ayub Med. Coll. Abbottabad 2013, 23, 3–5. [Google Scholar]
- Zhestkova, N.V.; Ailamazyan, E.K.; Kuzminykh, T.U.; Marchenko, N.V. Characteristics of Liver Function in Patients with Preeclampsia. J. Obstet. Women’s Dis. 2023, 72, 59–69. [Google Scholar] [CrossRef]
- Zhang, Y.; Sheng, C.; Wang, D.; Chen, X.; Chen, X.; Jiang, Y.; Dou, Y.; Wang, Y.; Li, M.; Chen, H.; et al. High-Normal Liver Enzyme Levels in Early Pregnancy Predispose the Risk of Gestational Hypertension and Preeclampsia: A Prospective Cohort Study. Front. Cardiovasc. Med. 2022, 9, 963957. [Google Scholar] [CrossRef] [PubMed]
- Singh, A.; Singh, N.P.; Sant, S.K.; Jaiswal, K. Comparative Evaluation of Liver Functions in Pre-Eclamptic and Normal Pregnancy. J. Evid. Based Med. Healthc. 2017, 4, 5192–5195. [Google Scholar] [CrossRef] [PubMed]
- Nainani, M.; Bhargava, A.K. A Comparison of Liver Enzymes, Bilirubin and Uric Acid in Preeclampsia, Eclampsia and Normotensive Subjects. Int. J. Clin. Obstet. Gynaecol. 2019, 3, 19–20. [Google Scholar] [CrossRef]
- Ohotu, E.O.; Queendalyn, M.N.; Onah, E.S.; Ogbuabor, A.O. Comparative Evaluation of Some Liver Enzymes in Preeclamptic and Non-Preeclamptic Patients in the Enugu Metropolis South East Nigeria. Int. J. Med. Sci. Dent. Res. 2023, 6, 1–7. [Google Scholar]
- Ibrahim Salman, M. Evaluation of Liver Function Tests in Normotensive and Hypertensive Pregnancy. J. Univ. Anbar Pure Sci. 2016, 10, 7–10. [Google Scholar] [CrossRef]
- Saha, A.; Gupta, A. Das Study of Changes in Biochemical Parameters of Preeclampsia Patients, a Prospective Five Year Study. Int. J. Reprod. Contracept. Obstet. Gynecol. 2022, 11, 517. [Google Scholar] [CrossRef]
- Das, S.; Char, D.; Sarkar, S.; Kanti Saha, T.; Biswas, S.; Rudra, B. Evaluation of Liver Function Test in Normal Pregnancy and Pre-Eclampsia: A Case Control. IOSR J. Dent. Med. Sci. 2013, 12, 30–32. [Google Scholar] [CrossRef]
- Roy, N.; Lodhi, R.A. Evaluation of Liver Function Test and Renal Function Test in Pre-Eclampsia: A Case Control Study. People’s J. Sci. Res. 2019, 12, 18–23. [Google Scholar]
- Al-Sultan, A.M.; Jankeer, M.H. Evaluation of Liver and Renal Functions Tests in Pregnant Women with Preeclampsia. Texila Int. J. Public Health 2025, 13. [Google Scholar] [CrossRef]
- Afroz, F.; Sultana, N.; Rahman, A.; Zerin, N.; Mohammad Samsuzzaman, S.; Chowdhury, P.P.; Andalib, M.H.; Morshed, M.; Rahman, M.M.; Kamal, M.M. A Comparative Study of Hepatic Enzymes Between Preeclampsia and Normal Pregnant Women. J. Dhaka Med. Coll. 2021, 29, 18–22. [Google Scholar] [CrossRef]
- Al-Jameil, N.; Tabassum, H.; Al-Mayouf, H.; Al-Otay, L.; Aziz Khan, F. Liver Function Tests as Probable Markers of Preeclampsia—A Prospective Study Conducted in Riyadh. J. Clin. Anal. Med. 2015, 6, 461–464. [Google Scholar] [CrossRef]
- Makuyana, D.; Mahomed, K.; Shukusho, F.D.; Majoko, F. Liver and Kidney Function Tests in Normal and Pre-Eclamptic Gestation-a Comparison with Non-Gestational Reference Values. Cent. Afr. J. Med. 2002, 48, 55–59. [Google Scholar] [PubMed]
- Hazari, N.R.; Hatolkar, V.S.; Munde, S.M. Study of Serum Hepatic Enzymes in Preeclampsia. Int. J. Curr. Med. Appl. Sci. 2014, 2, 1–8. [Google Scholar]
- Edebiri, O.E.; Adewole, A.S.; Akpe, C.I.; Ehigiamusoe, E.A.; Ikuenobe, V.E.; Ohiwerei, W.O.; Orunta, E.D. Evaluation Of Liver Enzymes (ALP, ALT, AST and GGT) in Preeclamptic Pregnant Women in the Third Trimester Of Pregnancy. Int. J. Med. Health 2025, 4, 101–113. [Google Scholar] [CrossRef]
- Ekun, O.A.; Olawumi, O.M.; Makwe, C.C.; Ogidi, N.O. Biochemical Assessment of Renal and Liver Function among Preeclamptics in Lagos Metropolis. Int. J. Reprod. Med. 2018, 2018, 1594182. [Google Scholar] [CrossRef]
- Asha, N.S.; Varghese, A. Study of Liver Enzymes in Preeclampsia. J. Med. Sci. Clin. Res. 2017, 05, 15169–15172. [Google Scholar] [CrossRef]
- Lu, Y.; Yang, L.; Li, X.; Kuai, D.; Tian, W.; Zhang, H. A Prediction Model of Superimposed Preeclampsia in Women with Chronic Hypertension. Front. Cardiovasc. Med. 2025, 12, 1641662. [Google Scholar] [CrossRef]
- Albayrak, M.; Arslan, H.F. Useful Biomarkers for Preeclampsia: Evaluating the Diagnostic Potential of FIB-4 and FIB-5 Indices. Diagnostics 2025, 15, 693. [Google Scholar] [CrossRef]
- Singh, P.A.; Rachna, K. Association between LFT Test and Preeclampsia. Int. Res. J. Mod. Eng. Technol. Sci. 2021, 3, 93–98. [Google Scholar]
- Strauss, K.L.E.; Phoswa, W.N.; Hanser, S.; Mokgalaboni, K. HIV Infection and Antiretroviral Therapy Impair Liver Function in People Living with HIV: Systematic Review and Meta-Analysis. Pharmaceuticals 2025, 18, 955. [Google Scholar] [CrossRef]
- Strauss, K.L.E.; Phoswa, W.N.; Mokgalaboni, K. The Impact of Antiretroviral Therapy on Liver Function Among Pregnant Women Living with HIV in Co-Existence with and Without Pre-Eclampsia. Viruses 2025, 17, 28. [Google Scholar] [CrossRef]
- Chaudhary, S.; Mubaral, H.A.; Sabir, A.; Sadai, H.; Khali, A.; Mahmood, Z.; Shoukat, M.; Tahir, F.N. Elevated Liver Function Tests as Predictors of Severe Maternal Outcomes in Women with Preeclampsia. Pak. J. Med. Dent. 2025, 14, 116. [Google Scholar] [CrossRef]
- Aplin, J.D.; Myers, J.E.; Timms, K.; Westwood, M. Tracking Placental Development in Health and Disease. Nat. Rev. Endocrinol. 2020, 16, 479–494. [Google Scholar] [CrossRef]
- El Sayed, S.; Noel, L.; Lorquet, S.; Chantraine, F. Placenta Accreta Spectrum Disorder Associated With Late Onset Pre-Eclampsia: A Case Report. Clin. Case Rep. 2025, 13, e70346. [Google Scholar] [CrossRef]
- Gauster, M.; Moser, G.; Wernitznig, S.; Kupper, N.; Huppertz, B. Early Human Trophoblast Development: From Morphology to Function. Cell. Mol. Life Sci. 2022, 79, 345. [Google Scholar] [CrossRef]
- Rana, S.; Burke, S.D.; Karumanchi, S.A. Imbalances in Circulating Angiogenic Factors in the Pathophysiology of Preeclampsia and Related Disorders. Am. J. Obstet. Gynecol. 2022, 226, S1019–S1034. [Google Scholar] [CrossRef] [PubMed]
- Ali, L.E.; Salih, M.M.; Elhassan, E.M.; Mohmmed, A.A.; Adam, I. Placental Growth Factor, Vascular Endothelial Growth Factor, and Hypoxia-Inducible Factor-1α in the Placentas of Women with Pre-Eclampsia. J. Matern.-Fetal Neonatal Med. 2019, 32, 2628–2632. [Google Scholar] [CrossRef] [PubMed]
- Molbay, M.; Kipmen-Korgun, D.; Korkmaz, G.; Ozekinci, M.; Korgun, E.T. Human Trophoblast Progenitor Cells Express and Release Angiogenic Factors. Int. J. Mol. Cell Med. 2018, 7, 203–211. [Google Scholar] [CrossRef]
- Bakrania, B.A.; Spradley, F.T.; Drummond, H.A.; LaMarca, B.; Ryan, M.J.; Granger, J.P. Preeclampsia: Linking Placental Ischemia with Maternal Endothelial and Vascular Dysfunction. Compr. Physiol. 2021, 11, 1315–1349. [Google Scholar] [CrossRef]
- Tamil Barathi, P.; Mohanapriya, A. Pre-Eclampsia: Re-Visiting Pathophysiology, Role of Immune Cells, Biomarker Identification and Recent Advances in Its Management. J. Reprod. Immunol. 2024, 163, 104236. [Google Scholar] [CrossRef] [PubMed]
- Boeldt, D.S.; Bird, I.M. Vascular Adaptation in Pregnancy and Endothelial Dysfunction in Preeclampsia. J. Endocrinol. 2017, 232, R27–R44. [Google Scholar] [CrossRef] [PubMed]
- Shabani, M.; Irandoost, M.; Kashnian, M.; Monfared, Y.K. Comparation Level of Nitric Oxide (NO), Thromboxane A2(TXA2), Prostaglandin E2(PGE2) and Prostacyclin (PGI2) in the Plasma among Normal and Preeclampsia Pregnantwomen. J. Biochem. Technol. 2018, 9, 102–106. [Google Scholar]
- Zhang, B.; Zhan, Z.; Xi, S.; Zhang, Y.; Yuan, X. Alkaline Phosphatase of Late Pregnancy Promotes the Prediction of Adverse Birth Outcomes. J. Glob. Health 2025, 15, 04028. [Google Scholar] [CrossRef]
- Li, Q.; Wang, H.; Wang, H.; Deng, J.; Cheng, Z.; Lin, W.; Zhu, R.; Chen, S.; Guo, J.; Tang, L.V.; et al. Association between Serum Alkaline Phosphatase Levels in Late Pregnancy and the Incidence of Venous Thromboembolism Postpartum: A Retrospective Cohort Study. EClinicalMedicine 2023, 62, 102088. [Google Scholar] [CrossRef]
- Hammoud, G.M.; Ibdah, J.A. Preeclampsia-Induced Liver Dysfunction, HELLP Syndrome, and Acute Fatty Liver of Pregnancy. Clin. Liver Dis. 2014, 4, 69–73. [Google Scholar] [CrossRef]
- Auger, N.; Jutras, G.; Paradis, G.; Ayoub, A.; Lewin, A.; Maniraho, A.; Potter, B.J. Long-Term Risk of Chronic Liver Disease after Pre-Eclampsia. Int. J. Epidemiol. 2025, 54, dyaf072. [Google Scholar] [CrossRef]
- Guerra Ruiz, A.R.; Crespo, J.; López Martínez, R.M.; Iruzubieta, P.; Casals Mercadal, G.; Lalana Garcés, M.; Lavin, B.; Morales Ruiz, M. Measurement and Clinical Usefulness of Bilirubin in Liver Disease. Adv. Lab. Med. 2021, 2, 352–361. [Google Scholar] [CrossRef]
- Lodhi, R.; Roy, N. Liver Function Tests in Patients of Pre-Eclampsia in Bhilai, Chhattisgarh, India: A Clinical Study. Int. J. Reprod. Contracept. Obstet. Gynecol. 2018, 7, 5102. [Google Scholar] [CrossRef]






| Population (P) | Pre-eclamptic pregnant women |
| Exposure (E) | Pre-eclampsia |
| Comparison (C) | Healthy pregnant women (normotensive) |
| Outcome (O) | Liver function (AST, ALT, ALP, and bilirubin) |
| Study design (S) | Cross-sectional, case–control, and cohort |
| Author Name and Publication Year | Country | Study Design | PE Group | Normotensive Group | Age (Years) PE Group | Age (Years) Normotensive Group | SBP and DBP (mmHg) PE Group | SBP and DBP (mmHg) Normotensive Group | Markers |
|---|---|---|---|---|---|---|---|---|---|
| Atiba et al., 2016 [28] | Nigeria | Cross-sectional | 98 | 115 | 28.87 ± 4.33 | 28.87 ± 6.62 | 166.15 ± 9.40 99.80 ± 2.66 | 117.83 ± 13.03 70.87 ± 9.65 | AST |
| Ekun et al., 2018 [68] | Nigeria | Cross-sectional | 49 | 50 | 33.18 ± 4.55 | 32.44 ± 4.99 | 172.55 ± 24.16 112.47 ± 17.73 | 113.02 ± 9.95 70.20 ± 9.09 | AST and ALT |
| Asha and Varghese, 2017 [69] | India | Case–control | 50 | 50 | NR | NR | NR | NR | AST, ALT, and ALP |
| Chen et al., 2022 [32] | China | Case–Control | 73 | 73 | 30.17 ± 4.33 | 29.87 ± 4.14 | 116.43 ± 10.3 71.96 ± 9.65 | 106.07 ± 11.91 65.59 ± 9.78 | AST and ALT |
| Cho et al., 2018 [42] | South Korea | Cohort | 3973 | 192,571 | 30.92 ± 3.75 | 30.25 ± 3.38 | 117.60 ± 13.46 74.76 ± 10.00 | 109.6 ± 10.69 69.00 ± 7.95 | AST and ALT |
| Hamed et al., 2023 [46] | Libya | Cross-sectional | 60 | 40 | 33.62 ± 6.50 | 28.77 ± 7.26 | NR | NR | ALT and AST |
| Fang et al., 2024 [47] | China | Retrospective cohort | 53 | 898 | 29.23 ± 1.65 | 29.77 ± 1.77 | 112.5 ± 2.92 72.5 ± 2.92 | 108 ± 3.45 67.5 ± 2.84 | AST, ALT, and ALP |
| Albayrak and Arslan, 2025 [71] | Türkiye | Retrospective case–control | 207 | 205 | 31.2 ± 6.89 | 29.5 ± 5.13 | 156.5 ± 9.2 96.8 ± 7.5 | 110.6 ± 7.3 63.5 ± 6.8 | AST, ALP, and ALP |
| Lu et al., 2025 [70] | China | Retrospective case–control | 113 | 217 | 31.32 ± 5.10 | 31.53 ± 4.06 | 140 ± 0.75 90 ± 0.2 | 140 ± 0.67 90 ± 0.33 | AST, ALT, ALP, and bilirubin |
| Hassanpour and Karami, 2018 [48] | Iran | Case–control | 50 | 49 | NR | NR | NR | ALT, AST, ALP, and bilirubin | |
| Hassen et al., 2022 [29] | Ethiopia | Cross-sectional | 51 | 51 | 32.9 ± 6.3 | 29.5 ± 3.3 | 142.8 ± 6.34 92.8 ± 5.22 | NR | ALT, AST, ALP, and bilirubin |
| Hendawy et al., 2020 [38] | Saudi Arabia | Cross-sectional | 100 | 100 | NR | NR | NR | NR | ALT and AST |
| İpek et al., 2024 [45] | Turkey | Case–Control | 92 | 91 | 31.0 ± 10.0 | 27.0 ± 8.0 | NR | NR | ALT and AST |
| Khan et al., 2023 [31] | India | Cross-sectional | 150 | 150 | 29.24 ± 3.43 | 29.09 ± 3.08 | 154.28 ± 22.31 100.21 ± 12.34 | 119.08 ± 12.20 74.34 ± 6.22 | ALT and AST |
| Mishra et al., 2021 [33] | India | Case–control | 33 | 25 | 30 ± 5 | NR | 151.3 ± 3.0 70.83 ± 3.41 | 100.0 ± 1.82 111.2 ± 4.94 | AST and bilirubin |
| Mondal et al., 2016 [30] | Bangladesh | Cross-sectional | 50 | 50 | 26.58 ± 3.97 | 26.06 ± 5.02 | 156.56 ± 14.05 104.69 ± 8.88 | 107.5 ± 12.95 69.69 ± 7.82 | ALT and bilirubin |
| Munazza et al., 2013 [52] | Pakistan | Comparative cross-sectional | 50 | 50 | 15–45 | 15–45 | 166.60 ± 24.04 106.50 ± 13.18 | 116.80 ± 9.022 73.44 ± 7.29 | ALT, AST, and bilirubin |
| Qassim and Ameen, 2021 [34] | Iraq | Case–control | 50 | 50 | 16–40 | 16–40 | NR | NR | ALT and AST |
| Sakr et al., 2019 [51] | Egypt | Cross-sectional | 25 | 25 | 18–35 | 18–35 | NR | NR | AST and ALT |
| Singh and Rachna, 2021 [72] | India | Case–control | 30 | 30 | 18 and above | 18 and above | 167.33 ± 25.45 103.33 ± 12.41 | 113.33 ± 7.58 75.00 ± 5.08 | ALT, AST, and ALP |
| Sultana et al., 2021 [35] | Bangladesh | Case–control | 50 | 50 | 24.66 ± 3.22 | 24.06 ± 3.71 | NR | NR | ALT |
| Uckan and Sahin, 2018 [36] | Turkey | Case–control | 30 | 30 | 30.7 ± 8.01 | 28.5 ± 8.03 | 175.6 ± 16.82 95.8 ± 7.97 | 122.5 ± 7.2 72.6 ± 8.73 | AST and ALT |
| Udenze et al., 2014 [37] | Nigeria | Case–control | 21 | 21 | 31.73 ± 5.5 | 32.57 ± 5.5 | 153.4 ± 52 99.1 ± 34.5 | 116.19 ± 12.00 70.7 ± 1.12 | AST, ALT, and ALP |
| Al Ghazali et al., 2014 [39] | Iraq | Cross-sectional | 53 | 21 | 25.23 ± 6.23 | 27.28 ± 6.14 | 168.58 ± 20.54 110.39 ± 9.025 | 117.4 ± 9.95 76.7 ± 9.13 | AST and ALT |
| Nie et al., 2025 [40] | China | Retrospective cohort | 1200 | 11,499 | 30.09 ± 5.40 | 29.19 ± 4.64 | 134.76 ± 7.95 84.53 ± 7.36 | 115.28 ± 12.95 71.56 ± 6.57 | ALT, AST, and bilirubin |
| Shahid et al., 2019 [41] | Pakistan | Prospective cohort | 63 | 17 | 27.05 ± 5.89 | 30.65 ± 9.40 | 125.44 ± 16.23 83.95 ± 7.6 | 108.22 ± 5.89 79.55 ± 8.45 | ALP and bilirubin |
| Taimoor et al., 2017 [50] | Pakistan | Comparative cross-sectional | 50 | 50 | 25.92 ± 5.56 | 25.92 ± 5.56 | NR | NR | AST, ALP, and bilirubin |
| Walle et al., 2022 [49] | Ethiopia | Comparative cross-sectional | 63 | 63 | 28.1 ± 4.61 | 27.5 ± 4.77 | 145.4 ± 8.6 94.5 ± 6.1 | 103.7 ± 10.2 69.5 ± 7.5 | AST, ALT, and bilirubin |
| Haggai et al., 2022 [44] | Israel | Prospective cohort | 36 | 37 | 31.17 ± 7.60 | 28.59 ± 4.77 | 156.0 ± 14.2 94.25 ± 12.1 | 117.92 ± 10.8 70.0 ± 8.4 | AST and ALT |
| Zhang et al., 2025 [43] | China | Prospective cohort | 1588 | 35,858 | 32.4 ± 4.2 | 32.4 ± 4.2 | NR | NR | AST and ALT |
| Zhestkova et al., 2023 [53] | Russia | Cross-sectional | 73 | 50 | 30.65 ± 2.39 | 31.75 ± 2.01 | 150.23 ± 6.73 93.43 ± 3.06 | 108 ± 3.45 65 ± 2.9 | ALP and bilirubin |
| Singh et al., 2017 [55] | India | Cross-sectional | 70 | 70 | 25.6 ± 3.7 | 25.1 ± 3.9 | 156.5 ± 18.4 102.0 ± 16.3 | 117.2 ± 8.9 76.7 ± 4.5 | AST, ALT, ALP, and bilirubin |
| Zhang et al., 2022 [54] | China | Cohort | 244 | 5281 | 31.9 ± 4.5 | 30.9 ± 4.0 | NR | NR | AST, ALT, and ALP |
| Nainani and Bhargava, 2019 [56] | India | Comparative cross-sectional | 39 | 100 | 20–45 | NR | NR | NR | AST, ALT, ALP and bilirubin |
| Ohotu et al., 2023 [57] | Nigeria | Cross-sectional | 35 | 35 | NR | NR | 169.56 ± 20.02 107.45 ± 8.14 | 117.42 ± 6.01 75.36 ± 8.20 | AST, ALT, and ALP |
| Salman, 2016 [58] | Iraq | Comparative cross-sectional | 40 | 40 | NR | NR | 158.5 ± 8.92 111.75 ± 7.1 | 108.75 ± 7.9 73.0 ± 5.16 | AST, ALT and bilirubin |
| Das et al., 2013 [60] | India | Cross-sectional | 50 | 50 | NR | NR | 164.58 ± 22.04 104.48 ± 12.16 | 114.72 ± 8.01 72.41 ± 6.28 | ALT, AST, ALP, and bilirubin |
| Roy and Lodhi, 2019 [61] | India | Cross-sectional | 30 | 30 | 27.53 ± 5.15 | 29.23 ± 6.08 | NR | NR | AST, ALT, and bilirubin |
| Al-Sultan et al. [62] | Iraq | Comparative cross-sectional | 60 | 35 | NR | NR | NR | NR | AST, ALT, and ALP |
| Afroz et al., 2021 [63] | India | Cross-sectional | 50 | 50 | 28.0 ± 5.93 | 26.20 ± 5.32 | 153.4 ± 16.7 91.7 ± 5.2 | 113.4 ± 4.5 74.1 ± 6.6 | AST and ALT |
| Saha et al., 2022 [59] | India | Cross-sectional | 60 | 60 | 32.42 ± 6.45 | 26.44 ± 8.14 | 146.32 ± 8.21 94.46 ± 6.84 | 110.86 ± 12.54 79.44 ± 6.47 | AST, ALT, ALP, and bilirubin |
| Al-Jameil et al., 2015 [64] | Saudi Arabia | Cross-sectional | 40 | 40 | 31.55 ± 6.14 | 31.20 ± 5.84 | 167.0 ± 24.43 98.51 ± 11.16 | 113.56 ± 13.93 67.66 ± 9.38 | AST, ALT, ALP, and bilirubin |
| Makuyana et al., 2002 [65] | Zimbabwe | Cross-sectional | 38 | 72 | 27 ± 6 | 25 ± 6 | 165 ± 20 109 ± 13 | 118 ± 11 74 ± 8 | AST, ALT, ALP, and bilirubin |
| Hazari et al., 2014 [66] | India | Cross-sectional | 40 | 40 | 32.42 ± 6.45 | 25.13 ± 2.34 | 146.32 ± 8.21 94.46 ± 6.84 | 110.0 ± 10.4 67.4 ± 4.8 | AST, ALP. ALP and bilirubin |
| Edebiri et al., 2025 [67] | Nigeria | Comparative cross-sectional | 40 | 20 | NR | NR | NR | NR | ALT, AST, and ALP |
| Outcomes | Moderators | β | se | p | Lower CI | Upper CI |
|---|---|---|---|---|---|---|
| AST | Intercept | 2.827 | 0.335 | <0.001 | 2.170 | 3.484 |
| Study design | −0.630 * | 0.183 | <0.001 | −0.989 | −0.270 | |
| Intercept | 1.7535 | 0.424 | <0.001 | 0.923 | 2.584 | |
| Maternal age | 0.0198 | 0.172 | 0.909 | −0.318 | 0.358 | |
| Intercept | 2.306 | 0.322 | <0.001 | 1.675 | 2.936 | |
| BMI | −0.281 | 0.157 | 0.075 | −0.589 | 0.028 | |
| Intercept | 2.078 | 0.2617 | <0.001 | 1.565 | 2.591 | |
| Gestation age | −0.120 | 0.0910 | 0.187 | −0.298 | 0.058 | |
| Intercept | 0.182 | 0.470 | 0.698 | −0.739 | 1.103 | |
| Quality | 1.084 * | 0.299 | <0.001 | 0.498 | 1.670 | |
| Intercept | 2.131 | 0.566 | <0.001 | 1.021 | 3.241 | |
| Continent | −0.179 | 0.293 | 0.542 | −0.753 | 0.395 | |
| ALT | Intercept | 3.01 | 0.573 | <0.001 | 1.884 | 4.131 |
| Study design | −1.08 * | 0.459 | 0.019 | −1.979 | −0.180 | |
| Intercept | 1.443 | 0.451 | 0.001 | 0.558 | 2.327 | |
| Maternal age | 0.137 | 0.203 | 0.499 | −0.260 | 0.534 | |
| Intercept | 2.454 | 0.318 | <0.001 | 1.831 | 3.078 | |
| BMI | −0.406 * | 0.147 | 0.006 | −0.694 | −0.117 | |
| Intercept | 1.340 | 0.363 | <0.001 | 0.628 | 2.052 | |
| Gestation age | 0.228 | 0.190 | 0.231 | −0.145 | 0.601 | |
| Intercept | 0.653 | 0.547 | 0.232 | −0.419 | 1.725 | |
| Quality | 0.729 * | 0.353 | 0.039 | 0.037 | 1.421 | |
| Intercept | 1.8034 | 0.650 | 0.006 | 0.529 | 3.078 | |
| Continent | −0.0452 | 0.338 | 0.894 | −0.709 | 0.618 | |
| ALP | Intercept | 1.816 | 0.583 | 0.002 | 0.673 | 2.958 |
| Study design | −0.231 | 0.297 | 0.435 | −0.813 | 0.350 | |
| Intercept | 3.027 | 0.673 | <0.001 | 1.709 | 4.345 | |
| Maternal age | −0.720 * | 0.278 | 0.010 | −1.266 | −0.175 | |
| Intercept | 1.689 | 0.539 | 0.002 | 0.633 | 2.745 | |
| BMI | −0.177 | 0.286 | 0.535 | −0.737 | 0.383 | |
| Intercept | 0.993 | 0.490 | 0.043 | 0.032 | 1.954 | |
| Gestation age | 0.220 | 0.226 | 0.330 | −0.223 | 0.663 | |
| Intercept | −0.705 | 0.753 | 0.349 | −2.181 | 0.772 | |
| Quality | 1.444 * | 0.488 | 0.003 | 0.488 | 2.400 | |
| Intercept | −2.14 | 0.938 | 0.022 | −3.982 | −0.305 | |
| Continent | 2.07 * | 0.528 | <0.001 | 1.032 | 3.104 | |
| Bilirubin | Intercept | 1.189 | 0.234 | <0.001 | 0.730 | 1.647 |
| Study design | −0.384 * | 0.134 | 0.004 | −0.647 | −0.122 | |
| Intercept | 1.237 | 0.294 | <0.001 | 0.660 | 1.814 | |
| Maternal age | −0.304 * | 0.129 | 0.019 | −0.558 | −0.050 | |
| Intercept | 0.856 | 0.277 | 0.002 | 0.312 | 1.399 | |
| BMI | −0.142 | 0.145 | 0.328 | −0.427 | 0.143 | |
| Intercept | 0.5900 | 0.248 | 0.017 | 0.104 | 1.075 | |
| Gestation age | 0.0151 | 0.135 | 0.911 | −0.250 | 0.280 | |
| Intercept | −0.607 | 0.338 | 0.073 | −1.269 | 0.056 | |
| Quality | 0.761 * | 0.206 | <0.001 | 0.358 | 1.164 | |
| Intercept | −0.0808 | 0.662 | 0.903 | −1.379 | 1.217 | |
| Continent | 0.3815 | 0.354 | 0.282 | −0.313 | 1.076 |
Disclaimer/Publisher’s Note: The statements, opinions and data contained in all publications are solely those of the individual author(s) and contributor(s) and not of MDPI and/or the editor(s). MDPI and/or the editor(s) disclaim responsibility for any injury to people or property resulting from any ideas, methods, instructions or products referred to in the content. |
© 2026 by the authors. Licensee MDPI, Basel, Switzerland. This article is an open access article distributed under the terms and conditions of the Creative Commons Attribution (CC BY) license.
Share and Cite
Strauss, K.-L.E.; Phoswa, W.N.; Mokgalaboni, K. Pre-Eclampsia-Induced Maternal Liver Dysfunction: Systematic Review, Meta-Analysis and Meta-Regression of Observation Studies. Life 2026, 16, 223. https://doi.org/10.3390/life16020223
Strauss K-LE, Phoswa WN, Mokgalaboni K. Pre-Eclampsia-Induced Maternal Liver Dysfunction: Systematic Review, Meta-Analysis and Meta-Regression of Observation Studies. Life. 2026; 16(2):223. https://doi.org/10.3390/life16020223
Chicago/Turabian StyleStrauss, Kay-Lee E., Wendy N. Phoswa, and Kabelo Mokgalaboni. 2026. "Pre-Eclampsia-Induced Maternal Liver Dysfunction: Systematic Review, Meta-Analysis and Meta-Regression of Observation Studies" Life 16, no. 2: 223. https://doi.org/10.3390/life16020223
APA StyleStrauss, K.-L. E., Phoswa, W. N., & Mokgalaboni, K. (2026). Pre-Eclampsia-Induced Maternal Liver Dysfunction: Systematic Review, Meta-Analysis and Meta-Regression of Observation Studies. Life, 16(2), 223. https://doi.org/10.3390/life16020223