
Preparation of Auricularia auricula-Derived Immune Modulators and Alleviation of Cyclophosphamide-Induced Immune Suppression and Intestinal Microbiota Dysbiosis in Mice

 ,
,
Abstract
1. Introduction
2. Materials and Methods
2.1. Chemicals and Reagents
2.2. Screening Methodology
2.2.1. In Vitro Antioxidant Activity
- (1)
- 2,2-diphenyl-1-picrylhydrazyl (DPPH) Radical Scavenging Assay
- (2)
- Superoxide Anion Radical (O2−) Scavenging Assay
- (3)
- Hydroxyl radical (·OH) scavenging capacity
2.2.2. Determination of Degree of Hydrolysis (DH)
2.3. Obtainment of Antioxidant Polysaccharides and Polypeptides
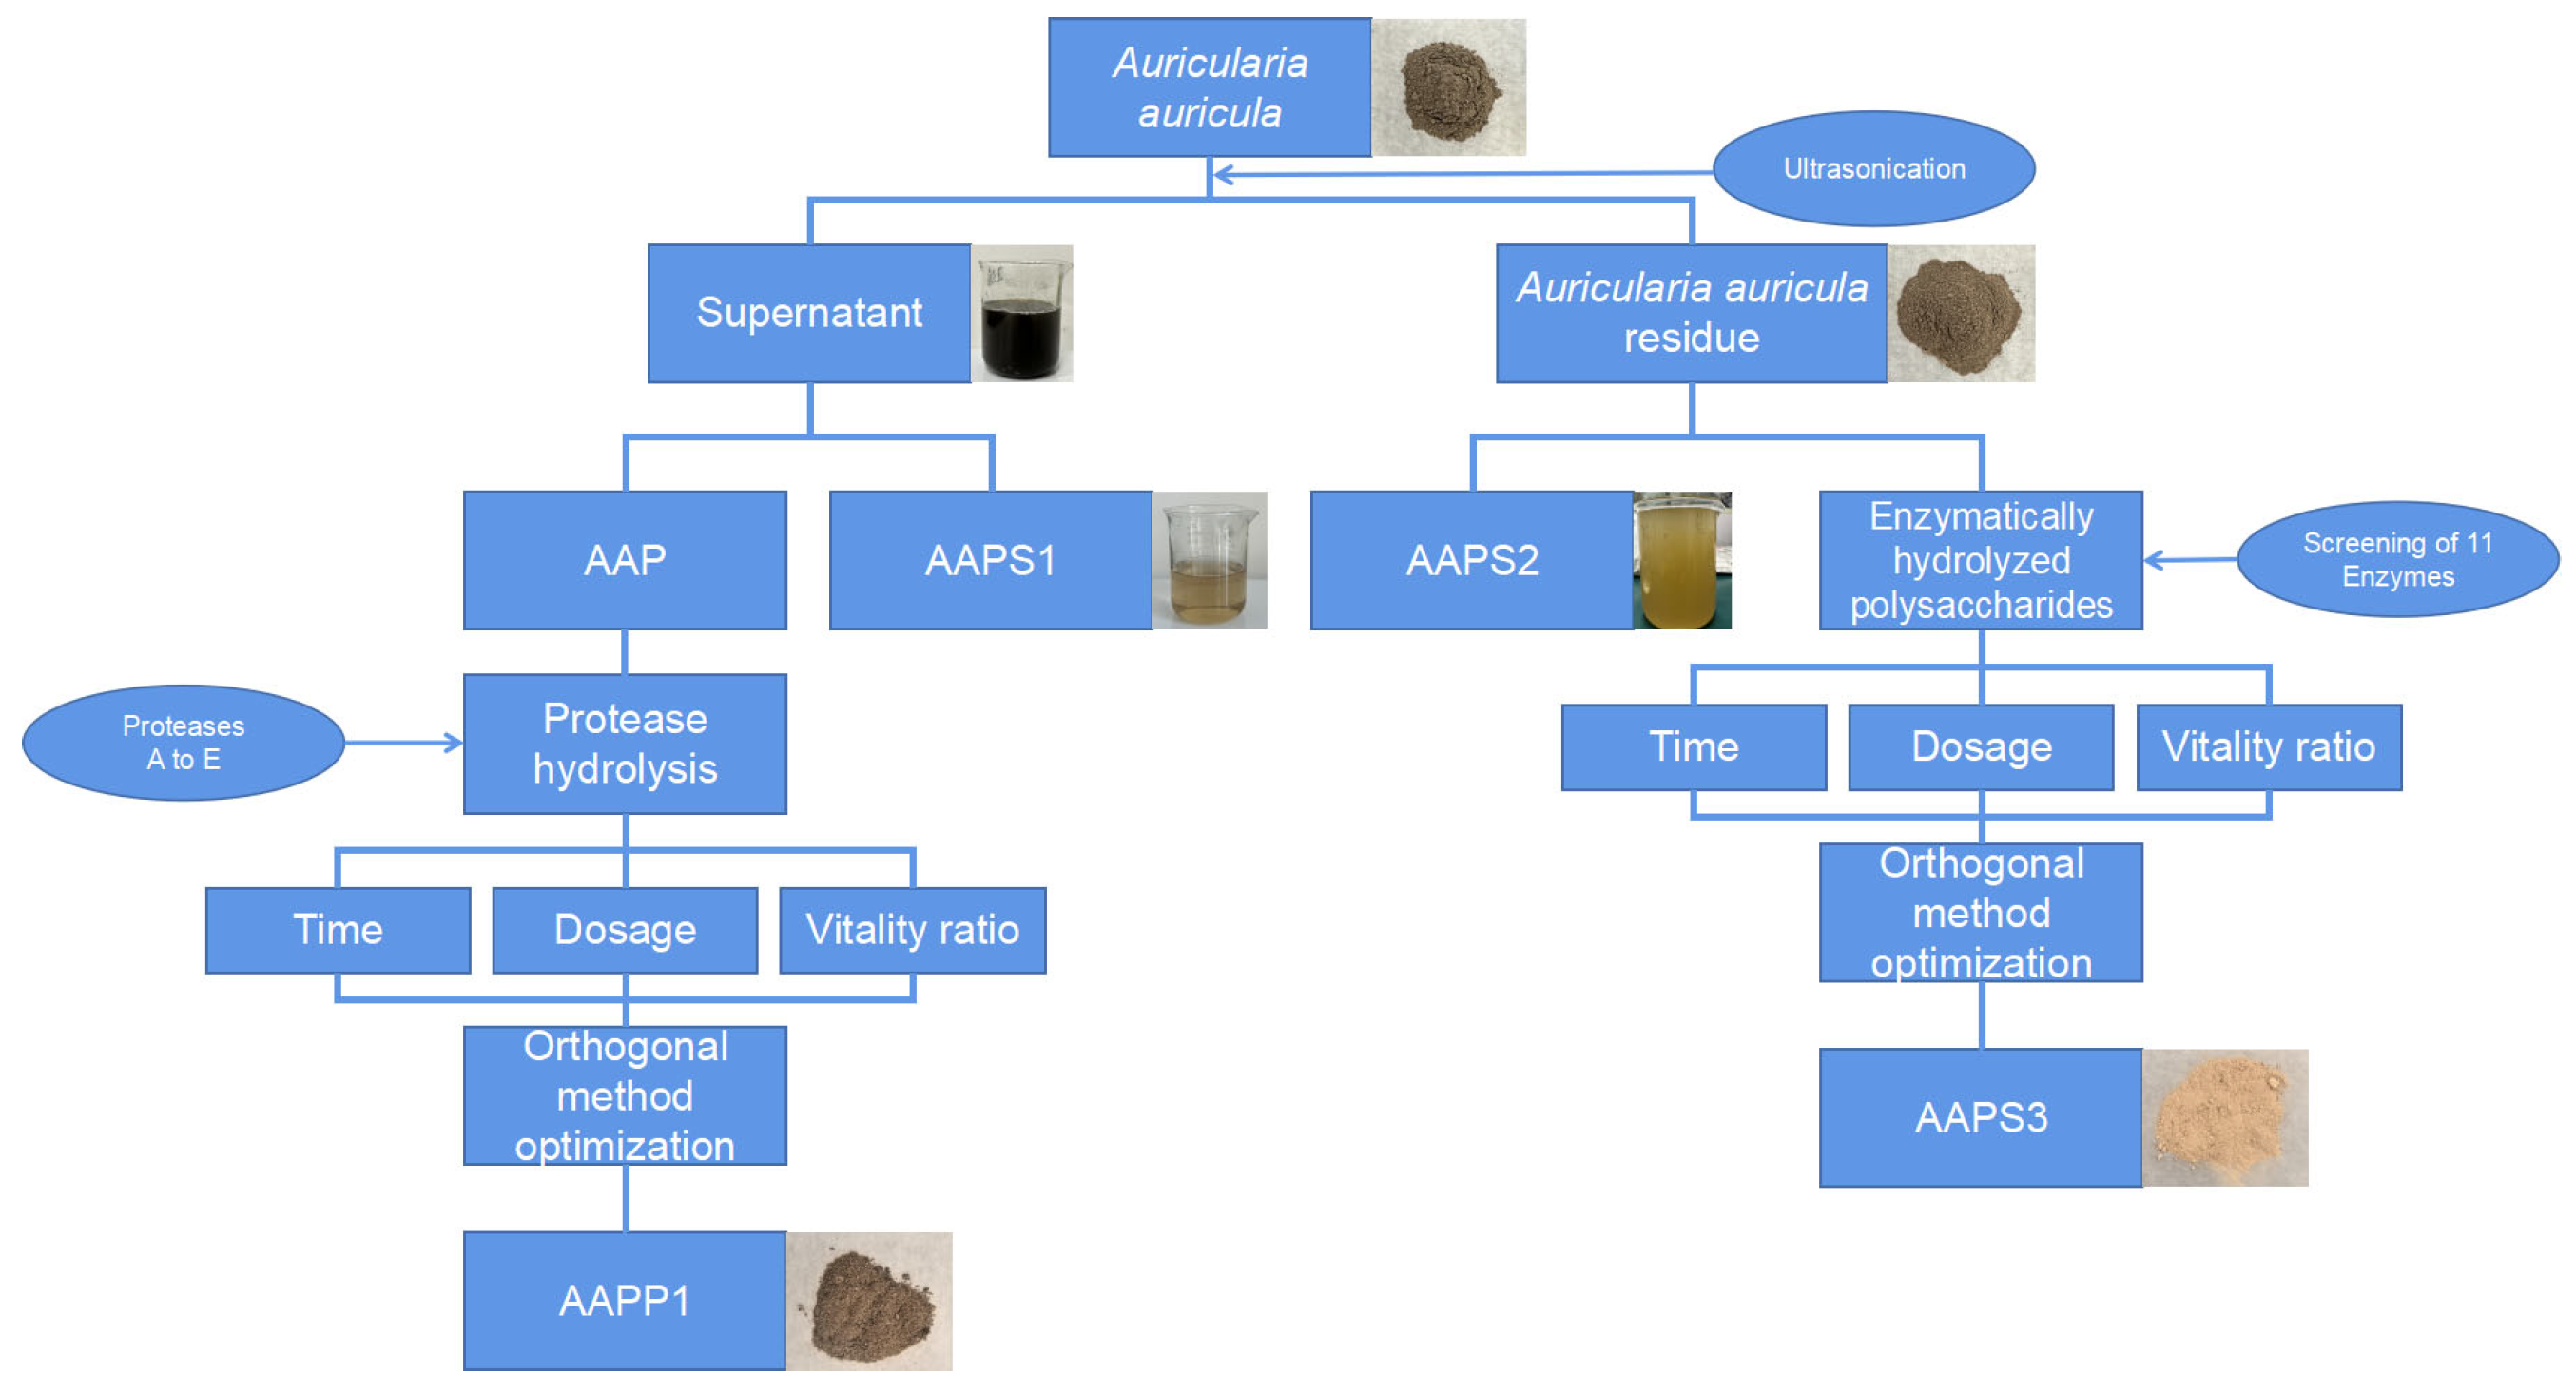
2.3.1. Flowchart
2.3.2. Extraction of Auricularia Auricula Protein (AAP)
2.3.3. Obtainment of Antioxidant Polypeptides and Polysaccharides
- (1)
- Antioxidant Polypeptides
- a.
- Enzymatic Hydrolysis of Polypeptides
- b.
- Optimization of Enzymatic Hydrolysis Conditions
- (2)
- Antioxidant Polysaccharides
- a.
- Polysaccharides in Supernatant from Ammonium Sulfate Precipitation of Protein (AAPS1)
- b.
- Preparation of Water-Extracted Polysaccharides from Auricularia auricula Residue (AAPS2)
- c.
- Enzymatically Hydrolyzed Polysaccharides (AAPS3)
- d.
- Optimization of Enzymatic Hydrolysis Conditions
2.4. Animal Model and Study Design
2.5. Determination of the Immune Organ Indices
2.6. Histopathological Analysis of Spleen
2.7. Gut Microbiota Analysis of Feces
2.7.1. DNA Extraction
2.7.2. 16S rRNA Gene Amplicon Sequencing
2.7.3. Sequence Analysis
2.8. Determination of the Immunoglobulin Contents
2.9. Determination of the Level of Oxidative Stress in the Liver
2.10. Statistical Analysis
3. Result and Discussion
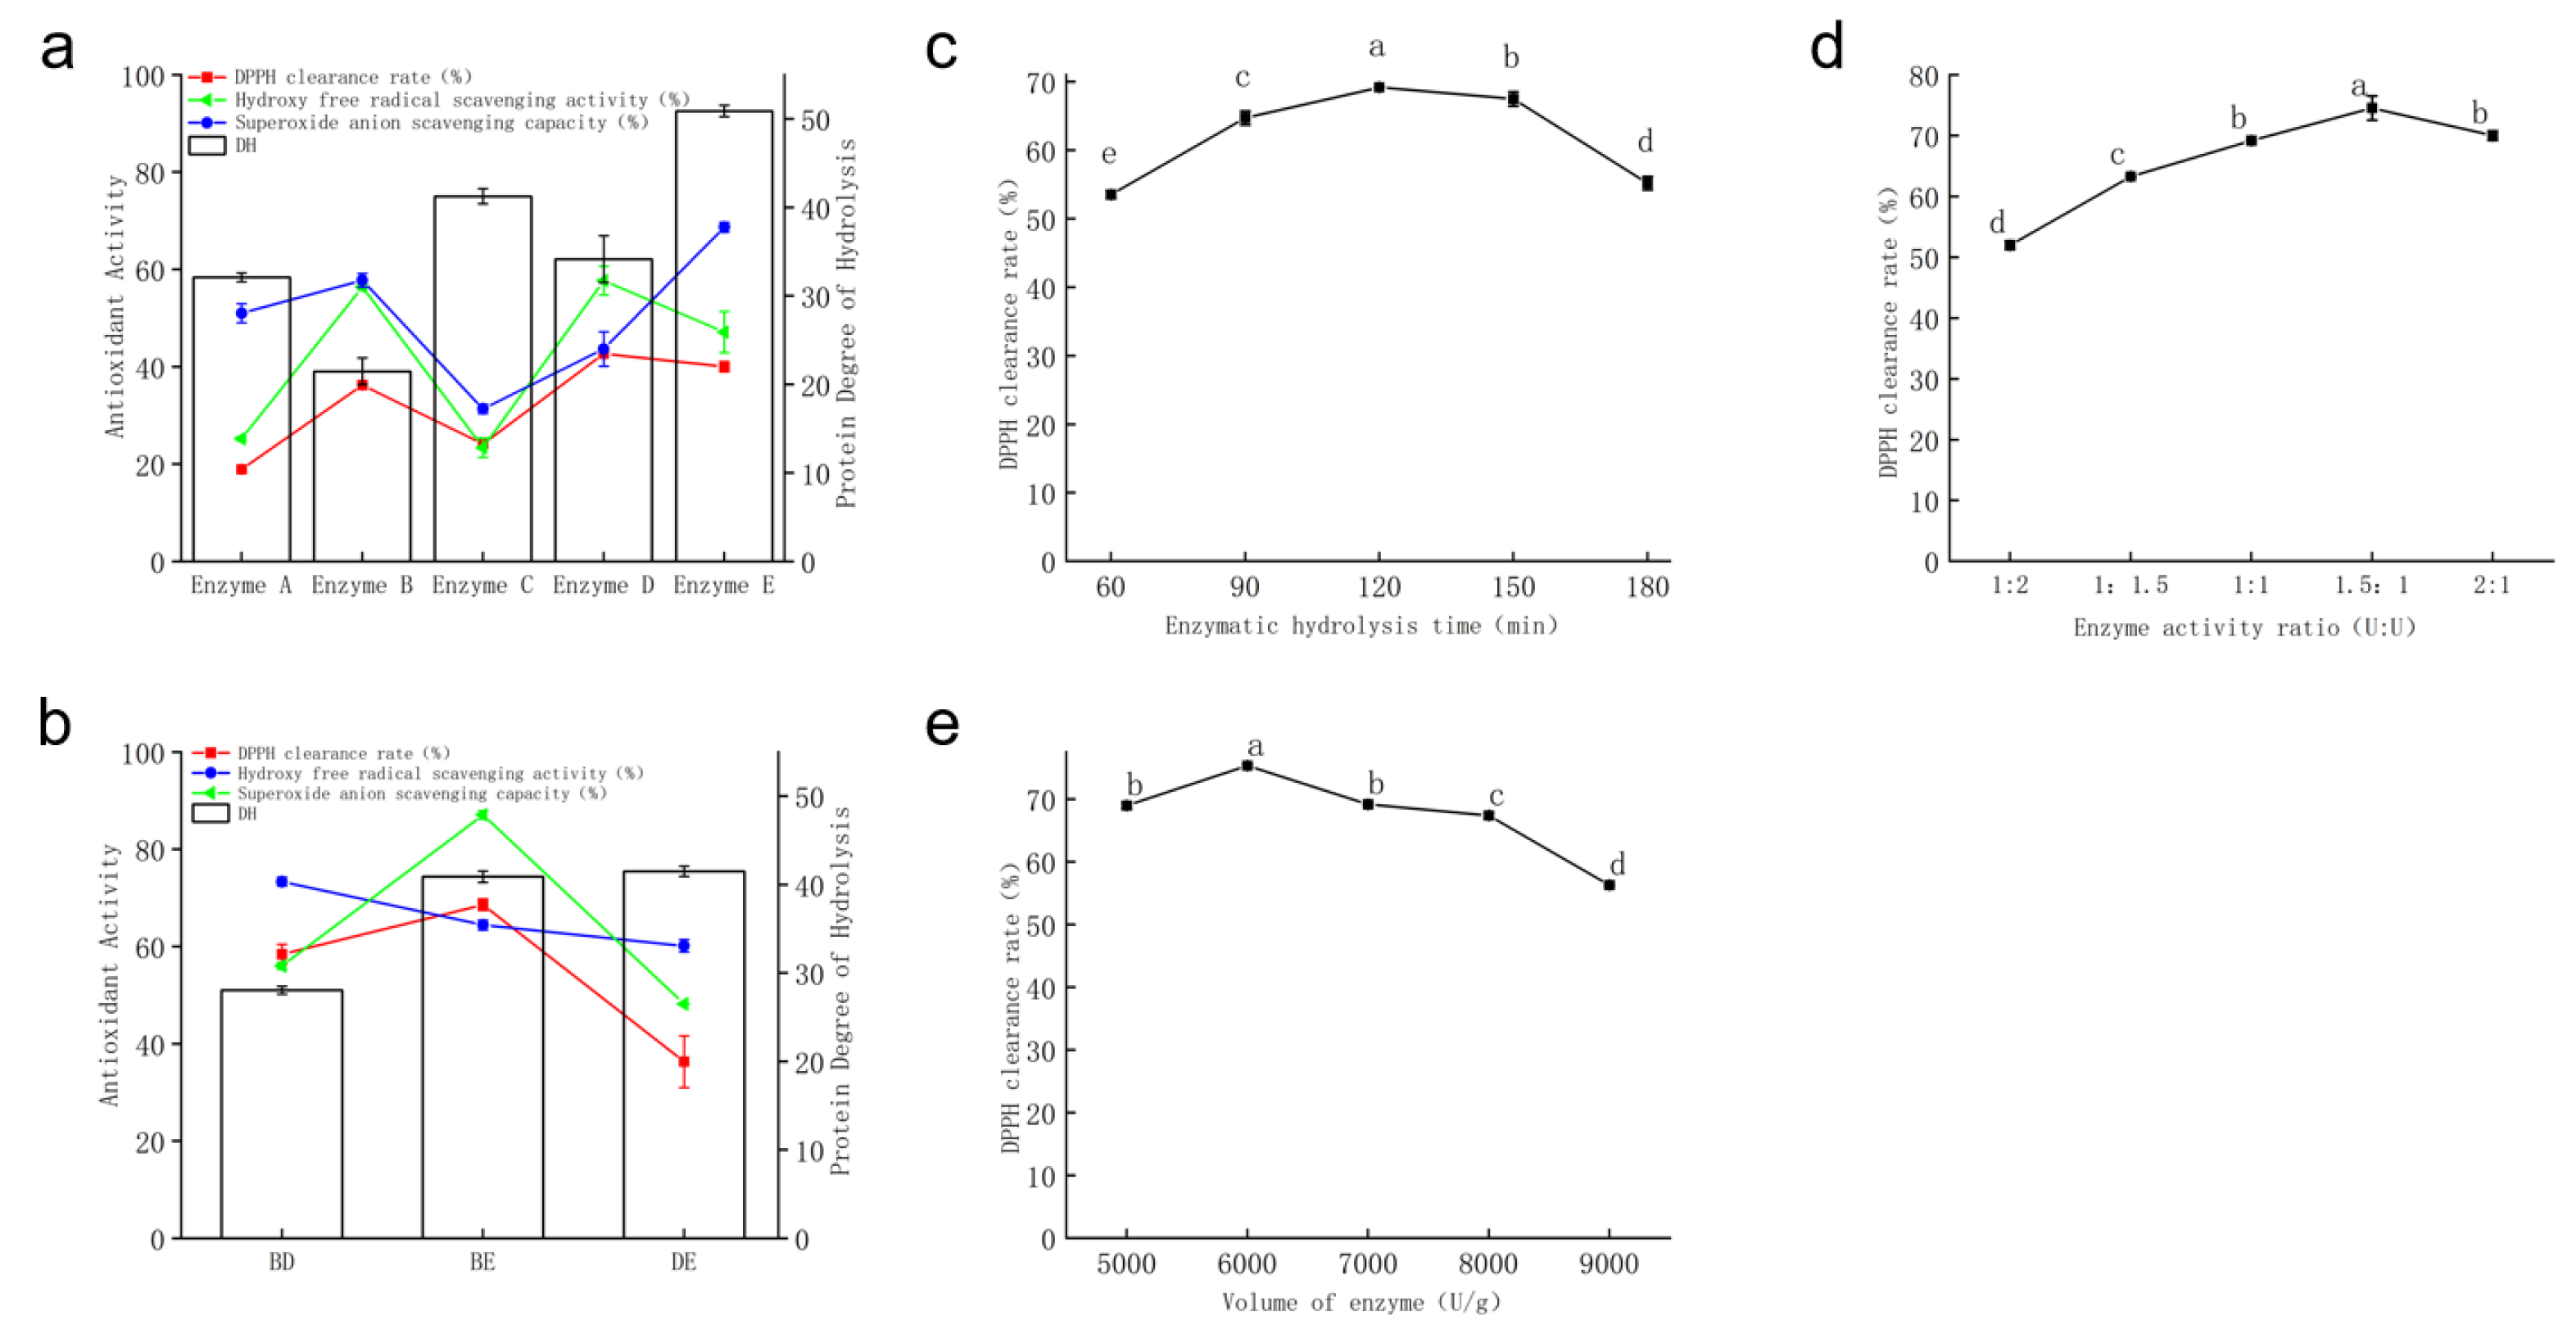
3.1. Screening of Optimal Conditions to Prepare AAPP1
- a.
- Screening of Proteases
- b.
- Screening of Protease Compound Combinations
- c.
- Optimization of Enzymatic Hydrolysis Conditions
- (I)
- Enzymatic Hydrolysis Time
- (II)
- Compound Enzyme Ratio
- (III)
- Enzyme Dosage
- (IV)
- Results of Orthogonal Test
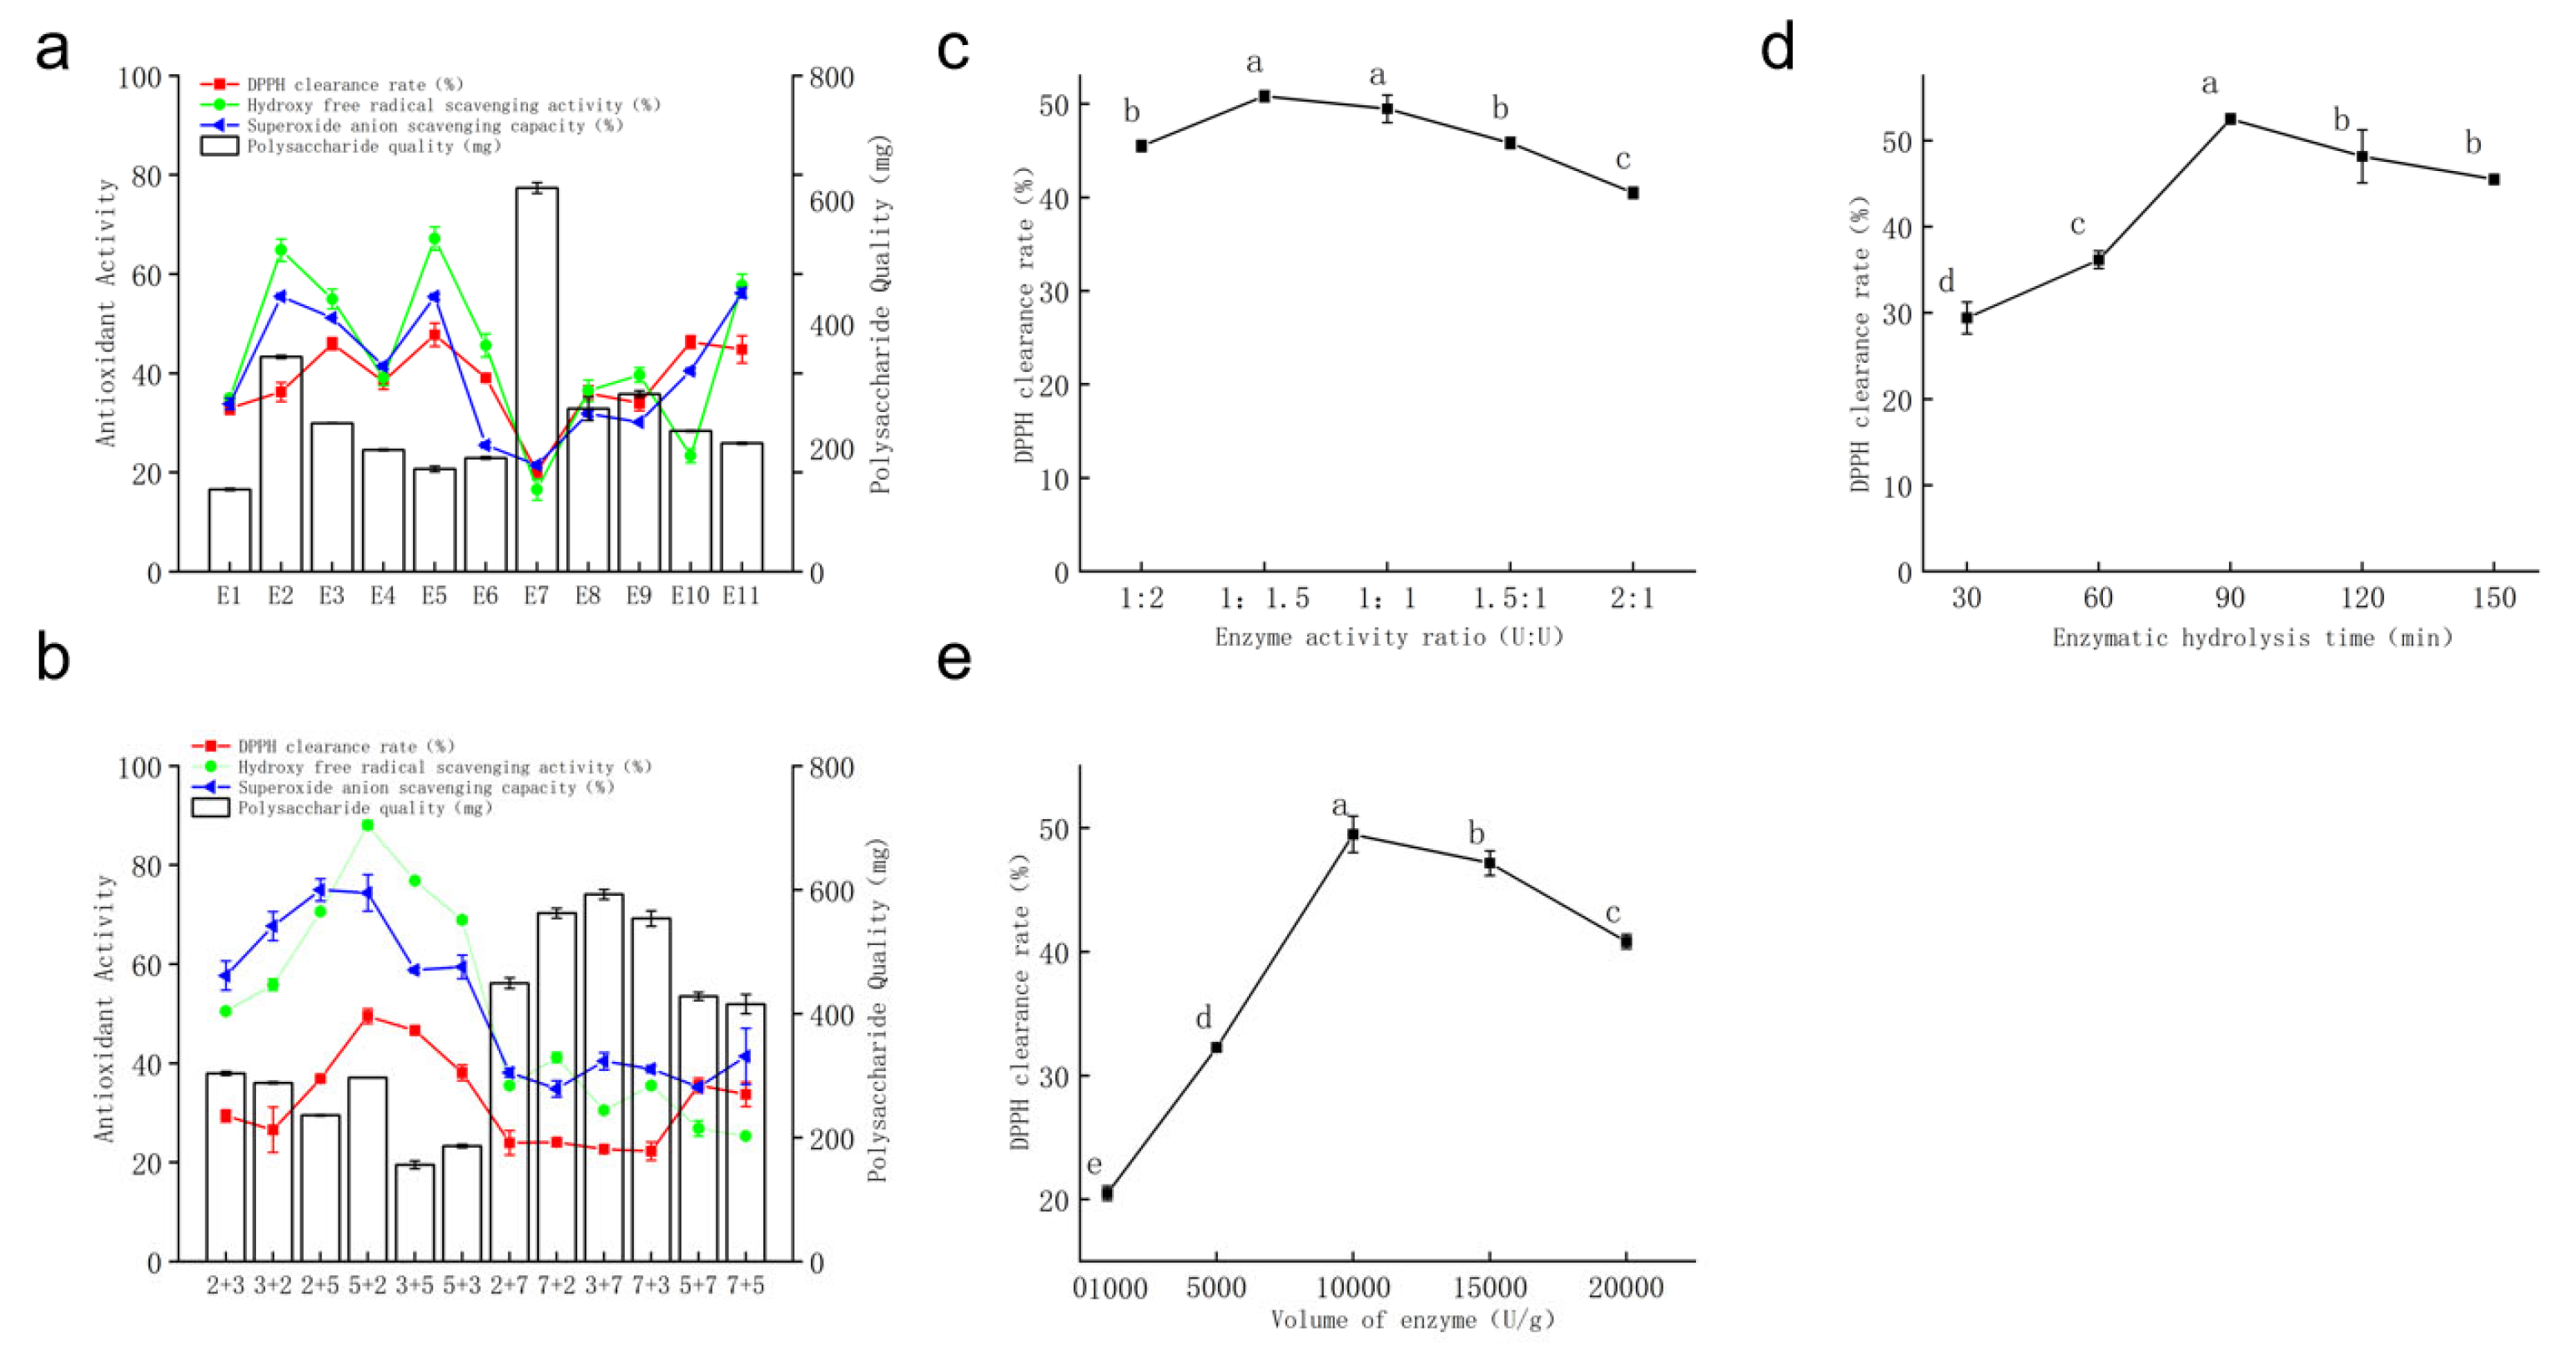
3.2. Screening of Optimal Condition to Prepare AAPS3
- a.
- Single Enzyme Screening
- b.
- Combined Enzyme Screening
- c.
- Optimization of enzymatic hydrolysis conditions
- (I)
- Enzymatic Hydrolysis Time
- (II)
- Proportion of Combined Enzymes
- (III)
- Enzyme Dosage
- (IV)
- Results of Orthogonal Test
3.3. Comparison of In Vitro Antioxidant Activities of Each Component
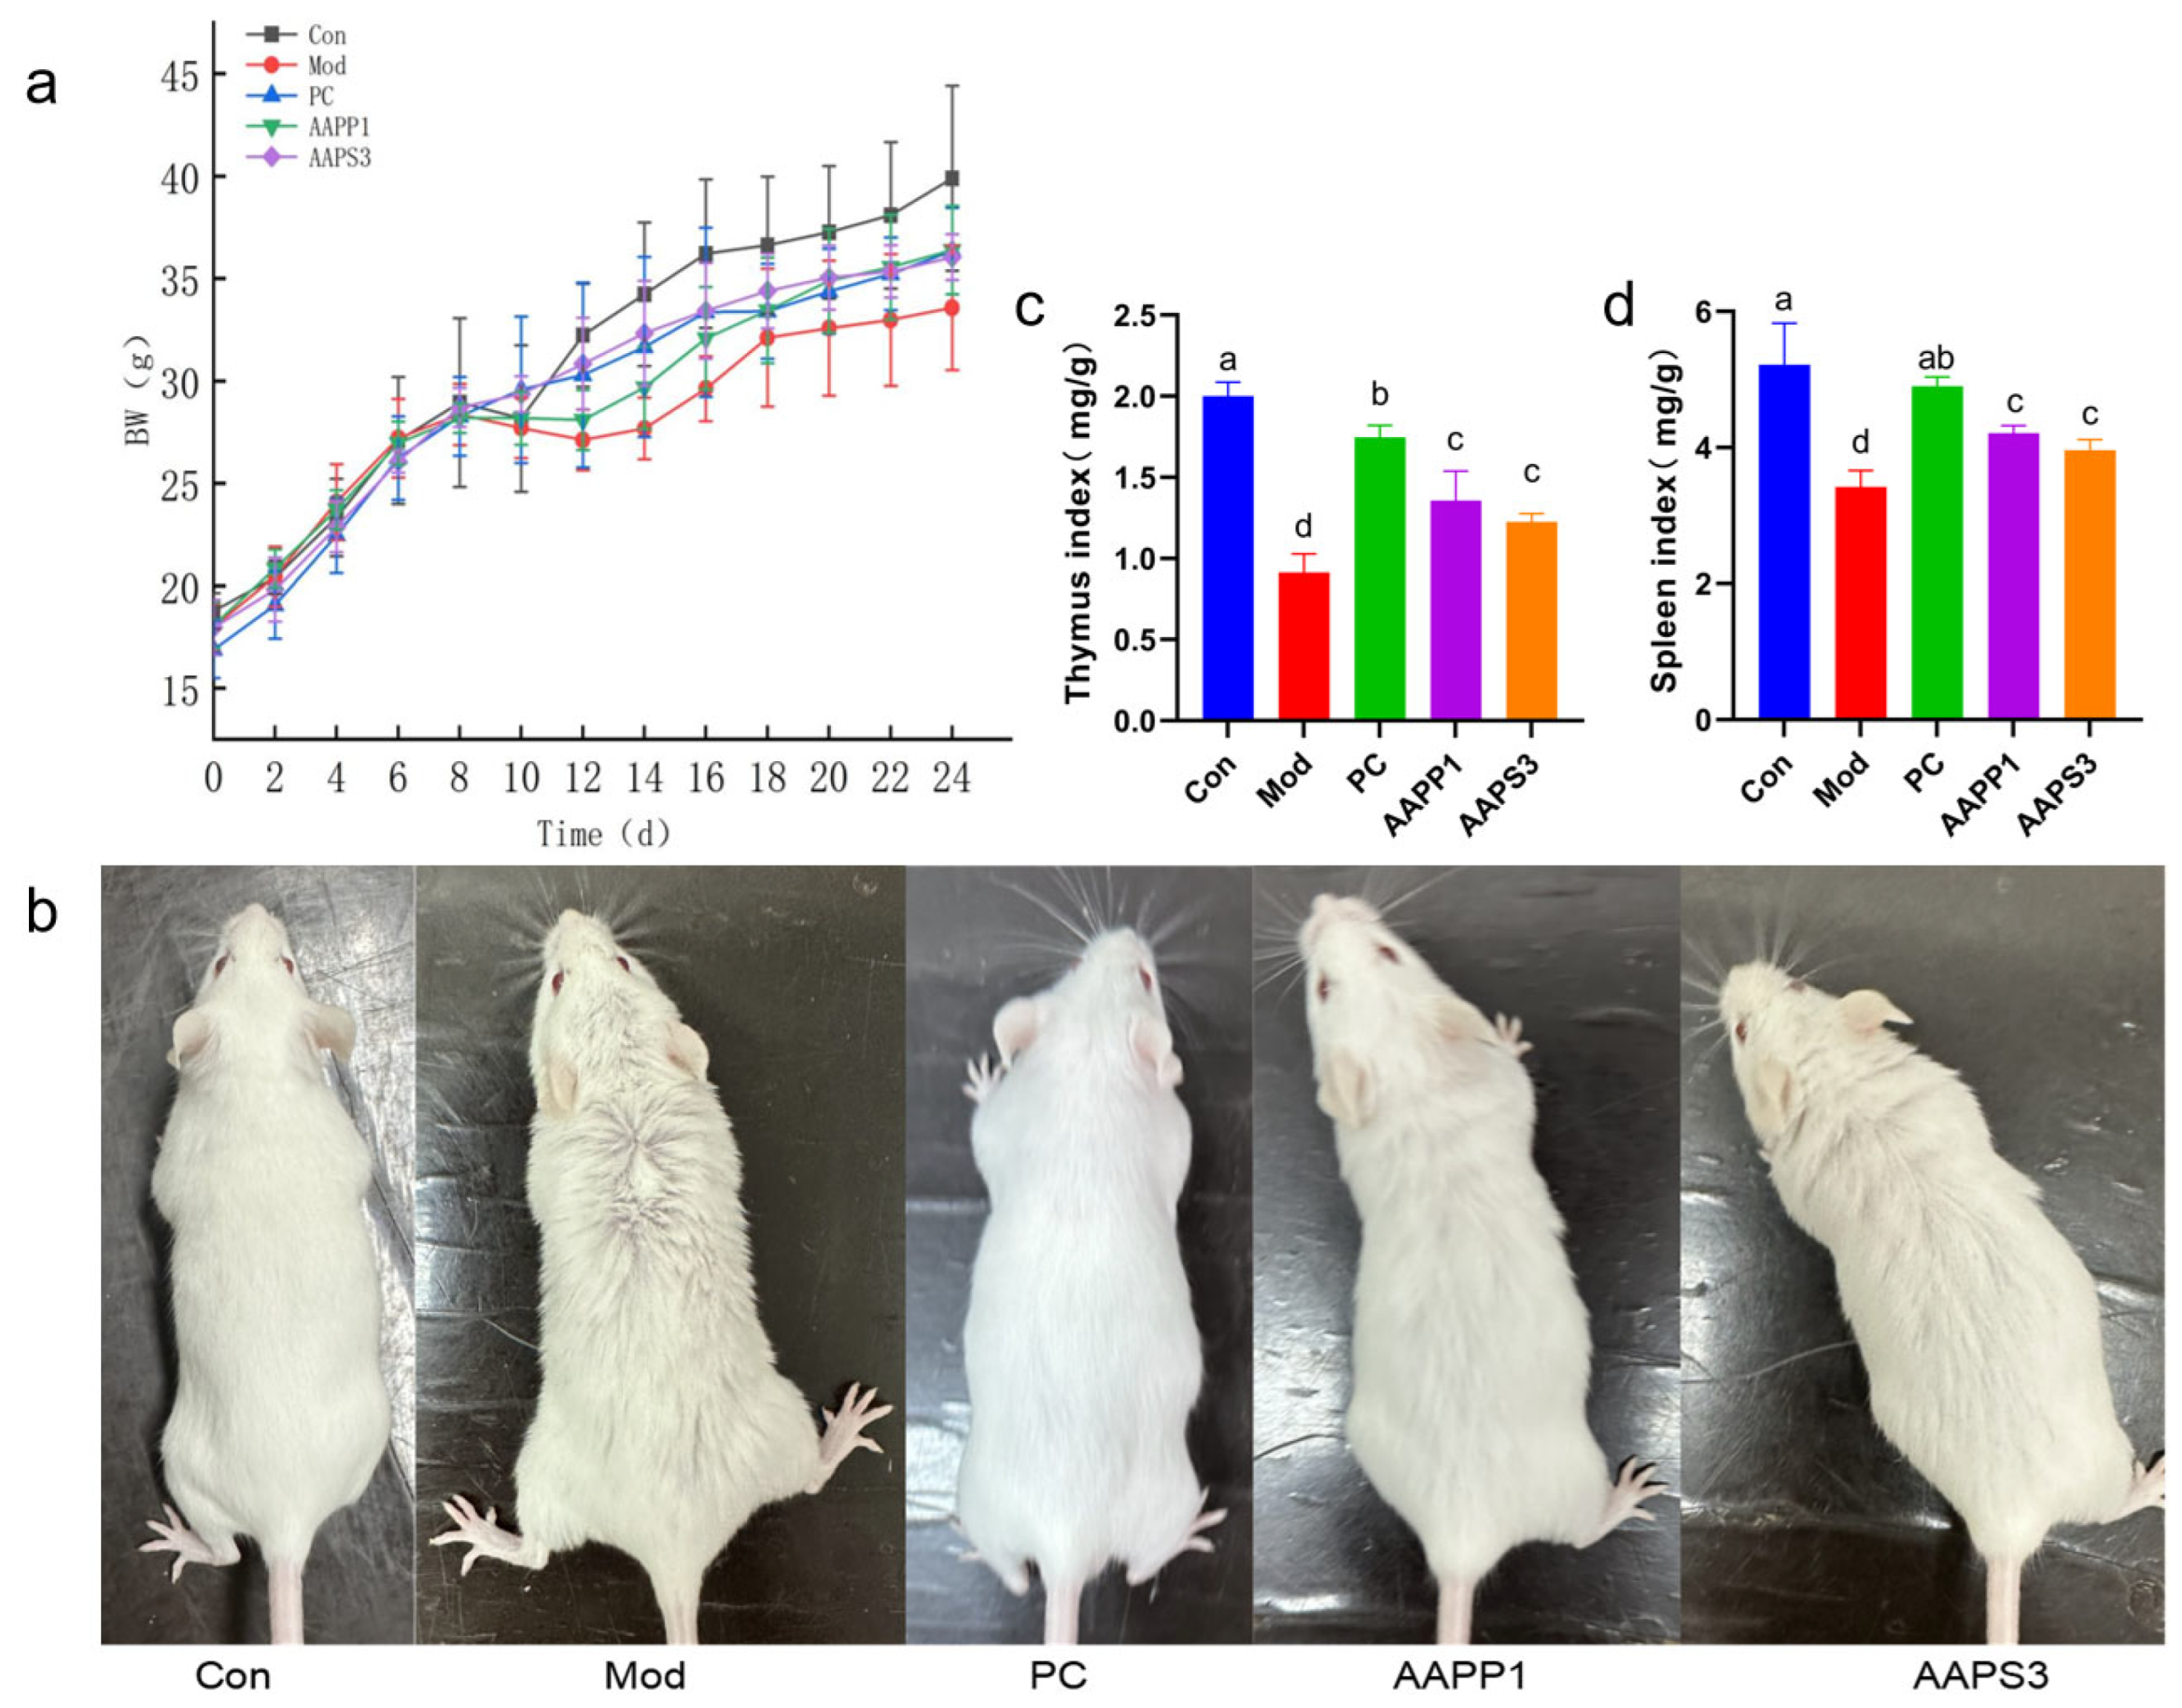
3.4. Effects of AAPP1 and AAPS3 on Body Weight and Immune Organ Indexes of Immunosuppressed Mice
- a.
- Body weight and hair changes in immunosuppressed mice
- b.
- Effects on Immune Organ Indexes of Immunosuppressed Mice
3.5. Effects of AAPP1 and AAPS3 on Serum Cytokines and Immunoglobulins in Immunosuppressed Mice
- a.
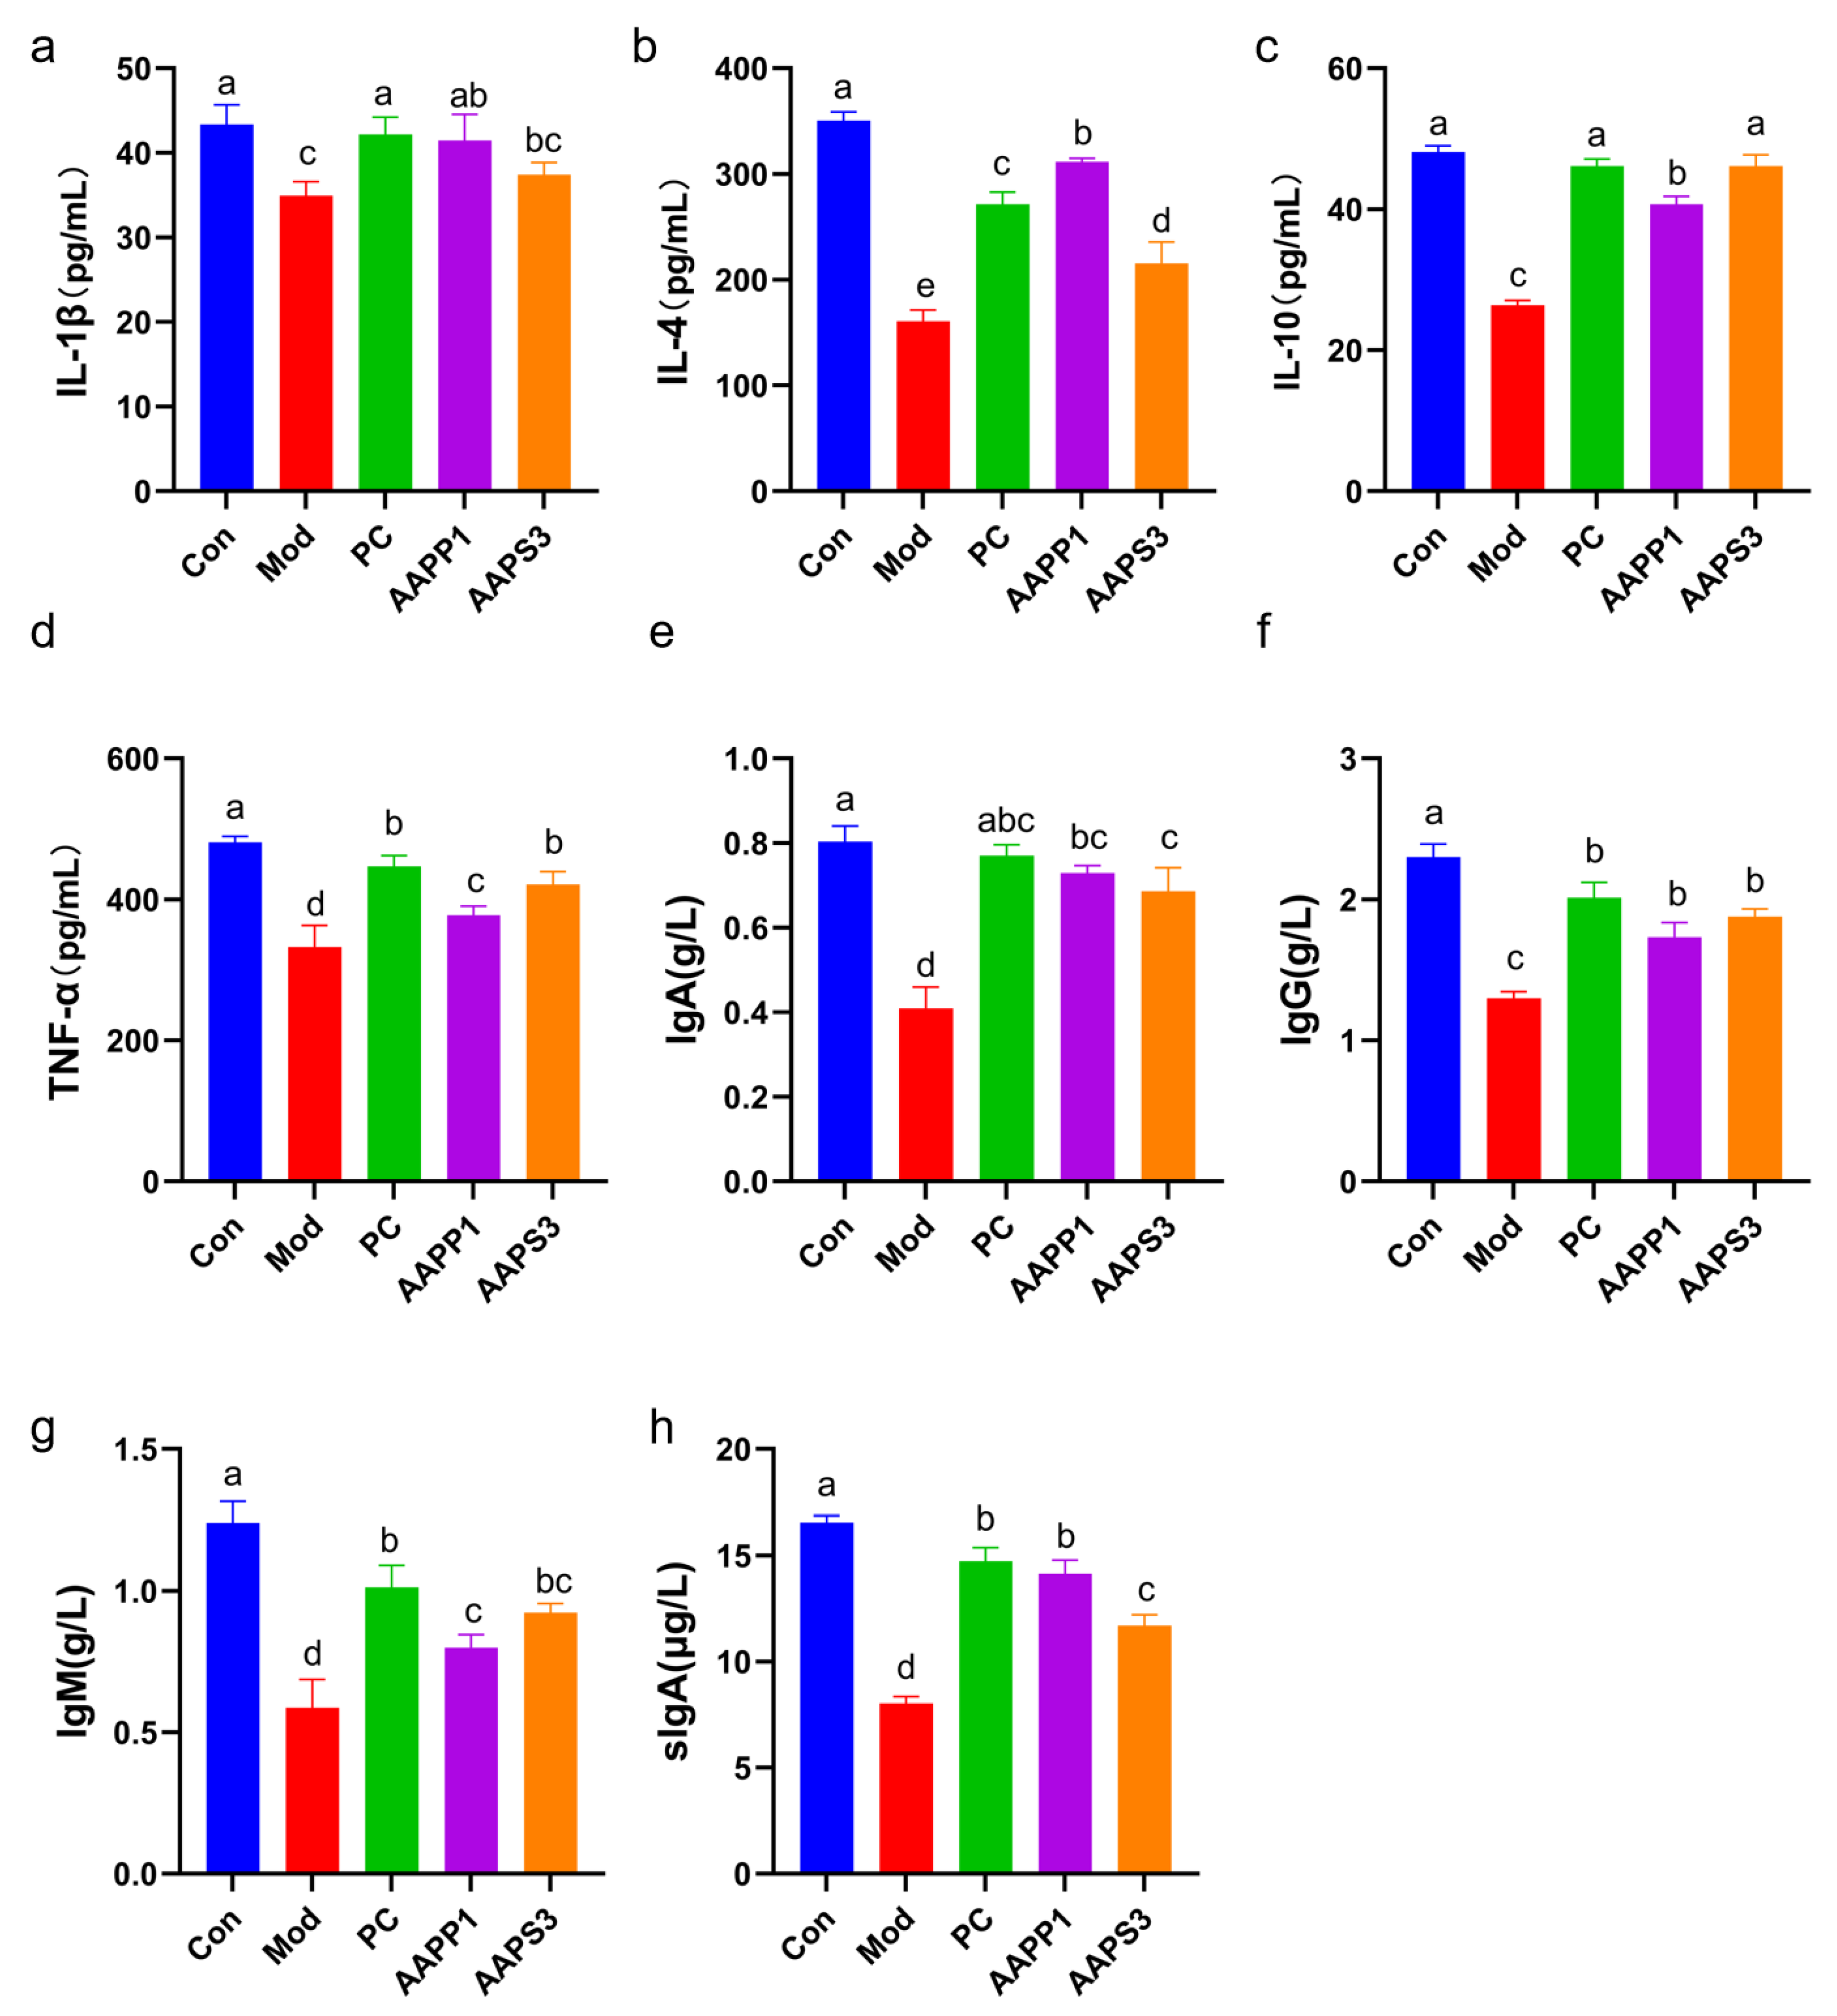
- Changes in Serum Cytokines in Immunosuppressed Mice
- b.
- Changes in Immunoglobulin Content in Serum and Intestinal Tract of Immunosuppressed Mice
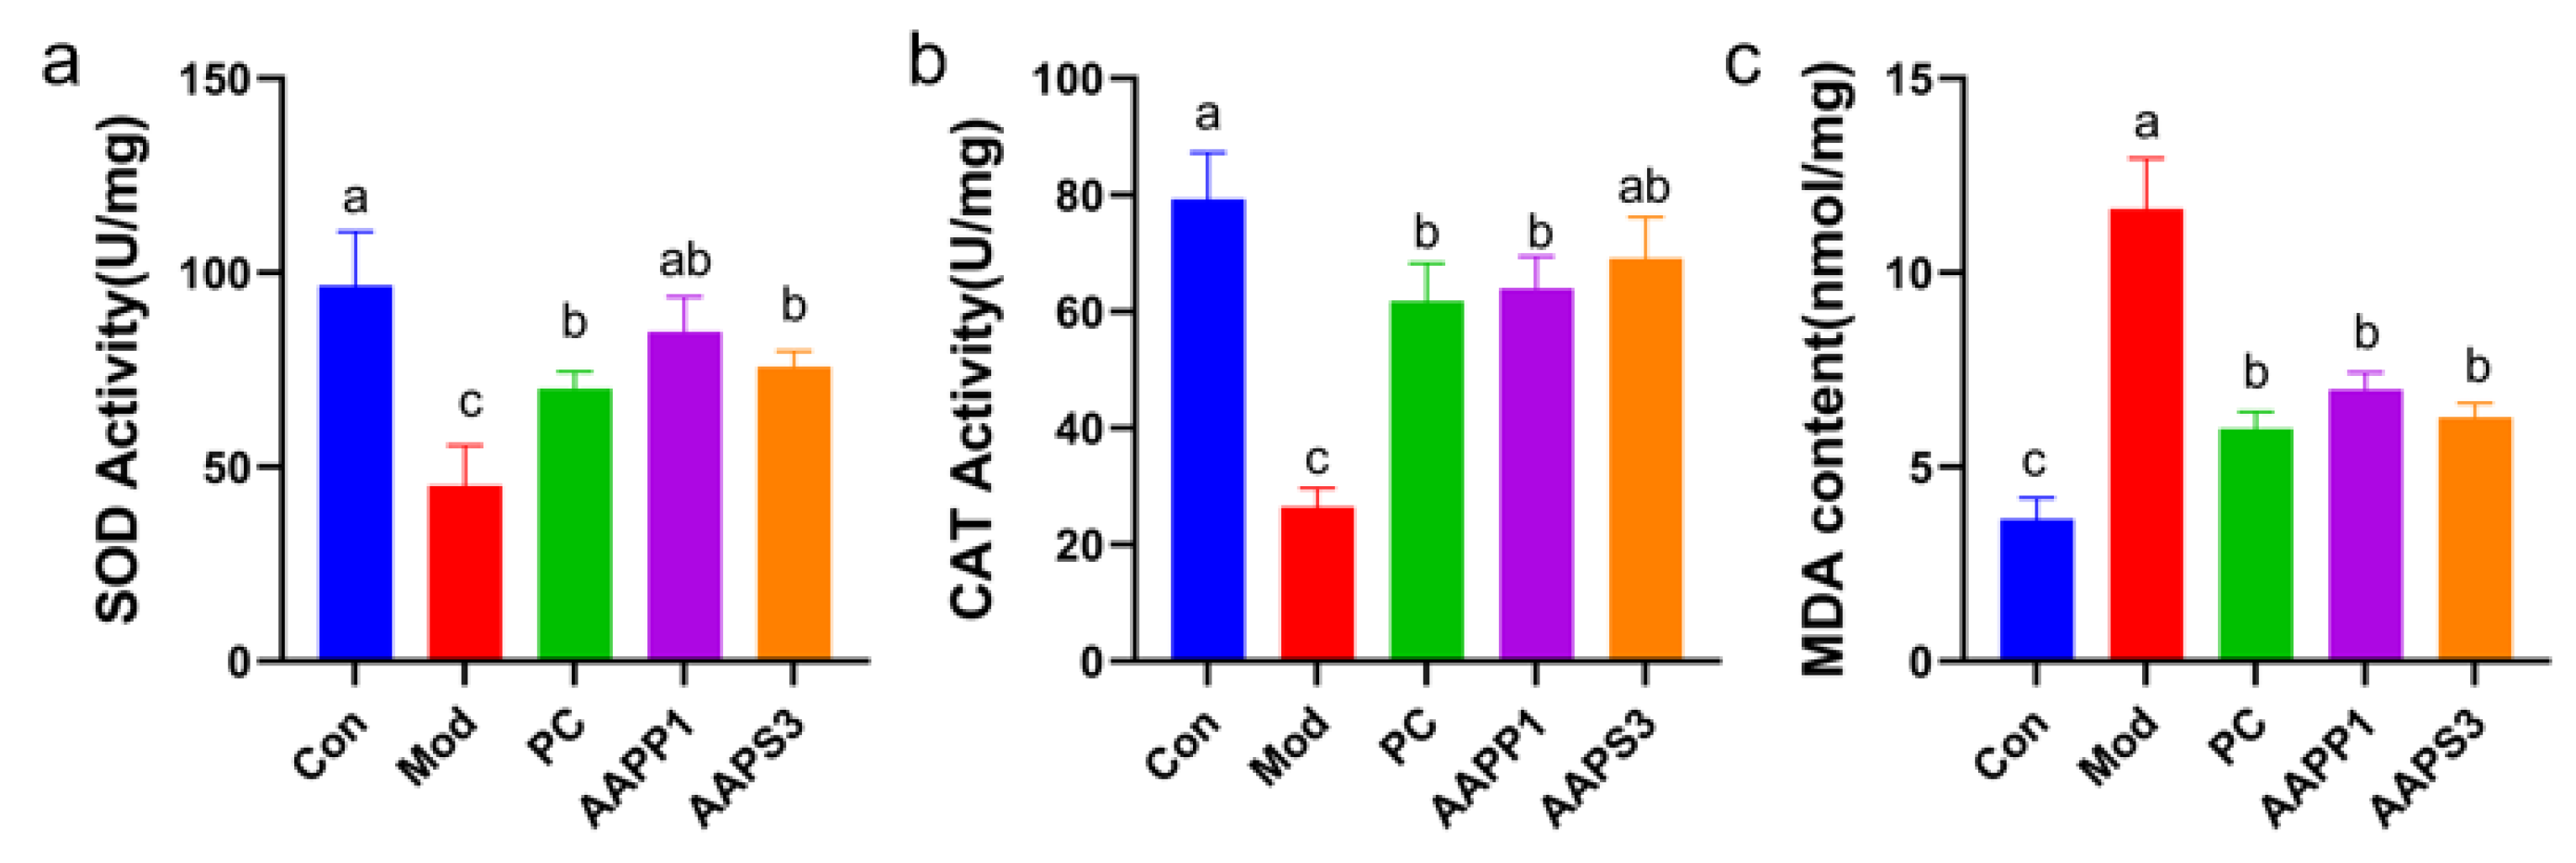
3.6. Protective Effects of AAPP1 and AAPS3 on Oxidative Damage in Liver Tissues of Immunosuppressed Mice
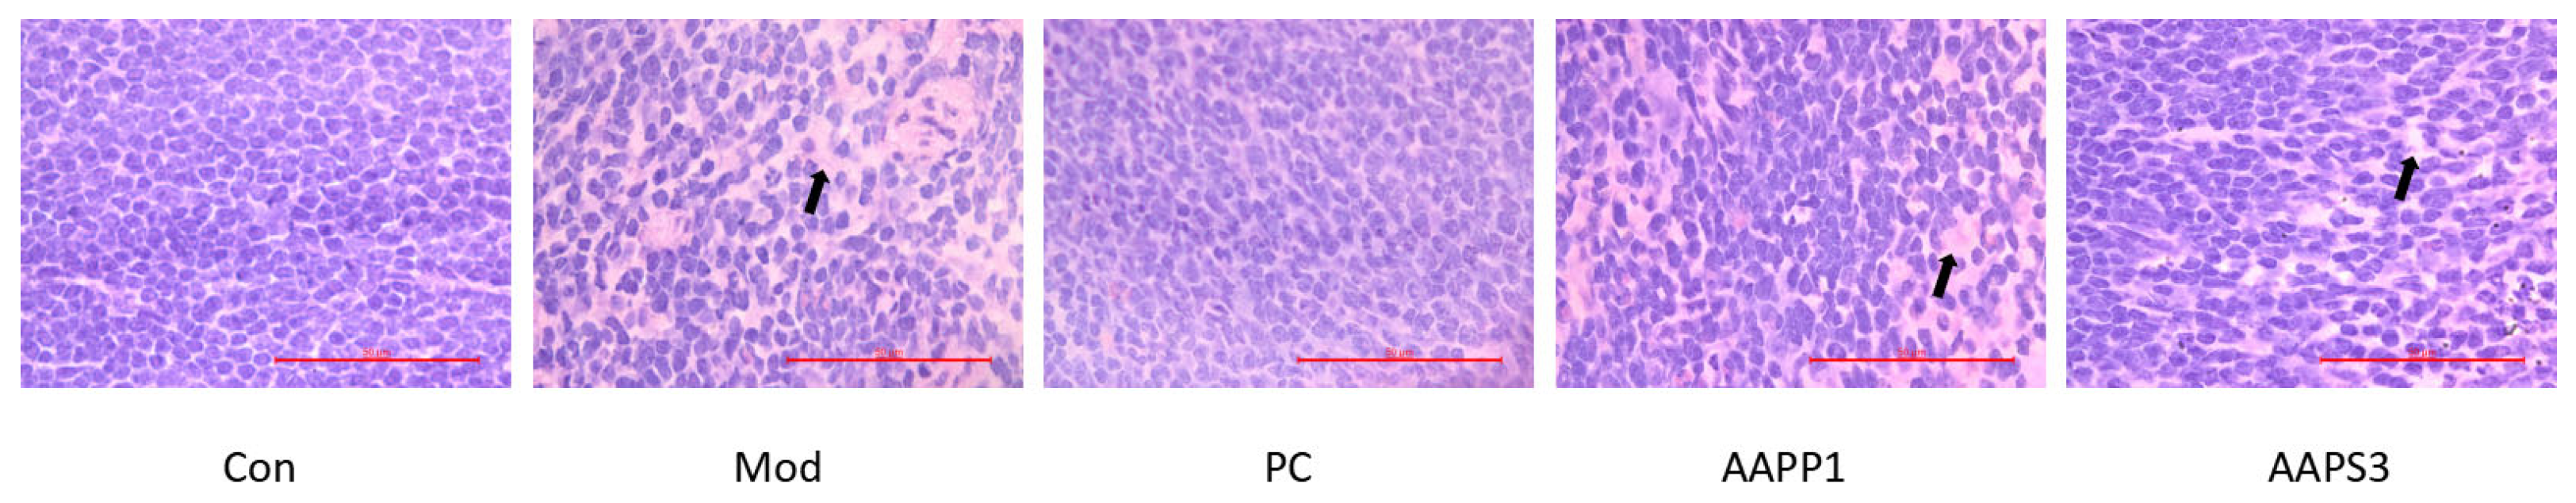
3.7. Histopathology Examination
3.8. Effects of AAPP1 and AAPS3 on Intestinal Microbiota of Immunosuppressed Mice
- a.
- Analysis of Sample Complexity and Multi-Sample Comparison of Intestinal Microbiota in Mice
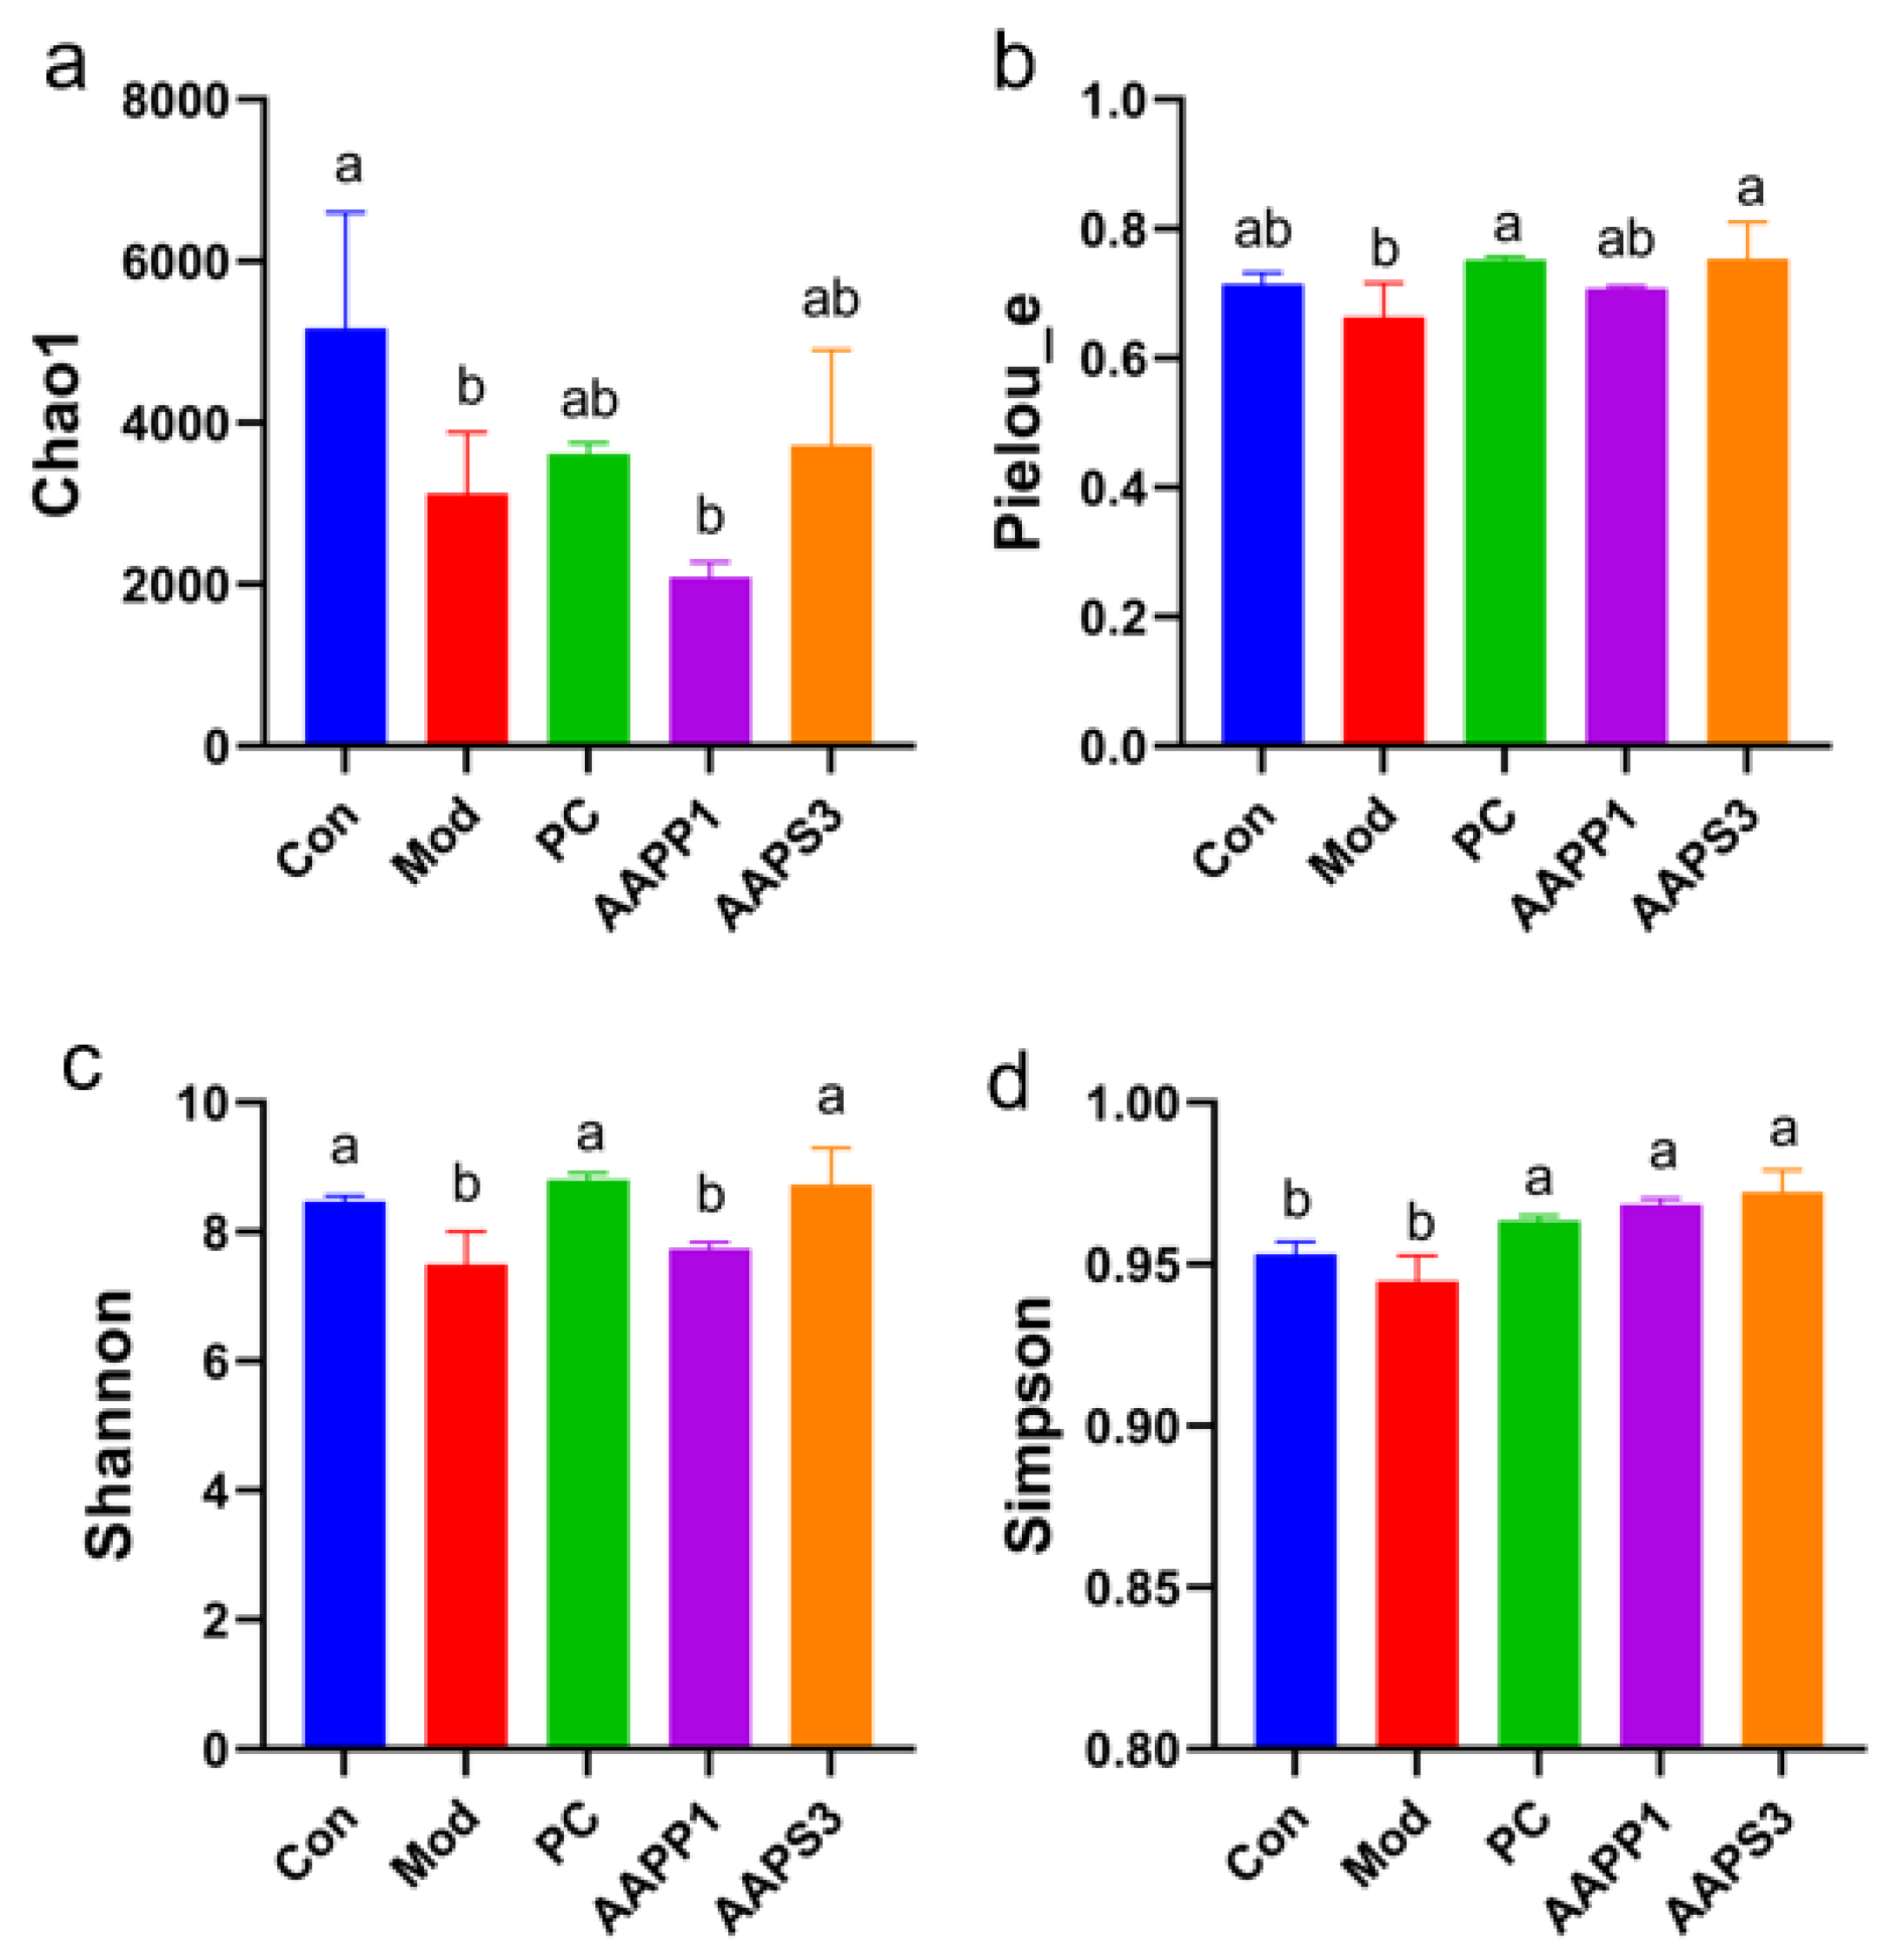
- (I)
- α-diversity Analysis
- (II)
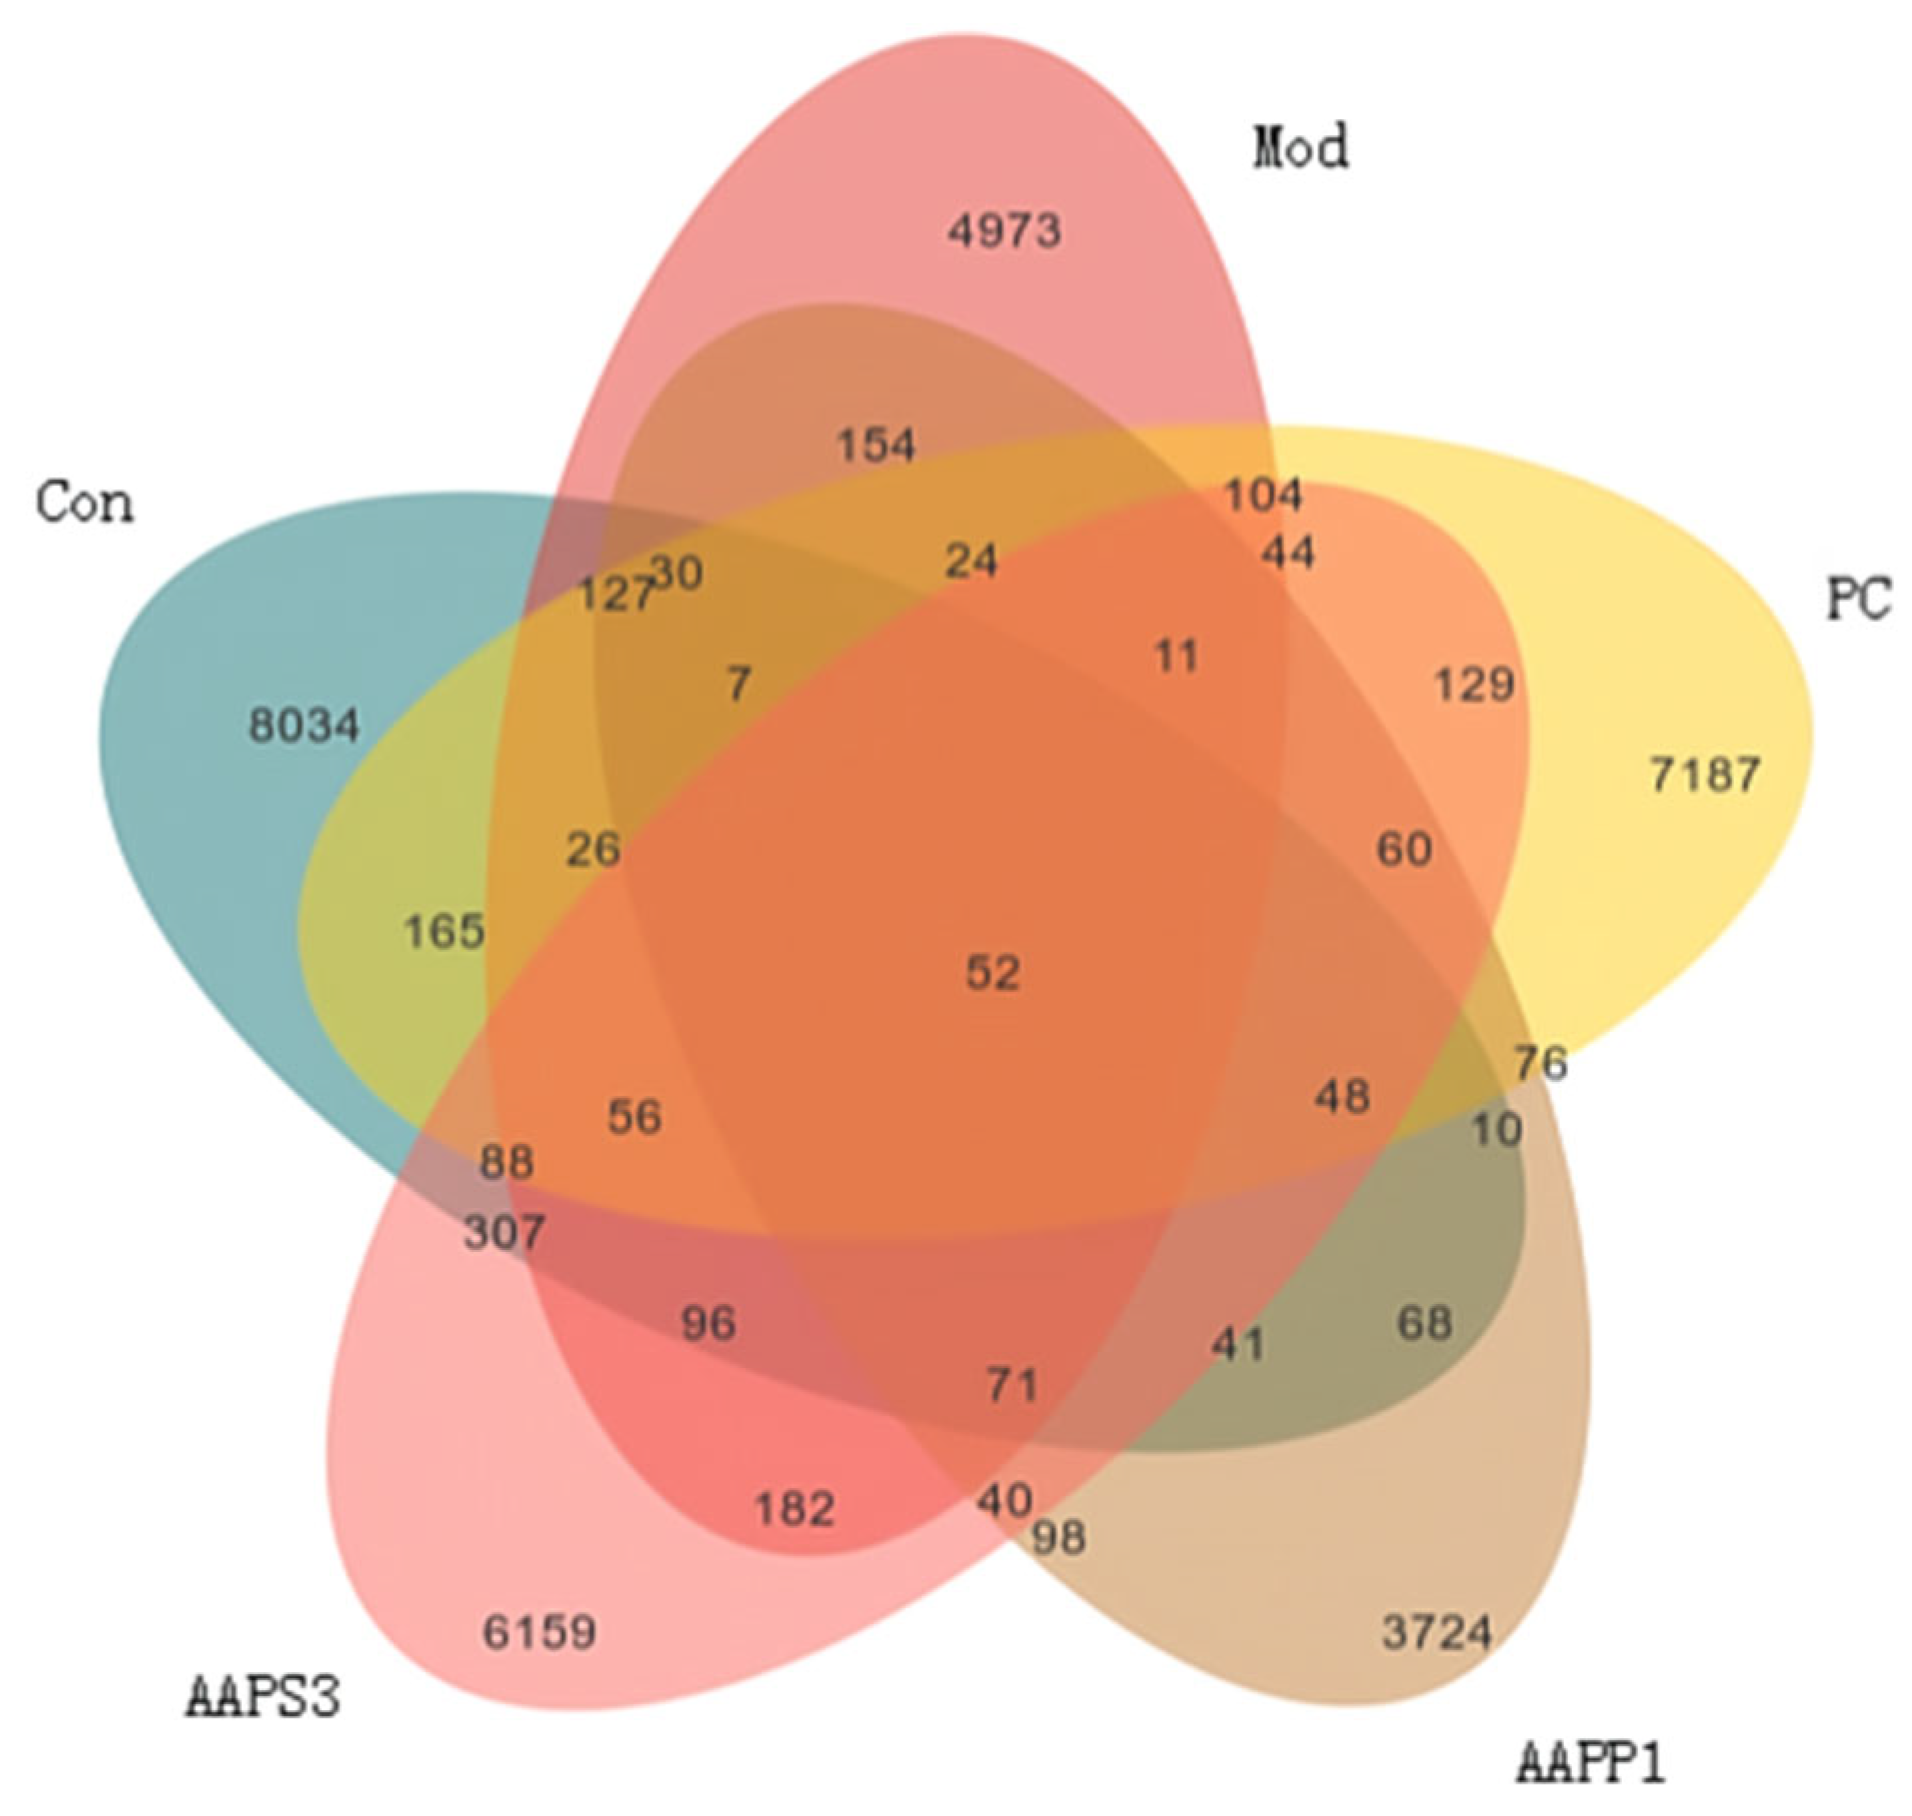
- Veen Diagram
- b.
- Analysis of Intestinal Microbiota Structure and Composition in Mice
- (I)
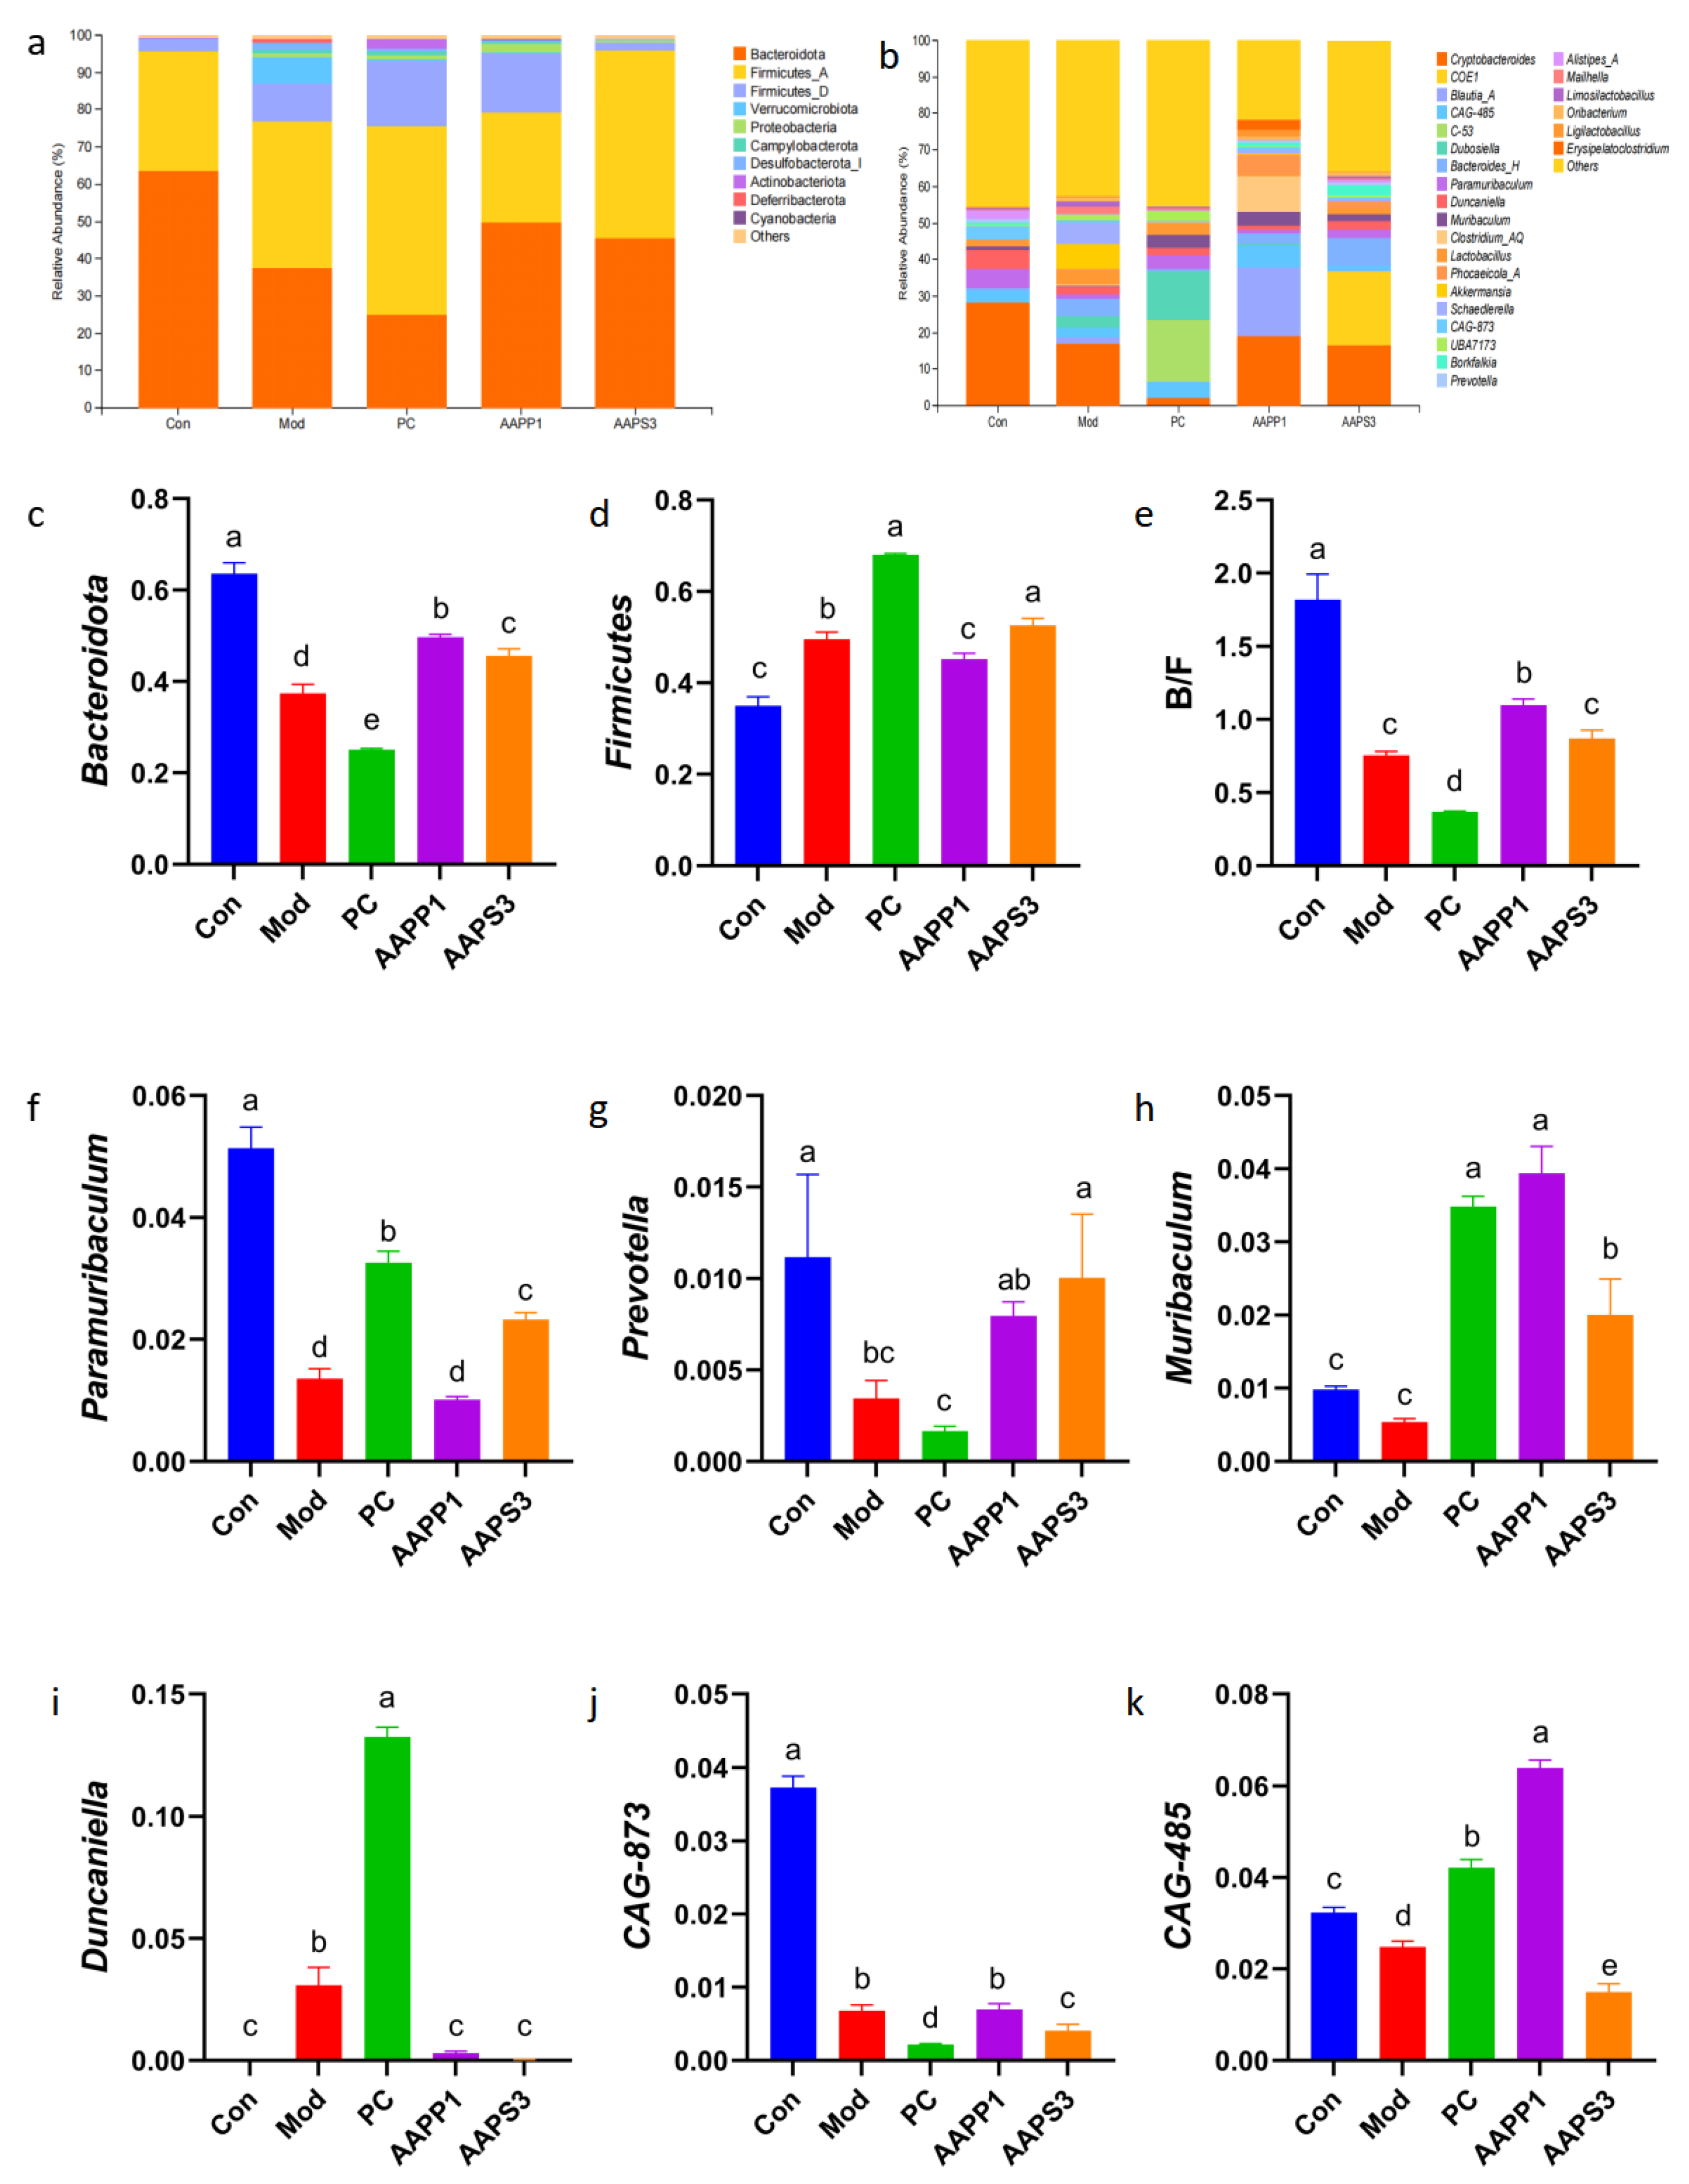
- Phylum Level
- (II)
- Genus Level
- (III)
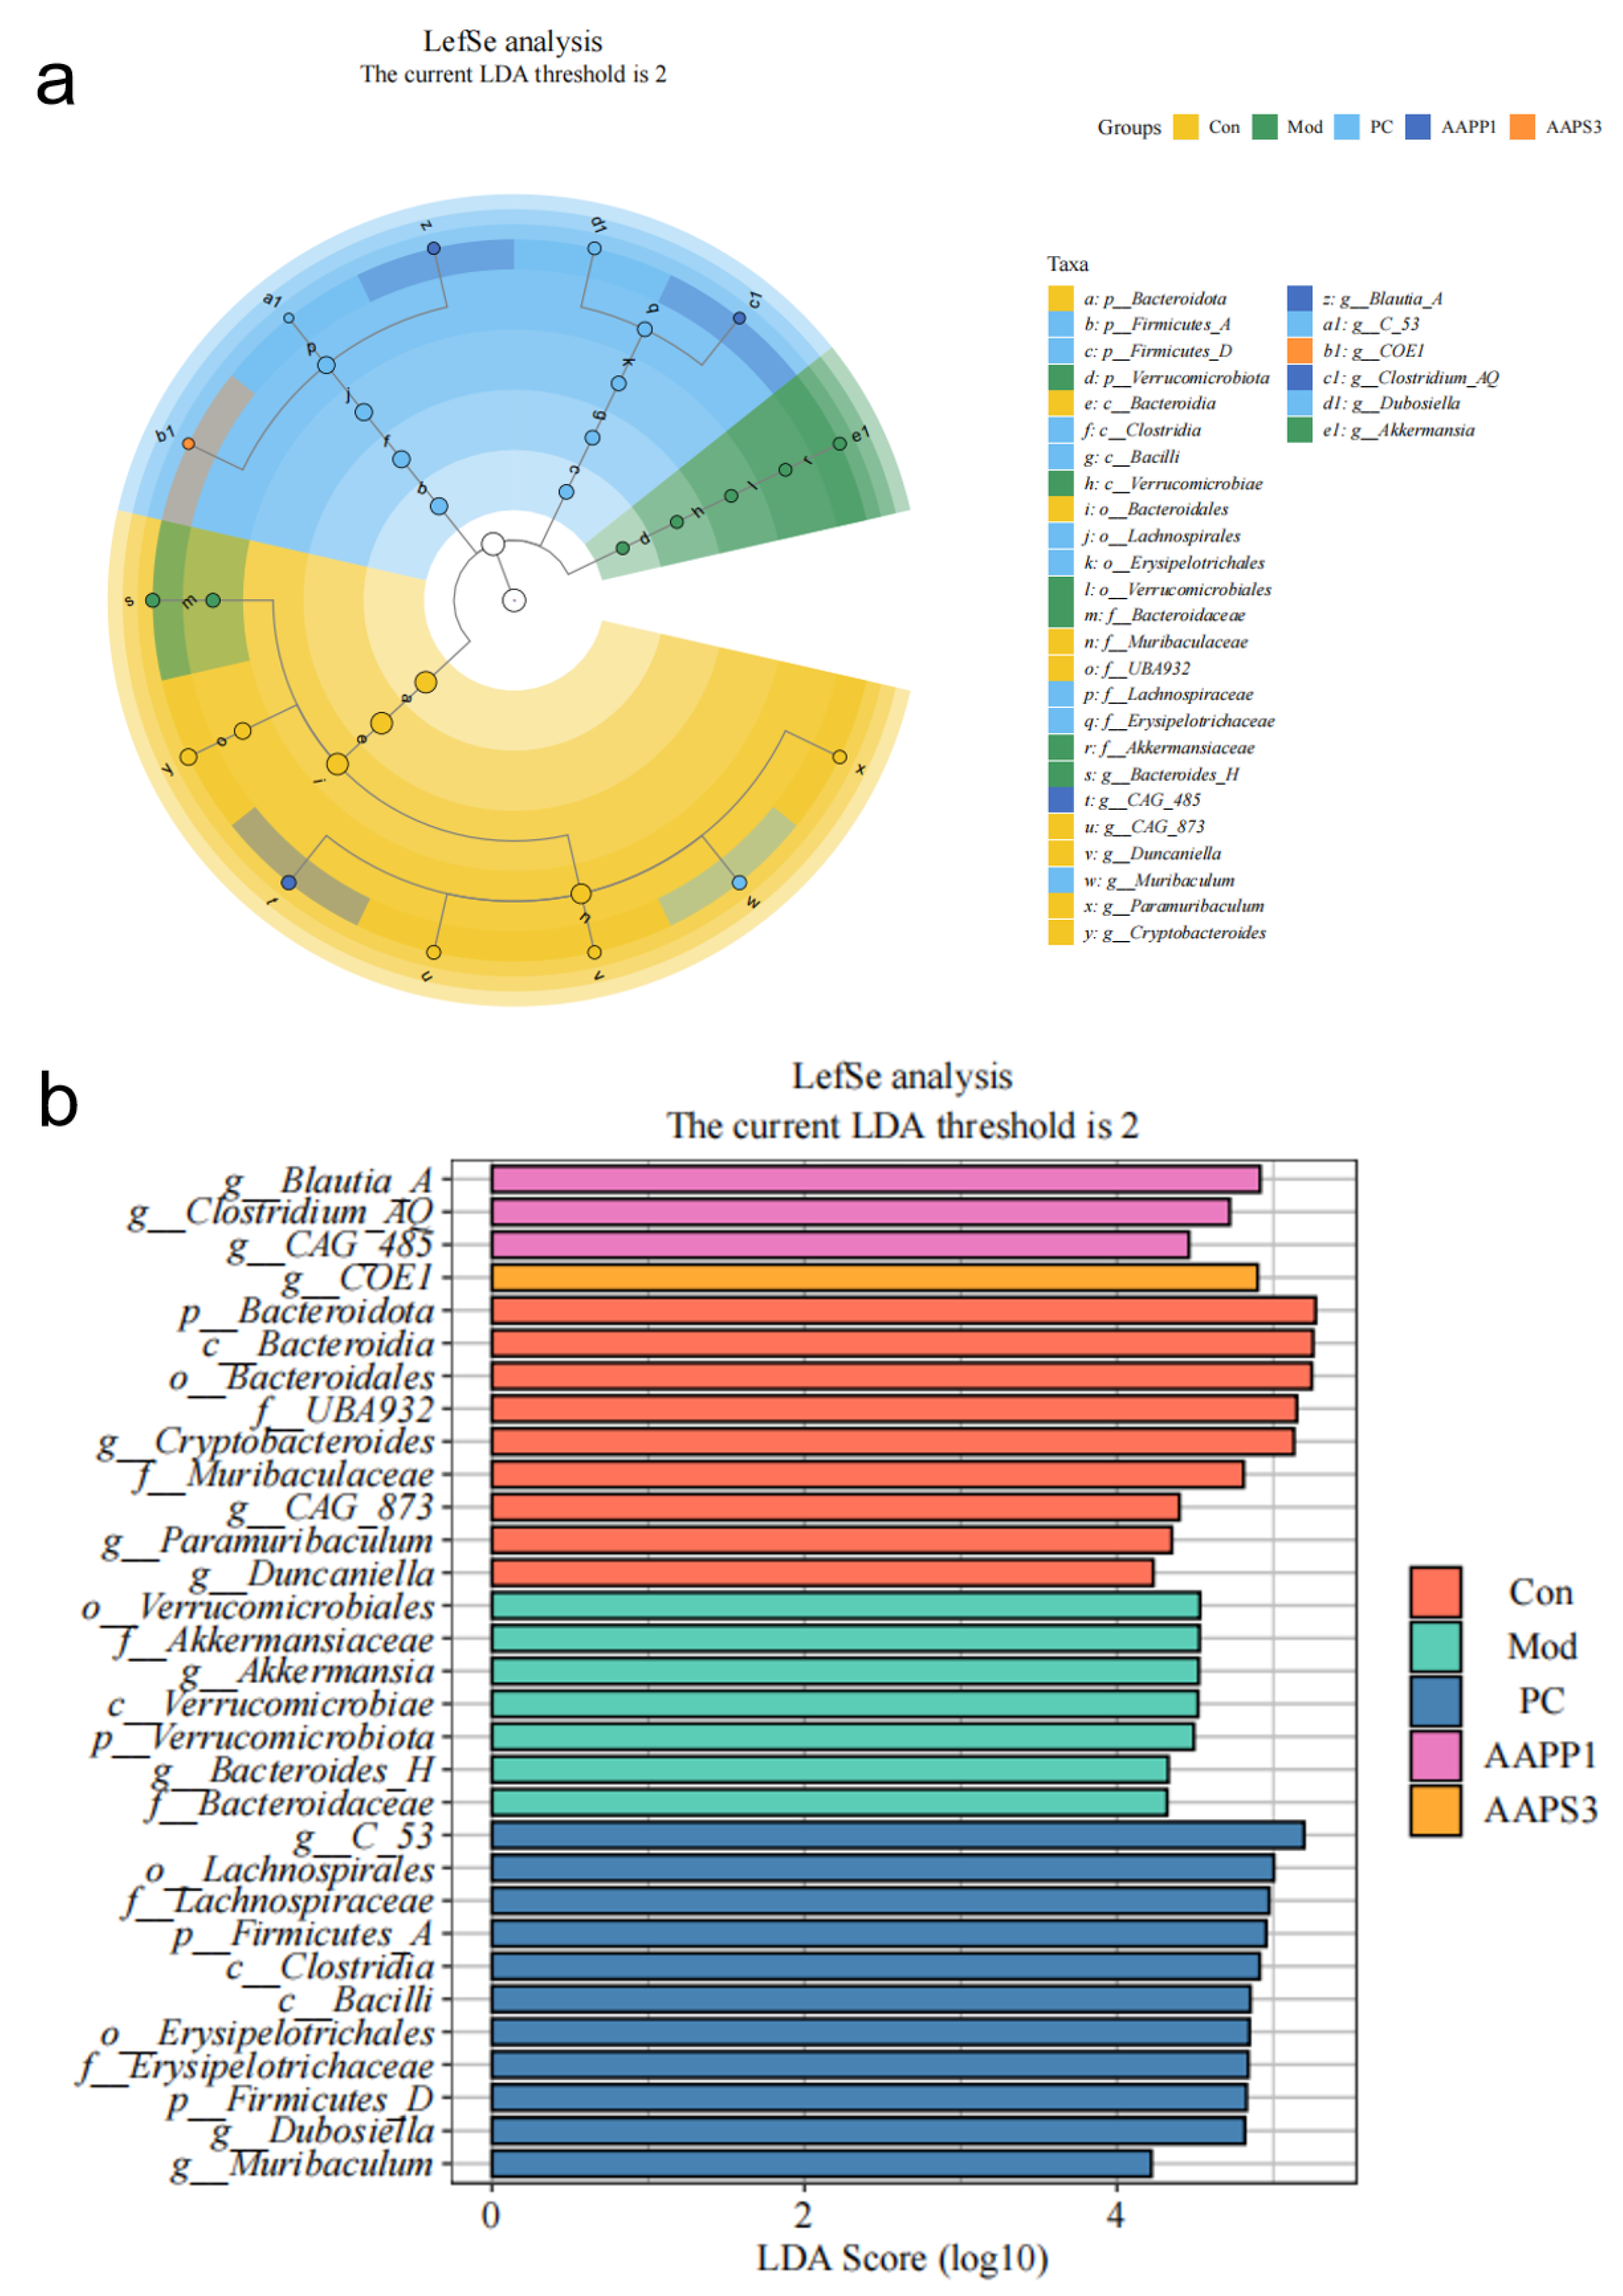
- Species Differential Analysis of Immunosuppressed Mice
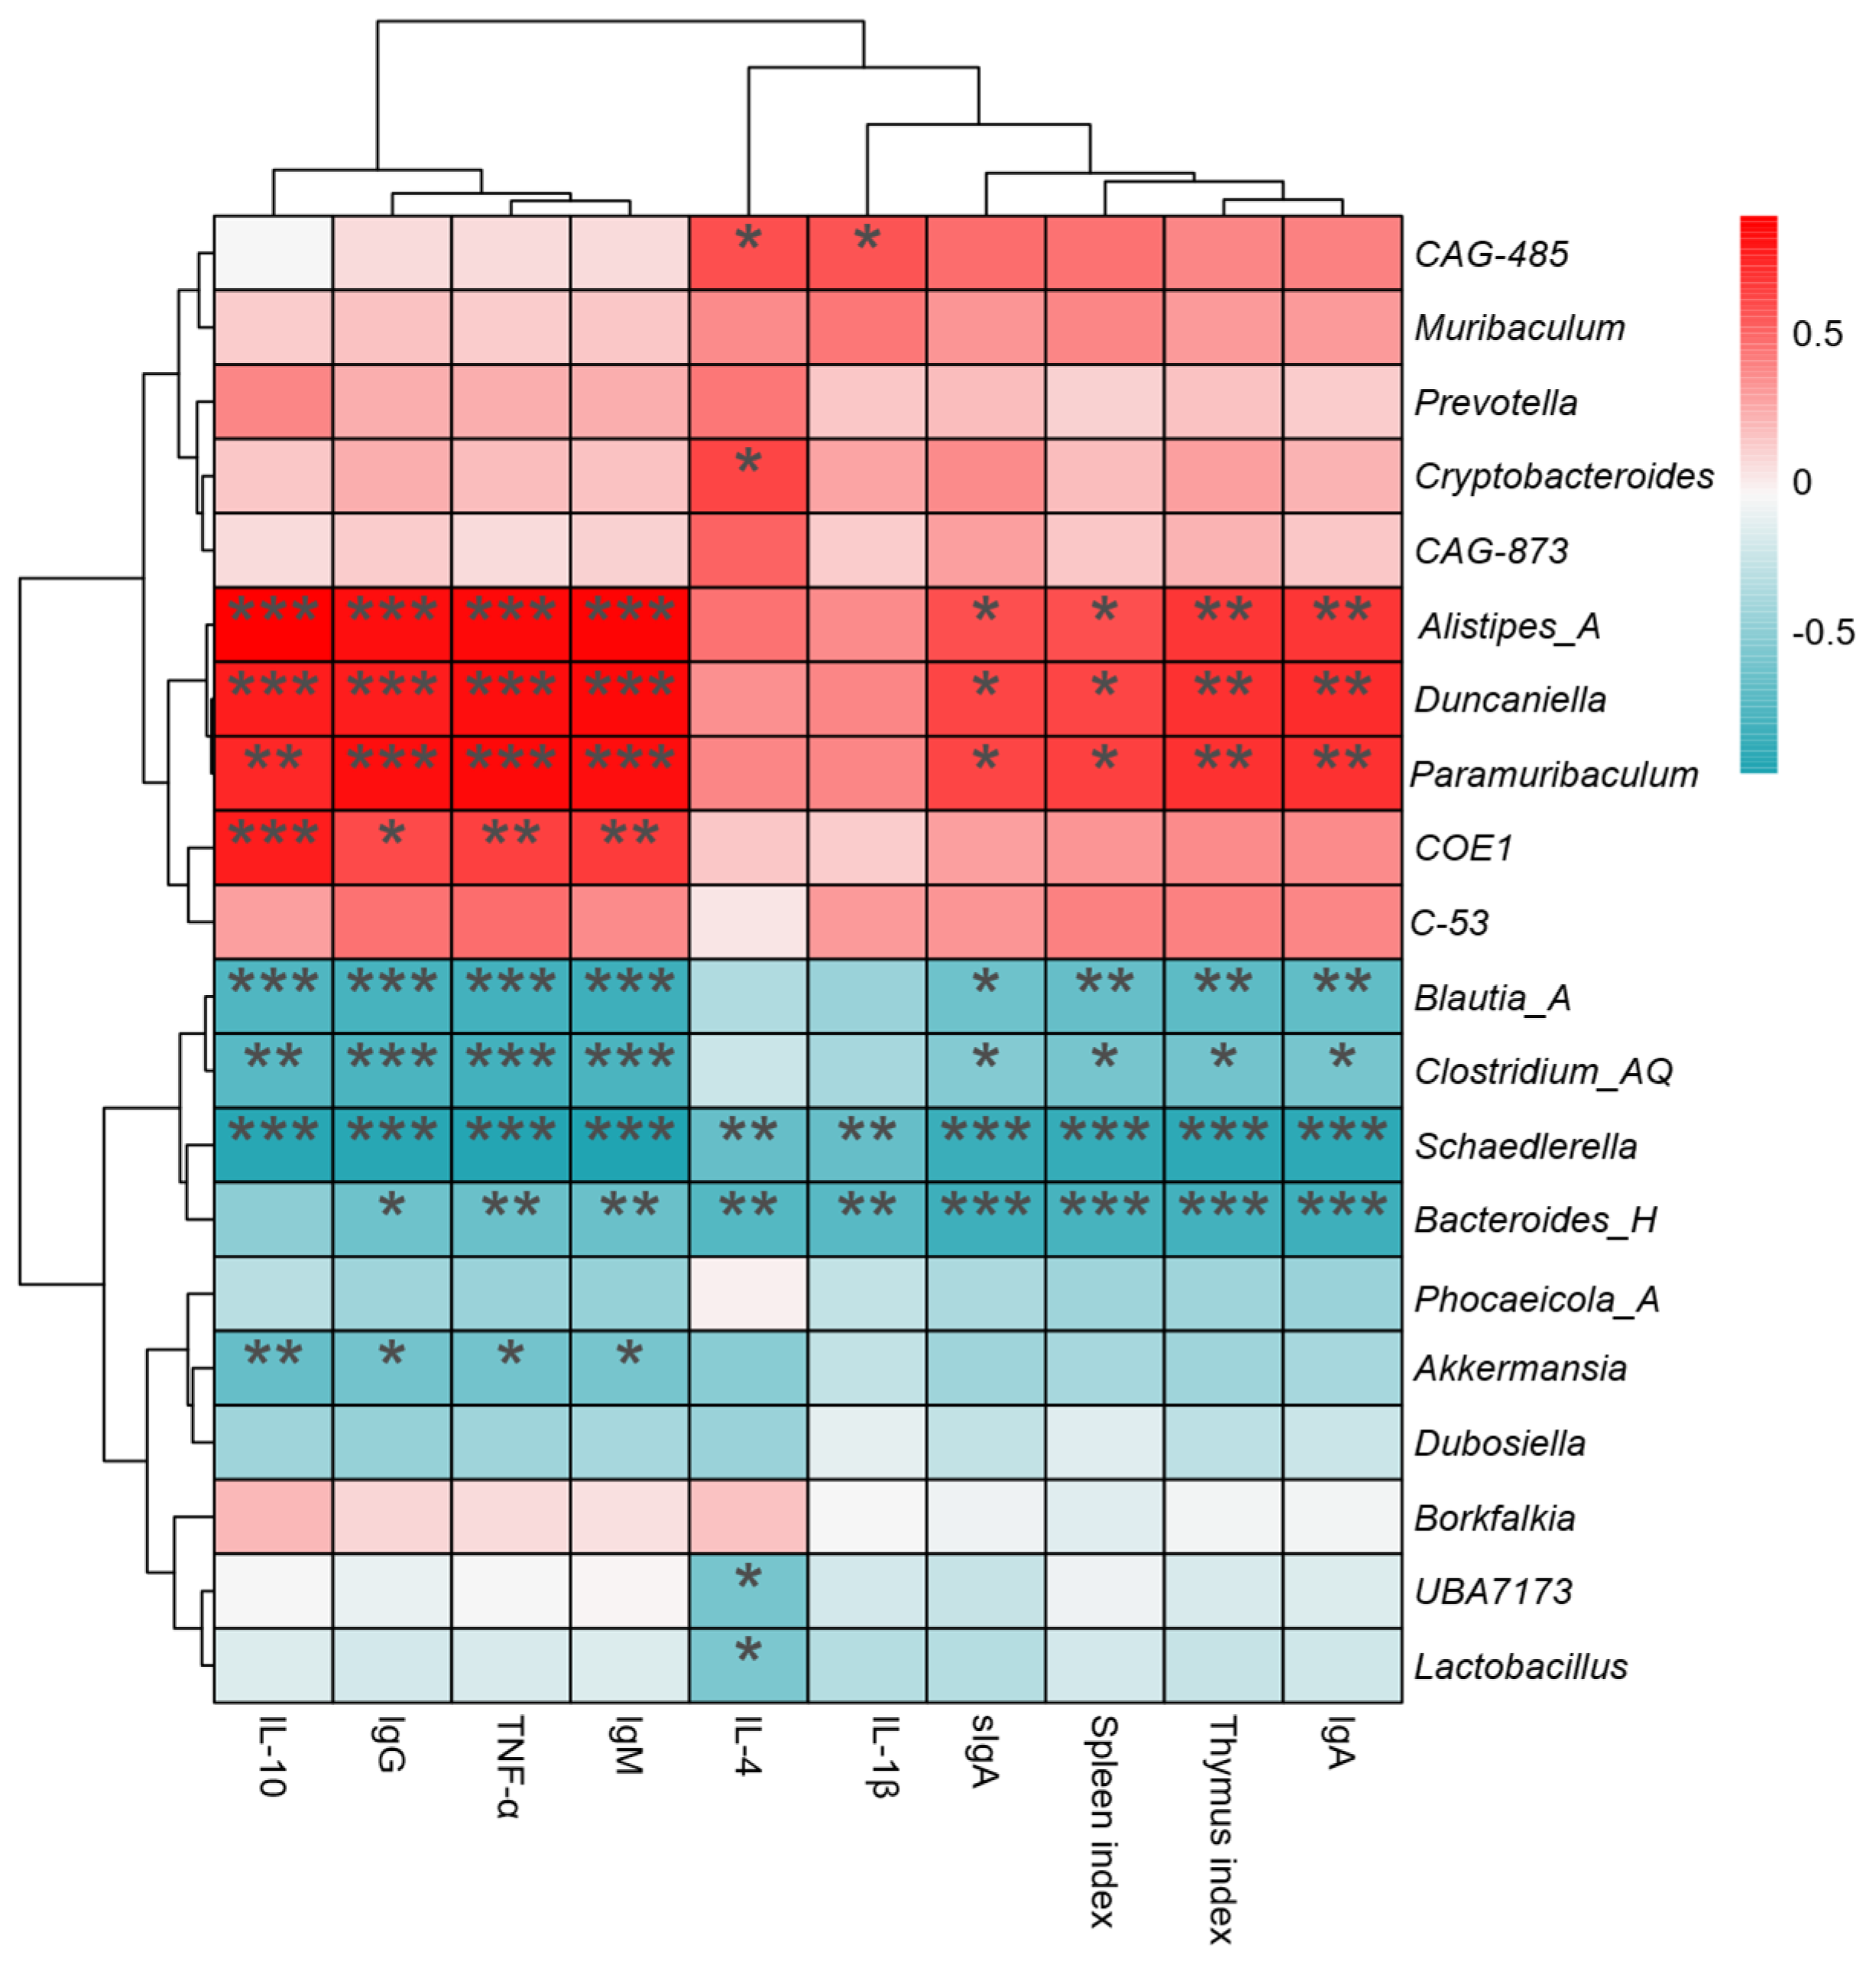
3.9. Correlation Between the Main Gut Microbiota and the Immune Index
4. Conclusions
Author Contributions
Funding
Institutional Review Board Statement
Informed Consent Statement
Data Availability Statement
Conflicts of Interest
References
- Rock, C.L.; Thomson, C.; Gansler, T.; Gapstur, S.M.; McCullough, M.L.; Patel, A.V.; Andrews, K.S.; Bandera, E.V.; Spees, C.K.; Robien, K.; et al. American Cancer Society guideline for diet and physical activity for cancer prevention. CA Cancer J. Clin. 2020, 70, 245–271. [Google Scholar]
- Wiley, C.D.; Campisi, J. The metabolic roots of senescence: Mechanisms and opportunities for intervention. Nat. Metab. 2021, 3, 1290–1301. [Google Scholar] [CrossRef] [PubMed]
- Shanafelt, T.D.; Lin, T.; Geyer, S.M.; Zent, C.S.; Leung, N.; Kabat, B.; Deborah, B.; Michael, R.G. Pentostatin, cyclophosphamide, and rituximab regimen in older patients with chronic lymphocytic leukemia. Cancer 2007, 109, 2291–2298. [Google Scholar] [CrossRef]
- Scott, D.G.; Bacon, P.A. Intravenous cyclophosphamide plus methylprednisolone in treatment of systemic rheumatoid vasculitis. Am. J. Med. 1984, 76, 377–384. [Google Scholar] [CrossRef]
- Alserhani, G.S.; Mohamed, M.E.; Younis, N.S. Mitigating cyclophosphamide-induced hepatorenal toxicity: Linalool’s role in modulating oxidative stress, inflammation, and apoptosis. Aunyn-Schmiedeberg’s Arch. Pharmacol. 2025. Online ahead of print. Available online: https://pubmed.ncbi.nlm.nih.gov/40100375/ (accessed on 18 March 2025).
- Almasi, M.; Shafiei, G.; Nikzad, H.; Karimian, M.; Moshkdanian, G. The effect of L-carnitine in reactive oxygen species reduction and apoptotic gene expression in mice after cyclophosphamide: An experimental study. Int. J. Reprod. Biomed. 2024, 22, 661–672. [Google Scholar] [CrossRef]
- Xu, X.; Zhang, X. Effects of cyclophosphamide on immune system and gut microbiota in mice. Microbiol. Res. 2015, 171, 97–106. [Google Scholar] [CrossRef] [PubMed]
- Abruzzo, G.K.; Gill, C.J.; Flattery, A.M.; Kong, L.; Leighton, C.; Smith, J.G.; Pikounis, V.B.; Bartizal, K.; Rosen, H. Efficacy of the echinocandin caspofungin against disseminated aspergillosisand candidiasis in cyclophosphamide-induced immunosuppressed mice. Antimicrob. Agents Chemother. 2000, 44, 2310–2318. [Google Scholar] [CrossRef]
- Wang, J.; Liu, J.; Wang, M.; Zhao, F.; Ge, M.; Liu, L.; Jiang, E.; Feng, S.; Han, M.; Pei, X.; et al. Levamisole Suppresses CD4+ T-Cell Proliferation and Antigen-Presenting Cell Activation in Aplastic Anemia by Regulating the JAK/STAT and TLR Signaling Pathways. Front. Immunol. 2022, 13, 907808. [Google Scholar] [CrossRef]
- Witonsky, S.; Buechner-Maxwell, V.; Santonastasto, A.; Pleasant, R.; Werre, S.; Wagner, B.; Ellison, S.; Lindsay, D. Can levamisole upregulate the equine cell-mediated macrophage (M1) dendritic cell (DC1) T-helper 1 (CD4 Th1) T-cytotoxic (CD8) immune response in vitro? J. Vet. Intern. Med. 2019, 33, 889–896. [Google Scholar] [CrossRef]
- Niego, A.G.; Rapior, S.; Thongklang, N.; Raspé, O.; Jaidee, W.; Lumyong, S.; Hyde, K.D. Macrofungi as a Nutraceutical Source: Promising Bioactive Compounds and Market Value. J. Fungi. 2021, 7, 397. [Google Scholar] [CrossRef] [PubMed]
- Li, H.; Gao, J.; Zhao, F.; Liu, X.; Ma, B. Bioactive Peptides from Edible Mushrooms—The Preparation, Mechanisms, Structure—Activity Relationships and Prospects. Foods 2023, 12, 2935. [Google Scholar] [CrossRef]
- Zhang, Q.; Xu, Y.; Xie, L.; Shu, X.; Zhang, S.; Wang, Y.; Wang, H.; Dong, Q.; Peng, W. The function and application of edible fungal polysaccharides. Adv. Appl. Microbiol. 2024, 127, 45–142. [Google Scholar]
- Liu, D.; Mueed, A.; Ma, H.; Wang, T.; Su, L.; Wang, Q. Pleurocinus ostreatus Polysaccharide Alleviates Cyclophosphamide-Induced Immunosuppression through the Gut Microbiome, Metabolome, and JAK/STAT1 Signaling Pathway. Foods 2024, 13, 2679. [Google Scholar] [CrossRef] [PubMed]
- Pan, M.; Kong, F.; Xing, L.; Yao, L.; Li, Y.; Liu, Y.; Li, C.; Li, L. The Structural Characterization and Immunomodulatory Activity of Polysaccharides from Pleurotus abieticola Fruiting Bodies. Nutrients 2022, 14, 4410. [Google Scholar] [CrossRef]
- Zhao, F.; Gao, J.; Li, H.; Huang, S.; Wang, S.; Liu, X. Identification of Peptides from Edible Pleurotus eryngii Mushroom Feet and the Effect of Delaying D-Galactose-Induced Senescence of PC12 Cells Through TLR4/NF-κB/MAPK Signaling Pathways. Foods 2024, 13, 3668. [Google Scholar] [CrossRef] [PubMed]
- Te, Y.; Qiong, W.; Bin, L.; Wang, J.M.; Wu, D.; Shang, X. The Current State and Future Prospects of Auricularia auricula’s Polysaccharide Processing Technology Portfolio. Molecules 2023, 28, 582. [Google Scholar] [CrossRef] [PubMed]
- Aletor, V.A. Compositional studies on edible tropical species of mushrooms. Food Chem. 1995, 54, 265–268. [Google Scholar] [CrossRef]
- Jiang, M.; Zeng, Q.; Xia, X. Optimisation of extraction procedure for black fungus polysaccharides and effect of the polysaccharides on blood lipid and myocardium antioxidant enzymes activities. Carbohydr. Polym. 2010, 84, 1061–1068. [Google Scholar] [CrossRef]
- Tian, Z.; Xue, M.; Wei, J.; Pan, Y.; Chen, X.J.; Hu, J.H.; Kongm, X.H. Assessment of Auricularia cornea var. Li. polysaccharides potential to improve hepatic, antioxidation and intestinal microecology in rats with non-alcoholic fatty liver disease. Front. Nutr. 2023, 10, 1161537. [Google Scholar] [CrossRef]
- He, S.; Zhang, Y.; Sun, H.J.; Du, M.; Qiu, J.L.; Tang, M.M.; Sun, X.B.; Zhu, B.W. Antioxidative peptides from proteolytic hydrolysates of false abalone (Volutharpa ampullacea perryi): Characterization, identification, and molecular docking. Mar. Drugs 2019, 17, 116. [Google Scholar] [CrossRef]
- Kim, S.S.; Ahn, C.B.; Moon, S.W.; Je, Y.J. Purification and antioxidant activities of peptides from sea squirt (Halocynthia roretzi) protein hydrolysates using pepsin hydrolysis. Food Biosci. 2018, 25, 128–133. [Google Scholar] [CrossRef]
- Ma, M.; Cong, Y.; Zhang, J.Z.H.; Zhang, L.J. Rational design of highly specific prolyl endopeptidase to activate the antihypertensive effect of peptides. Chembiochem A Eur. J. Chem. Biol. 2023, 2, 35–44. [Google Scholar] [CrossRef] [PubMed]
- Li, Y.X.; Shao, Y.H.; Deng, N.Y. Improved prediction of palmitoylation sites using PWMs and SVM. Protein Pept. Lett. 2011, 18, 186–193. [Google Scholar] [CrossRef] [PubMed]
- Jiang, S.; Mo, F.; Li, W.; Yang, S.U.; Li, C.B.; Jiang, L. Deep Learning-Driven Optimization of Antihypertensive Properties from Whey Protein Hydrolysates: A Multienzyme Approach. J. Agric. Food Chem. 2025, 73, 1373–1388. [Google Scholar] [CrossRef] [PubMed]
- Dong, Y.; Lin, H.Q.; MIAO, S.; Lu, X. Advances in enzymatic extraction of polysaccharides. Sci. Technol. Food Ind. 2021, 42, 351–358. [Google Scholar] [CrossRef]
- Wang, J.; Hu, S.Z.; NIE, S.P.; Yu, Q.; Xie, M.Y. Reviews on mechanisms of in vitro antioxidant activity of polysaccharides. Oxidative Med. Cell. Longev. 2016, 2016, 1–13. [Google Scholar] [CrossRef]
- Wang, Y.; Lv, Z.; Jiang, T.F. Extraction and determination of polysaccharides in the holothutia. J. Ocean. Univ. Qingdao 2005, 35, 987–990. Available online: https://www.semanticscholar.org/paper/Extraction-and-Determination-of-Polysaccharides-in-Yuan/e0aa849e79ee79b75311fcbae9c992cf3f32d954 (accessed on 13 February 2025).
- Wu, Q.; Qin, D.; Cao, H.; Bai, Y. Enzymatic hydrolysis of polysaccharide from Auricularia auricula and characterization of the degradation product. Int. J. Biol. Macromol. 2020, 162, 127–135. [Google Scholar] [CrossRef]
- Yan, F.; Li, N.; Shi, J.; Li, H.Z.; Yue, Y.X.; Jiao, W.X.; Wang, N. Lactobacillus acidophilus alleviates type 2 diabetes by regulating hepatic glucose, lipid metabolism and gut microbiota in mice. Food Funct. 2019, 10, 5804–5815. [Google Scholar] [CrossRef]
- Lewis, S.M.; Williams, A.; Eisenbarth, S.C. Structure and function of the immune system in the spleen. Sci. Immunol. 2019, 4, eaau6085. [Google Scholar] [CrossRef]
- Zhao, S.; Peng, X.; Zhou, Q.Y.; Huang, Y.Y.; Rao, X.; Tu, J.L.; Xiao, H.Y.; Liu, D.M. Bacillus coagulans 13002 and fructo-oligosaccharides improve the immunity of mice with immunosuppression induced by cyclophosphamide through modulating intestinal-derived and fecal microbiota. Food Res. Int. 2021, 140, 109793. [Google Scholar] [CrossRef]
- Kong, X.; Duan, W.; Li, D.; Tang, X.X.; Duan, Z.H. Effects of Polysaccharides From Auricularia auricula on the Immuno-Stimulatory Activity and Gut Microbiota in Immunosuppressed Mice Induced by Cyclophosphamide. Front. Immunol. 2020, 11, 595700. [Google Scholar] [CrossRef]
- Yalin, Z.; Xiao, C.; Ruokun, Y.; Li, G.J.; Peng, S.; Qian, Y.; Zhao, X. Immunomodulatory Effect of Tremella Polysaccharides against Cyclophosphamide-Induced Immunosuppression in Mice. Molecules 2018, 23, 239. [Google Scholar] [CrossRef] [PubMed]
- Yang, T.; Meng, Y.; Li, S.; Zhao, X.; Hou, H. Preparation, unique structural characteristics and immunomodulatory effects of peptides from Antarctic krill (Euphausia superba). Food Res. Int. 2025, 214, 116592. [Google Scholar] [CrossRef] [PubMed]
- Mantis, N.J.; Rol, N.; Corthésy, B. Secretory IgA’s complex roles in immunity and mucosal homeostasis in the gut. Mucosal Immunol 2011, 4, 603–611. [Google Scholar] [CrossRef] [PubMed]
- Mandelker, L. Oxidative Stress, Free Radicals, and Cellular Damage; Humana Press: Totowa, NJ, USA, 2011. [Google Scholar] [CrossRef]
- Tang, Y.P.; Zhao, R.; Pu, Q.Y.; Su, J.; Yu, F.M.; Yang, Z.S.; Han, T. Investigation of nephrotoxicity on mice exposed to polystyrene nanoplastics and the potential amelioration effects of DHA-enriched phosphatidylserine. Sci. Total Environ. 2023, 892, 164808. [Google Scholar] [CrossRef]
- Inal, M.E.; Kanbak, G.; Sunal, E. Antioxidant enzyme activities and malondialdehyde levels related to aging. Clin. Chim. Acta. 2001, 305, 75–80. [Google Scholar] [CrossRef]
- Li, Y.N.; Guo, Y.; Xi, M.M.; Yang, P.; Zhou, X.Y.; Yin, S. Saponins from Aralia taibaiensis attenuate D-galactose-induced aging in rats by activating FOXO3a and Nrf2 pathways. Oxid. Med. Cell Longev. 2014, 2014, 320513. [Google Scholar] [CrossRef] [PubMed]
- Kaynar, H.; Meral, M.; Turhan, H.; Mustafa, K.; Gulnaz, C.; Fatih, A. Glutathione peroxidase, glutathione-S-transferase, catalase, xanthine oxidase, Cu-Zn superoxide dismutase activities, total glutathione, nitric oxide, and malondialdehyde levels in erythrocytes of patients with small cell and non-small cell lung cancer. Cancer Lett. 2005, 227, 133–139. [Google Scholar] [CrossRef]
- Chen, Z.; Ge, X.; Wang, Y.; Zhang, J.; Sui, Y.; Yin, X.; Wu, N.; Yang, L.; Xu, J.; Zhou, H.; et al. Ruditapes philippinarum Polysaccharide Alleviates Hyperglycemia by Modulating Gut Microbiota in a Mouse Model of Type 2 Diabetes Mellitus. Mol. Nutr. Food Res. 2025, 69, e202400996. [Google Scholar] [CrossRef]
- Liu, L.; Jiang, Z.; Khan, I.; Fan, X.X.; Wu, Q.; Zhong, Q.L. Ginseng polysaccharides alter the gut microbiota and kynurenine/tryptophan ratio, potentiating the antitumour effect of antiprogrammed cell death 1/programmed cell death ligand 1 (anti-PD-1/PD-L1) immunotherapy. Gut 2022, 71, 734–745. [Google Scholar]
- Kovatcheva, D.P.; Nilsson, A.; Akrami, R.; Lee, Y.S.; Filipe, D.V.; Tulika, A.; Eric, M.; Inger, B.; Fredrik, B. Dietary Fiber-Induced Improvement in Glucose Metabolism Is Associated with Increased Abundance of Prevotella. Cell Metab. 2015, 22, 971–982. [Google Scholar] [CrossRef]
- Rolhion, N.; Chassaing, B.; Nahori, M.; Jana, B.; Alexandra, M.; Marc, L.; Olivier, D. A listeria monocytogenes bacteriocin can target the commensal prevotella copri and modulate intestinal infection. Cell Host Microbe 2019, 26, 691–701.e5. [Google Scholar] [CrossRef]
- Zhuge, A.; Li, S.; Lou, P. Longitudinal 16S rRNA sequencing reveals relationships among alterations of gut microbiota and nonalcoholic fatty liver disease progression in mice. Microbiol. Spectr. 2022, 10, e0004722. [Google Scholar] [CrossRef]
- Qiao, Y.; Zhang, Z.; Zhai, Y.; Yan, X.; Zhou, W.L.; Liu, H.; Guan, L.L.; Peng, L. Apigenin alleviates obesity-associated metabolic syndrome by regulating the composition of the gut microbiome. Front. Microbiol. 2021, 12, 805827. [Google Scholar] [CrossRef] [PubMed]
- Berry, D.; Stecher, B.; Schintlmeister, A.; Reichert, J.; Brugiroux, S.; Alexander, L.; Wagner, M. Host-compound foraging by intestinal microbiota revealed by single-cell stable isotope probing. Proc. Natl. Acad. Sci. USA 2013, 110, 4720–4725. [Google Scholar] [CrossRef] [PubMed]
- Klaus, A.; Kozarski, M.; Niksic, M.; Jakovljevic, D.; Todorovic, N. Antioxidative activities and chemical characterization of polysaccharides extracted from the basidiomycete Schizophyllum commune. LWT-Food Sci. Technol. 2011, 44, 2005–2011. [Google Scholar] [CrossRef]

| Number | Name | Manufacturer |
|---|---|---|
| Enzyme A | Alkaline protease | Angel Enzyme Preparation (Yichang) Co., Ltd. (Yichang, China) |
| Enzyme B | Trypsin | Xiasheng (Beijing) Biotechnology Development Co., Ltd. (Beijing, China) |
| Enzyme C | Chymotrypsin | Shanghai Yuanye Biotechnology Co., Ltd. (Shanghai, China) |
| Enzyme D | pepsin | |
| Enzyme E | Prolyl endopeptidase | Provided by Northeast Agricultural University |
| Level | Factor | ||
|---|---|---|---|
| A Vitality Ratio (U:U) | B Dosage (U/g) | C Time (min) | |
| 1 | 1:1 | 5000 | 90 |
| 2 | 1.5:1 | 6000 | 120 |
| 3 | 2:1 | 7000 | 150 |
| Number | Name | Manufacturer |
|---|---|---|
| Enzyme 1 | Pectinase | Nanning Dongheng Huadao Biotechnology Co., Ltd. (Nanning, China) |
| Enzyme 3 | Cellulase | |
| Enzyme 4 | β—glucanase | Angel Enzyme Preparation (Yichang) Co., Ltd. (Yichang, China) |
| Enzyme 5 | Pectinase | |
| Enzyme 6 | Glucoamylase | |
| Enzyme 7 | α-amylase | Xiasheng (Beijing) Biotechnology Development Co., Ltd. (Beeijing, China) |
| Enzyme 8 | Xylanase | |
| Enzyme 9 | β—glucanase | |
| Enzyme 10 | Pectinase | |
| Enzyme 11 | Glucoamylase |
| Level | Factor | ||
|---|---|---|---|
| A Time (min) | B Dosage (U/g) | C Vitality Ratio (U:U) | |
| 1 | 60 | 5000 | 1:2 |
| 2 | 90 | 10,000 | 1:1.5 |
| 3 | 120 | 15,000 | 1:1 |
| Group | Experimental Cycle | ||
|---|---|---|---|
| 1~7 d | 8~10 d (3 d, Intraperitoneal Injection Modeling) | 11–24 d (14 d) | |
| Con | Natural lighting, free eating and drinking | 0.9% normal saline | 0.9% normal saline |
| Mod | 80 mg/kg CTX | 0.9% normal saline | |
| PC | 80 mg/kg CTX | 80 mg/kg Levamisole hydrochloride | |
| AAPP1 | 80 mg/kg CTX | 200 mg/kg AAPP1 | |
| AAPS3 | 80 mg/kg CTX | 200 mg/kg AAPS3 | |
| Test Number | Factor | DPPH Radical Scavenging Rate (%) | |||
|---|---|---|---|---|---|
| A Vitality Ratio (U:U) | B Dosage (U/g) | C Time (min) | D (Empty Column) | ||
| 1 | 1 | 1 | 1 | 1 | 53.88 |
| 2 | 1 | 2 | 3 | 2 | 67.36 |
| 3 | 1 | 3 | 2 | 3 | 69.17 |
| 4 | 2 | 1 | 3 | 3 | 60.42 |
| 5 | 2 | 2 | 2 | 1 | 78.52 |
| 6 | 2 | 3 | 1 | 2 | 59.72 |
| 7 | 3 | 1 | 2 | 2 | 52.12 |
| 8 | 3 | 2 | 1 | 3 | 54.16 |
| 9 | 3 | 3 | 3 | 1 | 48.76 |
| K1 | 190.41 | 166.42 | 167.76 | 181.16 | |
| K2 | 198.66 | 200.04 | 199.81 | 179.20 | |
| K3 | 155.04 | 177.65 | 176.54 | 183.75 | |
| k1 | 63.47 | 55.47 | 55.92 | 60.39 | |
| k2 | 66.22 | 66.68 | 66.60 | 59.73 | |
| k3 | 51.68 | 59.22 | 58.85 | 61.25 | |
| R | 14.54 | 11.21 | 10.68 | 1.52 | |
| Factor | Sum of Squares | Freedom | Mean Square | F Value | Significance |
|---|---|---|---|---|---|
| A | 357.98 | 2 | 178.99 | 103.09 | * |
| B | 195.30 | 2 | 97.65 | 56.24 | * |
| C | 182.86 | 2 | 91.43 | 52.66 | * |
| error | 3.47 | 2 | 1.74 |
| Test Number | Factor | DPPH Radical Scavenging Rate (%) | |||
|---|---|---|---|---|---|
| A Time (min) | B Dosage (U/g) | C Vitality Ratio (U:U) | D (Empty Column) | ||
| 1 | 1 | 1 | 1 | 1 | 38.16 |
| 2 | 1 | 2 | 3 | 2 | 36.66 |
| 3 | 1 | 3 | 2 | 3 | 33.72 |
| 4 | 2 | 1 | 3 | 3 | 52.49 |
| 5 | 2 | 2 | 2 | 1 | 60.35 |
| 6 | 2 | 3 | 1 | 2 | 59.30 |
| 7 | 3 | 1 | 2 | 2 | 52.12 |
| 8 | 3 | 2 | 1 | 3 | 61.49 |
| 9 | 3 | 3 | 3 | 1 | 48.76 |
| K1 | 108.54 | 142.77 | 158.95 | 147.27 | |
| K2 | 172.14 | 158.50 | 146.19 | 148.08 | |
| K2 | 162.37 | 141.78 | 137.91 | 147.70 | |
| k1 | 36.18 | 47.59 | 52.98 | 49.09 | |
| k2 | 57.38 | 52.83 | 48.73 | 49.36 | |
| k3 | 54.12 | 47.26 | 45.97 | 49.23 | |
| R | 21.20 | 5.57 | 7.01 | 0.27 | |
| Factor | Sum of Squares | Freedom | Mean Square | F Value | Significance |
|---|---|---|---|---|---|
| A | 782.01 | 2 | 391.00 | 7142.36 | * |
| B | 58.66 | 2 | 29.33 | 535.79 | * |
| C | 74.90 | 2 | 37.45 | 684.04 | * |
| error | 3.47 | 2 | 1.74 |
| IC50 for DPPH Scavenging (mg/mL) | IC50 for OH Scavenging (mg/mL) | IC50 for O2− Scavenging (mg/mL) | |
|---|---|---|---|
| AAP | 1.88 ± 0.03 | 2.33 ± 0.07 | 2.28 ± 0.02 |
| AAPP1 | 0.63 ± 0.02 | 1.25 ± 0.01 | 1.96 ± 0.07 |
| AAPS1 | 0.97 ± 0.03 | 1.83 ± 0.06 | 4.26 ± 0.03 |
| AAPS2 | 1.22 ± 0.07 | 2.73 ± 0.10 | 4.65 ± 0.15 |
| AAPS3 | 0.53 ± 0.00 | 1.42 ± 0.00 | 2.30 ± 0.00 |
Disclaimer/Publisher’s Note: The statements, opinions and data contained in all publications are solely those of the individual author(s) and contributor(s) and not of MDPI and/or the editor(s). MDPI and/or the editor(s) disclaim responsibility for any injury to people or property resulting from any ideas, methods, instructions or products referred to in the content. |
© 2025 by the authors. Licensee MDPI, Basel, Switzerland. This article is an open access article distributed under the terms and conditions of the Creative Commons Attribution (CC BY) license (https://creativecommons.org/licenses/by/4.0/).
Share and Cite
Zhao, M.; Huang, H.; Li, B.; Pan, Y.; Wang, C.; Du, W.; Wang, W.; Wang, Y.; Mao, X.; Kong, X. Preparation of Auricularia auricula-Derived Immune Modulators and Alleviation of Cyclophosphamide-Induced Immune Suppression and Intestinal Microbiota Dysbiosis in Mice. Life 2025, 15, 1236. https://doi.org/10.3390/life15081236
Zhao M, Huang H, Li B, Pan Y, Wang C, Du W, Wang W, Wang Y, Mao X, Kong X. Preparation of Auricularia auricula-Derived Immune Modulators and Alleviation of Cyclophosphamide-Induced Immune Suppression and Intestinal Microbiota Dysbiosis in Mice. Life. 2025; 15(8):1236. https://doi.org/10.3390/life15081236
Chicago/Turabian StyleZhao, Ming, Huiyan Huang, Bowen Li, Yu Pan, Chuankai Wang, Wanjia Du, Wenliang Wang, Yansheng Wang, Xue Mao, and Xianghui Kong. 2025. "Preparation of Auricularia auricula-Derived Immune Modulators and Alleviation of Cyclophosphamide-Induced Immune Suppression and Intestinal Microbiota Dysbiosis in Mice" Life 15, no. 8: 1236. https://doi.org/10.3390/life15081236
APA StyleZhao, M., Huang, H., Li, B., Pan, Y., Wang, C., Du, W., Wang, W., Wang, Y., Mao, X., & Kong, X. (2025). Preparation of Auricularia auricula-Derived Immune Modulators and Alleviation of Cyclophosphamide-Induced Immune Suppression and Intestinal Microbiota Dysbiosis in Mice. Life, 15(8), 1236. https://doi.org/10.3390/life15081236