
Atorvastatin Confers Renoprotection and Modulates Inflammation in Diabetic Rats on a High-Fat Diet

 ,
,  , ,
, ,  ,
, 
Abstract
1. Introduction
2. Materials and Methods
2.1. Animals
2.2. Ethical Approach
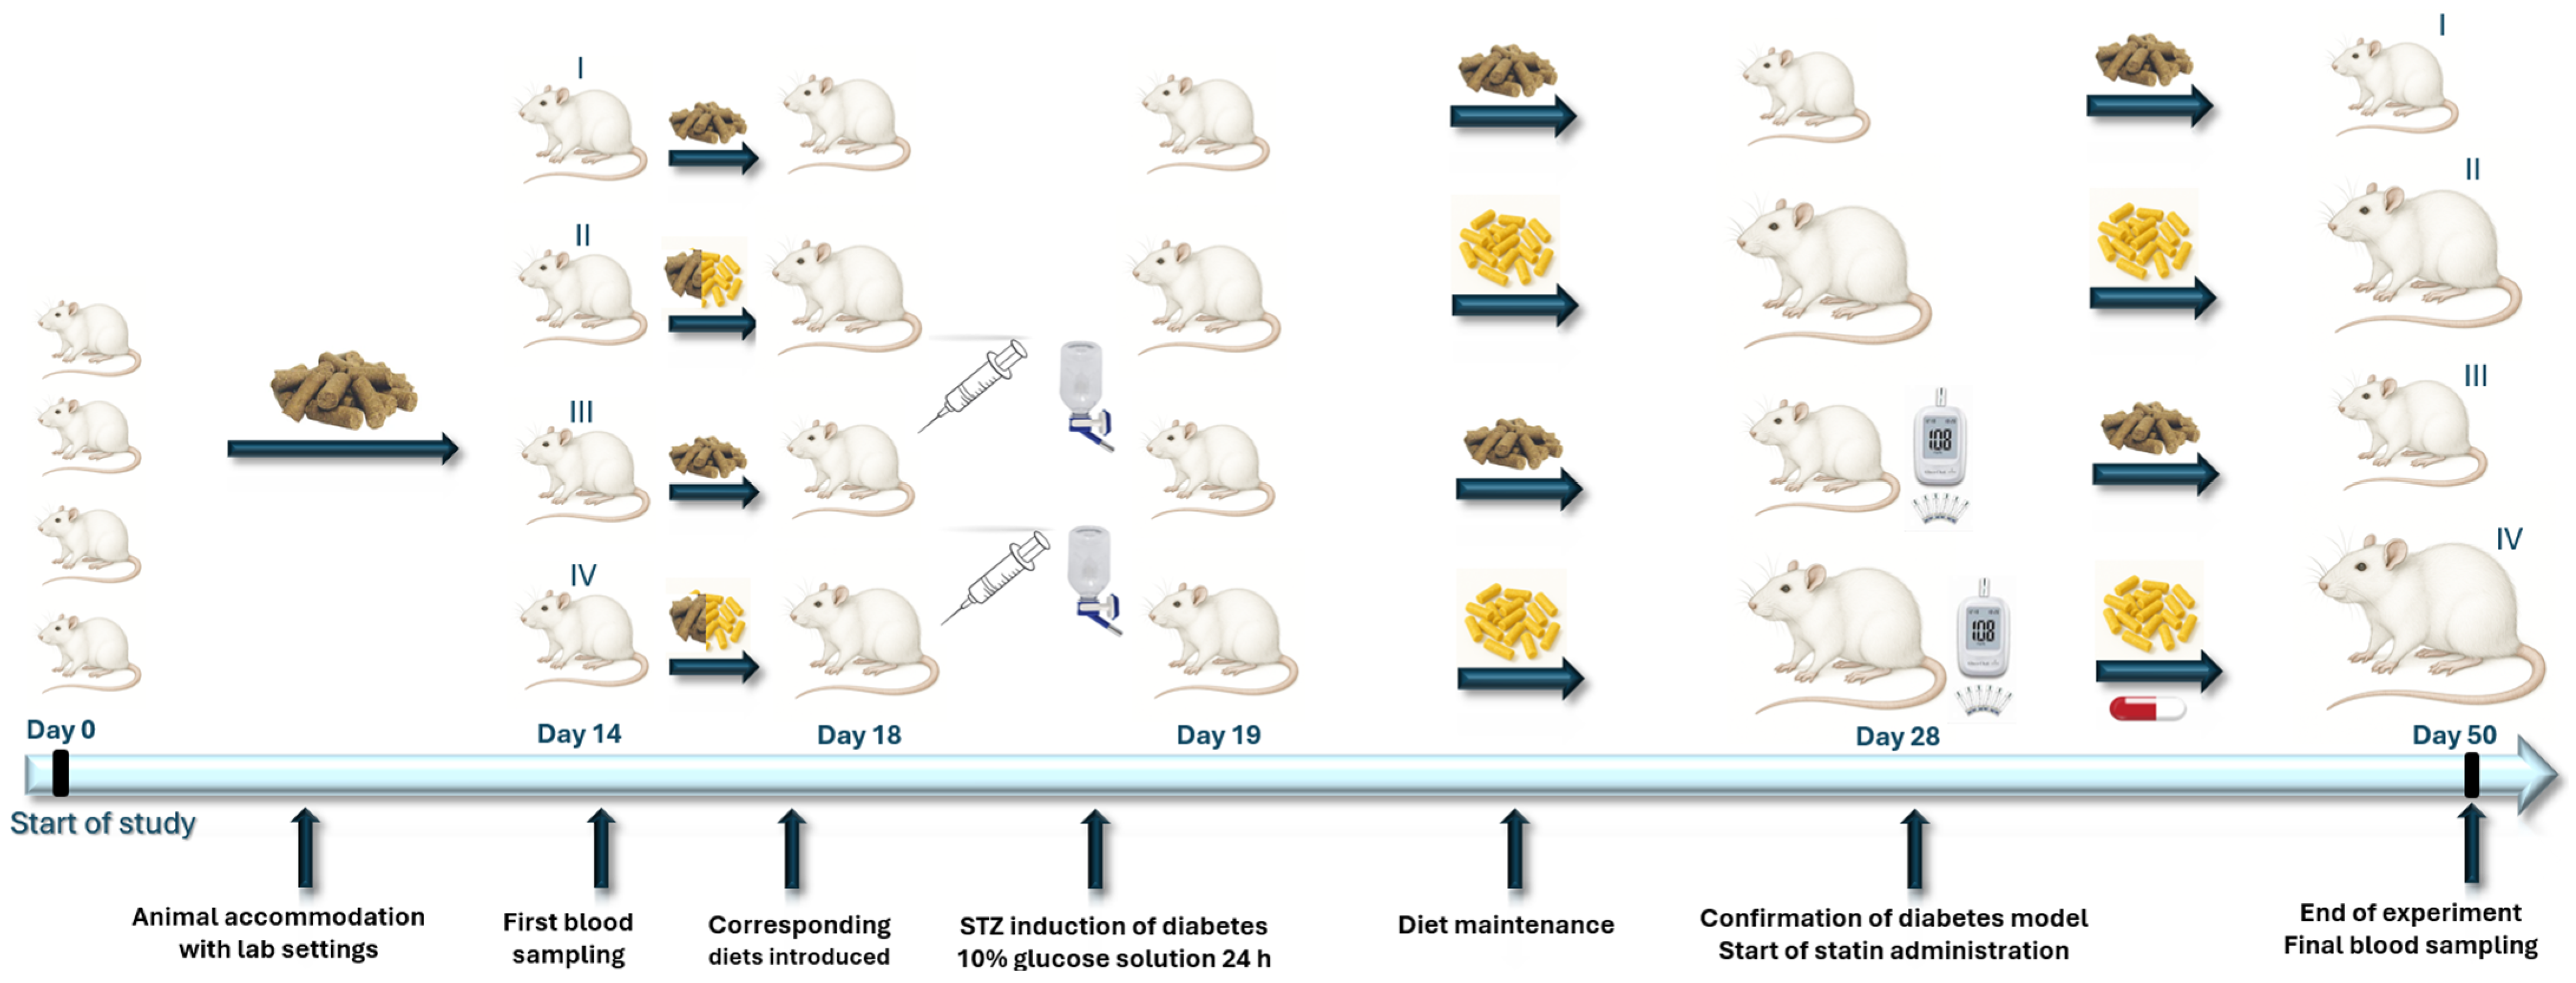
2.3. Experimental Design and Treatment Groups
2.4. Type 2 Diabetes Mellitus Rodent Model Induction and Confirmation
2.5. The Complete Biochemical Assay Protocol
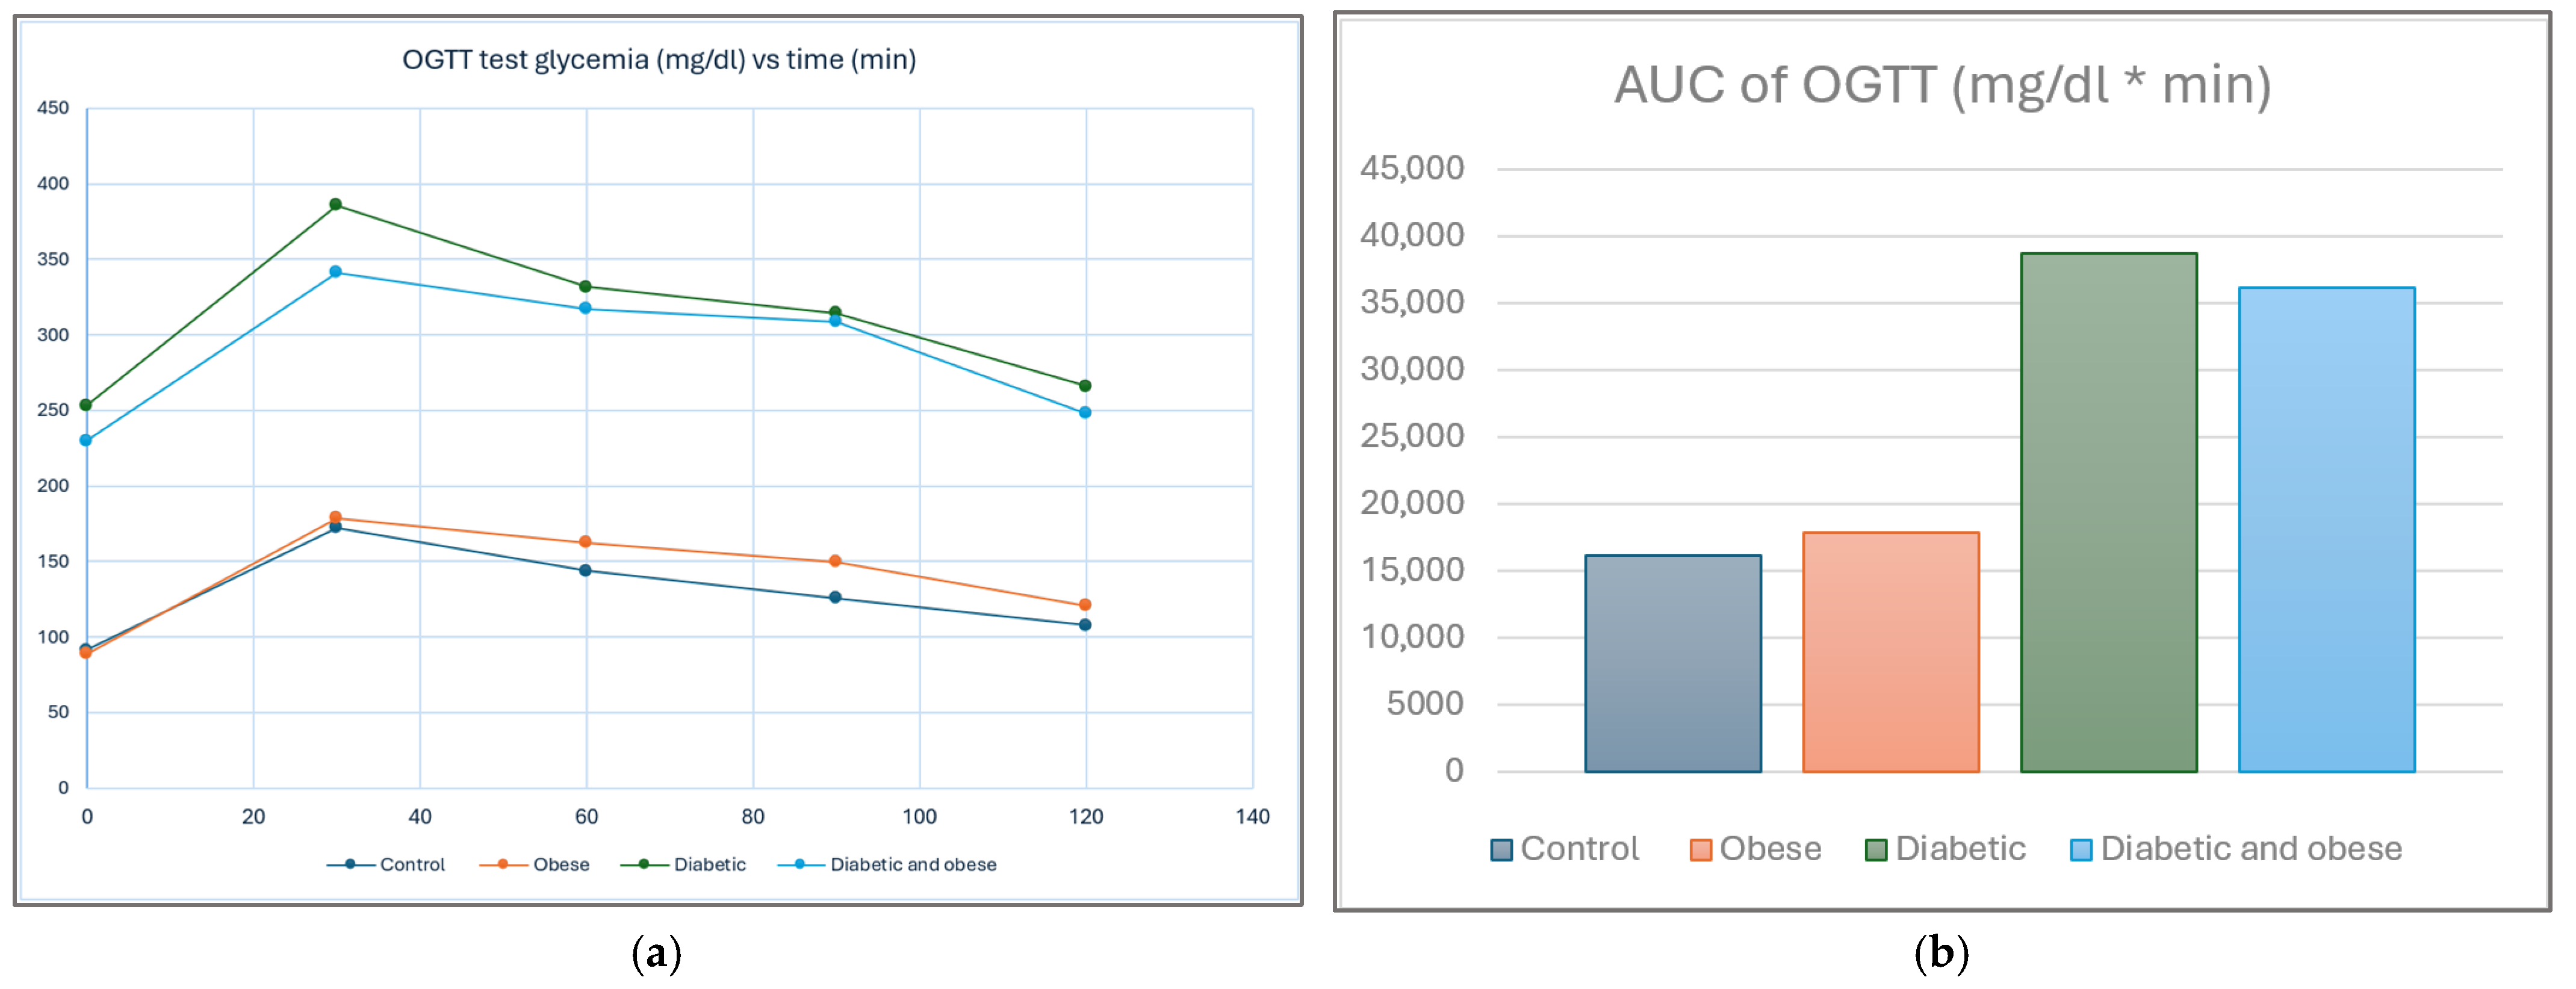
2.6. Additional Glycemia Assays in Diabetic Groups
2.7. Statistical Analysis
2.8. Statistical Tests Were Chosen to Retain Most of the Original Data Information
3. Results
4. Discussion
4.1. Obesity and Diabetes Individually Impair Renal Function
4.2. Atorvastatin Rescues the Renal Function in the Diabetic-and-Obese Rat
4.3. The Concentrations of Creatinine and Urea Are Reliably Correlated to IL-17α and TNFα
4.4. Atorvastatin Improves the Inflammatory Profile of Diabetic-and-Obese Rats, but Appearances May Be Deceiving
4.5. Paradoxical Effects of Statin upon IL-6 and IL-1β Cytokines Are Likely an Illusion
4.6. A Word of Caution: Indiscriminate Statin Treatment May Not Be the Solution
4.7. Limitations
5. Conclusions
Supplementary Materials
Author Contributions
Funding
Institutional Review Board Statement
Informed Consent Statement
Data Availability Statement
Conflicts of Interest
Abbreviations
| AMPK | Adenosine Monophosphate Kinase |
| AUC | Area under the Curve (for statistical methods) |
| DM | Diabetes Mellitus |
| HFD | High-Fat Diet |
| ICAM-1 | Intercellular cell adhesion molecule-1 |
| LGCI | Low-grade chronic inflammation |
| NF-κB | Nuclear Transcription Factor κB |
| NLRP3 | NOD-like receptor family, pyrin-domain-containing inflammasome |
| NO | Nitrogen monoxide |
| OGTT | Oral glucose tolerance test |
| PECAM | Platelet endothelial adhesion molecule-1 |
| RCT | Randomized controlled trial |
| STZ | Streptozotocin |
| TNFα | Tumoral necrosis factor α |
| TNFR | Tumoral necrosis factor α Receptor |
| T2DM | Type 2 diabetes mellitus |
References
- Fioranelli, M.; Roccia, M.G.; Flavin, D.; Cota, L. Regulation of Inflammatory Reaction in Health and Disease. Int. J. Mol. Sci. 2021, 22, 5277. [Google Scholar] [CrossRef]
- Cifuentes, M.; Verdejo, H.E.; Castro, P.F.; Corvalan, A.H.; Ferreccio, C.; Quest, A.F.G.; Kogan, M.J.; Lavandero, S. Low-Grade Chronic Inflammation: A Shared Mechanism for Chronic Diseases. Physiology 2025, 40, 4–25. [Google Scholar] [CrossRef]
- Tsalamandris, S.; Antonopoulos, A.S.; Oikonomou, E.; Papamikroulis, G.A.; Vogiatzi, G.; Papaioannou, S.; Deftereos, S.; Tousoulis, D. The Role of Inflammation in Diabetes: Current Concepts and Future Perspectives. Eur. Cardiol. 2019, 14, 50–59. [Google Scholar] [CrossRef]
- Khanna, D.; Khanna, S.; Khanna, P.; Kahar, P.; Patel, B.M. Obesity: A Chronic Low-Grade Inflammation and Its Markers. Cureus 2022, 14, e22711. [Google Scholar] [CrossRef]
- Hildebrandt, X.; Ibrahim, M.; Peltzer, N. Cell death and inflammation during obesity: “Know my methods, WAT(son)”. Cell Death Differ. 2023, 30, 279–292. [Google Scholar] [CrossRef]
- Sethi, J.K.; Hotamisligil, G.S. Metabolic Messengers: Tumour necrosis factor. Nat. Metab. 2021, 3, 1302–1312. [Google Scholar] [CrossRef] [PubMed]
- Nedosugova, L.V.; Markina, Y.V.; Bochkareva, L.A.; Kuzina, I.A.; Petunina, N.A.; Yudina, I.Y.; Kirichenko, T.V. Inflammatory Mechanisms of Diabetes and Its Vascular Complications. Biomedicines 2022, 10, 1168. [Google Scholar] [CrossRef] [PubMed]
- Hasegawa, Y.; Saito, T.; Ogihara, T.; Ishigaki, Y.; Yamada, T.; Imai, J.; Uno, K.; Gao, J.; Kaneko, K.; Shimosawa, T.; et al. Blockade of the nuclear factor-κB pathway in the endothelium prevents insulin resistance and prolongs life spans. Circulation 2012, 125, 1122–1133. [Google Scholar] [CrossRef] [PubMed]
- Stenvinkel, P.; Chertow, G.M.; Devarajan, P.; Levin, A.; Andreoli, S.P.; Bangalore, S.; Warady, B.A. Chronic Inflammation in Chronic Kidney Disease Progression: Role of Nrf2. Kidney Int. Rep. 2021, 6, 1775–1787. [Google Scholar] [CrossRef]
- Ren, N.; Wang, W.F.; Zou, L.; Zhao, Y.L.; Miao, H.; Zhao, Y.Y. The nuclear factor kappa B signaling pathway is a master regulator of renal fibrosis. Front. Pharmacol. 2024, 14, 1335094. [Google Scholar] [CrossRef]
- Guo, Q.; Jin, Y.; Chen, X.; Ye, X.; Shen, X.; Lin, M.; Zeng, C.; Zhou, T.; Zhang, J. NF-κB in biology and targeted therapy: New insights and translational implications. Signal Transduct. Target Ther. 2024, 9, 53. [Google Scholar] [CrossRef]
- Taqueti, V.R.; Ridker, P.M. Lipid-Lowering and Anti-Inflammatory Benefits of Statin Therapy: More Than Meets the Plaque. Circ. Cardiovasc. Imaging 2017, 10, e006676. [Google Scholar] [CrossRef] [PubMed]
- Zivkovic, S.; Maric, G.; Cvetinovic, N.; Lepojevic-Stefanovic, D.; Bozic Cvijan, B. Anti-Inflammatory Effects of Lipid-Lowering Drugs and Supplements—A Narrative Review. Nutrients 2023, 15, 1517. [Google Scholar] [CrossRef] [PubMed]
- Blake, G.J.; Ridker, P.M. Are statins anti-inflammatory? Trials 2000, 1, 161. [Google Scholar] [CrossRef] [PubMed]
- Dongbo, Y.; James, K.L. Emerging views of statin pleiotropy and cholesterol lowering. Cardiovasc Res. 2022, 118, 413–423. [Google Scholar] [CrossRef]
- Buabeid, M.; Arafa, E.S.A.; Yaseen, H.S.; Umar, M.I.; Murtaza, G. Anti-inflammatory effect of simvastatin by impeding TNF-α and interleukin-1β pathways: Antiangiogenic activity of simvastatin and simvastatin-loaded silver nanoparticles. Artif. Cells Nanomed. Biotechnol. 2022, 50, 208–217. [Google Scholar] [CrossRef]
- Koushki, K.; Shahbaz, S.K.; Mashayekhi, K.; Sadeghi, M.; Zayeri, Z.D.; Taba, M.Y.; Banach, M.; Al-Rasadi, K.; Johnston, T.; Sahekbar, A. Anti-inflammatory Action of Statins in Cardiovascular Disease: The Role of Inflammasome and Toll-Like Receptor Pathways. Clin. Rev. Allergy Immunol. 2021, 60, 175–199. [Google Scholar] [CrossRef]
- Yazdanpanah, M.; Yazdanpanah, N.; Chardoli, M.; Dehghan, A. Role of interleukin 6 signaling pathway in the anti-inflammatory effects of statins on coronary artery disease: Evidence from Mendelian randomization analysis. Int. J. Cardiol. 2024, 406, 131964. [Google Scholar] [CrossRef]
- Shomer, N.H.; Allen-Worthington, K.H.; Hickman, D.L.; Jonnalagadda, M.; Newsome, J.T.; Slate, A.R.; Valentine, H.; Williams, A.M.; Wilkinson, M. Review of Rodent Euthanasia Methods. J. Am. Assoc. Lab. Anim. Sci. 2020, 59, 242–253. [Google Scholar] [CrossRef]
- Pierozan, P.; Jernerén, F.; Ransome, Y.; Karlsson, O. The Choice of Euthanasia Method Affects Metabolic Serum Biomarkers. Basic Clin. Pharmacol. Toxicol. 2017, 121, 113–118. [Google Scholar] [CrossRef]
- Leitao, S.A.T.; dos Santos Soares, D.; Carvas, N.J.; Zimmer, R.; Ludwig, N.F.; Andrades, M. Study of anesthetics for euthanasia in rats and mice: A systematic review and meta-analysis on the impact upon biological outcomes (SAFE-RM). Life Sci. 2021, 284, 119916. [Google Scholar] [CrossRef] [PubMed]
- Struck, M.B.; Andrutis, K.A.; Ramirez, H.E.; Battles, A.H. Effect of a short-term fast on ketamine-xylazine anesthesia in rats. J. Am. Assoc. Lab. Anim. Sci. 2011, 50, 344–348. [Google Scholar] [PubMed]
- Vigneshwar, R.; Arivalagan, A.; Mekala, P.; Imayarasi, K. Sex-specific reference intervals for Wistar albino rats: Hematology and clinical biochemistry. Ind. J. Anim. Health 2021, 60, 58–65. [Google Scholar] [CrossRef]
- Laville, S.M.; Couturier, A.; Lambert, O.; Metzger, M.; Mansencal, N.; Jacquelinet, C.; Laville, M.; Frimat, L.; Fouque, D.; Combe, C.; et al. Urea levels and cardiovascular disease in patients with chronic kidney disease. Nephrol. Dial. Transplant. 2022, 38, 184–192. [Google Scholar] [CrossRef] [PubMed]
- Heaf, J.G.; Mortensen, L.S. Uraemia progression in chronic kidney disease stages 3–5 is not constant. Nephron Clin. Pract. 2011, 118, c367–c374. [Google Scholar] [CrossRef]
- Ahmed, N.; Dalmasso, C.; Turner, M.B.; Arthur, G.; Cincinelli, G.; Loria, A.S. From fat to filter: The effect of adipose tissue-derived signals on kidney function. Nat. Rev. Nephrol. 2025, 21, 417–434. [Google Scholar] [CrossRef]
- Lambert, E.A.; Esler, M.D.; Schlaich, M.P.; Dixon, J.; Eikelis, N.; Lamber, G.W. Obesity-Associated Organ Damage and Sympathetic Nervous Activity: A Target for Treatment? Hypertension 2019, 73, 1150–1159. [Google Scholar] [CrossRef]
- Srivastava, S.P.; Li, J.; Kitada, M.; Fujita, H.; Yamada, Y.; Goodwin, J.E.; Kanasaki, K.; Koya, D. SIRT3 deficiency leads to induction of abnormal glycolysis in diabetic kidney with fibrosis. Cell Death Dis. 2018, 9, 997. [Google Scholar] [CrossRef]
- Srivastava, S.P.; Li, J.; Takagaki, Y.; Kitada, M.; Goodwin, J.E.; Kanasaki, K.; Koya, D. Endothelial SIRT3 regulates myofibroblast metabolic shifts in diabetic kidneys. iScience 2021, 24, 102390. [Google Scholar] [CrossRef]
- Gong, X.; Zeng, X.; Fu, P. The impact of weight loss on renal function in individuals with obesity and type 2 diabetes: A comprehensive review. Front. Endocrinol. 2024, 15, 1320627. [Google Scholar] [CrossRef]
- Al Maradni, A.; Tomah, S.; Mottalib, A.; Rosas, S.; Alsibai, K.; Pober, D.; Morsi, A.; Hamdy, O. The effect of intensive lifestyle intervention on renal function in patients with diabetes and obesity in real-world practice: A 5-years longitudinal study. Hum. Nutr. Metabol. 2021, 24, 200119. [Google Scholar] [CrossRef]
- US Preventive Services Task Force. Statin Use for the Primary Prevention of Cardiovascular Disease in Adults: US Preventive Services Task Force Recommendation Statement. JAMA 2022, 328, 746–753. [Google Scholar] [CrossRef] [PubMed]
- Jabarpour, M.; Rashtchizadeh, N.; Ghorbani Haghjo, A.; Argani, H.; Nemati, M.; Dastmalchi, S.; Roshangar, L.; Ranjbarzadhag, M.; Mesgari-Abbasi, M.; Bargahi, N.; et al. Protection of renal damage by HMG-CoA inhibitors: A comparative study between atorvastatin and rosuvastatin. Iran J. Basic Med. Sci. 2020, 23, 206–213. [Google Scholar] [CrossRef] [PubMed]
- Pengrattanachot, N.; Cherngwelling, R.; Jaikumkao, K.; Pongchaidecha, A.; Thongnak, L.; Swe, M.T.; Chatsudthipong, V.; Lungkaphin, A. Atorvastatin attenuates obese-induced kidney injury and impaired renal organic anion transporter 3 function through inhibition of oxidative stress and inflammation. Biochim. Biophys. Acta Mol. Basis. Dis. 2020, 1866, 165741. [Google Scholar] [CrossRef] [PubMed]
- Wang, A.; Lin, Y.; Liang, B.; Zhao, X.; Qiu, M.; Huang, H.; Li, C.; Wang, W.; Kong, Y. Statins attenuate cholesterol-induced ROS via inhibiting NOX2/NOX4 and mitochondrial pathway in collecting ducts of the kidney. BMC Nephrol. 2022, 23, 184. [Google Scholar] [CrossRef]
- Kimura, G.; Kasahara, M.; Ueshima, K.; Tanaka, S.; Yasuno, S.; Fujimoto, A.; Sato, T.; Imamoto, M.; Kosugi, S.; Nakao, K. Effects of atorvastatin on renal function in patients with dyslipidemia and chronic kidney disease: Assessment of clinical usefulness in CKD patients with atorvastatin (ASUCA) trial. Clin. Exp. Nephrol. 2017, 21, 417–424. [Google Scholar] [CrossRef]
- Vogt, L.; Bangalore, S.; Fayyad, R.; Melamed, S.; Hovingh, K.; DeMicco, D.A.; Waters, D.D. Atorvastatin Has a Dose-Dependent Beneficial Effect on Kidney Function and Associated Cardiovascular Outcomes: Post Hoc Analysis of 6 Double-Blind Randomized Controlled Trials. JAHA 2019, 8, e010827. [Google Scholar] [CrossRef]
- Esmeijer, K.; Dekkers, O.M.; de Fijter, J.W.; Dekker, F.W.; Hoogeveen, E.K. Effect of different types of statins on kidney function decline and proteinuria: A network meta-analysis. Sci. Rep. 2019, 9, 16632. [Google Scholar] [CrossRef]
- Hu, P.J.; Wu, M.Y.; Lin, T.C.; Chen, T.T.; Wu, Y.C.; Su, S.L.; Lu, K.C.; Chen, J.S.; Sung, F.C.; Lee, C.T.; et al. Effect of Statins on Renal Function in Chronic Kidney Disease Patients. Sci. Rep. 2018, 8, 16276. [Google Scholar] [CrossRef]
- Cortvrindt, C.; Speeckaert, R.; Moerman, A.; Delanghe, J.R.; Speeckaert, M.M. The role of interleukin-17A in the pathogenesis of kidney diseases. Pathology 2017, 49, 247–258. [Google Scholar] [CrossRef]
- Danzaki, K.; Matsui, Y.; Ikesue, M.; Ohta, D.; Ito, K.; Kanayama, M.; Kurotaki, D.; Morimoto, J.; Iwakura, Y.; Yagita, H.; et al. Interleukin-17A deficiency accelerates unstable atherosclerotic plaque formation in apolipoprotein e-deficient mice. Arterioscler. Thromb. Vasc. Biol. 2011, 32, 273–280. [Google Scholar] [CrossRef]
- Lin, X.; You, Y.; Wang, J.; Qin, Y.; Huang, P.; Yang, F. MicroRNA-155 Deficiency Promotes Nephrin Acetylation and Attenuates Renal Damage in Hyperglycemia-Induced Nephropathy. Inflammation 2015, 38, 546–554. [Google Scholar] [CrossRef]
- Ma, J.; Li, Y.J.; Chen, X.; Kwan, T.; Chadban, S.; Wu, H. Interleukin 17A promotes diabetic kidney injury. Sci. Rep. 2019, 9, 2264. [Google Scholar] [CrossRef] [PubMed]
- Lavoz, C.; Matus, Y.S.; Orejudo, M.; Carpio, J.D.; Droguett, A.; Egido, J.; Mezzano, S.; Ruiz-Ortega, M. Interleukin-17A blockade reduces albuminuria and kidney injury in an accelerated model of diabetic nephropathy. Kidney Int. 2019, 95, 1418–1432. [Google Scholar] [CrossRef] [PubMed]
- Jin, H.; Wei, W.; Zhao, Y.; Ma, A.; Sun, K.; Lin, X.; Liu, Q.; Shou, S.; Zhang, Y. The roles of interleukin-17A in risk stratification and prognosis of patients with sepsis-associated acute kidney injury. Kidney Res. Clin. Pract. 2023, 42, 742–750. [Google Scholar] [CrossRef] [PubMed]
- Al-Rawi, K.F.; Ali, H.H.; Guma, M.A.; Mohammed Aldahham, B.J.; Tuleab Alaaraji, S.F.; Al-Ani, O.; Tariq Ali, A. Relationship Between IL-2, IL-17 Concentrations, and Serum Creatinine Levels in Men with Chronic Kidney Diseases. Rep. Biochem. Mol. Biol. 2022, 10, 664–674. [Google Scholar] [CrossRef]
- Soták, M.; Clark, M.; Suur, B.E.; Borgeson, E. Inflammation and resolution in obesity. Nat. Rev. Endocrinol. 2025, 21, 45–61. [Google Scholar] [CrossRef]
- Mehaffey, E.; Majid, D.S.A. Tumor necrosis factor-α, kidney function, and hypertension. Am. J. Physiol. Renal Physiol. 2017, 313, F1005–F1008. [Google Scholar] [CrossRef]
- Taguchi, S.; Azushima, K.; Yamaji, T.; Urate, S.; Suzuki, T.; Abe, E.; Tanaka, S.; Tsukamoto, S.; Kamimura, D.; Kinguchi, S.; et al. Effects of tumor necrosis factor-α inhibition on kidney fibrosis and inflammation in a mouse model of aristolochic acid nephropathy. Sci. Rep. 2021, 11, 23587. [Google Scholar] [CrossRef]
- Eswar, S.; Rajagopalan, B.; Ete, K.; Nageswara, R.G.S. Serum Tumor Necrosis Factor Alpha (TNF-α) Levels in Obese and Overweight Adults: Correlations With Metabolic Syndrome and Inflammatory Markers. Cureus 2024, 16, e64619. [Google Scholar] [CrossRef]
- Flake, C.C.; Aguas, I.S.; Policarpio, A.; Ysais, A.; Tiongco, R.E.; Navarro, A. Serum and urinary levels of tumor necrosis factor-alpha and interferon-gamma in diabetic nephropathy patients: A systematic review. Int. J. Diabetes Dev. Ctries 2024, 44, 644–651. [Google Scholar] [CrossRef]
- Arthanarisami, A.; Komaru, Y.; Katsouridi, C.; Schumacher, J.; Verges, D.K.; Ning, L.; Abdelmageed, M.M.; Herrlich, A.; Kefaloyianni, E. Acute Kidney Injury-Induced Circulating TNFR1/2 Elevations Correlate with Persistent Kidney Injury and Progression to Fibrosis. Cells 2023, 12, 2214. [Google Scholar] [CrossRef]
- Abbasifard, M.; Kandelouei, T.; Aslani, S.; Razi, B.; Imani, D.; Fasihi, M.; Cicero, F.G.; Sahekbar, A. Effect of statins on the plasma/serum levels of inflammatory markers in patients with cardiovascular disease; a systematic review and meta-analysis of randomized clinical trials. Inflammopharmacology 2022, 30, 369–383. [Google Scholar] [CrossRef] [PubMed]
- Razi, B.; Aslani, S.; Imani, D.; Salehiyeh, S.; Fasihi, M.; Reiner, Ž.; Sahebkar, A. Effect of Statins on Serum Levels of TNF-alpha and Interleukin-6 in Patients with Kidney Disease: A Meta-analysis of Randomized Clinical Trials. Curr. Pharm. Des. 2024, 30, 1564–1577. [Google Scholar] [CrossRef] [PubMed]
- Sabeel, S.; Motaung, B.; Nhuyen, K.A.; Ozturk, M.; Mukasa, S.L.; Wolmarans, K.; Blom, D.J.; Sliwa, K.; Nepolo, E.; Gunther, G.; et al. Impact of statins as immune-modulatory agents on inflammatory markers in adults with chronic diseases: A systematic review and meta-analysis. PLoS ONE 2025, 20, e0323749. [Google Scholar] [CrossRef] [PubMed]
- Wang, S.; Xie, X.; Lei, T.; Zhang, K.; Lai, B.; Zhang, Z.; Guan, Y.; Mao, G.; Xiao, L.; Wang, N. Statins Attenuate Activation of the NLRP3 Inflammasome by Oxidized LDL or TNFα in Vascular Endothelial Cells through a PXR-Dependent Mechanism. Mol. Pharmacol. 2017, 92, 256–264. [Google Scholar] [CrossRef]
- Kouhpeikar, H.; Delbari, Z.; Sathyapalan, T.; Simental-Mendía, L.E.; Jamialahmadi, T.; Sahebkar, A. The Effect of Statins through Mast Cells in the Pathophysiology of Atherosclerosis: A Review. Curr. Atheroscler. Rep. 2020, 22, 19. [Google Scholar] [CrossRef]
- Saeedi Saravi, S.S.; Saeedi Saravi, S.S.; Arefidoust, A.; Dehpour, A.R. The beneficial effects of HMG-CoA reductase inhibitors in the processes of neurodegeneration. Metab. Brain Dis. 2017, 32, 949–965. [Google Scholar] [CrossRef]
- Kwak, B.; Mulhaupt, F.; Myit, S.; Mach, F. Statins as a newly recognized type of immunomodulator. Nat. Med. 2000, 6, 1399–1402. [Google Scholar] [CrossRef]
- Khatiwada, N.; Hong, Z. Potential Benefits and Risks Associated with the Use of Statins. Pharmaceutics 2024, 16, 214. [Google Scholar] [CrossRef]
- Saud, A.; Ali, N.A.; Gali, F.; Hadi, N. The role of cytokines, adhesion molecules, and toll-like receptors in atherosclerosis progression: The effect of Atorvastatin. J. Med. Life 2022, 15, 751–756. [Google Scholar] [CrossRef]
- Miao, Y.; Yan, T.; Liu, J.; Zhang, C.; Yan, J.; Xu, L.; Zhang, N.; Zhang, X. Meta-analysis of the association between interleukin-17 and ischemic cardiovascular disease. BMC Cardiovasc. Disord. 2024, 24, 252. [Google Scholar] [CrossRef]
- Voss, L.; Guttek, K.; Reddig, A.; Reinhold, A.; Voss, M.; Simeoni, L.; Schraven, B.; Reinhold, D. Pitavastatin Is a Highly Potent Inhibitor of T-Cell Proliferation. Pharmaceuticals 2021, 14, 727. [Google Scholar] [CrossRef]
- He, X.; Liang, B.; Gu, N. Th17/Treg Imbalance and Atherosclerosis. Dis. Markers 2020, 2020, 8821029. [Google Scholar] [CrossRef] [PubMed]
- Zhang, X.; Jin, J.; Peng, X.; Ramgolam, V.S.; Markovic-Plese, S. Simvastatin Inhibits IL-17 Secretion by Targeting Multiple IL-17-Regulatory Cytokines and by Inhibiting the Expression of IL-17 Transcription Factor RORC in CD4+ Lymphocytes. J. Immunol. 2008, 180, 6988–6996. [Google Scholar] [CrossRef] [PubMed]
- Tabrizi, Z.; Tamtaji, O.R.; Mirhosseini, N.; Lankarani, K.B.; Akbari, M.; Dadgostar, E.; Borhani-Haghighi, A.; Peymani, P.; Ahmadizar, F.; Asemi, Z. The effects of statin use on inflammatory markers among patients with metabolic syndrome and related disorders: A systematic review and metaanalysis of randomized controlled trials. Pharmacol. Res. 2019, 141, 85–103. [Google Scholar] [CrossRef] [PubMed]
- Meda, C.; Plank, C.; Mykhaylyk, O.; Schmidt, K.; Mayer, B. Effects of statins on nitric oxide/cGMP signaling in human umbilical vein endothelial cells. Pharmacol. Rep. 2010, 62, 100–112. [Google Scholar] [CrossRef]
- Xenos, E.S.; Stevens, S.L.; Freeman, M.B.; Cassada, D.C.; Goldman, M.H. Nitric oxide mediates the effect of fluvastatin on intercellular adhesion molecule-1 and platelet endothelial cell adhesion molecule-1 expression on human endothelial cells. Ann. Vasc. Surg. 2005, 19, 386–392. [Google Scholar] [CrossRef]
- Wei, H.; Fang, L.; Song, J.; Chatterjee, S. Statin-inhibited endothelial permeability could be associated with its effect on PECAM-1 in endothelial cells. FEBS Lett. 2005, 579, 1272–1278. [Google Scholar] [CrossRef]
- Loppnow, H.; Zhang, L.; Buerke, M.; Lautenschläger, M.; Chen, L.; Frister, A.; Schlitt, A.; Luther, T.; Song, N.; Hofmann, B.; et al. Statins potently reduce the cytokine-mediated IL-6 release in SMC/MNC cocultures. J. Cell. Mol. Med. 2011, 15, 994–1004. [Google Scholar] [CrossRef]
- Libby, P. Interleukin-1 Beta as a Target for Atherosclerosis Therapy: Biological Basis of CANTOS and Beyond. J. Am. Coll. Cardiol. 2017, 70, 2278–2289. [Google Scholar] [CrossRef] [PubMed]
- Lindholm, M.W.; Nilsson, J. Simvastatin stimulates macrophage interleukin-1beta secretion through an isoprenylation-dependent mechanism. Vascul. Pharmacol. 2007, 46, 91–96. [Google Scholar] [CrossRef] [PubMed]
- Boland, A.J.; Gangadharan, N.; Kavanagh, P.; Hemeryck, L.; Kieran, J.; Barry, M.; Walsh, P.T.; Lucitt, M. Simvastatin Suppresses Interleukin Iβ Release in Human Peripheral Blood Mononuclear Cells Stimulated With Cholesterol Crystals. J. Cardiovasc. Pharmacol. Ther. 2018, 23, 509–517. [Google Scholar] [CrossRef]
- Sharpton, R.A.; Laucka, P.J.; McKeller, R.N.; Dangler, M.A.; Horne, J.S.; Dangler, J.Y. The Impact of Obesity on the Efficacy of Simvastatin for Lowering Low-Density Lipoprotein Cholesterol in a Veteran Population. Fed. Pract. 2017, 34, 41–44. [Google Scholar] [PubMed]
- Mora-Rodriguez, R.; Ortega, J.F.; Morales-Palomo, F.; Ramirez-Jimenez, M.; Moreno-Cabañas, A. Effects of statin therapy and exercise on postprandial triglycerides in overweight individuals with hypercholesterolaemia. Br. J. Clin. Pharmacol. 2020, 86, 1089–1099. [Google Scholar] [CrossRef]
- Ganda, O.P. Statin-induced diabetes: Incidence, mechanisms, and implications. F1000Research 2016, 5, 1499. [Google Scholar] [CrossRef]
- Kokkinos, P.F.; Faselis, C.J.; Myers, J.; Samuel, I.B.; Lavie, C.J.; Gollie, J.; Lamonte, M.J.; Pittaras, A.; Sen, S.; Nylen, E. Fitness in Type 2 Diabetes Mellitus Incidence. Circulation 2023, 148, S1. [Google Scholar] [CrossRef]
- Taylor, B.A.; Ng, J.; Stone, A.; Thompson, P.D.; Papasavas, P.K.; Tishler, D.S. Effects of statin therapy on weight loss and diabetes in bariatric patients. Surg. Obes. Relat. Dis. 2017, 13, 674–680. [Google Scholar] [CrossRef]
- Cholesterol Treatment Trialists’ Collaboration. Effect of statin therapy on muscle symptoms: An individual participant data meta-analysis of large-scale, randomised, double-blind trials. Lancet 2022, 400, 832–845. [Google Scholar] [CrossRef]
- Zhang, Y.; Qu, Y.; Cai, R.; Gao, J.; Xu, Q.; Zhang, L.; Kang, M.; Jia, H.; Chen, Q.; Liu, Y.; et al. Atorvastatin ameliorates diabetic nephropathy through inhibiting oxidative stress and ferroptosis signaling. Eur. J. Pharmacol. 2024, 976, 176699. [Google Scholar] [CrossRef]
- Lu, L.; Peng, W.H.; Wang, W.; Wang, L.J.; Chen, Q.J.; Shen, W.F. Effects of atorvastatin on progression of diabetic nephropathy and local RAGE and soluble RAGE expressions in rats. J. Zhejiang Univ. Sci. B 2011, 12, 652–659. [Google Scholar] [CrossRef]
- Liao, D.; Liu, Y.Q.; Xiong, L.Y.; Zhang, L. Renoprotective effect of atorvastatin on STZ-diabetic rats through inhibiting inflammatory factors expression in diabetic rat. Eur. Rev. Med. Pharmacol. Sci. 2016, 20, 1888–1893. [Google Scholar] [PubMed]
- Zhao, L.; Li, S.; Gao, Y. Efficacy of statins on renal function in patients with chronic kidney disease: A systematic review and meta-analysis. Ren. Fail. 2021, 43, 718–728. [Google Scholar] [CrossRef] [PubMed]

| Group | Name | Experimental Protocol |
|---|---|---|
| G-I | Control (normal) | Rats fed with standard chow over whole study period |
| G-II | Obese (High-Fat Diet—HFD only) | Rats fed with HFD chow over whole study period |
| G-III | Diabetic (Diabetes-induced model only) | Streptozotocin-induced diabetes fed with standard chow |
| G-IV | Diabetic + Obese + Atorvastatin (Statin treated) | Streptozotocin-induced diabetes, HFD, and statin treated |
| Chow (% by Weight) | Standard Lab Chow | Caloric Content | HFD + 2% Cholesterol | Caloric Content |
|---|---|---|---|---|
| Protein | 23.7% | 28.6% | 18% | 14.9% |
| Fat extract | 5% | 13.5% | 31.7% | 59.1% |
| Carbohydrate | 48.4% | 58.0% | 31.3% | 26% |
| Neutral detergent fiber | 15.6% | 14.7% | ||
| Ash | 7% | 4.9% | ||
| Energy density | 3.34 kcal/gram | 4.83 kcal/gram |
| Time | Parameter/Group | G-I (Control) | G-II (Obese) | G-III (Diabetic Only) | G-IV (Statin Treated) |
|---|---|---|---|---|---|
| Initial | Glycemia (mg/dL) | 89.9 (9.9) | 86.3 (9.2) | 84.7 (12.9) | 98.8 (5.3) * |
| Urea (mg/dL) | 13.7 (2.0) | 13.9 (2.8) | 16.1 (3.0) | 16.3 (3.1) | |
| Creatinine (mg/dL) | 0.34 (0.09) | 0.49 (0.16) | 0.54 (0.12) * | 0.42 (0.15) | |
| CRP (mg/dL) | 2.0 (1.1, 3.0) | 1.0 (0.7, 2.0) | 1.6 (1.0, 1.8) | 2.0 (1.0, 3.0) | |
| Final time point | Glycemia (mg/dL) | 84.1 (11.2) | 99.6 (5.9) * | 325.6 (43.1) * | 277.4 (18.1) * |
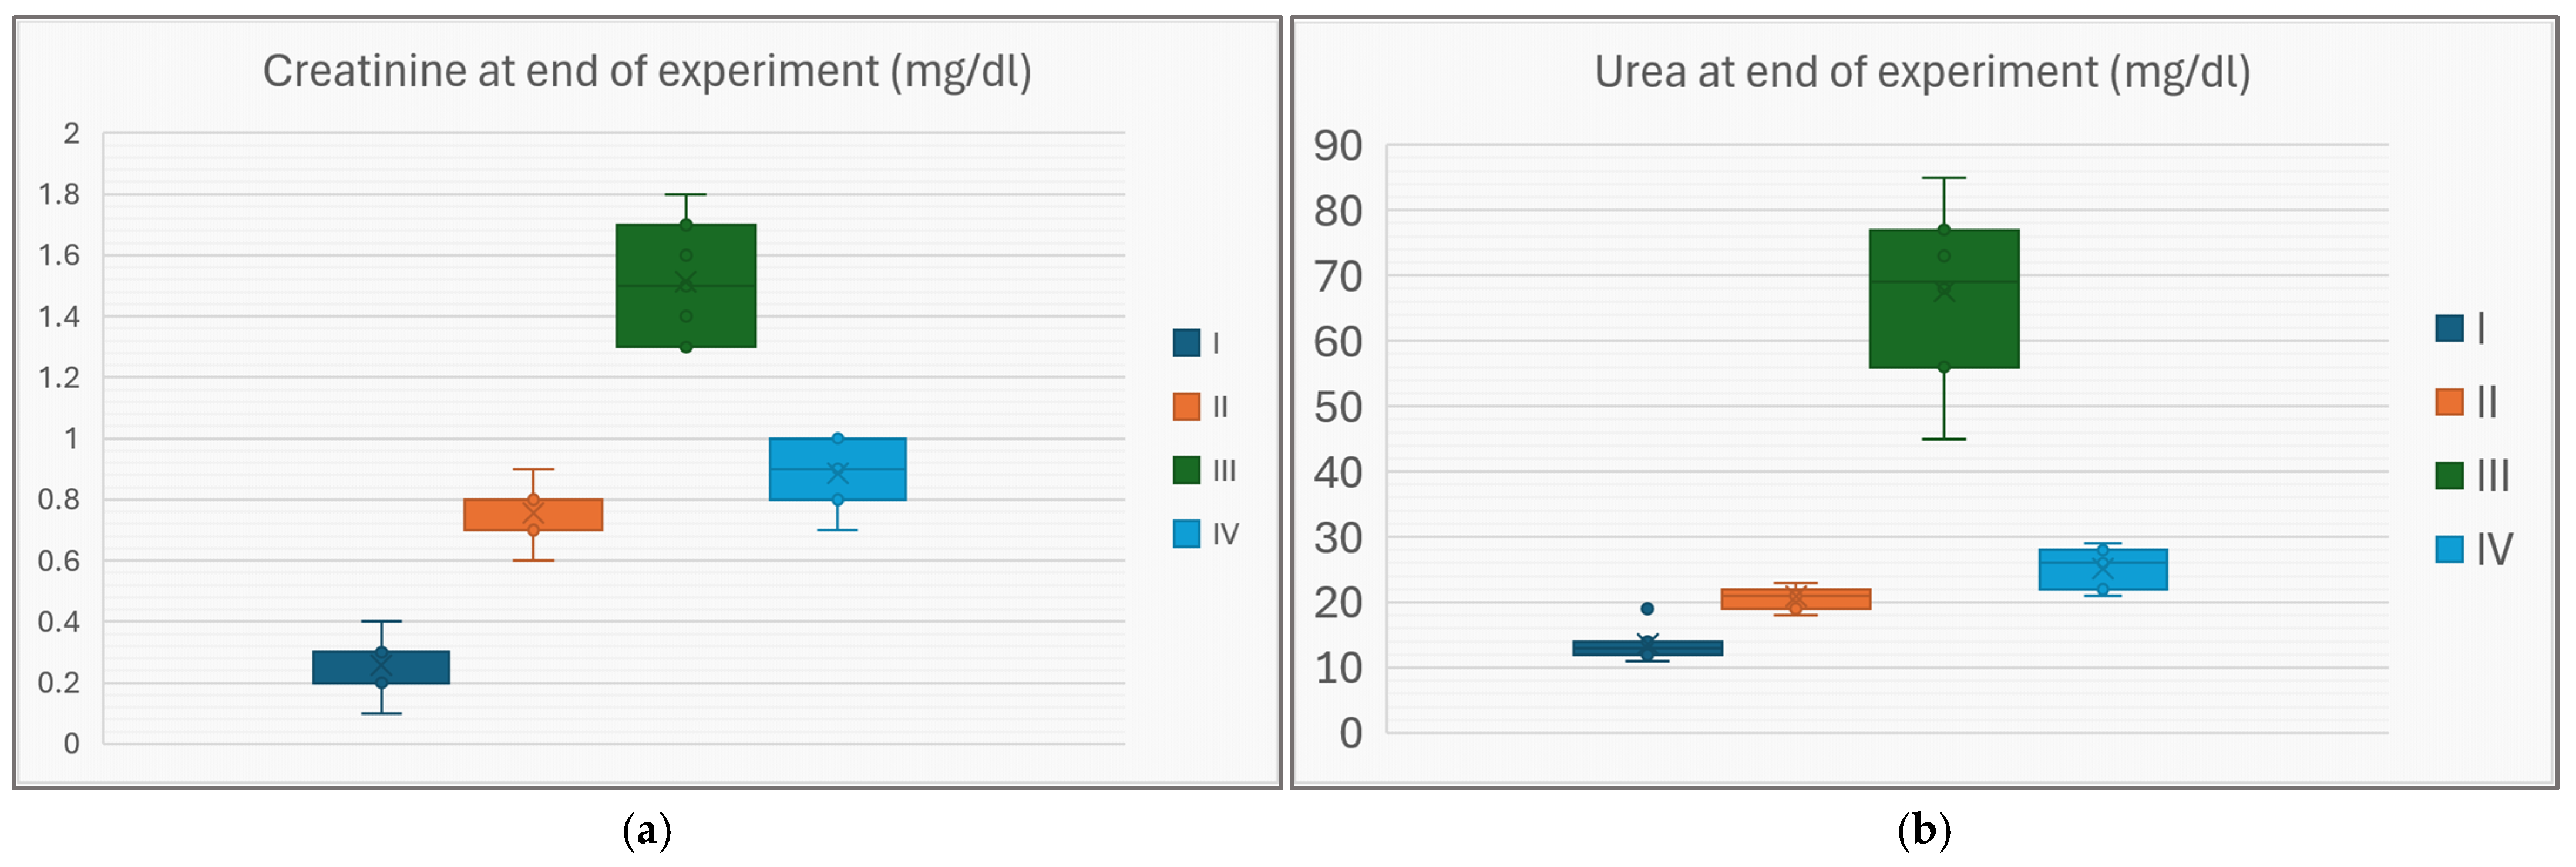
| Urea (mg/dL) | 13.6 (2.4) | 20.9 (1.6) * | 67.6 (12.4) * | 25.1 (2.9) * | |
| Creatinine (mg/dL) | 0.26 (0.09) | 0.76 (0.09) * | 1.51 (0.18) * | 0.89 (0.10) * | |
| CRP (mg/dL) | 4.9 (0.8) | 5.4 (1.5) | 3.9 (1.3) | 3.8 (1.0) | |
| Total Col (mg/dL) | 176.7 (31.0) | 250.7 (31.8) | 260.0 (185.0, 262.0) | 196.0 (189.0, 201.0) | |
| HDL-Col (mg/dL) | 55.6 (6.8) | 54.1 (7.7) | 62 (5.5) | 57.6 (8.6) | |
| LDL-Col (mg/dL) | 52.9 (10.2) | 50.6 (4.1) | 39.2 (6.9) | 92.4 (4.0) | |
| Triglycerides (mg/dL) | 170 (164, 177) | 170 (25) | 193 (10) | 194 (17) | |
| IL-1β (U/L) | 68 (39) | 4116 (427) * | 3327 (623) * | 4439 (795) * | |
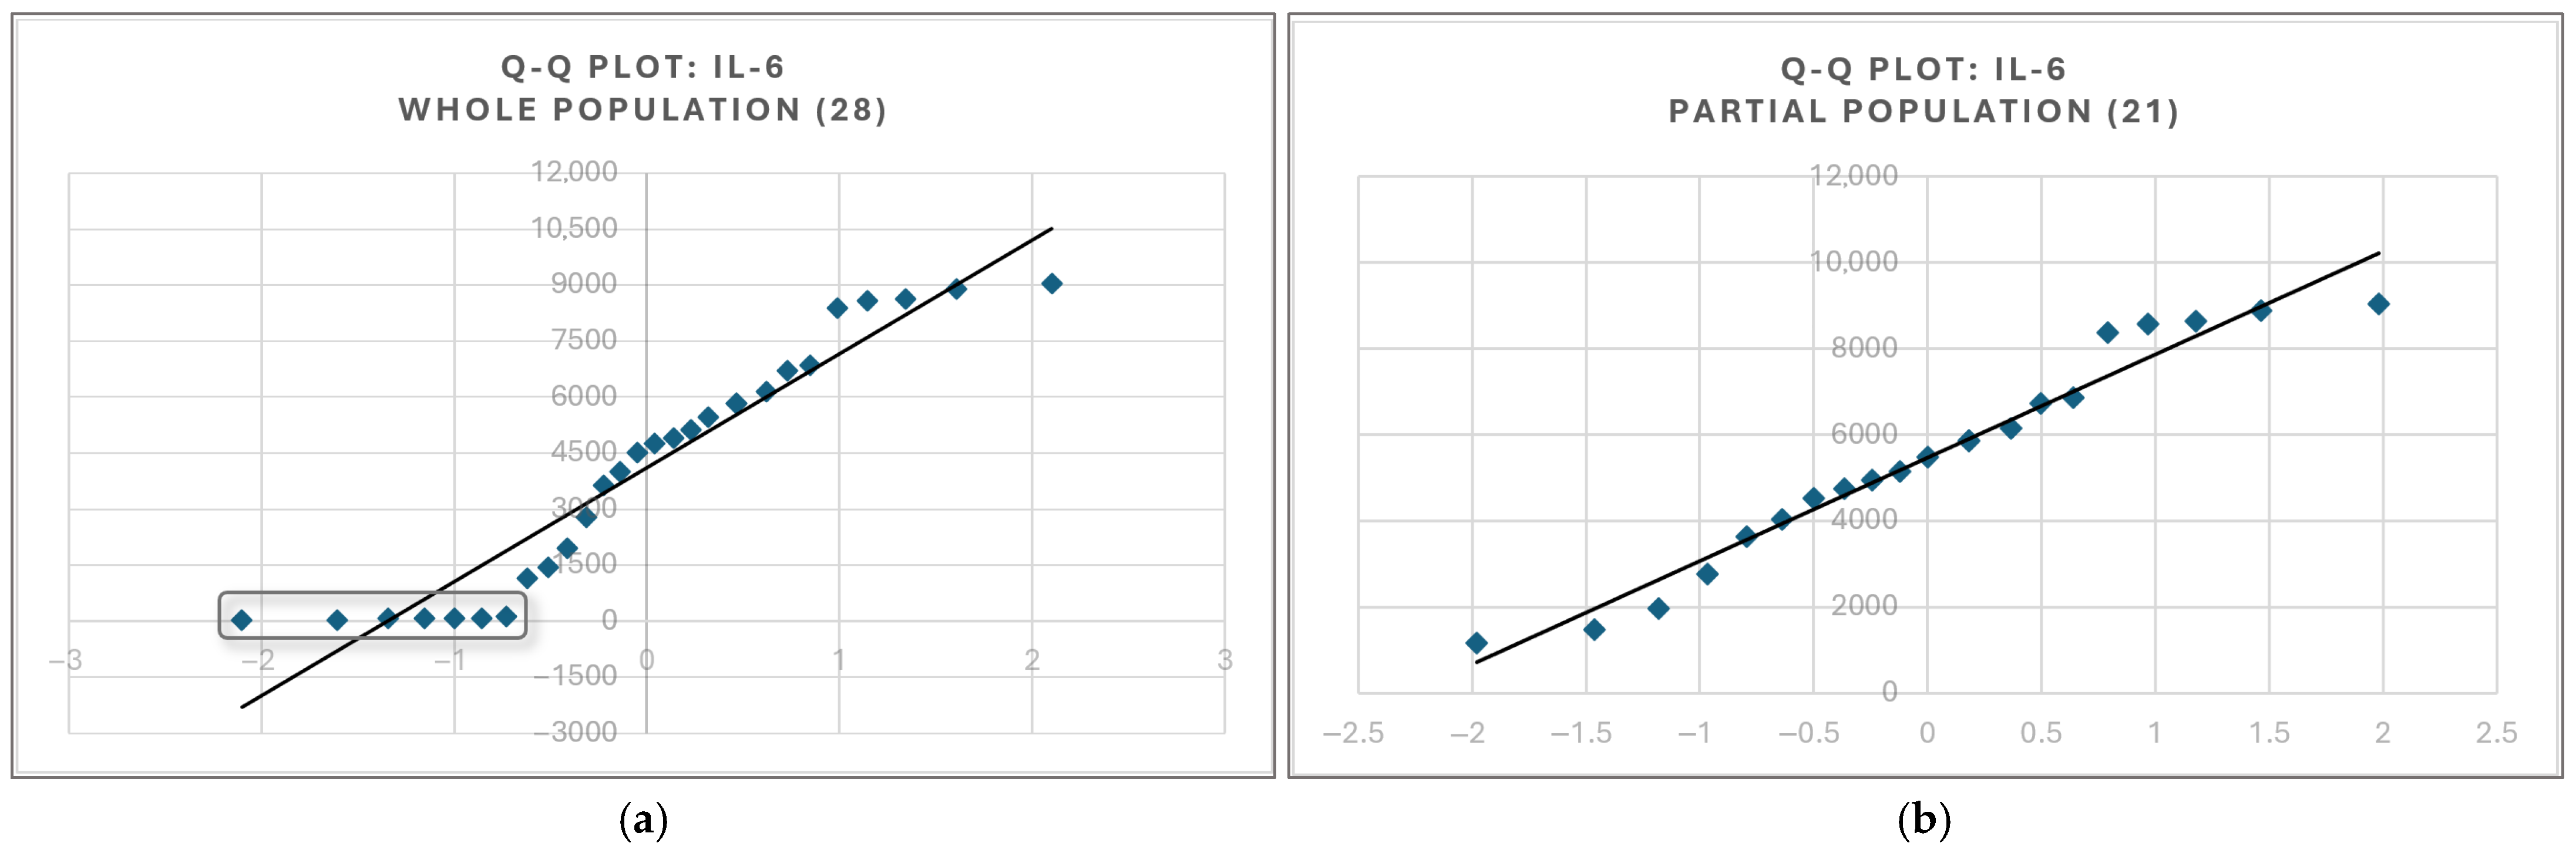
| IL-6 (U/L) | 66 (28) | 3874 (2333) * | 5689 (686) * | 6817 (2564) * | |
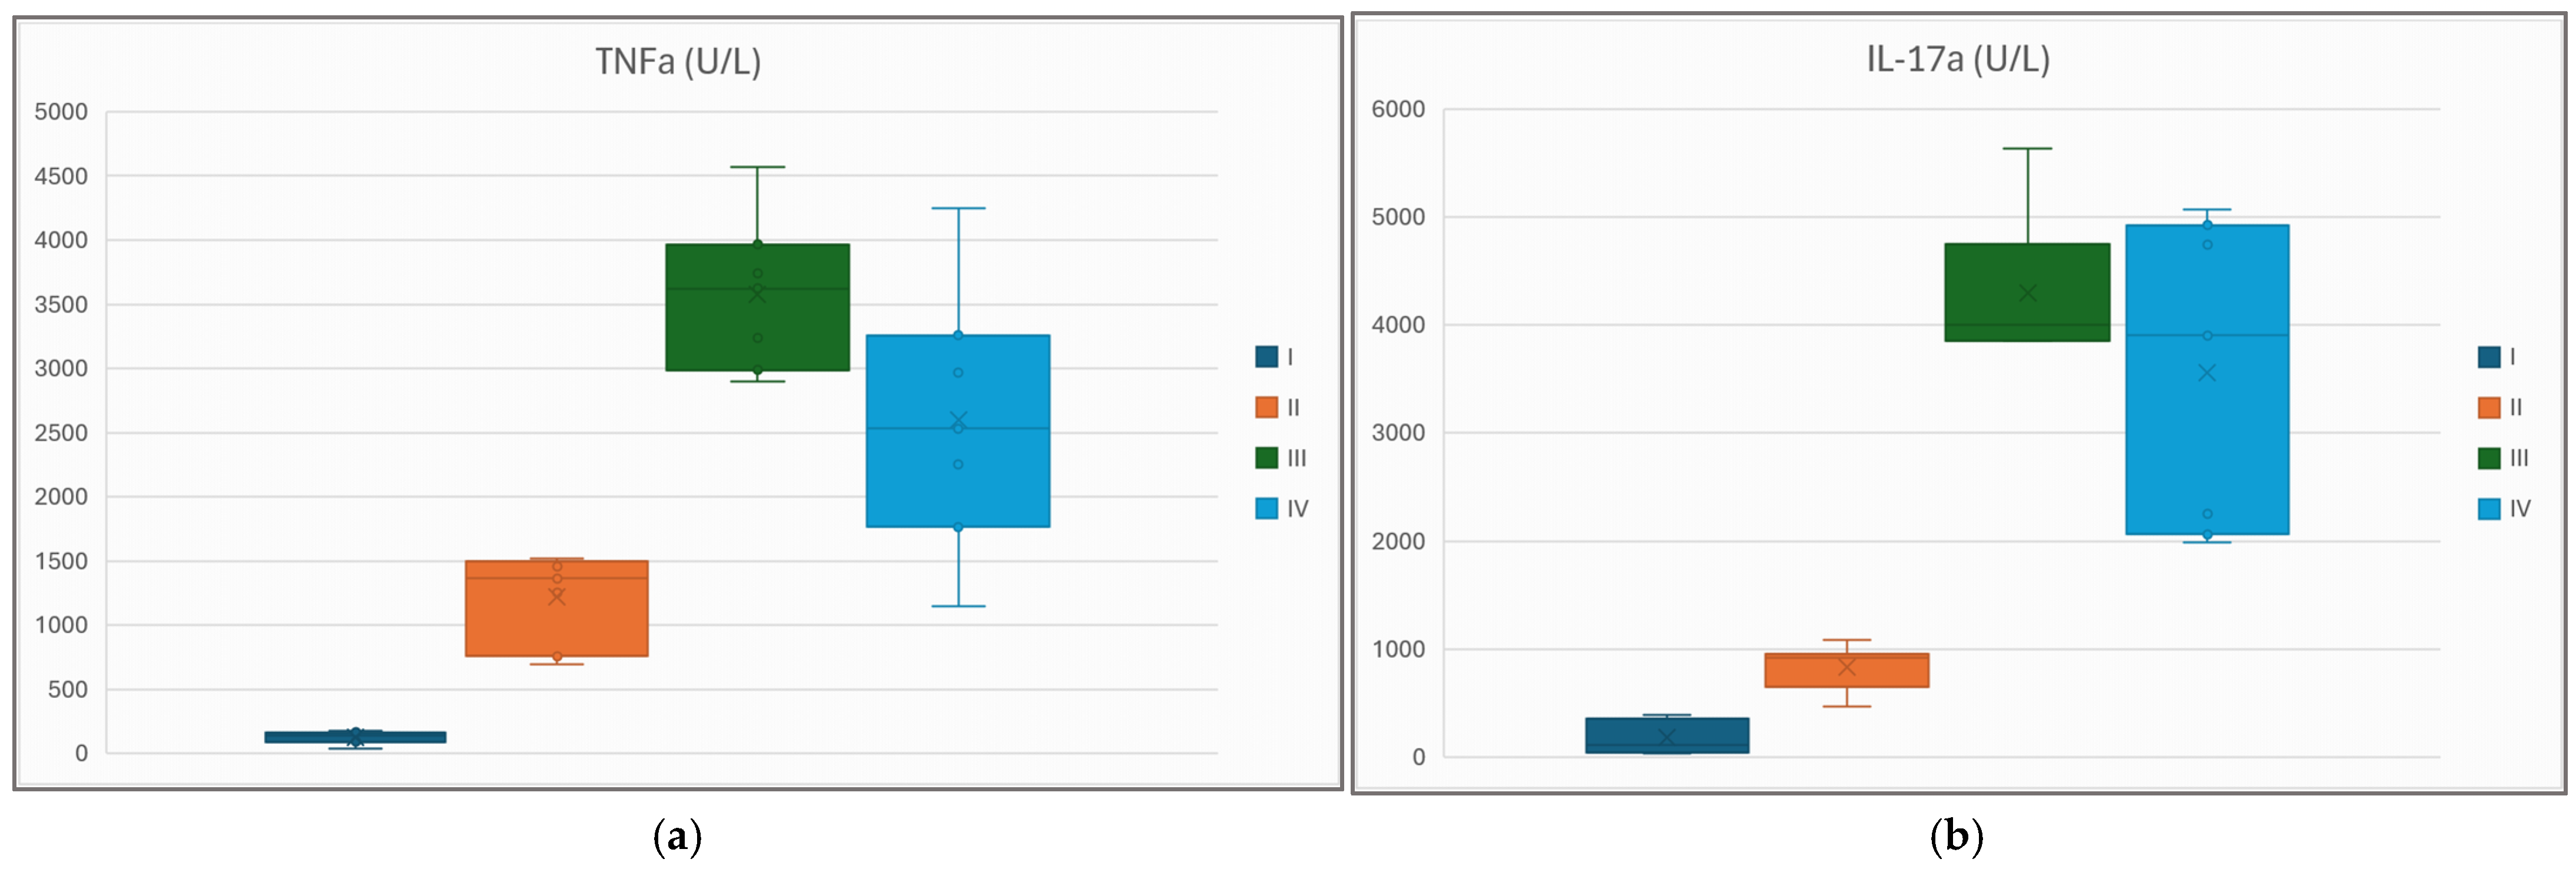
| IL-17α (U/L) | 180 (139) | 830 (192) * | 4002 (3856, 4752) ** | 3903 (2064, 4925) ** | |
| TNFα (U/L) | 129 (43) | 1222 (324) * | 3574 (545) * | 2596 (942) * |
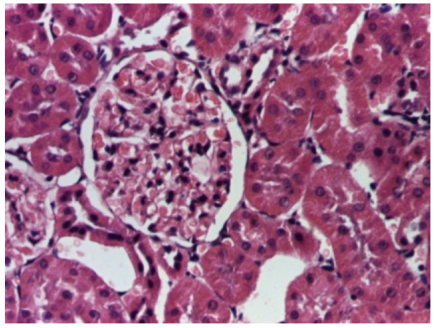 | 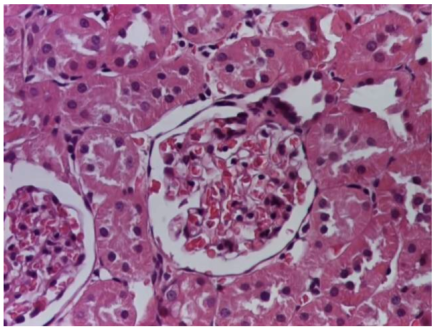 |
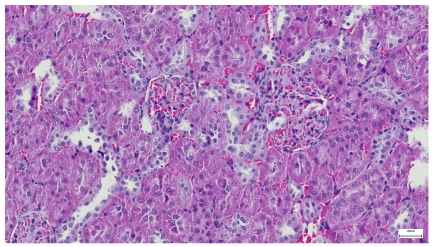
| 4.1. Hematoxylin and Eosin stain, 200× magnification. Normal aspect of the glomerulus, afferent arteriole, efferent arteriole, and normal renal tubules. Control group specimens. | 4.2. Hematoxylin and Eosin stain, 200× magnification. Normal aspect of the juxtaglomerular apparatus. Control group specimens. |
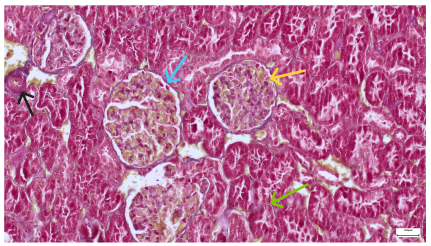 |  |
| 4.3. Trichrome Masson stain, 100× magnification, 200 microns scale segment. Arteriole thickening (black), glomerular basal membrane thickening (blue), mesangial cell expansion (yellow), proximal renal tubule basal membrane thickening (green). Group II obese High-Fat-Diet-fed specimens. | 4.4. Hematoxylin and Eosin stain, 200× magnification, 100 microns scale segment. Glomerular congestion and mesangial cell expansion. Group II obese High-Fat-Diet-fed specimens. |
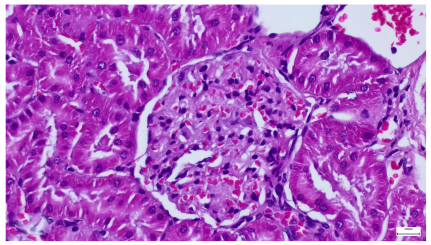
 | 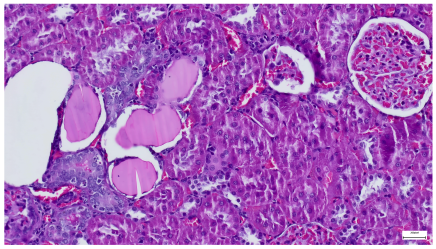 |
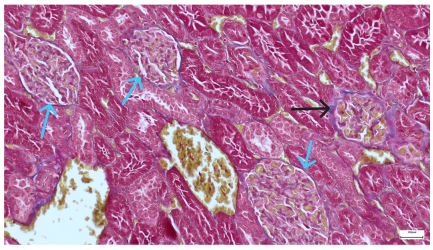
| 4.5. Trichrome Masson stain, 100× magnification, 200 microns scale segment. Arteriole wall thickening (green), unequal glomerular size and basal membrane thickening (blue), extensive proximal renal tubule basal membrane thickening (black), pronounced fibrosis in renal parenchyma (yellow). Group III diabetic and normal-diet-fed specimens. | 4.6. Hematoxylin and Eosin stain, 100× magnification, 200 microns scale segment. Glomerular congestion, hyaline material present inside the lumen of renal tubules, flattened tubular walls. Group III diabetic and normal-diet-fed specimens. |
 | 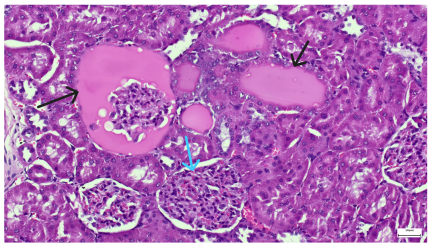 |
| 4.7. Trichrome Masson stain, magnification 100×, scale 200 microns. Renal corpuscle with relatively increased thickness of the glomerular basal membrane (black), renal corpuscular congestion, mesangial expansion, unequal glomerular dimensions (blue). Group IV diabetic-and-obese specimens. | 4.8. Hematoxylin and Eosin stain, 100× magnification, scale 200 microns. Tubule “thyroidisation” (black) denoting the presence of eosinophilic material inside tubular lumen, the flattening of tubular wall cells as a consequence of glomerular partial or total sclerosis, significant hypercellular matrix environment in glomerulus (blue). Group IV diabetic-and-obese specimens. |
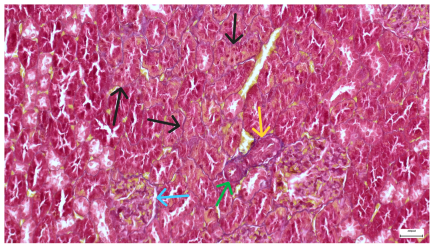
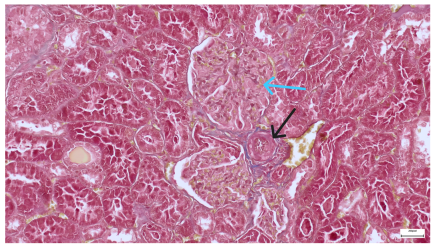 |  |
| 4.9. Trichrome Masson stain, magnification 100×, scale 200 microns. Arterial wall thickening is regarded as hyalinization (black), corpuscular congestion and start of segmental sclerosing (blue). Group IV diabetic-and-obese specimens. | 4.10. Hematoxylin and Eosin stain, 100× magnification, scale 200 microns. Mesangial cell expansion and irregular glomerular dimensions. Group IV diabetic-and-obese specimens. |
| Predictor Variable | Coefficient Employed | IL-1β | IL-6 | IL-17α | TNFα |
|---|---|---|---|---|---|
| Urea | Kendall τ | 0.219 | 0.481 | 0.654 | 0.649 |
| Pearson r | −0.431 | 0.157 | 0.628 | 0.644 | |
| Creatinine | Kendall τ | 0.271 | 0.436 | 0.667 | 0.689 |
| Pearson r | −0.426 | 0.056 | 0.627 | 0.649 |
Disclaimer/Publisher’s Note: The statements, opinions and data contained in all publications are solely those of the individual author(s) and contributor(s) and not of MDPI and/or the editor(s). MDPI and/or the editor(s) disclaim responsibility for any injury to people or property resulting from any ideas, methods, instructions or products referred to in the content. |
© 2025 by the authors. Licensee MDPI, Basel, Switzerland. This article is an open access article distributed under the terms and conditions of the Creative Commons Attribution (CC BY) license (https://creativecommons.org/licenses/by/4.0/).
Share and Cite
Maranduca, M.A.; Clim, A.; Tanase, D.M.; Cozma, C.T.; Floria, M.; Clim, I.A.; Serban, D.N.; Serban, I.L. Atorvastatin Confers Renoprotection and Modulates Inflammation in Diabetic Rats on a High-Fat Diet. Life 2025, 15, 1184. https://doi.org/10.3390/life15081184
Maranduca MA, Clim A, Tanase DM, Cozma CT, Floria M, Clim IA, Serban DN, Serban IL. Atorvastatin Confers Renoprotection and Modulates Inflammation in Diabetic Rats on a High-Fat Diet. Life. 2025; 15(8):1184. https://doi.org/10.3390/life15081184
Chicago/Turabian StyleMaranduca, Minela Aida, Andreea Clim, Daniela Maria Tanase, Cristian Tudor Cozma, Mariana Floria, Ioana Adelina Clim, Dragomir Nicolae Serban, and Ionela Lacramioara Serban. 2025. "Atorvastatin Confers Renoprotection and Modulates Inflammation in Diabetic Rats on a High-Fat Diet" Life 15, no. 8: 1184. https://doi.org/10.3390/life15081184
APA StyleMaranduca, M. A., Clim, A., Tanase, D. M., Cozma, C. T., Floria, M., Clim, I. A., Serban, D. N., & Serban, I. L. (2025). Atorvastatin Confers Renoprotection and Modulates Inflammation in Diabetic Rats on a High-Fat Diet. Life, 15(8), 1184. https://doi.org/10.3390/life15081184