Abstract
Purpose: Standard automated perimetry (SAP) remains the gold standard functional test in glaucoma, used primarily for evaluating peripheral vision loss. Central contrast sensitivity (CCS) has emerged as a potential early functional marker of glaucomatous damage. This systematic review aimed to describe the different methods used to measure CCS in randomized controlled trials (RCT) involving glaucoma patients. Methods: We searched the MEDLINE, Embase, CINAHL, Cochrane Central Register of Controlled Trials, Epistemonikos, and ClinicalTrials.gov databases on 25 January 2023, and updated the search on 12 February 2025. Eligible studies comprised RCTs that reported CCS as an outcome in patients with glaucoma, suspected glaucoma, or ocular hypertension. No restrictions were placed on age, sex, ethnicity, geography, intervention, or publication year. Abstracts and full texts were screened independently by two reviewers. Descriptive statistics were used. No formal risk of bias assessment was performed, due to the descriptive nature of the review. Results: Of 1066 records screened, 31 studies met the eligibility criteria. The study sample size ranged from 7 to 207 (median: 23), with most studies involving primary open-angle glaucoma. Interventions were diverse, mainly involving topical medications, with timolol being the most frequent. Eleven CCS test methods were identified. Five studies did not report the method used. The CSV-1000 was the most commonly used test, being applied in 11 studies. Conclusions: CCS has been measured using a wide range of methods in glaucoma RCTs, with limited standardization. Most of the included studies were small, variably reported, and conducted over 10 years ago, suggesting a decreasing interest in CCS as an outcome measure in glaucoma RCTs. Funding: This review was funded by Oslo University Hospital and the Research Council of Norway. Registration: This review was registered on the OSF.
1. Introduction
Glaucoma is an irreversible, chronic, progressive neuropathy of the optic nerve. If left untreated, it will lead to atrophy of the optic nerve, due to the death of retinal ganglion cells (RGCs) and their axons, ultimately resulting in reduced visual function and, eventually, blindness [1,2]. Glaucoma is traditionally considered a peripheral disease, often sparing the central vision until its later stages. However, this is not entirely accurate, as many cases of glaucoma present with defects within the central 10 degrees of vision [3,4]. To date, standard automated perimetry (SAP) is the gold standard functional exam for diagnosing and evaluating glaucoma progression. In the early stages of the disease, only the loss of RGCs and their axons can be detected, a stage referred to as pre-perimetric glaucoma [5,6,7]. A substantial loss of RGCs is needed before statistically significant visual field abnormalities can be seen [8,9,10], making early diagnosis challenging. Given that early intervention is critical in preventing visual impairment, improved diagnostic methods are needed.
Visual acuity (VA) is routinely performed in the evaluation of glaucoma patients but provides no useful information about the stage or progression of the disease. Despite maintaining good, best-corrected visual acuity (BCVA), many patients report decreased quality of vision. Studies suggest that central contrast sensitivity (CCS) and visual field loss correlate more strongly with self-reported visual function than VA [11,12].
CCS declines with age and is affected by various ophthalmic conditions and diseases [13]. This is also true for the early stages of glaucoma, where CCS has been widely used as an outcome measure in clinical trials [14,15,16,17,18]. However, contrast perception is a complex process influenced by multiple factors, including luminance conditions, target size, shape, orientation, color profile, and the distribution of spatial frequencies. CS is assessed both spatially and temporally. Spatial CS refers to the ability to discern differences in light and dark areas in static images, while temporal CS involves detecting changes over time, such as a flickering light. Numerous methods exist for assessing CCS, ranging from chart-based tests to computerized solutions, using a variety of stimuli, including optotypes, symbols, and black-and-white gratings [19]. Optotypes, while simple to use, are complex two-dimensional images that inherently contain a range of spatial frequencies and are, therefore, unsuitable for investigating specific spatial frequencies. Other tests standardize targets using black-and-white gratings with predefined spatial frequencies, measured in cycles per degree (cpd). Lower spatial frequencies correspond to wider stripes, while higher spatial frequencies correspond to narrower stripes. Humans typically have peak sensitivity to contrast at medium spatial frequencies (around 3–6 cpd) and decreased sensitivity at very low and very high frequencies [20].
To our knowledge, no systematic review has yet been conducted describing the use of CCS in randomized controlled trials (RCT) in glaucoma. It is important to summarize the existing evidence to inform the use of these tests in future research and clinical practice. In this context, we investigated whether they are used as primary or secondary outcomes, the types of tests used, data formats, and other study characteristics.
2. Methods
We registered the protocol of our systematic review in the Open Science Framework (osf.io) before data collection. The systematic review was assigned a registration DOI of https://doi.org/10.17605/OSF.IO/BWKQR.
2.1. Search Strategy
A systematic search was conducted on 25 January 2023, by a senior librarian at the Library of Medicine and Science at the University of Oslo, of the following scientific databases: MEDLINE (Ovid), Embase (Ovid), Cochrane Reviews and the Central Register of Controlled Trials, CINAHL (EbscoHost), Epistemonikos, Scopus, and ClinicalTrials.gov. The complete documentation of the literature search can be found in the Supplementary Materials.
An updated literature search was conducted on 12 February 2025, focusing on the three most relevant and comprehensive databases (MEDLINE, Scopus, and Epistemonikos). This targeted update approach was chosen to optimize time and resources while minimizing the risk of missing new relevant records. Although other databases were not re-searched during the update, we recognize this as a potential limitation. The same inclusion and exclusion criteria were applied. This update identified 79 additional records after duplicates were removed, of which 2 met the inclusion criteria and were incorporated into the final analysis. Both searches are summarized in the PRISMA diagram (Figure 1).
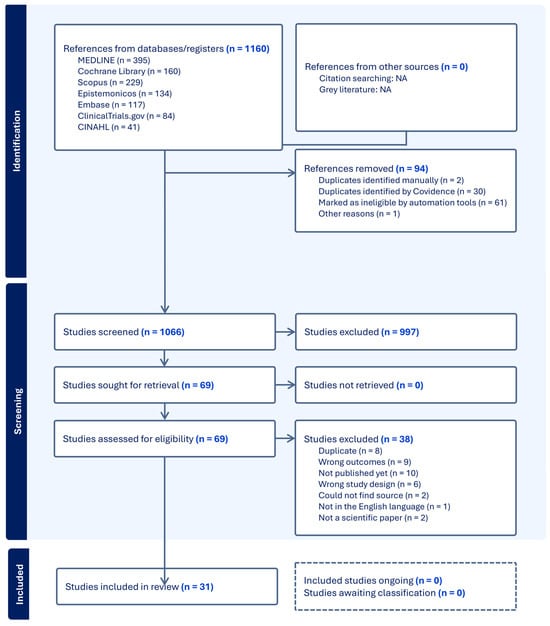
Figure 1.
PRISMA flow diagram of the included and excluded studies.
2.2. Inclusion and Exclusion Criteria
We included glaucoma RCTs that used CCS as an outcome measure, with either temporal or spatial contrast sensitivity (CS). We included only publications in English but put no restrictions on the date, type of glaucoma (including suspected glaucoma and ocular hypertension), and severity. There were no limitations on age, sex, ethnicity, or geographical location. Any type of intervention and comparator was included. Duplicates, unpublished articles, and non-scientific papers were also excluded.
Abstracts were included only when they clearly described an RCT involving glaucoma patients and reported contrast sensitivity as an outcome. Given the limited number of eligible full-text studies, this approach allowed us to broaden the descriptive scope of CCS measurement methods. However, we acknowledge that abstracts provide less methodological detail, and this represents a limitation of our review.
2.3. Data Extraction and Quality Assessment
Two reviewers performed independent title and abstract screening processes, full-text reviews, and data extraction of the included studies. In the case of any uncertainty or disagreements, a third reviewer was consulted to reach a consensus. The review management software “Covidence” was used to organize the screening and extraction processes.
Data were retrieved from different sources, such as tables and text, and for studies only reporting their results with graphs, the data were visually assessed individually by each reviewer using either Autodesk Fusion 360 or Microsoft PowerPoint. Only descriptive statistics were used to summarize the data.
We extracted the following information from each study: the number of participants, intervention(s), type and description of the CCS test used, outcome format (e.g., log contrast, SPARCS score, and area under the contrast sensitivity curve), and follow-up duration. We recorded whether CCS was reported as a primary or secondary outcome, to assess how central it was to each study’s design. This distinction provides context on whether CCS was likely pre-specified and prioritized during planning or if it was included more exploratorily. CCS was considered to be a primary outcome when stated as such in the paper or if “contrast sensitivity” was mentioned in the title. In cases where relevant data were missing or unclear, we attempted to contact the corresponding authors for clarification. If no response was received or if the information could not be obtained, the item was recorded as “not reported” (NR).
Because this was a descriptive systematic review without statistical synthesis, we did not conduct a formal quality or risk of bias assessment. Our focus was on cataloguing the diversity of methods and outcome reporting, rather than comparing effect sizes or drawing pooled conclusions.
3. Results
3.1. Characteristics of the Included Studies
The PRISMA flow diagram of the included and excluded studies, along with their characteristics, is shown in Figure 1. The literature search resulted in a total of 1066 studies after the removal of duplicates and ineligible studies using the automation tool in Covidence. Of these studies, 997 were excluded after title and abstract screening. Full-text screening was performed on the remaining 69 studies, from which a further 38 articles were excluded. Reasons for their exclusion can be seen in the PRISMA flowchart (Figure 1). Therefore, a total of 22 published full-text papers and 9 abstracts were included in this review. These 31 articles and abstracts were published between 1990 and 2024. One of the records (Casson 2014 [21]) included a follow-up study, making the total number of studies 32. A summary of the 32 included studies can be seen in Table 1.

Table 1.
Summary RCTs evaluating CS outcomes in patients with glaucoma. For crossover studies, both the total follow-up duration and individual treatment arm durations (including washout if applicable) are reported.
3.2. Reporting of CCS as a Primary or Secondary Outcome
Among the 32 studies (31 records) included, 8 specified CCS as a primary outcome, while only 1 study reported it as a secondary outcome (Table 1). The status of CCS as an outcome remained unspecified in the other 22 studies.
3.3. Follow-Up Time
Most of the included studies focused on the short-term effects on CCS. The most common follow-up time was one month (n = 14). Only 11 out of 32 studies had a follow-up time greater than one month (Table 1). Several studies used a crossover design, where follow-up duration can be interpreted in two ways: either as the total study duration or as the duration of each individual treatment period. In this review, we have chosen to report the duration of each treatment arm in the crossover studies, as this reflects the total exposure time for each intervention.
3.4. Types of Contrast Sensitivity Tests Used
To assess changes in CCS, the studies included a variety of different tests for CCS (Table 1). The most commonly used test to assess CCS was the CSV-1000 (n = 11). This test utilizes sine wave gratings of four different cpd of 3, 6, 12, and 18, arranged in rows. Each row has eight contrast levels, decreasing from left to right. The test presents a sample patch and eight pairs of gratings, together with a blank patch. The patient is asked to identify the patch with the gratings. The CCS is measured in both linear and log units.
Three studies used the Functional Acuity Contrast Test (FACT) chart. FACT utilizes 5 different cpd: 1.5, 3, 6, 12, and 18. In the same way as the CSV-1000, the gratings are presented in patches that decrease in contrast from left to right. FACT differs from the CVS-1000 by also tilting the patches 15° to either the left or right. The change in CCS is also measured in log units.
Despite being a well-known test for CCS, the Pelli–Robson chart was used in only three of the reviewed studies. In contrast to the other tests listed, the Pelli–Robson charts utilize Sloan letters instead of gratings. The letters are of equal size and have varying contrast levels. There are eight rows of letters, each consisting of two triplets. The change in contrast from one triplet to another is 0.15 log units, starting from the upper left, with 100% contrast (Weber contrast), to the lower right, with 0.56% contrast. The cpd of the Pelli–Robson chart depends on the test distance and how one measures the cpd, but it is, nevertheless, in the lower range and has been reported to be 1 [52] and 1.3 [53]) at 1 m.
Besides the three above-mentioned tests for CCS, the reviewed articles used a variety of different tests. These are summarized in Table 2, which provides a brief description of each test and its key characteristics.
Table 2.
Short description of each of the CCS tests obtained from the included literature.
3.5. Format of Data Outcome
Of the 31 studies, 16 used the logarithm of contrast sensitivity (log con); 12 studies did not provide any information about the data format, while 2 studies reported an area under the contrast sensitivity function (CSF) curve, 1 of which also showed the CSF curve with CS values. The authors of the final study reported their results as SPARCS scores.
3.6. Study Participants
Most of the included studies had a sample size below 50 (n = 24). The remaining eight studies had sample sizes ranging from 54 to 207 (Table 1).
3.7. Type of Glaucoma
The majority of the included studies investigated the effects of treatment on CCS in individuals with primary open-angle glaucoma (POAG) (n = 16). Other glaucoma subgroups investigated were normal tension glaucoma (n = 5), ocular hypertension (n = 2), and newly diagnosed POAG (n = 2). Open-angle glaucoma and primary angle-closure glaucoma were investigated in one study each, whereas another study included both types of glaucoma. The remaining three studies did not describe the type of glaucoma included.
3.8. Interventions
Several interventions were used in the included studies, with the most common treatments being eye drops of timolol (n = 10), latanoprost (n = 6), brimonidine (n = 6), and dorzolamide (n = 5). A wide selection of interventions was investigated using CCS, and the full list of interventions can be seen in Table 1. This included recognized glaucoma medications as well as treatments that are not normally associated with the treatment of glaucoma.
3.9. Types of RCTs Included
The reviewed articles showed a somewhat even distribution of placebo-controlled studies (n = 14) compared to studies investigating a comparative effect between two interventions (n = 18). The RCT design of the included studies was crossover (n = 15), parallel-group (n = 15), and split-body (n = 2) studies. The number and degree of blinding conducted were double (n = 19), single (n = 7), and none (n = 6).
4. Discussion
Our literature search identified eight studies that cited CCS as a primary outcome, with many not specifying its priority. The most common follow-up time was 1 month, but they varied between 15 min and 24 months. The sample size of the studies ranged from 7 to 207, averaging 37.5 participants. While POAG was the predominant glaucoma subtype examined, other subtypes were also considered. Common interventions included timolol, latanoprost, brimonidine, and dorzolamide eye drops, among a total of 23 different interventions being assessed for their impact on CCS. Across the 32 studies, 11 distinct CCS test methods were used, with the CSV-1000 and FACT emerging as the most frequently employed techniques.
While CCS testing has significant potential in detecting central visual impairment [13], its role in diagnosing and monitoring glaucoma remains uncertain. The findings suggest a decreasing interest in evaluating CCS in RCTs involving patients with glaucoma. This may, in part, be due to a lack of standardized methodologies, making comparisons across studies challenging. Unlike VA testing using the Snellen chart or visual field testing with SAP, CCS lacks a widely accepted gold-standard functional exam, limiting its adoption in clinical and research settings. Furthermore, most studies had short follow-up periods, which may fail to capture how different CCS measurement methods track changes over time or reflect the long-term effects of various interventions.
Our review highlighted substantial variability in CCS testing methods, with no universally accepted standard for assessment. The CSV-1000 and FACT charts were the most widely used tests, reflecting a preference for instruments that measure CCS across multiple spatial frequencies, offering a more detailed profile of visual function. Despite its widespread recognition and ease of use, the Pelli–Robson chart was used in only three studies. This may reflect its limitation in terms of sampling only low spatial frequencies and its complex two-dimensional design, which also includes a broad distribution of spatial orientations. Additionally, some tests were poorly described or omitted entirely, further complicating study comparisons. Temporal CS, which measures the ability to detect flickering stimuli, is notably underrepresented in the included literature. Although a few studies included methods that are sensitive to temporal modulations, most trials did not assess this dimension. This is a notable gap, given that temporal CS may be more strongly affected in glaucoma due to the early involvement of the magnocellular pathway [17]. This indicates the need for more comprehensive, standardized testing protocols that can account for both the spatial and temporal dimensions of contrast sensitivity in future RCTs involving patients with glaucoma.
The predominance of short-term follow-up periods in most of the studies, with only 11 out of 32 having follow-up periods exceeding one month, may further contribute to the uncertainty surrounding the role of CCS in glaucoma research. Given the progressive nature of glaucoma, longer follow-up periods are essential for understanding the potential role of CCS in monitoring disease progression and treatment efficacy. Additionally, only one study included a healthy control group, making it difficult to differentiate disease-related changes in CCS from normal variations in the general population. Shorter follow-up times may increase the impact of the learning effect, skewing the data in favor of a positive outcome. An important measure to minimize the learning effect is to implement training before collecting data for analysis. Out of the 32 studies, only 6 explicitly reported training to minimize the learning effect. Another study by Bose (1992) [25] used different charts instead of training to minimize the learning effect.
Only nine studies explicitly stated whether CCS was a primary or secondary outcome. Although we did not examine the study protocols, this shows a lack of adherence to reporting guidelines such as the SPIRIT and CONSORT checklists [62]. Clear and transparent outcome reporting is essential for the proper interpretation of findings, avoiding post hoc changes such as outcome switching.
Moreover, CCS may be affected by other ocular conditions, such as cataracts, which are common in the glaucoma population. Klein et al. (2015) [17] demonstrated that cataracts significantly decrease CCS and may interfere with early glaucoma detection when spatial and temporal CS tests are used. Their findings highlight the necessity of controlling for cataracts in CCS studies. Only one of the included studies (Bose et al. 1992 [25]) tried to control for this variable.
Our study has several limitations. First, while we aimed to include only RCTs, this approach excluded those insights from observational and cross-sectional studies, which could have provided additional context on CCS assessment in glaucoma. Second, although we assessed whether CCS was reported as a primary or secondary outcome, we did not review the study protocols to determine whether these outcomes were pre-specified, thereby limiting our ability to evaluate potential selective reporting bias. Third, this review only included published studies, potentially contributing to publication bias, as studies with negative or inconclusive findings are less likely to be published. Lastly, due to the descriptive nature of this review, we did not perform a formal quality or risk of bias assessment.
To further clarify the role of CCS in evaluating glaucoma patients, future research should aim to establish standardized protocols for CCS assessment. This requires longer follow-up periods, the use of healthy control groups, and comparative studies evaluating different CCS measurement methodologies. Additionally, controlling for cataracts is essential, as their impact on CCS may confound any findings related to early glaucomatous changes. Although our review did not include a meta-analysis comparing CCS with other glaucoma metrics, such an analysis could yield valuable insights into its diagnostic and prognostic utility. A quantitative synthesis of CCS relative to other functional and structural measures may help define its role in glaucoma management and assess its potential as an early marker of disease progression.
5. Conclusions
Our findings expose the diverse methodologies employed in CCS measurement, revealing a lack of standardization across clinical trials. This variability hinders the direct comparability of outcomes, thereby impeding the consolidation of data into further insights. Notably, the CSV-1000 and FACT charts emerge as prevalent tools, suggesting a preference for more detailed testing protocols. The relatively few studies included in this systematic review, especially those from the last decade, suggest a declining interest in evaluating CCS in RCTs involving patients with glaucoma. Furthermore, this systematic review highlights the necessity for future research to incorporate control groups and longer follow-up periods to better understand how different CCS measurement methods track changes over time.
Supplementary Materials
The following supporting information can be downloaded at: https://www.mdpi.com/article/10.3390/life15071043/s1, Documentation of literature search.
Author Contributions
Conceptualization, O.K., G.P. and M.K.; methodology, A.S., J.R.M., and J.F.; investigation, A.S. and J.R.M.; data curation, A.S. and J.R.M.; writing—original draft preparation, A.S. and J.R.M.; writing—review and editing, A.S., J.R.M., G.V., A.A.-B., J.F., S.A., O.K., G.P., and M.K. All authors have read and agreed to the published version of the manuscript.
Funding
This research was supported by institutional funds from Oslo University Hospital and The Research Council of Norway (Project No.: 333925 on “Validation of eye-tracking tests in screening, diagnostics and treatment monitoring in two major, central ophthalmic disorders”), and Copenhagen University Hospital.
Conflicts of Interest
The authors declare no conflicts of interest.
References
- Tann, A. 2020–2021 Basic and Clinical Science Course(tm) (BCSC), Section 10: Glaucoma; Chandrasekharan Krishnan, M.V.B., Giaconi, J.A., Tanna, A., Lin, S.C., Medeiros, F.A., Moroi, S.E., Sit, A.J., American Academy of Ophthalmology, Eds.; American Academy of Ophthalmology: San Francisco, CA, USA, 2020; pp. 59–89. [Google Scholar]
- Almasieh, M.; Wilson, A.M.; Morquette, B.; Cueva Vargas, J.L.; Di Polo, A. The molecular basis of retinal ganglion cell death in glaucoma. Prog. Retin. Eye Res. 2012, 31, 152–181. [Google Scholar] [CrossRef] [PubMed]
- Germano, R.A.S.; Germano, C.S.; Susanna, F.N.; Susanna, R. Patterns of Visual Field Loss in Early, Moderate, and Severe Stages of Open Angle Glaucoma. J. Glaucoma 2022, 31, 609–613. [Google Scholar] [CrossRef]
- Traynis, I.; De Moraes, C.G.; Raza, A.S.; Liebmann, J.M.; Ritch, R.; Hood, D.C. Prevalence and nature of early glaucomatous defects in the central 10° of the visual field. JAMA Ophthalmol. 2014, 132, 291–297. [Google Scholar] [CrossRef] [PubMed]
- Quigley, H.A. Glaucoma. Lancet 2011, 377, 1367–1377. [Google Scholar] [CrossRef]
- Casson, R.J.; Chidlow, G.; Wood, J.P.; Crowston, J.G.; Goldberg, I. Definition of glaucoma: Clinical and experimental concepts. Clin. Exp. Ophthalmol. 2012, 40, 341–349. [Google Scholar] [CrossRef]
- Wollstein, G.; Kagemann, L.; Bilonick, R.A.; Ishikawa, H.; Folio, L.S.; Gabriele, M.L.; Ungar, A.K.; Duker, J.S.; Fujimoto, J.G.; Schuman, J.S.; et al. Retinal nerve fibre layer and visual function loss in glaucoma: The tipping point. Br. J. Ophthalmol. 2012, 96, 47–52. [Google Scholar] [CrossRef] [PubMed]
- Harwerth, R.S.; Quigley, H.A. Visual field defects and retinal ganglion cell losses in patients with glaucoma. Arch. Ophthalmol. 2006, 124, 853–859. [Google Scholar] [CrossRef]
- Harwerth, R.S.; Carter-Dawson, L.; Shen, F.; Smith, E.L., 3rd; Crawford, M.L. Ganglion cell losses underlying visual field defects from experimental glaucoma. Investig. Ophthalmol. Vis. Sci. 1999, 40, 2242–2250. [Google Scholar]
- Kerrigan-Baumrind, L.A.; Quigley, H.A.; Pease, M.E.; Kerrigan, D.F.; Mitchell, R.S. Number of ganglion cells in glaucoma eyes compared with threshold visual field tests in the same persons. Investig. Ophthalmol. Vis. Sci. 2000, 41, 741–748. [Google Scholar]
- Jampel, H.D.; Schwartz, A.; Pollack, I.; Abrams, D.; Weiss, H.; Miller, R. Glaucoma patients’ assessment of their visual function and quality of life. J. Glaucoma 2002, 11, 154–163. [Google Scholar] [CrossRef]
- Dhawan, M.; Hans, T.; Sandhu, P.S.; Midha, N. Evaluation of vision-related quality of life in patients with glaucoma: A hospital-based study. J. Curr. Glaucoma Pract. 2019, 13, 9–15. [Google Scholar] [PubMed]
- Flaharty, K.; Niziol, L.M.; Woodward, M.A.; Elam, A.; Bicket, A.; Killeen, O.J.; Zhang, J.; Johnson, L.; Kershaw, M.; John, D.A.; et al. Association of Contrast Sensitivity With Eye Disease and Vision-Related Quality of Life. Am. J. Ophthalmol. 2024, 261, 176–186. [Google Scholar] [CrossRef]
- Stamper, R.L. The effect of glaucoma on central visual function. Trans. Am. Ophthalmol. Soc. 1984, 82, 792–826. [Google Scholar]
- Ichhpujani, P.; Thakur, S.; Spaeth, G.L. Contrast Sensitivity and Glaucoma. J. Glaucoma 2020, 29, 71–75. [Google Scholar] [CrossRef] [PubMed]
- Richman, J.; Lorenzana, L.L.; Lankaranian, D.; Dugar, J.; Mayer, J.; Wizov, S.S.; Spaeth, G.L. Importance of visual acuity and contrast sensitivity in patients with glaucoma. Arch. Ophthalmol. 2010, 128, 1576–1582. [Google Scholar] [CrossRef] [PubMed]
- Klein, J.; Pierscionek, B.K.; Lauritzen, J.; Derntl, K.; Grzybowski, A.; Zlatkova, M.B. The Effect of Cataract on Early Stage Glaucoma Detection Using Spatial and Temporal Contrast Sensitivity Tests. PLoS ONE 2015, 10, e0128681. [Google Scholar] [CrossRef]
- Velten, I.M.; Korth, M.; Horn, F.K.; Budde, W.M. Temporal contrast sensitivity with peripheral and central stimulation in glaucoma diagnosis. Br. J. Ophthalmol. 1999, 83, 199–205. [Google Scholar] [CrossRef]
- Kaur, K.; Gurnani, B. Contrast Sensitivity. In StatPearls; StatPearls Publishing LLC.: Treasure Island, FL, USA, 2025. [Google Scholar]
- Richman, J.; Spaeth, G.L.; Wirostko, B. Contrast sensitivity basics and a critique of currently available tests. J. Cataract. Refract. Surg. 2013, 39, 1100–1106. [Google Scholar] [CrossRef]
- Casson, R.J.; Han, G.; Ebneter, A.; Chidlow, G.; Glihotra, J.; Newland, H.; Wood, J.P.M. Glucose-induced temporary visual recovery in primary open-angle glaucoma: A double-blind, randomized study. Ophthalmology 2014, 121, 1203–1211. [Google Scholar] [CrossRef]
- Muermans, M.; Faubert, J.; Overbury, O.; Balazsi, A.G. The Acute Effects of Timolol Maleate on Temporal Modulation Fields and Spatial Contrast Sensitivity; American Academy of Optometry: Orlando, FL, USA, 1990; p. 121. [Google Scholar]
- Balazsi, A.G.; Saheb, N.E.; Kasner, O.P.; Overbury, O.; Faubert, J. The effects of timolol maleate on static visual fields, temporal modulation fields, and spatial contrast sensitivity in early glaucoma. IOVS 1991, 32, 1107. [Google Scholar]
- Bonomi, L.; Marchini, G.; Marraffa, M.; De Franco, I.; Perfetti, S.; Ferri, E. Effects of the association of alpha and beta-blocking agents in glaucoma. J. Ocul. Pharmacol. 1992, 8, 279–283. [Google Scholar] [CrossRef]
- Bose, S.; Piltz, J.R.; Breton, M.E. Effect of Nimodipine, a Centrally Active Calcium Channel Blocker, on Spatial Contrast Sensitivity in Normal Tension Glaucoma; American Academy of Optometry: Orlando, FL, USA, 1992; p. 132. [Google Scholar]
- Drance, S.M. A comparison of the effects of betaxolol, timolol, and pilocarpine on visual function in patients with open-angle glaucoma. J. Glaucoma 1998, 7, 247–252. [Google Scholar] [CrossRef]
- Evans, D.W.; Harris, A.; Cantor, L.B. Primary open-angle glaucoma patients characterized by ocular vasospasm demonstrate a different ocular vascular response to timolol versus betaxolol. J. Ocul. Pharmacol. Ther. 1999, 15, 479–487. [Google Scholar] [CrossRef]
- Harris, A.; Arend, O.; Kagemann, L.; Garrett, M.; Chung, H.S.; Martin, B. Dorzolamide, visual function and ocular hemodynamics in normal-tension glaucoma. J. Ocul. Pharmacol. Ther. 1999, 15, 189–197. [Google Scholar] [CrossRef]
- Caramazza, N.; Damele, M.; Parente, G.; Alessandrini, A.; Cellini, M. Use of polyunsatured fatty acids in the treatment of glaucomatous optic neuropathy (GON). Ann. Di Ottalmol. E Clinica Oculistica 1999, 125, 329–338. [Google Scholar]
- Garzozi, H.; Harris, A.; Kagemann, L.; Jonescu-Cuypers, C.P.; Rotenstreich, Y.; Siesky, B.; Cantor, L.B.; McCranor, L.; McNulty, L. Comparison of dorzolamide and latanoprost in normal-tension glaucoma: Effects on IOP and retinal hemodynamics. IOVS 2001, 42, 1051–1057. [Google Scholar]
- Sponsel, W.E.; Paris, G.; Trigo, Y.; Pena, M. Comparative effects of latanoprost (Xalatan) and unoprostone (Rescula) in patients with open-angle glaucoma and suspected glaucoma. Am. J. Ophthalmol. 2002, 134, 552–559. [Google Scholar] [CrossRef]
- Sponsel, W.E.; Paris, G.; Trigo, Y.; Pena, M.; Weber, A.; Sanford, K.; McKinnon, S. Latanoprost and brimonidine: Therapeutic and physiologic assessment before and after oral nonsteroidal anti-inflammatory therapy. Am. J. Ophthalmol. 2002, 133, 11–18. [Google Scholar] [CrossRef]
- Arend, O.; Harris, A.; Wolter, P.; Remky, A. Evaluation of retinal haemodynamics and retinal function after application of dorzolamide, timolol and latanoprost in newly diagnosed open-angle glaucoma patients. Acta Ophthalmol. Scand. 2003, 81, 474–479. [Google Scholar] [CrossRef]
- Evans, D.W.; Hosking, S.L.; Gherghel, D.; Bartlett, J.D. Contrast sensitivity improves after brimonidine therapy in primary open angle glaucoma: A case for neuroprotection. Br. J. Ophthalmol. 2003, 87, 1463–1465. [Google Scholar] [CrossRef]
- Harris, A.; Migliardi, R.; Rechtman, E.; Cole, C.N.; Yee, A.B.; Garzozi, H.J. Comparative analysis of the effects of dorzolamide and latanoprost on ocular hemodynamics in normal tension glaucoma patients. Eur. J. Ophthalmol. 2003, 13, 24–31. [Google Scholar] [CrossRef]
- Catoira, Y.M.; Harris, A.; Siesky, B.; Cantor, L.; Kagemann, L.; Garzozi, H.; Lusky, M.; Tsai, P. Intraocular Pressure Correlates with Visual Function in Primary Open Angle Glaucoma Patients. IOVS 2004, 45, 3352–3357. [Google Scholar]
- Fea, A.M.; Brogliatti, B.; Belli, L.; Rolle, T.; Roagna, B.; Grignolo, F. Is contrast sensitivity of POAG patients getting better with cyticholine treatment? IOVS 2004, 45, ARVO E–abstract 901. [Google Scholar]
- Siesky, B.A.; Harris, A.; Cantor, L.; Rechtman, E.; Zalish, M.; Yung, C.W.; Kagemann, L.; Sanches, E.; Garzozi, H.J. Visual Function Correlates with Blood Flow in Primary Open Angle Glaucoma. IOVS 2004, 45, 3439–3445. [Google Scholar]
- Siesky, B.; Harris, A.; Sines, D.; Rechtman, E.; Malinovsky, V.E.; McCranor, L.; Yung, C.-W.; Zalish, M. A comparative analysis of the effects of the fixed combination of timolol and dorzolamide versus latanoprost plus timolol on ocular hemodynamics and visual function in patients with primary open-angle glaucoma. J. Ocul. Pharmacol. Ther. 2006, 22, 353–361. [Google Scholar] [CrossRef]
- Evans, D.W.; Bartlett, J.D.; Houde, B.; Than, T.P.; Shaikh, A. Latanoprost-induced stabilization of central visual function in patients with primary open-angle glaucoma. J. Ocul. Pharmacol. Ther. 2008, 24, 224–229. [Google Scholar] [CrossRef]
- Prata, T.S.; Piassi, M.V.; Melo, L.A.S., Jr. Changes in visual function after intraocular pressure reduction using antiglaucoma medications. Eye 2009, 23, 1081–1085. [Google Scholar] [CrossRef]
- Guo, X.; Kong, X.; Huang, R.; Jin, L.; Ding, X.; He, M.; Liu, X.; Patel, M.C.; Congdon, N.G. Effect of ginkgo biloba on visual field and contrast sensitivity in Chinese patients with normal tension glaucoma: A randomized, crossover clinical trial. Investig. Ophthalmol. Vis. Sci. 2014, 55, 110–116. [Google Scholar] [CrossRef]
- Aerie, P. Efficacy and Systemic Safety of Netarsudil 0.01%, 0.02%, 0.04% Relative to Placebo in Subjects with Open-angle Glaucoma or Ocular Hypertension in Japan 2019 [Updated September 19]. Available online: https://ClinicalTrials.gov/show/NCT03844945 (accessed on 13 June 2025).
- Azizzadeh, P.; Safarzadeh, M. Evaluation of Contrast Sensitivity after Four Different Treatment Modalities Using OPTEC-Functional Vision Analyzer in Primary Open-Angle Glaucoma. Middle East Afr. J. Ophthalmol. 2019, 26, 60–64. [Google Scholar] [CrossRef] [PubMed]
- Trevino, R.; Sponsel, W.E.; Majcher, C.; Villaflor, C.; Nozicka, J. Effect of laser peripheral iridotomy location on post-operative visual function. Investig. Ophthalmol. Vis. Sci. 2019, 60, 2824. [Google Scholar]
- Marino, P.F.; Rossi, G.C.M.; Campagna, G.; Capobianco, D.; Costagliola, C.; Group, Q.S. Effects of citicoline, homotaurine, and vitamin e on contrast sensitivity and visual-related quality of life in patients with primary open-angle glaucoma: A preliminary study. Molecules 2020, 25, 5614. [Google Scholar] [CrossRef]
- Loughman, J.; Loskutova, E.; Butler, J.S.; Siah, W.F.; O’Brien, C. Macular Pigment Response to Lutein, Zeaxanthin, and Meso-zeaxanthin Supplementation in Open-Angle Glaucoma: A Randomized Controlled Trial. Ophthalmol. Sci. 2021, 1, 100039. [Google Scholar] [CrossRef]
- Lee, K.; Yang, H.; Kim, J.Y.; Choi, W.; Seong, G.J.; Kim, C.Y.; Lee, J.M.; Bae, H.W. Effect of red ginseng on visual function and vision-related quality of life in patients with glaucoma. J. Ginseng Res. 2021, 45, 676–682. [Google Scholar] [CrossRef]
- Hunter, A.M.L.; Loskutova, E.; Lingham, G.; O’Brien, C.J.; Loughman, J.; Butler, J.S. Higher Macular Pigment Levels are Associated with Better Contrast Sensitivity and Photostress Recovery Time in Patients with Open-Angle Glaucoma Supplemented with Carotenoids. Investig. Ophthalmol. Vis. Sci. 2022, 63, 2699-A0063. [Google Scholar]
- Kitnarong, N.; Udomwech, L.; Chongthurakit, N.; Phongsuphan, T.; Petchyim, S. Effects of blue-light-filtering intraocular lenses on contrast sensitivity in patients with glaucoma. Medicine 2023, 102, e36821. [Google Scholar] [CrossRef]
- Ramos Cadena, M.L.A.; Sohn, A.; Livengood, H.; Lee, T.F.; Rubin, B.; Hu, J.; Sabel, B.A.; Matayev, R.; Panarelli, J.; Wollstein, G.; et al. Transorbital Alternating Current Stimulation in a Double-Masked Randomized Clinical Trial: Visual Functional Effect and Quality of Life. Ophthalmol. Sci. 2025, 5, 100614. [Google Scholar] [CrossRef]
- Bambo, M.P.; Ferrandez, B.; Güerri, N.; Fuertes, I.; Cameo, B.; Polo, V.; Larrosa, J.M.; Garcia-Martin, E. Evaluation of Contrast Sensitivity, Chromatic Vision, and Reading Ability in Patients with Primary Open Angle Glaucoma. J. Ophthalmol. 2016, 2016, 7074016. [Google Scholar] [CrossRef]
- Leat, S.J.; Woo, G.C. The validity of current clinical tests of contrast sensitivity and their ability to predict reading speed in low vision. Eye 1997, 11 Pt 6, 893–899. [Google Scholar] [CrossRef]
- VectorVision. CSV-1000E. Available online: https://www.vectorvision.com/csv1000-contrast-sensitivity/ (accessed on 13 June 2025).
- Stereo Optical Company I. Functional Acuity Contrast Test F.A.C.T; 2018. Available online: www.stereooptical.com (accessed on 13 June 2025).
- Pesudovs, K.; Hazel, C.A.; Doran, R.M.; Elliott, D.B. The usefulness of Vistech and FACT contrast sensitivity charts for cataract and refractive surgery outcomes research. Br. J. Ophthalmol. 2004, 88, 11–16. [Google Scholar] [CrossRef]
- Pelli, D.G. The design of a new letter chart for measuring contrast sensitivity. Clin. Vis. Sci. 1988, 2, 187–199. [Google Scholar]
- Optical, S. Functional Vision Analyzer; Stereo Optical: Chicago, IL, USA, 2023. [Google Scholar]
- Richman, J.; Zangalli, C.; Lu, L.; Wizov, S.S.; Spaeth, E.; Spaeth, G.L. The Spaeth/Richman contrast sensitivity test (SPARCS): Design, reproducibility and ability to identify patients with glaucoma. Br. J. Ophthalmol. 2015, 99, 16–20. [Google Scholar] [CrossRef] [PubMed]
- Bose, S.; Piltz, J.R.; Breton, M.E. Nimodipine, a centrally active calcium antagonist, exerts a beneficial effect on contrast sensitivity in patients with normal-tension glaucoma and in control subjects. Ophthalmology 1995, 102, 1236–1241. [Google Scholar] [CrossRef] [PubMed]
- Graham, S.L.; Drance, S.M.; Chauhan, B.C.; Swindale, N.V.; Hnik, P.; Mikelberg, F.S.; Douglas, G.R. Comparison of psychophysical and electrophysiological testing in early glaucoma. Investig. Ophthalmol. Vis. Sci. 1996, 37, 2651–2662. [Google Scholar]
- Hopewell, S.; Boutron, I.; Chan, A.W.; Collins, G.S.; de Beyer, J.A.; Hróbjartsson, A.; Nejstgaard, C.H.; Østengaard, L.; Schulz, K.F.; Tunn, R.; et al. An update to SPIRIT and CONSORT reporting guidelines to enhance transparency in randomized trials. Nat. Med. 2022, 28, 1740–1743. [Google Scholar] [CrossRef]
Disclaimer/Publisher’s Note: The statements, opinions and data contained in all publications are solely those of the individual author(s) and contributor(s) and not of MDPI and/or the editor(s). MDPI and/or the editor(s) disclaim responsibility for any injury to people or property resulting from any ideas, methods, instructions or products referred to in the content. |
© 2025 by the authors. Licensee MDPI, Basel, Switzerland. This article is an open access article distributed under the terms and conditions of the Creative Commons Attribution (CC BY) license (https://creativecommons.org/licenses/by/4.0/).