
Lacticaseibacillus rhamnosus LM1019 Enhances Natural Killer Cell Activity in Defined Adult Subsets: A Double-Blind, Placebo-Controlled Trial

 , ,
, ,
Abstract
1. Introduction
2. Materials and Methods
2.1. Study Design
2.2. Clinical Study
2.2.1. Inclusion and Exclusion Criteria
Inclusion Criteria
- Age between 19 and 75 years.
- White blood cell counts between 3.0 and 8.0 × 10³ cells/µL.
- History of ≥2 upper respiratory tract infections (e.g., common cold, pharyngitis, rhinitis) within the past 12 months.
- History of ≥2 episodes of stomatitis or herpes zoster within the past 12 months.
- Recurrent uncomplicated cystitis: ≥3 episodes in the past year, or ≥2 episodes in the past 6 months.
- Perceived Stress Scale (PSS) score ≥ 16.
- Willingness and ability to maintain usual diet, avoid probiotic-rich supplements at ≥4×/week, and comply with all study procedures.
- Signed informed consent.
Exclusion Criteria
- Chronic or uncontrolled medical conditions (autoimmune disease, active malignancy, uncontrolled hypertension [SBP ≥ 140 mmHg or DBP ≥ 90 mmHg], diabetes with fasting glucose ≥ 126 mg/dL, or thyroid dysfunction [TSH < 0.1 or < 10 µIU/mL]).
- Recent vaccination (influenza, COVID-19, herpes zoster) within 3 months, or COVID-19 infection within 6 weeks prior to visit 1.
- Use of immunosuppressants, systemic steroids, antibiotics, or acid suppressants within 1 month prior to visit 1.
- Regular (≥4×/week) consumption of probiotic supplements or probiotic-rich fermented dairy products in the month prior to visit 1.
- Severe gastrointestinal disorders (e.g., active ulcer, inflammatory bowel disease).
- Pregnancy, breastfeeding, or planning pregnancy during the study (unless using effective contraception).
- Participation in another interventional clinical trial within 8 weeks prior to visit 1 or planned participation during this study.
- Known allergy to probiotics or capsule excipients (e.g., maltodextrin).
- Body mass index ≥ 30 kg/m2.
- Excessive alcohol intake (>210 g/week for men, >140 g/week for women) within 1 month prior to visit 1.
- Any other condition that, in the investigator’s judgment, could compromise safety or protocol compliance.
2.3. Outcome Measures
2.3.1. Efficacy Assessment
- Experimental Release refers to LDH levels measured in wells containing NK cells co-cultured with K562 target cells.
- Spontaneous Release refers to LDH levels measured in wells containing target cells alone.
- Maximum Release refers to LDH levels measured in wells containing target cells treated with lysis solution to achieve complete cell lysis.
2.3.2. Safety Assessment
2.4. Statistical Analysis
2.4.1. Efficacy Analysis
2.4.2. Demographic and Baseline Characteristics
2.4.3. Safety Analysis
2.4.4. Vital Signs, Non-Efficacy Measurements and Other Evaluations
3. Results
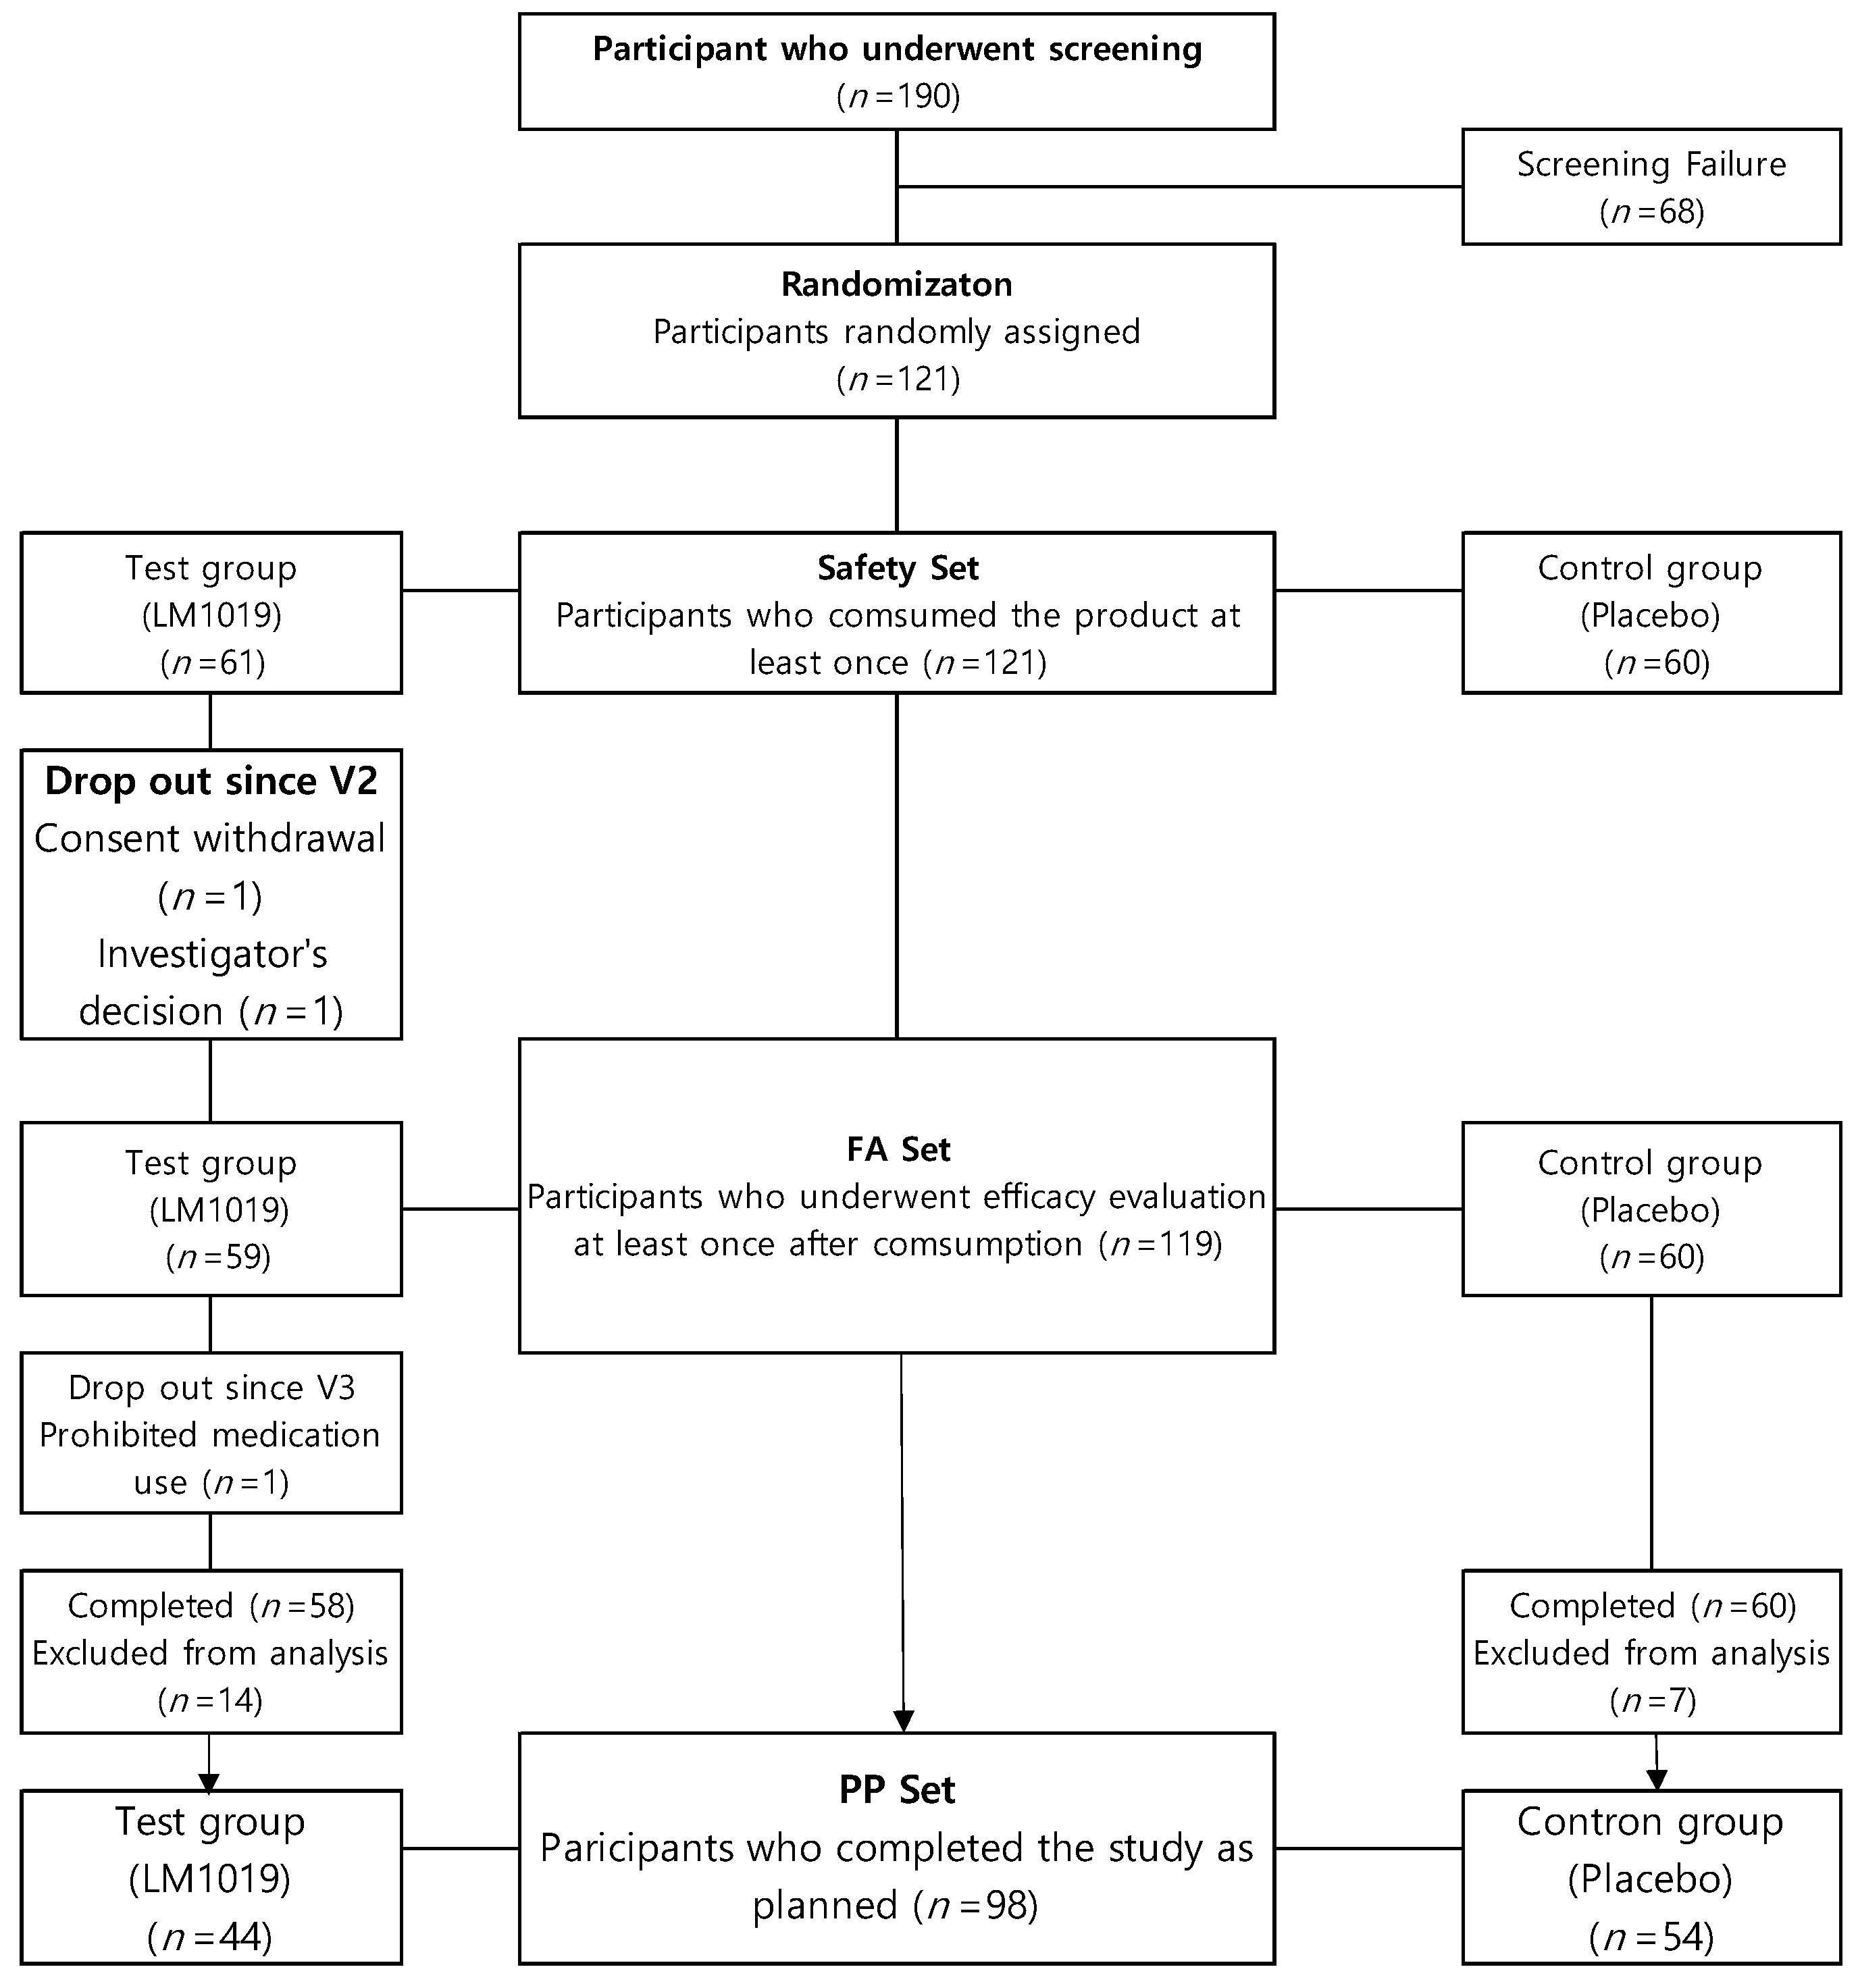
3.1. Study Population
3.2. Baseline Characteristics of the Participants
3.3. Safety Assessment
3.4. Primary and Secondary Outcomes
3.5. Nutritional Intake Analysis
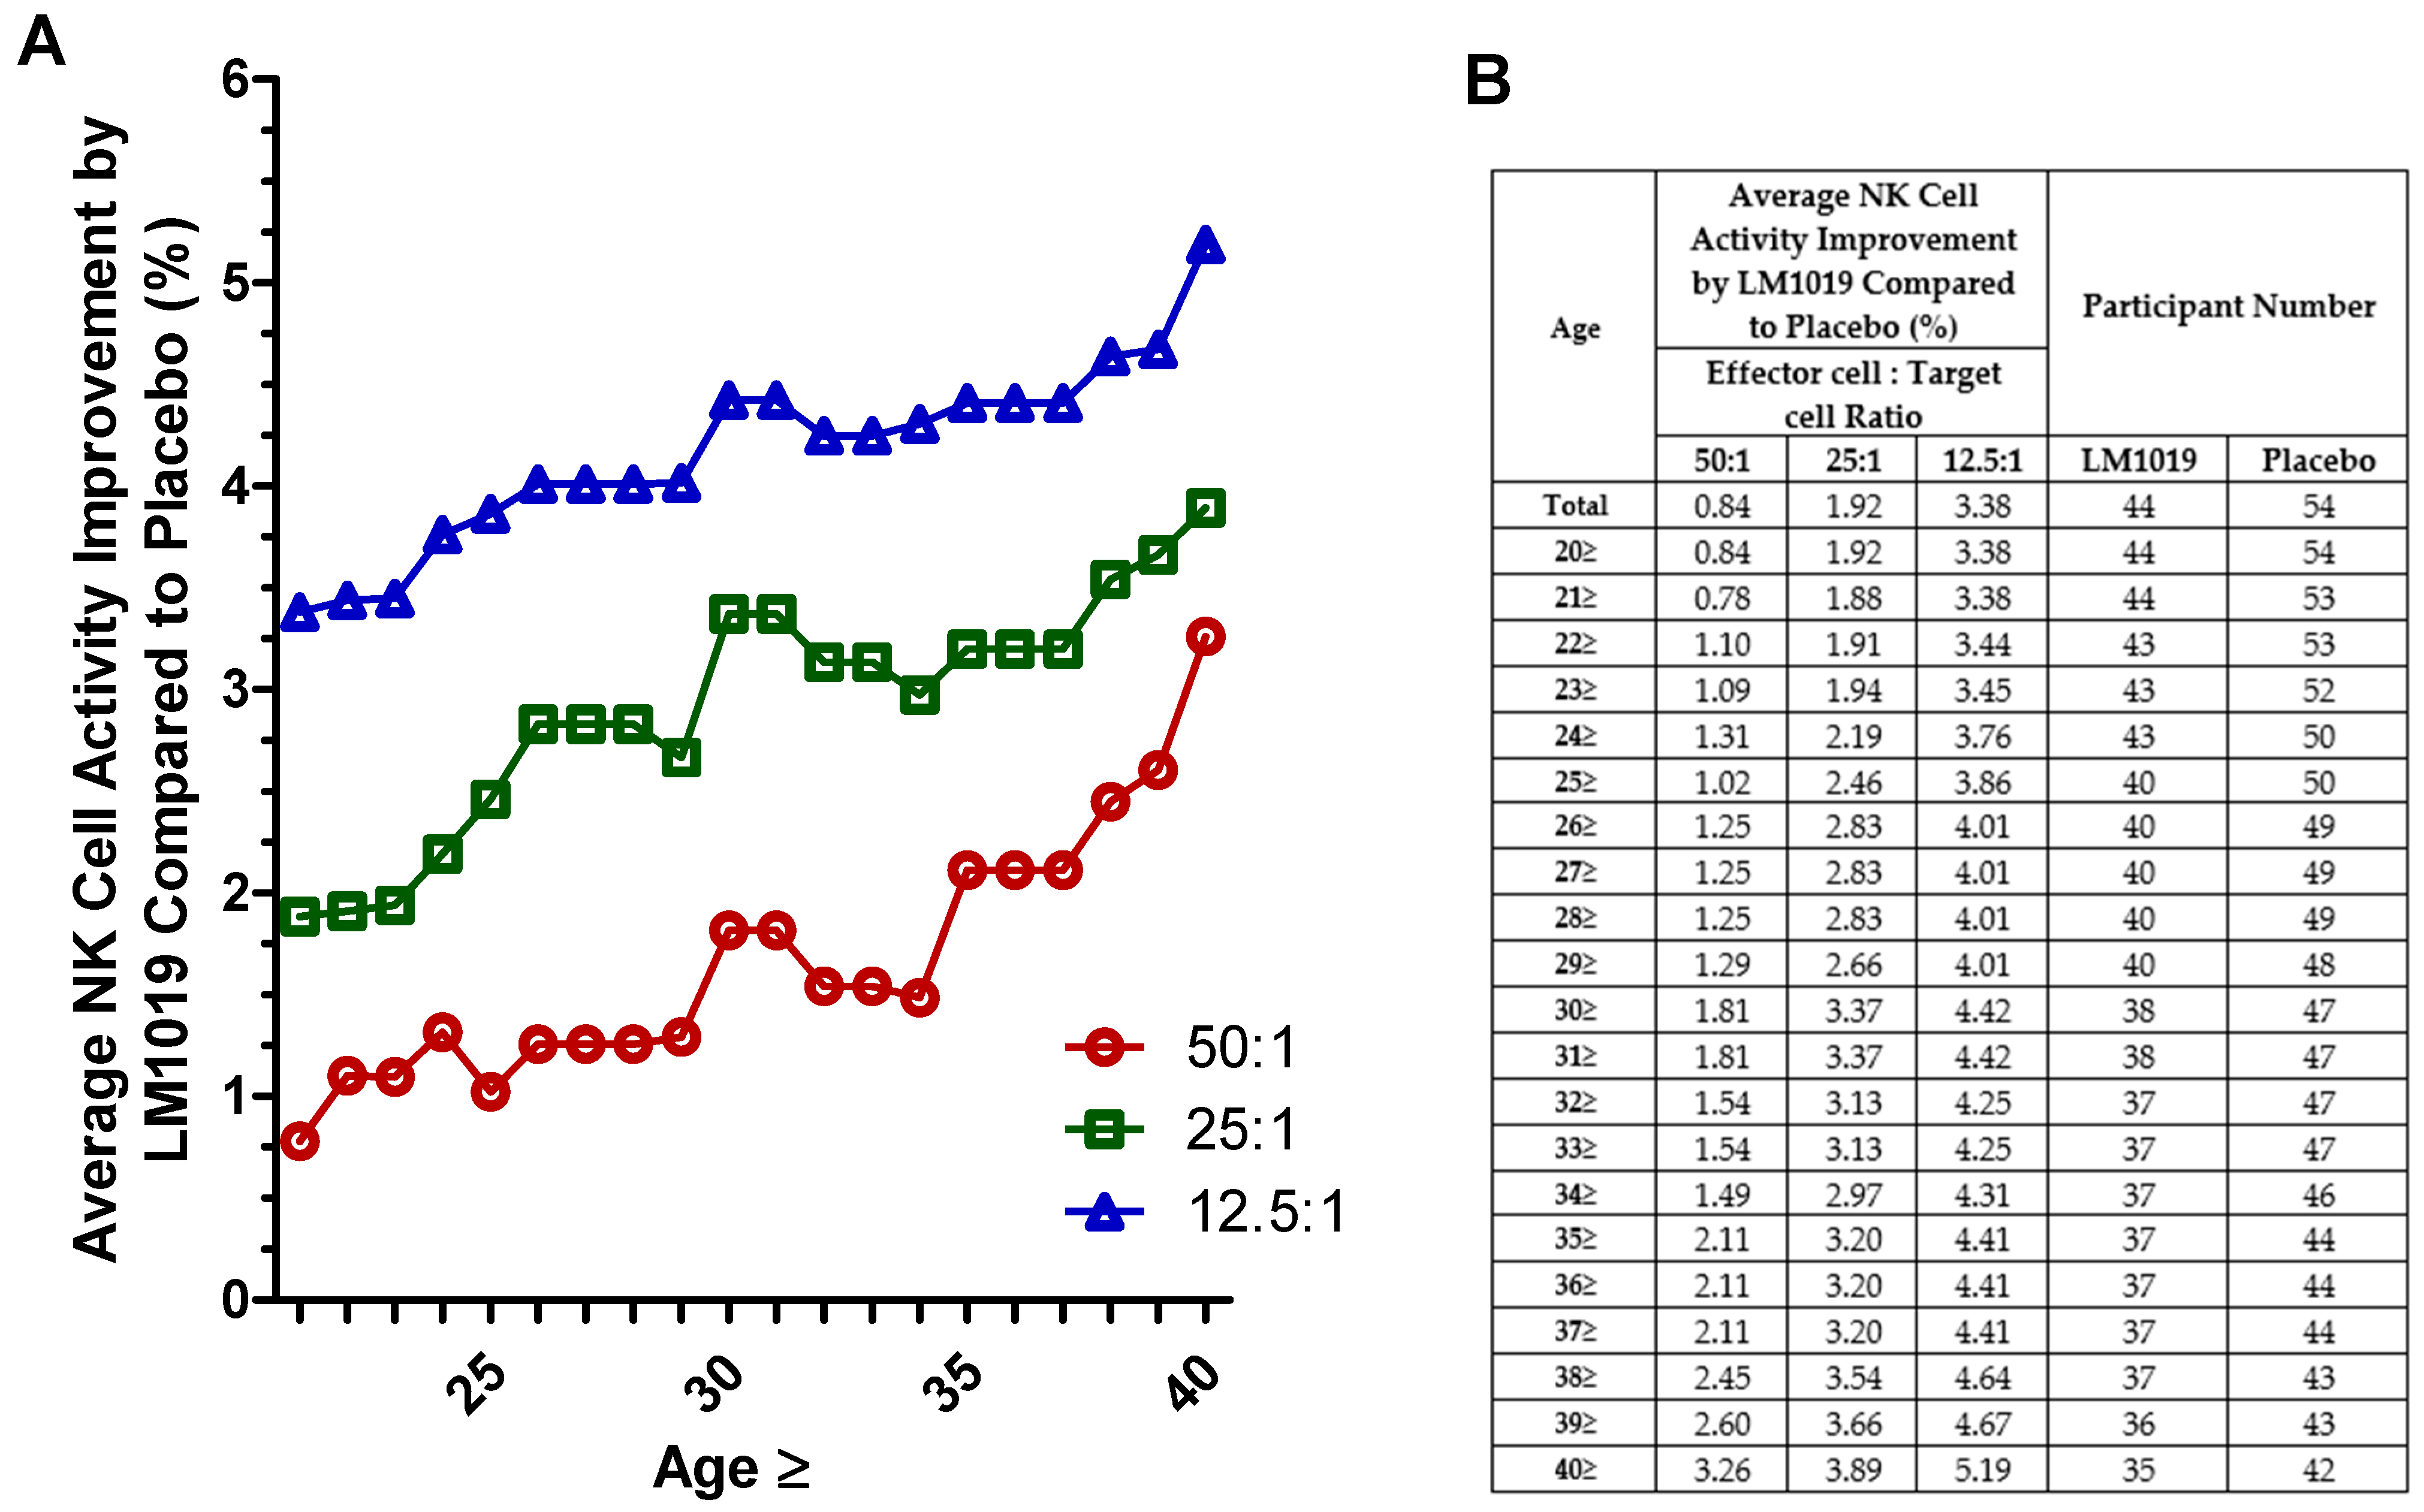
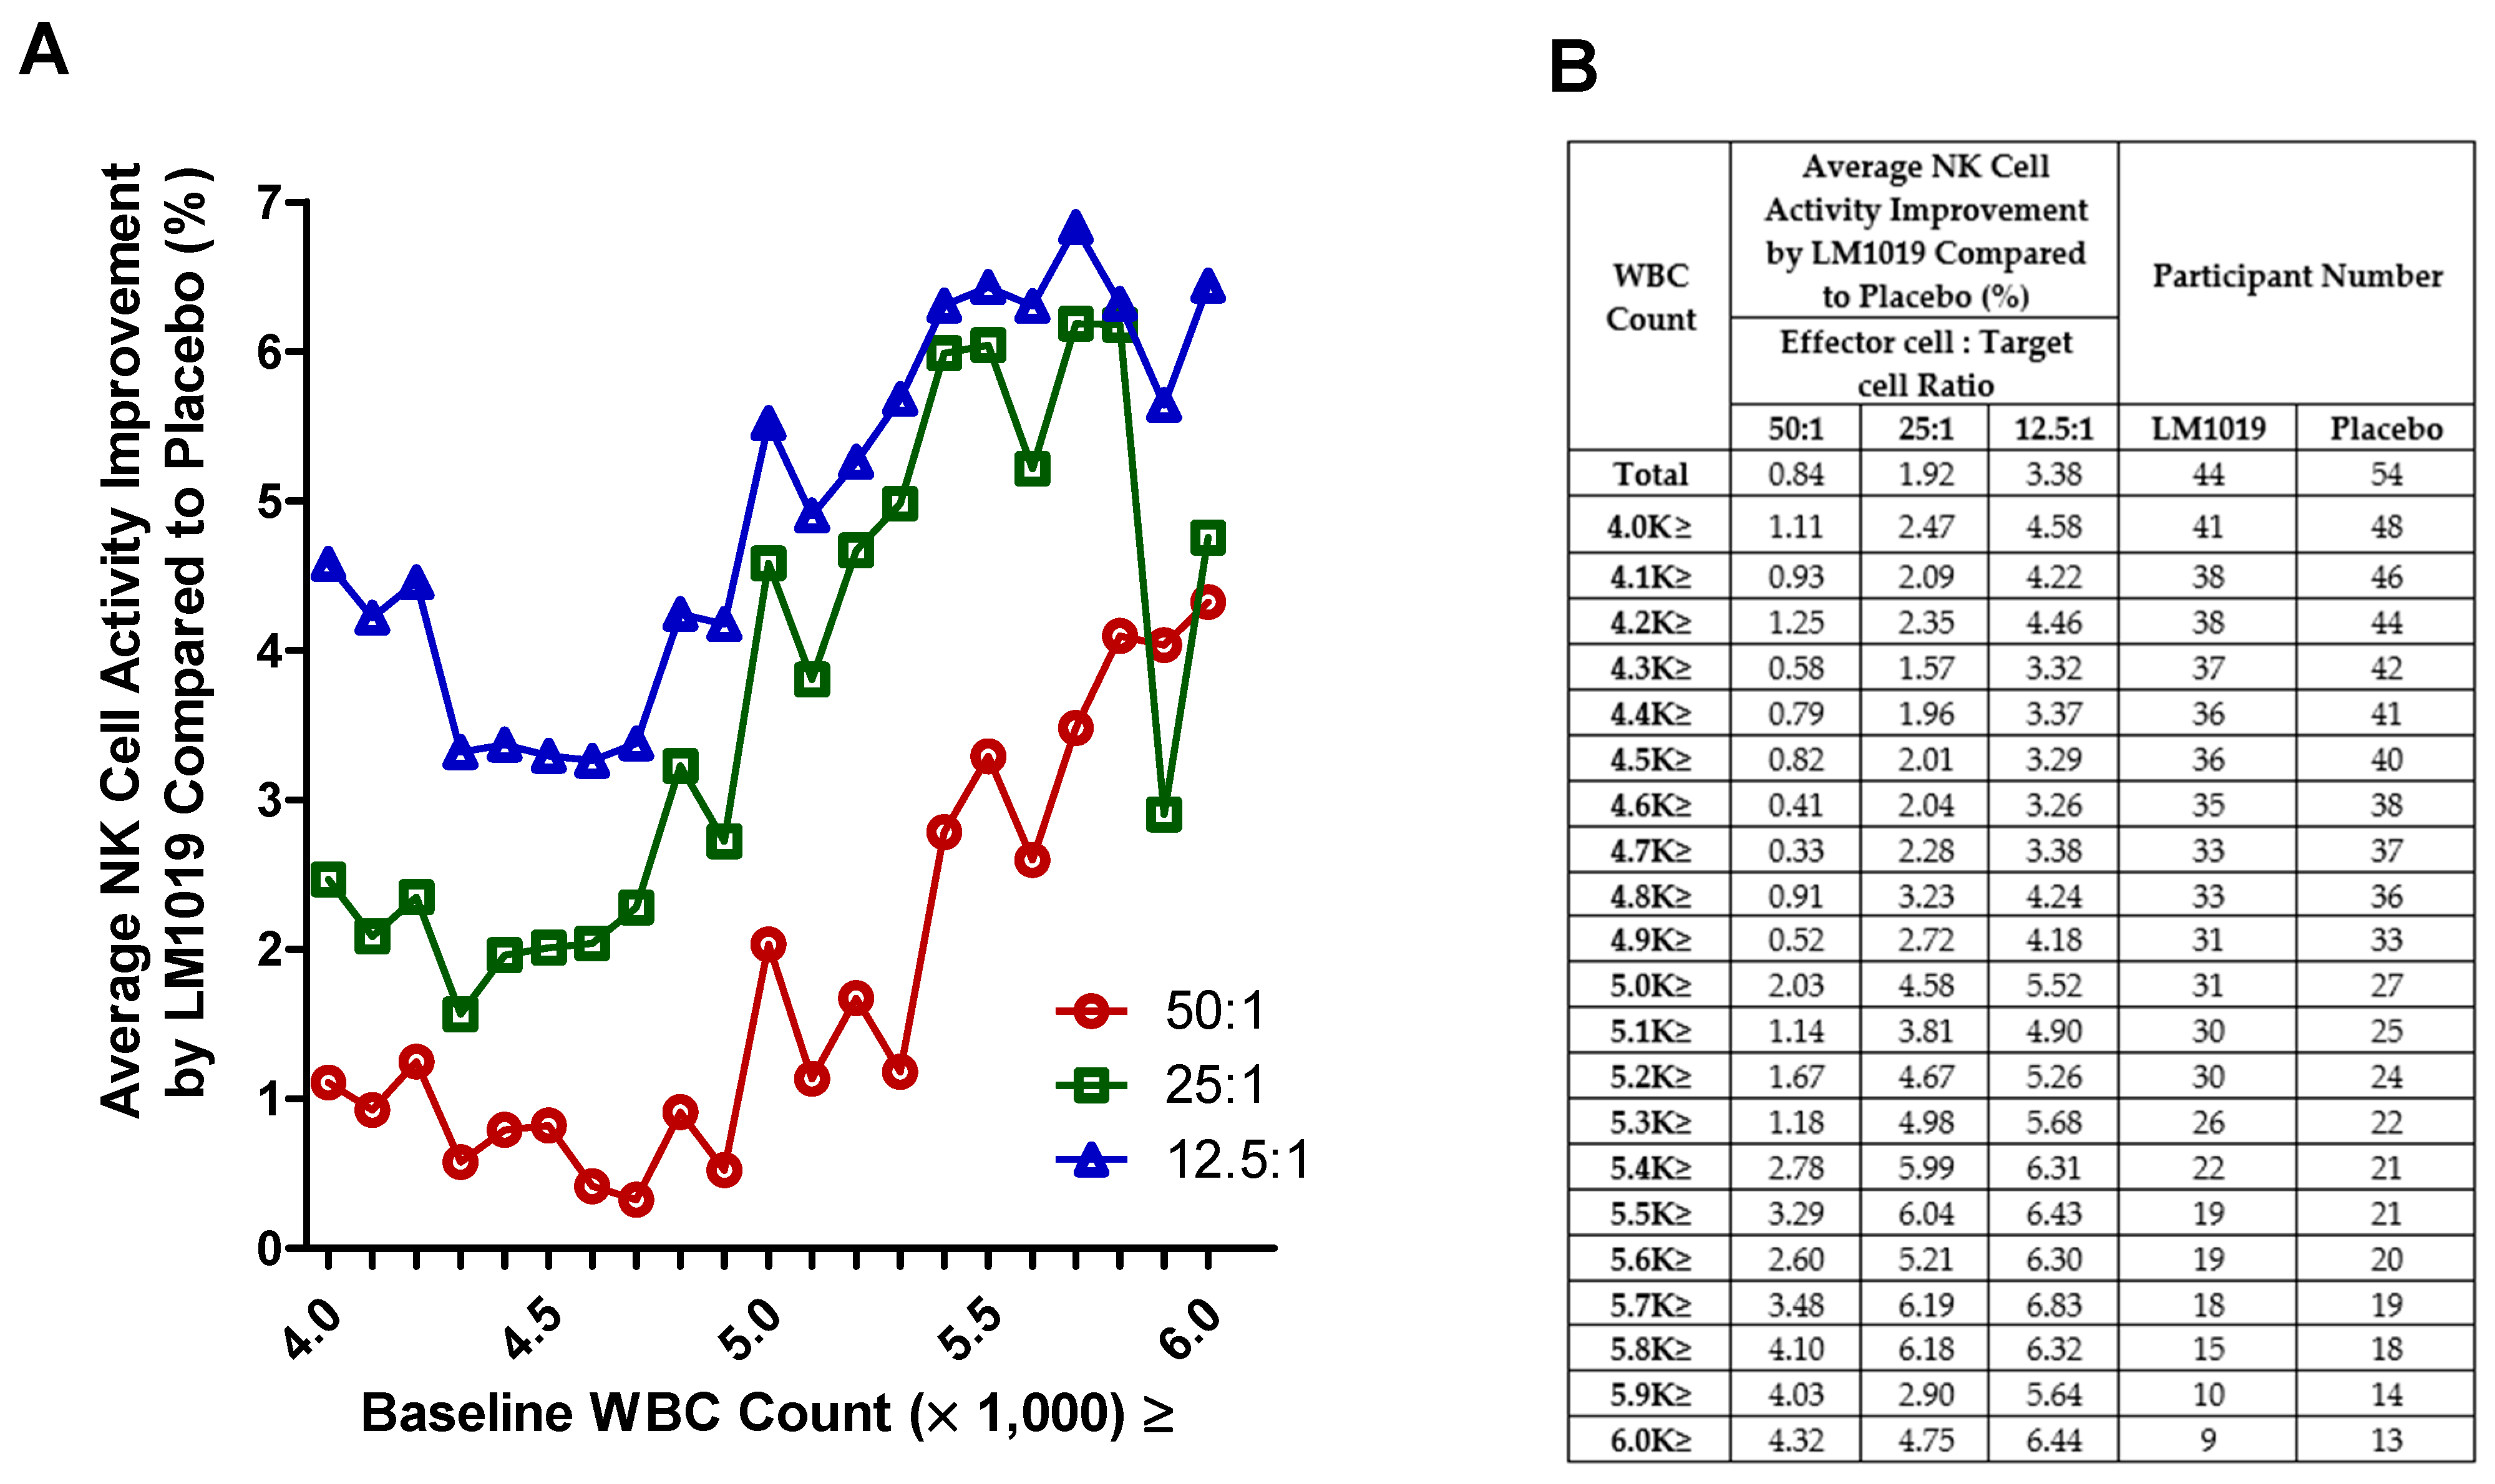
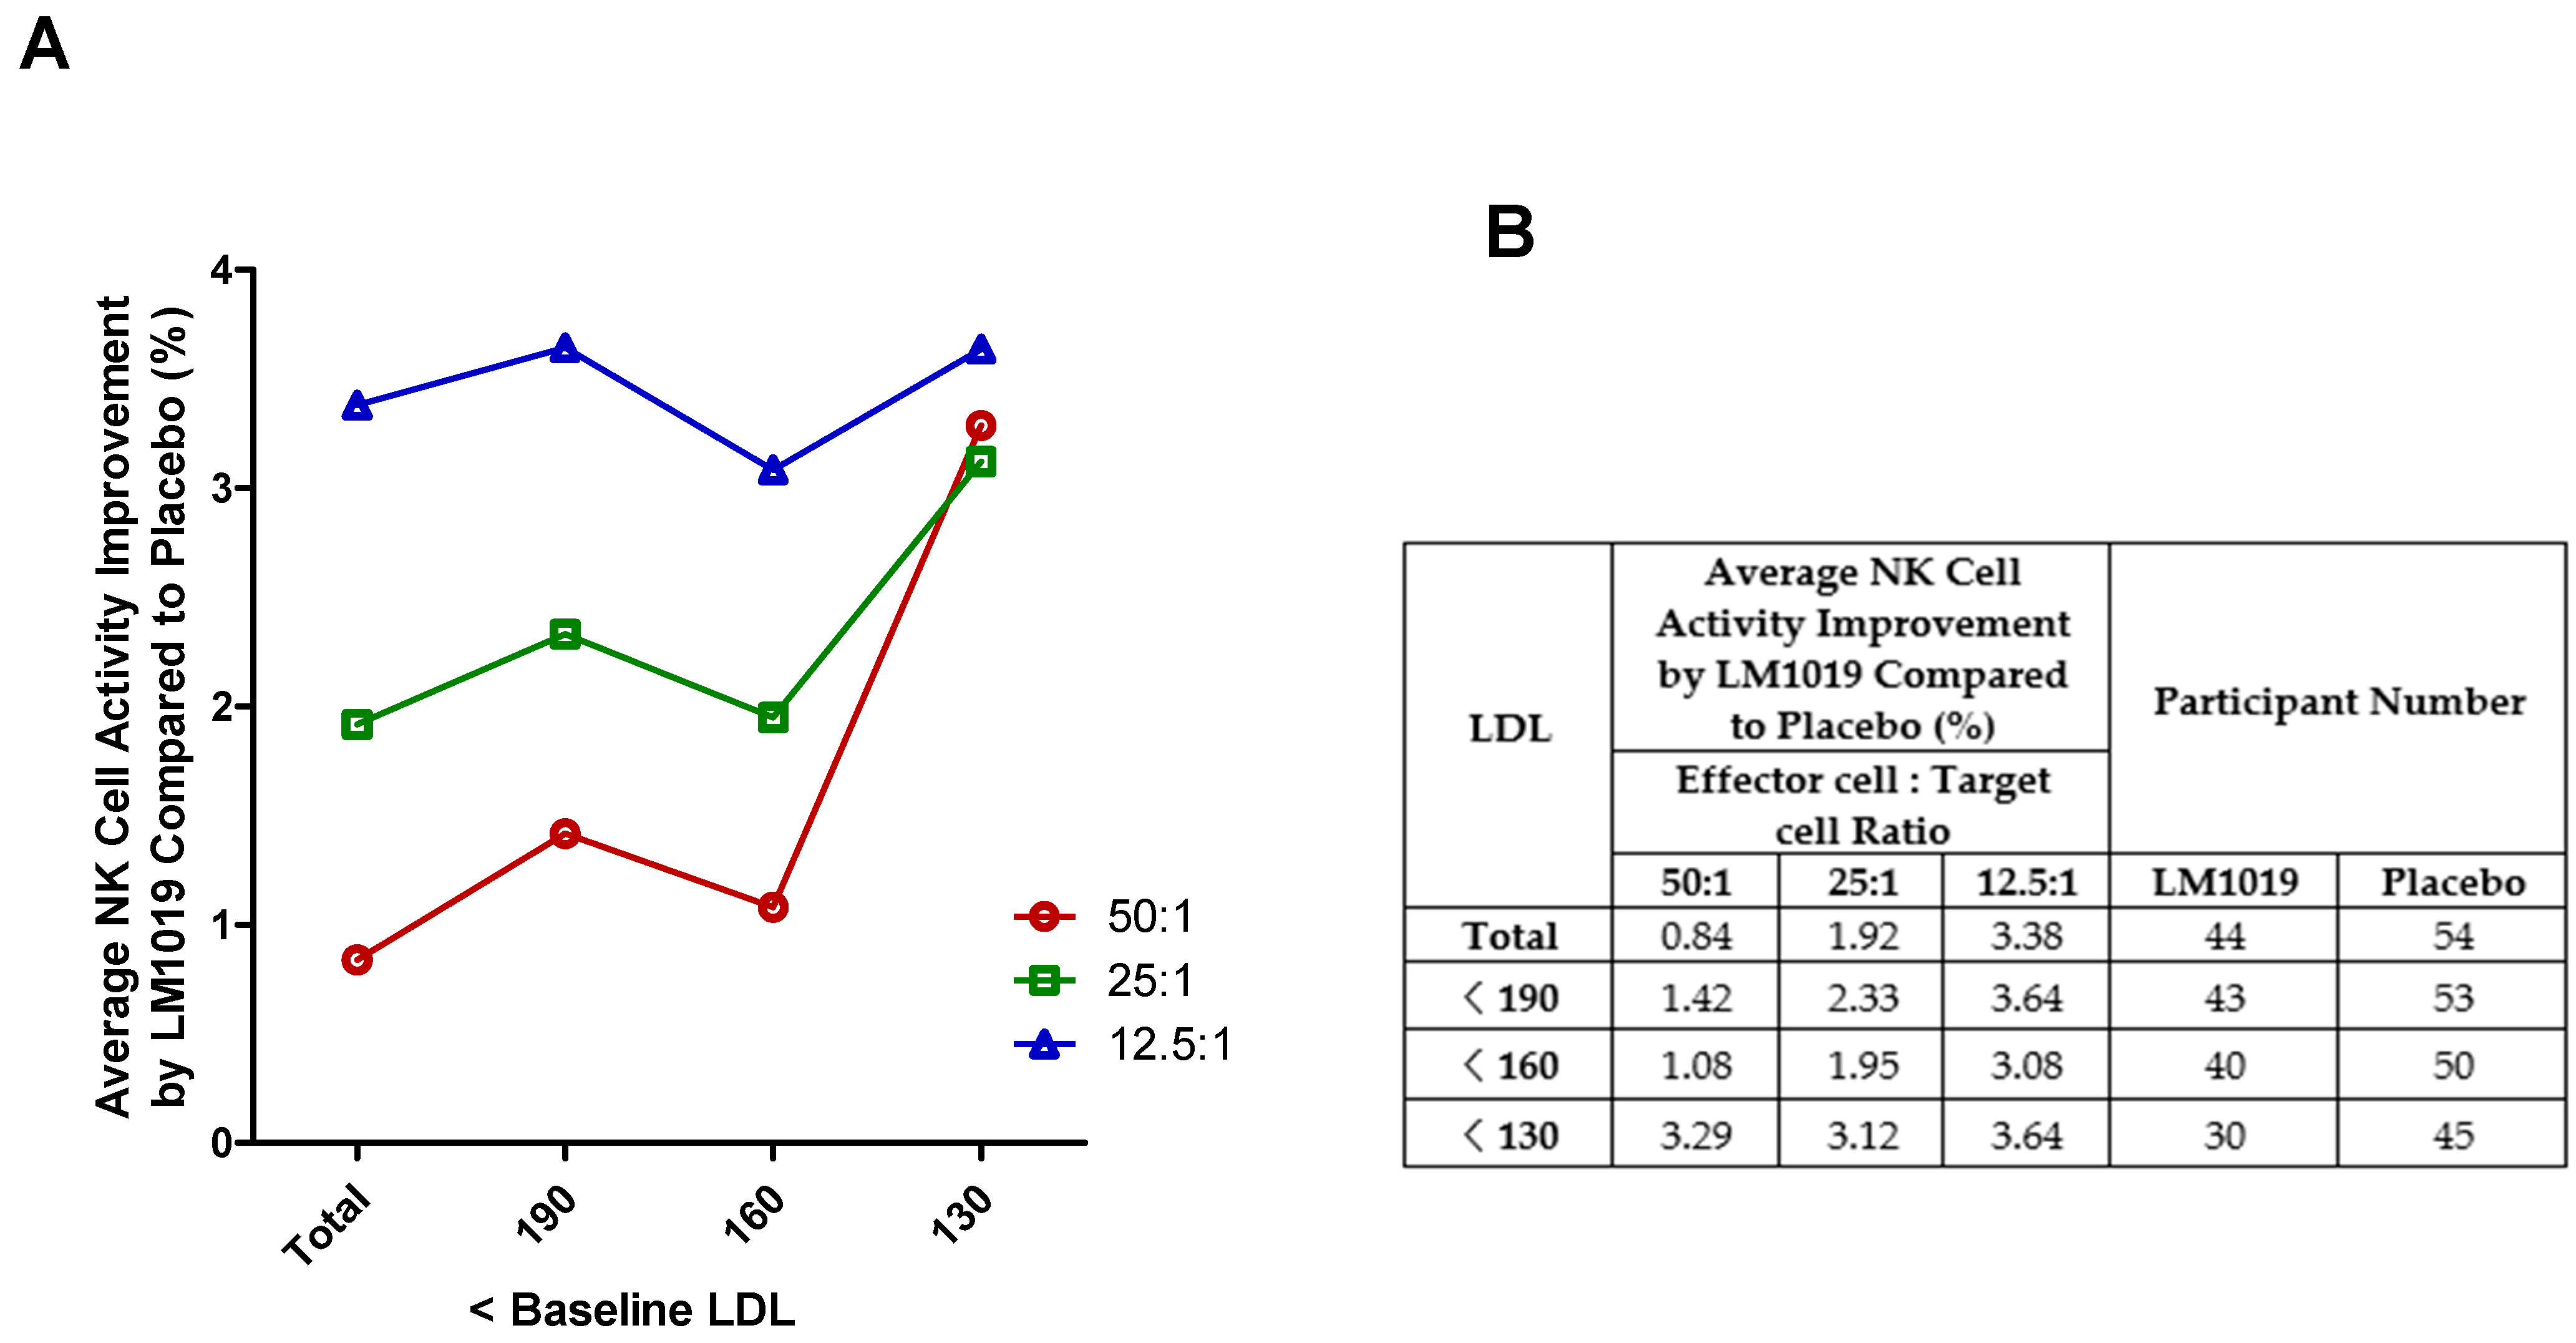
3.6. Subgroup Analysis
3.6.1. Age Group
3.6.2. Baseline WBC Count
3.6.3. Baseline LDL
3.6.4. Combined Subgroup Analysis
4. Discussion
4.1. Main Findings
4.2. Study Limitations and Considerations
4.3. Future Research Directions
5. Conclusions
Author Contributions
Funding
Institutional Review Board Statement
Informed Consent Statement
Data Availability Statement
Conflicts of Interest
References
- Goyani, P.; Christodoulou, R.; Vassiliou, E. Immunosenescence: Aging and Immune System Decline. Vaccines 2024, 12, 1314. [Google Scholar] [CrossRef] [PubMed]
- Elyahu, Y.; Monsonego, A. Thymus involution sets the clock of the aging T-cell landscape: Implications for declined immunity and tissue repair. Ageing Res. Rev. 2021, 65, 101231. [Google Scholar] [CrossRef] [PubMed]
- Qi, Q.; Liu, Y.; Cheng, Y.; Glanville, J.; Zhang, D.; Lee, J.-Y.; Olshen, R.A.; Weyand, C.M.; Boyd, S.D.; Goronzy, J.J. Diversity and clonal selection in the human T-cell repertoire. Proc. Natl. Acad. Sci. USA 2014, 111, 13139–13144. [Google Scholar] [CrossRef]
- Cardinale, A.; De Luca, C.D.; Locatelli, F.; Velardi, E. Thymic Function and T-Cell Receptor Repertoire Diversity: Implications for Patient Response to Checkpoint Blockade Immunotherapy. Front. Immunol. 2021, 12, 752042. [Google Scholar] [CrossRef]
- Britanova, O.V.; Putintseva, E.V.; Shugay, M.; Merzlyak, E.M.; Turchaninova, M.A.; Staroverov, D.B.; Bolotin, D.A.; Lukyanov, S.; Bogdanova, E.A.; Mamedov, I.Z.; et al. Age-related decrease in TCR repertoire diversity measured with deep and normalized sequence profiling. J. Immunol. 2014, 192, 2689–2698. [Google Scholar] [CrossRef]
- Egorov, E.S.; Kasatskaya, S.A.; Zubov, V.N.; Izraelson, M.; Nakonechnaya, T.O.; Staroverov, D.B.; Angius, A.; Cucca, F.; Mamedov, I.Z.; Rosati, E.; et al. The Changing Landscape of Naive T Cell Receptor Repertoire with Human Aging. Front. Immunol. 2018, 9, 1618. [Google Scholar] [CrossRef]
- Chang, S.T.; Chuang, Y.F.; Li, A.H.; Fan, Y.T.; Liao, M.R.; Chen, I.Y.; Hung, R.W.; Yang, T.O.; Chiu, Y.L. Age-dependent immune profile in healthy individuals: An original study, systematic review and meta-analysis. Immun. Ageing 2024, 21, 75. [Google Scholar] [CrossRef]
- Tedeschi, V.; Paldino, G.; Kunkl, M.; Paroli, M.; Sorrentino, R.; Tuosto, L.; Fiorillo, M.T. CD8⁺ T Cell Senescence: Lights and Shadows in Viral Infections, Autoimmune Disorders and Cancer. Int. J. Mol. Sci. 2022, 23, 3374. [Google Scholar] [CrossRef]
- Lin, Y.; Damjanovic, A.; Metter, E.J.; Nguyen, H.; Truong, T.; Najarro, K.; Morris, C.; Longo, D.L.; Zhan, M.; Ferrucci, L.; et al. Age-associated telomere attrition of lymphocytes in vivo is coordinated with changes in telomerase activity, composition of lymphocyte subsets and health conditions. Clin. Sci. 2015, 128, 367–377. [Google Scholar] [CrossRef] [PubMed]
- Naylor, K.; Li, G.; Vallejo, A.N.; Lee, W.-W.; Koetz, K.; Bryl, E.; Witkowski, J.; Fulbright, J.; Weyand, C.M.; Goronzy, J.J. The influence of age on T cell generation and TCR diversity. J. Immunol. 2005, 174, 7446–7452. [Google Scholar] [CrossRef]
- de Mol, J.; Kuiper, J.; Tsiantoulas, D.; Foks, A.C. The Dynamics of B Cell Aging in Health and Disease. Front. Immunol. 2021, 12, 733566. [Google Scholar] [CrossRef] [PubMed]
- Siegrist, C.A.; Aspinall, R. B-cell responses to vaccination at the extremes of age. Nat. Rev. Immunol. 2009, 9, 185–194. [Google Scholar] [CrossRef]
- Shaw, A.C.; Joshi, S.; Greenwood, H.; Panda, A.; Lord, J.M. Aging of the innate immune system. Curr. Opin. Immunol. 2010, 22, 507–513. [Google Scholar] [CrossRef]
- Puzianowska-Kuźnicka, M.; Owczarz, M.; Wieczorowska-Tobis, K.; Nadrowski, P.; Chudek, J.; Ślusarczyk, P.; Skalska, A.; Jonas, M.; Franek, E.; Mossakowska, M. Interleukin-6 and C-reactive protein, successful aging, and mortality: The PolSenior study. Immun. Ageing 2016, 13, 21. [Google Scholar] [CrossRef]
- Ferrucci, L.; Fabbri, E. Inflammageing: Chronic inflammation in ageing, cardiovascular disease, and frailty. Nat. Rev. Cardiol. 2018, 15, 505–522. [Google Scholar] [CrossRef] [PubMed]
- Fulop, T.; Larbi, A.; Dupuis, G.; Le Page, A.; Frost, E.H.; Cohen, A.A.; Witkowski, J.M.; Franceschi, C. Immunosenescence and inflammaging as two sides of the same coin: Friends or foes? Front. Immunol. 2018, 8, 1960. [Google Scholar] [CrossRef]
- Weinberger, B.; Herndler-Brandstetter, D.; Schwanninger, A.; Weiskopf, D.; Grubeck-Loebenstein, B. Biology of immune responses to vaccines in elderly persons. Clin. Infect. Dis. 2008, 46, 1078–1084. [Google Scholar] [CrossRef]
- Goronzy, J.J.; Weyand, C.M. Immune aging and autoimmunity. Cell. Mol. Life Sci. 2012, 69, 1615–1623. [Google Scholar] [CrossRef]
- Campisi, J. Aging, cellular senescence, and cancer. Annu. Rev. Physiol. 2013, 75, 685–705. [Google Scholar] [CrossRef]
- Bauer, M.E. Accelerated immunosenescence in rheumatoid arthritis: Impact on clinical progression. Immun. Ageing 2020, 17, 6. [Google Scholar] [CrossRef]
- Tay, M.Z.; Poh, C.M.; Rénia, L.; MacAry, P.A.; Ng, L.F.P. The trinity of COVID-19: Immunity, inflammation and intervention. Nat. Rev. Immunol. 2020, 20, 363–374. [Google Scholar] [CrossRef] [PubMed]
- Mak, J.W.Y.; Chan, F.K.L.; Ng, S.C. Probiotics and COVID-19: One size does not fit all. Lancet Gastroenterol. Hepatol. 2020, 5, 644–645. [Google Scholar] [CrossRef] [PubMed]
- Chen, Y.; Klein, S.L.; Garibaldi, B.T.; Li, H.; Wu, C.; Osevala, N.M.; Li, D.; Zhang, F.; Klein, C.; Jin, F.; et al. Aging in COVID-19: Vulnerability, immunity and intervention. Ageing Res. Rev. 2021, 65, 101205. [Google Scholar] [CrossRef]
- Uddin, N.; Acter, T.; Rashid, M.H.; Chowdhury, A.I.; Jahan, E.A. Coping with the COVID-19 pandemic by strengthening immunity as a nonpharmaceutical intervention: A major public health challenge. Health Sci. Rep. 2023, 6, e1562. [Google Scholar] [CrossRef]
- Yan, F.; Polk, D.B. Probiotics and immune health. Curr. Opin. Gastroenterol. 2011, 27, 496–501. [Google Scholar] [CrossRef]
- Mazziotta, C.; Tognon, M.; Martini, F.; Torreggiani, E.; Rotondo, J.C. Probiotics Mechanism of Action on Immune Cells and Beneficial Effects on Human Health. Cells 2023, 12, 184. [Google Scholar] [CrossRef]
- Chandrasekaran, P.; Weiskirchen, S.; Weiskirchen, R. Effects of Probiotics on Gut Microbiota: An Overview. Int. J. Mol. Sci. 2024, 25, 6022. [Google Scholar] [CrossRef]
- Markowiak-Kopeć, P.; Śliżewska, K. The Effect of Probiotics on the Production of Short-Chain Fatty Acids by Human Intestinal Microbiome. Nutrients 2020, 12, 1107. [Google Scholar] [CrossRef]
- Azad, M.A.K.; Sarker, M.; Wan, D. Immunomodulatory Effects of Probiotics on Cytokine Profiles. Biomed. Res. Int. 2018, 2018, 8063647. [Google Scholar] [CrossRef]
- Björkström, N.K.; Strunz, B.; Ljunggren, H.-G. Natural killer cells in antiviral immunity. Nat. Rev. Immunol. 2022, 22, 112–123. [Google Scholar] [CrossRef]
- Wang, R.; Jaw, J.J.; Stutzman, N.C.; Zou, Z.; Sun, P.D. Natural killer cell-produced IFN-γ and TNF-α induce target cell cytolysis through up-regulation of ICAM-1. J. Leukoc. Biol. 2012, 91, 299–309. [Google Scholar] [CrossRef] [PubMed]
- Mujal, A.M.; Delconte, R.B.; Sun, J.C. Natural Killer Cells: From Innate to Adaptive Features. Annu. Rev. Immunol. 2021, 39, 417–447. [Google Scholar] [CrossRef] [PubMed]
- Lee, Y.J.; Lee, A.; Yoo, H.J.; Kim, M.; Noh, G.M.; Lee, J.H. Supplementation with the probiotic strain Weissella cibaria JW15 enhances natural killer cell activity in nondiabetic subjects. J. Funct. Foods 2018, 48, 153–158. [Google Scholar] [CrossRef]
- Nishimura, M.; Ohkawara, T.; Tetsuka, K.; Kawasaki, Y.; Nakagawa, R.; Satoh, H.; Sato, Y.; Nishihira, J. Effects of yogurt containing Lactobacillus plantarum HOKKAIDO on immune function and stress markers. J. Tradit. Complement. Med. 2015, 6, 275–280. [Google Scholar] [CrossRef]
- Gill, H.S.; Rutherfurd, K.J.; Cross, M.L.; Gopal, P.K. Enhancement of immunity in the elderly by dietary supplementation with the probiotic Bifidobacterium lactis HN019. Am. J. Clin. Nutr. 2001, 74, 833–839. [Google Scholar] [CrossRef]
- Miller, L.E.; Lehtoranta, L.; Lehtinen, M.J. The Effect of Bifidobacterium animalis ssp. lactis HN019 on Cellular Immune Function in Healthy Elderly Subjects: Systematic Review and Meta-Analysis. Nutrients 2017, 9, 191. [Google Scholar] [CrossRef]
- Pagnini, C.; Corleto, V.D.; Martorelli, M.; Lanini, C.; D’Ambra, G.; Di Giulio, E.; Delle Fave, G. Mucosal adhesion and anti-inflammatory effects of Lactobacillus rhamnosus GG in the human colonic mucosa: A proof-of-concept study. World J. Gastroenterol. 2018, 24, 4652–4662. [Google Scholar] [CrossRef]
- Costabile, A.; Bergillos-Meca, T.; Rasinkangas, P.; Korpela, K.; de Vos, W.M.; Gibson, G.R. Effects of Soluble Corn Fiber Alone or in Synbiotic Combination with Lactobacillus rhamnosus GG and the Pilus-Deficient Derivative GG-PB12 on Fecal Microbiota, Metabolism, and Markers of Immune Function: A Randomized, Double-Blind, Placebo-Controlled, Crossover Study in Healthy Elderly. Front. Immunol. 2017, 8, 1443. [Google Scholar] [CrossRef]
- Castro-Herrera, V.M.; Fisk, H.L.; Wootton, M.; Lown, M.; Owen-Jones, E.; Lau, M.; Lowe, R.; Hood, K.; Gillespie, D.; Hobbs, F.D.R.; et al. Combination of the Probiotics Lacticaseibacillus rhamnosus GG and Bifidobacterium animalis subsp. lactis BB-12 Has Limited Effect on Biomarkers of Immunity and Inflammation in Older People Resident in Care Homes: Results From the Probiotics to Reduce Infections iN CarE home reSidentS Randomized, Controlled Trial. Front. Immunol. 2021, 12, 643321. [Google Scholar] [CrossRef]
- Park, H.S. Lactobacillus rhamnosus LM1019 Strain and Composition for Preventing and Treating Obesity or Diabetes Mellitus Comprising Same. U.S. Patent 11,571,488 B2, 7 February 2023. [Google Scholar]
- Cho, Y.H.; Oh, S.J. Casein phosphopeptide-producing activity and proteolytic ability by some lactic acid bacteria. Korean J. Food Sci. Anim. Resour. 2010, 30, 443–448. [Google Scholar] [CrossRef]
- You, Y.; Kim, S.H.; Kim, C.H.; Kim, I.H.; Shin, Y.; Kim, T.R.; Sohn, M.; Park, J. Immune-Stimulating Potential of Lacticaseibacillus rhamnosus LM1019 in RAW 264.7 Cells and Immunosuppressed Mice Induced by Cyclophosphamide. Microorganisms 2023, 11, 2312. [Google Scholar] [CrossRef] [PubMed]
- Cohen, S.; Kamarck, T.; Mermelstein, R. A global measure of perceived stress. J. Health Soc. Behav. 1983, 24, 385–396. [Google Scholar] [CrossRef] [PubMed]
- Fink, L.N.; Zeuthen, L.H.; Christensen, H.R.; Morandi, B.; Frøkiaer, H.; Ferlazzo, G. Distinct gut-derived lactic acid bacteria elicit divergent dendritic cell-mediated NK cell responses. Int. Immunol. 2007, 19, 1319–1327. [Google Scholar] [CrossRef]
- Nagao, F.; Nakayama, M.; Muto, T.; Okumura, K. Effects of a fermented milk drink containing Lactobacillus casei strain Shirota on the immune system in healthy human subjects. Biosci. Biotechnol. Biochem. 2000, 64, 2706–2708. [Google Scholar] [CrossRef] [PubMed]
- Foligné, B.; Zoumpopoulou, G.; Dewulf, J.; Ben Younes, A.; Chareyre, F.; Sirard, J.-C.; Pot, B.; Grangette, C. A key role of dendritic cells in probiotic functionality. PLoS ONE 2007, 2, e313. [Google Scholar] [CrossRef]
- Cai, S.; Kandasamy, M.; Rahmat, J.N.; Tham, S.M.; Bay, B.H.; Lee, Y.K.; Mahendran, R. Lactobacillus rhamnosus GG activation of dendritic cells and neutrophils depends on the dose and time of exposure. J. Immunol. Res. 2016, 2016, 7402760. [Google Scholar] [CrossRef]
- Maggini, S.; Pierre, A.; Calder, P.C. Immune Function and Micronutrient Requirements Change over the Life Course. Nutrients 2018, 10, 1531. [Google Scholar] [CrossRef]
- Chandra, R.K. Nutrition and the immune system: An introduction. Am. J. Clin. Nutr. 1997, 66, 460S–463S. [Google Scholar] [CrossRef]
- Li, P.; Yin, Y.L.; Li, D.; Kim, S.W.; Wu, G. Amino acids and immune function. Br. J. Nutr. 2007, 98, 237–252. [Google Scholar] [CrossRef]
- Rolles, B.; Maywald, M.; Rink, L. Influence of zinc deficiency and supplementation on NK cell cytotoxicity. J. Funct. Foods 2018, 48, 322–328. [Google Scholar] [CrossRef]
- Amling, L.; Rink, L.; Bennstein, S.B. Short-term oral zinc supplementation enhances Natural Killer cell functionality and decreases circulating Innate Lymphoid Cell counts and frequencies in healthy young adults. J. Transl. Med. 2025, 23, 333. [Google Scholar] [CrossRef] [PubMed]
- Hanson, M.G.; Özenci, V.; Carlsten, M.C.; Glimelius, B.L.; Frödin, J.E.; Masucci, G.; Malmberg, K.J.; Kiessling, R.V. A short-term dietary supplementation with high doses of vitamin E increases NK cell cytolytic activity in advanced colorectal cancer patients. Cancer Immunol. Immunother. 2007, 56, 973–984. [Google Scholar] [CrossRef] [PubMed]
- Lee, G.Y.; Han, S.N. The Role of Vitamin E in Immunity. Nutrients 2018, 10, 1614. [Google Scholar] [CrossRef]
- Ha, C.; Miller, L.T.; Kerkvliet, N.I. The effect of vitamin B6 deficiency on cytotoxic immune responses of T cells, antibodies, and natural killer cells, and phagocytosis by macrophages. Cell. Immunol. 1984, 85, 318–329. [Google Scholar] [CrossRef]
- Schimmer, S.; Sridhar, V.; Satan, Z.; Grebe, A.; Saad, M.; Wagner, B.; Kahlert, N.; Werner, T.; Richter, D.; Dittmer, U.; et al. Iron improves the antiviral activity of NK cells. Front. Immunol. 2025, 15, 1526197. [Google Scholar] [CrossRef]


| LM1019 (n = 44) | Placebo (n = 54) | p-Value | |
|---|---|---|---|
| Sex | 0.4367(C) | ||
| Male | 11 (25.00%) | 10 (18.52%) | |
| Female | 33 (75.00%) | 44 (81.48%) | |
| Age (years) | 43.98 ± 10.52 | 43.76 ± 10.32 | 0.9181(T) |
| BMI (kg/m2) | 22.67 ± 2.59 | 22.18 ± 3.02 | 0.2099(W) |
| Systolic blood pressure (mmHg) | 116.73 ± 10.96 | 112.87 ± 12.16 | 0.1061(T) |
| Diastolic blood pressure (mmHg) | 69.55 ± 10.22 | 66.80 ± 9.12 | 0.1632(T) |
| Family history of immune diseases | 2 (4.55%) | 1 (1.85%) | 0.5860(F) |
| COVID-19 vaccination | 44 (100%) | 49 (90.74%) | 0.0626(F) |
| Alcohol consumers | 24 (54.55%) | 28 (51.85%) | 0.7904(C) |
| Tobacco users | |||
| Non-smokers | 43 (97.73%) | 51 (94.44%) | 0.4126(F) |
| Former smokers (>1 year) | 0 (0%) | 2 (3.70%) | |
| Former smokers (<1 year) | 0 (0%) | 1 (1.85%) | |
| Smokers | 1 (2.27%) | 0 (0%) | |
| Exercise | 0.6389(F) | ||
| No exercise | 8 (18.18%) | 8 (14.81%) | |
| 1–2 times/week | 19 (43.18%) | 27 (50.00%) | |
| 3–4 times/week | 11 (25.00%) | 10 (18.52%) | |
| 5–6 times/week | 2 (4.55%) | 6 (11.11%) | |
| 7 times/week | 4 (9.09%) | 3 (5.56%) | |
| PSS (point) | 26.20 ± 3.77 | 25.52 ± 3.83 | 0.2756(W) |
| Variables | LM1019 (n = 61) | Placebo (n = 60) | Between Groups (2) | ||||||
|---|---|---|---|---|---|---|---|---|---|
| Baseline | 8 Weeks | Within Group (1) | Baseline | 8 Weeks | Within Group (1) | ||||
| Vital Parameters | |||||||||
| Weight (kg) | 61.60 ± 11.02 | 61.74 ± 10.73 | 0.3230 | 59.52 ± 10.95 | 59.76 ± 11.41 | 0.1806 | 0.8879(T) | ||
| Systolic blood pressure (mmHg) | 118.07 ± 11.22 | 114.14 ± 12.90 | 0.0101 | 113.02 ± 12.16 | 111.32 ± 9.59 | 0.2037 | 0.3009(T) | ||
| Diastolic blood pressure (mmHg) | 69.93 ± 9.89 | 67.78 ± 10.47 | 0.0548 | 67.03 ± 8.86 | 66.40 ± 8.93 | 0.5343 | 0.3651(T) | ||
| Body temperature (°C) | 36.50 ± 0.12 | 36.50 ± 0.10 | 0.8253 | 36.51 ± 0.11 | 36.49 ± 0.10 | 0.1889 | 0.3646(W) | ||
| Heart rate (bpm) | 77.98 ± 10.93 | 76.53 ± 9.74 | 0.1806 | 79.80 ± 10.09 | 77.73 ± 8.93 | 0.1097 | 0.7114(T) | ||
| Hematology Test | |||||||||
| RBC (106/μL) | 4.49 ± 0.43 | 4.51 ± 0.50 | 0.5923 | 4.42 ± 0.37 | 4.37 ± 0.39 | 0.0688 | 0.0636(W) | ||
| Hemoglobin (g/dL) | 13.62 ± 1.33 | 13.72 ± 1.44 | 0.2637 | 13.37 ± 1.19 | 13.19 ± 1.29 | 0.0423 | 0.0265(T) | ||
| Hematocrit (%) | 41.40 ± 3.47 | 41.54 ± 4.02 | 0.6397 | 40.84 ± 3.34 | 39.99 ± 3.64 | 0.0063 | 0.0180(T) | ||
| Platelet (103/μL) | 266.26 ± 64.73 | 257.88 ± 55.82 | 0.2342 | 260.57 ± 54.27 | 265.42 ± 54.19 | 0.1880 | 0.0759(T) | ||
| Seg. Neutrophil (%) | 52.36 ± 8.84 | 53.27 ± 7.94 | 0.2286 | 50.96 ± 8.51 | 52.56 ± 7.39 | 0.1607 | 0.9464(W) | ||
| Lymphocyte (%) | 37.55 ± 7.82 | 36.75 ± 7.37 | 0.2283 | 38.27 ± 7.40 | 37.23 ± 7.23 | 0.2793 | 0.7961(W) | ||
| Monocyte (%) | 7.03 ± 1.90 | 6.74 ± 1.69 | 0.0679 | 6.95 ± 1.83 | 6.82 ± 1.80 | 0.4314 | 0.5234(T) | ||
| Eosinophil (%) | 2.28 ± 1.81 | 2.46 ± 1.66 | 0.3532 | 3.07 ± 3.11 | 2.65 ± 2.29 | 0.0722 | 0.0632(W) | ||
| Basophil (%) | 0.78 ± 0.36 | 0.77 ± 0.35 | 0.9576 | 0.75 ± 0.29 | 0.73 ± 0.34 | 0.5776 | 0.7056(T) | ||
| Blood Biochemical Test | |||||||||
| AST (U/L) | 21.77 ± 5.30 | 21.02 ± 4.91 | 0.0770 | 21.95 ± 6.12 | 23.08 ± 8.52 | 0.1756 | 0.0702(W) | ||
| ALT (U/L) | 17.03 ± 8.28 | 17.55 ± 8.66 | 0.9015 | 17.47 ± 10.83 | 20.02 ± 15.23 | 0.0297 | 0.2148(W) | ||
| γ-GTP (U/L) | 21.23 ± 9.93 | 22.50 ± 13.31 | 0.2242 | 19.48 ± 9.61 | 21.10 ± 12.46 | 0.0153 | 0.8901(W) | ||
| Glucose | 90.20 ± 8.87 | 90.81 ± 8.70 | 0.7760 | 88.23 ± 6.35 | 88.47 ± 7.82 | 0.7442 | 0.6778(W) | ||
| Total cholesterol (mg/dL) | 198.66 ± 30.75 | 194.07 ± 30.53 | 0.1941 | 191.92 ± 27.76 | 196.63 ± 32.98 | 0.1342 | 0.0743(W) | ||
| HDL cholesterol (mg/dL) | 59.52 ± 13.76 | 58.21 ± 13.27 | 0.4662 | 61.25 ± 11.34 | 63.43 ± 12.06 | 0.0352 | 0.0433(T) | ||
| LDL cholesterol (mg/dL) | 117.41 ± 26.44 | 112.93 ± 26.33 | 0.0651 | 110.97 ± 27.26 | 113.55 ± 31.34 | 0.2918 | 0.1536(W) | ||
| Triglyceride (mg/dL) | 93.57 ± 56.79 | 104.17 ± 69.47 | 0.0196 | 83.77 ± 45.69 | 82.05 ± 42.98 | 0.7272 | 0.1394(W) | ||
| hs-CRP (mg/L) | 0.58 ± 0.86 | 0.69 ± 1.29 | 0.6049 | 0.58 ± 0.96 | 0.52 ± 0.55 | 0.6027 | 0.1705(W) | ||
| ESR (mm/h) | 5.97 ± 7.31 | 6.67 ± 7.48 | 0.4067 | 6.03 ± 7.83 | 6.62 ± 7.25 | 0.2863 | 0.4636(W) | ||
| Urinalysis | |||||||||
| Protein | Normal | → | Normal (n = 41) | 0.3173 (M) | Normal | → | Normal (n= 45) | 0.7055 (M) | 0.0248(F) |
| Normal | → | Abnormal (n = 10) | Normal | → | Abnormal (n = 4) | ||||
| Abnormal | → | Normal (n = 6) | Abnormal | → | Normal (n = 3) | ||||
| Abnormal | → | Abnormal (n = 1) | Abnormal | → | Abnormal (n = 8) | ||||
| Glucose | Normal | → | Normal (n = 57) | - | Normal | → | Normal (n = 59) | - | 0.7436(F) |
| Normal | → | Abnormal (n = 0) | Normal | → | Abnormal (n = 1) | ||||
| Abnormal | → | Normal (n = 1) | Abnormal | → | Normal (n = 0) | ||||
| Abnormal | → | Abnormal (n = 0) | Abnormal | → | Abnormal (n = 0) | ||||
| Ketone | Normal | → | Normal (n = 57) | - | Normal | → | Normal (n = 58) | - | 1.0000(F) |
| Normal | → | Abnormal (n = 0) | Normal | → | Abnormal (n = 0) | ||||
| Abnormal | → | Normal (n = 1) | Abnormal | → | Normal (n = 2) | ||||
| Abnormal | → | Abnormal (n = 0) | Abnormal | → | Abnormal (n = 0) | ||||
| Erythrocytes | Normal | → | Normal (n = 38) | 0.6171 (M) | Normal | → | Normal (n = 49) | 0.4795 (M) | 0.1719(F) |
| Normal | → | Abnormal (n = 7) | Normal | → | Abnormal (n = 5) | ||||
| Abnormal | → | Normal (n = 9) | Abnormal | → | Normal (n = 3) | ||||
| Abnormal | → | Abnormal (n = 4) | Abnormal | → | Abnormal (n = 3) | ||||
| Leukocytes | Normal | → | Normal (n = 37) | - | Normal | → | Normal (n = 45) | - | - |
| Normal | → | Abnormal (n = 7) | Normal | → | Abnormal (n = 7) | ||||
| Abnormal | → | Normal (n = 5) | Abnormal | → | Normal (n = 5) | ||||
| Abnormal | → | Abnormal (n = 9) | Abnormal | → | Abnormal (n = 3) | ||||
| Nitrite | Normal | → | Normal (n = 54) | 0.3173 (M) | Normal | → | Normal (n = 58) | - | 0.0566(F) |
| Normal | → | Abnormal (n = 0) | Normal | → | Abnormal (n = 2) | ||||
| Abnormal | → | Normal (n = 1) | Abnormal | → | Normal (n = 0) | ||||
| Abnormal | → | Abnormal (n = 3) | Abnormal | → | Abnormal (n = 0) | ||||
| Variables | LM1019 (n = 44) | Placebo (n = 54) | Between Groups (2) | ||||
|---|---|---|---|---|---|---|---|
| Baseline | 8 Weeks | Within Group (1) | Baseline | 8 Weeks | Within Group (1) | ||
| NK cell activity (%) | |||||||
| E:T = 50:1 | 51.59 ± 10.84 | 60.63 ± 9.98 | <0.0001 | 52.00 ± 12.28 | 60.20 ± 9.51 | <0.0001 | 0.9289(W) |
| E:T = 25:1 | 38.86 ± 11.48 | 48.53 ± 11.20 | <0.0001 | 40.76 ± 13.29 | 48.51 ± 10.54 | <0.0001 | 0.4444(T) |
| E:T = 12.5:1 | 20.72 ± 8.48 | 28.28 ± 9.79 | <0.0001 | 23.99 ± 9.88 | 28.16 ± 7.82 | 0.0030 | 0.1511(W) |
| Cytokines (pg/mL) | |||||||
| IL-1β | 1.57 ± 1.00 | 1.38 ± 0.78 | 0.0626 | 2.14 ± 3.49 | 1.80 ± 2.27 | 0.0671 | 0.3933(W) |
| IL-2 | 0.75 ± 0.35 | 0.73 ± 0.33 | 0.7780 | 1.14 ± 2.54 | 0.98 ± 1.52 | 0.2534 | 0.4092(W) |
| IL-6 | 9.06 ± 15.66 | 7.53 ± 12.64 | 0.1063 | 11.64 ± 18.10 | 9.59 ± 14.55 | 0.0131 | 0.2274(W) |
| IL-12 | 3.95 ± 10.51 | 2.15 ± 2.44 | 0.1984 | 2.85 ± 6.79 | 2.70 ± 5.14 | 0.6468 | 0.6630(W) |
| IFN-γ | 6.73 ± 8.24 | 6.10 ± 6.18 | 0.3315 | 6.65 ± 6.93 | 6.84 ± 7.64 | 0.7833 | 0.1923(W) |
| TNF-α | 9.81 ± 4.87 | 8.84 ± 4.68 | 0.0757 | 10.39 ± 5.23 | 8.96 ± 4.75 | 0.0029 | 0.3914(W) |
| WBC count (103 cells/μL) | 5.33 ± 0.87 | 5.30 ± 1.20 | 0.8513 | 5.20 ± 1.00 | 4.98 ± 1.19 | 0.1625 | 0.5320(W) |
| URTI (case) | - | 1 | - | - | 2 | - | 1.0000(F) |
| FSS (point) | 4.88 ± 1.16 | 3.68 ± 1.00 | <0.0001 | 4.97 ± 0.92 | 3.82 ± 0.96 | <0.0001 | 0.3952(W) |
| Variables | LM1019 (n = 44) | Placebo (n = 54) | Between Groups (2) | ||||
|---|---|---|---|---|---|---|---|
| Baseline | 8 Weeks | Within Group (1) | Baseline | 8 Weeks | Within Group (1) | ||
| Nutritional Analysis | |||||||
| Energy intake (kcal) | 1474.50 ± 596.60 | 1679.81 ± 552.54 | 0.0219 | 1463.65 ± 485.52 | 1607.18 ± 335.96 | 0.0266 | 0.5559(T) |
| Carbohydrate (g) | 195.80 ± 66.38 | 220.25 ± 70.64 | 0.0293 | 202.59 ± 66.21 | 212.86 ± 52.22 | 0.2080 | 0.2869(T) |
| Protein (g) | 63.31 ± 37.65 | 67.68 ± 26. | 0.4486 | 58.52 ± 21.44 | 66.74 ± 16.37 | 0.0043 | 0.8723(W) |
| Fat (g) | 47.03 ± 30.14 | 56.64 ± 29.36 | 0.0598 | 44.28 ± 25.60 | 52.29 ± 18.83 | 0.0323 | 0.7915(T) |
| Dietary fiber (g) | 15.27 ± 7.76 | 16.79 ± 6.56 | 0.1463 | 14.87 ± 6.38 | 16.67 ± 5.85 | 0.0592 | 0.8949(W) |
| Ash (g) | 14.30 ± 6.23 | 14.93 ± 5.23 | 0.4489 | 12.87 ± 4.73 | 14.24 ± 3.31 | 0.0273 | 0.4637(T) |
| Vitamin A (μg) | 462.18 ± 317.05 | 522.97 ± 271.30 | 0.2678 | 392.02 ± 212.08 | 548.60 ± 232.97 | 0.0004 | 0.3261(W) |
| Vitamin B6 (mg) | 0.44 ± 0.42 | 0.54 ± 0.38 | 0.2628 | 0.36 ± 0.35 | 0.55 ± 0.29 | 0.0057 | 0.2921(W) |
| Vitamin B12 (μg) | 3.61 ± 4.41 | 4.01 ± 2.84 | 0.5533 | 3.77 ± 6.04 | 4.51 ± 6.90 | 0.0790 | 0.6971(W) |
| Vitamin C (mg) | 46.37 ± 64.52 | 58.01 ± 38.74 | 0.2914 | 49.78 ± 53.93 | 58.11 ± 39.27 | 0.3519 | 0.4554(W) |
| Vitamin D (μg) | 1.68 ± 2.42 | 1.69 ± 2.03 | 0.9798 | 0.88 ± 1.05 | 1.50 ± 1.21 | 0.0020 | 0.1973(W) |
| Vitamin E (mg) | 8.89 ± 5.94 | 9.71 ± 4.13 | 0.3727 | 8.22 ± 4.39 | 9.89 ± 4.14 | 0.0188 | 0.4511(W) |
| Beta-carotene (μg) | 1748.81 ± 1198.00 | 2131.89 ± 1044.68 | 0.0754 | 1590.54 ± 987.92 | 2340.80 ± 1358.65 | 0.0010 | 0.4862(W) |
| Calcium (mg) | 358.90 ± 181.35 | 420.14 ± 238.54 | 0.1431 | 359.31 ± 265.86 | 387.87 ± 144.63 | 0.4148 | 0.6605(W) |
| Phosphate (mg) | 900.40 ± 478.83 | 958.97 ± 371.74 | 0.4296 | 828.68 ± 336.18 | 950.96 ± 222.26 | 0.0043 | 0.5557(W) |
| Sodium (mg) | 3115.57 ± 1487.38 | 3206.38 ± 1233.22 | 0.6714 | 2805.14 ± 1215.31 | 2921.10 ± 827.99 | 0.4827 | 0.9244(T) |
| Potassium (mg) | 1903.27 ± 910.67 | 2080.52 ± 689.16 | 0.1828 | 1811.26 ± 656.52 | 2094.46 ± 561.02 | 0.0039 | 0.7615(W) |
| Iron (mg) | 10.82 ± 6.53 | 10.18 ± 4.30 | 0.6057 | 8.70 ± 3.86 | 10.25 ± 3.11 | 0.0085 | 0.2954(W) |
| Magnesium (mg) | 168.22 ± 82.75 | 178.78 ± 73.73 | 0.4373 | 158.70 ± 70.84 | 188.65 ± 67.23 | 0.0060 | 0.2512(T) |
| Zinc (mg) | 6.61 ± 3.85 | 6.94 ± 2.80 | 0.5407 | 5.72 ± 2.49 | 7.15 ± 2.58 | 0.0014 | 0.1924(W) |
| Subgroup Analyses | NK Cell Activity | Group | n | Baseline | 8 Weeks | Within Group (1) | Between Groups (2) |
|---|---|---|---|---|---|---|---|
| Age ≥ 40 | E:T = 50:1 | LM1019 | 35 | 51.69 ± 10.45 | 61.25 ± 10.59 | <0.0001 | 0.2540(W) |
| Placebo | 42 | 53.97 ± 11.60 | 60.27 ± 9.92 | 0.0008 | |||
| E:T = 25:1 | LM1019 | 35 | 39.26 ± 11.53 | 49.27 ± 11.90 | <0.0001 | 0.2139(W) | |
| Placebo | 42 | 42.96 ± 12.26 | 49.08 ± 10.83 | 0.0024 | |||
| E:T = 12.5:1 | LM1019 | 35 | 20.92 ± 8.85 | 26.17 ± 9.21 | <0.0001 | 0.0439(W) | |
| Placebo | 42 | 28.79 ± 10.40 | 28.85 ± 7.87 | 0.0902 | |||
| WBC ≥ 5.0 k | E:T = 50:1 | LM1019 | 31 | 51.29 ± 11.51 | 59.85 ± 9.42 | <0.0001 | 0.4978(T) |
| Placebo | 27 | 51.59 ± 13.51 | 58.11 ± 9.86 | 0.0118 | |||
| E:T = 25:1 | LM1019 | 31 | 38.18 ± 11.85 | 47.91 ± 11.88 | <0.0001 | 0.1694(T) | |
| Placebo | 27 | 40.67 ± 14.25 | 45.81 ± 10.78 | 0.0670 | |||
| E:T = 12.5:1 | LM1019 | 31 | 19.85 ± 8.53 | 27.86 ± 9.94 | <0.0001 | 0.0215(T) | |
| Placebo | 27 | 23.50 ± 9.97 | 26.00 ± 7.70 | 0.2209 | |||
| LDL < 130 mg/dL | E:T = 50:1 | LM1019 | 30 | 51.65 ± 12.03 | 61.28 ± 10.89 | <0.0001 | 0.1799(T) |
| Placebo | 45 | 53.83 ± 10.70 | 60.17 ± 8.87 | 0.0002 | |||
| E:T = 25:1 | LM1019 | 30 | 39.22 ± 12.24 | 48.68 ± 11.85 | 0.0001 | 0.2822(T) | |
| Placebo | 45 | 42.47 ± 12.38 | 48.81 ± 10.54 | 0.0015 | |||
| E:T = 12.5:1 | LM1019 | 30 | 21.70 ± 9.04 | 28.62 ± 10.44 | 0.0002 | 0.1246(W) | |
| Placebo | 45 | 25.22 ± 9.55 | 28.50 ± 8.06 | 0.0335 | |||
| Age ≥ 40, WBC ≥ 5.0 k, LDL < 130 mg/dL | E:T = 50:1 | LM1019 | 18 | 50.72 ± 12.33 | 60.98 ± 11.13 | 0.0004 | 0.0210(T) |
| Placebo | 17 | 55.58 ± 10.31 | 57.23 ± 8.87 | 0.5472 | |||
| E:T = 25:1 | LM1019 | 18 | 38.59 ± 13.11 | 48.76 ± 14.15 | 0.0032 | 0.0297(T) | |
| Placebo | 17 | 44.25 ± 11.21 | 44.55 ± 10.79 | 0.9276 | |||
| E:T = 12.5:1 | LM1019 | 18 | 21.07 ± 9.57 | 29.04 ± 11.57 | 0.0002 | 0.0080(T) | |
| Placebo | 17 | 26.24 ± 8.78 | 25.61 ± 7.98 | 0.8093 |
Disclaimer/Publisher’s Note: The statements, opinions and data contained in all publications are solely those of the individual author(s) and contributor(s) and not of MDPI and/or the editor(s). MDPI and/or the editor(s) disclaim responsibility for any injury to people or property resulting from any ideas, methods, instructions or products referred to in the content. |
© 2025 by the authors. Licensee MDPI, Basel, Switzerland. This article is an open access article distributed under the terms and conditions of the Creative Commons Attribution (CC BY) license (https://creativecommons.org/licenses/by/4.0/).
Share and Cite
Park, J.; You, Y.; Kim, S.-H.; Ku, H.-J.; Han, H.-J.; Kim, C.-H.; Kim, T.-R.; Sohn, M.; Kim, I.; Baeg, C. Lacticaseibacillus rhamnosus LM1019 Enhances Natural Killer Cell Activity in Defined Adult Subsets: A Double-Blind, Placebo-Controlled Trial. Life 2025, 15, 1002. https://doi.org/10.3390/life15071002
Park J, You Y, Kim S-H, Ku H-J, Han H-J, Kim C-H, Kim T-R, Sohn M, Kim I, Baeg C. Lacticaseibacillus rhamnosus LM1019 Enhances Natural Killer Cell Activity in Defined Adult Subsets: A Double-Blind, Placebo-Controlled Trial. Life. 2025; 15(7):1002. https://doi.org/10.3390/life15071002
Chicago/Turabian StylePark, Jeseong, Yeji You, Sung-Hwan Kim, Hye-Jin Ku, Hye-Jung Han, Chul-Hong Kim, Tae-Rahk Kim, Minn Sohn, Inah Kim, and Chaemin Baeg. 2025. "Lacticaseibacillus rhamnosus LM1019 Enhances Natural Killer Cell Activity in Defined Adult Subsets: A Double-Blind, Placebo-Controlled Trial" Life 15, no. 7: 1002. https://doi.org/10.3390/life15071002
APA StylePark, J., You, Y., Kim, S.-H., Ku, H.-J., Han, H.-J., Kim, C.-H., Kim, T.-R., Sohn, M., Kim, I., & Baeg, C. (2025). Lacticaseibacillus rhamnosus LM1019 Enhances Natural Killer Cell Activity in Defined Adult Subsets: A Double-Blind, Placebo-Controlled Trial. Life, 15(7), 1002. https://doi.org/10.3390/life15071002