
Normative Knee Range of Motion for Children


 , and
, and
Abstract
1. Introduction
2. Materials and Methods
2.1. Sample Size Estimation
2.2. Study Participants
2.3. Range of Motion Measurement
2.4. Anthropometric Measurements
2.5. Data Analysis
3. Results
4. Discussion
5. Conclusions
Author Contributions
Funding
Institutional Review Board Statement
Informed Consent Statement
Data Availability Statement
Conflicts of Interest
References
- D’souza, S.; Schnell, S. Reference measures of hip, knee and ankle range of motion in children aged 5–17 years. Gait Posture 2021, 90, 33–34. [Google Scholar] [CrossRef]
- Mudge, A.J.; Bau, K.V.; Purcell, L.N.; Wu, J.C.; Axt, M.W.; Selber, P.; Burns, J. Normative reference values for lower limb joint range, bone torsion, and alignment in children aged 4–16 years. J. Pediatr. Orthop. B 2014, 23, 15–25. [Google Scholar] [CrossRef] [PubMed]
- Hallaceli, H.; Uruc, V.; Uysal, H.H.; Ozden, R.; Hallaceli, C.; Soyuer, F.; Parpucu, T.I.; Yengil, E.; Cavlak, U. Normal hip, knee and ankle range of motion in the Turkish population. Acta Orthop. Traumatol. Turc. 2014, 48, 37–42. [Google Scholar] [CrossRef] [PubMed]
- McKay, M.J.; Baldwin, J.N.; Ferreira, P.; Simic, M.; Vanicek, N.; Burns, J.; For the 1000 Norms Project Consortium. Normative reference values for strength and flexibility of 1,000 children and adults. Neurology 2017, 88, 36–43. [Google Scholar] [CrossRef]
- Abu El Kasem, S.T.; Aly, S.M.; Kamel, E.M.; Hussein, H.M. Normal active range of motion of lower extremity joints of the healthy young adults in Cairo, Egypt. Bull. Fac. Phys. Ther. 2020, 25, 2. [Google Scholar] [CrossRef]
- Macedo, L.G.; Magee, D.J. Effects of age on passive range of motion of selected peripheral joints in healthy adult females. Physiother. Theory Pract. 2009, 25, 145–164. [Google Scholar] [CrossRef]
- Soucie, J.M.; Wang, C.; Forsyth, A.; Funk, S.; Denny, M.; Roach, K.E.; Boone, D.; Network, H.T.C. Range of motion measurements: Reference values and a database for comparison studies. Haemophilia 2011, 17, 500–507. [Google Scholar] [CrossRef]
- Fatoye, F.A.; Palmer, S.; Van der Linden, M.L.; Rowe, P.J.; Macmillan, F. Gait kinematics and passive knee joint range of motion in children with hypermobility syndrome. Gait Posture 2011, 33, 447–451. [Google Scholar] [CrossRef]
- Hansmann, S.; Benseler, S.M.; Kuemmerle-Deschner, J.B. Dynamic knee joint function in children with juvenile idiopathic arthritis (JIA). Pediatr. Rheumatol. 2015, 13, 8. [Google Scholar] [CrossRef]
- Kilgour, G.M.; McNair, P.J.; Stott, N.S. Range of motion in children with spastic diplegia, GMFCS I-II compared to age and gender matched controls. Phys. Occup. Ther. Pediatr. 2005, 25, 61–79. [Google Scholar] [CrossRef]
- Dimakopoulos, R.; Syrogiannopoulos, G.; Youroukos, S.; Dailiana, Z.; Spinou, A. Passive range of motion changes in young children with spastic diplegia. A study during the initial stages of independent walking. J. Pediatr. Rehabil. Med. 2019, 12, 151–159. [Google Scholar] [CrossRef] [PubMed]
- Khaled, A.M.; Mostafa, M.M.; Radwa, S.A.; Shaimaa, A.A. Relations between Knee Joint Range of Motion and Growth Motor Function Measure in Children with Hemiplegic Cerebral Palsy. Med. J. Cairo Univ. 2021, 89, 2821–2825. [Google Scholar] [CrossRef]
- Feldman, D.S.; Rand, T.J.; Huser, A.J. Novel Approach to Improving Knee Range of Motion in Arthrogryposis with a New Working Classification. Children 2021, 8, 546. [Google Scholar] [CrossRef] [PubMed]
- Low, W.M.-T.; Wang, S.-M.; Yeh, K.-K.; Chang, C.-H. Spontaneous decrease in gastrocnemius spasticity after correction of knee flexion gait in children with cerebral palsy. J. Orthop. Surg. 2019, 28, 2309499019890252. [Google Scholar] [CrossRef]
- Haberfehlner, H.; Maas, H.; Harlaar, J.; Newsum, I.E.; Becher, J.G.; Buizer, A.I.; Jaspers, R.T. Assessment of net knee moment-angle characteristics by instrumented hand-held dynamometry in children with spastic cerebral palsy and typically developing children. J. Neuroeng. Rehabil. 2015, 12, 67. [Google Scholar] [CrossRef]
- Broughton, N.S.; Wright, J.; Menelaus, M.B. Range of knee motion in normal neonates. J. Pediatr. Orthop. 1993, 13, 263–264. [Google Scholar]
- Drews, J.E.; Vraciu, J.K.; Pellino, G. Range of motion of the joints of the lower extremities of newborns. Phys. Occup. Ther. Pediatr. 1984, 4, 49–63. [Google Scholar] [CrossRef]
- Ahlberg, A.K.E.; Moussa, M.; Al-Nahdi, M. On geographical variations in the normal range of joint motion. Clin. Orthop. Relat. Res. 1988, 234, 229–231. [Google Scholar] [CrossRef]
- Norkin, C.C.; White, D.J. Measurement of Joint Motion: A Guide to Goniometry; FA Davis: Philadelphia, PA, USA, 2016. [Google Scholar]
- Cheng, J.C.Y.; Chan, P.S.; Hui, P.W. Joint laxity in children. J. Pediatr. Orthop. 1991, 11, 752–756. [Google Scholar] [CrossRef]
- Beighton, P.H.; Solomon, L.; Soskolne, C.L. Articular mobility in an African population. Ann. Rheum. Dis. 1973, 32, 413. [Google Scholar] [CrossRef]
- Steinberg, N.; Hershkovitz, I.; Peleg, S.; Dar, G.; Masharawi, Y.; Heim, M.; Siev-Ner, I. Range of joint movement in female dancers and nondancers aged 8 to 16 years: Anatomical and clinical implications. Am. J. Sports Med. 2006, 34, 814–823. [Google Scholar] [CrossRef] [PubMed]
- Loudon, J.K.; Goist, H.L.; Loudon, K.L. Genu recurvatum syndrome. J. Orthop. Sport. Phys. Ther. 1998, 27, 361–367. [Google Scholar] [CrossRef] [PubMed]
- Hall, M.G.; Ferrell, W.R.; Sturrock, R.D.; Hamblen, D.L.; Baxendale, R.H. The effect of the hypermobility syndrome on knee joint proprioception. Rheumatology 1995, 34, 121–125. [Google Scholar] [CrossRef]
- Almquist, P.O.; Ekdahl, C.; Isberg, P.; Fridén, T. Knee rotation in healthy individuals related to age and gender. J. Orthop. Res. 2013, 31, 23–28. [Google Scholar] [CrossRef]
- James, B.; Parker, A.W. Active and passive mobility of lower limb joints in elderly men and women. Am. J. Phys. Med. Rehabil. 1989, 68, 162–167. [Google Scholar] [CrossRef]
- Richmond, S.A.; Fukuchi, R.K.; Ezzat, A.; Schneider, K.; Schneider, G.; Emery, C.A. Are joint injury, sport activity, physical activity, obesity, or occupational activities predictors for osteoarthritis? A systematic review. J. Orthop. Sport. Phys. Ther. 2013, 43, 515-B19. [Google Scholar] [CrossRef]
- Vrezas, I.; Elsner, G.; Bolm-Audorff, U.; Abolmaali, N.; Seidler, A. Case–control study of knee osteoarthritis and lifestyle factors considering their interaction with physical workload. Int. Arch. Occup. Environ. Health 2010, 83, 291–300. [Google Scholar] [CrossRef]
- Teichtahl, A.J.; Wluka, A.E.; Wang, Y.; Urquhart, D.M.; Hanna, F.S.; Berry, P.A.; Jones, G.; Cicuttini, F.M. Occupational activity is associated with knee cartilage morphology in females. Maturitas 2010, 66, 72–76. [Google Scholar] [CrossRef]
- Escalante, A.; Lichtenstein, M.J.; Dhanda, R.; Cornell, J.E.; Hazuda, H.P. Determinants of hip and knee flexion range: Results from the San Antonio Longitudinal Study of Aging. Arthritis Care Res. 1999, 12, 8–18. [Google Scholar] [CrossRef]
- Lichtenstein, M.J.; Dhanda, R.; Cornell, J.E.; Escalante, A.; Hazuda, H.P. Modeling impairment: Using the disablement process as a framework to evaluate determinants of hip and knee flexion. Aging Clin. Exp. Res. 2000, 12, 208–220. [Google Scholar] [CrossRef]
- Sobti, A.; Cooper, C.; Inskip, H.; Searle, S.; Coggon, D. Occupational physical activity and long-term risk of musculoskeletal symptoms: A national survey of post office pensioners. Am. J. Ind. Med. 1997, 32, 76–83. [Google Scholar] [CrossRef]
- Park, W.; Ramachandran, J.; Weisman, P.; Jung, E.S. Obesity effect on male active joint range of motion. Ergonomics 2010, 53, 102–108. [Google Scholar] [CrossRef] [PubMed]
- Amin, S.; Goggins, J.; Niu, J.; Guermazi, A.; Grigoryan, M.; Hunter, D.J.; Genant, H.K.; Felson, D.T. Occupation-related squatting, kneeling, and heavy lifting and the knee joint: A magnetic resonance imaging-based study in men. J. Rheumatol. 2008, 35, 1645–1649. [Google Scholar]
- Mossberg, K.A.; Smith, L.K. Axial rotation of the knee in women. J. Orthop. Sport. Phys. Ther. 1983, 4, 236–240. [Google Scholar] [CrossRef]
- ISO 15535: 2008; General Requirements for Establishing Anthropometric Databases. ISO: Geneva, Switzerland, 2008; pp. 5–9.
- Pheasant, S.; Haslegrave, C.M. Bodyspace: Anthropometry, Ergonomics and the Design of Work; CRC Press: Boca Raton, FL, USA, 2016; ISBN 1420055895. [Google Scholar]
- Singh, J.A.; Siddiqi, M.; Parameshwar, P.; Chandra-Mouli, V. World Health Organization guidance on ethical considerations in planning and reviewing research studies on sexual and reproductive health in adolescents. J. Adolesc. Health 2019, 64, 427–429. [Google Scholar] [CrossRef]
- Kato, M.; Echigo, A.; Ohta, H.; Ishiai, S.; Aoki, M.; Tsubota, S.; Uchiyama, E. The accuracy of goniometric measurements of proximal interphalangeal joints in fresh cadavers: Comparison between methods of measurement, types of goniometers, and fingers. J. Hand Ther. 2007, 20, 12–19. [Google Scholar] [CrossRef]
- Ahlbäck, S.-O.; Lindahl, O. Sagittal mobility of the hip-joint. Acta Orthop. Scand. 1964, 34, 310–322. [Google Scholar] [CrossRef]
- Milani, P.; Coccetta, C.A.; Rabini, A.; Sciarra, T.; Massazza, G.; Ferriero, G. Mobile smartphone applications for body position measurement in rehabilitation: A review of goniometric tools. PM&R 2014, 6, 1038–1043. [Google Scholar]
- Piriyaprasarth, P.; Morris, M.E. Psychometric properties of measurement tools for quantifying knee joint position and movement: A systematic review. Knee 2007, 14, 2–8. [Google Scholar] [CrossRef]
- Gogia, P.P.; Braatz, J.H.; Rose, S.J.; Norton, B.J. Reliability and validity of goniometric measurements at the knee. Phys. Ther. 1987, 67, 192–195. [Google Scholar] [CrossRef]
- Enwemeka, C.S. Radiographic verification of knee goniometry. Scand. J. Rehabil. Med. 1986, 18, 47–49. [Google Scholar] [CrossRef] [PubMed]
- Naylor, J.M.; Ko, V.; Adie, S.; Gaskin, C.; Walker, R.; Harris, I.A.; Mittal, R. Validity and reliability of using photography for measuring knee range of motion: A methodological study. BMC Musculoskelet. Disord. 2011, 12, 77. [Google Scholar] [CrossRef]
- Afifi, M.; Abdulazeez, M.U.; Aminian, K.; Stylianides, G.A.; Abdullah, K.A. A protocol for obtaining upper and lower extremity joints’ range of motion in children using three-dimensional motion analysis system. Front. Physiol. 2024, 15, 1416175. [Google Scholar] [CrossRef] [PubMed]
- Doege, T.C.; Houston, T.P. AMA Guides® to the Evaluation of Permanent Impairment, 4th ed.; American Medical Association: Chicago, IL, USA, 1993; ISBN 0899705537. [Google Scholar]
- Cocchiarella, L.; Andersson, G.B.J. AMA Guides® to the Evaluation of Permanent Impairment, 5th ed.; American Medical Association: Chicago, IL, USA, 2001; ISBN 1579470858. [Google Scholar]
- Johnson, C.L.; Paulose-Ram, R.; Ogden, C.L.; Carroll, M.D.; Kruszan-Moran, D.; Dohrmann, S.M.; Curtin, L.R. National Health and Nutrition Examination Survey. Analytic Guidelines, 1999–2010; National Center for Health Statistics: Hyattsville, MD, USA, 2013.
- The Population Division of the Department of Economic and Social Affairs. World Population Prospects 2022: Summary of Results; The Population Division of the Department of Economic and Social Affairs: New York, NY, USA, 2022; Available online: https://www.un.org/development/desa/pd/sites/www.un.org.development.desa.pd/files/wpp2022_summary_of_results.pdf (accessed on 28 October 2024).
- Scott, A.; Zwerver, J.; Grewal, N.; de Sa, A.; Alktebi, T.; Granville, D.J.; Hart, D.A. Lipids, adiposity and tendinopathy: Is there a mechanistic link? Critical review. Br. J. Sports Med. 2015, 49, 984–988. [Google Scholar] [CrossRef] [PubMed]
- Gaida, J.E.; Ashe, M.C.; Bass, S.L.; Cook, J.L. Is adiposity an under-recognized risk factor for tendinopathy? A systematic review. Arthritis Care Res. Off. J. Am. Coll. Rheumatol. 2009, 61, 840–849. [Google Scholar] [CrossRef]
- Barker, K.L.; Simpson, A.; Lamb, S.E. Loss of knee range of motion in leg lengthening. J. Orthop. Sport. Phys. Ther. 2001, 31, 238–246. [Google Scholar] [CrossRef]
- Manikowska, F.; Brazevic, S.; Jóźwiak, M.; Lebiedowska, M. Impairments restricted knee flexion during gait in a child with cerebral palsy. Rheumatol. Forum 2022, 8, 178–184. [Google Scholar]
- Lerner, Z.F.; Damiano, D.L.; Bulea, T.C. The effects of exoskeleton assisted knee extension on lower-extremity gait kinematics, kinetics, and muscle activity in children with cerebral palsy. Sci. Rep. 2017, 7, 13512. [Google Scholar] [CrossRef]
- Pace, J.L.; Nasreddine, A.Y.; Simoni, M.; Zurakowski, D.; Kocher, M.S. Dynamic splinting in children and adolescents with stiffness after knee surgery. J. Pediatr. Orthop. 2018, 38, 38–43. [Google Scholar] [CrossRef]
- Jo, S.M.A.; Nishizaki, M.N.; Yamamoto, C.H.; Barbosa, V.L.P.; Sauer, J.F. Obesity effect on children hip and knee range of motion. Int. J. Clin. Med. 2014, 2014, 490–497. [Google Scholar]
- Gayito, R.C.; Haoudou, R.; Priuli, G.; Elbaum, R.; Dusabe, J.-P.; Moungondo, F.; Pirotte, T.; Docquier, P.-L. Management of severe knee extension stiffness in children: Particularity in sub-Saharan Africa. Acta Orthop. Belg. 2020, 86, 23–27. [Google Scholar]
- Clarkson, H. Musculoskeletal Assessment: Joint Range of Motion, Muscle Testing, and Function; Lippincott Williams & Wilkins: Philadelphia, PA, USA, 2020; ISBN 1975166302. [Google Scholar]
- Holzgreve, F.; Maurer-Grubinger, C.; Isaak, J.; Kokott, P.; Mörl-Kreitschmann, M.; Polte, L.; Solimann, A.; Weßler, L.; Filmann, N.; van Mark, A. The acute effect in performing common range of motion tests in healthy young adults: A prospective study. Sci. Rep. 2020, 10, 21722. [Google Scholar] [CrossRef] [PubMed]
- Moromizato, K.; Kimura, R.; Fukase, H.; Yamaguchi, K.; Ishida, H. Whole-body patterns of the range of joint motion in young adults: Masculine type and feminine type. J. Physiol. Anthropol. 2016, 35, 23. [Google Scholar] [CrossRef] [PubMed]
- Borstad, J.D. Resting position variables at the shoulder: Evidence to support a posture-impairment association. Phys. Ther. 2006, 86, 549–557. [Google Scholar] [CrossRef]
- Reese, N.B.; Bandy, W.D. Joint Range of Motion and Muscle Length Testing-E-Book; Elsevier Health Sciences: Amsterdam, The Netherlands, 2016; ISBN 0323291554. [Google Scholar]
- Ajja, R.; Wikkeling-Scott, L.F.; Brazendale, K.; Hijazi, R.; Abdulle, A. Accelerometer measured physical activity patterns of children during segmented school day in Abu Dhabi. BMC Pediatr. 2021, 21, 182. [Google Scholar] [CrossRef]
- Alrahma, A.M.; Al Suwaidi, H.; AlGurg, R.; Farah, Z.; Khansaheb, H.; Ajja, R.; Alzaabi, M.; Al Hamiz, A.; Aljunaibi, A.; Abdulle, A. Results from the United Arab Emirates 2022 report card on physical activity for children and adolescents. J. Exerc. Sci. Fit. 2023, 21, 218–225. [Google Scholar] [CrossRef]
- Paulo, M.S.; Nauman, J.; Abdulle, A.; Aljunaibi, A.; Alzaabi, M.; Barakat-Haddad, C.; Sheek-Hussein, M.; Shah, S.M.; Yousufzai, S.; Loney, T. Results from the United Arab Emirates’ 2018 report card on physical activity for children and youth. J. Phys. Act. Health 2018, 15, S419–S421. [Google Scholar] [CrossRef]
- Watkins, J. Structure and Function of the Musculoskeletal System; Human Kinetics: Champaign, IL, USA, 2010. [Google Scholar]
- Fonvig, C.E. Physical Activity, Sedentary Behavior, and the Relationship Between Gross Motor Function and Passive Range of Motion in Ambulant/Semi-Ambulant Children and Adolescents with Cerebral Palsy. Ph.D. Thesis, University of Southern Denmark, Odense, Denmark, 2023. [Google Scholar]
- Murata, C.; Kataoka, H.; Aoki, H.; Nakashima, S.; Nakagawa, K.; Goto, K.; Yamashita, J.; Okita, S.; Takahashi, A.; Honda, Y. The Relationship Between Physical Activity and Limited Range of Motion in the Older Bedridden Patients. Can. Geriatr. J. 2023, 26, 1. [Google Scholar] [CrossRef]
- Schramm, T.M. The Relationship Between Physical Activity and Flexibility. Master’s Thesis, University of Nebraska, Lincoln, NE, USA, 1998. [Google Scholar]
- Asgari, M. Crash injury analysis of knee joint considering pedestrian safety. J. Biomed. Phys. Eng. 2019, 9, 569. [Google Scholar] [CrossRef]
- Kiapour, A.; Kiapour, A.M.; Kaul, V.; Quatman, C.E.; Wordeman, S.C.; Hewett, T.E.; Demetropoulos, C.K.; Goel, V.K. Finite element model of the knee for investigation of injury mechanisms: Development and validation. J. Biomech. Eng. 2014, 136, 11002. [Google Scholar] [CrossRef]
- Sun, J.; Yan, S.; Jiang, Y.; Wong, D.W.; Zhang, M.; Zeng, J.; Zhang, K. Finite element analysis of the valgus knee joint of an obese child. Biomed. Eng. Online 2016, 15, 309–321. [Google Scholar] [CrossRef]

| Characteristic | Gender | p-Value | |||
|---|---|---|---|---|---|
| Girls | Boys | ||||
| N | % | N | % | ||
| Age Group | 0.133 | ||||
| 3–9 | 112 | 55.7% | 89 | 44.3% | |
| 10–12 | 43 | 45.7% | 51 | 54.3% | |
| Ethnicity | <0.001 | ||||
| Arab | 55 | 42.3% | 75 | 57.7% | |
| South Asian | 98 | 62.4% | 59 | 37.6% | |
| Other | 2 | 25.0% | 6 | 75.0% | |
| Age (years), median (IQR) | 8.0 | (6.0, 10.0) | 8.0 | (7.0, 11.0) | 0.021 |
| BMI (kg/m2), median (IQR) | 16.0 | (14.3, 18.5) | 16.2 | (14.8, 19.0) | 0.255 |
| Knee ROM # | Age Group | |
|---|---|---|
| Children * | Adolescents * | |
| Boys | ||
| Passive Flexion | 128.5 (114.3, 136.9) | 125.7 (114.6, 135.4) |
| Active Flexion | 124.9 (113.4, 132.9) | 123.3 (114.8, 131.7) |
| Passive Extension | 2.3 (−0.5, 3.9) | 2.2 (−1.1, 5.4) |
| Active Extension | 1.3 (−3.8, 5.2) | 1.0 (−4.3, 6.8) |
| PROM | 131.3 (116.5, 141.1) | 129.9 (118.1, 139.3) |
| AROM | 129.4 (118.4, 138.0) | 128.2 (119.3, 137.1) |
| Girls | ||
| Passive Flexion | 129.6 (115.5, 136.8) | 125.8 (116.9, 134.5) |
| Active Flexion | 125.1 (115.4, 133.2) | 125.1 (117.2, 131.7) |
| Passive Extension | 1.9 (−2.0, 4.5) | 2.8 (−1.1, 6.5) |
| Active Extension | 0.5 (−4.7, 4.3) | 1.7 (−5.0, 4.8) |
| PROM | 133.5 (119.6, 141.7) | 130.8 (123.0, 138.7) |
| AROM | 131.0 (120.3, 137.4) | 129.8 (123.2, 137.4) |
| Active Extension Versus Passive Extension | Active Flexion Versus Passive Flexion | AROM Versus PROM | |||||||
|---|---|---|---|---|---|---|---|---|---|
| Active Extension * | Passive Extension * | p-Value | Active Flexion * | Passive Flexion * | p-Value | AROM * | PROM * | p-Value | |
| Median (IQR) | 0.8 (−4.3, 4.7) | 2.2 (−1.1, 4.5) | <0.001 | 124.6 (114.8, 132.5) | 127.9 (115.2, 135.9) | <0.001 | 129.9 (120.1, 137.7) | 131.7 (118.9, 140.3) | <0.001 |
| ROM * | Age Group | p-Value | Gender | p-Value | Ethnicity | p-Value | |||
|---|---|---|---|---|---|---|---|---|---|
| Children | Adolescents | Girls | Boys | Arab | South Asian | ||||
| PF | 128.7 (115.1, 136.8) | 125.8 (115.4, 134.7) | 0.282 | 128.5 (116.6, 136.0) | 127.9 (114.5, 135.7) | 0.546 | 130.2 (120.0, 138.6) | 123.8 (112.9, 134.3) | <0.001 |
| PE | 2.1 (−1.0, 4.1) | 2.8 (−1.1, 6.0) | 0.152 | 2.4 (−1.4, 5.4) | 2.2 (−0.4, 4.2) | 0.978 | 2.7 (0.3, 4.3) | 1.9 (−1.5, 4.9) | 0.401 |
| AF | 124.9 (114.3, 133.1) | 123.7 (115.6, 131.7) | 0.747 | 125.1 (115.6, 132.5) | 124.2 (113.5, 132.5) | 0.594 | 126.8 (117.0, 134.5) | 122.5 (111.6, 131.2) | 0.005 |
| AE | 0.7 (−4.2, 4.6) | 1.2 (−4.7, 5.2) | 0.585 | 0.7 (−4.7, 4.4) | 1.3 (−3.9, 5.3) | 0.394 | 1.8 (−2.1, 5.7) | −1.6 (−5.1, 4.5) | 0.017 |
| PROM | 132.2 (118.6, 141.2) | 130.8 (119.9, 139.3) | 0.528 | 132.8 (120.9, 140.3) | 131.2 (117.2, 140.2) | 0.194 | 134.2 (124.3, 142.0) | 129.5 (116.9, 138.0) | <0.001 |
| AROM | 130.2 (119.5, 137.8) | 128.6 (121.5, 137.4) | 0.878 | 130.5 (120.9, 137.4) | 129.3 (118.8, 137.9) | 0.344 | 131.3 (123.3, 137.9) | 127.4 (118.1, 137.1) | 0.046 |
| Parameter | Nationality | p-Value | |
|---|---|---|---|
| USA | UAE | ||
| Age (Years) * | 7.0 (4.0, 9.0) | 8.0 (6.0, 10.0) | <0.001 |
| Gender | 0.092 | ||
| Boys | 78 | 140 | |
| Girls | 61 | 155 | |
| Body Mass (kg) * | 23.2 (17.3, 32.5) | 27.7 (20.9, 36.7) | <0.001 |
| Height (cm) * | 122.0 (104.0, 137.0) | 130.0 (119.1, 142.4) | <0.001 |
| BMI (kg/m2) * | 16.5 (15.2, 17.7) | 16.1 (14.6, 18.7) | 0.442 |
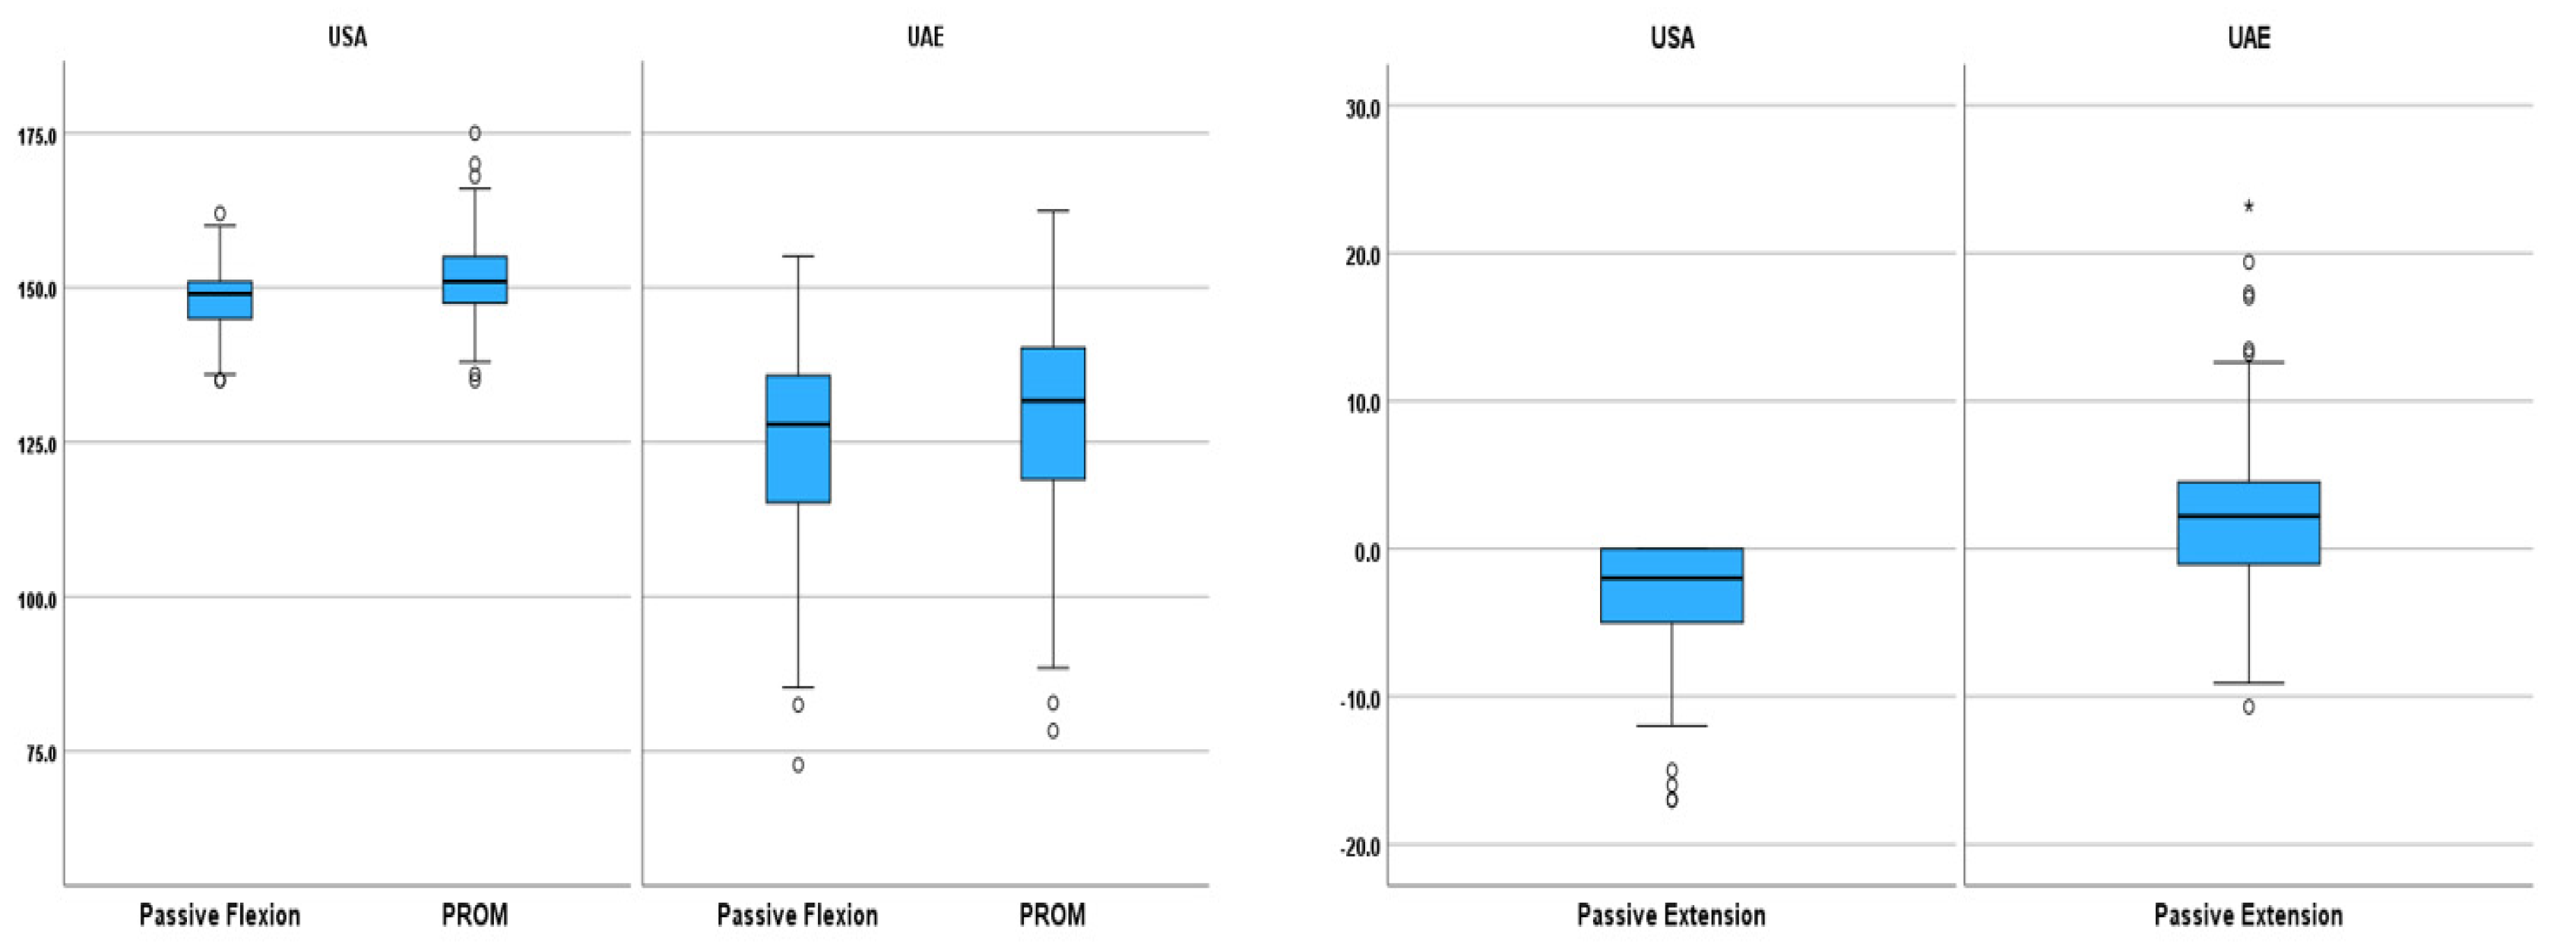
| Passive Flexion *,# | 149.0 (145.0, 151.0) | 127.9 (115.2, 135.9) | <0.001 |
| Passive Extension *,# | −2 (−5.0, 0.0) | 2.2 (−1.1, 4.5) | <0.001 |
| PROM *,# | 151.0 (147.0, 155.0) | 131.7 (118.9, 140.3) | <0.001 |
| Parameters | Passive Flexion | Passive Extension | PROM | Active Flexion | Active Extension | AROM |
|---|---|---|---|---|---|---|
| Age (years) | −0.139 * | 0.109 | −0.093 | −0.065 | 0.057 | −0.047 |
| Body Mass (kg) | −0.218 ** | 0.080 | −0.171 ** | −0.167 ** | 0.080 | −0.151 ** |
| Height (cm) | −0.152 ** | 0.107 | −0.104 | −0.099 | 0.099 | −0.077 |
| BMI (kg/m2) | −0.251 ** | 0.026 | −0.224 ** | −0.224 ** | 0.042 | −0.222 ** |
| Waist Circumference (cm) | −0.286 ** | 0.065 | −0.216 ** | −0.238 ** | 0.079 | −0.186 ** |
| Buttock-Popliteal Length (cm) | −0.096 | 0.080 | −0.079 | −0.071 | 0.033 | −0.066 |
| Thigh Circumference (cm) | −0.174 ** | −0.003 | −0.145 * | −0.136 ** | 0.019 | −0.136 * |
| Knee Height (cm) | −0.200 ** | 0.075 | −0.152 ** | −0.134 * | 0.063 | −0.114 * |
| Functional Leg Length (cm) | −0.171 ** | 0.113 | −0.118 * | −0.118 * | 0.081 | −0.096 |
| Buttock-Knee Length (cm) | −0.130 * | 0.088 | −0.083 | −0.070 | 0.048 | −0.044 |
| Thigh Depth (cm) | −0.279 ** | 0.021 | −0.238 ** | −0.246 ** | 0.045 | −0.215 ** |
| Study | Sample Size | Age Group | Passive Flexion # | Passive Extension # | Active Flexion # | Active Extension # |
|---|---|---|---|---|---|---|
| Current study | 295 | 3–12 | 125.5(14.0) * | 2.3(4.7) * | 122.6(13.4) * | 0.9(6.5) * |
| Current study | 123 | 3–7 | 128.1(12.7) c | 1.7(4.2) c | 123.8(13.6) c | 0.4(5.9) c |
| Current study | 172 | 8–12 | 123.7(14.7) d | 2.7(5.0) d | 121.7(13.4) d | 1.3(6.9) d |
| [1] | 34 | 6–16 | 156.6(4.1) * | 4.3(4.4) * | - | - |
| [1] | 16 | 6–16 | 158.0(3.2) a | 4.4(4.4) a | - | - |
| [1] | 18 | 6–16 | 155.4(4.6) b | 4.2(4.5) b | - | - |
| [7] | 39 | 2–8 | 152.6(4.5) a | 5.4(4.9) a | - | - |
| [7] | 55 | 2–8 | 147.8(4.7) b | 1.6(2.5) b | - | - |
| [7] | 56 | 9–19 | 142.3(5.7) a | 2.4(3.5) a | - | - |
| [7] | 48 | 9–19 | 142.2(6.3) b | 1.8(3.2) b | - | - |
| [2] | 53 | 4–16 | - | 4.0(5.0)* | - | - |
| [2] | 20 | 4–7 | - | 5.0(4.0) c | - | - |
| [2] | 17 | 8–11 | - | 4.0(6.0) d | - | - |
| [2] | 16 | 12–16 | - | 1.0(4.0) e | - | - |
| [4] | 70 | 3–9 | - | - | 145.0(5.5) b | 4.0(3.3) b |
| [4] | 70 | 3–9 | - | - | 144.0(5.7) a | 4.0(3.9) a |
| [4] | 80 | 10–19 | - | - | 140.0(6.7) b | 2.0(2.6) b |
| [4] | 80 | 10–19 | - | - | 142.0(6.6) a | 2.0(2.6) a |
| [10] | 22 | 6–17 | - | 1.4(6.4) f | - | - |
| [10] | 22 | 6–17 | - | −3.6(3.6) g | - | - |
Disclaimer/Publisher’s Note: The statements, opinions and data contained in all publications are solely those of the individual author(s) and contributor(s) and not of MDPI and/or the editor(s). MDPI and/or the editor(s) disclaim responsibility for any injury to people or property resulting from any ideas, methods, instructions or products referred to in the content. |
© 2025 by the authors. Licensee MDPI, Basel, Switzerland. This article is an open access article distributed under the terms and conditions of the Creative Commons Attribution (CC BY) license (https://creativecommons.org/licenses/by/4.0/).
Share and Cite
Abdulazeez, M.U.; Alhefeiti, M.; Alhammadi, S.; Alnuaimi, H.; Abdullahi, A.S.; Shaikhoun, L.; Aminian, K.; Stylianides, G.A.; Abdullah, K.A. Normative Knee Range of Motion for Children. Life 2025, 15, 1000. https://doi.org/10.3390/life15071000
Abdulazeez MU, Alhefeiti M, Alhammadi S, Alnuaimi H, Abdullahi AS, Shaikhoun L, Aminian K, Stylianides GA, Abdullah KA. Normative Knee Range of Motion for Children. Life. 2025; 15(7):1000. https://doi.org/10.3390/life15071000
Chicago/Turabian StyleAbdulazeez, Muhammad Uba, Maryam Alhefeiti, Shahad Alhammadi, Hajar Alnuaimi, Aminu Sabo Abdullahi, Lobna Shaikhoun, Kamiar Aminian, Georgios Antoniou Stylianides, and Kassim Abdulrahman Abdullah. 2025. "Normative Knee Range of Motion for Children" Life 15, no. 7: 1000. https://doi.org/10.3390/life15071000
APA StyleAbdulazeez, M. U., Alhefeiti, M., Alhammadi, S., Alnuaimi, H., Abdullahi, A. S., Shaikhoun, L., Aminian, K., Stylianides, G. A., & Abdullah, K. A. (2025). Normative Knee Range of Motion for Children. Life, 15(7), 1000. https://doi.org/10.3390/life15071000