
Atherogenic Risk and Its Association with Alcohol Consumption, Lifestyle Habits, and Sociodemographic Factors in a Population of Spanish Workers

 , , ,
, , ,  , ,
, ,
Abstract
:1. Introduction
2. Methods
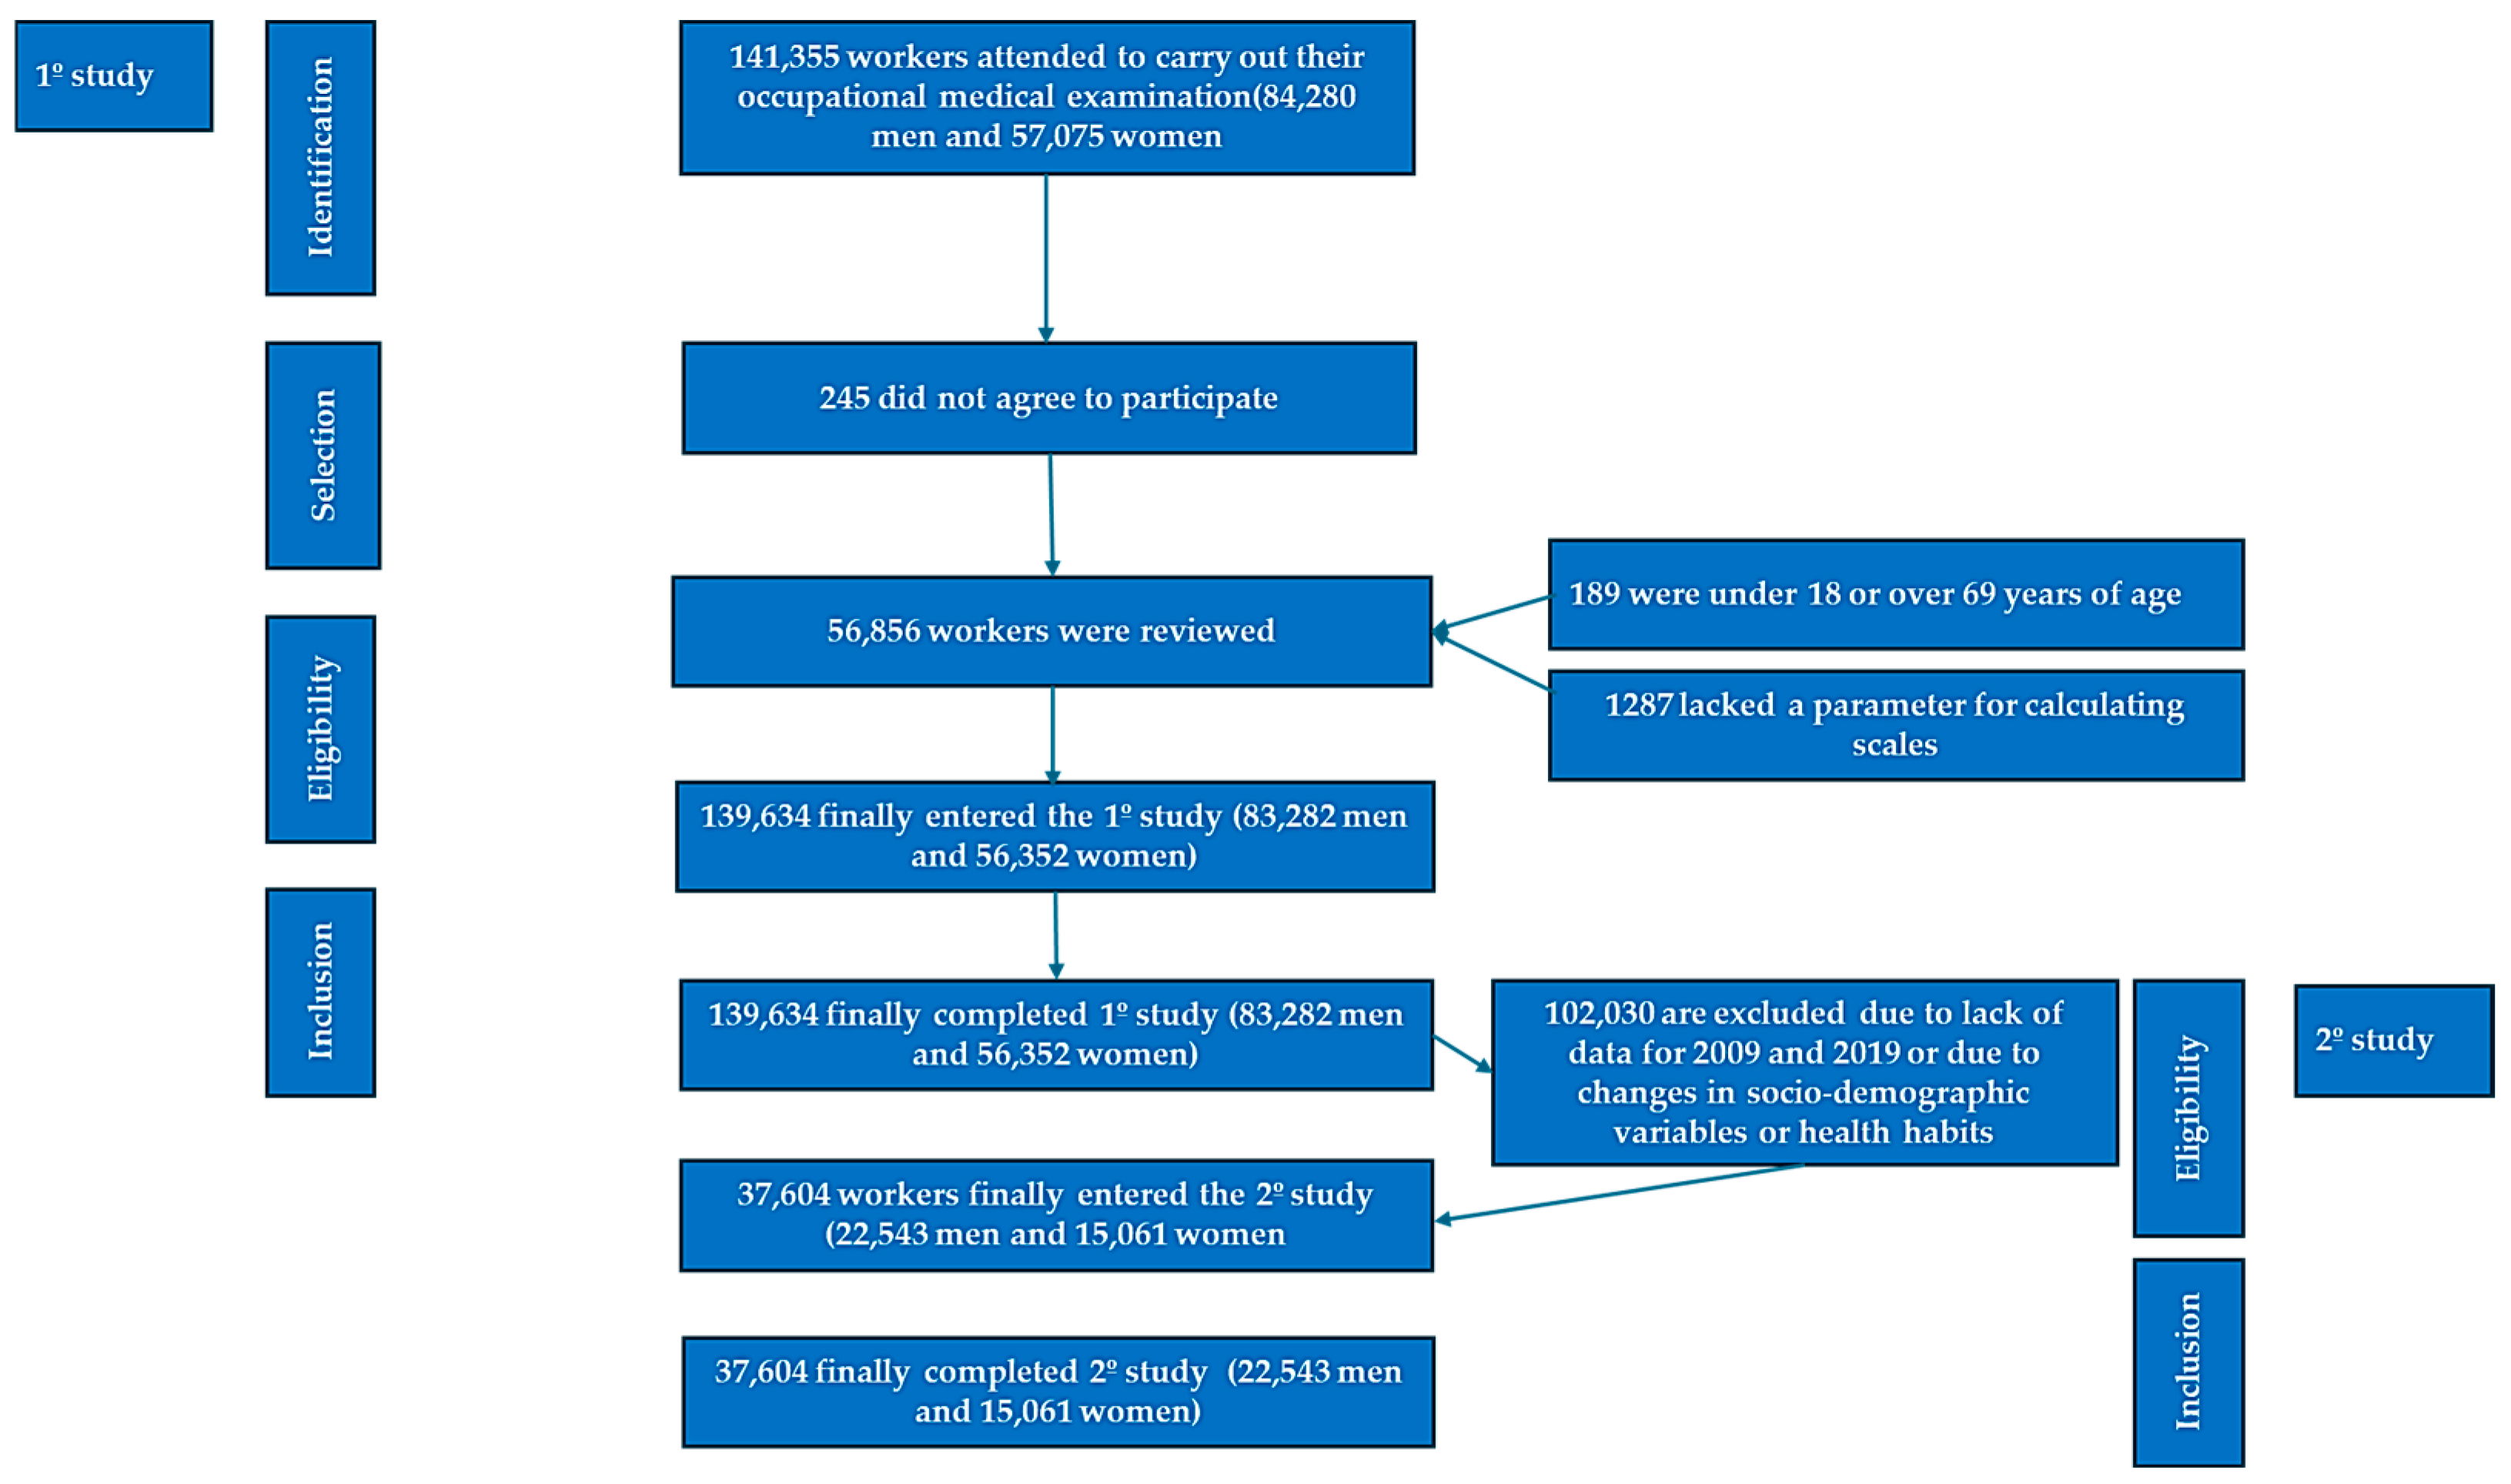
2.1. Study Design and Population
- Age between 18 and 69 years, corresponding to the active working population;
- Active employment status at the time of assessment, without any recorded temporary incapacity;
- Availability of complete data to compute the various atherogenic risk scores;
- Provision of informed consent authorizing the use of anonymized data for epidemiological research purposes;
- For the longitudinal component, availability of comprehensive data for both 2009 and 2019, and no recorded changes in sociodemographic attributes or health behaviors during this interval.
2.2. Variable Assessment
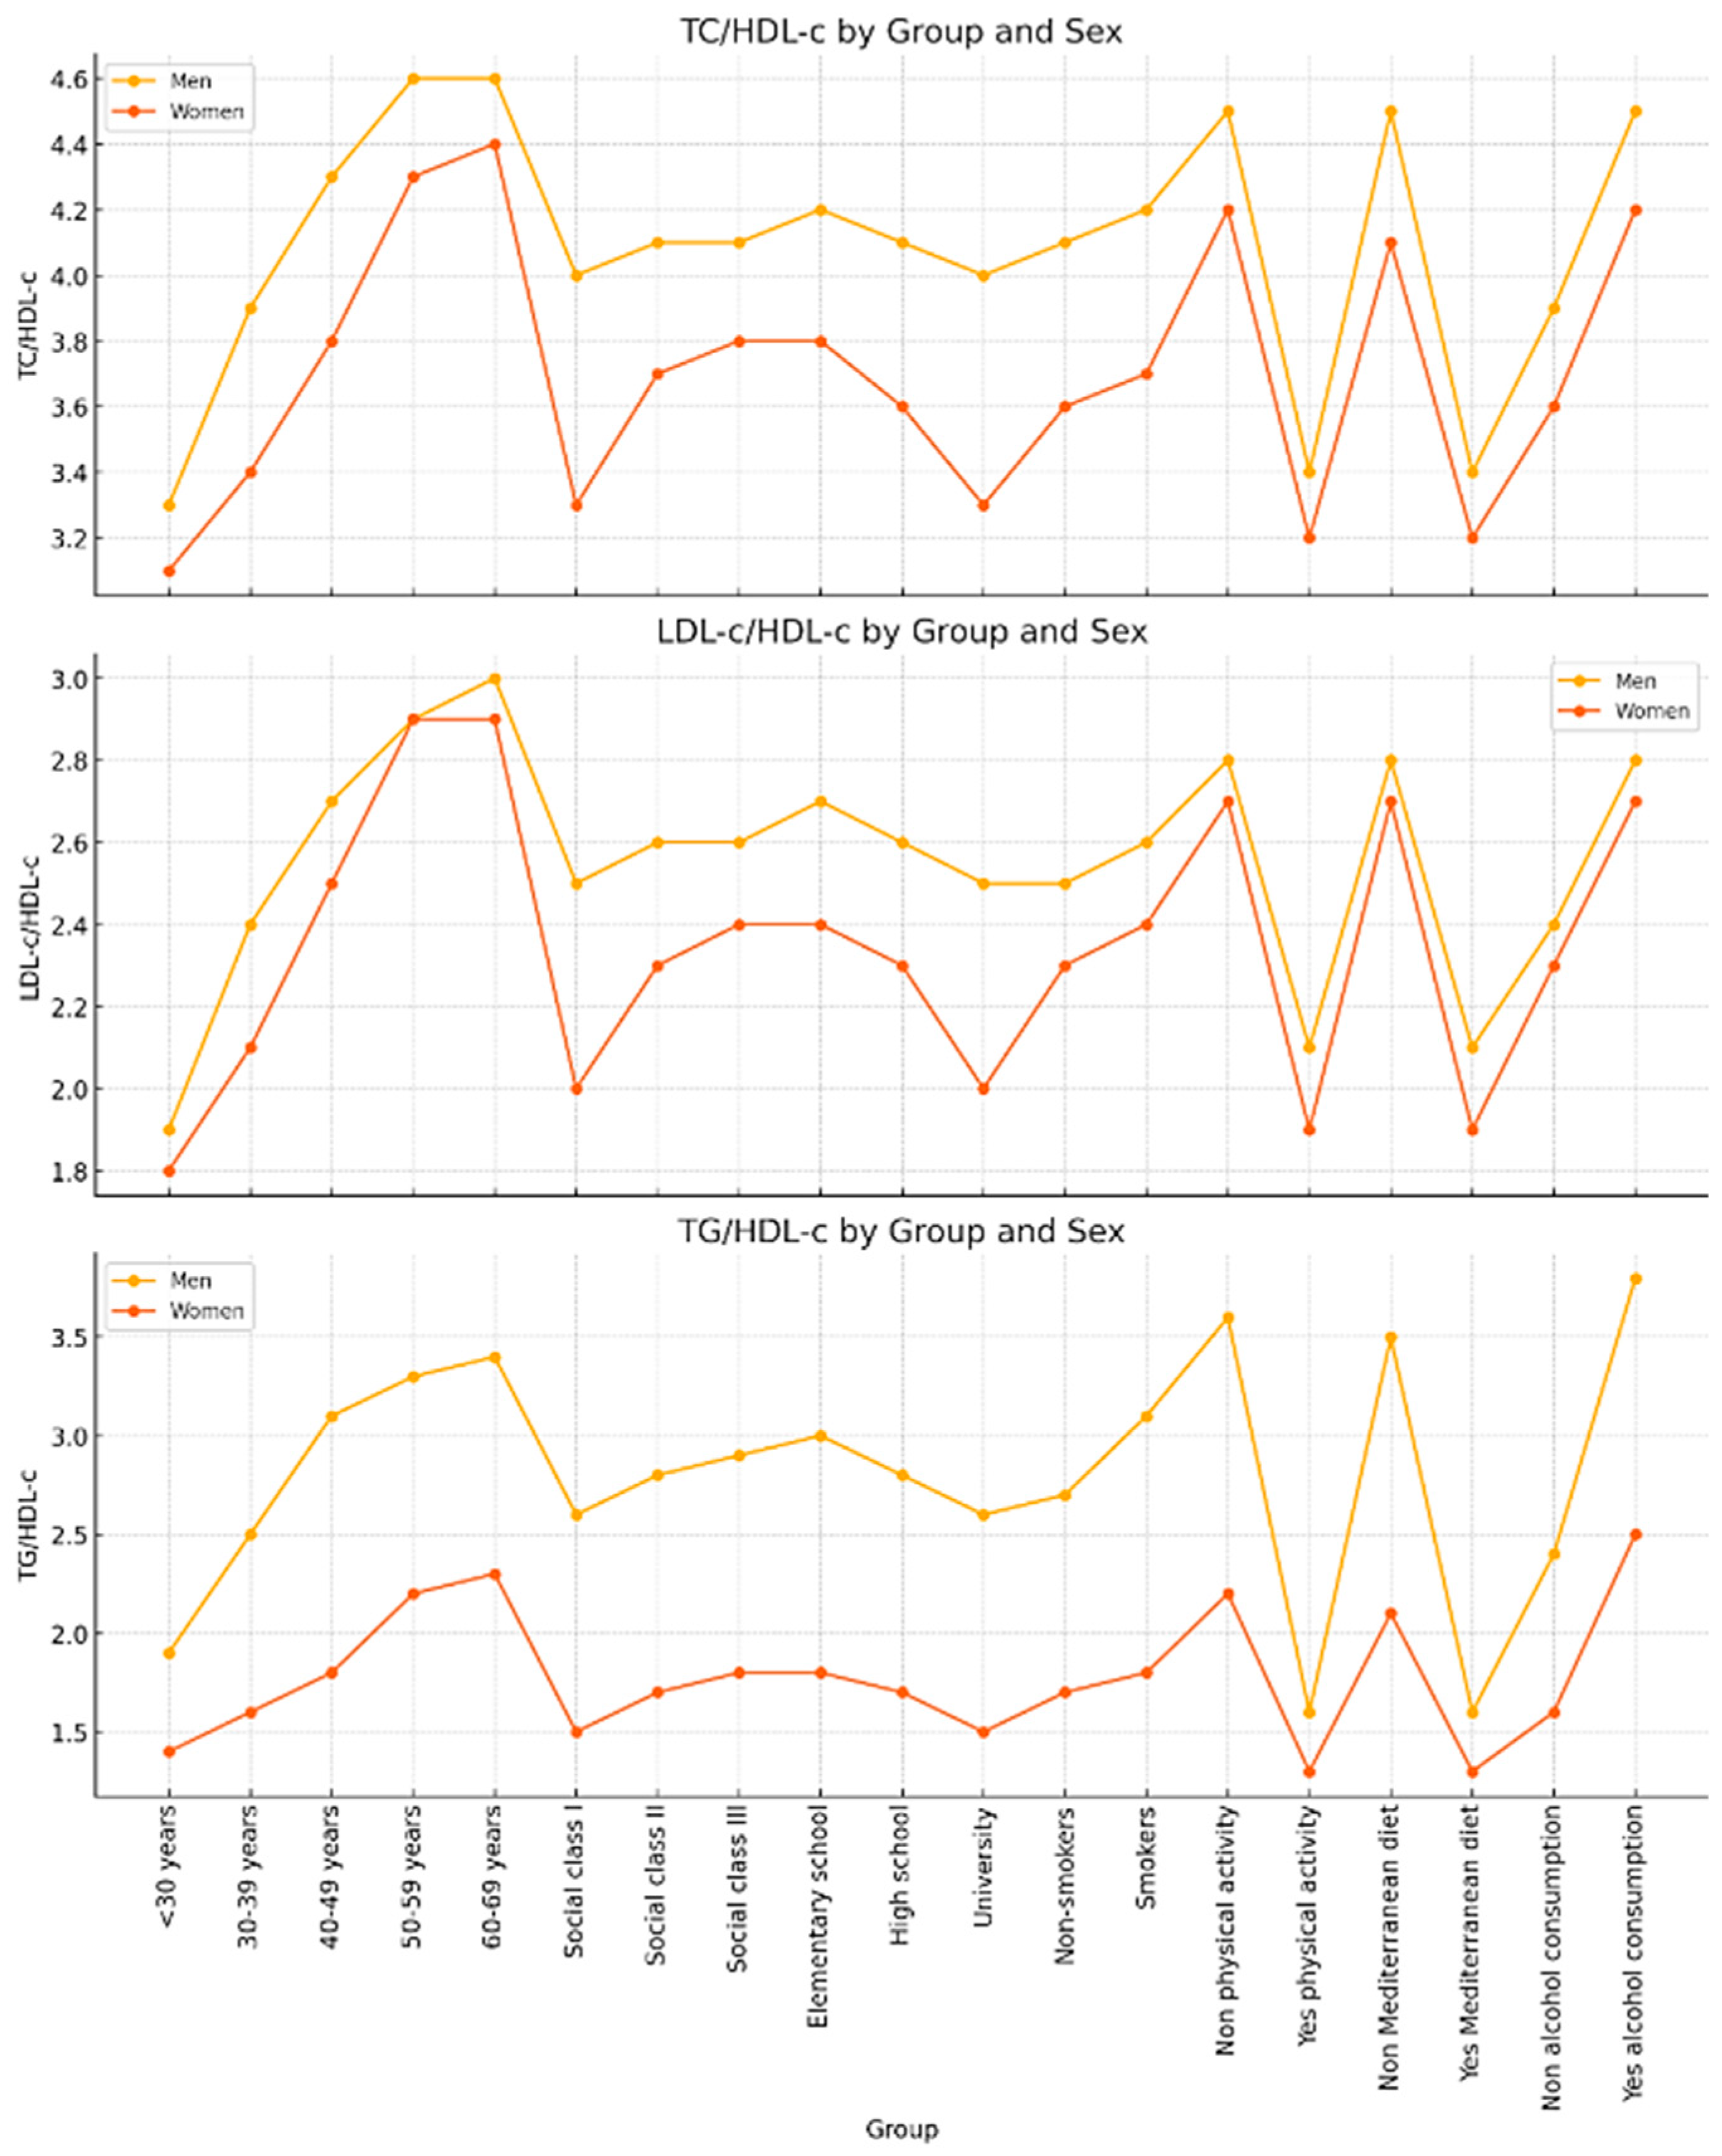
- Total cholesterol/HDL-c: Low risk if <5 in men and <4.5 in women; moderate risk between 5 and 9 in men and 4.5 and 7 in women; high risk if >9 in men and >7 in women;
- LDL-c/HDL-c: Values < 3 were categorized as low risk, while values ≥ 3 were considered high risk;
- Triglycerides/HDL-c: A ratio ≥ 3 indicated elevated risk.
- Class I: Professionals and senior management;
- Class II: Self-employed and intermediate-skilled workers;
- Class III: Manual and unskilled labor.
2.3. Statistical Analysis
3. Results
4. Discussion
5. Strengths and Limitations
6. Conclusions
Author Contributions
Funding
Institutional Review Board Statement
Informed Consent Statement
Data Availability Statement
Conflicts of Interest
References
- Lloyd-Jones, D.M.; Hong, Y.; Labarthe, D.; Mozaffarian, D.; Appel, L.J.; Van Horn, L.; Greenlund, K.; Daniels, S.; Nichol, G.; Tomaselli, G.F.; et al. Defining and setting national goals for cardiovascular health promotion and disease reduction: The American Heart Association’s strategic Impact Goal through 2020 and beyond. Circulation 2010, 121, 586–613. [Google Scholar] [CrossRef] [PubMed]
- Grundy, S.M.; Stone, N.J.; Bailey, A.L.; Beam, C.; Birtcher, K.K.; Blumenthal, R.S.; Braun, L.T.; de Ferranti, S.; Faiella-Tommasino, J.; Forman, D.E.; et al. 2018 AHA/ACC/AACVPR/AAPA/ABC/ACPM/ADA/AGS/APhA/ASPC/NLA/PCNA Guideline on the Management of Blood Cholesterol: A Report of the American College of Cardiology/American Heart Association Task Force on Clinical Practice Guidelines. Circulation 2019, 139, e1082–e1143, Erratum in Circulation 2019, 139, e1182–e1186; Erratum in Circulation 2023, 148, e5. [Google Scholar] [CrossRef] [PubMed] [PubMed Central]
- Sattar, N.; Preiss, D. Reverse Causality in Cardiovascular Epidemiological Research: More Common Than Imagined? Circulation 2017, 135, 2369–2372. [Google Scholar] [CrossRef] [PubMed]
- Mozaffarian, D.; Benjamin, E.J.; Go, A.S.; Arnett, D.K.; Blaha, M.J.; Cushman, M.; de Ferranti, S.; Després, J.-P.; Fullerton, H.J.; Howard, V.J.; et al. Heart disease and stroke statistics--2015 update: A report from the American Heart Association. Circulation 2015, 131, e29-322, Erratum in Circulation 2015, 131, e535; Erratum in Circulation 2016, 133, e417. [Google Scholar] [CrossRef] [PubMed]
- Rajendran, A.; Minhas, A.S.; Kazzi, B.; Varma, B.; Choi, E.; Thakkar, A.; Michos, E.D. Sex-specific differences in cardiovascular risk factors and implications for cardiovascular disease prevention in women. Atherosclerosis 2023, 384, 117269. [Google Scholar] [CrossRef] [PubMed] [PubMed Central]
- Stringhini, S.; Sabia, S.; Shipley, M.; Brunner, E.; Nabi, H.; Kivimaki, M.; Singh-Manoux, A. Association of socioeconomic position with health behaviors and mortality. JAMA 2010, 303, 1159–1166. [Google Scholar] [CrossRef] [PubMed] [PubMed Central]
- Mackenbach, J.P.; Stirbu, I.; Roskam, A.J.; Schaap, M.M.; Menvielle, G.; Leinsalu, M.; Kunst, A.E. Socioeconomic inequalities in health in 22 European countries. N. Engl. J. Med. 2008, 358, 2468–2481, Erratum in N. Engl. J. Med. 2008, 359, e14. [Google Scholar] [CrossRef] [PubMed]
- Braveman, P.A.; Egerter, S.A.; Mockenhaupt, R.E. Broadening the focus: The need to address the social determinants of health. Am. J. Prev. Med. 2011, 40 (Suppl. S1), S4–S18. [Google Scholar] [CrossRef] [PubMed]
- Ekelund, U.; Tarp, J.; Steene-Johannessen, J.; Hansen, B.H.; Jefferis, B.; Fagerland, M.W.; Whincup, P.; Diaz, K.M.; Hooker, S.P.; Chernofsky, A.; et al. Dose-response associations between accelerometry measured physical activity and sedentary time and all cause mortality: Systematic review and harmonised meta-analysis. BMJ 2019, 366, l4570. [Google Scholar] [CrossRef] [PubMed] [PubMed Central]
- Dunstan, D.W.; Howard, B.; Healy, G.N.; Owen, N. Too much sitting—A health hazard. Diabetes Res. Clin. Pract. 2012, 97, 368–376. [Google Scholar] [CrossRef] [PubMed]
- Estruch, R.; Ros, E.; Salas-Salvadó, J.; Covas, M.I.; Corella, D.; Arós, F.; Gómez-Gracia, E.; Ruiz-Gutiérrez, V.; Fiol, M.; Lapetra, J.; et al. Primary Prevention of Cardiovascular Disease with a Mediterranean Diet Supplemented with Extra-Virgin Olive Oil or Nuts. N. Engl. J. Med. 2018, 378, e34. [Google Scholar] [CrossRef] [PubMed]
- Sofi, F.; Abbate, R.; Gensini, G.F.; Casini, A. Accruing evidence on benefits of adherence to the Mediterranean diet on health: An updated systematic review and meta-analysis. Am. J. Clin. Nutr. 2010, 92, 1189–1196. [Google Scholar] [CrossRef] [PubMed]
- Ronksley, P.E.; Brien, S.E.; Turner, B.J.; Mukamal, K.J.; Ghali, W.A. Association of alcohol consumption with selected cardiovascular disease outcomes: A systematic review and meta-analysis. BMJ 2011, 342, d671. [Google Scholar] [CrossRef] [PubMed] [PubMed Central]
- Stockwell, T.; Zhao, J.; Panwar, S.; Roemer, A.; Naimi, T.; Chikritzhs, T. Do “Moderate” Drinkers Have Reduced Mortality Risk? A Systematic Review and Meta-Analysis of Alcohol Consumption and All-Cause Mortality. J. Stud. Alcohol. Drugs 2016, 77, 185–198. [Google Scholar] [CrossRef] [PubMed] [PubMed Central]
- Spiegelman, D.; Lovato, L.C.; Khudyakov, P.; Wilkens, T.L.; Adebamowo, C.A.; Adebamowo, S.N.; Appel, L.J.; Beulens, J.W.; Coughlin, J.W.; Dragsted, L.O.; et al. The Moderate Alcohol and Cardiovascular Health Trial (MACH15): Design and methods for a randomized trial of moderate alcohol consumption and cardiometabolic risk. Eur. J. Prev. Cardiol. 2020, 27, 1967–1982. [Google Scholar] [CrossRef] [PubMed] [PubMed Central]
- Vandevijvere, S.; Chow, C.C.; Hall, K.D.; Umali, E.; Swinburn, B.A. Increased food energy supply as a major driver of the obesity epidemic: A global analysis. Bull. World Heal. Organ. 2015, 93, 446–456. [Google Scholar] [CrossRef] [PubMed] [PubMed Central]
- Kivimäki, M.; Steptoe, A. Effects of stress on the development and progression of cardiovascular disease. Nat. Rev. Cardiol. 2018, 15, 215–229. [Google Scholar] [CrossRef] [PubMed]
- Jayawardena, R.; Sooriyaarachchi, P.; Misra, A. Abdominal obesity and metabolic syndrome in South Asians: Prevention and management. Expert Rev. Endocrinol. Metab. 2021, 16, 339–349. [Google Scholar] [CrossRef] [PubMed]
- Jia, C.; Anderson, J.L.C.; Gruppen, E.G.; Lei, Y.; Bakker, S.J.L.; Dullaart, R.P.F.; Tietge, U.J. High-Density Lipoprotein Anti-Inflammatory Capacity and Incident Cardiovascular Events. Circulation 2021, 143, 1935–1945. [Google Scholar] [CrossRef] [PubMed]
- Millán, J.; Pintó, X.; Muñoz, A.; Zúñiga, M.; Rubiés-Prat, J.; Pallardo, L.F.; Masana, L.; Mangas, A.; Hernández-Mijares, A.; González-Santos, P.; et al. Lipoprotein ratios: Physiological significance and clinical usefulness in cardiovascular prevention. Vasc. Health Risk Manag. 2009, 5, 757–765. [Google Scholar] [PubMed] [PubMed Central]
- Mora, S.; Glynn, R.J.; Ridker, P.M. High-density lipoprotein cholesterol, size, particle number, and residual vascular risk after potent statin therapy. Circulation 2013, 128, 1189–1197. [Google Scholar] [CrossRef] [PubMed] [PubMed Central]
- McLaughlin, T.; Reaven, G.; Abbasi, F.; Lamendola, C.; Saad, M.; Waters, D.; Simon, J.; Krauss, R.M. Is there a simple way to identify insulin-resistant individuals at increased risk of cardiovascular disease? Am. J. Cardiol. 2005, 96, 399–404. [Google Scholar] [CrossRef] [PubMed]
- Kempel, M.K.; Winding, T.N.; Lynggaard, V.; Brantlov, S.; Andersen, J.H.; Böttcher, M. Traditional and novel cardiometabolic risk markers across strata of body mass index in young adults. Obes. Sci. Pract. 2021, 7, 727–737. [Google Scholar] [CrossRef] [PubMed] [PubMed Central]
- Lee, S.H.; Han, K.; Yang, H.K.; Kim, M.K.; Yoon, K.H.; Kwon, H.S.; Park, Y. Identifying subgroups of obesity using the product of triglycerides and glucose: The Korea National Health and Nutrition Examination Survey, 2008–2010. Clin. Endocrinol. 2015, 82, 213–220. [Google Scholar] [CrossRef] [PubMed]
- Duan, M.; Zhao, X.; Li, S.; Miao, G.; Bai, L.; Zhang, Q.; Yang, W.; Zhao, X. Metabolic score for insulin resistance (METS-IR) predicts all-cause and cardiovascular mortality in the general population: Evidence from NHANES 2001–2018. Cardiovasc. Diabetol. 2024, 23, 243. [Google Scholar] [CrossRef] [PubMed] [PubMed Central]
- Yusuf, S.; Hawken, S.; Ounpuu, S.; Dans, T.; Avezum, A.; Lanas, F.; McQueen, M.; Budaj, A.; Pais, P.; Varigos, J.; et al. Effect of potentially modifiable risk factors associated with myocardial infarction in 52 countries (the INTERHEART study): Case-control study. Lancet 2004, 364, 937–952. [Google Scholar] [CrossRef] [PubMed]
- Folsom, A.R. Serum total cholesterol concentrations and awareness, treatment, and control of hypercholesterolemia among US adults. Circulation 2003, 108, e152. [Google Scholar] [CrossRef] [PubMed]
- Daviglus, M.L.; Stamler, J.; Pirzada, A.; Yan, L.L.; Garside, D.B.; Liu, K.; Wang, R.; Dyer, A.R.; Lloyd-Jones, D.M.; Greenland, P. Favorable cardiovascular risk profile in young women and long-term risk of cardiovascular and all-cause mortality. JAMA 2004, 292, 1588–1592. [Google Scholar] [CrossRef] [PubMed]
- Gordon-Larsen, P.; Nelson, M.C.; Page, P.; Popkin, B.M. Inequality in the built environment underlies key health disparities in physical activity and obesity. Pediatrics 2006, 117, 417–424. [Google Scholar] [CrossRef] [PubMed]
- Singh, G.K.; Siahpush, M. Widening socioeconomic inequalities in US life expectancy, 1980-2000. Int. J. Epidemiol. 2006, 35, 969–979. [Google Scholar] [CrossRef] [PubMed]
- Delgado-Lista, J.; Alcala-Diaz, J.F.; Torres-Peña, J.D.; Quintana-Navarro, G.M.; Fuentes, F.; Garcia-Rios, A.; Ortiz-Morales, A.M.; I Gonzalez-Requero, A.; Perez-Caballero, A.I.; Yubero-Serrano, E.M.; et al. Long-term secondary prevention of cardiovascular disease with a Mediterranean diet and a low-fat diet (CORDIOPREV): A randomised controlled trial. Lancet 2022, 399, 1876–1885. [Google Scholar] [CrossRef] [PubMed]
- Dinu, M.; Pagliai, G.; Casini, A.; Sofi, F. Mediterranean diet and multiple health outcomes: An umbrella review of meta-analyses of observational studies and randomised trials. Eur. J. Clin. Nutr. 2018, 72, 30–43. [Google Scholar] [CrossRef] [PubMed]
- Ekelund, U.; Steene-Johannessen, J.; Brown, W.J.; Fagerland, M.W.; Owen, N.; Powell, K.E.; Bauman, A.; Lee, I.-M. Does physical activity attenuate, or even eliminate, the detrimental association of sitting time with mortality? A harmonised meta-analysis of data from more than 1 million men and women. Lancet 2016, 388, 1302–1310, Erratum in Lancet 2016, 388, e6. [Google Scholar] [CrossRef] [PubMed]
- Clemes, S.A.; Patel, R.; Mahon, C.; Griffiths, P.L. Sitting time and step counts in office workers. Occup. Med. 2014, 64, 188–192. [Google Scholar] [CrossRef] [PubMed]
- Ikehara, S.; Iso, H.; Toyoshima, H.; Date, C.; Yamamoto, A.; Kikuchi, S.; Kondo, T.; Watanabe, Y.; Koizumi, A.; Wada, Y.; et al. Alcohol consumption and mortality from stroke and coronary heart disease among Japanese men and women: The Japan collaborative cohort study. Stroke 2008, 39, 2936–2942. [Google Scholar] [CrossRef] [PubMed]
- García Agudo, S.; González Casquero, R.; Vallejos, D.; Eugercios Escribano, H.; Roberto Martín, J.A.; Gil Llinas, M. Relevancia de los índices aterogénicos como predictores precoces de riesgo cardiovascular en el contexto laboral de los profesionales sanitarios. Acad. J. Health Sci. 2024, 39, 15–22. [Google Scholar] [CrossRef]
- Ramírez-Manent, J.I.; Tomás-Gil, P.; Coll-Villalonga, J.L.; Marti-Lliteras, P.; López-González, A.A.; Paublini, H. Influence of sociodemographic variables and tobacco consumption on the prevalence of atherogenic dyslipidemia and lipid triad in 418.343 spanish workers. Acad. J. Health Sci. 2023, 38, 84–89. [Google Scholar] [CrossRef]
- Domingo-Salvany, A.; Bacigalupe, A.; Carrasco, J.M.; Espelt, A.; Ferrando, J.; Borrell, C.; del Grupo de Determinantes Sociales de la Sociedad Española de Epidemiología. Propuestas de clase social neoweberiana y neomarxista a partir de la Clasificación Nacional de Ocupaciones 2011. Gac. Sanit. 2013, 27, 263–272. (In Spanish) [Google Scholar] [CrossRef]
- Celada Roldán, C.; López Diez, J.; Rider, F.; Tárraga Marcos, A.; Tárraga Marcos, M.L.; Tárraga López, P.J.; Gallegos, I.R.; Arroyo, M.M.; Manent, J.I.R.; González, Á.A.L. Impact of adherence to the Mediterranean diet on health-related quality of life in poorly controlled diabetics. Acad. J. Health Sci. 2024, 39, 103–112. [Google Scholar] [CrossRef]
- Mestre Font, M.; Busquets-Cortés, C.; Ramírez-Manent, J.I.; Vallejos, D.; Sastre Alzamora, T.; López-González, A.A. Influence of sociodemographic variables and healthy habits on the values of cardiometabolic risk scales in 386924 spanish workers. Acad. J. Health Sci. 2024, 39, 112–121. [Google Scholar] [CrossRef]
- Límites de Consumo de Bajo Riesgo de Alcohol. Actualización del Riesgo Relacionado con los Niveles de Consumo de Alcohol, el Patrón de Consumo y el Tipo de Bebida Parte 1. Actualización de los Límites de Consumo de Bajo Riesgo de Alcohol. Ministerio de Sanidad de España 2020. Available online: https://www.sanidad.gob.es/areas/promocionPrevencion/alcohol/documentosTecnicos/docs/Limites_Consumo_Bajo_Riesgo_Alcohol_Actualizacion.pdf (accessed on 29 May 2025).
- Obrador de Hevia, J.; López-González, Á.A.; Ramírez-Manent, J.I.; Paublini Oliveira, H.; Tárraga López, P.J.; Riutord-Sbert, P. Relationship between alcohol consumption and other variables with the values of different cardiovascular risk factors in 139634 Spanish workers. Acad. J. Health Sci. 2024, 39, 132–141. [Google Scholar] [CrossRef]
- Rodriguez de Morales, Y.A.; Abramson, B.L. Cardiovascular and physiological risk factors in women at mid-life and beyond. Can. J. Physiol. Pharmacol. 2024, 102, 442–451. [Google Scholar] [CrossRef] [PubMed]
- Gong, R.; Luo, G.; Wang, M.; Ma, L.; Sun, S.; Wei, X. Associations between TG/HDL ratio and insulin resistance in the US population: A cross-sectional study. Endocr. Connect. 2021, 10, 1502–1512. [Google Scholar] [CrossRef] [PubMed] [PubMed Central]
- Zhang, Y.; Qin, P.; Lou, Y.; Zhao, P.; Li, X.; Qie, R.; Wu, X.; Han, M.; Huang, S.; Zhao, Y.; et al. Association of TG/HDLC ratio trajectory and risk of type 2 diabetes: A retrospective cohort study in China. J. Diabetes 2020, 13, 402–412. [Google Scholar] [CrossRef] [PubMed]
- Yang, Y.; Wang, B.; Yuan, H.; Li, X. Triglycerides to High-Density Lipoprotein Cholesterol Ratio Is the Best Surrogate Marker for Insulin Resistance in Nonobese Middle-Aged and Elderly Population: A Cross-Sectional Study. Int. J. Endocrinol. 2021, 2021, 6676569. [Google Scholar] [CrossRef] [PubMed]
- Siegrist, J.; Li, J. Work stress and altered biomarkers: A synthesis of findings based on the effort–reward imbalance model. Int. J. Environ. Res. Public. Health 2017, 14, 1373. [Google Scholar] [CrossRef]
- Ekelund, U.; Brown, W.J.; Steene-Johannessen, J.; Fagerland, M.W.; Owen, N.; Powell, K.E.; Bauman, A.E.; Lee, I.-M. Do the associations of sedentary behaviour with cardiovascular disease mortality and cancer mortality differ by physical activity level? A systematic review and harmonised meta-analysis of data from 850 060 participants. Br. J. Sports Med. 2019, 53, 886–894. [Google Scholar] [CrossRef] [PubMed]
- Holmes, J.; Beard, E.; Brown, J.; Brennan, A.; Meier, P.S.; Michie, S.; Stevely, A.K.; Webster, L.; Buykx, P.F. Effects on alcohol consumption of announcing and implementing revised UK low-risk drinking guidelines: Findings from an interrupted time series analysis. J Epidemiol Community Health 2020, 74, 942–949. [Google Scholar] [CrossRef] [PubMed] [PubMed Central]
- Lange, C.; Manz, K.; Rommel, A.; Schienkiewitz, A.; Mensink, G.B.M. Alcohol consumption of adults in Germany: Harmful drinking quantities, consequences and measures. J Health Monit. 2016, 1, 2–20. [Google Scholar] [CrossRef] [PubMed] [PubMed Central]
- Ren, Y.; Chase, E.; d’Almeida, T.; Allègre, J.; Latino-Martel, P.; Deschamps, V.; Arwidson, P.; Etilé, F.; Hercberg, S.; Touvier, M.; et al. Modelling the number of avoidable new cancer cases in France attributable to alcohol consumption by following official recommendations: A simulation study. Addiction 2021, 116, 2316–2325. [Google Scholar] [CrossRef] [PubMed]
- National Academies of Sciences, Engineering, and Medicine; Health and Medicine Division; Food and Nutrition Board; Committee on Review of Evidence on Alcohol and Health. Review of Evidence on Alcohol and Health; Stone, K.B., Calonge, B.N., Eds.; National Academies Press (US): Washington, DC, USA, 23 April 2025. [Google Scholar] [PubMed]
- Wood, A.M.; Kaptoge, S.; Butterworth, A.S.; Willeit, P.; Warnakula, S.; Bolton, T.; Paige, E.; Paul, D.S.; Sweeting, M.; Burgess, S.; et al. Risk thresholds for alcohol consumption: Combined analysis of individual-participant data for 599,912 current drinkers in 83 prospective studies. Lancet 2018, 391, 1513–1523. [Google Scholar] [CrossRef] [PubMed]
- Zhao, J.; Stockwell, T.; Naimi, T. Are “moderate” drinkers actually healthier than non-drinkers? Evidence from the National Health Interview Survey, 1988–2020. J. Stud. Alcohol. Drugs 2023, 84, 38–47. [Google Scholar]
- Valli, C.; Rabassa, M.; Johnston, B.C.; Kuijpers, R.; Prokop-Dorner, A.; Zajac, J.; Storman, D.; Storman, M.; Bala, M.M.; Solà, I.; et al. Health-related values and preferences regarding meat consumption: A mixed-methods systematic review. Ann. Intern. Med. 2019, 171, 742–755. [Google Scholar] [CrossRef] [PubMed]
- Donat-Vargas, C.; Sandoval-Insausti, H.; Rey-García, J.; Ramón Banegas, J.; Rodríguez-Artalejo, F.; Guallar-Castillón, P. Five-color Nutri-Score labeling and mortality risk in a nationwide, population-based cohort in Spain: The Study on Nutrition and Cardiovascular Risk in Spain (ENRICA). Am. J. Clin. Nutr. 2021, 113, 1301–1311. [Google Scholar] [CrossRef]
- Fadel, M.; Li, J.; Sembajwe, G.; Gagliardi, D.; Pico, F.; Ozguler, A.; Evanoff, B.A.; Baer, M.; Tsutsumi, A.; Iavicoli, S.; et al. Cumulative Exposure to Long Working Hours and Occurrence of Ischemic Heart Disease: Evidence From the CONSTANCES Cohort at Inception. J. Am. Heart Assoc. 2020, 9, e015753. [Google Scholar] [CrossRef]
- Mach, F.; Baigent, C.; Catapano, A.L.; Koskinas, K.C.; Casula, M.; Badimon, L.; Chapman, M.J.; De Backer, G.G.; Delgado, V.; Ference, B.A.; et al. 2019 ESC/EASGuidelines for the management of dyslipidaemias: Lipid modification to reduce cardiovascular risk. Eur. Heart J. 2020, 41, 111–188, Erratum in Eur. Heart J. 2020, 41, 4255. [Google Scholar] [CrossRef] [PubMed]
- Visseren, F.L.J.; Mach, F.; Smulders, Y.M.; Carballo, D.; Koskinas, K.C.; Bäck, M.; Benetos, A.; Biffi, A.; Boavida, J.M.; Capodanno, D.; et al. 2021 ESC Guidelines on cardiovascular disease prevention in clinical practice. Eur. J. Prev. Cardiol. 2022, 29, 5–115. [Google Scholar] [CrossRef]

| Men n = 83,282 | Women n = 56,352 | ||
|---|---|---|---|
| Mean (SD) | Mean (SD) | p-Value | |
| Age (years) | 41.4 (10.7) | 40.1 (10.4) | 0.089 |
| Height (cm) | 173.8 (7.1) | 161.2 (6.5) | <0.001 |
| Weight (kg) | 83.2 (14.6) | 66.3 (13.9) | <0.001 |
| BMI (kg/m2) | 27.5 (4.5) | 25.5 (5.3) | <0.001 |
| Systolic blood pressure (mmHg) | 126.2 (15.9) | 115.6 (15.7) | <0.001 |
| Diastolic blood pressure (mmHg) | 76.6 (10.9) | 71.1 (10.7) | <0.001 |
| Total cholesterol (mg/dL) | 199.6 (38.6) | 194.6 (36.9) | <0.001 |
| HDL cholesterol (mg/dL) | 50.0 (7.7) | 54.7 (9.2) | <0.001 |
| LDL cholesterol (mg/dL) | 122.6 (37.4) | 121.5 (37.1) | <0.001 |
| Triglycerides (mg/dL) | 133.8 (95.6) | 90.8 (49.7) | <0.001 |
| Glucose (mg/dL) | 93.0 (25.4) | 86.8 (18.1) | <0.001 |
| % | % | p-Value | |
| <30 years | 15.1 | 18.0 | <0.001 |
| 30–39 years | 29.6 | 31.0 | |
| 40–49 years | 30.2 | 30.3 | |
| 50–59 years | 20.9 | 17.7 | |
| 60–69 years | 4.2 | 3.0 | |
| Underweight | 0.5 | 2.7 | <0.001 |
| Normalweight | 30.3 | 52.3 | |
| Overweight | 43.0 | 26.9 | |
| Obesity | 26.2 | 18.1 | |
| Social class I | 7.5 | 13.6 | <0.001 |
| Social class II | 23.8 | 32.1 | |
| Social class III | 68.7 | 54.1 | |
| Elementary school | 66.4 | 48.1 | <0.001 |
| High school | 26.9 | 40.0 | |
| University | 6.7 | 11.9 | |
| Non-smokers | 66.8 | 67.9 | <0.001 |
| Smokers | 33.2 | 32.1 | |
| No physical activity | 62.4 | 51.4 | <0.001 |
| Yes physical activity | 37.6 | 48.6 | |
| No Mediterranean diet | 65.8 | 52.8 | <0.001 |
| Yes Mediterranean diet | 34.2 | 47.2 | |
| No alcohol consumption | 67.3 | 84.4 | <0.001 |
| Yes alcohol consumption | 32.7 | 15.6 |
| TC/HDL-c | LDL-c/HDL-c | TG/HDL-c | ||
|---|---|---|---|---|
| Men | n | Mean (SD) | Mean (SD) | Mean (SD) |
| <30 years | 12,558 | 3.3 (0.9) | 1.9 (0.8) | 1.9 (1.4) |
| 30–39 years | 24,648 | 3.9 (1.1) | 2.4 (0.9) | 2.5 (2.3) |
| 40–49 years | 25,178 | 4.3 (1.2) | 2.7 (1.0) | 3.1 (2.8) |
| 50–59 years | 17,370 | 4.6 (1.2) | 2.9 (1.0) | 3.3 (2.2) |
| 60–69 years | 3528 | 4.6 (1.2) | 3.0 (1.1) | 3.4 (2.8) |
| Social class I | 6234 | 4.0 (1.1) | 2.5 (1.0) | 2.6 (2.1) |
| Social class II | 19,856 | 4.1 (1.1) | 2.6 (0.9) | 2.8 (2.3) |
| Social class III | 57,192 | 4.1 (1.3) | 2.6 (1.1) | 2.9 (2.6) |
| Elementary school | 55,306 | 4.2 (1.2) | 2.7 (1.0) | 3.0 (2.7) |
| High school | 22,408 | 4.1 (1.2) | 2.6 (1.0) | 2.8 (2.4) |
| University | 5568 | 4.0 (1.1) | 2.5 (1.0) | 2.6 (2.1) |
| Non-smokers | 55,618 | 4.1 (1.1) | 2.5 (1.0) | 2.7 (2.2) |
| Smokers | 27,664 | 4.2 (1.4) | 2.6 (1.1) | 3.1 (3.0) |
| No physical activity | 51,984 | 4.5 (1.3) | 2.8 (1.1) | 3.6 (2.9) |
| Yes physical activity | 31,298 | 3.4 (0.7) | 2.1 (0.7) | 1.6 (0.6) |
| No Mediterranean diet | 54,792 | 4.5 (1.3) | 2.8 (1.1) | 3.5 (2.8) |
| Yes Mediterranean diet | 28,490 | 3.4 (0.7) | 2.1 (0.7) | 1.6 (0.7) |
| No alcohol consumption | 56,022 | 3.9 (1.1) | 2.4 (1.0) | 2.4 (1.9) |
| Yes alcohol consumption | 27,260 | 4.5 (1.3) | 2.8 (1.1) | 3.8 (3.2) |
| Women | n | Mean (SD) | Mean (SD) | Mean (SD) |
| <30 years | 10,110 | 3.1 (0.9) | 1.8 (0.8) | 1.4 (0.8) |
| 30–39 years | 17,460 | 3.4 (1.0) | 2.1 (0.9) | 1.6 (0.9) |
| 40–49 years | 17,094 | 3.8 (1.0) | 2.5 (0.9) | 1.8 (1.2) |
| 50–59 years | 9984 | 4.3 (1.1) | 2.9 (1.0) | 2.2 (1.4) |
| 60–69 years | 1704 | 4.4 (1.1) | 2.9 (1.0) | 2.3 (1.2) |
| Social class I | 7632 | 3.3 (1.0) | 2.0 (0.9) | 1.5 (1.0) |
| Social class II | 18,112 | 3.7 (1.0) | 2.3 (0.9) | 1.7 (1.2) |
| Social class III | 30,608 | 3.8 (1.1) | 2.4 (1.0) | 1.8 (1.1) |
| Elementary school | 27,086 | 3.8 (1.1) | 2.4 (1.0) | 1.8 (1.2) |
| High school | 22,574 | 3.6 (1.1) | 2.3 (1.0) | 1.7 (1.1) |
| University | 6692 | 3.3 (1.0) | 2.0 (0.9) | 1.5 (1.1) |
| Non-smokers | 38,252 | 3.6 (1.1) | 2.3 (1.0) | 1.7 (1.1) |
| Smokers | 18,100 | 3.7 (1.1) | 2.4 (0.9) | 1.8 (1.2) |
| No physical activity | 28,962 | 4.2 (1.1) | 2.7 (1.0) | 2.2 (1.4) |
| Yes physical activity | 27,390 | 3.2 (0.7) | 1.9 (0.7) | 1.3 (0.4) |
| No Mediterranean diet | 29,764 | 4.1 (1.1) | 2.7 (1.0) | 2.1 (1.4) |
| Yes Mediterranean diet | 26,588 | 3.2 (0.7) | 1.9 (0.7) | 1.3 (0.5) |
| No alcohol consumption | 47,536 | 3.6 (1.0) | 2.3 (0.9) | 1.6 (0.9) |
| Yes alcohol consumption | 8816 | 4.2 (1.1) | 2.7 (1.0) | 2.5 (1.8) |
| TC/HDL-c Moderate–High | LDL-c/HDL-c High | TG/HDL-c High | AD | ||
|---|---|---|---|---|---|
| Men | n | % | % | % | % |
| <30 years | 12,558 | 3.8 | 3.3 | 11.2 | 1.9 |
| 30–39 years | 24,648 | 11.2 | 9.5 | 22.2 | 5.2 |
| 40–49 years | 25,178 | 22.0 | 17.8 | 34.7 | 11.3 |
| 50–59 years | 17,370 | 31.1 | 25.5 | 40.4 | 20.1 |
| 60–69 years | 3528 | 31.4 | 25.7 | 42.1 | 27.5 |
| Social class I | 6234 | 18.1 | 17.4 | 24.5 | 8.4 |
| Social class II | 19,856 | 18.7 | 16.5 | 29.3 | 10.0 |
| Social class III | 57,192 | 18.9 | 15.1 | 29.4 | 11.1 |
| Elementary school | 55,306 | 20.0 | 17.7 | 30.9 | 13.0 |
| High school | 22,408 | 19.6 | 15.5 | 28.5 | 9.8 |
| University | 5568 | 17.6 | 14.7 | 25.7 | 8.9 |
| Non-smokers | 55,618 | 17.6 | 14.4 | 27.6 | 8.8 |
| Smokers | 27,664 | 19.8 | 16.6 | 31.6 | 14.3 |
| No physical activity | 51,984 | 28.6 | 23.3 | 45.5 | 15.7 |
| Yes physical activity | 31,298 | 1.3 | 1.5 | 1.5 | 2.1 |
| No Mediterranean diet | 54,792 | 27.1 | 21.7 | 42.7 | 15.0 |
| Yes Mediterranean diet | 28,490 | 2.2 | 2.4 | 2.6 | 2.2 |
| Nn alcohol consumption | 56,022 | 13.6 | 12.3 | 20.2 | 4.3 |
| Yes alcohol consumption | 27,260 | 28.1 | 20.9 | 47.1 | 11.1 |
| Women | n | % | % | % | % |
| <30 years | 10,110 | 6.5 | 8.9 | 4.1 | 1.6 |
| 30–39 years | 17,460 | 12.7 | 16.4 | 5.6 | 3.1 |
| 40–49 years | 17,094 | 22.1 | 26.3 | 9.1 | 6.3 |
| 50–59 years | 9984 | 38.4 | 43.4 | 17.3 | 16.1 |
| 60–69 years | 1704 | 39.8 | 44.8 | 21.8 | 27.3 |
| Social class I | 7632 | 12.3 | 15.6 | 10.4 | 3.0 |
| Social class II | 18,112 | 18.7 | 26.4 | 8.3 | 5.6 |
| Social class III | 30,608 | 22.4 | 22.6 | 4.8 | 8.4 |
| Elementary school | 27,086 | 23.0 | 27.2 | 10.6 | 8.7 |
| High school | 22,574 | 18.4 | 22.1 | 8.4 | 5.6 |
| University | 6692 | 11.9 | 15.2 | 4.3 | 2.8 |
| Non-smokers | 38,252 | 18.8 | 21.9 | 8.7 | 6.2 |
| Smokers | 18,100 | 20.3 | 24.6 | 9.5 | 7.0 |
| No physical activity | 28,962 | 35.3 | 39.2 | 17.4 | 12.2 |
| Yes physical activity | 27,390 | 3.6 | 7.3 | 1.1 | 1.6 |
| No Mediterranean diet | 29,764 | 33.2 | 37.2 | 16.5 | 11.8 |
| Yes Mediterranean diet | 26,588 | 4.9 | 8.6 | 0.8 | 1.1 |
| No alcohol consumption | 47,536 | 17.1 | 21.5 | 5.9 | 2.6 |
| Yes alcohol consumption | 8816 | 34.6 | 35.8 | 25.6 | 14.2 |
| TC/HDL-c Moderate–High | LDL-C/HDL-C High | TG/HDL-c High | Atherogenic Dyslipidemia | |
|---|---|---|---|---|
| OR (95% CI) | OR (95% CI) | OR (95% CI) | OR (95% CI) | |
| Women | 1 | 1 | 1 | 1 |
| Men | 0.68 (0.66–0.70) | 0.43 (0.42–0.44) | 3.76 (3.62–3.89) | 1.84 (1.70–1.98) |
| <30 years | 1 | 1 | 1 | 1 |
| 30–39 years | 1.10 (1.07–1.14) | 1.19 (1.15–1.23) | 1.06 (1.04–1.09) | 1.14 (1.10–1.18) |
| 40–49 years | 1.50 (1.40–1.60) | 1.62 (1.52–1.72) | 1.17 (1.09–1.26) | 1.57 (1.43–1.71) |
| 50–59 years | 2.50 (2.33–2.68) | 2.58 (2.40–2.76) | 1.51 (1.41–1.70) | 2.03 (1.83–2.24) |
| 60–69 years | 4.96 (4.55–5.37) | 5.01 (4.59–5.43) | 2.08 (1.91–2.27) | 2.81 (2.45–3.17) |
| Social class I | 1 | 1 | 1 | 1 |
| Social class II | 1.09 (1.06–1.10) | 1.10 (1.06–1.14) | 1.14 (1.09–1.19) | 1.09 (1.05–1.14) |
| Social class III | 1.29 (1.24–1.35) | 1.20 (1.16–1.25) | 1.31 (1.21–1.32) | 1.20 (1.15–1.26) |
| University | 1 | 1 | 1 | 1 |
| High school | 1.12 (1.09–1.15) | 1.11 (1.08–1.14) | 1.13 (1.09–1.17) | 1.09 (1.06–1.12) |
| Elementary school | 1.23 (1.19–1.27) | 1.29 (1.23–1.35) | 1.29 (1.23–1.36) | 1.15 (1.12–1.18) |
| Non-smokers | 1 | 1 | 1 | 1 |
| Smokers | 1.18 (1.14–1.22) | 1.15 (1.12–1.18) | 1.16 (1.12–1.20) | 1.10 (1.08–1.12) |
| Yes physical activity | 1 | 1 | 1 | 1 |
| No physical activity | 13.52 (12.43–14.62) | 8.08 (7.52–8.64) | 36.23 (32.12–40.35) | 16.86 (14.80–18.93) |
| Yes Mediterranean diet | 1 | 1 | 1 | 1 |
| No Mediterranean diet | 1.26 (1.20–1.32) | 1.22 (1.14–1.30) | 1.59 (1.45–1.73) | 7.46 (6.70–8.22) |
| No alcohol consumption | 1 | 1 | 1 | 1 |
| Yes alcohol consumption | 2.33 (2.15–2.51) | 2.19 (2.02–2.36) | 1.60 (1.54–1.66) | 1.79 (1.70–1.88) |
| TC/HDL-c Moderate–High | LDL-c/HDL-c High | TG/HDL-c High | AD | ||||||||||
|---|---|---|---|---|---|---|---|---|---|---|---|---|---|
| PRE | POST | PRE | POST | PRE | POST | PRE | POST | ||||||
| Men | n | % | % | Difference (%) | % | % | Difference (%) | % | % | Difference (%) | % | % | Difference (%) |
| <30 years | 3645 | 7.9 | 8.4 | 6.9 | 10.3 | 11.3 | 9.9 | 7.1 | 7.7 | 8.8 | 3.1 | 3.3 | 7.1 |
| 30–39 years | 6933 | 12.8 | 14.1 | 10.3 | 17.9 | 20.4 | 13.7 | 14.2 | 16.0 | 12.5 | 4.9 | 5.4 | 9.9 |
| 40–49 years | 7013 | 15.9 | 18.2 | 14.5 | 23.8 | 28.5 | 19.8 | 21.0 | 25.1 | 19.7 | 7.9 | 8.9 | 12.8 |
| 50–59 years | 4952 | 20.3 | 24.3 | 19.8 | 28.9 | 35.8 | 23.9 | 27.8 | 33.7 | 21.4 | 10.3 | 12.1 | 17.5 |
| Social class I | 1760 | 9.9 | 10.6 | 7.2 | 13.8 | 15.6 | 12.8 | 10.9 | 12.3 | 12.5 | 3.8 | 4.1 | 7.8 |
| Social class II | 5368 | 11.8 | 13.1 | 10.9 | 19.8 | 23.1 | 16.8 | 16.8 | 19.5 | 16.1 | 4.9 | 5.5 | 11.9 |
| Social class III | 15,415 | 15.8 | 18.6 | 17.8 | 28.2 | 33.9 | 20.1 | 24.4 | 29.4 | 20.3 | 7.9 | 9.3 | 17.2 |
| Elementary school | 14,914 | 15.9 | 18.8 | 18.1 | 27.7 | 33.3 | 20.3 | 24.1 | 29.1 | 20.6 | 8.0 | 9.4 | 17.1 |
| High school | 6053 | 12.0 | 13.4 | 11.4 | 20.2 | 23.8 | 17.8 | 17.0 | 19.7 | 16.0 | 5.1 | 5.7 | 11.8 |
| University | 1576 | 9.8 | 10.9 | 10.9 | 14.0 | 15.5 | 10.9 | 11.0 | 12.3 | 12.0 | 3.7 | 4.0 | 7.7 |
| Non-smokers | 15,122 | 12.8 | 15.0 | 17.5 | 17.5 | 20.1 | 15.1 | 15.9 | 17.6 | 10.9 | 5.9 | 6.5 | 10.9 |
| Smokers | 7421 | 16.9 | 20.3 | 19.9 | 22.9 | 28.0 | 22.2 | 22.4 | 26.3 | 17.3 | 10.8 | 12.8 | 18.5 |
| Yes physical activity | 8535 | 4.8 | 5.0 | 3.8 | 6.8 | 7.3 | 7.1 | 5.8 | 6.1 | 5.8 | 2.3 | 2.5 | 7.1 |
| No physical activity | 14,008 | 19.7 | 23.4 | 18.9 | 29.9 | 37.0 | 23.9 | 23.1 | 27.8 | 20.4 | 15.8 | 19.6 | 23.8 |
| Yes Mediterranean diet | 7767 | 6.1 | 6.4 | 4.8 | 7.7 | 8.3 | 8.2 | 6.9 | 7.4 | 7.9 | 3.5 | 3.8 | 8.8 |
| No Mediterranean diet | 14,776 | 17.7 | 20.9 | 17.8 | 25.8 | 31.1 | 20.5 | 20.3 | 24.6 | 21.1 | 10.9 | 13.1 | 20.1 |
| No alcohol consumption | 15,107 | 10.8 | 11.8 | 8.8 | 10.1 | 11.2 | 10.5 | 14.8 | 16.8 | 13.3 | 5.8 | 6.5 | 11.9 |
| Yes alcohol consumption | 7436 | 16.8 | 19.3 | 14.9 | 23.9 | 29.6 | 23.9 | 26.9 | 33.5 | 24.5 | 10.9 | 13.1 | 19.8 |
| Women | n | % | % | Difference (%) | % | % | Difference (%) | % | % | Difference (%) | % | % | Difference (%) |
| <30 years | 2833 | 7.9 | 8.6 | 8.6 | 9.1 | 9.9 | 8.8 | 6.1 | 6.6 | 7.7 | 2.1 | 2.2 | 6.0 |
| 30–39 years | 4824 | 11.8 | 13.3 | 12.9 | 10.7 | 12.0 | 11.7 | 8.8 | 9.7 | 10.2 | 3.6 | 3.9 | 8.7 |
| 40–49 years | 4636 | 13.9 | 16.5 | 18.8 | 14.9 | 17.3 | 15.9 | 12.1 | 13.8 | 13.8 | 5.8 | 6.4 | 10.9 |
| 50–59 years | 2768 | 19.2 | 23.4 | 22.1 | 19.9 | 25.0 | 25.8 | 19.3 | 22.9 | 18.8 | 7.3 | 8.4 | 14.8 |
| Social class I | 1973 | 8.9 | 9.5 | 6.8 | 10.1 | 11.1 | 9.9 | 7.5 | 8.3 | 10.1 | 3.1 | 3.3 | 7.3 |
| Social class II | 4920 | 11.8 | 13.1 | 10.7 | 14.8 | 16.8 | 13.8 | 10.8 | 12.4 | 14.5 | 4.8 | 5.3 | 10.1 |
| Social class III | 8168 | 17.8 | 21.2 | 18.9 | 19.8 | 23.3 | 17.9 | 15.8 | 18.8 | 18.8 | 6.2 | 7.1 | 14.5 |
| Elementary school | 7289 | 17.6 | 20.8 | 18.1 | 19.5 | 23.0 | 18.1 | 15.3 | 18.1 | 18.6 | 6.0 | 6.9 | 14.3 |
| High school | 6056 | 12.0 | 13.4 | 11.6 | 15.1 | 17.2 | 13.9 | 11.0 | 12.6 | 14.7 | 4.9 | 5.4 | 10.2 |
| University | 1716 | 9.0 | 9.6 | 7.1 | 10.2 | 11.2 | 9.5 | 7.7 | 8.5 | 10.2 | 4.7 | 5.0 | 7.4 |
| Non-smokers | 10,236 | 10.8 | 12.0 | 11.1 | 13.5 | 15.1 | 12.1 | 10.8 | 11.9 | 10.3 | 4.0 | 4.4 | 8.8 |
| Smokers | 4825 | 14.8 | 16.9 | 14.2 | 16.2 | 19.4 | 19.8 | 14.9 | 17.3 | 16.4 | 5.9 | 6.7 | 13.8 |
| Yes physical activity | 7317 | 3.8 | 3.9 | 3.4 | 4.4 | 4.6 | 5.5 | 4.1 | 4.3 | 4.9 | 1.8 | 1.9 | 5.5 |
| No physical activity | 7744 | 15.8 | 17.5 | 10.9 | 15.5 | 18.7 | 20.5 | 18.8 | 22.1 | 17.8 | 9.5 | 11.0 | 16.2 |
| Yes Mediterranean diet | 7029 | 4.9 | 5.1 | 3.9 | 5.1 | 5.4 | 6.4 | 4.9 | 5.2 | 5.8 | 2.3 | 2.4 | 5.9 |
| No Mediterranean diet | 8032 | 14.1 | 15.5 | 10.1 | 14.1 | 16.7 | 18.5 | 16.1 | 18.6 | 15.4 | 9.0 | 10.3 | 14.6 |
| No alcohol consumption | 12,750 | 8.9 | 9.6 | 7.7 | 7.7 | 8.5 | 9.9 | 7.9 | 8.7 | 10.2 | 3.7 | 4.0 | 8.4 |
| Yes alcohol consumption | 2311 | 13.9 | 15.6 | 12.2 | 16.9 | 20.3 | 20.3 | 16.8 | 20.2 | 20.3 | 7.8 | 9.1 | 17.2 |
Disclaimer/Publisher’s Note: The statements, opinions and data contained in all publications are solely those of the individual author(s) and contributor(s) and not of MDPI and/or the editor(s). MDPI and/or the editor(s) disclaim responsibility for any injury to people or property resulting from any ideas, methods, instructions or products referred to in the content. |
© 2025 by the authors. Licensee MDPI, Basel, Switzerland. This article is an open access article distributed under the terms and conditions of the Creative Commons Attribution (CC BY) license (https://creativecommons.org/licenses/by/4.0/).
Share and Cite
Obrador de Hevia, J.; López-González, Á.A.; Ramírez-Manent, J.I.; Busquets-Cortes, C.; Tárraga López, P.J.; García Samuelsson, M.; Riutord-Sbert, P. Atherogenic Risk and Its Association with Alcohol Consumption, Lifestyle Habits, and Sociodemographic Factors in a Population of Spanish Workers. Life 2025, 15, 923. https://doi.org/10.3390/life15060923
Obrador de Hevia J, López-González ÁA, Ramírez-Manent JI, Busquets-Cortes C, Tárraga López PJ, García Samuelsson M, Riutord-Sbert P. Atherogenic Risk and Its Association with Alcohol Consumption, Lifestyle Habits, and Sociodemographic Factors in a Population of Spanish Workers. Life. 2025; 15(6):923. https://doi.org/10.3390/life15060923
Chicago/Turabian StyleObrador de Hevia, Joan, Ángel Arturo López-González, José Ignacio Ramírez-Manent, Carla Busquets-Cortes, Pedro Juan Tárraga López, Miguel García Samuelsson, and Pere Riutord-Sbert. 2025. "Atherogenic Risk and Its Association with Alcohol Consumption, Lifestyle Habits, and Sociodemographic Factors in a Population of Spanish Workers" Life 15, no. 6: 923. https://doi.org/10.3390/life15060923
APA StyleObrador de Hevia, J., López-González, Á. A., Ramírez-Manent, J. I., Busquets-Cortes, C., Tárraga López, P. J., García Samuelsson, M., & Riutord-Sbert, P. (2025). Atherogenic Risk and Its Association with Alcohol Consumption, Lifestyle Habits, and Sociodemographic Factors in a Population of Spanish Workers. Life, 15(6), 923. https://doi.org/10.3390/life15060923