Author Contributions
Conceptualization, F.C. and S.A.; methodology, F.C.; software, F.C.; validation, F.C., S.A. and M.P.P.; formal analysis, S.L.; investigation, S.L.; resources, M.P.P.; data curation, G.M.; writing—original draft preparation, F.C.; writing—review and editing, S.A.; visualization, S.D.F.; supervision, S.D.F.; project administration, G.M.; funding acquisition, G.M. All authors have read and agreed to the published version of the manuscript.
Figure 1.
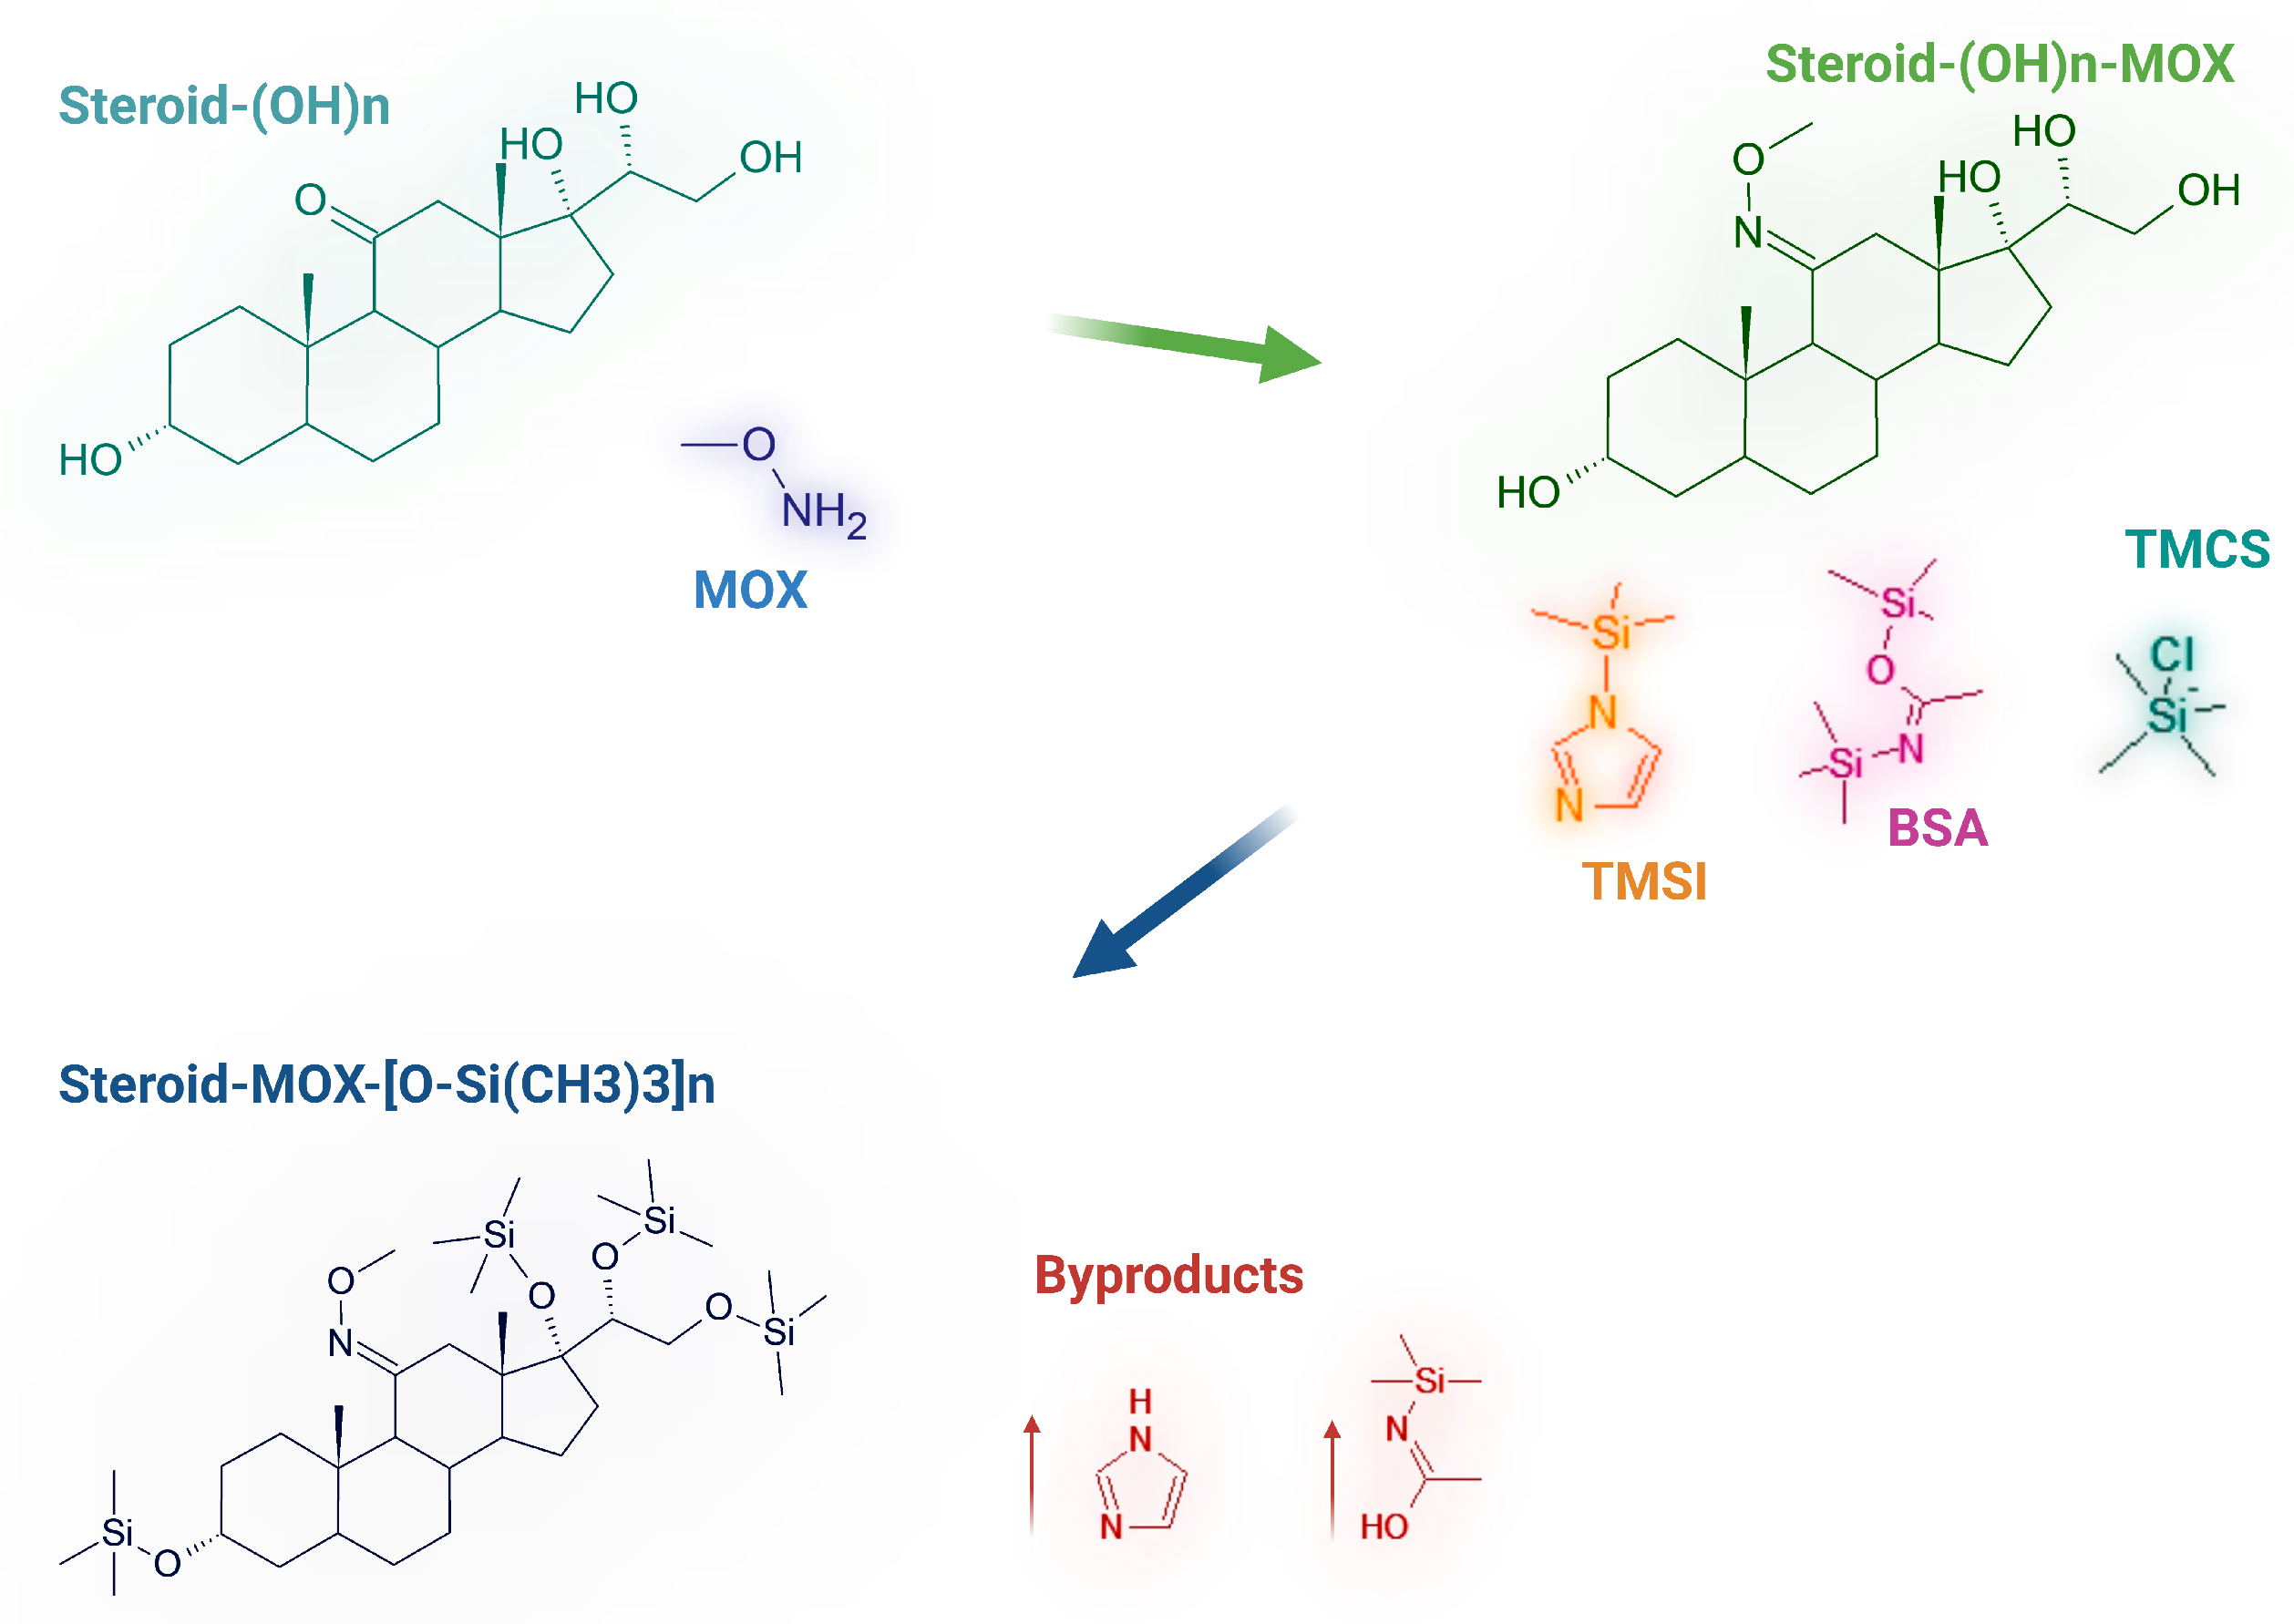
Reaction scheme of the derivatization process for hydroxysteroids: methoximation (MOX) followed by silylation using a mixture of BSA (N,O-Bis(trimethylsilyl)acetamide), TMCS (chlorotrimethylsilane), and TMSI (trimethylsilylimidazole). The resulting derivatives are trimethylsilyl (TMS)-protected steroids, as shown in the final structure.
Figure 1.
Reaction scheme of the derivatization process for hydroxysteroids: methoximation (MOX) followed by silylation using a mixture of BSA (N,O-Bis(trimethylsilyl)acetamide), TMCS (chlorotrimethylsilane), and TMSI (trimethylsilylimidazole). The resulting derivatives are trimethylsilyl (TMS)-protected steroids, as shown in the final structure.
Figure 2.
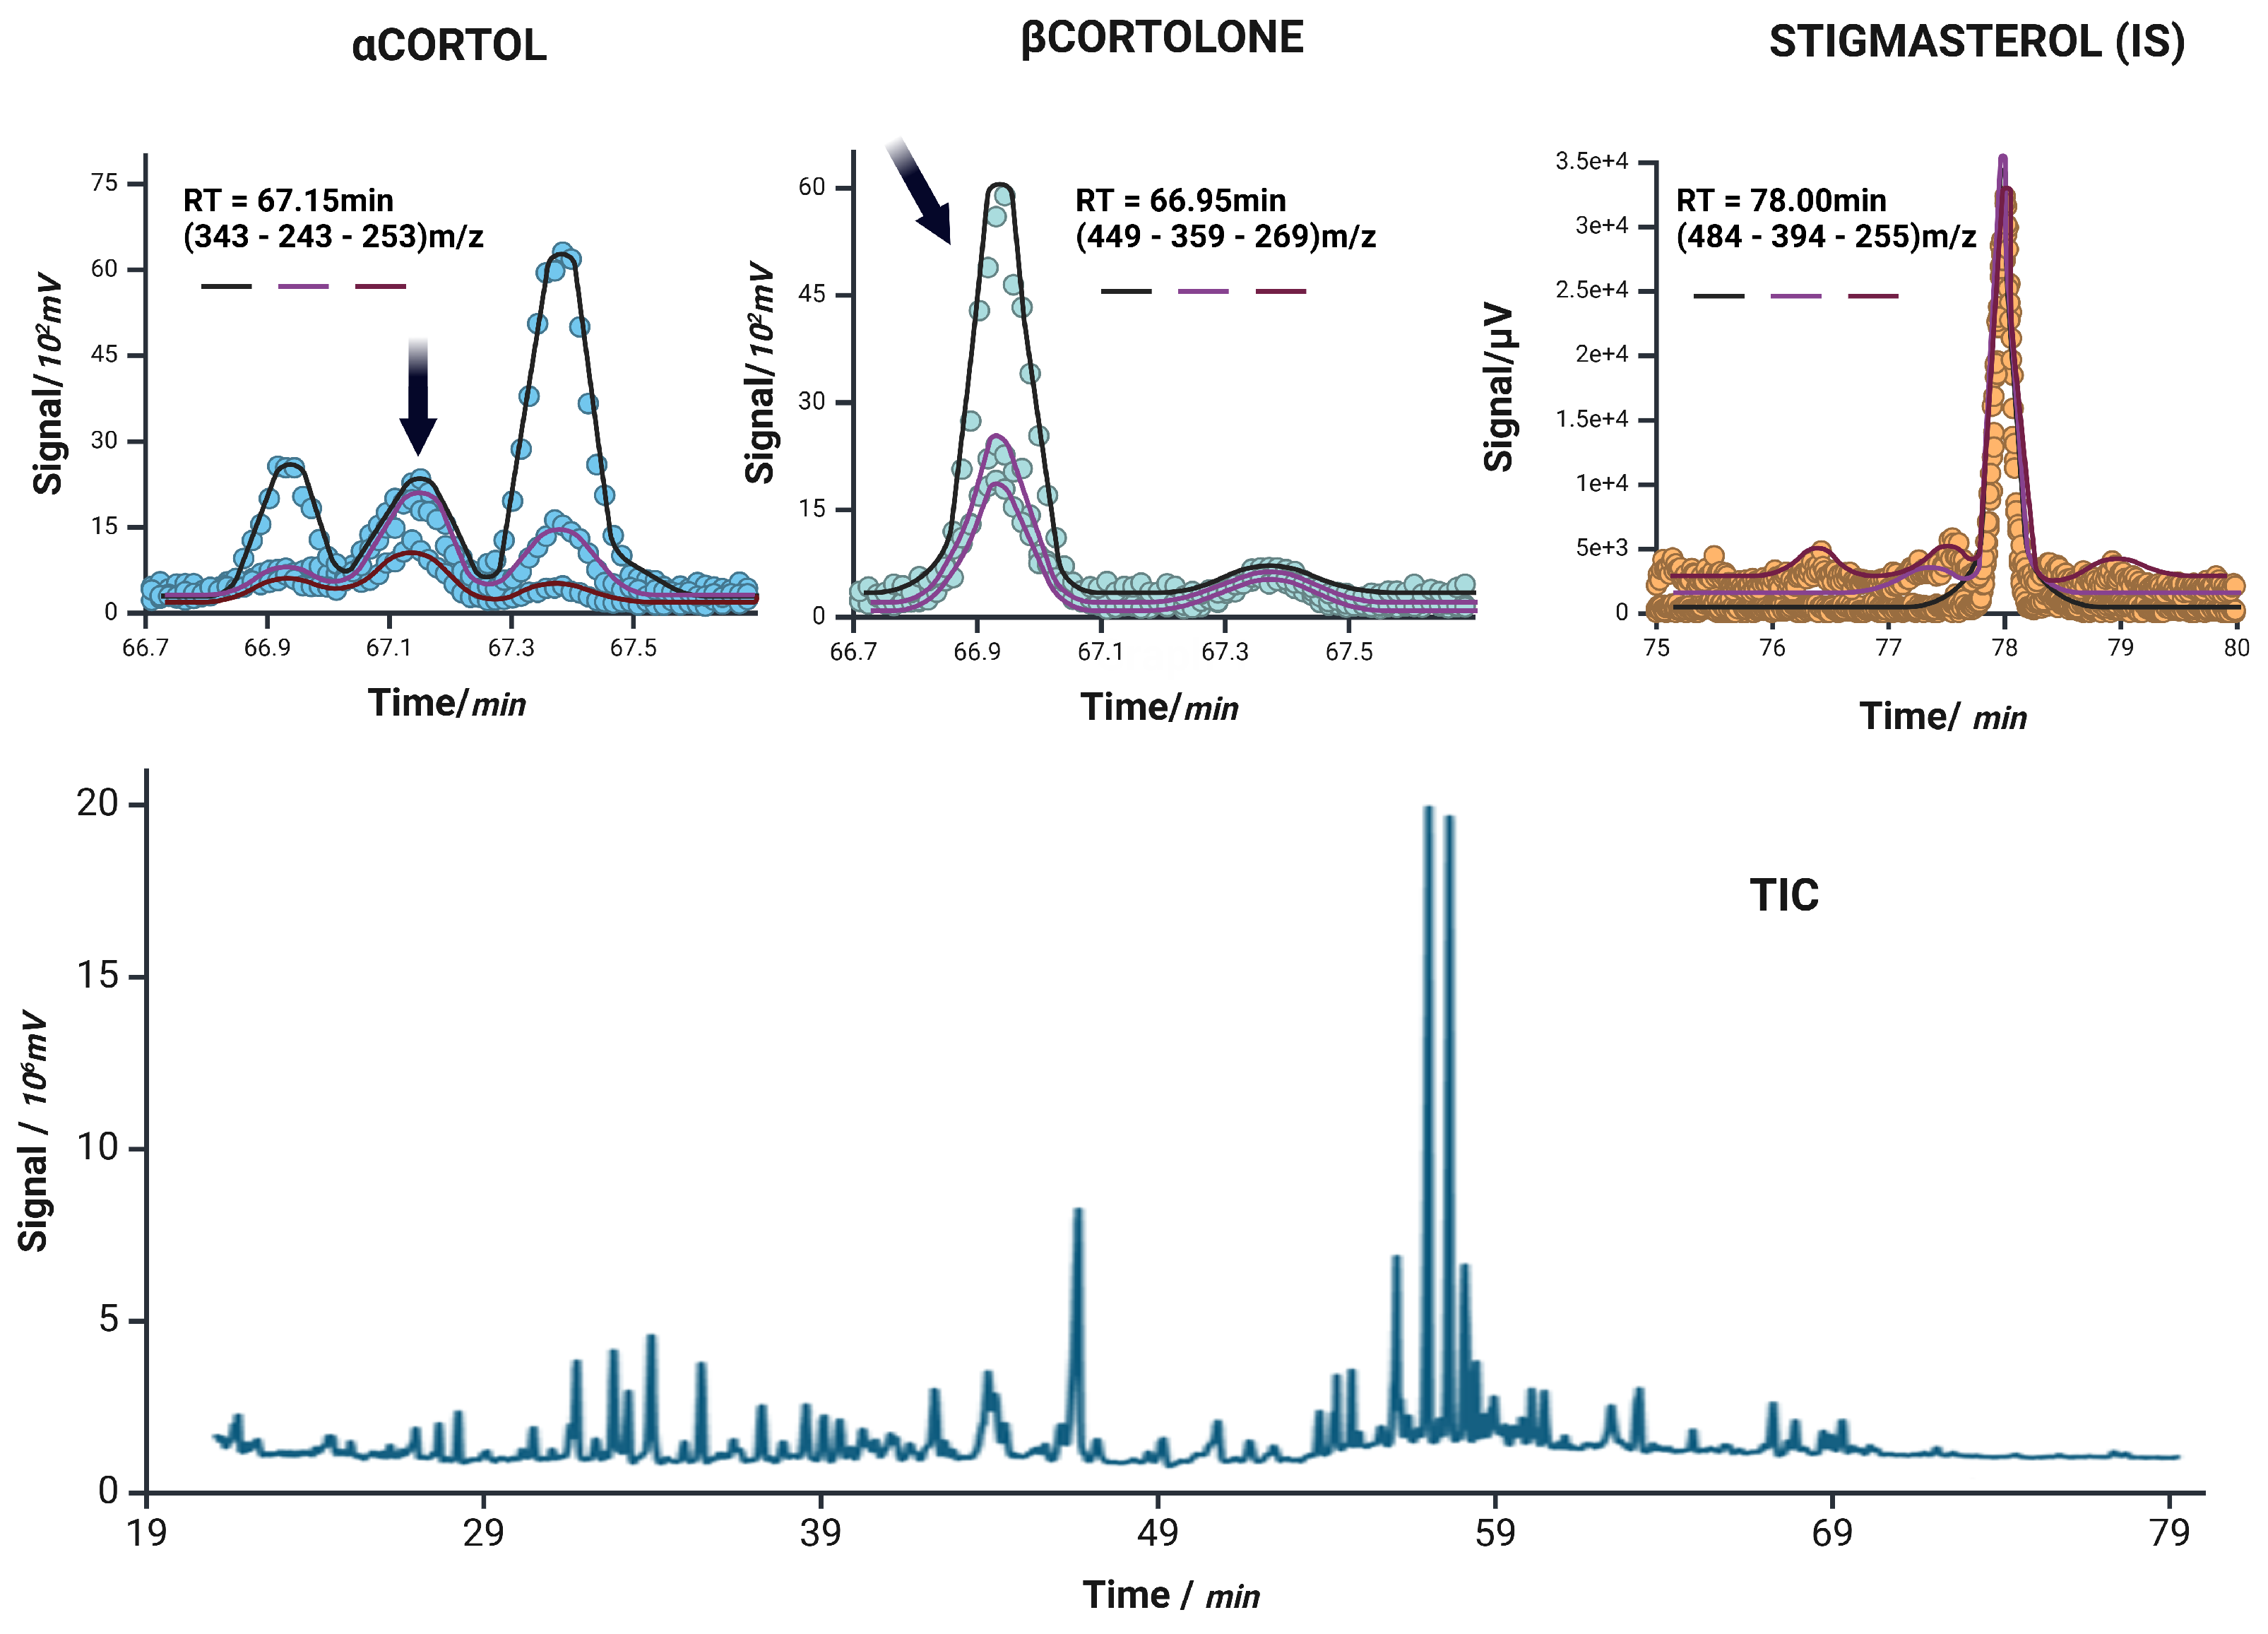
Extracted ion chromatograms for -Cortol, -Cortolone, and the internal standard stigmasterol (IS) are shown in the top row. Each panel displays the ion currents of the monitored transitions: target ion (black), qualifier 1 (magenta), and qualifier 2 (purple), corresponding to m/z values used in the acquisition. Dots represent the raw signal intensity, while the overlaid solid lines reflect the smoothed chromatographic profiles of each individual ion current. The bottom panel shows the unprocessed total ion current (TIC) chromatogram of a representative sample, illustrating the overall complexity and retention time distribution of the steroidal metabolites analyzed.
Figure 2.
Extracted ion chromatograms for -Cortol, -Cortolone, and the internal standard stigmasterol (IS) are shown in the top row. Each panel displays the ion currents of the monitored transitions: target ion (black), qualifier 1 (magenta), and qualifier 2 (purple), corresponding to m/z values used in the acquisition. Dots represent the raw signal intensity, while the overlaid solid lines reflect the smoothed chromatographic profiles of each individual ion current. The bottom panel shows the unprocessed total ion current (TIC) chromatogram of a representative sample, illustrating the overall complexity and retention time distribution of the steroidal metabolites analyzed.
Figure 3.
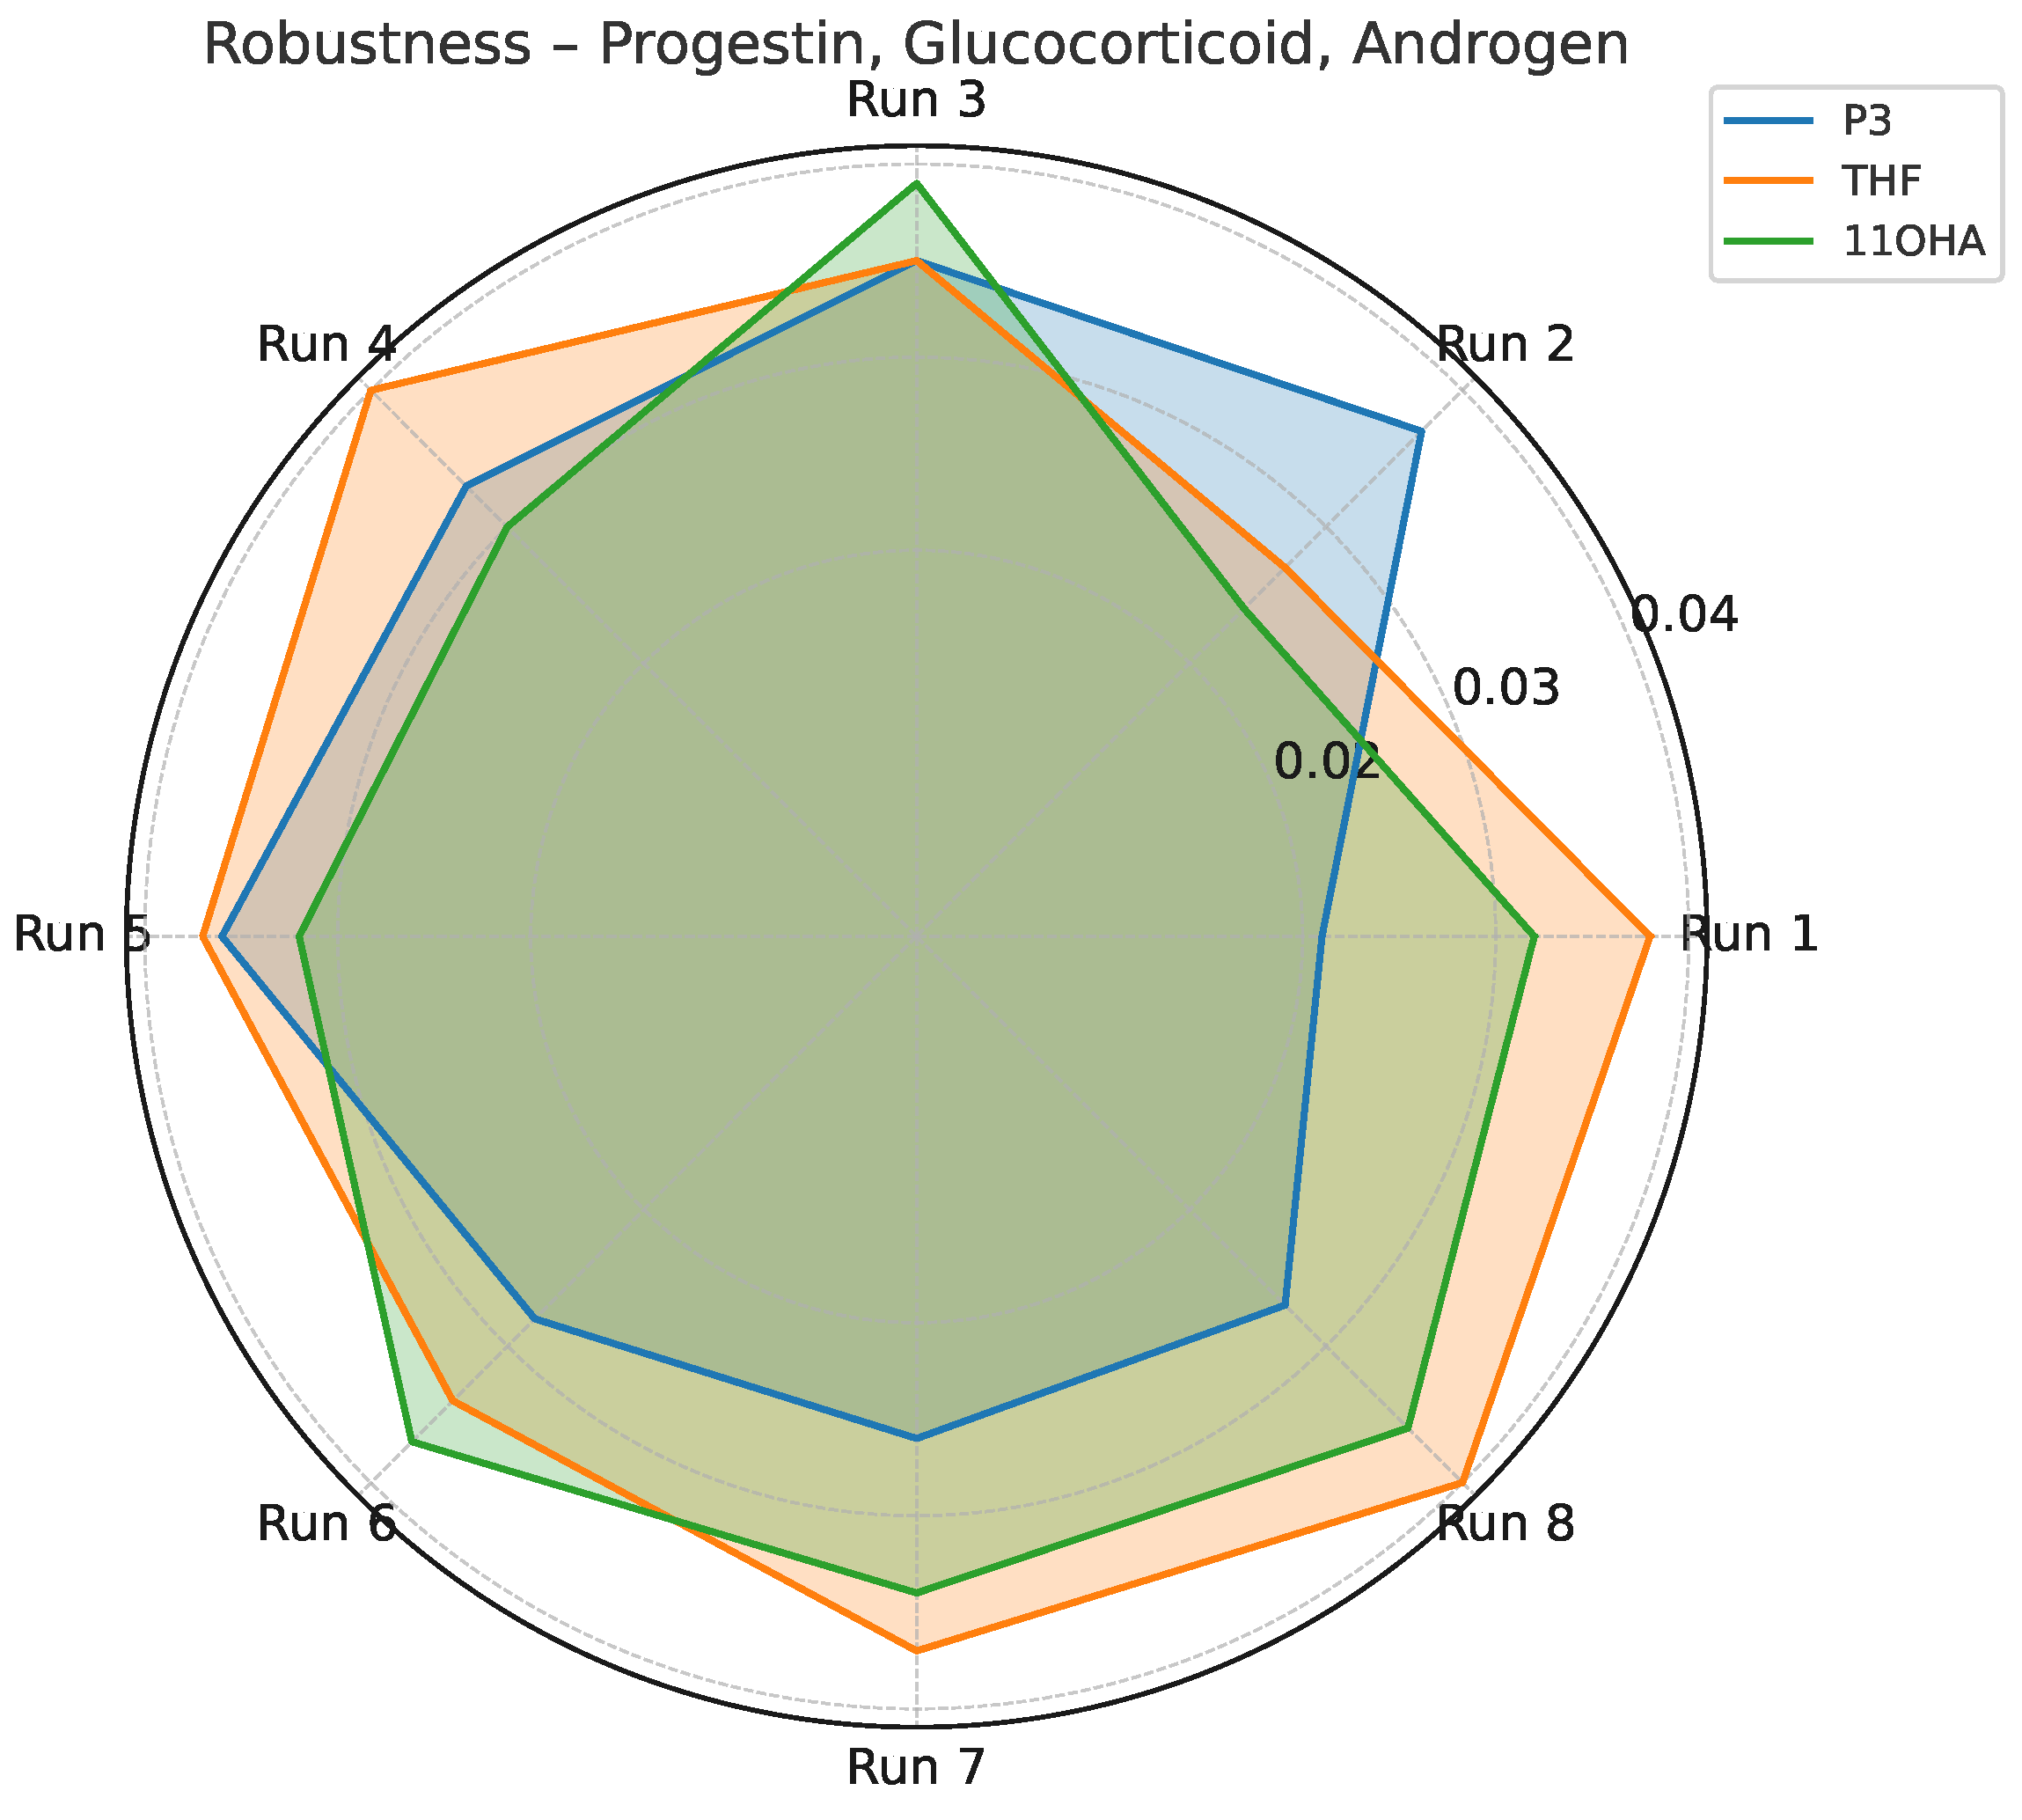
Standard deviation profile for P3, THF, and 11OHA across robustness testing conditions (Yates matrix).
Figure 3.
Standard deviation profile for P3, THF, and 11OHA across robustness testing conditions (Yates matrix).
Figure 4.
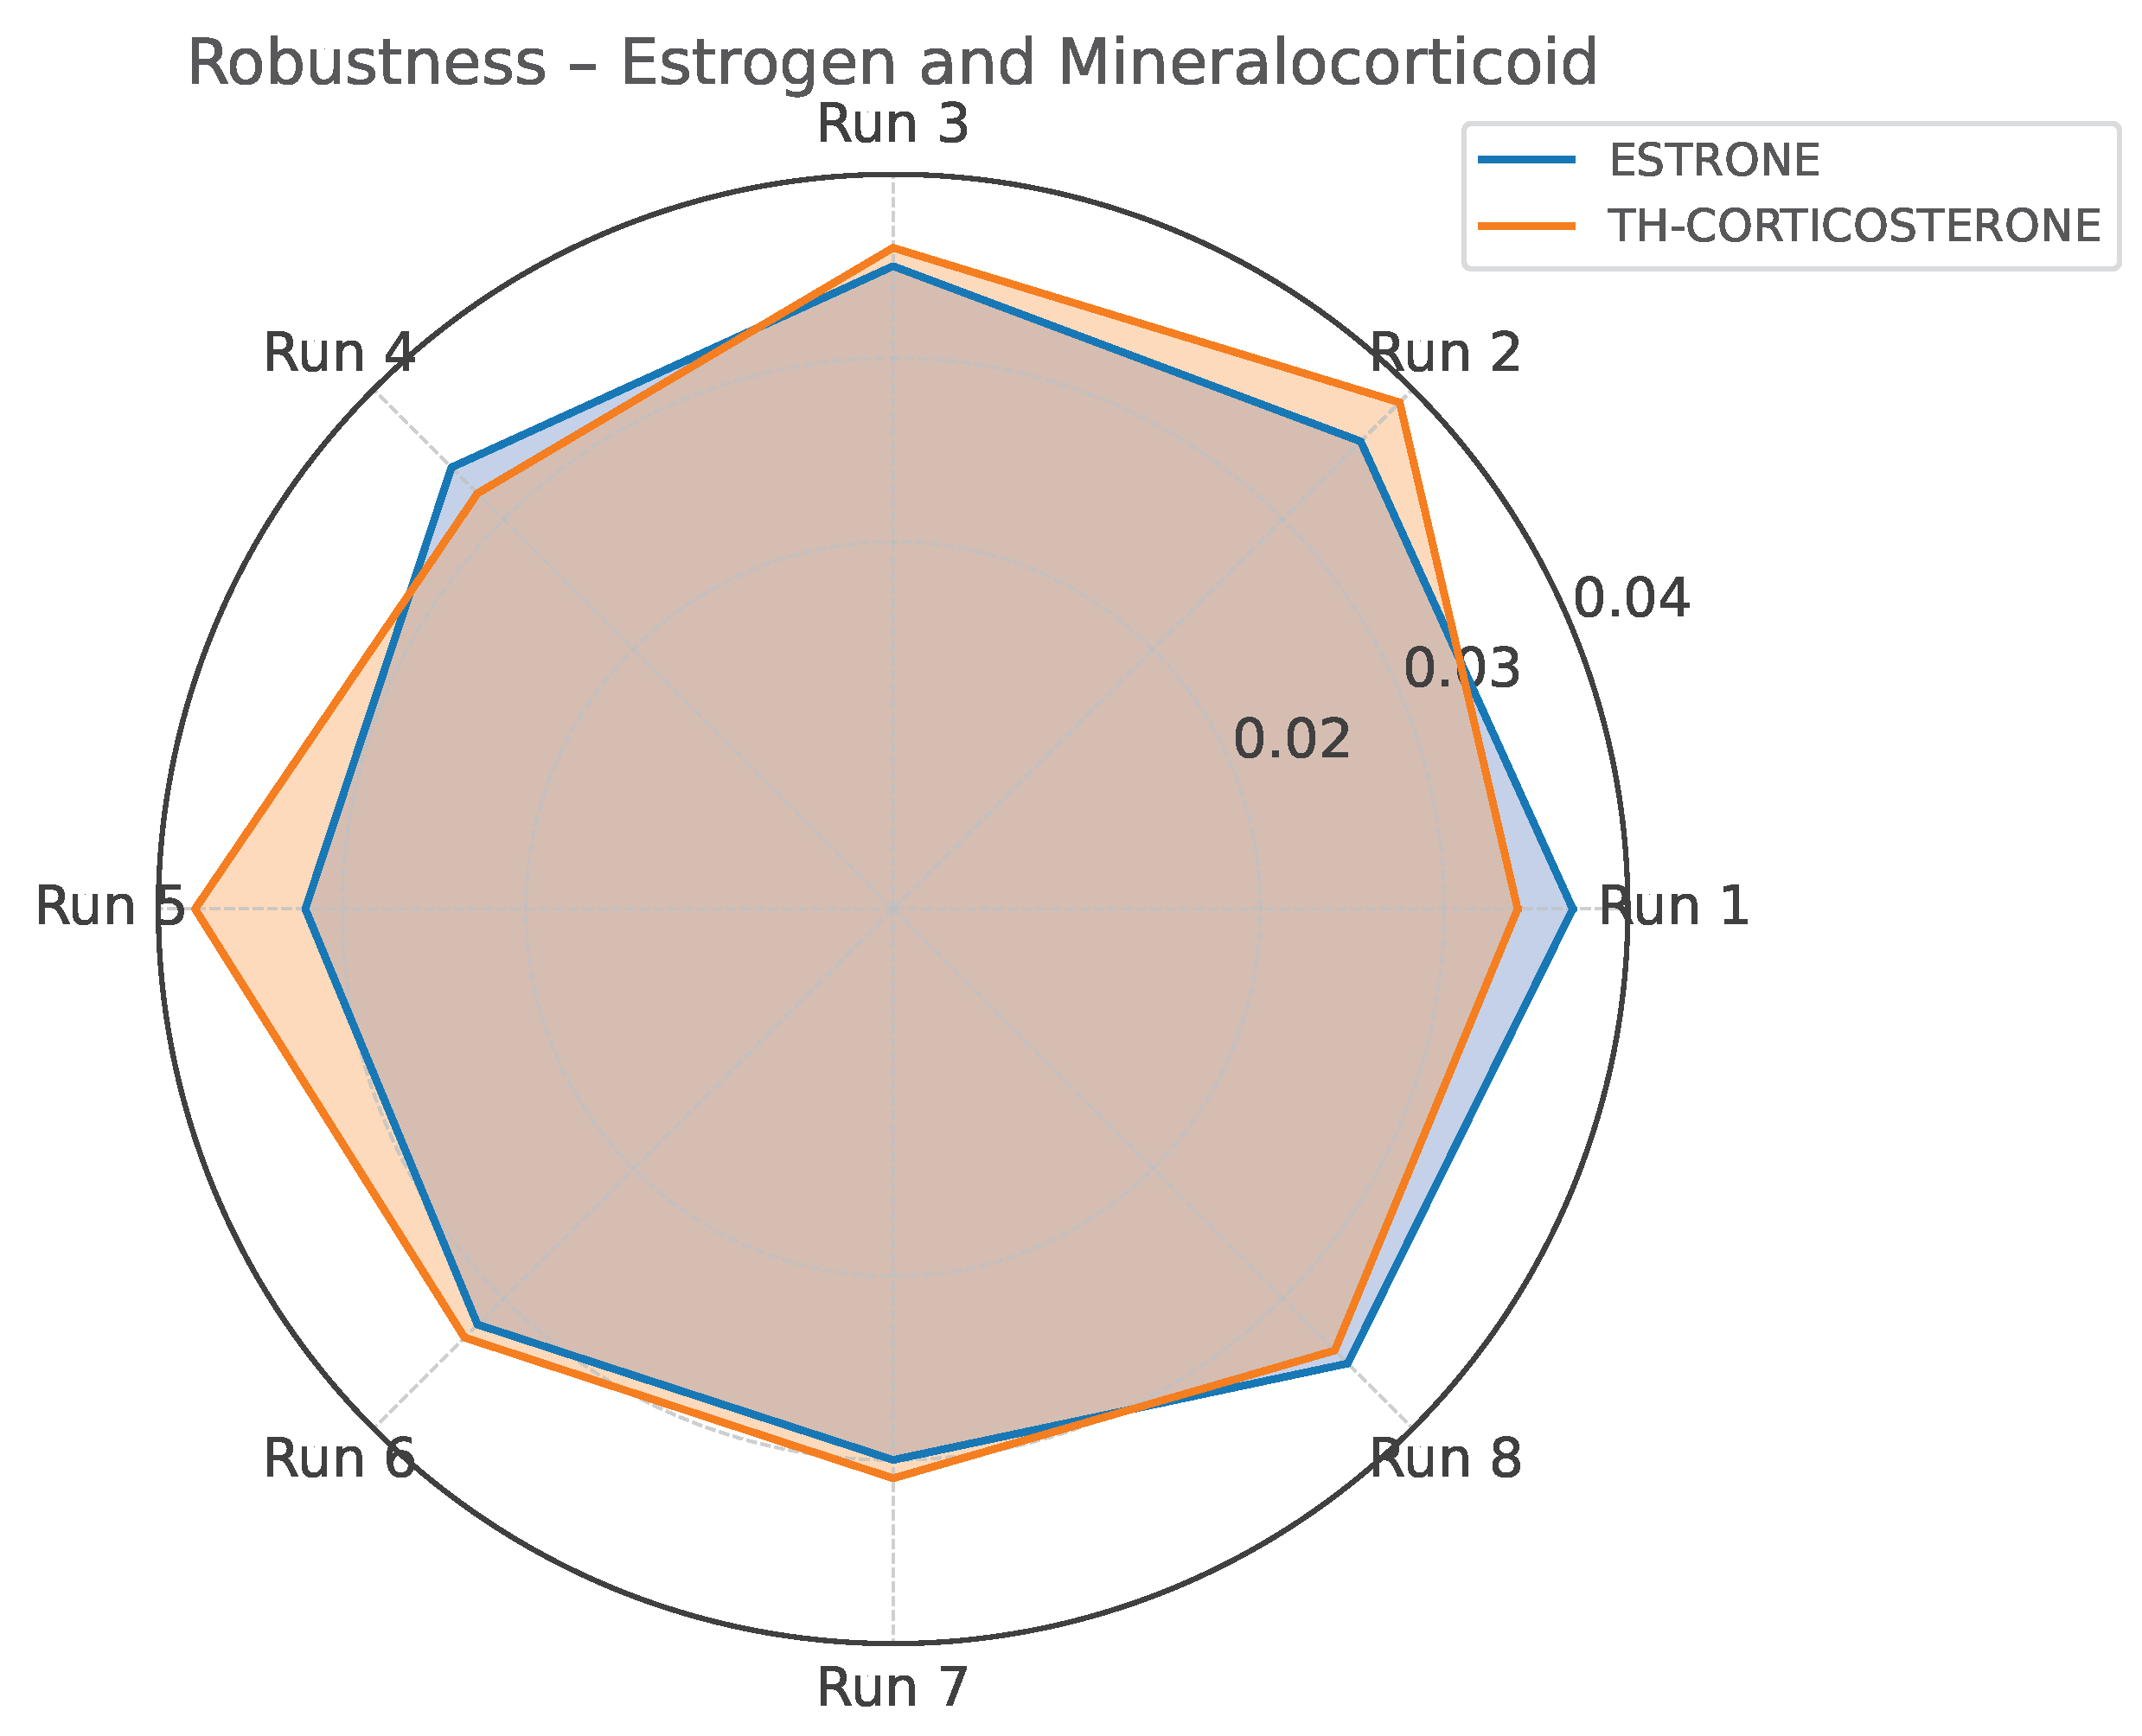
Standard deviation profile for Estrone and TH-Corticosterone across robustness testing conditions (Yates matrix).
Figure 4.
Standard deviation profile for Estrone and TH-Corticosterone across robustness testing conditions (Yates matrix).
Table 1.
Steroid metabolites in the progestins group with retention times and associated clinical conditions.
Table 1.
Steroid metabolites in the progestins group with retention times and associated clinical conditions.
| Analyte | Abbreviation | RT (min) | Associated Conditions |
|---|
| 17OH-Pregnanolone | 17HP | 45.72 | Elevated in CAH due to 21-hydroxylase or 11-hydroxylase deficiency. |
| Pregnanediol | P2 | 50.66 | Major metabolite of progesterone; increased in 21-hydroxylase deficiency (classic CAH). |
| Pregnentriol | 5PT | 60.29 | Marker of 3-hydroxysteroid dehydrogenase (3-HSD) deficiency; increased in non-classic CAH variants. |
| Pregnantriolone | PTONE | 60.67 | Derived from 17-hydroxyprogesterone (17OHP); elevated in 21-hydroxylase deficiency. Often reported with pregnanetriol. |
| Pregnantriol | PT | 61.92 | Major urinary metabolite of 17OHP; markedly elevated in 21- and 11-hydroxylase deficiency (CAH). |
Table 2.
Steroid metabolites in the mineralocorticoids group with retention times and associated clinical conditions.
Table 2.
Steroid metabolites in the mineralocorticoids group with retention times and associated clinical conditions.
| Analyte | Abbreviation | RT (min) | Associated Conditions |
|---|
| TH-11-Deoxycorticosterone | THDOC | 60.38 | Metabolite of DOC; elevated in 11-hydroxylase deficiency, sometimes in AME. |
| 5-TH-Corticosterone | 5THB | 64.04 | Metabolite in the aldosterone biosynthesis pathway. |
| TH-Corticosterone | THB | 64.80 | Aldosterone pathway metabolite. |
| TH-11-Dehydrocorticosterone | THA | 65.04 | Derived from 11-dehydrocorticosterone; altered in 11-hydroxylase deficiency. |
Table 3.
Steroid metabolites in the glucocorticoids group with retention times and associated clinical conditions.
Table 3.
Steroid metabolites in the glucocorticoids group with retention times and associated clinical conditions.
| Analyte | Abbreviation | RT (min) | Associated Conditions |
|---|
| 11-Keto-Etiocholanolone | 11ketoET | 42.88 | Metabolite of cortisone pathway. |
| 11-OH-Etiocholanolone | 11OHET | 45.79 | Elevated in 11-hydroxylase deficiency. |
| TH-11-Deoxycortisol | THS | 57.39 | Highly elevated in 11-hydroxylase deficiency. |
| TH-Cortisone | THE | 63.03 | Cortisone metabolite. |
| TH-Cortisol | THF | 63.80 | Cortisol metabolite. |
| 5-TH-Cortisol | 5THF | 64.33 | Cortisol metabolite; used in 5/5 ratio for ACRD. |
| -Cortol | Cortol | 65.10 | Cortisol metabolite; altered in ACRD. |
| -Cortolone | Cortolone | 65.40 | Cortisol metabolite; altered in ACRD. |
| -Cortolone | Cortolone | 66.75 | Cortisol metabolite; altered in ACRD. |
| -Cortol | Cortol | 66.95 | Cortisol metabolite; altered in ACRD. |
| Cortisol | F | 77.63 | Primary glucocorticoid excreted in urine. |
| 20-Dihydro-Cortisol | 20DHF | 81.19 | Minor cortisol metabolite. |
Table 4.
Steroid metabolites in the androgens group with retention times and associated clinical conditions.
Table 4.
Steroid metabolites in the androgens group with retention times and associated clinical conditions.
| Analyte | Abbreviation | RT (min) | Associated Conditions |
|---|
| 5-Androstanediol | 5ADIOL | 30.50 | Androgen metabolite. |
| Androsterone | AN | 34.24 | Elevated in CAH and androgen excess. ET/AN ratio is informative. |
| 5-Androstenediol | D5-ADIOL | 34.37 | Altered in 3-HSD deficiency. |
| Etiocholanolone | ET | 35.40 | Elevated in CAH and androgen excess. ET/AN ratio is informative. |
| Dehydroepiandrosterone | DHEA | 38.25 | Precursor/metabolite in adrenal androgen pathway; elevated in CAH and adrenal tumors. |
| 11-OH-Androsterone | 11OHAN | 40.00 | Derived from cortisol metabolism; elevated in 11-hydroxylase deficiency. |
| 16-OH-DHEA | 16OHDHEA | 47.90 | DHEA pathway metabolite. |
| Androstenetriol | D5-ATRIOL | 53.02 | Altered in 3-HSD deficiency. |
Table 5.
Steroid metabolites in the estrogens group with retention times and associated clinical conditions.
Table 5.
Steroid metabolites in the estrogens group with retention times and associated clinical conditions.
| Analyte | Abbreviation | RT (min) | Associated Conditions |
|---|
| Estrone | E1 | 43.39 | Estrogen metabolite. |
| Estriol | E3 | 59.14 | Estrogen metabolite; also a pregnancy marker. |
| 17-Estradiol | E2 | 76.06 | Estrogen metabolite. |
Table 6.
Slope and intercept parameters with 95% confidence intervals for progestins (GC-MS).
Table 6.
Slope and intercept parameters with 95% confidence intervals for progestins (GC-MS).
| Analytes | Slope (m) | CIlow(m) | CIhigh(m) | Intercept (q) | CIlow(q) | CIhigh(q) |
|---|
| P2 | 0.0326 | 0.0309 | 0.0343 | 0.0913 | 0.0529 | 0.1298 |
| 5PT | 0.0111 | 0.0107 | 0.0115 | 0.1459 | 0.1368 | 0.1550 |
| 17HP | 0.0337 | 0.0330 | 0.0345 | 0.1922 | 0.1754 | 0.2090 |
| PT | 0.0153 | 0.0150 | 0.0156 | 0.1379 | 0.1311 | 0.1447 |
| PTONE | 0.0686 | 0.0656 | 0.0717 | 0.0970 | 0.0282 | 0.1658 |
Table 7.
LOD, LOQ, LLOQ, recovery, and for progestins (GC-MS).
Table 7.
LOD, LOQ, LLOQ, recovery, and for progestins (GC-MS).
| Analytes | LOD (g/mL) | LOQ (g/mL) | LLOQ (g/mL) | Recovery (%) | R2 |
|---|
| P2 | 2.172 | 6.581 | 0.010 | 97.7100 | 0.9986 |
| 5PT | 1.507 | 4.567 | 0.010 | 109.3800 | 0.9993 |
| 17HP | 0.919 | 2.785 | 0.010 | 107.7000 | 0.9997 |
| PT | 0.818 | 2.478 | 0.010 | 102.5500 | 0.9998 |
| PTONE | 1.848 | 5.599 | 0.010 | 110.3000 | 0.9990 |
Table 8.
Slope and intercept parameters with 95% confidence intervals for mineralocorticoids (GC-MS).
Table 8.
Slope and intercept parameters with 95% confidence intervals for mineralocorticoids (GC-MS).
| Analytes | Slope (m) | CIlow(m) | CIhigh(m) | Intercept (q) | CIlow(q) | CIhigh(q) |
|---|
| THDOC | 0.0490 | 0.0477 | 0.0504 | 0.0068 | −0.0234 | 0.0369 |
| THA | 0.0784 | 0.0764 | 0.0803 | 0.1371 | 0.0938 | 0.1804 |
| 5THB | 0.0483 | 0.0469 | 0.0497 | 0.0611 | 0.0299 | 0.0923 |
| THB | 0.0568 | 0.0548 | 0.0589 | 0.0967 | 0.0502 | 0.1431 |
Table 9.
LOD, LOQ, LLOQ, recovery, and for mineralocorticoids (GC-MS).
Table 9.
LOD, LOQ, LLOQ, recovery, and for mineralocorticoids (GC-MS).
| Analytes | LOD (g/mL) | LOQ (g/mL) | LLOQ (g/mL) | Recovery (%) | R2 |
|---|
| THDOC | 1.132 | 3.431 | 0.010 | 99.2100 | 0.9996 |
| THA | 1.018 | 3.086 | 0.010 | 103.2100 | 0.9997 |
| 5THB | 1.190 | 3.606 | 0.010 | 94.9100 | 0.9996 |
| THB | 1.505 | 4.561 | 0.010 | 112.0600 | 0.9993 |
Table 10.
Slope and intercept parameters with 95% confidence intervals for glucocorticoids (GC-MS).
Table 10.
Slope and intercept parameters with 95% confidence intervals for glucocorticoids (GC-MS).
| Analytes | Slope (m) | CIlow(m) | CIhigh(m) | Intercept (q) | CIlow(q) | CIhigh(q) |
|---|
| THS | 0.0469 | 0.0463 | 0.0474 | 0.0590 | 0.0460 | 0.0721 |
| F | 0.0762 | 0.0734 | 0.0790 | 0.1532 | 0.0911 | 0.2152 |
| THF | 0.0099 | 0.0090 | 0.0108 | 0.0277 | 0.0084 | 0.0469 |
| 5-THF | 0.0321 | 0.0303 | 0.0339 | 0.1534 | 0.1135 | 0.1932 |
| -Cortol | 0.0412 | 0.0396 | 0.0427 | 0.1401 | 0.1046 | 0.1757 |
| -Cortol | 0.0276 | 0.0269 | 0.0284 | 0.1468 | 0.1297 | 0.1638 |
| 20-DHF | 0.0242 | 0.0207 | 0.0276 | 0.2051 | 0.1275 | 0.2827 |
| 11-OHET | 0.0396 | 0.0378 | 0.0415 | 0.1408 | 0.0997 | 0.1819 |
| THE | 0.0178 | 0.0167 | 0.0189 | 0.1304 | 0.1052 | 0.1556 |
| -Cortolone | 0.0540 | 0.0530 | 0.0551 | 0.0312 | 0.0069 | 0.0554 |
| -Cortolone | 0.0151 | 0.0143 | 0.0160 | 0.0769 | 0.0575 | 0.0962 |
| 11ketoET | 0.0289 | 0.0279 | 0.0299 | 0.1169 | 0.0934 | 0.1404 |
Table 11.
LOD, LOQ, LLOQ, recovery, and for glucocorticoids (GC-MS).
Table 11.
LOD, LOQ, LLOQ, recovery, and for glucocorticoids (GC-MS).
| Analytes | LOD (g/mL) | LOQ (g/mL) | LLOQ (g/mL) | Recovery (%) | R2 |
|---|
| THS | 0.513 | 1.554 | 0.010 | 96.6000 | 0.9999 |
| F | 1.500 | 4.545 | 0.010 | 90.9700 | 0.9993 |
| THF | 3.577 | 10.839 | 0.010 | 108.9800 | 0.9961 |
| 5-THF | 2.285 | 6.925 | 0.010 | 91.1600 | 0.9984 |
| -Cortol | 1.591 | 4.822 | 0.010 | 98.6300 | 0.9992 |
| -Cortol | 1.137 | 3.444 | 0.010 | 90.2400 | 0.9996 |
| 20-DHF | 5.919 | 17.936 | 0.010 | 114.8800 | 0.9895 |
| 11-OHET | 1.912 | 5.794 | 0.010 | 99.5000 | 0.9989 |
| THE | 2.617 | 7.930 | 0.010 | 94.2900 | 0.9979 |
| -Cortolone | 0.826 | 2.503 | 0.010 | 90.6800 | 0.9998 |
| -Cortolone | 2.352 | 7.126 | 0.010 | 111.3100 | 0.9983 |
| 11ketoET | 1.501 | 4.549 | 0.010 | 89.1100 | 0.9993 |
Table 12.
Slope and intercept parameters with 95% confidence intervals for androgens (GC-MS).
Table 12.
Slope and intercept parameters with 95% confidence intervals for androgens (GC-MS).
| Analytes | Slope (m) | CIlow(m) | CIhigh(m) | Intercept (q) | CIlow(q) | CIhigh(q) |
|---|
| DHEA | 0.0399 | 0.0390 | 0.0408 | 0.1195 | 0.1000 | 0.1389 |
| 16-OHDHEA | 0.0317 | 0.0306 | 0.0329 | 0.0435 | 0.0178 | 0.0692 |
| D5-ADIOL | 0.0792 | 0.0770 | 0.0814 | 0.0916 | 0.0427 | 0.1405 |
| D5-ATRIOL | 0.0286 | 0.0265 | 0.0306 | 0.1465 | 0.1008 | 0.1922 |
| ET | 0.0477 | 0.0466 | 0.0488 | 0.0132 | −0.0114 | 0.0377 |
| AN | 0.0248 | 0.0239 | 0.0257 | 0.0869 | 0.0667 | 0.1070 |
| 5-ADIOL | 0.0096 | 0.0091 | 0.0101 | 0.1874 | 0.1758 | 0.1990 |
| 11-OHAN | 0.0577 | 0.0526 | 0.0627 | 0.1363 | 0.0237 | 0.2489 |
Table 13.
LOD, LOQ, LLOQ, recovery, and for androgens (GC-MS).
Table 13.
LOD, LOQ, LLOQ, recovery, and for androgens (GC-MS).
| Analytes | LOD (g/mL) | LOQ (g/mL) | LLOQ (g/mL) | Recovery (%) | R2 |
|---|
| DHEA | 0.899 | 2.724 | 0.010 | 88.7100 | 0.9998 |
| 16-OHDHEA | 1.491 | 4.519 | 0.010 | 89.6400 | 0.9993 |
| D5-ADIOL | 1.137 | 3.447 | 0.010 | 111.3700 | 0.9996 |
| D5-ATRIOL | 2.947 | 8.930 | 0.010 | 103.6200 | 0.9974 |
| ET | 0.948 | 2.871 | 0.010 | 97.8000 | 0.9997 |
| AN | 1.497 | 4.536 | 0.010 | 101.5400 | 0.9993 |
| 5-ADIOL | 2.233 | 6.766 | 0.010 | 97.0200 | 0.9985 |
| 11-OHAN | 3.599 | 10.906 | 0.010 | 90.5600 | 0.9961 |
Table 14.
Slope and intercept parameters with 95% confidence intervals for estrogens (GC-MS).
Table 14.
Slope and intercept parameters with 95% confidence intervals for estrogens (GC-MS).
| Analytes | Slope (m) | CIlow(m) | CIhigh(m) | Intercept (q) | CIlow(q) | CIhigh(q) |
|---|
| E3 | 0.0636 | 0.0619 | 0.0654 | 0.0807 | 0.0410 | 0.1204 |
| E2 | 0.0607 | 0.0584 | 0.0630 | 0.0049 | −0.0463 | 0.0561 |
| E1 | 0.0625 | 0.0570 | 0.0681 | 0.1231 | −0.0012 | 0.2474 |
Table 15.
LOD, LOQ, LLOQ, recovery, and for estrogens (GC-MS).
Table 15.
LOD, LOQ, LLOQ, recovery, and for estrogens (GC-MS).
| Analytes | LOD (g/mL) | LOQ (g/mL) | LLOQ (g/mL) | Recovery (%) | R2 |
|---|
| E3 | 1.149 | 3.481 | 0.010 | 99.1000 | 0.9996 |
| E2 | 1.555 | 4.712 | 0.010 | 101.6600 | 0.9993 |
| E1 | 3.662 | 11.097 | 0.010 | 114.5100 | 0.9960 |
Table 16.
Repeatability (Rep.) and reproducibility (Repr.) expressed as CV% for urinary progestin metabolites. Analytes: Rep. = Repeatability; Repr. = Reproducibility; Tgt = target ion; Q1 and Q2 = qualifier ions.
Table 16.
Repeatability (Rep.) and reproducibility (Repr.) expressed as CV% for urinary progestin metabolites. Analytes: Rep. = Repeatability; Repr. = Reproducibility; Tgt = target ion; Q1 and Q2 = qualifier ions.
| Analyte | QC Level | Rep. (%CV) | Repr. (%CV) | Tgt (m/z) | Q1 (m/z) | Q2 (m/z) |
|---|
| 17HP | High | 11.1 | 11.8 | 476 | 386 | 364 |
| 17HP | Low | 8.4 | 8.8 | 476 | 386 | 364 |
| 17HP | Medium | 9.7 | 10.7 | 476 | 386 | 364 |
| P2 | High | 10.2 | 11.0 | 284 | 346 | 449 |
| P2 | Low | 9.9 | 11.2 | 284 | 346 | 449 |
| P2 | Medium | 6.0 | 7.7 | 284 | 346 | 449 |
| PT | High | 10.6 | 10.9 | 433 | 343 | 253 |
| PT | Low | 8.5 | 10.2 | 433 | 343 | 253 |
| PT | Medium | 7.5 | 8.1 | 433 | 343 | 253 |
| PTNE | High | 4.7 | 6.2 | 449 | 269 | 359 |
| PTNE | Low | 7.2 | 7.9 | 449 | 269 | 359 |
| PTNE | Medium | 5.6 | 7.3 | 449 | 269 | 359 |
| 5PT | High | 5.3 | 6.7 | 372 | 462 | 267 |
| 5PT | Low | 9.6 | 10.9 | 372 | 462 | 267 |
| 5PT | Medium | 6.8 | 8.6 | 372 | 462 | 267 |
Table 17.
Repeatability (Rep.) and reproducibility (Repr.) expressed as CV% for urinary mineralocorticoid metabolites. Analytes: Rep. = Repeatability; Repr. = Reproducibility; Tgt = target ion; Q1 and Q2 = qualifier ions.
Table 17.
Repeatability (Rep.) and reproducibility (Repr.) expressed as CV% for urinary mineralocorticoid metabolites. Analytes: Rep. = Repeatability; Repr. = Reproducibility; Tgt = target ion; Q1 and Q2 = qualifier ions.
| Analyte | QC Level | Rep. (%CV) | Repr. (%CV) | Tgt (m/z) | Q1 (m/z) | Q2 (m/z) |
|---|
| 5-THB | High | 6.5 | 8.4 | 564 | 474 | 384 |
| 5-THB | Low | 10.4 | 10.7 | 564 | 474 | 384 |
| 5-THB | Medium | 10.4 | 11.1 | 564 | 474 | 384 |
| THA | High | 8.1 | 9.0 | 490 | 400 | 431 |
| THA | Low | 7.1 | 8.1 | 490 | 400 | 431 |
| THA | Medium | 7.2 | 8.7 | 490 | 400 | 431 |
| THDOC | High | 11.1 | 12.5 | 476 | 188 | 507 |
| THDOC | Low | 11.5 | 12.8 | 476 | 188 | 507 |
| THDOC | Medium | 7.3 | 8.3 | 476 | 188 | 507 |
| THB | High | 5.8 | 7.5 | 474 | 564 | 384 |
| THB | Low | 5.6 | 7.2 | 474 | 564 | 384 |
| THB | Medium | 10.4 | 11.0 | 474 | 564 | 384 |
Table 18.
Repeatability (Rep.) and reproducibility (Repr.) expressed as CV% for urinary glucocorticoid metabolites. Analytes: Rep. = Repeatability; Repr. = Reproducibility; Tgt = target ion; Q1 and Q2 = qualifier ions.
Table 18.
Repeatability (Rep.) and reproducibility (Repr.) expressed as CV% for urinary glucocorticoid metabolites. Analytes: Rep. = Repeatability; Repr. = Reproducibility; Tgt = target ion; Q1 and Q2 = qualifier ions.
| Analyte | QC Level | Rep. (%CV) | Repr. (%CV) | Tgt (m/z) | Q1 (m/z) | Q2 (m/z) |
|---|
| 11ketoET | High | 10.6 | 12.3 | 300 | 261 | 405 |
| 11ketoET | Low | 5.0 | 6.6 | 300 | 261 | 405 |
| 11ketoET | Medium | 11.4 | 12.1 | 300 | 261 | 405 |
| 11-OH-ET | High | 7.9 | 8.3 | 448 | 268 | 358 |
| 11-OH-ET | Low | 7.5 | 9.2 | 448 | 268 | 358 |
| 11-OH-ET | Medium | 9.4 | 10.9 | 448 | 268 | 358 |
| 20 DIIDRO-F | High | 7.6 | 8.6 | 296 | 243 | 476 |
| 20 DIIDRO-F | Low | 6.7 | 8.5 | 296 | 243 | 476 |
| 20 DIIDRO-F | Medium | 7.0 | 8.8 | 296 | 243 | 476 |
| 5-TH-F | High | 6.0 | 7.4 | 652 | 562 | 472 |
| 5-TH-F | Low | 5.5 | 5.8 | 652 | 562 | 472 |
| 5-TH-F | Medium | 6.5 | 6.9 | 652 | 562 | 472 |
| F | High | 6.6 | 7.3 | 605 | 515 | 361 |
| F | Low | 11.0 | 13.0 | 605 | 515 | 361 |
| F | Medium | 4.9 | 5.3 | 605 | 515 | 361 |
| THS | High | 9.6 | 10.5 | 564 | 474 | 384 |
| THS | Low | 4.5 | 4.8 | 564 | 474 | 384 |
| THS | Medium | 6.6 | 8.1 | 564 | 474 | 384 |
| TH-F | High | 8.2 | 10.1 | 652 | 472 | 562 |
| TH-F | Low | 9.4 | 10.8 | 652 | 472 | 562 |
| TH-F | Medium | 7.3 | 8.8 | 652 | 472 | 562 |
| THE | High | 9.7 | 11.6 | 578 | 609 | 488 |
| THE | Low | 8.9 | 10.8 | 578 | 609 | 488 |
| THE | Medium | 10.4 | 11.5 | 578 | 609 | 488 |
| CORTOL | High | 10.6 | 10.9 | 343 | 243 | 253 |
| CORTOL | Low | 5.6 | 6.8 | 343 | 243 | 253 |
| CORTOL | Medium | 9.7 | 11.5 | 343 | 243 | 253 |
| CORTOLONE | High | 9.4 | 10.3 | 449 | 359 | 269 |
| CORTOLONE | Low | 7.0 | 7.5 | 449 | 359 | 269 |
| CORTOLONE | Medium | 9.6 | 11.1 | 449 | 359 | 269 |
| CORTOL | High | 6.3 | 7.9 | 343 | 243 | 253 |
| CORTOL | Low | 10.4 | 11.3 | 343 | 243 | 253 |
| CORTOL | Medium | 9.9 | 11.9 | 343 | 243 | 253 |
| CORTOLONE | High | 6.6 | 7.2 | 449 | 359 | 269 |
| CORTOLONE | Low | 11.4 | 12.9 | 449 | 359 | 269 |
| CORTOLONE | Medium | 9.3 | 11.1 | 449 | 359 | 269 |
Table 19.
Repeatability (Rep.) and reproducibility (Repr.) expressed as CV% for urinary estrogen metabolites. Analytes: Rep. = Repeatability; Repr. = Reproducibility; Tgt = target ion; Q1 and Q2 = qualifier ions.
Table 19.
Repeatability (Rep.) and reproducibility (Repr.) expressed as CV% for urinary estrogen metabolites. Analytes: Rep. = Repeatability; Repr. = Reproducibility; Tgt = target ion; Q1 and Q2 = qualifier ions.
| Analyte | QC Level | Rep. (%CV) | Repr. (%CV) | Tgt (m/z) | Q1 (m/z) | Q2 (m/z) |
|---|
| 17-ESTRADIOLO | High | 5.7 | 7.4 | 531 | 441 | 459 |
| 17-ESTRADIOLO | Low | 6.4 | 8.3 | 531 | 441 | 459 |
| 17-ESTRADIOLO | Medium | 10.9 | 12.6 | 531 | 441 | 459 |
| E3 | High | 5.7 | 6.6 | 504 | 386 | 311 |
| E3 | Low | 4.6 | 5.5 | 504 | 386 | 311 |
| E3 | Medium | 9.3 | 9.9 | 504 | 386 | 311 |
| E1 | High | 8.1 | 8.8 | 371 | 340 | 356 |
| E1 | Low | 6.4 | 7.7 | 371 | 340 | 356 |
| E1 | Medium | 11.3 | 11.8 | 371 | 340 | 356 |
Table 20.
Repeatability (Rep.) and reproducibility (Repr.) expressed as CV% for urinary androgen metabolites. Analytes: Rep. = Repeatability; Repr. = Reproducibility; Tgt = target ion; Q1 and Q2 = qualifier ions.
Table 20.
Repeatability (Rep.) and reproducibility (Repr.) expressed as CV% for urinary androgen metabolites. Analytes: Rep. = Repeatability; Repr. = Reproducibility; Tgt = target ion; Q1 and Q2 = qualifier ions.
| Analyte | QC Level | Rep. (%CV) | Repr. (%CV) | Tgt (m/z) | Q1 (m/z) | Q2 (m/z) |
|---|
| 11-OH-AN | High | 8.3 | 9.9 | 360 | 270 | 213 |
| 11-OH-AN | Low | 8.4 | 9.5 | 360 | 270 | 213 |
| 11-OH-AN | Medium | 6.6 | 7.8 | 360 | 270 | 213 |
| 16-OH-DHEA | High | 8.8 | 10.0 | 446 | 266 | 356 |
| 16-OH-DHEA | Low | 5.4 | 6.8 | 446 | 266 | 356 |
| 16-OH-DHEA | Medium | 10.0 | 11.2 | 446 | 266 | 356 |
| 5-ANDROSTANEDIOL | High | 8.1 | 9.2 | 421 | 379 | 241 |
| 5-ANDROSTANEDIOL | Low | 5.9 | 6.9 | 421 | 379 | 241 |
| 5-ANDROSTANEDIOL | Medium | 9.9 | 11.7 | 421 | 379 | 241 |
| D5-ATRIOL | High | 9.6 | 11.5 | 432 | 522 | 417 |
| D5-ATRIOL | Low | 7.1 | 8.9 | 432 | 522 | 417 |
| D5-ATRIOL | Medium | 8.6 | 9.4 | 432 | 522 | 417 |
| AN | High | 7.2 | 8.7 | 360 | 270 | 213 |
| AN | Low | 6.9 | 8.3 | 360 | 270 | 213 |
| AN | Medium | 5.9 | 7.3 | 360 | 270 | 213 |
| D5-ADIOL | High | 7.1 | 7.7 | 344 | 434 | 239 |
| D5-ADIOL | Low | 10.6 | 11.2 | 344 | 434 | 239 |
| D5-ADIOL | Medium | 10.9 | 12.5 | 344 | 434 | 239 |
| DHEA | High | 10.7 | 11.3 | 358 | 389 | 268 |
| DHEA | Low | 5.2 | 5.9 | 358 | 389 | 268 |
| DHEA | Medium | 11.0 | 12.3 | 358 | 389 | 268 |
| ET | High | 10.3 | 11.2 | 360 | 270 | 213 |
| ET | Low | 6.5 | 7.9 | 360 | 270 | 213 |
| ET | Medium | 10.9 | 11.5 | 360 | 270 | 213 |


 ,
, 

