Abstract
Thyroid-associated ophthalmopathy (TAO), or Graves’ orbitopathy (GO), is a complex autoimmune disorder affecting orbital tissues, often leading to vision-threatening complications such as dysthyroid optic neuropathy (DON). In this systematic review, conducted following PRISMA guidelines, 22 studies were evaluated to investigate the role of optical coherence tomography (OCT) in assessing retinal and choroidal changes in TAO. Parameters such as the retinal nerve fiber layer (RNFL), ganglion cell complex (GCC), ganglion cell layer (GCL), and choroidal thickness were analyzed. RNFL changes varied by disease severity, with significant thinning in DON due to nerve fiber loss and thickening in early DON due to optic disk edema. Subfoveal choroidal thickness (SFCT) was consistently higher in active TAO, correlating positively with the clinical activity score (CAS) and proptosis, suggesting its role as a marker of disease activity. Subgroup analysis revealed that spectral-domain OCT (SD-OCT) was the most sensitive for detecting retinal changes. The findings highlight the effectiveness of OCT in detecting minor retinal and choroidal alterations in TAO. However, the variability of study designs, as well as the lack of longitudinal data, limits the ability to draw broad conclusions. Further standardized, long-term investigations are required to properly understand OCT’s diagnostic and prognostic value in TAO.
1. Introduction
Thyroid-associated ophthalmopathy (TAO), or Graves’ orbitopathy (GO), is a complex autoimmune disorder that primarily affects the orbital and periorbital tissues. About 40% of individuals with Graves’ disease present with GO, making it the most prevalent extra-thyroidal manifestation of Graves’ disease [1]. TAO has a profound impact on patients’ quality of life due to its cosmetic and functional consequences, including diplopia, proptosis, and vision-threatening complications such as compressive optic neuropathy [2]. The expected prevalence of TAO nowadays is lower than earlier estimates [3] and ranges from 3.3 to 8.0/100,000/year for women and 0.9 to 1.6/100,000/year for males, with a higher incidence in middle-aged individuals [4]. Despite its relatively low prevalence, TAO imposes a significant healthcare burden. While it is more common in women, the gender disparity decreases in severe GO [5]. About half of the patients had clinically significant TAO in a study of over 2000 Graves’ patients; however, patients with moderate-to-severe TAO were more likely to be elderly and male (30% vs. 21%) [6].
The pathophysiological mechanisms of TAO are varied, involving the autoimmune activation of orbital fibroblasts by autoantibodies against the thyroid-stimulating hormone receptor (TSHR) and insulin-like growth factor 1 receptor (IGF-1R) [7,8]. This leads to inflammation, adipogenesis, and glycosaminoglycan deposition within orbital tissues, resulting in orbital expansion and increased pressure [7]. The extraocular muscles and orbital adipose tissue are the most severely afflicted areas. While the orbital tissues are the primary targets, TAO’s effects extend beyond the orbit, potentially impacting the optic nerve and retinal structures [9]. Mechanical compression of the optic nerve at the apex and inflammatory mediators can disrupt retinal microstructures, such as the retinal nerve fiber layer (RNFL), ganglion cell complex (GCC), and ganglion cell layer (GCL) [9,10]. Though less studied than the disease’s orbital signs, neuro-ophthalmic alterations may be crucial to the visual impairment linked to TAO.
TAO typically manifests within 18 months of the onset of thyroid disease, although it may manifest years afterward. The course of TAO is consistent with a predictable trajectory, during which active disease persists for 6–18 months. After that, the disease becomes less severe before plateauing during the quiescent period [11]. The clinical activity score (CAS), first used in 1989, remains the standard tool for assessing disease activity [12]. It was developed as a clinical classification to help distinguish between the active and quiescent stages of the disease [13]. While the majority of individuals have a benign course, approximately 5% acquire dysthyroid optic neuropathy (DON), a significant condition that may result in retinal ganglion cell death and permanent vision impairment [14]. Imaging modalities, such as optical coherence tomography (OCT), and the newly developed OCTA, have emerged as valuable tools for providing objective, quantifiable insights into TAO-related changes. OCT provides a view into the subtle neuro-ophthalmic changes linked to TAO by allowing the precise observation and quantification of retinal structures [15].
According to latest research studies, biomarkers obtained via OCT, such as RNFL thinning, GCC loss, and GCL changes, may be used to detect involvement of the optic nerve before clinically apparent optic neuropathy manifests [16,17]. These biomarkers could be helpful in disease severity stratification and progression prediction in addition to their diagnostic capacities. Furthermore, since retinal and optic nerve abnormalities can happen even in patients with low CAS, OCT results may support clinical evaluations [15].
Despite these developments, it is still unclear how OCT results correspond to the clinical characteristics of TAO. The necessity for a thorough synthesis of the available information is demonstrated by the variation in OCT results between studies, which is impacted by variables such as disease stage and severity or patient demographics.
Additionally, the connection between orbital inflammation, mechanical effects, and neurodegeneration in TAO raises important questions about the pathophysiological mechanisms leading to these changes.
This systematic review aims to synthesize current evidence on the role of OCT in assessing TAO, with a focus on changes in the choroidal thickness, RNFL, GCC, and GCL thickness. It also explores the clinical implications of these findings, examining their relationship with disease activity and severity. By integrating data from diverse studies, this review seeks to provide a comprehensive overview of how OCT can develop the understanding of TAO and its impact on ocular structures.
2. Materials and Methods
2.1. Study Design and Protocol Registration
This systematic review was conducted in accordance with the Preferred Reporting Items for Systematic Reviews and Meta-Analyses (PRISMA) guidelines [18]. The protocol for the review was registered in the PROSPERO database (CRD42025638423). The primary aim of the review was to evaluate changes in the retinal nerve fiber layer (RNFL), ganglion cell complex (GCC) or ganglion cell layer (GCL) thickness, and choroidal thickness in patients with TAO using OCT.
2.2. Search Strategy
A comprehensive literature search was performed across major databases: PubMed, Google Scholar and Scopus in the last ten years (last search date: 2 January 2025). The search strategy combined keywords and Medical Subject Headings (MeSH) terms, such as “Thyroid associated ophthalmopathy”, “Thyroid eye disease”, “Graves’ orbitopathy”, “Optical coherence tomography”, “Retinal nerve fiber layer”, “Ganglion cell complex”, “Ganglion cell layer”, “Choroidal thickness”, and “Retinal parameters”. Boolean operators were used to combine the terms (“AND”, “OR”), and manual searches of reference lists from relevant articles and reviews were also conducted to identify additional studies.
2.3. Inclusion and Exclusion Criteria
This study included observational designs, such as cross-sectional, case–control, and cohort studies, that assessed retinal and choroidal thickness in TAO patients versus healthy controls. All stages of TAO, from mild to severe, included DON. Studies were eligible if they reported at least one measurement of the RNFL, GCC/GCL, or choroidal thickness. Only studies providing quantitative data on these OCT parameters were included. English-language studies were selected to standardize the review process and avoid language bias. Additional inclusion and exclusion criteria are listed in Table 1. This study was also accomplished using the PICO (Population, Intervention, Comparison, Outcome) framework [19] to guide the selection and evaluation of studies (Table 2).

Table 1.
Inclusion and exclusion criteria.
Table 2.
PICO framework.
Two independent reviewers screened titles and abstracts against the eligibility criteria. Full-text articles of potentially relevant studies were then assessed for inclusion. Disagreements between reviewers were resolved by discussion or consultation with a third reviewer to ensure objectivity.
Figure 1 shows the PRISMA flowchart, which details the systematic process of study selection for this review.
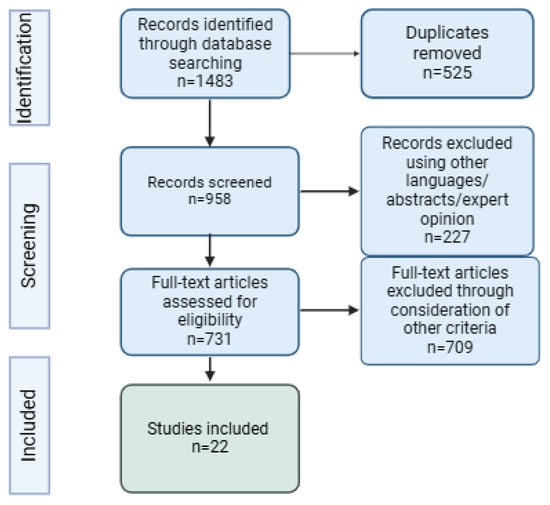
Figure 1.
PRISMA flowchart.
2.4. Data Extraction and Management
Two reviewers extracted data using a pre-designed collection form. Extracted information included study characteristics (author, year, country, and study design), patient demographics (sample size, age, gender, TAO activity or severity), OCT parameters (RNFL, GCC, and GCL thickness, choroidal thickness), comparator group details (healthy controls or TAO subgroups), and outcomes (mean thickness values, correlations with clinical activity). Methodological quality indicators, including participant selection and assessment protocols, were also recorded. If studies reported data in different units or scales, all measurements were converted to the same unit. Variations in terminology across studies were addressed by thoroughly reviewing each study’s definitions and methodologies to ensure consistency, and a unifying term was applied to synthesize the data. Outliers in the data were reviewed and analyzed separately to see if they affected the overall results.
2.5. Risk of Bias Assessment
The methodological quality of included studies was assessed independently by two reviewers. Cross-sectional, case–control, and cohort studies were evaluated using the original or adapted (in the case of cross-sectional studies) Newcastle-Ottawa Scale (NOS) [20]. Each study was rated as low, moderate, or high risk of bias, with the latter being excluded from this systematic review.
2.6. Data Synthesis
A narrative synthesis was conducted to summarize findings across studies. The authors did not perform a meta-analysis due to the lack of standardization among the study groups and the variability in reported parameters. The included studies assessed different outcomes and used inconsistent group definitions, making it unlikely for a meta-analysis to achieve statistical significance or provide meaningful pooled results. The primary outcomes of interest were differences in RNFL, GCC/GCL thickness and choroidal thickness between TAO patients and controls or across TAO subgroups. Secondary outcomes included correlations between retinal layer changes and clinical activity scores/clinical changes. A subgroup analysis was conducted, which involved examining the impact of the OCT type on reported outcome retinal parameters (RNFLs). To present the results of studies, tables that systematically listed all available data were used.
To address any potential bias from unpublished or selectively reported data, the results were compared with findings from systematic reviews or meta-analyses on related topics to identify any significant discrepancies.
2.7. Ethical Considerations
Since this systematic review involves the analysis of published data rather than primary data collection, ethical approval was not required. All the studies included in this review were obtained from publicly available, peer-reviewed journals, and their original authors had already adhered to the ethical guidelines and protocols established by the respective ethics committees and institutional review boards at the time of their studies.
3. Results
This review analyzed 22 studies that used OCT in order to evaluate structural alterations in the retina and choroid in TAO studies included eight cross-sectional investigations, eight prospective studies, three case–control studies, and three retrospective studies (Table 3).
Table 3.
Demographic and clinical parameters of included studies.
The studies were predominantly from Asia, with 11 from China, 4 from Turkey, 2 from India, and 1 each from South Korea, Hong Kong, and Iran. Europe contributed two studies from Italy, while the Middle East and Africa were represented by one study each from Israel and Egypt.
Several OCT modalities were used in the investigations: spectral-domain OCT (SD-OCT) was used in thirteen studies; swept-source OCT (SS-OCT) was used in four studies; high-definition OCT (HD-OCT) was used in three studies, and time-domain OCT (TD-OCT) was used in two studies. Two of the studies also involved OCTA as an additional method of investigation.
The studies concentrated on retinal and choroidal alterations, thirteen of them studying only retinal parameters, eight studies investigated choroidal parameters, and one of them studied both. Parameters were examined across various stages of TAO, with studies reporting the following stages or severity of disease: mild/moderate/severe, mild/moderate to severe/DON, active/inactive, and active/stable.
3.1. Association Between TAO and Choroidal Parameters
A total of nine studies investigated choroidal thickness changes in TAO compared to controls (Table 4), examining 294 TAO patients and 331 controls. The studies focused on subfoveal choroidal thickness (SFCT) as a key indicator of choroidal alterations in TED (five studies), with some also reporting mean choroidal thickness (MCT) (three studies) and one study reporting both of the parameters that were assessed in this review. Subfoveal choroidal thickness was generally higher in TAO patients compared to controls, with the thickening more pronounced in active TAO. Caliskan et al. reported significantly increased SFCT in active TAO patients (395.84 ± 9.68 µm) compared to controls (314.22 ± 5.74 µm) [22], while Yu et al. observed SFCT values of 313.47 ± 100.32 µm in TAO patients compared to 256.33 ± 50.18 µm in controls [40]. Similarly, Noce et al. highlighted variability in SFCT across mild, moderate, and especially severe TAO [34].
Table 4.
Studies investigating choroidal thickness in thyroid-associated ophthalmopathy.
Some studies also assessed MCT, along with different quadrants of the choroid. Yining Dai et al. found significantly lower MCT in controls (236.86 ± 45.02 µm) compared to TAO patients (276.25 ± 58.75 µm) [24]. However, not all studies observed significant differences. Casini et al. reported no notable difference in SFCT between TAO patients (288 ± 88 µm) and controls (287 ± 58 µm). They were the only research group to report both MCT and SFCT and did not report important differences between groups [23].
Most studies demonstrated statistically significant differences in SFCT or MCT between TAO patients and controls, with p-values often below 0.05. Active TAO patients consistently showed greater SFCT compared to inactive TED or controls, indicating a potential link between choroidal thickening and inflammatory activity.
A regional analysis of the studies included revealed some minor variations in choroidal thickness findings. Studies conducted in Asia consistently reported significantly increased SFCT in active TAO patients. In contrast, one study from Europe did not reveal important differences among different groups.
3.2. Association Between TAO and Retinal Parameters
3.2.1. Retinal Nerve Fiber Layer
A total of 10 studies explored the relationship between retinal nerve fiber layer thickness and TAO, examining 443 patients with TED and 391 healthy controls (Table 5). Several of them also reported variations across different disease stages. These studies compared RNFL thickness in TAO patients with healthy controls and assessed its association with disease severity.
Overall, RNFL thickness in TED patients often showed no significant differences compared to controls in mild and moderate stages but tended to increase in DON due to optic disk edema in a few of the cases. One study showed an important decrease in patients with DON as compared to all the other study groups, most probably patients with advanced cases due to nerve fiber loss [28]. Significant RNFL changes were more frequently observed when comparing DON to control groups or moderate TAO.
Several studies demonstrated significant RNFL differences. Abdolizadeh et al. reported a significant difference in RNFL thickness between DON patients and both mild TAO and controls [21]. Luo et al. found significant RNFL thinning in DON patients compared to controls (p = 0.003) [31], while Jian et al. identified substantial thinning in DON (63.47 ± 15.81 µm) compared to controls and non-DON groups (p < 0.001) [28]. Mugdha et al. also showed significant RNFL thinning (p = 0.0001) in TAO patients compared to controls, particularly in advanced cases. They also studied the RNFL in different age groups and showed that it decreased significantly with age, particularly between the 10–19 and 20–30 age groups (p = 0.005), with a progressive decline observed in older age groups [33]. Guo et al. showed that the mean RNFL thickness was thinnest in the moderate-to-severe TAO group (97.8 ± 9.2 µm) and thickest in the DON group (110.6 ± 34.2 µm), with a significant difference between these groups (p = 0.036). However, they reported no significant difference between any TAO stage and healthy patients [27]. Some studies, such as those by Park et al. and Wu et al., found no significant RNFL differences between TAO patients and controls in the early stages of the disease [36,38]. Xu et al. reported RNFL thickening in active TAO (114.93 ± 7.58 µm) compared to stable TAO (103.74 ± 8.40 µm) and controls [39].
A subgroup analysis was conducted to assess the impact of the type of OCT used on RNFL thickness measurements in TAO and control groups. Studies were categorized based on whether they used spectral-domain OCT (SD-OCT), high-definition OCT (HD-OCT), or time-domain OCT (TD-OCT). In the first type of OCT, for SD-OCT, six studies were included. In the control group, RNFL thickness ranged from 100.3 ± 6.3 µm [27] to 118.01 ± 13.07 µm [28], with a pooled estimate of 104.73 ± 11.61 µm. In the TAO groups, RNFL thickness varied significantly based on disease severity. These studies consistently demonstrated significant RNFL thinning in moderate-to-severe TED and DON cases. For HD-OCT investigation, three studies were included. In the control group, RNFL thickness ranged from 96 ± 8 µm [36] to 101.28 ± 6.64 µm [33], with a pooled estimate of 99.86 ± 5.79 µm. In the TAO group, RNFL thickness showed slight reductions. For TD-OCT, two studies were included. In the control group, there was a pooled estimate of 99.25 ± 16.95 µm. In the TAO group, RNFL thickness showed minimal reductions. Overall, SD-OCT was the most sensitive method for detecting RNFL thinning, while HD-OCT and TD-OCT were less sensitive.
Seven studies examined RNFL thickness across quadrants, showing variations among TAO patients. Guo et al. reported no statistically significant differences across quadrants among TAO stages, although the inferior RNFL thickness was 126.7 ± 15.9 µm in the moderate-to-severe group and 147.2 ± 50.3 µm in the DON group (p = 0.193). In the nasal quadrant, RNFL thickness increased from 68.7 ± 9.4 µm in the moderate-to-severe group to 80.1 ± 28.6 µm in the DON group (p = 0.087) [27]. Mugdha et al. observed significant RNFL thinning in all quadrants compared to controls (p < 0.01). However, at follow-up, no significant changes were noted (p > 0.05) except for the inferior quadrant, which showed significant thinning (p = 0.02) [33]. Luo et al. found reduced temporal and nasal RNFL thicknesses in TED patients compared to controls (p = 0.041, p = 0.012). In DON patients, temporal-inferior and nasal-superior quadrants demonstrated significant thickening [31]. Jian et al. reported significant differences in the superior, inferior, and nasal quadrants between DON patients and other groups (p < 0.001) [28]. Wu et al. observed significant thinning of RNFL in the superior, inferior, and nasal quadrants in DON patients compared to controls and non-DON groups (p < 0.001), with additional thinning in the temporal quadrant (p = 0.001) [38]. Park et al. found significant differences in temporal peripapillary RNFL thickness among eyes with acute DON, chronic DON, and controls (p = 0.014) [36]. In contrast, Sayin et al. reported no significant differences in RNFL thickness across quadrants between TED patients and controls [37].
3.2.2. Central Retinal Thickness
Five studies investigated central retinal thickness (CRT) in TAO (Table 5). Additionally, only one study reported both parameters discussed, the RNFL and CRT. Casini et al. reported significantly reduced CRT in the TED group (275 ± 19 µm) compared to healthy controls (285 ± 20 µm) (p = 0.017) [23]. Sayin et al. observed significant CRT thinning in the patient group compared to controls (p < 0.05), with reductions noted in both the right and left eyes and across all quadrants when both eyes were assessed together (p < 0.05) [37]. Xu et al. found no statistically significant differences in CRT between active TAO (241.07 ± 35.83 μm), stable TED (242.65 ± 13.44 μm), and healthy controls (251.64 ± 14.44 μm) (p = 0.160) [39].
A notable regional trend was found regarding RNFL and CRT measurements. Among the included studies, all four that reported no statistically significant difference in RNFL or CRT between TAO patients and controls were conducted in Asian populations. However, out of the 13 studies that investigated RNFL and CRT, only two were conducted outside of Asia.
Table 5.
Studies investigating RNFL and/or CRT in thyroid-associated ophthalmopathy.
Table 5.
Studies investigating RNFL and/or CRT in thyroid-associated ophthalmopathy.
| Study | RNFL Control Group | RNFL TED Group | CRT Control Group | CRT TED Group | p-Value | Observations |
|---|---|---|---|---|---|---|
| Abdolizadeh et al. [21] | 101.97 ± 8.93 | 98.99 ± 14.96 | - | - | <0.05 | Analyzed mild/moderate/DON disease stage Globally significant difference between DON and both mild TAO and control |
| Casini et al. [23] | - | - | 287 ± 20 | 275 ± 19 | 0.008 | Also investigated Graves’ disease without TAO |
| Elsamkary et al. [26] | - | - | 257.35 ± 16.97 | 247.53 ± 9.63 | 0.002 | No significant difference in mean outer macular thickness |
| Guo et al. [27] | 100.3 ± 6.3 | 103.2 ± 6.6 (mild)/97.8 ± 9.2 (moderate to severe)/110.6 ± 34.2 (DON) | - | - | >0.05 in all cases (TED stages vs. control) | Significant difference between moderate-to-severe group and DON groups |
| Jian et al. [28] | 118.01 ± 13.07 | 63.47 ± 15.81 (DON)/118.68 ± 11.08 (inactive non-DON)/122.79 ± 15.33 (active non-DON) | - | - | <0.001 | Total and regional RNFL thickness were similar among the non-DON, active non-DON, and healthy control groups |
| Luo et al. [31] | 103.15 ± 9.29 | 105.17 ± 13.21 (mild)/101.05 ± 10.28 (moderate)/111.38 ± 7.74 (DON) | - | - | 0.003 | Significant between DON and control. No significant differences between the other groups |
| Meirovitch et al. [32] | 96.25 ± 9.42 | 100.06 ± 33.3 | - | - | <0.05 | No significant increase n the temporal region |
| Mugdha et al. [33] | 101.28 ± 6.64 | 92.06 ± 12.44 | - | - | 0.0001 | - |
| Park et al. [36] | 96 ± 8 | 101 ± 11 (acute DON)/96 ± 11 (chronic) | - | - | 0.270 | No significant increase in RNFL between acute DON patients and controls |
| Sayin et al. [37] | 102.8 ± 29.7 (RE)/100.7 ± 31.1 (LE) | 99.9 ± 29.3 (RE)/96.7 ± 29.4 (LE) | 245.6 ± 27.9 (RE)/247.6 ± 35.3 (LE) | 238.6 ± 29.7 (RE)/240.0 ± 30.0 (LE) | >0.05 (RNFL)/0.01 (CRT) | When both eyes were analyzed, only the inferior RNFL values showed a significant difference, being thinner in the patient group compared to controls |
| Wu et al. [38] | - | - | 213.3 ± 51.3 | 214.7 ± 14.9 (non-DON)/215.8 ± 36.9 (DON) | >0.7 in all cases | - |
| Xu et al. [39] | 108.03 ± 9.15 | 114.93 ± 7.58 (active)/103.74 ± 8.40 (stable) | 251.64 ± 14.44 | 241.07 ± 35.83 (active)/242.65 ± 13.44 (stable) | <0.001 (RNFL) 0.160 (CRT) | For RNFL: active vs. stable <0.001; active vs. control 0.005; stable vs. control 0.175 |
| Zhang et al. [41] | 104.91 ± 7.99 | 101.36 ± 8.64 (non-DON)/98.30 ± 10.77 (DON) | - | - | 0.04 | - |
Abbreviations: CRT—central retinal thickness; DON—dysthyroid optic neuropathy; LE—left eye; RE—right eye; and RNFL—retinal nerve fiber layer.
3.2.3. Ganglion Cell Layer/Ganglion Cell Complex
Seven studies investigated changes in the ganglion cell complex (GCC) or ganglion cell layer (GCL) in TAO (Table 6). Luo et al. reported no significant differences in macular GCC thickness between various severity groups and the control group (p > 0.05) [31]. Zhang et al. found significant differences in GCC thickness among groups, with DON eyes exhibiting thinner mean GCC thickness compared to non-DON eyes (p = 0.008, post hoc p = 0.026) [41]. Guo et al. observed the lowest mean GCL/IPL thickness in the DON group compared to mild, moderate-to-severe, and control groups (all p < 0.001), with significant reductions in the moderate-to-severe group compared to controls (p < 0.001) [27]. Casini et al. demonstrated significantly reduced central GCL thickness in TAO patients (14.87 ± 3.0 µm) compared to controls (17.92 ± 5.02 µm, p = 0.001), and this reduction was also significant compared to patients without TAO (p = 0.001) [23].
Table 6.
Studies investigating GCC/GCL in thyroid-associated ophthalmopathy.
Kurt et al.’s study was not included in the table as it focused on the thickness of different quadrants of the GCL. Their findings showed no significant differences in the mean GCL thickness measurements in between the study and control groups [29].
3.3. Connection Between OCT Changes and Clinical Aspects
Seven studies have explored correlations between clinical aspects of TAO/Graves’ disease and retinal or choroidal parameters
Proptosis, measured through exophthalmometry, has been believed to have a variable impact on retinal and choroidal thickness. Elsamkary et al. identified a significant negative correlation between proptosis and central foveal thickness, with greater proptosis associated with thinner central foveal thickness in TAO (r = −0.59, p < 0.0001) [26]. Lai et al. further confirmed this association, reporting consistent negative correlations between subfoveal choroidal thickness and exophthalmometry in both univariate (β = −5.56, p = 0.038) and multivariate analyses (β = −5.04, p = 0.043), highlighting the link between proptosis severity and choroidal thinning [30].
Choroidal thickness has also been examined in relation to the CAS. Caliskan and Dave found significant positive correlations between subfoveal choroidal thickness and CAS in univariate analyses. However, in multivariate models, these associations were influenced by collinearity with other factors [22,25]. In the univariate analysis of Caliskan et al., thicker subfoveal choroidal thickness was significantly associated with higher clinical activity scores (p < 0.001) and greater proptosis (p < 0.001). However, in the multivariate analysis, the CAS was excluded due to high collinearity (variance inflation factor [VIF]: 8.04), and proptosis was removed as it was no longer significantly associated with subfoveal CT (p = 0.466) [22]. In a study conducted by Dave et al. [25], the CAS demonstrated a significant positive association with choroidal thickness in bivariate analysis (coefficient = 11.92 ± 5.17, p = 0.03). However, this association became borderline non-significant in multivariate analysis (coefficient = 11.89 ± 6.76, p = 0.08 [25]. Del Noce et al. reported a strong positive correlation between choroidal thickness and the EUGOGO clinical score (Pearson r = 0.84, p < 0.000001) [34]. Mugdha’s findings indicated no meaningful correlation between the CAS and RNFL thickness at any time point (r = −0.13 at the first visit and r = −0.02 at the second visit). Similarly, changes in the CAS and RNFL over time showed no meaningful correlation (r = +0.14), indicating no direct relationship between disease activity and RNFL thickness [33].
In a study conducted by Guo et al., there were significant differences in the mean CAS between the three groups (p < 0.001). The mean proptosis was substantially higher in DON and moderate-to-severe groups compared to the mild group (p < 0.05). The DON group had significantly worse best-corrected visual acuity (BCVA) compared to the mild and moderate-to-severe groups (p < 0.001) [27].
Additionally, Park et al. described that, among acute DON patients, treatments varied; patients received orbital radiotherapy, orbital decompression, steroids with radiotherapy, and combined therapies. In chronic DON, they received steroids, radiotherapy, or underwent decompression. At the follow-up consult, 81% of DON eyes achieved 20/20 vision, with significant improvement (p < 0.001). Visual acuity improved by ≥3 logMAR lines in 50% of acute and 32% of chronic DON cases [36].
3.4. Study Bias Assessment
The risk of bias for all 22 studies in this systematic review was evaluated, with a summary of the assessment presented in Table S1. For the studies included, the original and adapted Newcastle-Ottawa Scale (NOS) was applied. In the analysis, many cross-sectional studies showed moderate comparability, indicating partial control of confounders but leaving room for residual bias. This might limit the ability to attribute outcomes solely to the exposure of interest, affecting the overall reliability. Selection bias was present in studies with small sample sizes or inadequate randomization methods (five studies), while performance bias was identified in studies where the blinding of assessors or participants was not explicitly reported, which may have influenced outcome measurements (three studies). Additionally, attrition bias was noted in studies with incomplete follow-up data or high dropout rate (two studies). Despite these limitations, the overall quality of the included studies was moderate to high, supporting the reliability of the observed structural changes in TAO. Among the 22 studies, 14 were graded as low risk, 6 were graded as low/moderate risk, and the remaining 2 were graded as moderate risk of bias.
4. Discussion
This review analyzed 22 studies using OCT to evaluate retinal and choroidal changes in TAO and its stages. The studies, predominantly from China and Turkey, included various designs, with most focusing on the RNFL and choroidal thickness. Five studies reported CRT values in TAO patients, ten examined the RNFL, showing stage-dependent differences, particularly in DON, while six explored GCL and GCC alterations. Nine studies highlighted subfoveal choroidal thickness (SFCT) in TAO patients, and six studies proposed and studied the CAS and proptosis as influencing factors. There is an extremely low number of systematic reviews that describe retinal/choroidal alterations using OCT in TAO patients. Unlike prior reviews, this systematic analysis specifically focuses on the role of OCT in assessing both retinal and choroidal changes. A comprehensive evaluation of the RNFL, GCC/GCL, SFCT and other relevant parameters was conducted, with particular emphasis on their relationship with disease activity and severity.
The research of choroidal and retinal modifications in TAO has improved greatly since the introduction of OCT, which allows for the high-resolution, non-invasive imaging of the retinal and choroidal layers [15]. OCT allows for a thorough investigation of structural changes, which provides understanding of vascular and inflammatory processes related with TAO [15,39]. However, variations in imaging procedures, patient demographics, and disease severity between studies have resulted in heterogeneous findings. Longitudinal studies using standardized approaches would be required for understanding the occurrence of these changes in TAO and their clinical consequences.
RNFL alterations have been extensively studied in TAO as a marker of optic nerve involvement and disease severity [43]. The findings across studies reveal variability in RNFL thickness depending on the stage and severity of TAO [41]. While many studies report no significant RNFL changes in mild or moderate TAO compared to controls, advanced cases, particularly those involving dysthyroid optic neuropathy (DON), often show distinct RNFL alterations [28]. In DON, RNFL thickening may occur due to optic disk edema caused by increased intraorbital pressure or inflammation. It is also plausible that an interaction of compressive mechanical and inflammatory factors may obscure RNFL alterations [32]. Chronic or advanced stages of TAO, prolonged compression of the optic nerve due to enlarged extraocular muscles, increased retrobulbar pressure, or apical crowding can lead to ischemia and axonal loss [44,45], as seen in a study conducted by Jian et al. [26]. This results in RNFL thinning, particularly in the inferior and nasal quadrants, which are more vulnerable to mechanical compression. The degree of RNFL thinning is often correlated with the severity of visual impairment, making it a valuable parameter for assessing disease progression and predicting visual outcomes [46]. One systematic review discussed retinal layer thickness. They found no differential reduction in RNFL thickness in the superior areas. They reported a similar number of studies revealing thinning of the superior (six studies), inferior (seven studies), nasal (five studies), and temporal (six studies) RNFLs in TAO patients [43]. Chien et al. also discussed choroidal parameters in a systematic review. Similarly to our results, they reported an increased choroidal thickness in TED patients compared to normal controls, particularly in the subfoveal region. Furthermore, some of the studies included in the review found that patients with active TED had an increased thickness than those with inactive TED; however, the results were mixed. Finally, numerous studies found links between increased choroidal thickness and worsening clinical measures of disease activity, such as the CAS [47]. Another systematic review and meta-analyses on SFCT reported statistically significant differences in terms of the SFCT parameter between the study and control groups and also between active and inactive forms of TED [48]. Goel et al. performed a systematic review of orbital and ocular perfusion in TED. The majority of studies reporting SFCT indicated choroidal thickening in active TED. The authors hypothesized that choroidal thinning, which has been shown in just a few studies, could be caused by homeostatic changes or paradoxical compression effects [49]. The same important aspect observed in this systematic review was reported in other systematic reviews, such as the ethnicity of participants (particularly Asian populations), which may be associated with differences in orbital morphology.
RNFL changes in TAO might also influenced by other factors such as age, gender, intraocular pressure and proptosis [28,50]. However, several studies found no significant differences in RNFL thickness between the study groups, despite elevated intraocular pressure in one of the groups [51]. Other investigations found RNFL thinning in TAO patients without clinical optic nerve impairment, notably in the inferior quadrant [35,52]. This raises the notion that RNFL degradation occurs independently of IOP and that structural RNFL abnormalities may exist even in clinically normal conditions. A potential correlation between the CAS and RNFL thickness in TAO has been explored in several studies. However, the findings regarding this correlation remain inconsistent. In a study conducted by Sarnat-Kucharczyk et al., RNFL thickness showed a slight decrease after treatment, with a reduction of ≥2 μm observed in three patients. This change occurred despite improvements in the CAS, which showed a median reduction of 4 points over 48 weeks [53]. Some studies suggest no significant relationship between the CAS and RNFL thickness, indicating that inflammatory activity measured by the CAS may not directly influence RNFL changes. Mugdha et al. found no association between thyroid disease clinical activity and RNFL status. At the six-month follow-up, the CAS improved, but RNFL damage persisted, with further thinning in the inferior quadrant, most probably due to its greater baseline thickness [33].
In a study conducted by Guo et al. [27], there was a substantial relationship between visual functions and GCL/IPL thickness rather than RNFL thickness. Previous research has found that a better maintained GCC and/or RNFL thickness indicates better vision rehabilitation. Patients with early DON might have great visual recovery following treatments, even if the thinning RNFL and GCC showed no substantial improvement [54,55]. The thinning tendency of GCL/IPL may be a significant indication for closer vision monitoring and sooner decompression surgery in TAO patients [27].
Increased intraorbital pressure induced by the enlargement of extraocular muscles and orbital fat can cause choroidal thickness changes, resulting in vascular congestion and episcleral venous stasis. In addition, inflammation has an important role, with inflammatory mediators producing exudation, vascular leakage, and abnormal ocular blood flow [56,57,58]. These factors collectively contribute to changes in CT in TED. The alterations in choroidal thickness in patients with TED were initially reported by Caliskan et al. [22]. They found that, in patients with active TED, the mean subfoveal choroidal thickness rises. They suggested that a relevant metric for tracking disease activity would be subfoveal choroidal thickness [22]. The findings of other studies have reinforced this presumption [42]. In contrast with a study conducted by Caliskan et al., where the thickness changes were greater in the temporal quadrant, Dave et al. showed greater thickness in the nasal quadrant. Even in the absence of obvious clinical symptoms, their investigation found that both the inner nasal choroidal thickness and subfoveal central choroidal thickness were reliable indicators of activity [25]. Lai et al. found that, in TAO patients, a thinner subfoveal choroidal thickness was linked to increased age and axial length, greater proptosis, and worse visual acuity [30]. According to an ROC curve analysis, SFCT outperformed retinal, RNFL, GCL, GCL+, and GCL++ thicknesses in terms of disease activity assessment [45].
The limitations of this study include the heterogeneity of the included studies, which varied in design, population size and characteristics, imaging modalities, and outcome measures. The increased heterogeneity parameters also prevented the performance of a meta-analysis, which could have provided a better summary of the findings. Additionally, geographic and demographic bias is another limitation, as the majority of studies originated from Asia, particularly China, with underrepresentation from other regions, which may affect the generalizability of the findings. Furthermore, most studies were cross-sectional, providing only a brief idea of structural changes, and the lack of longitudinal data limits insights into the progression of retinal and choroidal alterations over time. Our focus on specific OCT parameters may have overlooked other potentially relevant structural or functional aspects of disease progression. Lastly, while a comprehensive search strategy was used, there remains the possibility of missing relevant studies, especially non-English studies, which may have introduced selection bias.
Because the majority of the studies in this systematic review were cross-sectional, data from individuals with TED were collected at various stages of their disease progression, which might result in thickness heterogeneity. Therefore, future longitudinal studies should focus on standardizing OCT acquisition protocols, using uniform segmentation techniques and image analysis criteria. Additionally, prospective studies should evaluate the temporal evolution of these changes in relation to disease activity, response to therapy, and clinical outcomes. To enhance clinical applicability, CAS thresholds should be incorporated to assess the utility of OCT as a disease monitoring tool. Furthermore, given the predominance of Asian-based studies in the current literature, future research should prioritize multi-ethnic studies to evaluate potential population-based differences in retinal and choroidal changes.
5. Conclusions
This study focuses on important retinal and choroidal structural changes in TAO. OCT can noninvasively detect changes across various stages of TAO patients and could be implemented as a high diagnostic value tool. The observed changes in RNFL thickness, CRT, GCC/GCL, and choroidal parameters indicate that they might be indicators of disease progression and severity. The results across studies reveal variability in retinal and choroidal thickness depending on the stage and severity of TAO. However, the most important changes in these parameters were observed in the DON group when compared to controls. These findings may help improve our understanding of the underlying pathophysiology of TAO and assist in the development of imaging-based diagnostic and monitoring techniques. More research is needed to better understand the clinical significance of these structural changes and their function in guiding treatment therapies.
Supplementary Materials
The following supporting information can be downloaded at https://www.mdpi.com/article/10.3390/life15020293/s1, Table S1: PRISMA checklist; Table S2: Newcastle-Ottawa risk assessment for cross-sectional studies; Table S3: Newcastle-Ottawa risk assessment for case–control studies; and Table S4: Newcastle-Ottawa risk assessment for cohort studies.
Author Contributions
Conceptualization: A.M.I.; methodology, A.M.I. and D.I.; formal analysis, S.L.B.; investigation, A.M.I. and D.A.; writing—original draft preparation, A.M.I. and D.I.; writing—review and editing, S.L.B.; visualization, D.A.; supervision, S.L.B. All authors have read and agreed to the published version of the manuscript.
Funding
We would like to acknowledge ‘VICTOR BABES’ UNIVERSITY OF MEDICINE AND PHARMACY TIMISOARA for their support in covering the costs of publication for this research paper.
Institutional Review Board Statement
Not applicable.
Informed Consent Statement
Not applicable.
Data Availability Statement
No new data created. Tables and analyses can be retrieved from the corresponding author.
Conflicts of Interest
The authors declare no conflicts of interest.
References
- Mishra, S.; Maurya, V.K.; Kumar, S.; Ankita; Kaur, A.; Saxena, S.K. Clinical Management and Therapeutic Strategies for the Thyroid-Associated Ophthalmopathy: Current and Future Perspectives. Curr. Eye Res. 2020, 45, 1325–1341. [Google Scholar] [CrossRef]
- Bartalena, L.; Tanda, M.L. Current Concepts Regarding Graves’ Orbitopathy. J. Intern. Med. 2022, 292, 692–716. [Google Scholar] [CrossRef] [PubMed]
- Bartley, G.B. The Epidemiologic Characteristics and Clinical Course of Ophthalmopathy Associated with Autoimmune Thyroid Disease in Olmsted County, Minnesota. Trans. Am. Ophthalmol. Soc. 1994, 92, 477–588. [Google Scholar] [PubMed]
- Bartalena, L.; Piantanida, E.; Gallo, D.; Lai, A.; Tanda, M.L. Epidemiology, Natural History, Risk Factors, and Prevention of Graves’ Orbitopathy. Front. Endocrinol. 2020, 11, 615993. [Google Scholar] [CrossRef]
- Lee, M.H.; Chin, Y.H.; Ng, C.H.; Nistala, K.R.Y.; Ow, Z.G.W.; Sundar, G.; Yang, S.P.; Khoo, C.M. Risk Factors of Thyroid Eye Disease. Endocr. Pract. 2021, 27, 245–253. [Google Scholar] [CrossRef] [PubMed]
- Manji, N.; Carr-Smith, J.D.; Boelaert, K.; Allahabadia, A.; Armitage, M.; Chatterjee, V.K.; Lazarus, J.H.; Pearce, S.H.S.; Vaidya, B.; Gough, S.C.; et al. Influences of Age, Gender, Smoking, and Family History on Autoimmune Thyroid Disease Phenotype. J. Clin. Endocrinol. Metab. 2006, 91, 4873–4880. [Google Scholar] [CrossRef] [PubMed]
- Shu, X.; Shao, Y.; Chen, Y.; Zeng, C.; Huang, X.; Wei, R. Immune Checkpoints: New Insights into the Pathogenesis of Thyroid Eye Disease. Front. Immunol. 2024, 15, 1392956. [Google Scholar] [CrossRef] [PubMed]
- Smith, T.J.; Janssen, J.A.M.J.L. Insulin-like Growth Factor-I Receptor and Thyroid-Associated Ophthalmopathy. Endocr. Rev. 2019, 40, 236–267. [Google Scholar] [CrossRef] [PubMed]
- Cheng, S.; Ming, Y.; Hu, M.; Zhang, Y.; Jiang, F.; Wang, X.; Xiao, Z. Risk Prediction of Dysthyroid Optic Neuropathy Based on CT Imaging Features Combined the Bony Orbit with the Soft Tissue Structures. Front. Med. 2022, 9, 936819. [Google Scholar] [CrossRef] [PubMed]
- Blanch, R.J.; Micieli, J.A.; Oyesiku, N.M.; Newman, N.J.; Biousse, V. Optical Coherence Tomography Retinal Ganglion Cell Complex Analysis for the Detection of Early Chiasmal Compression. Pituitary 2018, 21, 515–523. [Google Scholar] [CrossRef] [PubMed]
- Szelog, J.; Swanson, H.; Sniegowski, M.C.; Lyon, D.B. Thyroid Eye Disease. Mo. Med. 2022, 119, 343–350. [Google Scholar]
- Mourits, M.P.; Koornneef, L.; Wiersinga, W.M.; Prummel, M.F.; Berghout, A.; Van Der Gaag, R. Clinical Criteria for the Assessment of Disease Activity in Graves’ Ophthalmopathy: A Novel Approach. Br. J. Ophthalmol. 1989, 73, 639–644. [Google Scholar] [CrossRef] [PubMed]
- Barrio-Barrio, J.; Sabater, A.L.; Bonet-Farriol, E.; Velázquez-Villoria, Á.; Galofré, J.C. Graves’ Ophthalmopathy: VISA versus EUGOGO Classification, Assessment, and Management. J. Ophthalmol. 2015, 2015, 249125. [Google Scholar] [CrossRef]
- Saeed, P.; Tavakoli Rad, S.; Bisschop, P.H.L.T. Dysthyroid Optic Neuropathy. Ophthal. Plast. Reconstr. Surg. 2018, 34, S60–S67. [Google Scholar] [CrossRef] [PubMed]
- Yang, N.; Zhu, H.; Ma, J.; Shao, Q. OCT and OCTA in Dysthyroid Optic Neuropathy: A Systematic Review and Meta-Analysis. BMJ Open Ophthalmol. 2023, 8, e001379. [Google Scholar] [CrossRef] [PubMed]
- Kupersmith, M.J.; Garvin, M.K.; Wang, J.-K.; Durbin, M.; Kardon, R. Retinal Ganglion Cell Layer Thinning Within One Month of Presentation for Non-Arteritic Anterior Ischemic Optic Neuropathy. Investig. Opthalmol. Vis. Sci. 2016, 57, 3588. [Google Scholar] [CrossRef]
- Zerbini, G.; Maestroni, S.; Viganò, I.; Mosca, A.; Paleari, R.; Gabellini, D.; Galbiati, S.; Rama, P. Progressive Thinning of Retinal Nerve Fiber Layer/Ganglion Cell Layer (RNFL/GCL) as Biomarker and Pharmacological Target of Diabetic Retinopathy. Int. J. Mol. Sci. 2023, 24, 12672. [Google Scholar] [CrossRef] [PubMed]
- Page, M.J.; McKenzie, J.E.; Bossuyt, P.M.; Boutron, I.; Hoffmann, T.C.; Mulrow, C.D.; Shamseer, L.; Tetzlaff, J.M.; Akl, E.A.; Brennan, S.E.; et al. The PRISMA 2020 Statement: An Updated Guideline for Reporting Systematic Reviews. BMJ 2021, 372, n71. [Google Scholar] [CrossRef] [PubMed]
- Huang, X.; Lin, J.; Demner-Fushman, D. Evaluation of PICO as a Knowledge Representation for Clinical Questions. AMIA Annu. Symp. Proc. 2006, 2006, 359–363. [Google Scholar] [PubMed]
- Wells, G.A.; Shea, B.; O’Connell, D.; Peterson, J.; Welch, V.; Losos, M.; Tugwell, P. The Newcastle-Ottawa Scale (NOS) for Assessing the Quality of Nonrandomized Studies in Meta-Analyses. 2015. Available online: https://www.ohri.ca/programs/clinical_epidemiology/oxford.asp (accessed on 5 January 2025).
- Abdolalizadeh, P.; Kashkouli, M.B.; Moradpasandi, F.; Falavarjani, K.G.; Mirshahi, R.; Akbarian, S. Optic Nerve Head Vessel Density Changes from Graves’ Disease without TED to TED Dysthyroid Optic Neuropathy: Does Optic Nerve Head Ischemia Play a Role? Ophthal. Plast. Reconstr. Surg. 2022, 38, 250–257. [Google Scholar] [CrossRef] [PubMed]
- Çalışkan, S.; Acar, M.; Gürdal, C. Choroidal Thickness in Patients with Graves’ Ophthalmopathy. Curr. Eye Res. 2017, 42, 484–490. [Google Scholar] [CrossRef] [PubMed]
- Casini, G.; Marinò, M.; Rubino, M.; Licari, S.; Covello, G.; Mazzi, B.; Ionni, I.; Rocchi, R.; Sframeli, A.T.; Figus, M.; et al. Retinal, Choroidal and Optic Disc Analysis in Patients with Graves’ Disease with or without Orbitopathy. Int. Ophthalmol. 2020, 40, 2129–2137. [Google Scholar] [CrossRef] [PubMed]
- Dai, Y.; Wang, K.; Zheng, D.; Li, G.; Wang, K.; Wang, X.; Sun, B. Quantitative Analysis of Choroidal Alterations in Thyroid Eye Disease Using Swept-Source OCT. Front. Phys. 2023, 11, 1240728. [Google Scholar] [CrossRef]
- Dave, T.V.; Natarajan, R.; Reddy, R.U.; Kapoor, A.G.; Dave, V.P. Choroidal Thickness in Thyroid Eye Disease: Comparison With Controls and Application in Diagnosing Non-Inflammatory Active Disease. Cureus 2021, 13, e19779. [Google Scholar] [CrossRef]
- Elsamkary, M.A.; El-Shazly, A.A.E.-F.; Badran, T.A.F.; Fouad, Y.A.; Abdelgawad, R.H.A. Optical Coherence Tomography and Electrophysiological Analysis of Proptotic Eyes Due to Thyroid-Associated Ophthalmopathy. Int. Ophthalmol. 2022, 43, 2057–2064. [Google Scholar] [CrossRef] [PubMed]
- Guo, J.; Li, X.; Ma, R.; Gan, L.; Qian, J. The Changes of Retinal Nerve Fibre Layer and Ganglion Cell Layer with Different Severity of Thyroid Eye Disease. Eye 2022, 36, 129–134. [Google Scholar] [CrossRef]
- Jian, H.; Wang, Y.; Ou, L.; He, W. Altered Peripapillary Vessel Density and Nerve Fiber Layer Thickness in Thyroid-Associated Ophthalmopathy Using Optical Coherence Tomography Angiography. Int. Ophthalmol. 2022, 42, 855–862. [Google Scholar] [CrossRef] [PubMed]
- Kurt, M.M.; Akpolat, C.; Evliyaoglu, F.; Yilmaz, M.; Ordulu, F. Evaluation of Retinal Neurodegeneration and Choroidal Thickness in Patients with Inactive Graves’ Ophthalmopathy. Klin. Monatsblätter Augenheilkd. 2021, 238, 797–802. [Google Scholar] [CrossRef] [PubMed]
- Lai, F.H.P.; Iao, T.W.U.; Ng, D.S.C.; Young, A.L.; Leung, J.; Au, A.; Ko, S.T.C.; Chong, K.K.L. Choroidal Thickness in Thyroid-associated Orbitopathy. Clin. Experiment. Ophthalmol. 2019, 47, 918–924. [Google Scholar] [CrossRef] [PubMed]
- Luo, L.; Li, D.; Gao, L.; Wang, W. Retinal Nerve Fiber Layer and Ganglion Cell Complex Thickness as a Diagnostic Tool in Early Stage Dysthyroid Optic Neuropathy. Eur. J. Ophthalmol. 2022, 32, 3082–3091. [Google Scholar] [CrossRef] [PubMed]
- Blum Meirovitch, S.; Leibovitch, I.; Kesler, A.; Varssano, D.; Rosenblatt, A.; Neudorfer, M. Retina and Nerve Fiber Layer Thickness in Eyes with Thyroid-Associated Ophthalmopathy. Isr. Med. Assoc. J. IMAJ 2017, 19, 277–281. [Google Scholar]
- Mugdha, K.; Kaur, A.; Sinha, N.; Saxena, S. Evaluation of Retinal Nerve Fiber Layer Thickness Profile in Thyroid Ophthalmopathy without Optic Nerve Dysfunction. Int. J. Ophthalmol. 2016, 9, 1634–1637. [Google Scholar] [CrossRef] [PubMed]
- Del Noce, C.; Vagge, A.; Nicolò, M.; Traverso, C.E. Evaluation of Choroidal Thickness and Choroidal Vascular Blood Flow in Patients with Thyroid-Associated Orbitopathy (TAO) Using SD-OCT and Angio-OCT. Graefes Arch. Clin. Exp. Ophthalmol. 2020, 258, 1103–1107. [Google Scholar] [CrossRef] [PubMed]
- Ogmen, B.E.; Ugurlu, N.; Bilginer, M.C.; Polat, S.B.; Genc, B.; Ersoy, R.; Cakir, B. Thicknesses of the Retinal Layers in Patients with Graves’ Disease with or without Orbitopathy. Int. Ophthalmol. 2022, 42, 3397–3405. [Google Scholar] [CrossRef] [PubMed]
- Park, K.-A.; Kim, Y.-D.; In Woo, K.; Kee, C.; Han, J.C. Optical Coherence Tomography Measurements in Compressive Optic Neuropathy Associated with Dysthyroid Orbitopathy. Graefes Arch. Clin. Exp. Ophthalmol. 2016, 254, 1617–1624. [Google Scholar] [CrossRef]
- Sayın, O.; Yeter, V.; Arıtürk, N. Optic Disc, Macula, and Retinal Nerve Fiber Layer Measurements Obtained by OCT in Thyroid-Associated Ophthalmopathy. J. Ophthalmol. 2016, 2016, 9452687. [Google Scholar] [CrossRef] [PubMed]
- Wu, Y.; Tu, Y.; Wu, C.; Bao, L.; Wang, J.; Lu, F.; Shen, M.; Chen, Q. Reduced Macular Inner Retinal Thickness and Microvascular Density in the Early Stage of Patients with Dysthyroid Optic Neuropathy. Eye Vis. 2020, 7, 16. [Google Scholar] [CrossRef]
- Xu, B.; Wang, S.; Chen, L.; Tan, J. The Early Diagnostic Value of Optical Coherence Tomography (OCT) and OCT Angiography in Thyroid-Associated Ophthalmopathy. Ther. Adv. Chronic Dis. 2023, 14, 20406223231166802. [Google Scholar] [CrossRef]
- Yu, N.; Zhang, Y.; Kang, L.; Gao, Y.; Zhang, J.; Wu, Y. Analysis in Choroidal Thickness in Patients with Graves’ Ophthalmopathy Using Spectral-Domain Optical Coherence Tomography. J. Ophthalmol. 2018, 2018, 3529395. [Google Scholar] [CrossRef]
- Zhang, T.; Xiao, W.; Ye, H.; Chen, R.; Mao, Y.; Yang, H. Peripapillary and Macular Vessel Density in Dysthyroid Optic Neuropathy: An Optical Coherence Tomography Angiography Study. Investig. Opthalmol. Vis. Sci. 2019, 60, 1863. [Google Scholar] [CrossRef] [PubMed]
- Zhong, S.; He, F.; Fang, S.; Sun, J.; Li, Y.; Shuo, Z.; Liu, X.; Song, X.; Wang, Y.; Huang, Y.; et al. Choroidal Thickness in Patients with Thyroid-Associated Ophthalmopathy, as Determined by Swept-Source Optical Coherence Tomography. Br. J. Ophthalmol. 2024, 108, 1081–1087. [Google Scholar] [CrossRef]
- Chien, L.; Go, C.C.; Luna, G.M.L.; Briceño, C.A. Changes in Retinal Nerve Fiber Layer, Ganglion Cell Complex, and Ganglion Cell Layer Thickness in Thyroid Eye Disease: A Systematic Review. Taiwan J. Ophthalmol. 2024, 14, 217–224. [Google Scholar] [CrossRef] [PubMed]
- Blandford, A.D.; Zhang, D.; Chundury, R.V.; Perry, J.D. Dysthyroid Optic Neuropathy: Update on Pathogenesis, Diagnosis, and Management. Expert Rev. Ophthalmol. 2017, 12, 111–121. [Google Scholar] [CrossRef] [PubMed]
- Chen, H.-H.; Hu, H.; Chen, W.; Cui, D.; Xu, X.-Q.; Wu, F.-Y.; Yang, T. Thyroid-Associated Orbitopathy: Evaluating Microstructural Changes of Extraocular Muscles and Optic Nerves Using Readout-Segmented Echo-Planar Imaging-Based Diffusion Tensor Imaging. Korean J. Radiol. 2020, 21, 332. [Google Scholar] [CrossRef] [PubMed]
- Danesh-Meyer, H.V.; Carroll, S.C.; Foroozan, R.; Savino, P.J.; Fan, J.; Jiang, Y.; Vander Hoorn, S. Relationship between Retinal Nerve Fiber Layer and Visual Field Sensitivity as Measured by Optical Coherence Tomography in Chiasmal Compression. Investig. Opthalmol. Vis. Sci. 2006, 47, 4827. [Google Scholar] [CrossRef] [PubMed]
- Chien, L.; Go, C.C.; Lahaie Luna, G.M.; Briceño, C.A. Changes in choroidal thickness and choroidal vascularity index in thyroid eye disease: A systematic review. Orbit 2024, 43, 399–407. [Google Scholar] [CrossRef] [PubMed]
- Kowalik-Jagodzińska, M.; Sobol, M.; Turno-Kręcicka, A. A Comparison of Observational Studies on Subfoveal Choroidal Thickness Measured with OCT according to the Level of Thyroid Eye Disease Activity—Systematic Review and Meta-Analysis. J. Clin. Med. 2023, 12, 4720. [Google Scholar] [CrossRef] [PubMed]
- Goel, R.; Shah, S.; Sundar, G.; Arora, R.; Gupta, S.; Khullar, T. Orbital and ocular perfusion in thyroid eye disease. Surv. Ophthalmol. 2023, 68, 481–506. [Google Scholar] [CrossRef]
- Ghenciu, L.A.; Șișu, A.M.; Stoicescu, E.R.; Dănilă, A.-I.; Iacob, R.; Săndesc, M.-A.; Hațegan, O.A. Thyroid Eye Disease and Glaucoma: A Cross-Sectional Study Comparing Clinical Characteristics and Disease Severity. Medicina 2024, 60, 1430. [Google Scholar] [CrossRef] [PubMed]
- Bagatin, F.; Prpić, A.; Škunca Herman, J.; Zrinšćak, O.; Iveković, R.; Vatavuk, Z. Correlation between Structural and Functional Changes in Patients with Raised Intraocular Pressure Due to Graves’ Orbitopathy. Diagnostics 2024, 14, 649. [Google Scholar] [CrossRef]
- Hsu, C.-K.; Yao, H.-Y.; Lin, C.-M.; Chang, H.-C.; Lu, D.-W.; Chen, Y.-H.; Chien, K.-H. Characteristics of Optic Disc and Visual Field Changes in Patients with Thyroid-Associated Orbitopathy and Open-Angle Glaucoma. J. Clin. Med. 2021, 10, 3839. [Google Scholar] [CrossRef]
- Sarnat-Kucharczyk, M.; Świerkot, M.; Handzlik, G.; Kulawik, G.; Jagoda, K.; Grochoła-Małecka, I.; Fryżewska, J.; Mrukwa-Kominek, E.; Chudek, J. Antithymocyte Globulin as Second-Line Therapy in Graves Orbitopathy—Preliminary Results From a Prospective Single-Center Study. Front. Endocrinol. 2022, 13, 871009. [Google Scholar] [CrossRef] [PubMed]
- Park, K.-A.; Kim, Y.-D.; Woo, K.I. Changes in Optical Coherence Tomography Measurements after Orbital Wall Decompression in Dysthyroid Optic Neuropathy. Eye 2018, 32, 1123–1129. [Google Scholar] [CrossRef] [PubMed]
- Rajabi, M.T.; Ojani, M.; Riazi Esfahani, H.; Tabatabaei, S.Z.; Rajabi, M.B.; Hosseini, S.S. Correlation of Peripapillary Nerve Fiber Layer Thickness with Visual Outcomes after Decompression Surgery in Subclinical and Clinical Thyroid-Related Compressive Optic Neuropathy. J. Curr. Ophthalmol. 2019, 31, 86–91. [Google Scholar] [CrossRef] [PubMed]
- Baltmr, A.; Lightman, S.; Tomkins-Netzer, O. Examining the Choroid in Ocular Inflammation: A Focus on Enhanced Depth Imaging. J. Ophthalmol. 2014, 2014, 459136. [Google Scholar] [CrossRef]
- Wang, Y.; Smith, T.J. Current Concepts in the Molecular Pathogenesis of Thyroid-Associated Ophthalmopathy. Investig. Opthalmol. Vis. Sci. 2014, 55, 1735. [Google Scholar] [CrossRef] [PubMed]
- Korkmaz, S.; Konuk, O. Surgical Treatment of Dysthyroid Optic Neuropathy: Long-Term Visual Outcomes with Comparison of 2-Wall versus 3-Wall Orbital Decompression. Curr. Eye Res. 2016, 41, 159–164. [Google Scholar] [CrossRef] [PubMed]
Disclaimer/Publisher’s Note: The statements, opinions and data contained in all publications are solely those of the individual author(s) and contributor(s) and not of MDPI and/or the editor(s). MDPI and/or the editor(s) disclaim responsibility for any injury to people or property resulting from any ideas, methods, instructions or products referred to in the content. |
© 2025 by the authors. Licensee MDPI, Basel, Switzerland. This article is an open access article distributed under the terms and conditions of the Creative Commons Attribution (CC BY) license (https://creativecommons.org/licenses/by/4.0/).