
Systematic Review: AI Applications in Liver Imaging with a Focus on Segmentation and Detection
 ,
,  , , and
Abstract
1. Introduction
2. Materials and Methods
- The area of interest (AOI): liver parenchyma, lesions, vascularity, bile ducts or complex models (applied to >1 area, e.g., liver parenchyma and lesions).
- The AI task: detection and/or segmentation, classification/regression, image optimization (registration/synthesis/reconstruction) and multi-task (performing >1 task, e.g., segmentation and classification).
- The modality: US, CT, MRI, nuclear medicine, multi-modality (using > 1 modality, e.g., CT and MRI).
- The datasets used: public, private or both.
- The usage of an external dataset.
- The availability of the code used for model development.
- The prospective or retrospective nature of the study.
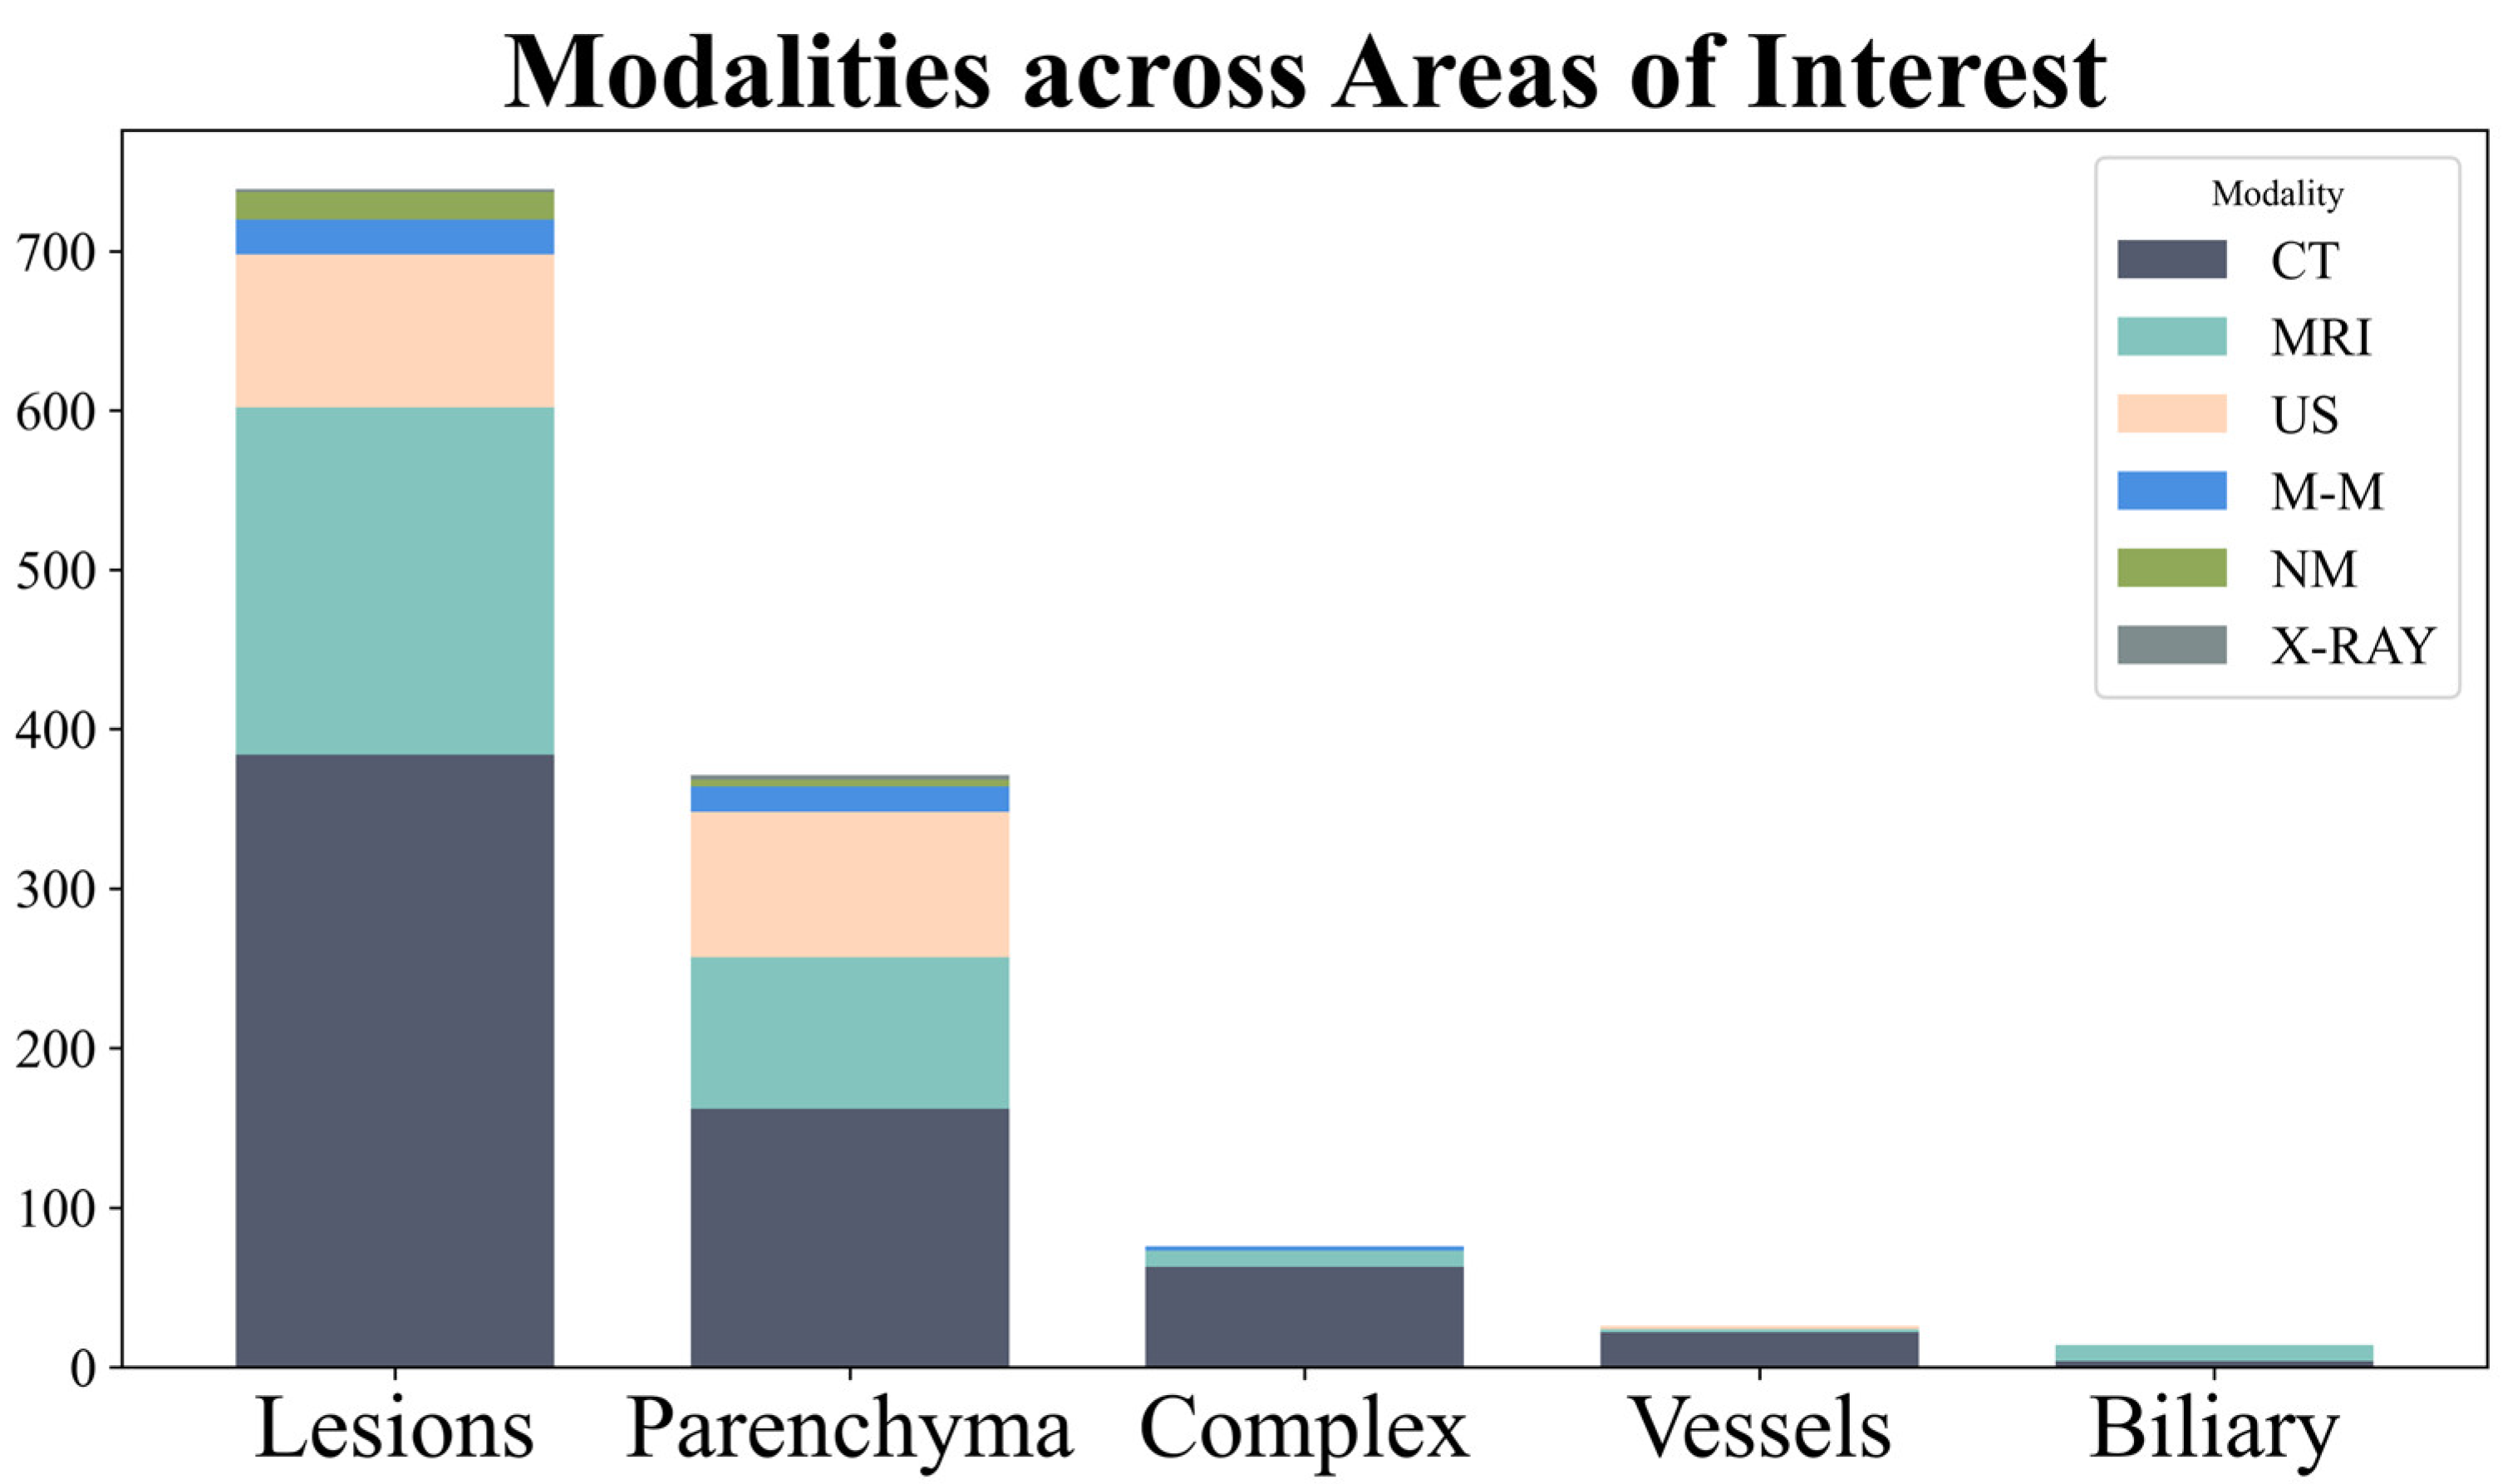
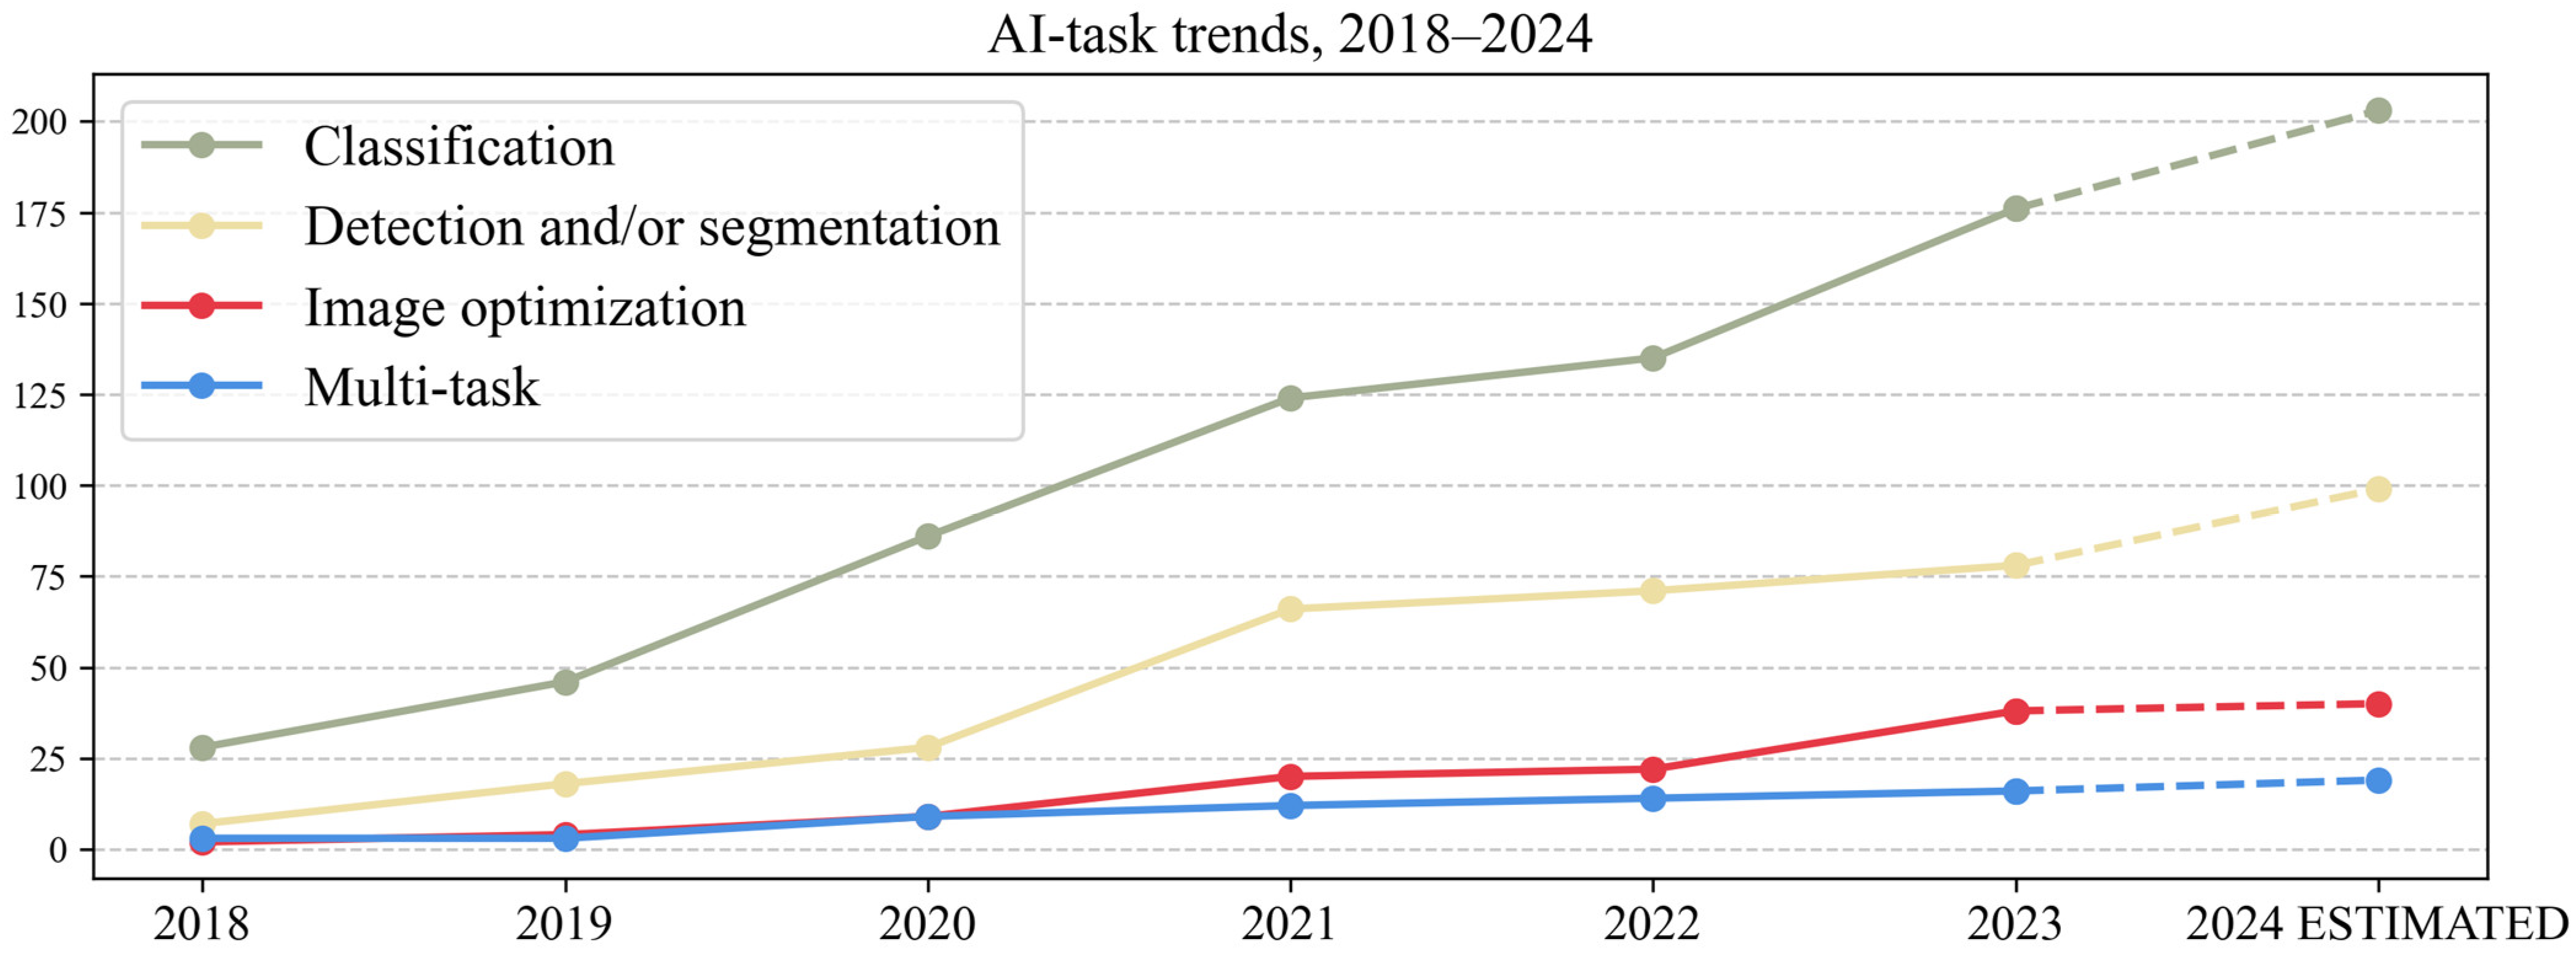
- Data from individual studies were tabulated according to the abovementioned criteria to summarize key study characteristics. Visual representations included hierarchical tree maps (Figures 3, 5 and 7) for the AOI, modality and AI task; line charts (Figures 4, 6, 8 and 9) for temporal trends; and stacked bar charts in Appendix A (Figure A1, Figure A2 and Figure A3). The number of articles for which the respective data was unavailable is mentioned in the results.
3. Results
3.1. Area of Interest (AOI)
3.2. Modality
3.3. AI Task
3.4. Detection and/or Segmentation Studies
3.4.1. Detection and/or Segmentation AOIs
3.4.2. Detection and/or Segmentation (D&S) Datasets
4. Discussion
5. Limitations
6. Conclusions
Supplementary Materials
Author Contributions
Funding
Data Availability Statement
Conflicts of Interest
Abbreviations
| PRISMA | Preferred Reporting Items for Systematic Reviews and Meta-Analyses |
| CT | Computed tomography |
| MRI | Magnetic resonance imaging |
| US | Ultrasound |
| NALFD | Non-alcoholic fatty liver disease |
| HCC | Hepatocarcinoma |
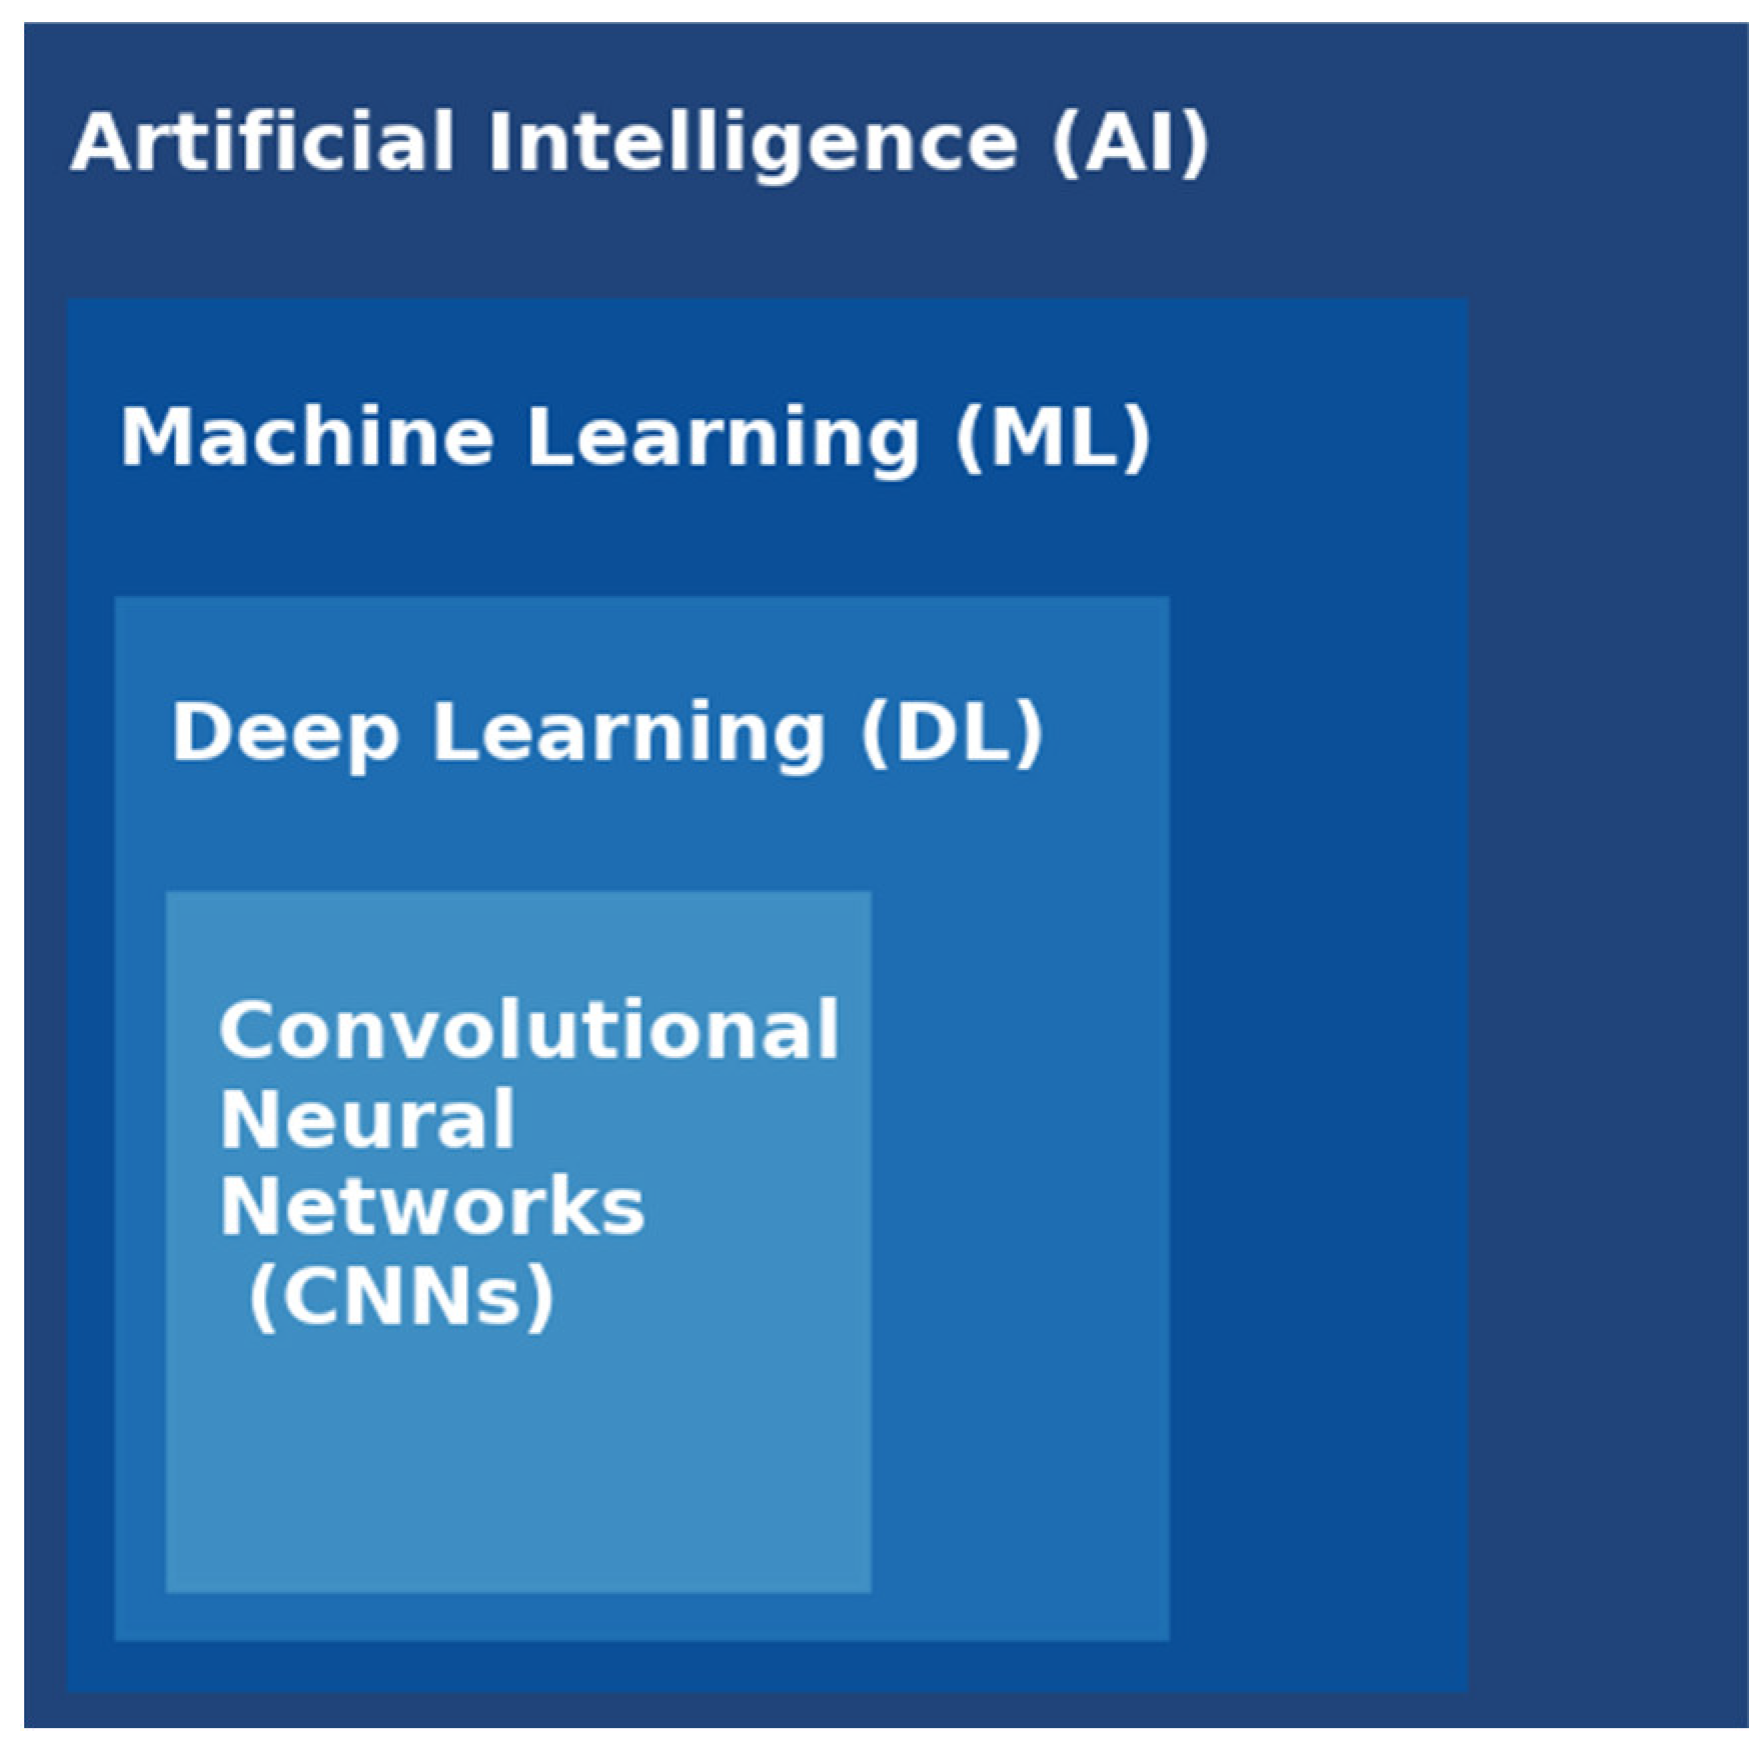
| AI | Artificial intelligence |
| ML | Machine learning |
| DL | Deep learning |
| CNN | Convolutional neural network |
| PACS | Picture archiving and communication system |
| CLAIM | Checklist for Artificial Intelligence in Medical Imaging |
| MINIMAR | MINimum Information for Medical AI Reporting |
| AOI | Area of interest |
| NM | Nuclear medicine |
| M-M | Multi-modality |
| LiTS | Liver Tumor Segmentation |
| 3DIRCAD | 3D image reconstruction for comparison of algorithm database |
| SLIVER | Segmentation of the Liver |
| CHAOS | Challenge-combined healthy abdominal organ segmentation |
| MSD | Medical Segmentation Decathlon |
| CLUST | Challenge on Liver Ultrasound Tracking |
| AMOS | Abdominal multi-organ segmentation |
| ATLAS | A Tumor and Liver Automatic Segmentation |
| DLDS | Duke liver dataset |
| ACT-1K | Abdomen-CT1k |
| BTCV | Beyond the cranial vault |
| NM | Nuclear medicine |
| M-M | Multi-modality |
Appendix A


| Dataset | Used by No. of Articles | Modality |
|---|---|---|
| Liver Tumor Segmentation (LiTS) [23] | 137 | CT |
| 3D image reconstruction for comparison of algorithm database (3DIRCAD) [24] | 97 | CT |
| Segmentation of the Liver (SLIVER) [25] | 25 | CT |
| Challenge-combined healthy abdominal organ segmentation (CHAOS) [26] | 23 | CT and MRI |
| Medical Segmentation Decathlon (MSD) [55] | 13 | CT |
| The cancer imaging archive (TCIA) [35] | 4 | CT and MRI |
| Challenge on Liver Ultrasound Tracking (CLUST) [36,37] | 3 | US |
| Abdominal multi-organ segmentation (AMOS) [31] | 2 | CT and MRI |
| A Tumor and Liver Automatic Segmentation (ATLAS) [32] | 2 | MRI |
| Duke liver dataset (DLDS) [33] | 2 | MRI |
| LIVERHCCSEG [34] | 2 | MRI |
| Abdomen-CT1k (ACT-1K) [108] | 2 | CT |
| ISICDM [109] | 1 | CT |
| Beyond the cranial vault (BTCV) [110] | 1 | CT |
| KAGGLE zxcv2022 [111] | 1 | CT |
| Multi-organ Abdominal CT Reference Standard Segmentations [112] | 1 | CT |
| VISCERALAnatomy [113] | 1 | CT |
| Dataset Type Used | Used by No. of Articles |
|---|---|
| No information | 81 (52.25%) |
| Multiphasic CT/MRI | 33 (21.29%) |
| Single-phase CT/MRI—venous | 13 (8.38%) |
| Multiphase multiparametric MRI | 8 (5.16%) |
| Single-phase MRI—hepatobiliary | 6 (3.87%) |
| Multiparametric MRI (non-contrast) | 5 (3.22%) |
| Single-sequence MRI-T1 (non-contrast) | 3 (1.93%) |
| Single-phase CT/MRI—arterial | 2 (1.29%) |
| Single-phase CT/MRI—delayed | 2 (1.29%) |
| Single-sequence MRI-T2 | 1 (0.64%) |
| Single-sequence MRI-PDFF | 1 (0.64%) |
References
- Arias, I.M.; Alter, H.J.; Boyer, J.L.; Cohen, D.E.; Shafritz, D.A.; Thorgeirsson, S.S.; Wolkoff, A.W. The Liver: Biology and Pathobiology; John Wiley & Sons: Hoboken, NJ, USA, 2020. [Google Scholar]
- Lorente, S.; Hautefeuille, M.; Sanchez-Cedillo, A. The liver, a functionalized vascular structure. Sci. Rep. 2020, 10, 16194. [Google Scholar] [CrossRef]
- Moon, A.M.; Singal, A.G.; Tapper, E.B. Contemporary epidemiology of chronic liver disease and cirrhosis. Clin. Gastroenterol. Hepatol. 2020, 18, 2650–2666. [Google Scholar] [CrossRef]
- Estes, C.; Razavi, H.; Loomba, R.; Younossi, Z.; Sanyal, A.J. Modeling the epidemic of nonalcoholic fatty liver disease demonstrates an exponential increase in burden of disease. Hepatology 2018, 67, 123–133. [Google Scholar] [CrossRef]
- Caussy, C.; Reeder, S.B.; Sirlin, C.B.; Loomba, R. Noninvasive, Quantitative Assessment of Liver Fat by MRI-PDFF as an Endpoint in NASH Trials. Hepatology 2018, 68, 763–772. [Google Scholar] [CrossRef] [PubMed]
- Ferraioli, G.; Soares Monteiro, L.B. Ultrasound-based techniques for the diagnosis of liver steatosis. World J. Gastroenterol. 2019, 25, 6053–6062. [Google Scholar] [CrossRef] [PubMed]
- Venkatesh, S.K.; Yin, M.; Ehman, R.L. Magnetic resonance elastography of liver: Technique, analysis, and clinical applications. J. Magn. Reson. Imaging 2013, 37, 544–555. [Google Scholar] [CrossRef] [PubMed]
- Gu, J.; Liu, S.; Du, S.; Zhang, Q.; Xiao, J.; Dong, Q.; Xin, Y. Diagnostic value of MRI-PDFF for hepatic steatosis in patients with non-alcoholic fatty liver disease: A meta-analysis. Eur. Radiol. 2019, 29, 3564–3573. [Google Scholar] [CrossRef] [PubMed]
- Sung, H.; Ferlay, J.; Siegel, R.L.; Laversanne, M.; Soerjomataram, I.; Jemal, A.; Bray, F. Global cancer statistics 2020: GLOBOCAN estimates of incidence and mortality worldwide for 36 cancers in 185 countries. CA Cancer J. Clin. 2021, 71, 209–249. [Google Scholar] [CrossRef] [PubMed]
- Tsilimigras, D.I.; Brodt, P.; Clavien, P.-A.; Muschel, R.J.; D’Angelica, M.I.; Endo, I.; Parks, R.W.; Doyle, M.; de Santibañes, E.; Pawlik, T.M. Liver metastases. Nat. Rev. Dis. Primers 2021, 7, 27. [Google Scholar] [CrossRef]
- Barragán-Montero, A.; Javaid, U.; Valdés, G.; Nguyen, D.; Desbordes, P.; Macq, B.; Willems, S.; Vandewinckele, L.; Holmström, M.; Löfman, F. Artificial intelligence and machine learning for medical imaging: A technology review. Phys. Medica 2021, 83, 242–256. [Google Scholar] [CrossRef] [PubMed]
- Yamashita, R.; Nishio, M.; Do, R.K.G.; Togashi, K. Convolutional neural networks: An overview and application in radiology. Insights Imaging 2018, 9, 611–629. [Google Scholar] [CrossRef]
- Recht, M.P.; Dewey, M.; Dreyer, K.; Langlotz, C.; Niessen, W.; Prainsack, B.; Smith, J.J. Integrating artificial intelligence into the clinical practice of radiology: Challenges and recommendations. Eur. Radiol. 2020, 30, 3576–3584. [Google Scholar] [CrossRef] [PubMed]
- Jiang, F.; Jiang, Y.; Zhi, H.; Dong, Y.; Li, H.; Ma, S.; Wang, Y.; Dong, Q.; Shen, H.; Wang, Y. Artificial intelligence in healthcare: Past, present and future. Stroke Vasc. Neurol. 2017, 2. [Google Scholar] [CrossRef] [PubMed]
- Wang, L.; Wang, H.; Huang, Y.; Yan, B.; Chang, Z.; Liu, Z.; Zhao, M.; Cui, L.; Song, J.; Li, F. Trends in the application of deep learning networks in medical image analysis: Evolution between 2012 and 2020. Eur. J. Radiol. 2022, 146, 110069. [Google Scholar] [CrossRef]
- Tejani, A.S.; Klontzas, M.E.; Gatti, A.A.; Mongan, J.T.; Moy, L.; Park, S.H.; Kahn, C.E., Jr.; Panel, C.U. Checklist for Artificial Intelligence in Medical Imaging (CLAIM): 2024 Update. Radiol. Artif. Intell. 2024, 6, e240300. [Google Scholar] [CrossRef] [PubMed]
- Hernandez-Boussard, T.; Bozkurt, S.; Ioannidis, J.P.; Shah, N.H. MINIMAR (MINimum Information for Medical AI Reporting): Developing reporting standards for artificial intelligence in health care. J. Am. Med. Inform. Assoc. 2020, 27, 2011–2015. [Google Scholar] [CrossRef]
- Klontzas, M.E.; Gatti, A.A.; Tejani, A.S.; Kahn, C.E., Jr. AI Reporting Guidelines: How to Select the Best One for Your Research. Radiol. Artif. Intell. 2023, 5, e230055. [Google Scholar] [CrossRef] [PubMed]
- Nakai, H.; Sakamoto, R.; Kakigi, T.; Coeur, C.; Isoda, H.; Nakamoto, Y. Artificial intelligence-powered software detected more than half of the liver metastases overlooked by radiologists on contrast-enhanced CT. Eur. J. Radiol. 2023, 163, 110823. [Google Scholar] [CrossRef]
- Cheng, P.M.; Montagnon, E.; Yamashita, R.; Pan, I.; Cadrin-Chenevert, A.; Perdigon Romero, F.; Chartrand, G.; Kadoury, S.; Tang, A. Deep Learning: An Update for Radiologists. Radiographics 2021, 41, 1427–1445. [Google Scholar] [CrossRef]
- Dai, W.; Li, X.; Chiu, W.H.K.; Kuo, M.D.; Cheng, K.-T. Adaptive contrast for image regression in computer-aided disease assessment. IEEE Trans. Med. Imaging 2021, 41, 1255–1268. [Google Scholar] [CrossRef] [PubMed]
- Moher, D.; Liberati, A.; Tetzlaff, J.; Altman, D.G.; The PRISMA Group. Preferred reporting items for systematic reviews and meta-analyses: The PRISMA statement. Ann. Intern. Med. 2009, 151, 264–269. [Google Scholar] [CrossRef] [PubMed]
- Bilic, P.; Christ, P.; Li, H.B.; Vorontsov, E.; Ben-Cohen, A.; Kaissis, G.; Szeskin, A.; Jacobs, C.; Mamani, G.E.H.; Chartrand, G. The liver tumor segmentation benchmark (lits). Med. Image Anal. 2023, 84, 102680. [Google Scholar] [CrossRef] [PubMed]
- Soler, L.; Hostettler, A.; Agnus, V.; Charnoz, A.; Fasquel, J.-B.; Moreau, J.; Osswald, A.-B.; Bouhadjar, M.; Marescaux, J. 3D Image Reconstruction for Comparison of Algorithm Database. 2010. Available online: https://www.ircad.fr/research/data-sets/liver-segmentation-3d-ircadb-01 (accessed on 20 October 2024).
- Heimann, T.; Van Ginneken, B.; Styner, M.A.; Arzhaeva, Y.; Aurich, V.; Bauer, C.; Beck, A.; Becker, C.; Beichel, R.; Bekes, G. Comparison and evaluation of methods for liver segmentation from CT datasets. IEEE Trans. Med. Imaging 2009, 28, 1251–1265. [Google Scholar] [CrossRef] [PubMed]
- Kavur, A.E.; Gezer, N.S.; Barış, M.; Aslan, S.; Conze, P.-H.; Groza, V.; Pham, D.D.; Chatterjee, S.; Ernst, P.; Özkan, S. CHAOS challenge-combined (CT-MR) healthy abdominal organ segmentation. Med. Image Anal. 2021, 69, 101950. [Google Scholar] [CrossRef]
- Nam, D.; Chapiro, J.; Paradis, V.; Seraphin, T.P.; Kather, J.N. Artificial intelligence in liver diseases: Improving diagnostics, prognostics and response prediction. JHEP Rep. 2022, 4, 100443. [Google Scholar] [CrossRef] [PubMed]
- Radiya, K.; Joakimsen, H.L.; Mikalsen, K.O.; Aahlin, E.K.; Lindsetmo, R.O.; Mortensen, K.E. Performance and clinical applicability of machine learning in liver computed tomography imaging: A systematic review. Eur. Radiol. 2023, 33, 6689–6717. [Google Scholar] [CrossRef] [PubMed]
- Oh, N.; Kim, J.H.; Rhu, J.; Jeong, W.K.; Choi, G.S.; Kim, J.M.; Joh, J.W. Automated 3D liver segmentation from hepatobiliary phase MRI for enhanced preoperative planning. Sci. Rep. 2023, 13, 17605. [Google Scholar] [CrossRef]
- Panic, J.; Defeudis, A.; Balestra, G.; Giannini, V.; Rosati, S. Normalization Strategies in Multi-Center Radiomics Abdominal MRI: Systematic Review and Meta-Analyses. IEEE Open J. Eng. Med. Biol. 2023, 4, 67–76. [Google Scholar] [CrossRef] [PubMed]
- Ji, Y.; Bai, H.; Ge, C.; Yang, J.; Zhu, Y.; Zhang, R.; Li, Z.; Zhanng, L.; Ma, W.; Wan, X. Amos: A large-scale abdominal multi-organ benchmark for versatile medical image segmentation. Adv. Neural Inf. Process. Syst. 2022, 35, 36722–36732. [Google Scholar]
- Quinton, F.; Popoff, R.; Presles, B.; Leclerc, S.; Meriaudeau, F.; Nodari, G.; Lopez, O.; Pellegrinelli, J.; Chevallier, O.; Ginhac, D. A tumour and liver automatic segmentation (atlas) dataset on contrast-enhanced magnetic resonance imaging for hepatocellular carcinoma. Data 2023, 8, 79. [Google Scholar] [CrossRef]
- Macdonald, J.A.; Zhu, Z.; Konkel, B.; Mazurowski, M.A.; Wiggins, W.F.; Bashir, M.R. Duke Liver Dataset: A publicly available liver MRI dataset with liver segmentation masks and series labels. Radiol. Artif. Intell. 2023, 5, e220275. [Google Scholar] [CrossRef] [PubMed]
- Gross, M.; Arora, S.; Huber, S.; Kücükkaya, A.S.; Onofrey, J.A. LiverHccSeg: A publicly available multiphasic MRI dataset with liver and HCC tumor segmentations and inter-rater agreement analysis. Data Brief 2023, 51, 109662. [Google Scholar] [CrossRef] [PubMed]
- Clark, K.; Vendt, B.; Smith, K.; Freymann, J.; Kirby, J.; Koppel, P.; Moore, S.; Phillips, S.; Maffitt, D.; Pringle, M. The Cancer Imaging Archive (TCIA): Maintaining and operating a public information repository. J. Digit. Imaging 2013, 26, 1045–1057. [Google Scholar] [CrossRef] [PubMed]
- De Luca, V.; Banerjee, J.; Hallack, A.; Kondo, S.; Makhinya, M.; Nouri, D.; Royer, L.; Cifor, A.; Dardenne, G.; Goksel, O. Evaluation of 2D and 3D ultrasound tracking algorithms and impact on ultrasound-guided liver radiotherapy margins. Med. Phys. 2018, 45, 4986–5003. [Google Scholar] [CrossRef]
- De Luca, V.; Benz, T.; Kondo, S.; König, L.; Lübke, D.; Rothlübbers, S.; Somphone, O.; Allaire, S.; Bell, M.L.; Chung, D. The 2014 liver ultrasound tracking benchmark. Phys. Med. Biol. 2015, 60, 5571. [Google Scholar] [CrossRef] [PubMed]
- Starmans, M.P.; Miclea, R.L.; Vilgrain, V.; Ronot, M.; Purcell, Y.; Verbeek, J.; Niessen, W.J.; Ijzermans, J.N.; de Man, R.A.; Doukas, M. Automated assessment of T2-Weighted MRI to differentiate malignant and benign primary solid liver lesions in noncirrhotic livers using radiomics. Acad. Radiol. 2024, 31, 870–879. [Google Scholar] [CrossRef] [PubMed]
- Urhuț, M.-C.; Săndulescu, L.D.; Streba, C.T.; Mămuleanu, M.; Ciocâlteu, A.; Cazacu, S.M.; Dănoiu, S. Diagnostic Performance of an Artificial Intelligence Model Based on Contrast-Enhanced Ultrasound in Patients with Liver Lesions: A Comparative Study with Clinicians. Diagnostics 2023, 13, 3387. [Google Scholar] [CrossRef]
- Deng, X.; Liao, Z. A machine-learning model based on dynamic contrast-enhanced MRI for preoperative differentiation between hepatocellular carcinoma and combined hepatocellular–cholangiocarcinoma. Clin. Radiol. 2024, 79, e817–e825. [Google Scholar] [CrossRef]
- Li, C.-Q.; Zheng, X.; Guo, H.-L.; Cheng, M.-Q.; Huang, Y.; Xie, X.-Y.; Lu, M.-D.; Kuang, M.; Wang, W.; Chen, L.-D. Differentiation between combined hepatocellular cholangiocarcinoma and hepatocellular carcinoma: Comparison of diagnostic performance between ultrasomics-based model and CEUS LI-RADS v2017. BMC Med. Imaging 2022, 22, 36. [Google Scholar]
- Lei, Y.; Feng, B.; Wan, M.; Xu, K.; Cui, J.; Ma, C.; Sun, J.; Yao, C.; Gan, S.; Shi, J. Predicting microvascular invasion in hepatocellular carcinoma with a CT-and MRI-based multimodal deep learning model. Abdom. Radiol. 2024, 49, 1397–1410. [Google Scholar] [CrossRef]
- Liu, J.; Cheng, D.; Liao, Y.; Luo, C.; Lei, Q.; Zhang, X.; Wang, L.; Wen, Z.; Gao, M. Development of a magnetic resonance imaging-derived radiomics model to predict microvascular invasion in patients with hepatocellular carcinoma. Quant. Imaging Med. Surg. 2023, 13, 3948. [Google Scholar] [CrossRef] [PubMed]
- Mosconi, C.; Cucchetti, A.; Bruno, A.; Cappelli, A.; Bargellini, I.; De Benedittis, C.; Lorenzoni, G.; Gramenzi, A.; Tarantino, F.P.; Parini, L. Radiomics of cholangiocarcinoma on pretreatment CT can identify patients who would best respond to radioembolisation. Eur. Radiol. 2020, 30, 4534–4544. [Google Scholar] [CrossRef] [PubMed]
- Ballı, H.T.; Pişkin, F.C.; Yücel, S.P.; Sözütok, S.; Özgül, D.; Aikimbaev, K. Predictability of the radiological response to Yttrium-90 transarterial radioembolization by dynamic magnetic resonance imaging-based radiomics analysis in patients with intrahepatic cholangiocarcinoma. Diagn. Interv. Radiol. 2024, 30, 193. [Google Scholar] [CrossRef] [PubMed]
- He, Y.; Hu, B.; Zhu, C.; Xu, W.; Ge, Y.; Hao, X.; Dong, B.; Chen, X.; Dong, Q.; Zhou, X. A novel multimodal radiomics model for predicting prognosis of resected hepatocellular carcinoma. Front. Oncol. 2022, 12, 745258. [Google Scholar] [CrossRef] [PubMed]
- Wang, L.; Yan, D.; Shen, L.; Xie, Y.; Yan, S. Prognostic Value of a CT Radiomics-Based Nomogram for the Overall Survival of Patients with Nonmetastatic BCLC Stage C Hepatocellular Carcinoma after Stereotactic Body Radiotherapy. J. Oncol. 2023, 2023, 1554599. [Google Scholar] [CrossRef] [PubMed]
- Yasaka, K.; Akai, H.; Kunimatsu, A.; Abe, O.; Kiryu, S. Deep learning for staging liver fibrosis on CT: A pilot study. Eur. Radiol. 2018, 28, 4578–4585. [Google Scholar] [CrossRef]
- Naganawa, S.; Enooku, K.; Tateishi, R.; Akai, H.; Yasaka, K.; Shibahara, J.; Ushiku, T.; Abe, O.; Ohtomo, K.; Kiryu, S. Imaging prediction of nonalcoholic steatohepatitis using computed tomography texture analysis. Eur. Radiol. 2018, 28, 3050–3058. [Google Scholar] [CrossRef]
- Zhou, Z.; Xia, T.; Zhang, T.; Du, M.; Zhong, J.; Huang, Y.; Xuan, K.; Xu, G.; Wan, Z.; Ju, S. Prediction of preoperative microvascular invasion by dynamic radiomic analysis based on contrast-enhanced computed tomography. Abdom. Radiol. 2024, 49, 611–624. [Google Scholar] [CrossRef]
- Zhu, Z.; Lv, D.; Zhang, X.; Wang, S.-H.; Zhu, G. Deep learning in the classification of stage of liver fibrosis in chronic hepatitis b with magnetic resonance ADC images. Contrast Media Mol. Imaging 2021, 2021, 2015780. [Google Scholar] [CrossRef] [PubMed]
- Zhang, L.; Cai, P.; Hou, J.; Luo, M.; Li, Y.; Jiang, X. Radiomics model based on gadoxetic acid disodium-enhanced MR imaging to predict hepatocellular carcinoma recurrence after curative ablation. Cancer Manag. Res. 2021, 13, 2785–2796. [Google Scholar] [CrossRef]
- Gotra, A.; Sivakumaran, L.; Chartrand, G.; Vu, K.N.; Vandenbroucke-Menu, F.; Kauffmann, C.; Kadoury, S.; Gallix, B.; de Guise, J.A.; Tang, A. Liver segmentation: Indications, techniques and future directions. Insights Imaging 2017, 8, 377–392. [Google Scholar] [CrossRef]
- Wang, J.; Peng, Y.; Jing, S.; Han, L.; Li, T.; Luo, J. A deep-learning approach for segmentation of liver tumors in magnetic resonance imaging using UNet+. BMC Cancer 2023, 23, 1060. [Google Scholar] [CrossRef] [PubMed]
- Antonelli, M.; Reinke, A.; Bakas, S.; Farahani, K.; Kopp-Schneider, A.; Landman, B.A.; Litjens, G.; Menze, B.; Ronneberger, O.; Summers, R.M.; et al. The Medical Segmentation Decathlon. Nat. Commun. 2022, 13, 4128. [Google Scholar] [CrossRef] [PubMed]
- Wasserthal, J.; Breit, H.-C.; Meyer, M.T.; Pradella, M.; Hinck, D.; Sauter, A.W.; Heye, T.; Boll, D.T.; Cyriac, J.; Yang, S. TotalSegmentator: Robust segmentation of 104 anatomic structures in CT images. Radiol. Artif. Intell. 2023, 5, e230024. [Google Scholar] [CrossRef]
- Oh, N.; Kim, J.-H.; Rhu, J.; Jeong, W.K.; Choi, G.-S.; Kim, J.; Joh, J.-W. Comprehensive deep learning-based assessment of living liver donor CT angiography: From vascular segmentation to volumetric analysis. Int. J. Surg. 2024, 110, 6551–6557. [Google Scholar] [CrossRef]
- Jeong, J.G.; Choi, S.; Kim, Y.J.; Lee, W.-S.; Kim, K.G. Deep 3D attention CLSTM U-Net based automated liver segmentation and volumetry for the liver transplantation in abdominal CT volumes. Sci. Rep. 2022, 12, 6370. [Google Scholar] [CrossRef]
- Park, R.; Lee, S.; Sung, Y.; Yoon, J.; Suk, H.-I.; Kim, H.; Choi, S. Accuracy and efficiency of right-lobe graft weight estimation using deep-learning-assisted CT volumetry for living-donor liver transplantation. Diagnostics 2022, 12, 590. [Google Scholar] [CrossRef] [PubMed]
- Koitka, S.; Gudlin, P.; Theysohn, J.M.; Oezcelik, A.; Hoyer, D.P.; Dayangac, M.; Hosch, R.; Haubold, J.; Flaschel, N.; Nensa, F. Fully automated preoperative liver volumetry incorporating the anatomical location of the central hepatic vein. Sci. Rep. 2022, 12, 16479. [Google Scholar] [CrossRef]
- Winkel, D.J.; Weikert, T.J.; Breit, H.-C.; Chabin, G.; Gibson, E.; Heye, T.J.; Comaniciu, D.; Boll, D.T. Validation of a fully automated liver segmentation algorithm using multi-scale deep reinforcement learning and comparison versus manual segmentation. Eur. J. Radiol. 2020, 126, 108918. [Google Scholar] [CrossRef]
- Zbinden, L.; Catucci, D.; Suter, Y.; Hulbert, L.; Berzigotti, A.; Brönnimann, M.; Ebner, L.; Christe, A.; Obmann, V.C.; Sznitman, R. Automated liver segmental volume ratio quantification on non-contrast T1–Vibe Dixon liver MRI using deep learning. Eur. J. Radiol. 2023, 167, 111047. [Google Scholar] [CrossRef] [PubMed]
- Gross, M.; Huber, S.; Arora, S.; Ze’evi, T.; Haider, S.P.; Kucukkaya, A.S.; Iseke, S.; Kuhn, T.N.; Gebauer, B.; Michallek, F. Automated MRI liver segmentation for anatomical segmentation, liver volumetry, and the extraction of radiomics. Eur. Radiol. 2024, 34, 5056–5065. [Google Scholar] [CrossRef]
- Sorace, A.G.; Elkassem, A.A.; Galgano, S.J.; Lapi, S.E.; Larimer, B.M.; Partridge, S.C.; Quarles, C.C.; Reeves, K.; Napier, T.S.; Song, P.N.; et al. Imaging for Response Assessment in Cancer Clinical Trials. Semin. Nucl. Med. 2020, 50, 488–504. [Google Scholar] [CrossRef] [PubMed]
- Frenette, A.; Morrell, J.; Bjella, K.; Fogarty, E.; Beal, J.; Chaudhary, V. Do diametric measurements provide sufficient and reliable tumor assessment? An evaluation of diametric, areametric, and volumetric variability of lung lesion measurements on computerized tomography scans. J. Oncol. 2015, 2015, 632943. [Google Scholar] [CrossRef]
- Schiavon, G.; Ruggiero, A.; Bekers, D.J.; Barry, P.A.; Sleijfer, S.; Kloth, J.; Krestin, G.P.; Schöffski, P.; Verweij, J.; Mathijssen, R.H. The effect of baseline morphology and its change during treatment on the accuracy of Response Evaluation Criteria in Solid Tumours in assessment of liver metastases. Eur. J. Cancer 2014, 50, 972–980. [Google Scholar] [CrossRef] [PubMed]
- Suzuki, C.; Torkzad, M.R.; Jacobsson, H.; Åström, G.; Sundin, A.; Hatschek, T.; Fujii, H.; Blomqvist, L. Interobserver and intraobserver variability in the response evaluation of cancer therapy according to RECIST and WHO-criteria. Acta Oncol. 2010, 49, 509–514. [Google Scholar] [CrossRef]
- Joskowicz, L.; Szeskin, A.; Rochman, S.; Dodi, A.; Lederman, R.; Fruchtman-Brot, H.; Azraq, Y.; Sosna, J. Follow-up of liver metastases: A comparison of deep learning and RECIST 1.1. Eur. Radiol. 2023, 33, 9320–9327. [Google Scholar] [CrossRef] [PubMed]
- Wesdorp, N.J.; Bolhuis, K.; Roor, J.; van Waesberghe, J.-H.T.; van Dieren, S.; van Amerongen, M.J.; Chapelle, T.; Dejong, C.H.; Engelbrecht, M.R.; Gerhards, M.F. The prognostic value of total tumor volume response compared with RECIST1. 1 in patients with initially unresectable colorectal liver metastases undergoing systemic treatment. Ann. Surg. Open 2021, 2, e103. [Google Scholar] [CrossRef] [PubMed]
- Fowler, K.J.; Bashir, M.R.; Fetzer, D.T.; Kitao, A.; Lee, J.M.; Jiang, H.; Kielar, A.Z.; Ronot, M.; Kamaya, A.; Marks, R.M. Universal liver imaging lexicon: Imaging atlas for research and clinical practice. Radiographics 2022, 43, e220066. [Google Scholar] [CrossRef]
- Frenette, C.; Mendiratta-Lala, M.; Salgia, R.; Wong, R.J.; Sauer, B.G.; Pillai, A. ACG clinical guideline: Focal liver lesions. Off. J. Am. Coll. Gastroenterol. ACG 2024, 119, 1235–1271. [Google Scholar] [CrossRef]
- Ye, Y.; Zhang, N.; Wu, D.; Huang, B.; Cai, X.; Ruan, X.; Chen, L.; Huang, K.; Li, Z.-P.; Wu, P.-M. Deep Learning Combined with Radiologist’s Intervention Achieves Accurate Segmentation of Hepatocellular Carcinoma in Dual-Phase Magnetic Resonance Images. BioMed Res. Int. 2024, 2024, 9267554. [Google Scholar] [CrossRef]
- Kim, D.W.; Lee, G.; Kim, S.Y.; Ahn, G.; Lee, J.-G.; Lee, S.S.; Kim, K.W.; Park, S.H.; Lee, Y.J.; Kim, N. Deep learning–based algorithm to detect primary hepatic malignancy in multiphase CT of patients at high risk for HCC. Eur. Radiol. 2021, 31, 7047–7057. [Google Scholar] [CrossRef] [PubMed]
- Geis, J.R.; Brady, A.P.; Wu, C.C.; Spencer, J.; Ranschaert, E.; Jaremko, J.L.; Langer, S.G.; Borondy Kitts, A.; Birch, J.; Shields, W.F.; et al. Ethics of Artificial Intelligence in Radiology: Summary of the Joint European and North American Multisociety Statement. Radiology 2019, 293, 436–440. [Google Scholar] [CrossRef] [PubMed]
- Hamilton, D.G.; Hong, K.; Fraser, H.; Rowhani-Farid, A.; Fidler, F.; Page, M.J. Prevalence and predictors of data and code sharing in the medical and health sciences: Systematic review with meta-analysis of individual participant data. BMJ 2023, 382, e075767. [Google Scholar] [CrossRef] [PubMed]
- Qin, W.; Wu, J.; Han, F.; Yuan, Y.; Zhao, W.; Ibragimov, B.; Gu, J.; Xing, L. Superpixel-based and boundary-sensitive convolutional neural network for automated liver segmentation. Phys. Med. Biol. 2018, 63, 095017. [Google Scholar] [CrossRef] [PubMed]
- Jin, Q.; Meng, Z.; Sun, C.; Cui, H.; Su, R. RA-UNet: A hybrid deep attention-aware network to extract liver and tumor in CT scans. Front. Bioeng. Biotechnol. 2020, 8, 605132. [Google Scholar] [CrossRef]
- Li, C.; Yao, G.; Xu, X.; Yang, L.; Zhang, Y.; Wu, T.; Sun, J. DCSegNet: Deep learning framework based on divide-and-conquer method for liver segmentation. IEEE Access 2020, 8, 146838–146846. [Google Scholar] [CrossRef]
- Kim, K.; Kim, S.; Han, K.; Bae, H.; Shin, J.; Lim, J.S. Diagnostic performance of deep learning-based lesion detection algorithm in CT for detecting hepatic metastasis from colorectal cancer. Korean J. Radiol. 2021, 22, 912. [Google Scholar] [CrossRef] [PubMed]
- Fehrenbach, U.; Xin, S.; Hartenstein, A.; Auer, T.A.; Dräger, F.; Froböse, K.; Jann, H.; Mogl, M.; Amthauer, H.; Geisel, D. Automatized hepatic tumor volume analysis of neuroendocrine liver metastases by gd-eob mri—A deep-learning model to support multidisciplinary cancer conference decision-making. Cancers 2021, 13, 2726. [Google Scholar] [CrossRef] [PubMed]
- Gross, M.; Spektor, M.; Jaffe, A.; Kucukkaya, A.S.; Iseke, S.; Haider, S.P.; Strazzabosco, M.; Chapiro, J.; Onofrey, J.A. Improved performance and consistency of deep learning 3D liver segmentation with heterogeneous cancer stages in magnetic resonance imaging. PLoS ONE 2021, 16, e0260630. [Google Scholar] [CrossRef]
- Wang, M.; Fu, F.; Zheng, B.; Bai, Y.; Wu, Q.; Wu, J.; Sun, L.; Liu, Q.; Liu, M.; Yang, Y. Development of an AI system for accurately diagnose hepatocellular carcinoma from computed tomography imaging data. Br. J. Cancer 2021, 125, 1111–1121. [Google Scholar] [CrossRef]
- Xue, Z.; Li, P.; Zhang, L.; Lu, X.; Zhu, G.; Shen, P.; Shah, S.A.A.; Bennamoun, M. Multi-modal co-learning for liver lesion segmentation on PET-CT images. IEEE Trans. Med. Imaging 2021, 40, 3531–3542. [Google Scholar] [CrossRef] [PubMed]
- Pang, S.; Du, A.; Orgun, M.A.; Wang, Y.; Yu, Z. Tumor attention networks: Better feature selection, better tumor segmentation. Neural Netw. 2021, 140, 203–222. [Google Scholar] [CrossRef] [PubMed]
- Han, L.; Chen, Y.; Li, J.; Zhong, B.; Lei, Y.; Sun, M. Liver segmentation with 2.5 D perpendicular UNets. Comput. Electr. Eng. 2021, 91, 107118. [Google Scholar] [CrossRef]
- Perez, A.A.; Noe-Kim, V.; Lubner, M.G.; Graffy, P.M.; Garrett, J.W.; Elton, D.C.; Summers, R.M.; Pickhardt, P.J. Deep learning CT-based quantitative visualization tool for liver volume estimation: Defining normal and hepatomegaly. Radiology 2022, 302, 336–342. [Google Scholar] [CrossRef]
- Senthilvelan, J.; Jamshidi, N. A pipeline for automated deep learning liver segmentation (PADLLS) from contrast enhanced CT exams. Sci. Rep. 2022, 12, 15794. [Google Scholar] [CrossRef]
- Barash, Y.; Klang, E.; Lux, A.; Konen, E.; Horesh, N.; Pery, R.; Zilka, N.; Eshkenazy, R.; Nachmany, I.; Pencovich, N. Artificial intelligence for identification of focal lesions in intraoperative liver ultrasonography. Langenbeck’s Arch. Surg. 2022, 407, 3553–3560. [Google Scholar] [CrossRef]
- Zhang, F.; Yan, S.; Zhao, Y.; Gao, Y.; Li, Z.; Lu, X. Iterative convolutional encoder-decoder network with multi-scale context learning for liver segmentation. Appl. Artif. Intell. 2022, 36, 2151186. [Google Scholar] [CrossRef]
- Wu, S.; Yu, H.; Li, C.; Zheng, R.; Xia, X.; Wang, C.; Wang, H. A Coarse-to-Fine Fusion Network for Small Liver Tumor Detection and Segmentation: A Real-World Study. Diagnostics 2023, 13, 2504. [Google Scholar] [CrossRef] [PubMed]
- Kazami, Y.; Kaneko, J.; Keshwani, D.; Kitamura, Y.; Takahashi, R.; Mihara, Y.; Ichida, A.; Kawaguchi, Y.; Akamatsu, N.; Hasegawa, K. Two-step artificial intelligence algorithm for liver segmentation automates anatomic virtual hepatectomy. J. Hepato-Biliary-Pancreat. Sci. 2023, 30, 1205–1217. [Google Scholar] [CrossRef] [PubMed]
- Özcan, F.; Uçan, O.N.; Karaçam, S.; Tunçman, D. Fully automatic liver and tumor segmentation from CT image using an AIM-Unet. Bioengineering 2023, 10, 215. [Google Scholar] [CrossRef]
- Fogarollo, S.; Bale, R.; Harders, M. Towards liver segmentation in the wild via contrastive distillation. Int. J. Comput. Assist. Radiol. Surg. 2023, 18, 1143–1149. [Google Scholar] [CrossRef]
- Gao, Z.; Zong, Q.; Wang, Y.; Yan, Y.; Wang, Y.; Zhu, N.; Zhang, J.; Wang, Y.; Zhao, L. Laplacian salience-gated feature pyramid network for accurate liver vessel segmentation. IEEE Trans. Med. Imaging 2023, 42, 3059–3068. [Google Scholar] [CrossRef] [PubMed]
- Wang, Q.; Chen, A.; Xue, Y. Liver CT Image Recognition Method Based on Capsule Network. Information 2023, 14, 183. [Google Scholar] [CrossRef]
- He, Q.; Duan, Y.; Yang, Z.; Wang, Y.; Yang, L.; Bai, L.; Zhao, L. Context-aware augmentation for liver lesion segmentation: Shape uniformity, expansion limit and fusion strategy. Quant. Imaging Med. Surg. 2023, 13, 5043. [Google Scholar] [CrossRef]
- Liu, H.; Yang, J.; Jiang, C.; He, S.; Fu, Y.; Zhang, S.; Hu, X.; Fang, J.; Ji, W. S2DA-Net: Spatial and spectral-learning double-branch aggregation network for liver tumor segmentation in CT images. Comput. Biol. Med. 2024, 174, 108400. [Google Scholar] [CrossRef] [PubMed]
- Shao, J.; Luan, S.; Ding, Y.; Xue, X.; Zhu, B.; Wei, W. Attention Connect Network for Liver Tumor Segmentation from CT and MRI Images. Technol. Cancer Res. Treat. 2024, 23, 15330338231219366. [Google Scholar] [CrossRef]
- Ou, J.; Jiang, L.; Bai, T.; Zhan, P.; Liu, R.; Xiao, H. ResTransUnet: An effective network combined with Transformer and U-Net for liver segmentation in CT scans. Comput. Biol. Med. 2024, 177, 108625. [Google Scholar] [CrossRef]
- Zhou, J.; Xia, Y.; Xun, X.; Yu, Z. Deep Learning-Based Detect-Then-Track Pipeline for Treatment Outcome Assessments in Immunotherapy-Treated Liver Cancer. J. Imaging Inform. Med. 2024, 1–14. [Google Scholar] [CrossRef] [PubMed]
- Yu, W.; Wang, M.; Zhang, Y.; Zhao, L. Reciprocal cross-modal guidance for liver lesion segmentation from multiple phases under incomplete overlap. Biomed. Signal Process. Control 2024, 88, 105561. [Google Scholar] [CrossRef]
- Patel, N.; Celaya, A.; Eltaher, M.; Glenn, R.; Savannah, K.B.; Brock, K.K.; Sanchez, J.I.; Calderone, T.L.; Cleere, D.; Elsaiey, A. Training robust T1-weighted magnetic resonance imaging liver segmentation models using ensembles of datasets with different contrast protocols and liver disease etiologies. Sci. Rep. 2024, 14, 20988. [Google Scholar] [CrossRef]
- Le, Q.A.; Pham, X.L.; van Walsum, T.; Dao, V.H.; Le, T.L.; Franklin, D.; Moelker, A.; Le, V.H.; Trung, N.L.; Luu, M.H. Precise ablation zone segmentation on CT images after liver cancer ablation using semi-automatic CNN-based segmentation. Med. Phys. 2024, 51, 8882–8899. [Google Scholar] [CrossRef] [PubMed]
- Chen, W.; Zhao, L.; Bian, R.; Li, Q.; Zhao, X.; Zhang, M. Compensation of small data with large filters for accurate liver vessel segmentation from contrast-enhanced CT images. BMC Med. Imaging 2024, 24, 129. [Google Scholar] [CrossRef]
- Quinton, F.; Presles, B.; Leclerc, S.; Nodari, G.; Lopez, O.; Chevallier, O.; Pellegrinelli, J.; Vrigneaud, J.-M.; Popoff, R.; Meriaudeau, F. Navigating the nuances: Comparative analysis and hyperparameter optimisation of neural architectures on contrast-enhanced MRI for liver and liver tumour segmentation. Sci. Rep. 2024, 14, 3522. [Google Scholar] [CrossRef] [PubMed]
- Cheng, D.; Zhou, Z.; Zhang, J. EG-UNETR: An edge-guided liver tumor segmentation network based on cross-level interactive transformer. Biomed. Signal Process. Control 2024, 97, 106739. [Google Scholar] [CrossRef]
- Zhou, G.-Q.; Zhao, F.; Yang, Q.-H.; Wang, K.-N.; Li, S.; Zhou, S.; Lu, J.; Chen, Y. Tagnet: A transformer-based axial guided network for bile duct segmentation. Biomed. Signal Process. Control 2023, 86, 105244. [Google Scholar] [CrossRef]
- Ma, J.; Zhang, Y.; Gu, S.; Zhu, C.; Ge, C.; Zhang, Y.; An, X.; Wang, C.; Wang, Q.; Liu, X. Abdomenct-1k: Is abdominal organ segmentation a solved problem? IEEE Trans. Pattern Anal. Mach. Intell. 2021, 44, 6695–6714. [Google Scholar] [CrossRef] [PubMed]
- ISICDM2024. Available online: https://www.imagecomputing.org/isicdm2024/index.html#/ (accessed on 4 February 2025).
- Landman, B.; Xu, Z.; Igelsias, J.; Styner, M.; Langerak, T.; Klein, A. Miccai multi-atlas labeling beyond the cranial vault–workshop and challenge. In Proceedings of the MICCAI Multi-Atlas Labeling Beyond Cranial Vault—Workshop Challenge, Munich, Germany; 2015; p. 12. [Google Scholar]
- Zxcv2022. CT Liver Liver Segmentation Dataset for Small Sample Examples. Available online: https://www.kaggle.com/datasets/zxcv2022/digital-medical-images-for--download-resource/data (accessed on 21 December 2024).
- Gibson, E.; Giganti, F.; Hu, Y.; Bonmati, E.; Bandula, S.; Gurusamy, K.; Davidson, B.; Pereira, S.P.; Clarkson, M.J.; Barratt, D.C. Automatic multi-organ segmentation on abdominal CT with dense V-networks. IEEE Trans. Med. Imaging 2018, 37, 1822–1834. [Google Scholar] [CrossRef]
- Langs, G.; Hanbury, A.; Menze, B.; Müller, H. VISCERAL: Towards large data in medical imaging—Challenges and directions. In Proceedings of the Medical Content-Based Retrieval for Clinical Decision Support: Third MICCAI International Workshop, MCBR-CDS 2012, Nice, France, 1 October 2012; pp. 92–98. [Google Scholar]

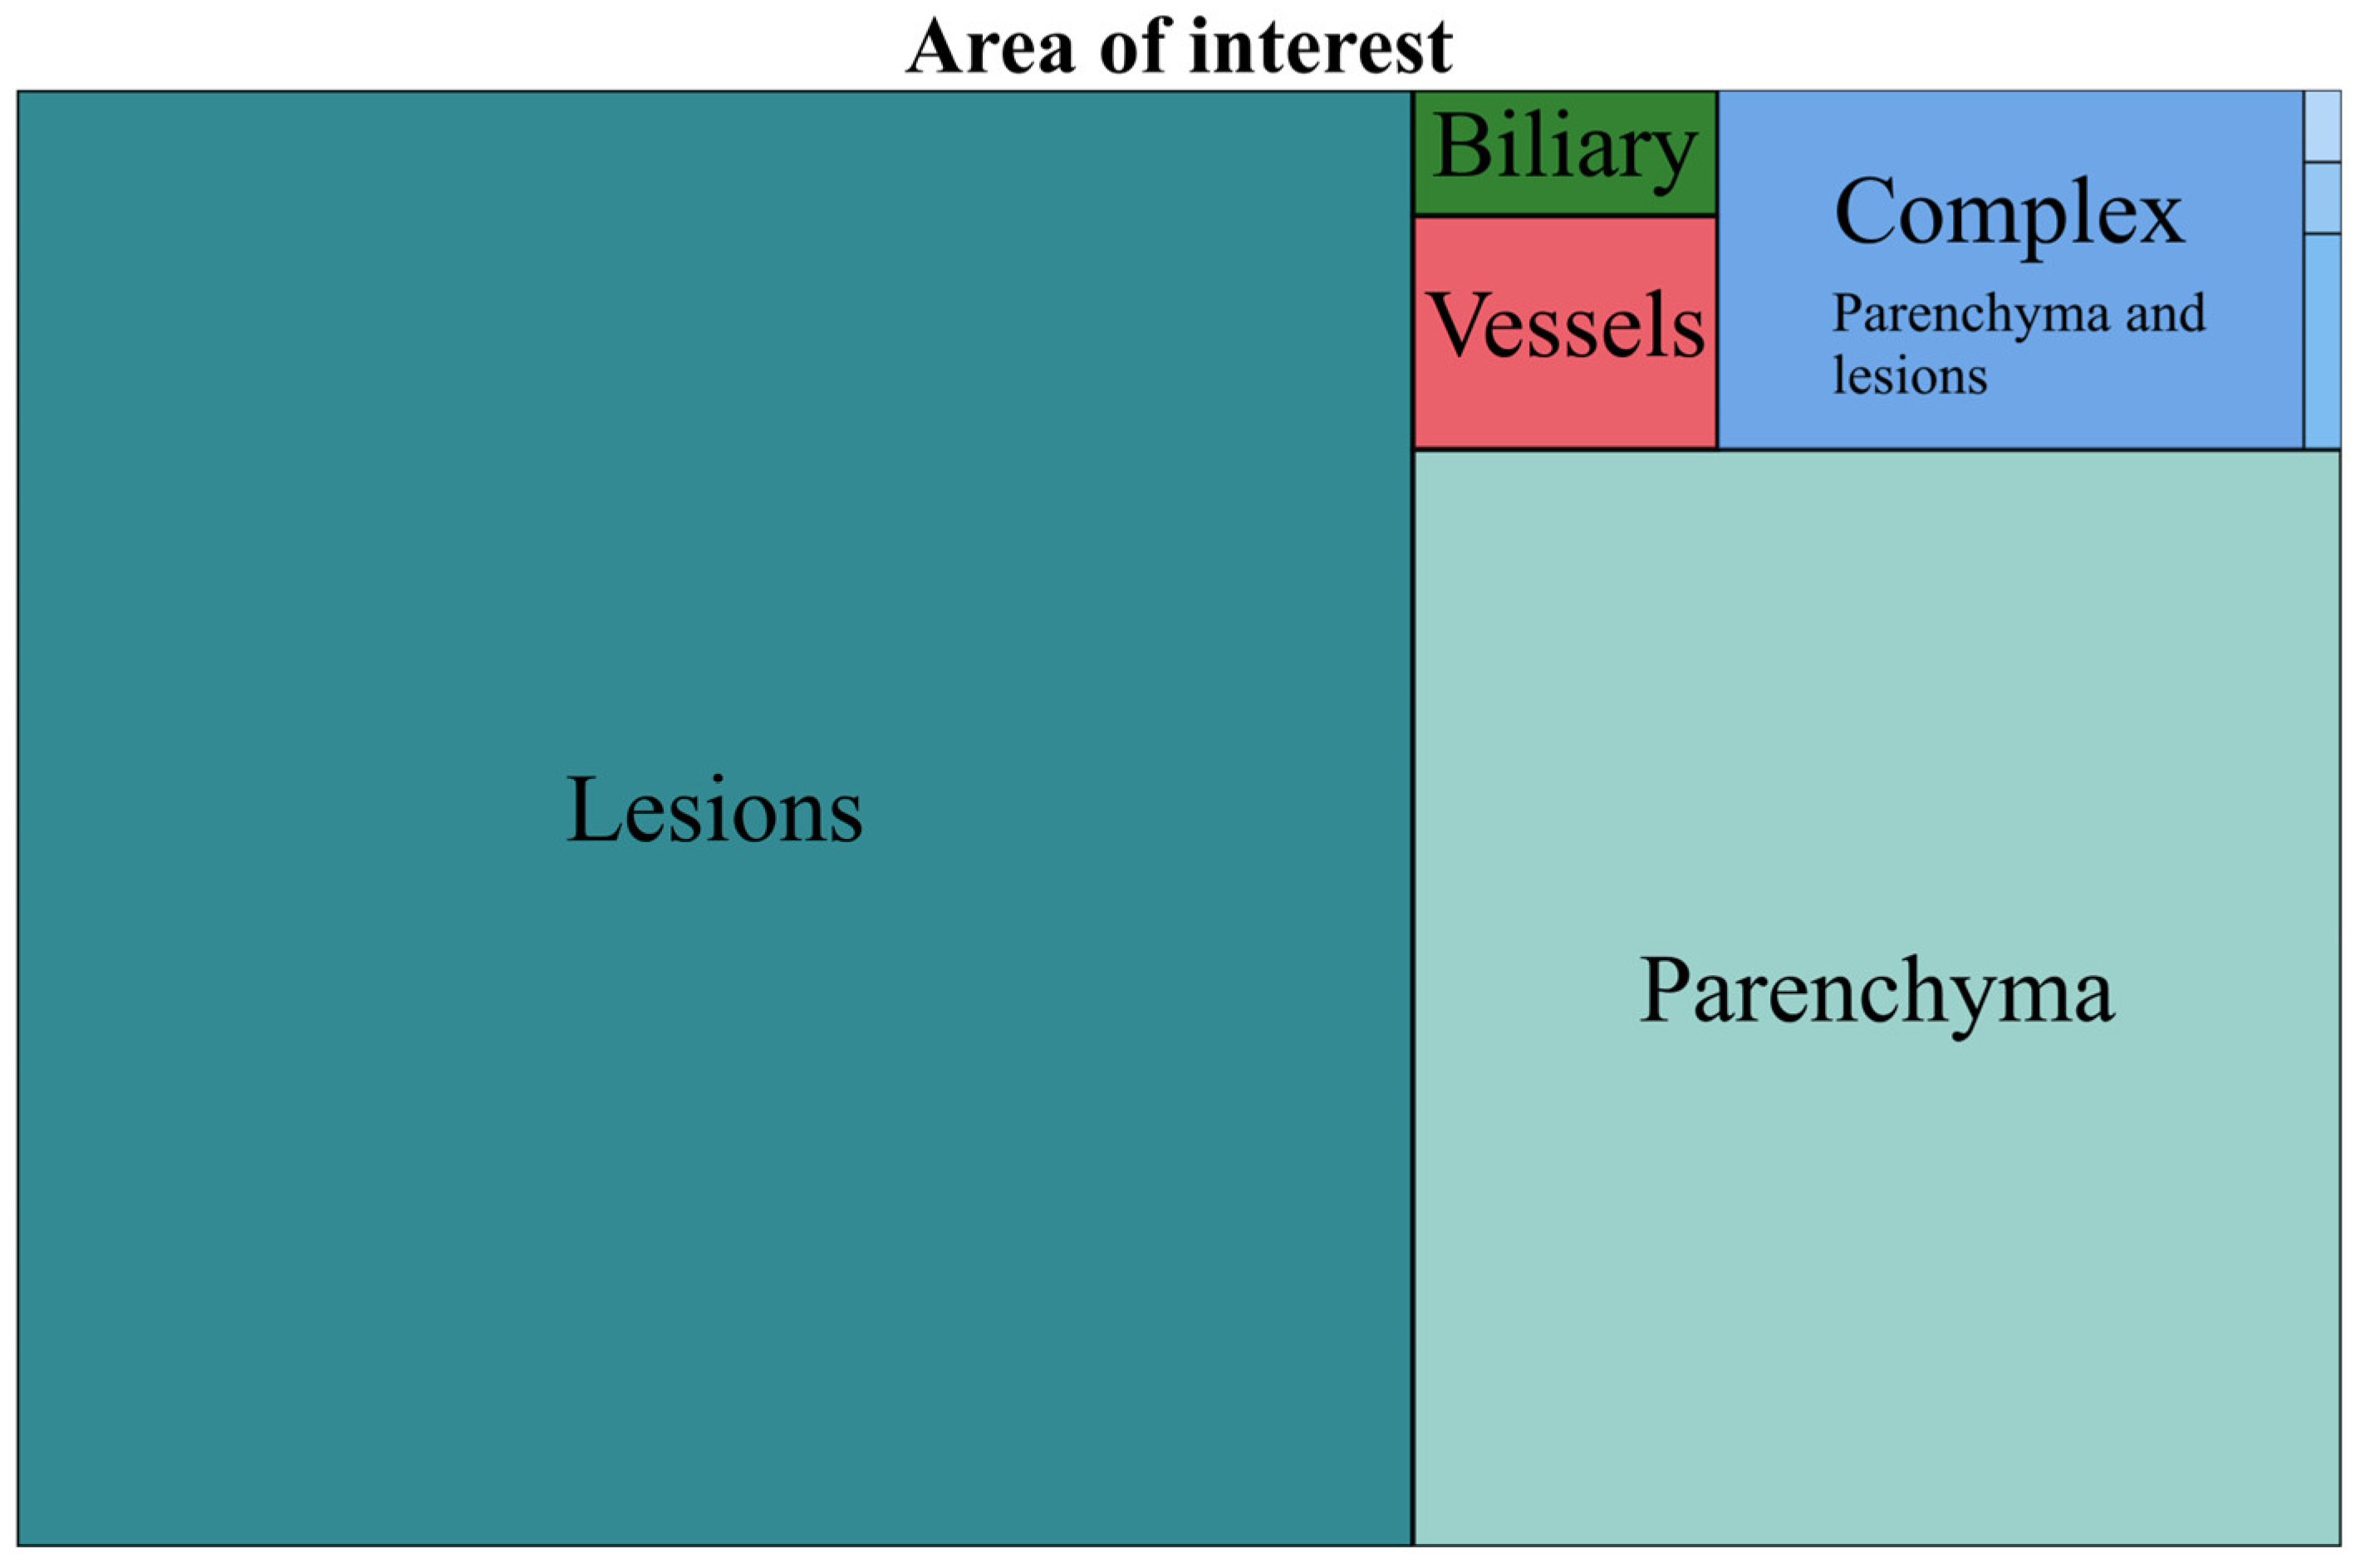


| AOI | No. | % of Total | Complex AOI | No. | % of Complex | % of Total |
|---|---|---|---|---|---|---|
| Lesions | 743 | 60.30 | Parenchyma and lesion | 72 | 93.50 | 5.84 |
| Parenchyma | 372 | 30.19 | Parenchyma and vessels | 3 | 3.89 | 0.24 |
| Complex | 77 | 6.25 | Lesions and vessels | 1 | 1.29 | 0.08 |
| Vessels | 26 | 2.11 | Parenchyma, lesion, vessels and biliary | 1 | 1.29 | 0.08 |
| Biliary | 14 | 1.13 |
| AOI | No. | % of Total | Multi-Modality | No. | % of Complex | % of Total |
|---|---|---|---|---|---|---|
| CT | 635 | 51.54 | CT and MRI | 36 | 87.80 | 2.92 |
| MRI | 335 | 27.19 | CT and US | 2 | 4.87 | 0.16 |
| US | 189 | 15.34 | CT and US and MRI | 2 | 4.87 | 0.16 |
| Multi-Modality | 41 | 3.32 | MRI and US | 1 | 2.43 | 0.08 |
| Nuclear Medicine | 21 | 1.70 | ||||
| X-Ray | 5 | 0.40 |
| AI Task | No. | % of Total | AI Multi-Task | No. | % of Complex | % of Total |
|---|---|---|---|---|---|---|
| Classification | 723 | 58.68 | Detection and/or segmentation and classification | 61 | 93.84 | 4.95 |
| Detection and/or segmentation | 329 | 26.70 | Detection and classification | 3 | 4.61 | 0.24 |
| Image optimization | 115 | 9.33 | Detection, segmentation and classification | 1 | 1.53 | 0.08 |
| Multi-task | 65 | 5.27 |
| Segmentation and/or Detection AOI | No. | % of Complex | % of Total | Detection and/or Segmentation Complex AOI | No. | % of Complex | % of Total |
|---|---|---|---|---|---|---|---|
| Lesions | 128 | 38.90 | 10.38 | Parenchyma and lesions | 66 | 92.95 | 5.35 |
| Parenchyma | 104 | 31.61 | 8.44 | Parenchyma and vessels | 3 | 4.22 | 0.24 |
| Complex | 71 | 21.58 | 5.76 | Parenchyma, lesions, vessels and biliary | 1 | 1.40 | 0.08 |
| Vessels | 25 | 7.59 | 2.02 | Lesions and vessels | 1 | 1.40 | 0.08 |
| Biliary | 1 | 0.30 | 0.08 |
Disclaimer/Publisher’s Note: The statements, opinions and data contained in all publications are solely those of the individual author(s) and contributor(s) and not of MDPI and/or the editor(s). MDPI and/or the editor(s) disclaim responsibility for any injury to people or property resulting from any ideas, methods, instructions or products referred to in the content. |
© 2025 by the authors. Licensee MDPI, Basel, Switzerland. This article is an open access article distributed under the terms and conditions of the Creative Commons Attribution (CC BY) license (https://creativecommons.org/licenses/by/4.0/).
Share and Cite
Pomohaci, M.D.; Grasu, M.C.; Băicoianu-Nițescu, A.-Ş.; Enache, R.M.; Lupescu, I.G. Systematic Review: AI Applications in Liver Imaging with a Focus on Segmentation and Detection. Life 2025, 15, 258. https://doi.org/10.3390/life15020258
Pomohaci MD, Grasu MC, Băicoianu-Nițescu A-Ş, Enache RM, Lupescu IG. Systematic Review: AI Applications in Liver Imaging with a Focus on Segmentation and Detection. Life. 2025; 15(2):258. https://doi.org/10.3390/life15020258
Chicago/Turabian StylePomohaci, Mihai Dan, Mugur Cristian Grasu, Alexandru-Ştefan Băicoianu-Nițescu, Robert Mihai Enache, and Ioana Gabriela Lupescu. 2025. "Systematic Review: AI Applications in Liver Imaging with a Focus on Segmentation and Detection" Life 15, no. 2: 258. https://doi.org/10.3390/life15020258
APA StylePomohaci, M. D., Grasu, M. C., Băicoianu-Nițescu, A.-Ş., Enache, R. M., & Lupescu, I. G. (2025). Systematic Review: AI Applications in Liver Imaging with a Focus on Segmentation and Detection. Life, 15(2), 258. https://doi.org/10.3390/life15020258