

Divergent Patterns of Metabolite Expression in Red Seaweeds (Devaleraea mollis and Palmaria hecatensis) Following Nitrate and Ammonium Supplementation

 , , , and
Abstract
1. Introduction
2. Materials and Methods
2.1. Sample Collection and Acclimation
2.2. Experimental Treatments
2.3. Metabolomics
2.4. Data Analysis
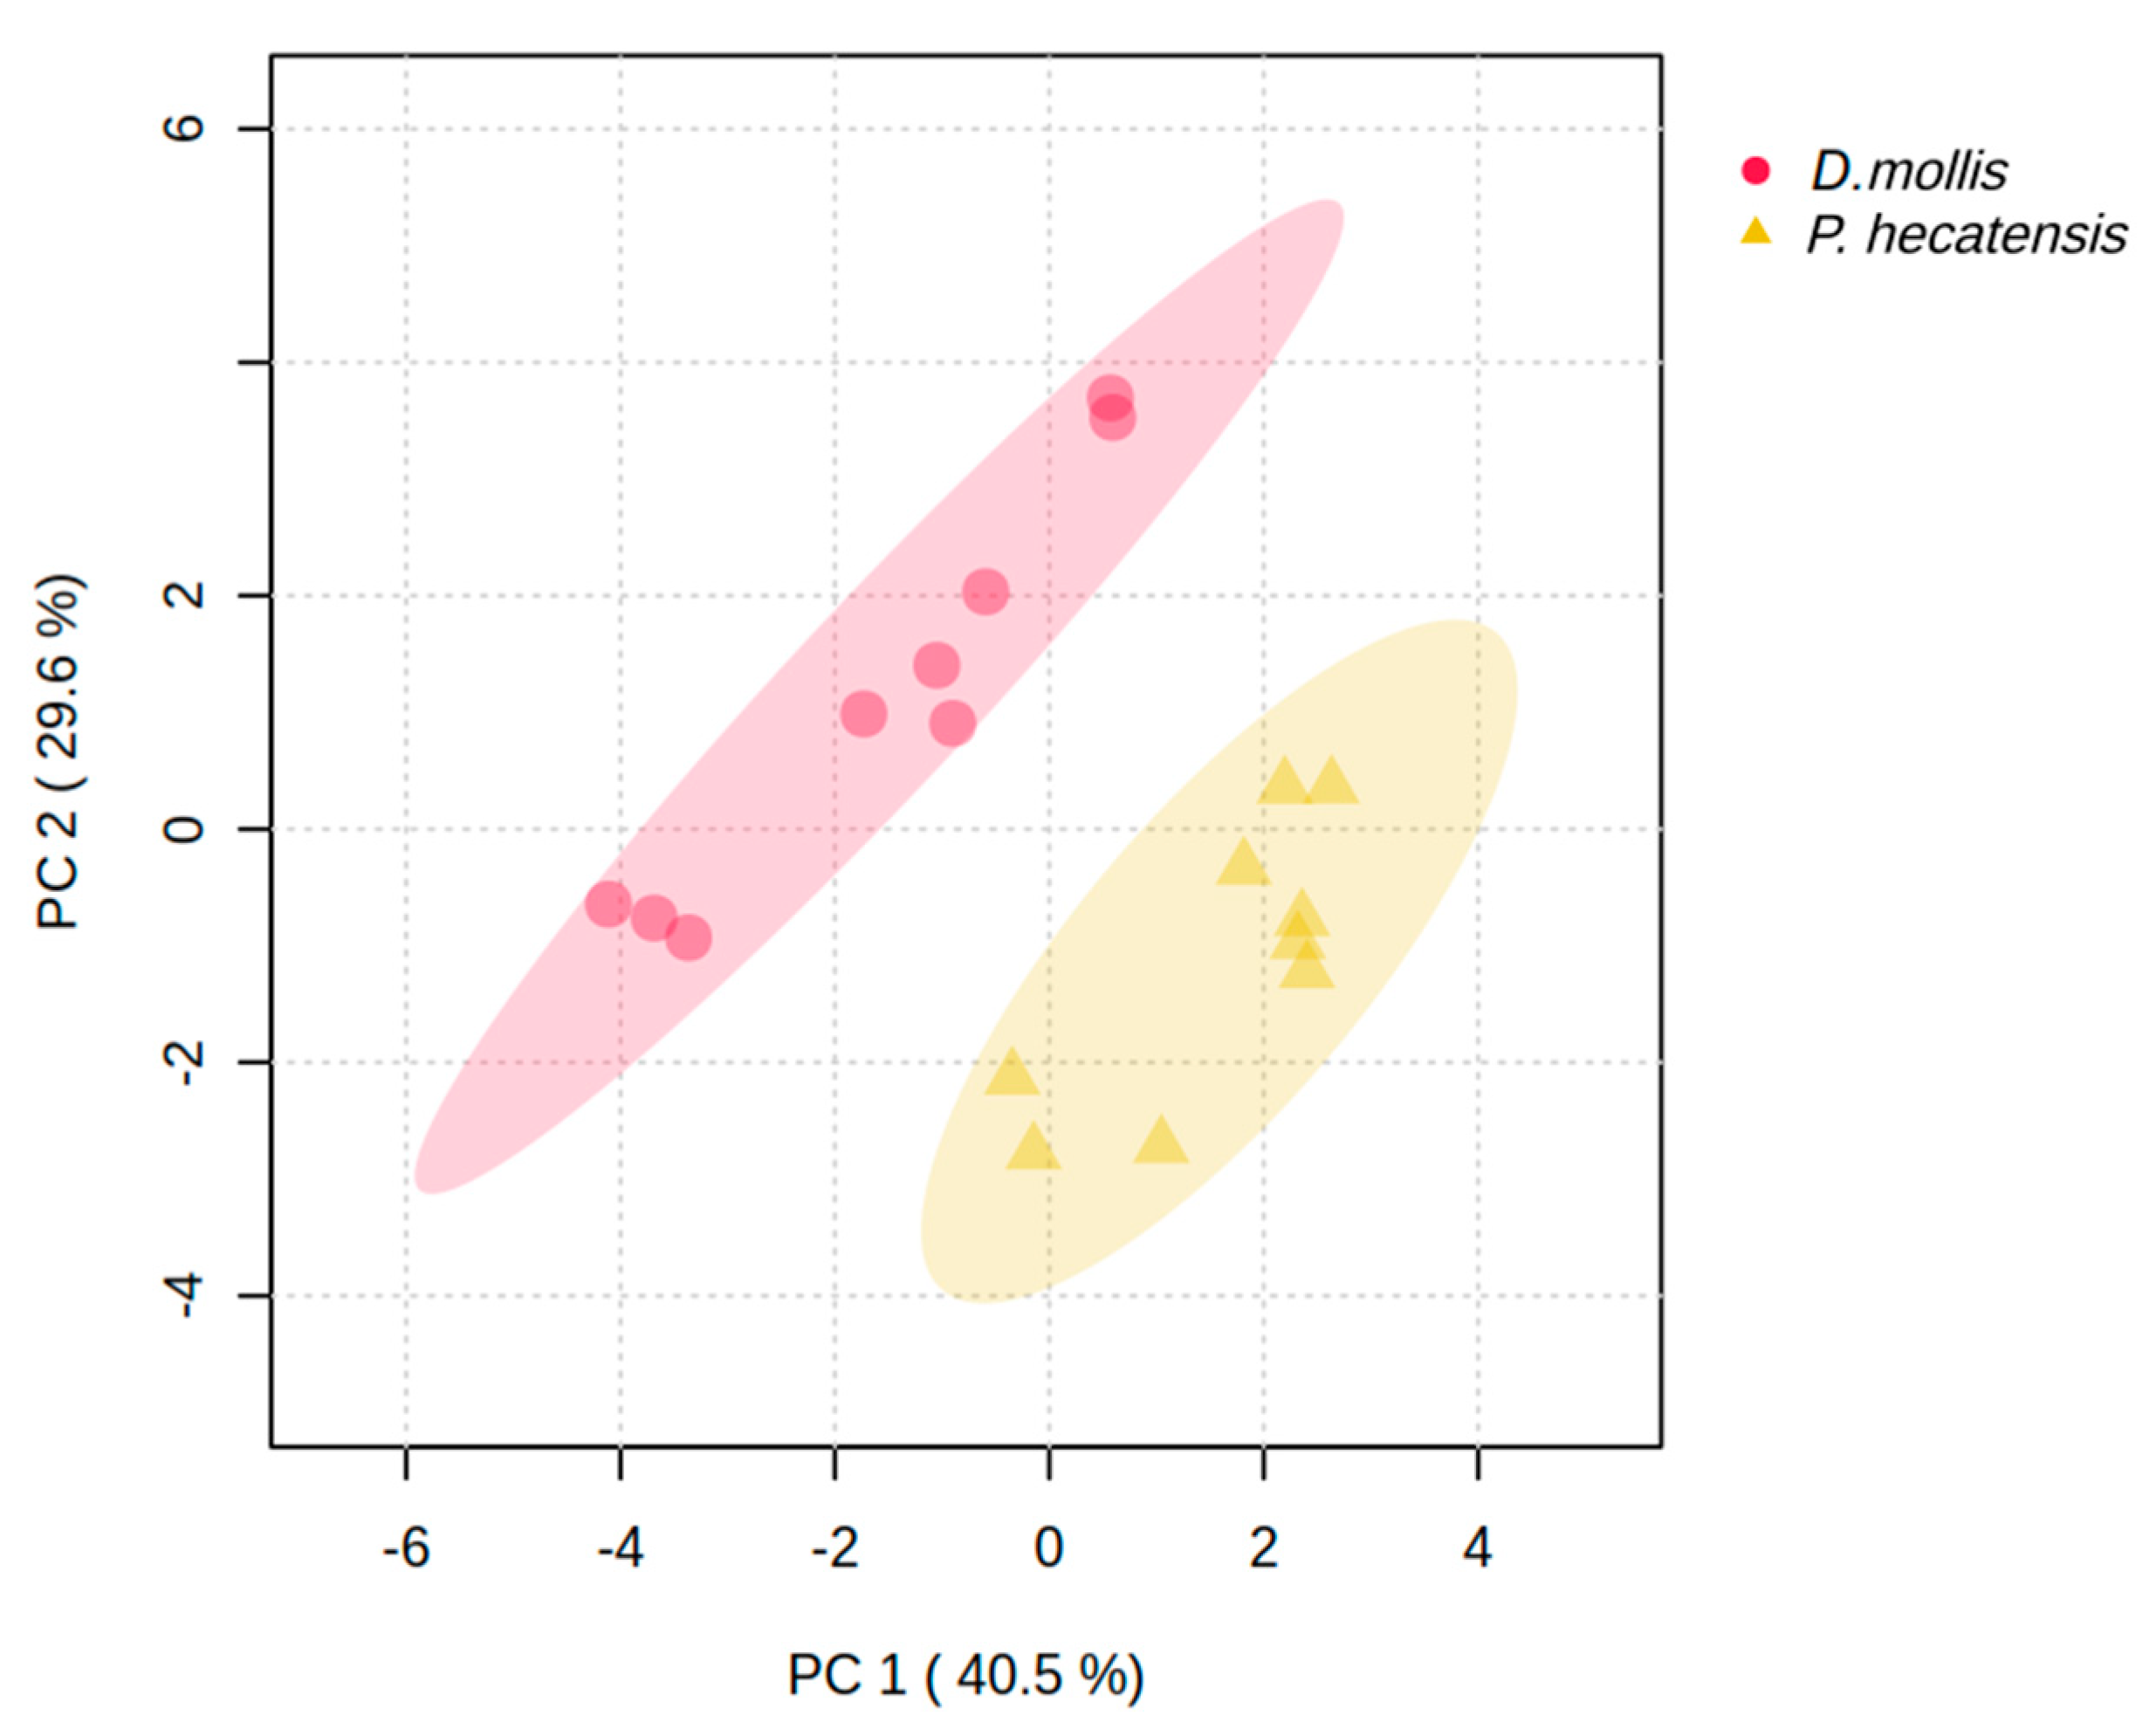
3. Results
4. Discussion
5. Conclusions
Supplementary Materials
Author Contributions
Funding
Institutional Review Board Statement
Informed Consent Statement
Data Availability Statement
Acknowledgments
Conflicts of Interest
References
- Buschmann, A.H.; Camus, C.; Infante, J.; Neori, A.; Israel, Á.; Hernández-González, M.C.; Critchley, A.T. Seaweed production: Overview of the global state of exploitation, farming and emerging research activity. Eur. J. Phycol. 2017, 52, 391–406. [Google Scholar] [CrossRef]
- Kotowicz, D.M.; Concepcion, A.; Bradt, G.; Chadsey, M.; Clemetson, A.; Good, M.; Reitsma, J.; Robidoux, J. Identifying challenges of the US domestic seaweed aquaculture industry. Aquaculture 2024, 593, 741314. [Google Scholar] [CrossRef]
- Bindu, M.S.; Levine, I.A. The commercial red seaweed Kappaphycus alvarezii—An overview on farming and environment. J. Appl. Phycol. 2010, 23, 789–796. [Google Scholar] [CrossRef]
- Loureiro, R.; Gachon, C.M.; Rebours, C. Seaweed cultivation: Potential and challenges of crop domestication at an unprecedented pace. New Phytol. 2015, 206, 489–492. [Google Scholar] [CrossRef] [PubMed]
- Tullberg, R.M.; Nguyen, H.P.; Wang, C.M. Review of the status and developments in seaweed farming infrastructure. J. Mar. Sci. Eng. 2022, 10, 1447. [Google Scholar] [CrossRef]
- Demetropoulos, C.L.; Langdon, C.J. Enhanced production of Pacific dulse (Palmaria mollis) for co-culture with abalone in a land-based system: Effects of stocking density, light, salinity, and temperature. Aquaculture 2004, 235, 471–488. [Google Scholar] [CrossRef]
- Saunders, G.W.; Jackson, C.; Salomaki, E.D. Phylogenetic analyses of transcriptome data resolve familial assignments for genera of the red-algal Acrochaetiales-Palmariales Complex (Nemaliophycidae). Mol. Phylogenet. Evol. 2018, 119, 151–159. [Google Scholar] [CrossRef]
- Dittrich, M.C.; Meyer, L.; Kelley, A.; Stekoll, M.S.S.; Umanzor, S. Cultivation protocols for the rhodophytes, Devaleraea mollis and Palmaria hecatensis from Alaska. BioRxiv 2024. [Google Scholar] [CrossRef]
- Lindeberg, M.; Lindstrom, S.C. A Field Guide to Seaweeds of Alaska; Alaska Sea Grant Program: Juneau, AK, USA, 2010; 179p, Available online: https://www.seaweedsofalaska.com/default.asp (accessed on 1 November 2024).
- Jung, J.W.; Dittrich, M.C.; Kim, J.K.; Umanzor, S. Exploring nutrient supplements for enhanced growth and quality of Devaleraea mollis and Palmaria hecatensis. J. Appl. Phycol. 2024. submitted. [Google Scholar]
- Hawkes, M.W. Palmaria hecatensis sp. nov. (Rhodophyta, Palmariales) from British Columbia and Alaska with a survey of other Palmaria species. Can. J. Bot. 1985, 63, 474–482. [Google Scholar] [CrossRef]
- Shah, N.J.; Sureshkumar, S.; Shewade, D.G. Metabolomics: A tool ahead for understanding molecular mechanisms of drugs and diseases. Indian J. Clin. Biochem. 2015, 30, 247–254. [Google Scholar] [CrossRef] [PubMed]
- Roleda, M.Y.; Hurd, C.L. Seaweed nutrient physiology: Application of concepts to aquaculture and bioremediation. Phycologia 2019, 58, 552–562. [Google Scholar] [CrossRef]
- Robertson-Andersson, D.V.; McKenzie, L.J. The effect of different nitrogen sources on the growth and biochemical composition of Gracilaria tenuistipitata. Aquat. Bot. 2008, 88, 41–47. [Google Scholar] [CrossRef]
- Wang, Q.; Lan, L.; Li, H.; Gong, Q.; Gao, X. Effects of nitrogen source and concentration on the growth and biochemical composition of the red seaweed Grateloupia turuturu (Halymeniaceae, Rhodophyta). Sustainability 2023, 15, 4210. [Google Scholar] [CrossRef]
- Dawes, C.J.; Koch, E.W. Physiological responses of the red algae Gracilaria verrucosa and G. tikvahiae before and after nutrient enrichment. Bull. Mar. Sci. 1990, 46, 335–344. [Google Scholar]
- Morgan, K.C.; Wright, J.L.C.; Simpson, F.J. Review of chemical constituents of the red alga Palmaria palmata (dulse). Econ. Bot. 1980, 34, 27–50. [Google Scholar] [CrossRef]
- Mouritsen, O.G.; Dawczynski, C.; Duelund, L.; Jensen, H.M.; Sommer, H.M.; Olsen, K. On the human consumption of the red seaweed dulse (Palmaria palmata (L.) Weber & Mohr). J. Appl. Phycol. 2013, 25, 1777–1791. [Google Scholar] [CrossRef]
- Lalegerie, F.; Stiger-Pouvreau, V.; Connan, S. Mycosporine-like Amino Acids in Palmaria palmata (Rhodophyta): Specific Implication of Usujirene in Photoprotection. Mar. Drugs 2024, 22, 121. [Google Scholar] [CrossRef]
- Kim, J.K.; Yarish, C. Development of a sustainable land-based seaweed aquaculture system suitable for the Northeast US. Bull. Korean Fish. Soc. 2004, 37, 529–540. [Google Scholar]
- Friedlander, M.; Dawes, C.J. In situ uptake kinetics of ammonium and phosphate and chemical composition of the red seaweed Gracilaria tikvahiae. J. Phycol. 1985, 21, 448–453. [Google Scholar] [CrossRef]
- Idowu, A.T.; Amigo-Benavent, M.; Santos-Hernández, M.; Tiwari, B.; Hayes, M. Impact of growth conditions on the nitrogen, protein, colour, and amino acid profiles of the cultured macroalga, Palmaria palmata. J. Appl. Phycol. 2023, 35, 2397–2411. [Google Scholar] [CrossRef]
- Rosen, G.; Langdon, C.J.; Evans, F. The nutritional value of Palmaria mollis cultured under different light intensities and water exchange rates for juvenile red abalone Haliotis rufescens. Aquaculture 2000, 185, 121–136. [Google Scholar] [CrossRef]
- Skriptsova, A.V.; Shibneva, S.; Semenchenko, A.A. Morphological and molecular investigations shed light on diversity and distribution of Palmariaceae in the north-western Pacific. Eur. J. Phycol. 2023, 58, 438–456. [Google Scholar] [CrossRef]
- Redmond, S.; Green, L.; Yarish, C.; Kim, J.K.; Neefus, C. New England Seaweed Culture Handbook: Nursery Systems; Sea Grant: Groton, CT, USA, 2014; Available online: https://digitalcommons.lib.uconn.edu/seagrant_weedcult/1/ (accessed on 1 November 2024).
- Werner, A.; Dring, M.J. Cultivation of Palmaria palmata (dulse). In Seaweed Biology; Wiencke, B., Bischof, K., Eds.; Springer: Berlin/Heidelberg, Germany, 2011; pp. 347–366. [Google Scholar] [CrossRef]
- Guillard, R.R.L. Culture of phytoplankton for feeding marine invertebrates. In Culture of Marine Invertebrate Animals; Smith, W.L., Chanley, M.H., Eds.; Springer: New York, NY, USA, 1975; pp. 29–60. [Google Scholar] [CrossRef]
- Schymanski, E.L.; Jeon, J.; Gulde, R.; Fenner, K.; Ruff, M.; Singer, H.P.; Hollender, J. Identifying small molecules via high resolution mass spectrometry: Communicating confidence. Environ. Sci. Technol. 2014, 48, 2097–2098. [Google Scholar] [CrossRef]
- Hurd, C.; Harrison, P.; Bischof, K.; Lobban, C. Seaweed Ecology and Physiology; Cambridge University Press: Cambridge, UK, 2014. [Google Scholar] [CrossRef]
- Lobban, C.S.; Harrison, P.J. Seaweed Ecology and Physiology; Cambridge University Press: Cambridge, UK, 1994. [Google Scholar]
- Xu, G.; Fan, X.; Miller, A.J. Plant Nitrogen Assimilation and Use Efficiency. Front. Plant Sci. 2012, 3, 183. [Google Scholar] [CrossRef]
- Stévant, P.; Rebours, C.; Chapman, A. Seaweed aquaculture in Norway: Recent industrial developments and future perspectives. Aquac. Int. 2017, 25, 1373–1390. [Google Scholar] [CrossRef]
- Harrison, P.J.; Druehl, L.D.; Lloyd, K.E.; Thompson, P.A. Nitrogen uptake kinetics in three species of laminarian kelp as a function of dissolved nitrogen concentration. Mar. Biol. 1986, 91, 237–249. [Google Scholar]
- Bidwell, R.G.S.; McLachlan, J. Carbon nutrition of seaweeds: Photosynthesis and growth. J. Exp. Mar. Biol. Ecol. 1985, 86, 129–137. [Google Scholar] [CrossRef]
- Thomas, T.E.; Turpin, D.H. Desiccation-enhanced nutrient uptake rates in the intertidal alga Fucus distichus. Bot. Mar. 1980, 23, 479–481. [Google Scholar] [CrossRef]
- Davison, I.R.; Pearson, G.A. Stress tolerance in intertidal seaweeds. J. Phycol. 1996, 32, 197–211. [Google Scholar] [CrossRef]
- Falkowski, P.G.; Raven, J.A. Aquatic Photosynthesis; Princeton University Press: Princeton, NJ, USA, 2007. [Google Scholar]
- Levitt, J. Responses of Plants to Environmental Stresses: Water, Radiation, Salt, and Other Stresses; Academic Press: New York, NY, USA, 1980. [Google Scholar]
- Buchanan, B.B.; Gruissem, W.; Jones, R.L. Biochemistry & Molecular Biology of Plants, 2nd ed.; Wiley Blackwell: Hoboken, NJ, USA, 2015. [Google Scholar]


| Functional Grouping | Metabolite | Devaleraea mollis | Palmaria hecatensis |
|---|---|---|---|
| Energy metabolism | Creatine | ↑ | ↓ |
| Guanidinoacetate | ↑ | ↓ | |
| Pantothenate | ↑ | ↓ | |
| Amino acid metabolism | Arginine | ↓ | ↑ |
| and protein synthesis | Glutamine | ↓ | ↑ |
| N-Acetylleucine | ↓ | ↑ | |
| Tryptophan | ↓ | ↑ | |
| Nucleotide and | Dihydrouracil | ↑ | ↓ |
| DNA/RNA metabolism | Thymidine | ↑ | ↓ |
| Uracil | ↑ | ↓ | |
| Uridine | ↑ | ↓ | |
| Cell growth | 4-Guanidinobutanoate | ↑ | ↓ |
| N-Acetylputrescine | ↑ | ↓ | |
| Secondary metabolites | 2,6-Dihydroxypyridine | ↑ | ↓ |
| 3-(2-Hydroxyphenyl)propanoate | ↑ | ↓ | |
| 4-Amino-4-Hydroxybenzoate | ↑ | ↓ | |
| Lumichrome | ↑ | ↓ | |
| Shikimate | ↑ | ↓ | |
| Quinate | ↑ | ↓ | |
| Signaling molecules | 3-Methoxytyramine | ↓ | ↑ |
| 4-Hydroxy-3-Methoxyphenylglycol | ↑ | ↓ |
| Functional Grouping | D. mollis Metabolite | VSE | F/2 | JS |
|---|---|---|---|---|
| Energy metabolism | Creatine | 2F/2,JS | 3VSE,JS | 1VSE,F/2 |
| Alpha-Hydroxyisobutyrate | 1F/2,JS | 2VSE | 3VSE | |
| Glycerol | 1F/2,JS | 2VSE | 3VSE | |
| Amino acid metabolism | Citrulline | 3JS | 2 | 1VSE |
| and protein synthesis | Glutamine | 3JS | 2 | 1VSE |
| N-Acetylleucine | 3F/S,JS | 2VSE | 1VSE | |
| Ornithine | 3F/2,JS | 2VSE,JS | 1VSE,F/2 | |
| Serine | 3F/2,JS | 2VSE | 1VSE | |
| Nucleotide and | Cytidine | 3F/2,JS | 2VSE,JS | 1VSE,F/2 |
| DNA/RNA metabolism | Guanine | 3F/2,JS | 2VSE | 1VSE |
| Hypoxanthine | 3F/2,JS | 2VSE | 1VSE | |
| Thymidine | 3F/2,JS | 2VSE,JS | 1VSE,F/2 | |
| Cell growth | 4-Guanidinobutanoate | 3F/2,JS | 2VSE,JS | 1VSE,F/2 |
| Ornithine | 3F/2,JS | 2VSE,JS | 1VSE,F/2 | |
| Secondary metabolites | 2,6-Dihydroxypyridine | 1F/2,JS | 3VSE | 2VSE |
| Trigonelline | 2F/2 | 1VSE,JS | 3F/2 |
| Functional Grouping | P. hecatensis Metabolite | VSE | F/2 | JS |
|---|---|---|---|---|
| Energy metabolism | Alpha-Hydroxyisobutyrate | 1F/2,JS | 2VSE,JS | 3VSE,F/2 |
| Glycerol | 1F/2,JS | 2VSE | 3VSE | |
| Succinate | 1F/2,JS | 2VSE | 3VSE | |
| Amino acid metabolism | 1-Aminocyclopropanecarboxylate | 1F/2,JS | 2VSE | 3VSE |
| and protein synthesis | Citrulline | 2JS | 3JS | 1VSE,F/2 |
| Glutamine | 3F/2,JS | 2VSE,JS | 1VSE,F/2 | |
| Histidinol | 3F/2,JS | 2VSE | 1VSE | |
| Isoleucine | 2JS | 3JS | 1VSE,F/2 | |
| Leucine | 2F/2,JS | 3VSE,JS | 1VSE,F/2 | |
| N-Acetylleucine | 3F/2,JS | 1VSE | 2VSE | |
| N-Acetylproline | 3JS | 2JS | 1VSE,F/2 | |
| N-Acetylserine | 1F/2,JS | 2VSE,JS | 3VSE,F/2 | |
| Ornithine | 2JS | 3JS | 1VSE,F/2 | |
| Proline | 2F/2 | 1VSE,JS | 3F/2 | |
| Nucleotide and | Cytidine | 3JS | 2 | 1VSE |
| DNA/RNA metabolism | Dihydrouracil | 2F/2 | 3VSE,JS | 1F/2 |
| Uridine | 2JS | 3JS | 1VSE,F/2 | |
| Cell growth | N-Acetylputrescine | 3F/2,JS | 2VSE,JS | 1VSE,F/2 |
| Ornithine | 2JS | 3JS | 1VSE,F/2 | |
| Secondary metabolites | 3-Methoxytyramine | 1F/2,JS | 2VSE,JS | 3VSE,F/2 |
| Porphobilinogen | 3F/2,JS | 2VSE,JS | 1VSE,F/2 | |
| Riboflavin | 3JS | 2JS | 1VSE,F/2 | |
| Signaling molecules | 3-Methoxytyramine | 1F/2,JS | 2VSE,JS | 3VSE,F/2 |
| Nicotinamide | 1JS | 2JS | 3VSE,F/2 | |
| Carbohydrate metabolism | 2-Acetamido-2-Deoxy-Beta-D- Glucosamine | 3JS | 2JS | 1VSE,F/2 |
Disclaimer/Publisher’s Note: The statements, opinions and data contained in all publications are solely those of the individual author(s) and contributor(s) and not of MDPI and/or the editor(s). MDPI and/or the editor(s) disclaim responsibility for any injury to people or property resulting from any ideas, methods, instructions or products referred to in the content. |
© 2025 by the authors. Licensee MDPI, Basel, Switzerland. This article is an open access article distributed under the terms and conditions of the Creative Commons Attribution (CC BY) license (https://creativecommons.org/licenses/by/4.0/).
Share and Cite
Umanzor, S.; Jung, J.W.; Dittrich, M.; Kim, J.K.; Tomco, P.; Redman, Z.C.; Brandhuber, M. Divergent Patterns of Metabolite Expression in Red Seaweeds (Devaleraea mollis and Palmaria hecatensis) Following Nitrate and Ammonium Supplementation. Life 2025, 15, 143. https://doi.org/10.3390/life15020143
Umanzor S, Jung JW, Dittrich M, Kim JK, Tomco P, Redman ZC, Brandhuber M. Divergent Patterns of Metabolite Expression in Red Seaweeds (Devaleraea mollis and Palmaria hecatensis) Following Nitrate and Ammonium Supplementation. Life. 2025; 15(2):143. https://doi.org/10.3390/life15020143
Chicago/Turabian StyleUmanzor, Schery, Jae Woo Jung, Muriel Dittrich, Jang K. Kim, Patrick Tomco, Zachary C. Redman, and Monica Brandhuber. 2025. "Divergent Patterns of Metabolite Expression in Red Seaweeds (Devaleraea mollis and Palmaria hecatensis) Following Nitrate and Ammonium Supplementation" Life 15, no. 2: 143. https://doi.org/10.3390/life15020143
APA StyleUmanzor, S., Jung, J. W., Dittrich, M., Kim, J. K., Tomco, P., Redman, Z. C., & Brandhuber, M. (2025). Divergent Patterns of Metabolite Expression in Red Seaweeds (Devaleraea mollis and Palmaria hecatensis) Following Nitrate and Ammonium Supplementation. Life, 15(2), 143. https://doi.org/10.3390/life15020143