Article

Monitoring the Effectiveness of Emergent Detached Offshore Structures in Mangrove Vegetation Increase: Lessons and Recommendations

by
Nguyen Tan Phong
1,*,
Nguyen Bao Thuan
1 and
Nguyen Ngoc Tien
2
1
Faculty of Environment and Labour Safety, Ton Duc Thang University, Ho Chi Minh City, Vietnam
2
Institute of Marine Geology and Geophysics, Vietnam Academy of Science and Technology, Hanoi, Vietnam
*
Author to whom correspondence should be addressed.
Life 2025, 15(2), 136; https://doi.org/10.3390/life15020136
Submission received: 1 December 2024 / Revised: 13 January 2025 / Accepted: 17 January 2025 / Published: 21 January 2025

Abstract

:
Although successful in protecting planted mangrove plants, the effectiveness of emergent detached offshore structures in increasing vegetation cover has yet to be definitively determined. We selected Tien Giang Province, Vietnam as an appropriate case study to address this question. We analyzed multiyear (2000 and 2022) shoreline changes and calculated the enhanced vegetation index (EVI) together with ground truthing in pursuit of the objectives of the study. Our findings suggest that emergent detached offshore structures have yet to lead to an increase in vegetation cover or promote mangrove growth. The vegetation growth steadily increased, as did the high level of natural mangrove growth with fully grown mangrove trees, even before the structures were constructed. By 2015, all the categories increased slightly except for low vegetation cover (LVC) and medium vegetation cover (MVC). LVC decreased from 390 ha in 2010 to 291 ha in 2015, while MVC decreased from 305 ha in 2010 to 275 ha in 2015. By 2020, all the categories decreased slightly except for non-vegetation cover—Barren lands (NVC2) and MVC. NVC2 decreased slightly from 404 ha in 2015 to 368 ha in 2015. The MVC decreased slightly from 275 ha in 2015 to 212 ha in 2020. Non-vegetation cover—Intertidal mudflats (NVC1)—LVC, and high vegetation cover (HVC) increased slightly from 2015 (326 ha, 291 ha, and 249 ha, respectively) to 2020 (368 ha, 292 ha, and 298 ha, respectively). By 2022, NVC2, MVC, and HVC remained unchanged, while NVC1 and LVC increased slightly from 368 ha and 292 ha in 2015, respectively, to 380 ha and 302 ha, respectively. The increase in vegetation cover and the natural regeneration of mangrove species were partly due to the adaptation of mangrove species to the site (river mouth areas), particularly the protection provided by Ngang Island offshore, and the construction of these structures. In addition, these structures were constructed in a rather stable area (slightly eroded and estuarine area) and therefore have yet to provide any noticeable benefits for mangrove regeneration three to five years after their construction. In the future, the morpho dynamic and hydrodynamic elements of the site should be adequately considered during the design and construction of these structures to increase vegetation cover and promote natural mangrove regeneration.

1. Introduction

Offshore breakwaters are structures constructed parallel to the shore in more exposed settings or deeper water areas at a certain distance from the shoreline. These structures are constructed primarily to dissipate the energy of incident waves [1]. Offshore breakwaters can be emergent detached structures [1] or low-crested/submerged structures [2]. Emergent detached structures are normally constructed with gaps among structures to facilitate water exchange and sediment transport. Low-crest or submergent structures are constructed in a long continuous form without gaps, to reduce the intensity of wave action and promote water circulation. To date, emergent detached offshore structures have been constructed to protect sandy beaches from wave-induced erosion at various locations around the world; for example, in Italy [3,4], the Mediterranean basin [5], and the UK [6]. To date, a numerical test suggested that the emergent breakwaters constructed in Italy and European Union countries should be replaced by submerged breakwaters to avoid the increment of wave transmission, to complete full dissipation of the wave energy, and to reach transmission coefficient [1]. A practical lesson in Italy showed that the conversion of offshore breakwaters into continuous submerged breakwaters provided better views of the sea and a more equitable beach width along the shore, allowing natural processes to reshape the beach [7]. Gaps between these structures and the shoreline, wave angle, and wave height are crucial in determining sediment accumulation ratios [8].
Similar structures have increasingly been used to respond to the erosion of mangrove forests in some areas of Southeast Asia. While these structures were constructed in combination with mangrove planting in Malaysia [9,10,11], mangrove planting was not undertaken with these offshore structures in Vietnam [12,13]. To date, these offshore concrete breakwaters have been successful in dissipating the energy of incident waves and protecting planted mangrove seedlings but accumulated less fine-grained sediment in Malaysia [10,11]. Submerged offshore structures, although costly, have been effective at protecting planted mangroves in some areas of Southeast Asia; for example, Indonesia [14] and Vietnam [15]. Against this background, it remains unclear whether offshore breakwaters are able to facilitate mangrove growth. This knowledge is crucial, particularly because offshore structures have been promoted as effective solutions to the problem of coastal erosion and for improved adaptation to the adverse effects of future climate change.
The Vietnamese Mekong Delta (VMD) has been severely eroded, with approximately 45% of the VMD coast being severely eroded and a maximum erosion rate of 45 m per year [16]. As the VMD plays a crucial role in Vietnam’s social–economic development, the Vietnamese government has made significant efforts to control coastal erosion in this region [17]. In 2013, Ca Mau province (one of the VMD provinces) was the first one in the region to have invested in constructing offshore breakwaters for constructing its coast [15]. This construction was based on the belief that strong incident waves were a driving force that had eroded muddy coasts [18]. In 2021, these offshore breakwaters were successful in dissipating the energy of strong incident waves and protecting stands of mangrove trees [15]. Given the success case of the Ca Mau offshore breakwaters [15], and that fact that other coastal protection measures such as the planting of mangrove seedlings and sea dykes have had limited success in protecting these coasts [18], multiple concrete (shoreline and offshore) structures have been strongly recommended to protect this coast in order to maximize the effectiveness of these offshore structures in protecting eroding coasts [19]. In 2019, Tien Giang province was the second one of the VMD to construct emergent detached offshore structures, called hollow triangular offshore breakwaters (HTBs), along the coast of the Tan Phu Dong district, Tien Giang Province, Vietnam [12,13]. By 2023, the coast of Tan Phu Dong District experienced an increase in vegetation cover and the significant natural regeneration of mangrove species (Sonneratia, Avicennia and Bruguiera sp.). It was reported that Tien Giang HTBs facilitated mangrove restoration and increased vegetation cover in the shoreside area of the Tan Phu Dong district, Tien Giang Province, Vietnam [12,13]. In 2021, the Tien Giang Provincial level People’s Committee (Tien Giang PPC) replicated this structural design in other areas along the Tan Thanh and Tan Dien coasts of Tien Giang province (a total of 3 km of HTBs), with funding from the local and central governments. Other provinces have expressed their interest in replicating similar structures to protect their eroding coasts. Governments at all levels also considered the Tien Giang HTBs as a success case in the region. However, little information is available on why and how vegetation cover has increased in the area.
Therefore, Tien Giang HTBs were selected as an appropriate case study to partially address the question raised in the literature and the reality. This study aimed to investigate the relationship between Tien Giang HTBs and vegetation cover increase. Our primary objectives were to investigate (1) how vegetation cover increased behind and around HTBs, and (2) whether the location of Tien Giang HTBs contributed to the increase in vegetation cover. The first objective was achieved by calculating the enhanced vegetation index (EVI) of the entire coast of the Tan Phu Dong district of Tien Giang Province, including the vegetation behind Tien Giang HTBs and field observations. The second one was obtained from the analysis of shoreline change using digital shoreline change analysis (DSAS)—version 5.0. DSAS is an extension of ArcGIS 10.8. software.

2. Materials and Methods

2.1. Site Description

Go Cong is located in the Tan Phu Dong district, Tien Giang, Vietnam. Hydrologically, the study site is strongly influenced by the southwest and northeast monsoon regimes. The southwest regime starts from May to October (the rainy season) while the northeast monsoon regime runs from November to March (the dry season). Tien Giang is substantially influenced by the East Sea tidal regime, which features semidiurnal tides and diurnal inequality. The tidal range varies between +1.8 and +2.2 m [20]. Located in the estuarine area of the Dai River, the site is dominated by mangrove species common in estuarine areas of rivers and tidal riverbanks, including Sonneratia alba, Sonneratia caseolaris, Avicennia marina, and Bruguiera cylindrica (Figure 1).
By 2019, HTBs were designed and constructed by the Southern Institute of Water Resources. HTBs have a dense porosity designed to maximize wave transmission, reflection, and dissipation. HTBs were numerically tested using glass wave flumes equipped with a pointed-trapezoidal cross-section and with two sides containing circular holes in four rows of variable diameter to represent different scenarios [12]. Unlike other impermeable structures, HTBs were designed with circular holes to reduce reflected waves and ensure the exchange of water, sediment, and water quality [12]. Wave gauges were installed in front of and behind the structures that were placed in the flumes to measure wave transmission and incident and to reflect wave parameters separately [12]. Numerical modeling revealed that HTBs were effective at dissipating incident wave energy [12]. HTBs were subsequently constructed to protect a tourist site in Go Cong, Tan Phu Dong District, Tien Giang Province in 2019 (Tien Giang HTBs) [12] for a total length of 1.6 km. The design and construction of the study were funded by the Vietnamese National Research Program. Tien Giang HTBs had been constructed for three years at the site (Figure 1D,E). The construction aimed to dissipate the energy of strong incoming waves, accumulate fine-grained sediment, and promote mangrove growth. Therefore, mangrove plants or propagules were not planted behind Tien Giang HTBs.

2.2. Methods

This study involved two phases, including EVI calculation and DSAS. The EVI calculation was undertaken in this study because the use of the Normalized Difference Vegetation Index (NDVI) is strongly affected by the brightness of the ground [21] and the saturation in high biomass areas [22]. The EVI calculation only aimed to record vegetation cover for the purpose of the study, not to identify mangrove species.
To calculate EVI values, the authors retrieved five satellite images between 2000 and 2022 from the United States Geological Survey (https://glovis.usgs.gov/) (accessed on 18 December 2023). The authors selected 2000 as the starting year for the analysis because erosion along the Tien Giang coast was first identified at this time. The 2022 satellite image was selected to update the status of vegetation cover and the HTBs. The authors used two rules for selecting satellite images: (1) the images that covered the study area were selected and (2) the images with an average cloud cover lower than 20% were selected. Each image was clipped to ensure that only the study area’s pixels were retained (Table 1).
The authors strictly followed the previous recommendation on defining the land–water boundary (yearly shoreline) [23,24,25,26] to avoid possible errors when calculating vegetation cover. This is particularly true for areas which are likely subject to inundation due to seasonal tidal regimes and for satellite images retrieved on different dates.
Yearly shorelines were established using three steps: (1) calculation of the modified normalized difference water index (mNDWI), (2) calculation of the water frequency index (WFI), and (3) establishment of yearly land–water shapefiles.
The mNDWI was calculated using the following Formula (1):
m N D W I = G r e e n M I R G r e e n + M I R
where
Green = Green band
MIR = Mid-infrared radiation
The mNDWI value ranges between −1 and 1, where positive values represent pixels with water.
The WFI was calculated using the following Formula (2):
W F I = N w a t e r N w a t e r + N l a n d  
where
Nwater and Nland denote the number of pixels that were observed as water and land within 1 year, respectively.
WFI pixel values greater than or equal to 0.5 (equivalent to a frequency of 50%) were reclassified as representative of the annual water/surface area.
Satellite images from different dates (2000, 2005, 2010, 2015, 2020, and 2022) were digitalized to extract multiple date satellites as vector ‘shapefiles’ using ArcGIS 10.6 software. These ‘shapefile’ sectors were overlaid to detect changes in the shoreline and the vegetation cover between 2000 and 2022.
The EVI formula is as follows (3):
E V I = 2.5 × N I R R N I R + ( 2.4 × R ) + 1.0
where
IR is the near-infrared band (Band 5—Landsat 8; Band 4—Landsat 7)
R is the red band (Band 4—Landsat 8; Band 3—Landsat 7)
We classified Go Cong, Tien Giang Province, Vietnam into two classes: vegetated areas (mangrove forests) and non-vegetated areas (intertidal mudflats, barren lands, and aquaculture ponds). In addition, overall accuracy (OA) and Kappa coefficient (KC) were used to evaluate the accuracy of the extraction results.
The OA formula is as follows (4):
O A = T P + T N T × 100 %
where
TP (True Positive) and TN (True Negative) represent, respectively, water and non-water pixels/points that match with the reference sites
The KC formula is as follows (5):
K C = T S × T C S Ʃ ( C o l u m n   T o t a l × R o w   T o t a l ) T S 2 Ʃ ( C o l u m n   T o t a l R o w   T o t a l )
where
TS = Total sample
TCS = Total corrected sample
The evaluation showed that the OA was 92% and the KC was 0.90, indicating that the proposed methods used in this study agreed with the previous recommendations that the maximum OA value is up to 100% and the maximum KC value is up to 1, as recommended previously [27,28].
The authors used the DSAS method for identifying shoreline change in Tien Giang Province, as previously recommended [23,25,29,30,31,32]. To commence the DSAS, a baseline was established as a curved line located 300 m landward over 12 km, stretching from the north to the south of Tien Giang. A total of 1310 transects were established perpendicularly to the baseline along the Tan Phu Dong District, with a 10 m spacing to ensure that each transect intercepted the shoreline only once to ensure exact calculation. Ngang Island was estimated automatically by the function in ArcGIS.
During the use of DSAS, the shoreline change envelope (SCE), net shoreline movement (NSM), linear regression rate of change (LRR), and end point rate (EPR) were used to determine the changes in the Tien Giang shoreline during the above periods.
The EPR equation is as follows (6):
Sr = (f0 − fy)/n,
where
-
Sr is the per year rate of shoreline change (m/year);
-
f0 is the distance between the baseline and shoreline at the oldest date of a particular transect (m);
-
fy is the distance between the baseline and shoreline on the most recent date on the same transect (m);
-
n is the total number of years from the oldest date to the most recent date.
The equation for LRR is below (7).
L = at + b.
where
-
L represents the distance of the shore position from the baseline (m);
-
t is the shoreline date interval (years);
-
a is the slope of the fitted line (m/year) (i.e., the shoreline change rate—LRR);
-
b is the y-intercept.
Both the LRR and EPR were used in this study because they provide small differences in the computed results. The SCE was estimated as the distance between the shoreline position and the baseline at each transect according to the latest (2022) and earliest (2000) sets of images, as pointed out previously [25,29,30,31,32]. Excellent correlations were obtained between the two statistical methods, with a high R2 value of 0.980 for Tan Phu Dong, indicating that the shoreline change rates in the Tan Phu Dong District were consistent with those of the previous two methods (Figure 2).
The SCE equation is below (8).
Sd = df − dc,
where
-
Sd is the shoreline change distance (m);
-
df is the distance between the baseline and farthest shoreline (m) at a particular transect;
-
dc is the distance between the baseline and closest shoreline (m) along the same transect.
The NSM equation is as below (9).
Snm = f0 − fy
where
-
Snm is net the movement of the shoreline (m);
-
f0 is the distance between the baseline and shoreline (m) on the oldest date of a particular transect;
-
fy is the distance between the baseline and shoreline (m) on the youngest date of the same transect.
The second component of the study, conducted between May 2020 and May 2024, involved five field visits/ground truthing to the site and its shoreline. The ground truthing involved the collection of GPS data of Tien Giang HTBs and the selection of six random sites along the Tan Phu Dong coast (four sites within the HTBs and two outside Tien Giang HTBs) for monitoring in May 2020 (see Figure 1 for further information of the random sites and Tien Giang HTBs) (Figure 1 and Table 2).
The 2000–2022 vegetation cover data were subsequently classified into non-vegetation cover (intertidal mudflats and barren lands) and vegetation cover (low vegetation cover, medium vegetation cover, and high vegetation cover) (Table 3).
The monitoring started in May 2020 and was undertaken every six months. Three elements selected as the criteria for monitoring were fine-grained sediment, coarse-grained sediment, and mangrove growth. The selection of these criteria was based on the pursuit of the objectives of the study. The monitoring aimed to describe the status of the random sites and take photographs of non-vegetated and vegetated areas in order to determine topographic reference points, main geographical features, vegetation patterns, and recent occurrences (natural regeneration of mangrove species) for the EVI analysis, not to quantify these criteria at each monitoring site.

3. Results

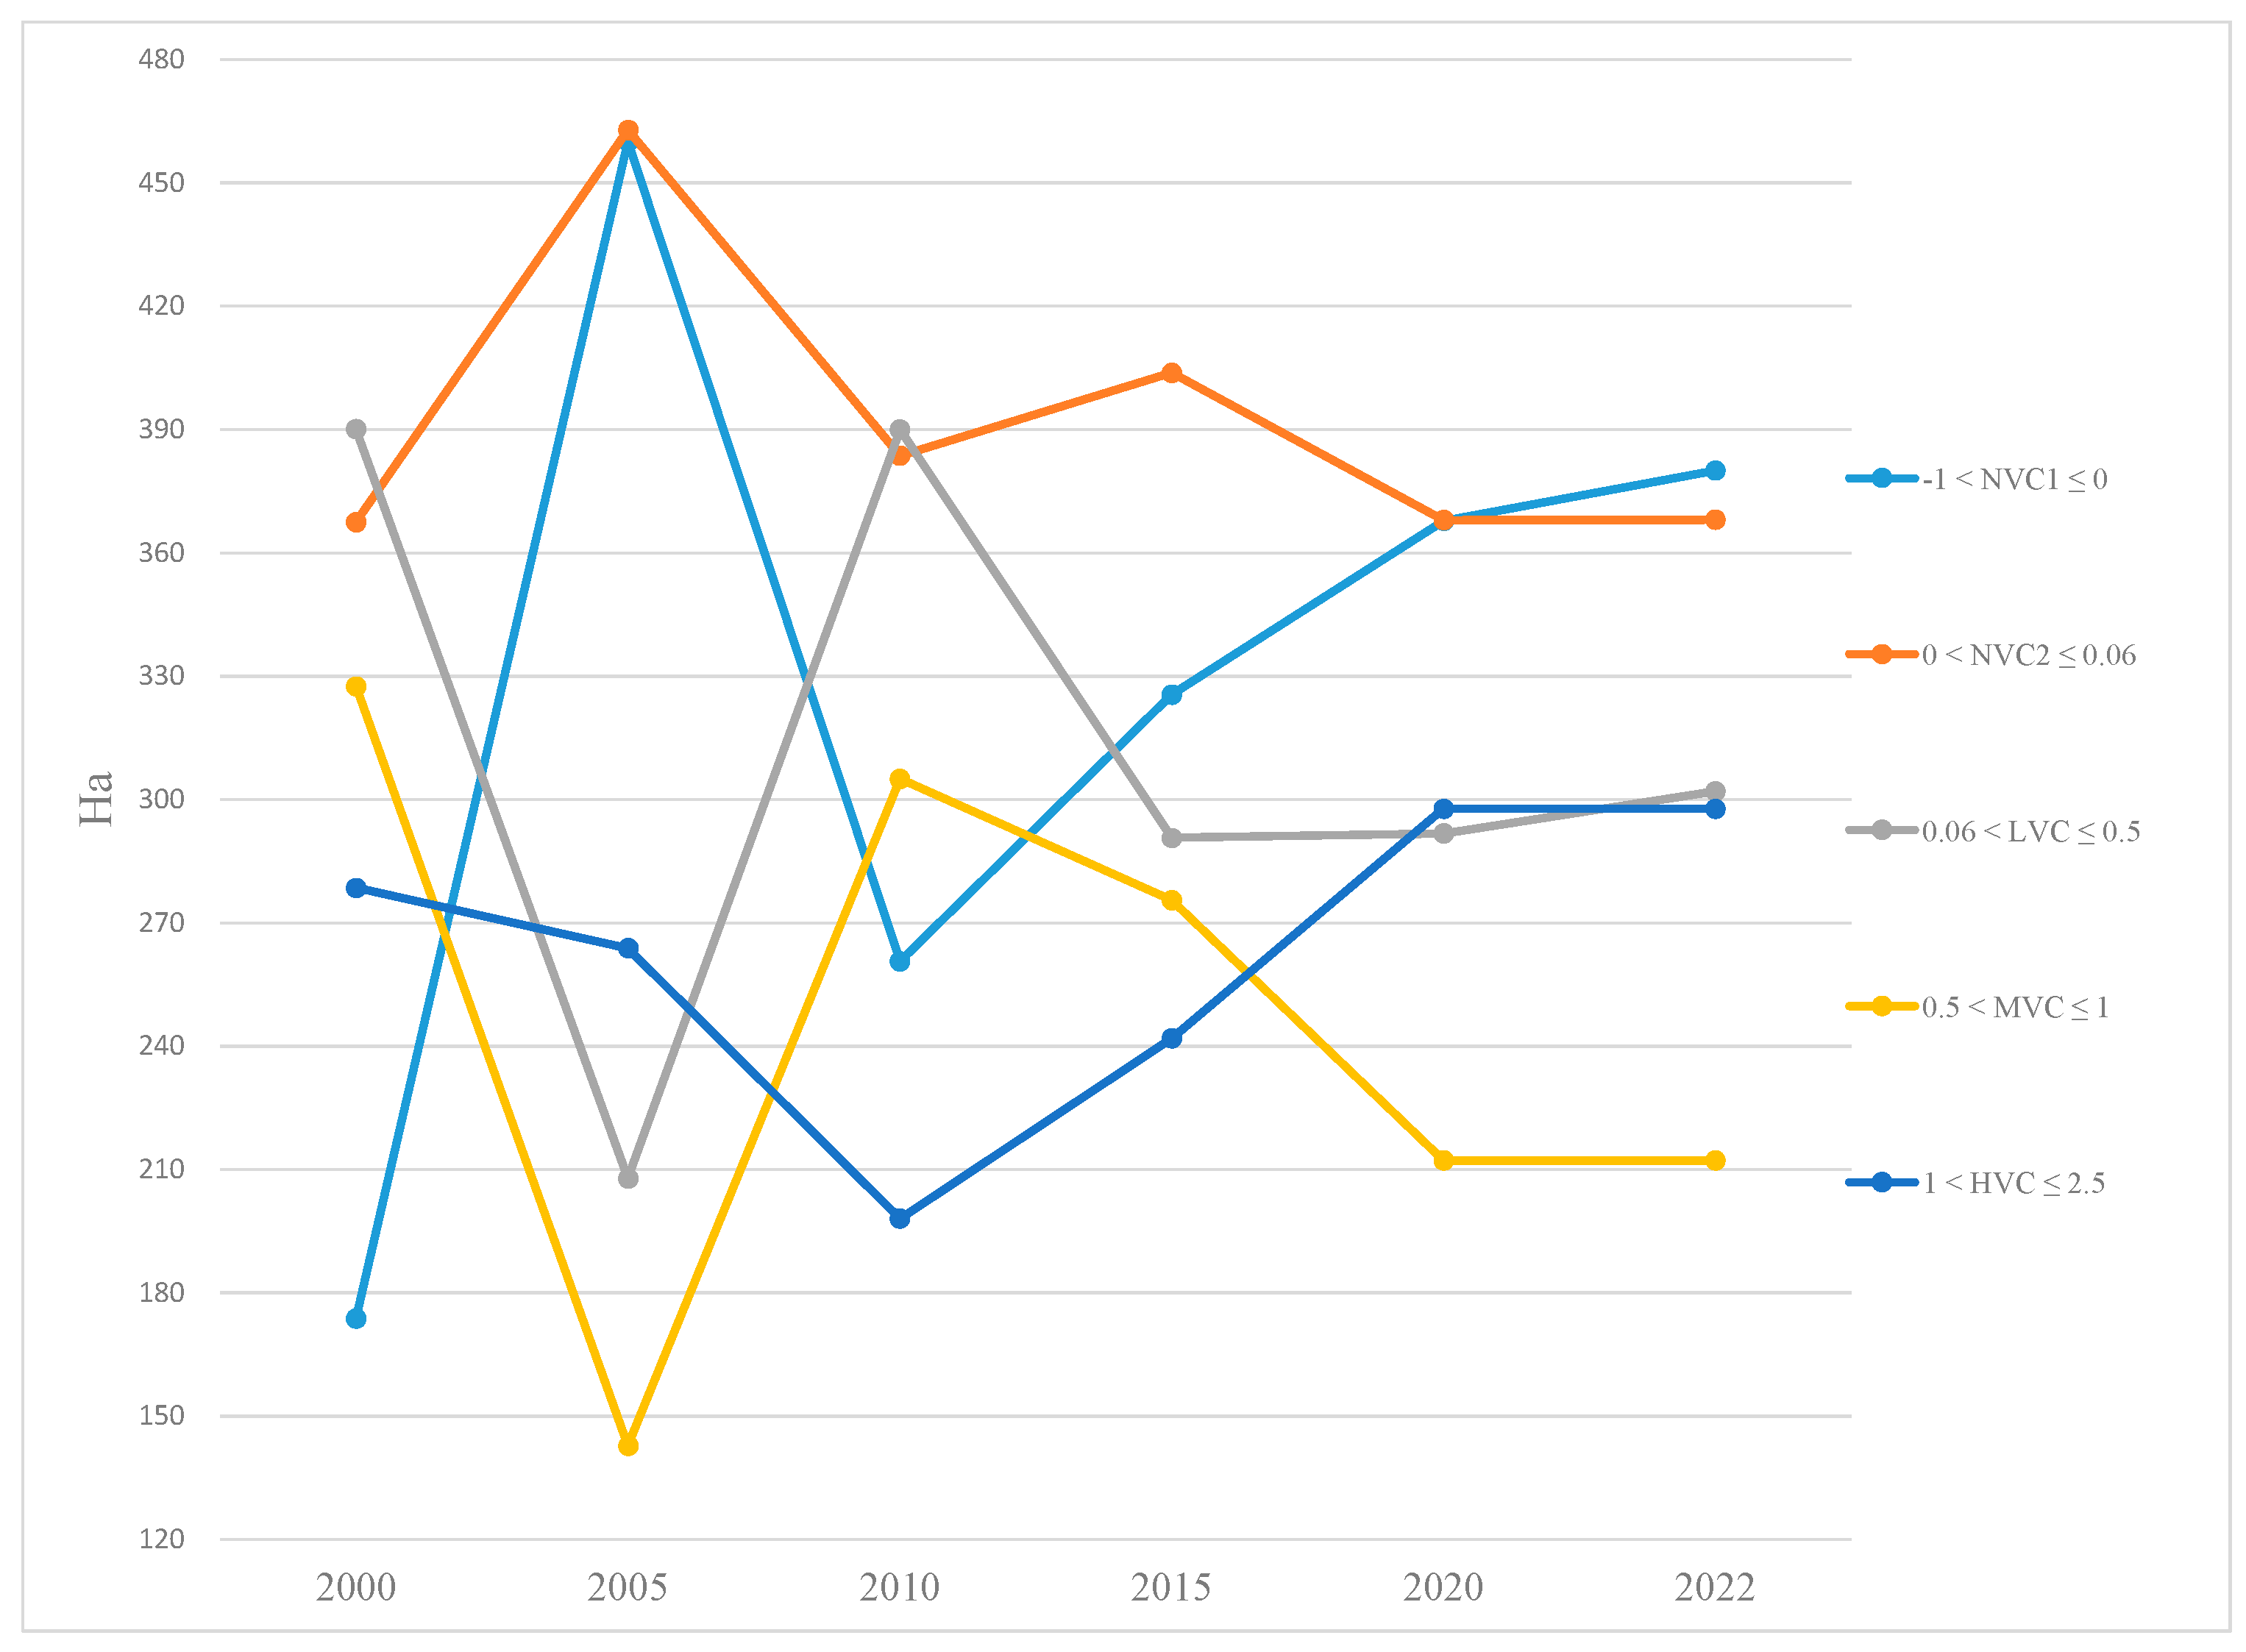
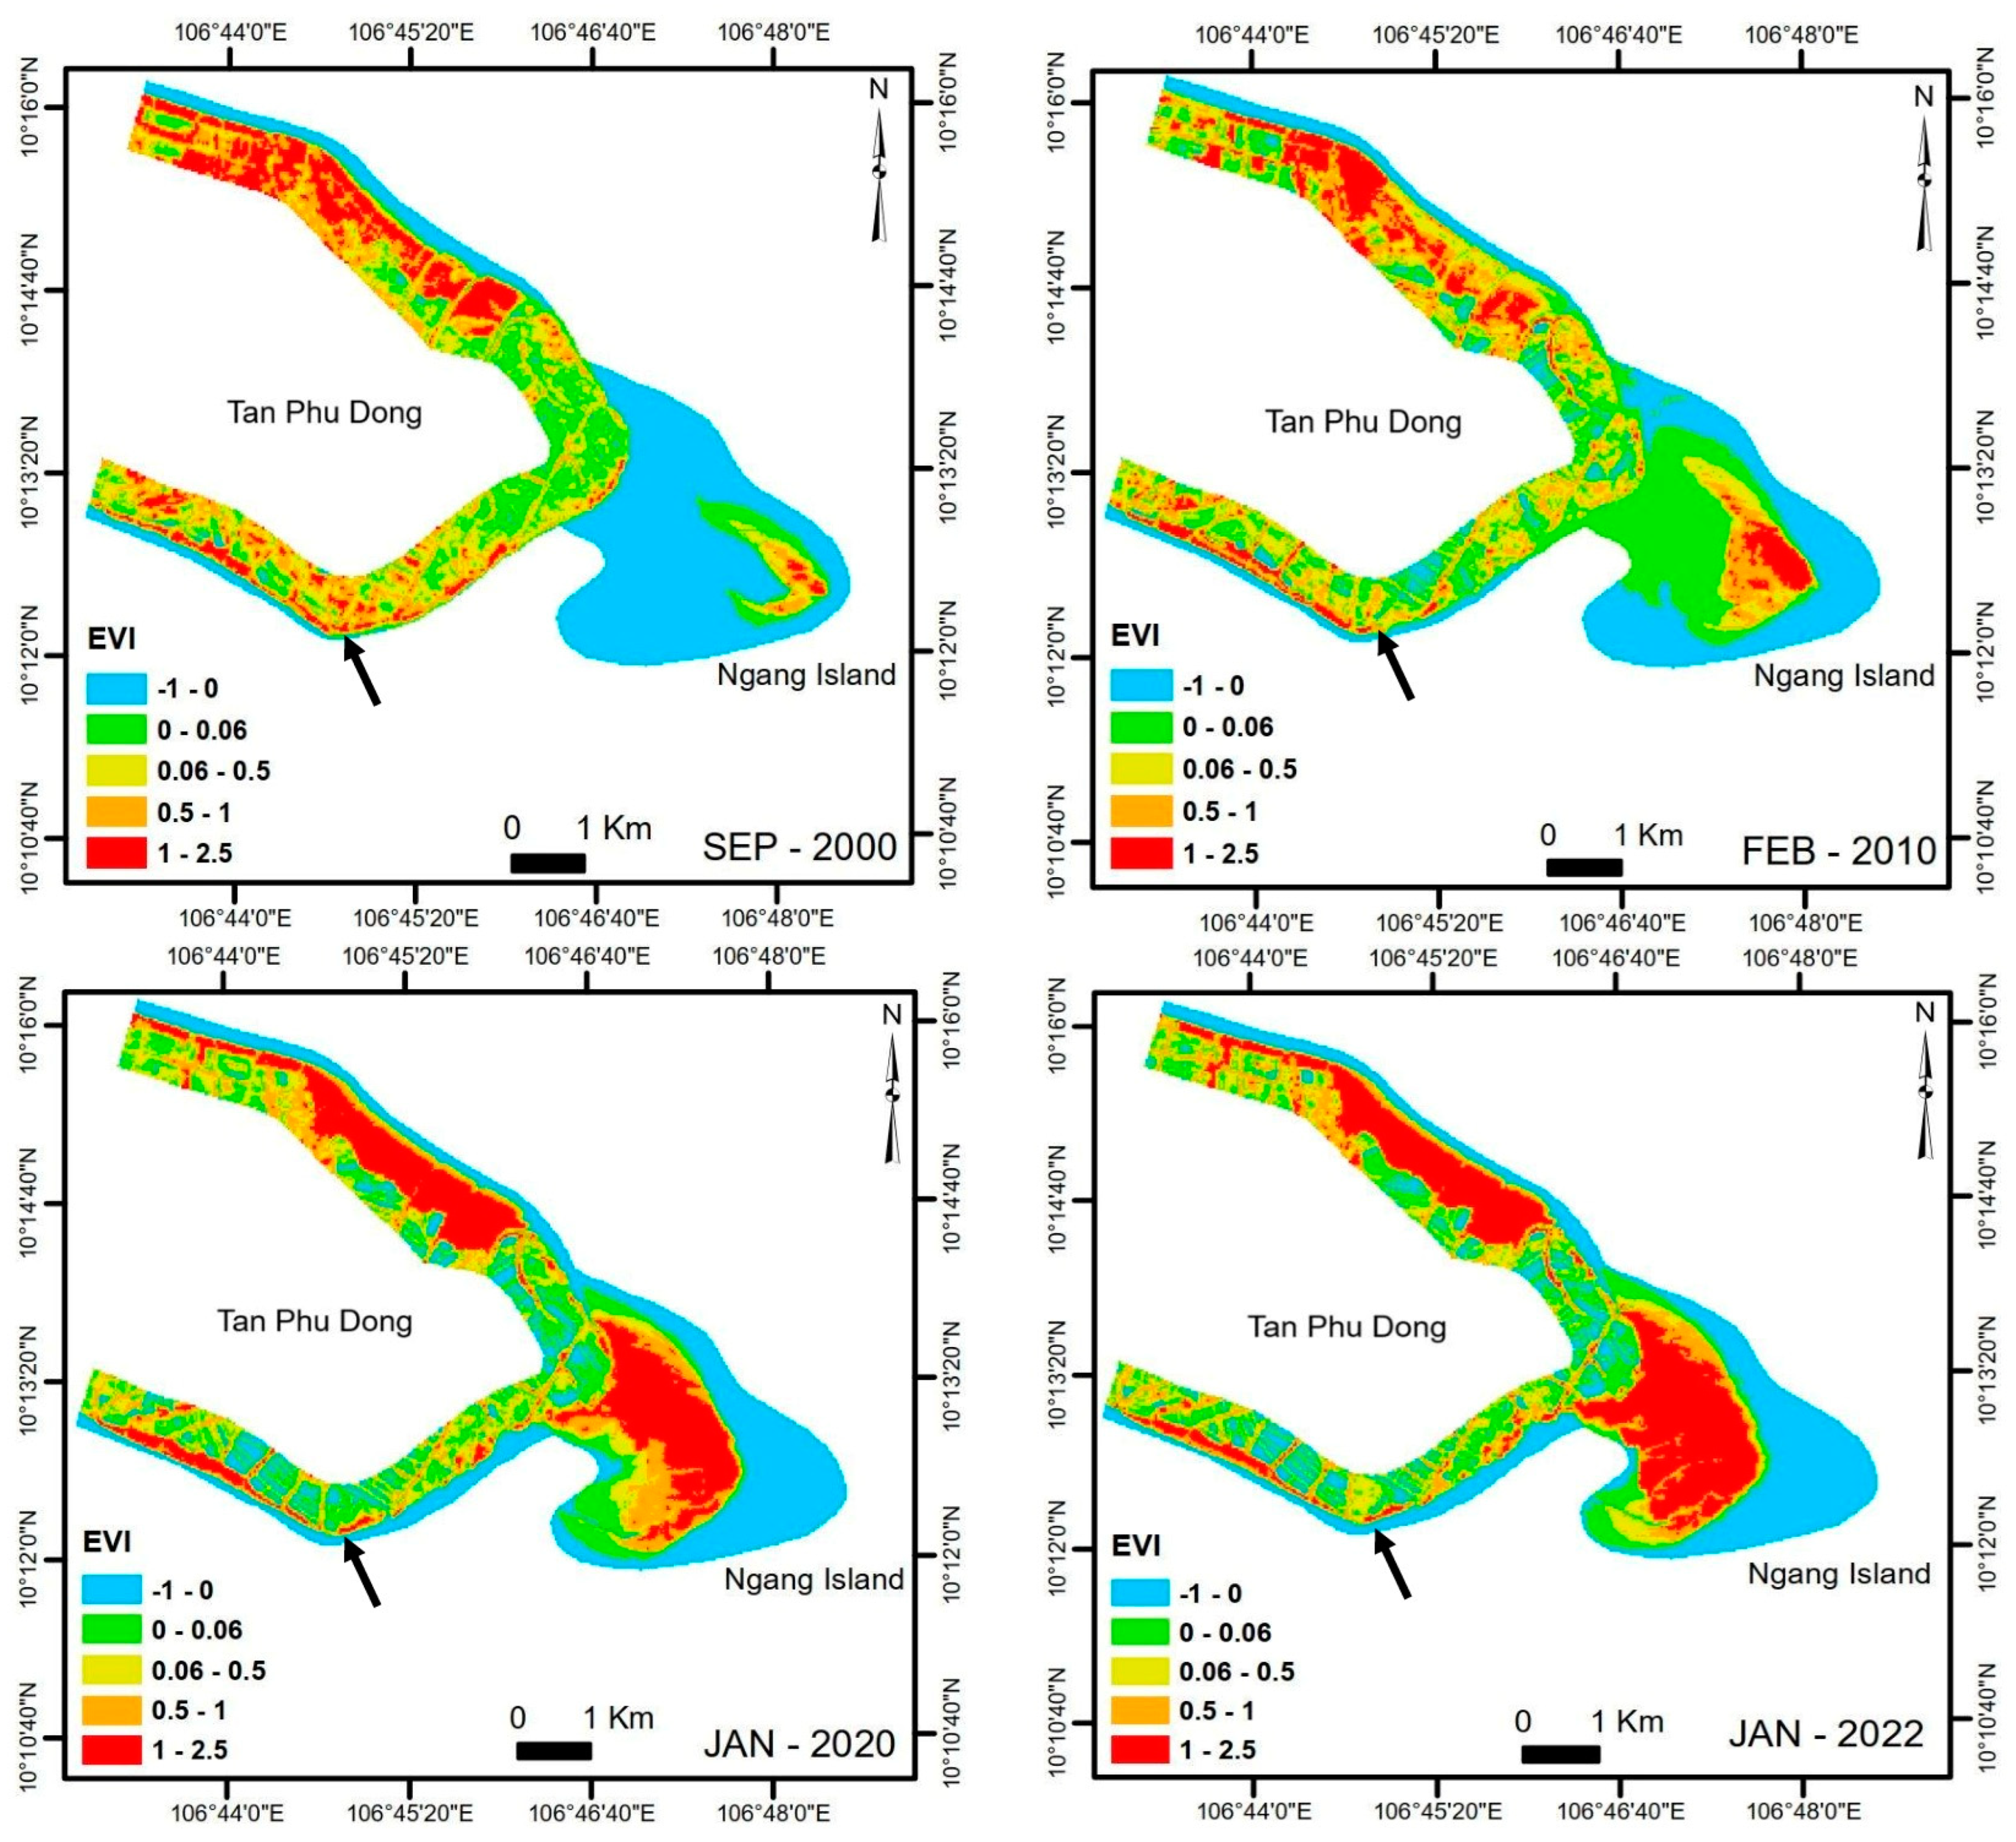
3.1. The Vegetation Cover Between 2000 and 2022

The EVI analysis showed that by 2010, NVC1 and NVC2 had increased dramatically in 2005 (460 ha and 463 ha, respectively) and then decreased in 2010 (261 ha and 384 ha, respectively). While the LVC remained almost unchanged between 2000 and 2010, the MVC decreased from 328 ha in 2000 to 143 ha in 2005 before it reached 305 ha in 2010. The HVC constantly decreased from 278 ha in 2000 to 198 ha in 2010. By 2015, all the categories increased slightly except for LVC and MVC. LVC decreased from 390 ha in 2010 to 291 ha in 2015, while MVC decreased from 305 ha in 2010 to 275 ha in 2015. By 2020, all the categories decreased slightly except for NVC2 and MVC. NVC2 had decreased slightly from 404 ha in 2015 to 368 ha in 2015. The MVC decreased slightly from 275 ha in 2015 to 212 ha in 2020. NVC1, LVC, and HVC increased slightly from 2015 (326 ha, 291 ha, and 249 ha, respectively) to 2020 (368 ha, 292 ha, and 298 ha, respectively). By 2022, NVC2, MVC, and HVC remained unchanged, while NVC1 and LVC increased slightly from 368 ha and 292 ha in 2015, respectively, to 380 ha and 302 ha, respectively (Figure 3 and Figure 4).

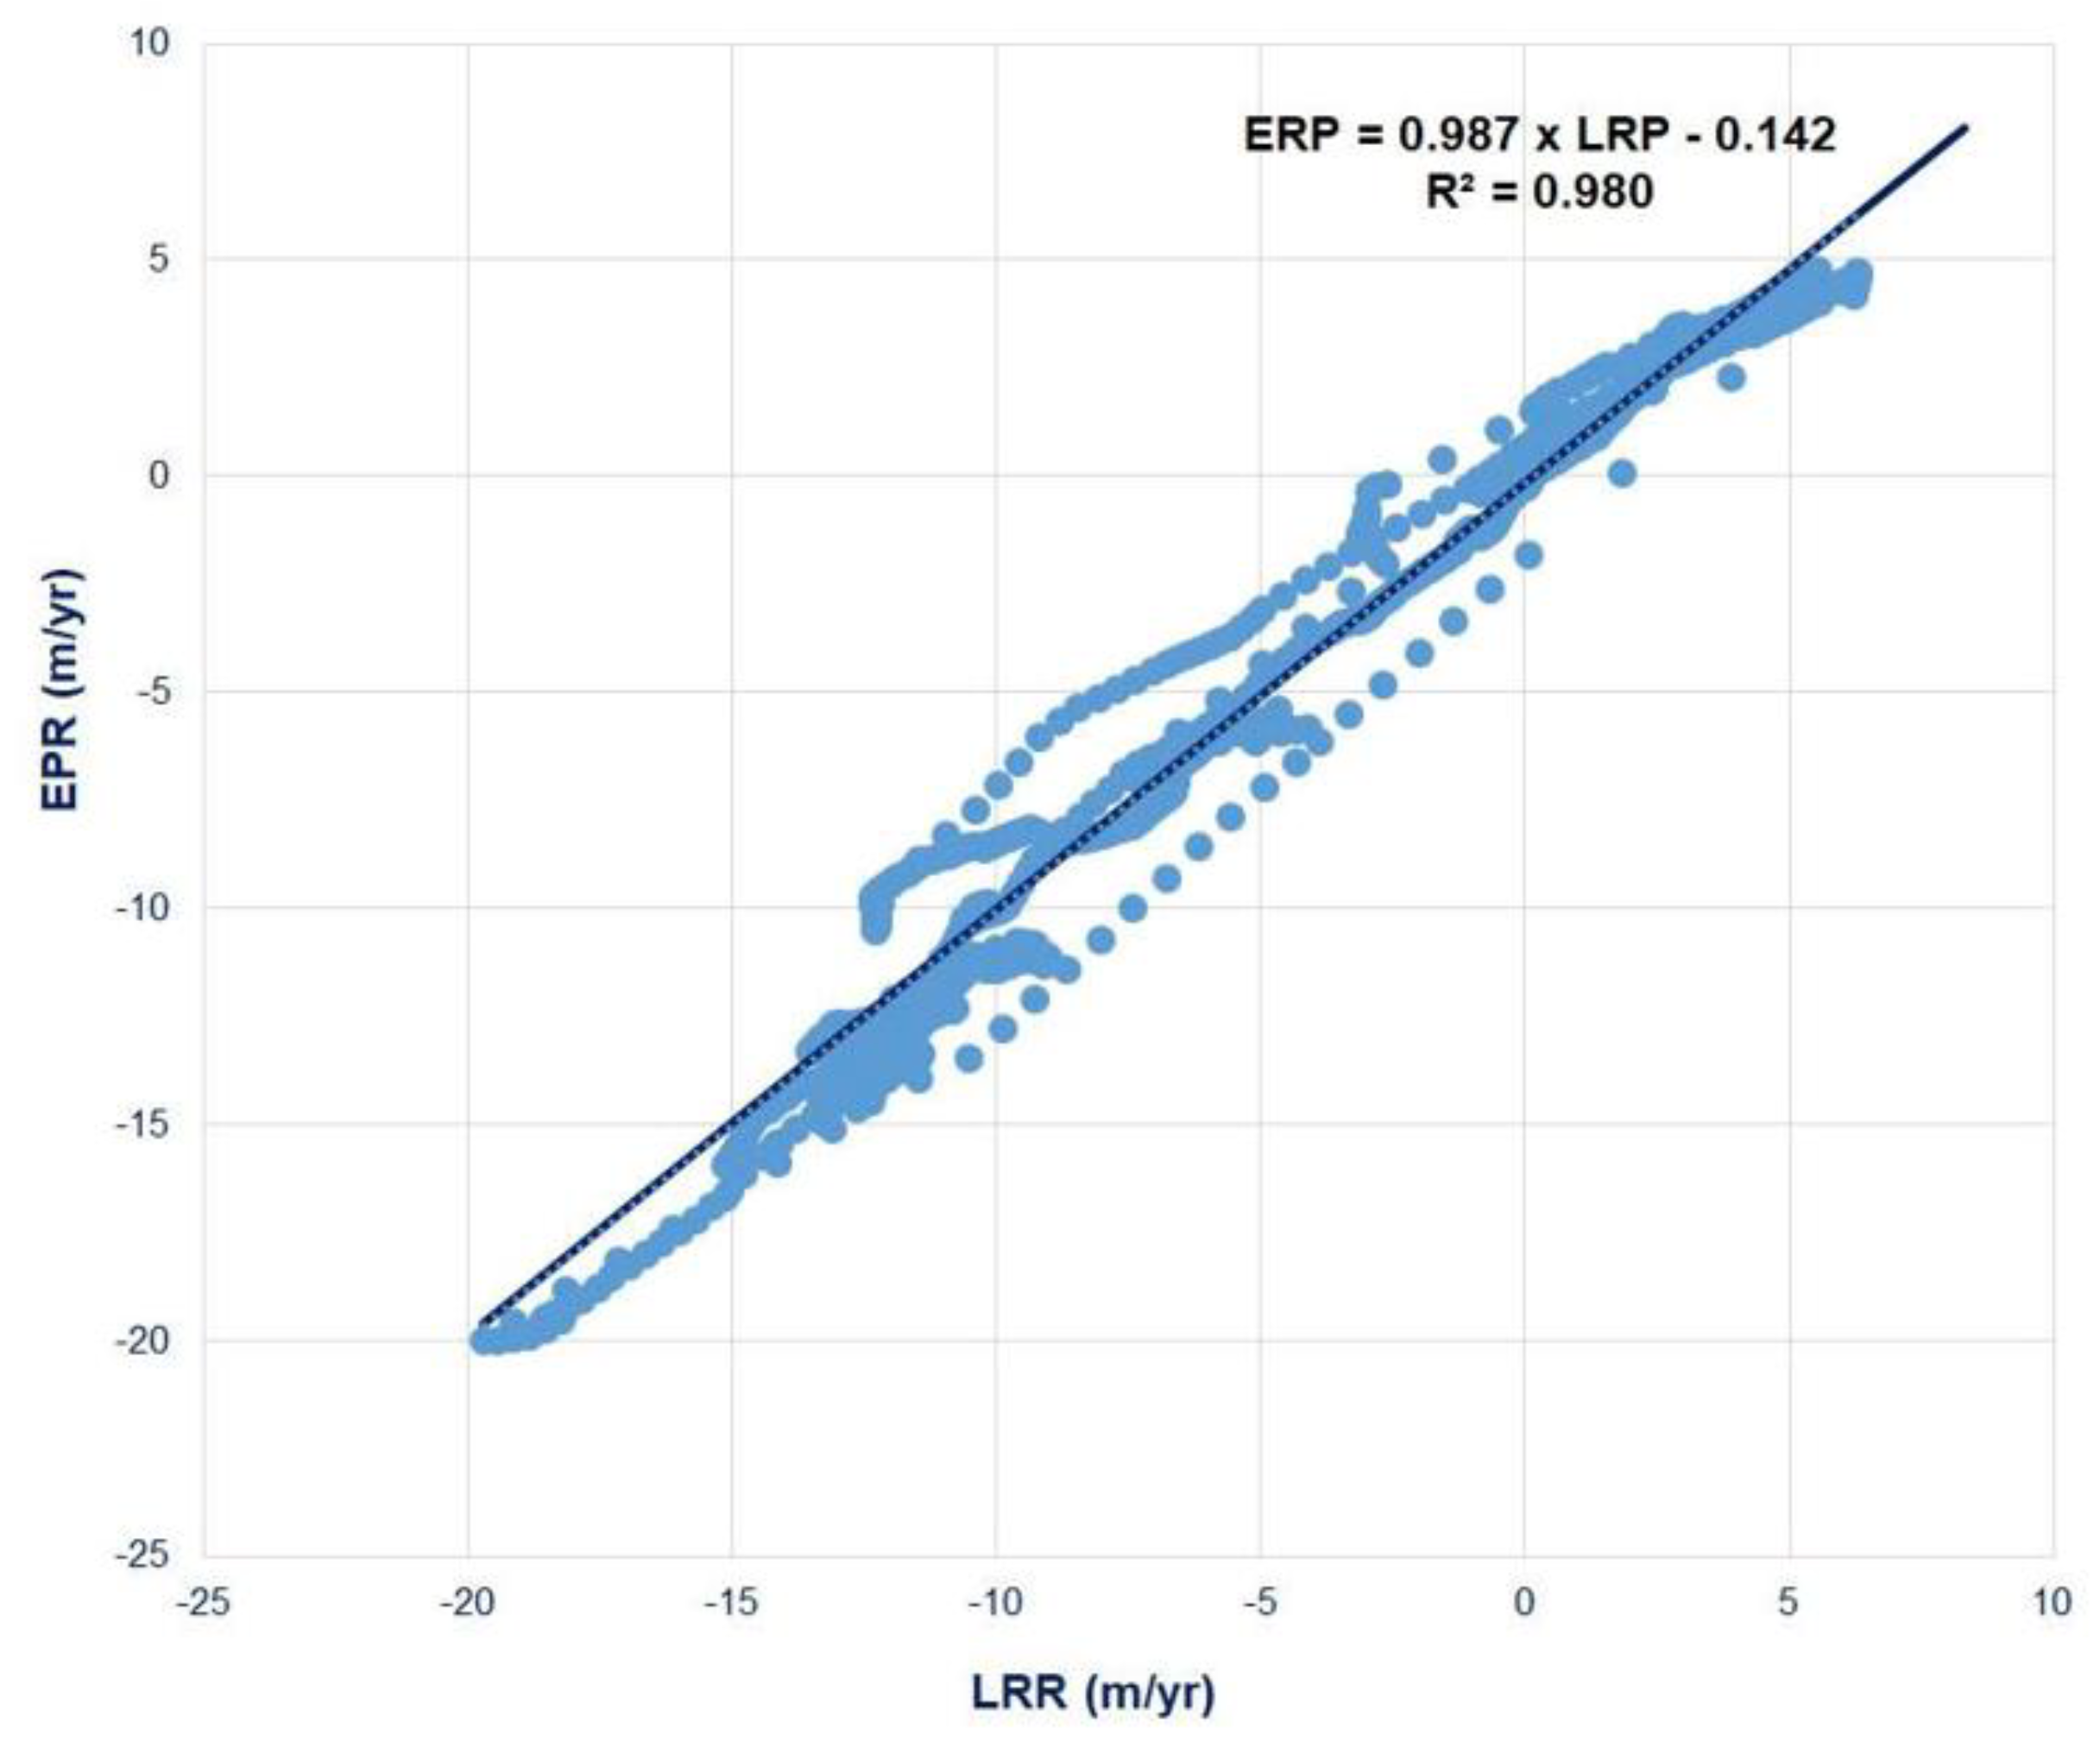
3.2. The Shoreline Change Between 2000 and 2022

The DSAS indicated that Tien Giang HTBs were in slightly eroded areas, while areas located in northeast of Tien Giang HTBs experienced dramatic changes in the shoreline. Moreover, the southwest (river mouth area) area of HTBs was rather stable (Figure 5).
The Tan Phu Dong shoreline is quite complex and widely curved with two river areas. The complex and widely curved coasts made it quite difficult to calculate the rate of shoreline change. Therefore, the Tan Phu Dong coast was divided into three smaller areas (i.e., A, B, and C) that helped to constructed transects to accurately calculate the changes of the Tan Phu Dong shoreline. A–C and the dotted lines were part of the transact establishment and were used for calculating the changes in the Tan Phu Dong shoreline in this study.

3.3. The Mangrove Growth

The monitoring revealed that there was a small number of young mangrove trees, mainly of the Bruguiera species, growing in small clusters in the gap between Tien Giang HTB section and the shoreline. There was also a low level of fine-grained and coarse-grained sediments at these monitoring sites behind Tien Giang HTBs over the entire period. Fully grown Bruguiera trees were also found in these monitoring sites behind Tien Giang HTBs. Meanwhile, two control sites experienced a high level of natural growth of mangrove species, including Sonneratia, Avicennia, and Bruguiera species in areas close to the shore and Tieu river mouth. Sonneratia sp. formed the majority, followed by Bruguiera sp., and Avicennia sp. These mangrove species grew from the shore. The monitoring also showed that remnants of eroded areas were still visible during low tides. Weeds, mainly Cyperus stoloniferus, grew strongly in brown clay soils (Table 4 and Figure 6).

4. Discussion

4.1. Tien Giang HTBs and Vegetation Cover Increase

The present study revealed that the vegetation cover has increased steadily since 2005, which was prior to the construction of Tien Giang HTBs. Vegetation cover in 2010 almost gained its highest coverage status in 2000 (Figure 3 and Figure 4). HVC increased dramatically between 2015 and 2020 while LVC and MVC decreased slightly between 2015 and 2020 (Figure 3 and Figure 4). Similarly, NVC1 and NVC2 fluctuated slightly during this period (Figure 3 and Figure 4). While MVC and HVC remained unchanged, LVC increased slightly between 2020 and 2022. Mangrove trees grew strongly in areas close to the shoreline and the estuarine areas (Figure 6). In addition, large areas of fully grown mangrove trees were found along the shoreline behind Tien Giang HTBs, particularly close to the river mouth areas (Figure 6 and Table 4). Weeds grew strongly on brown clay soil (Figure 6 and Table 4).

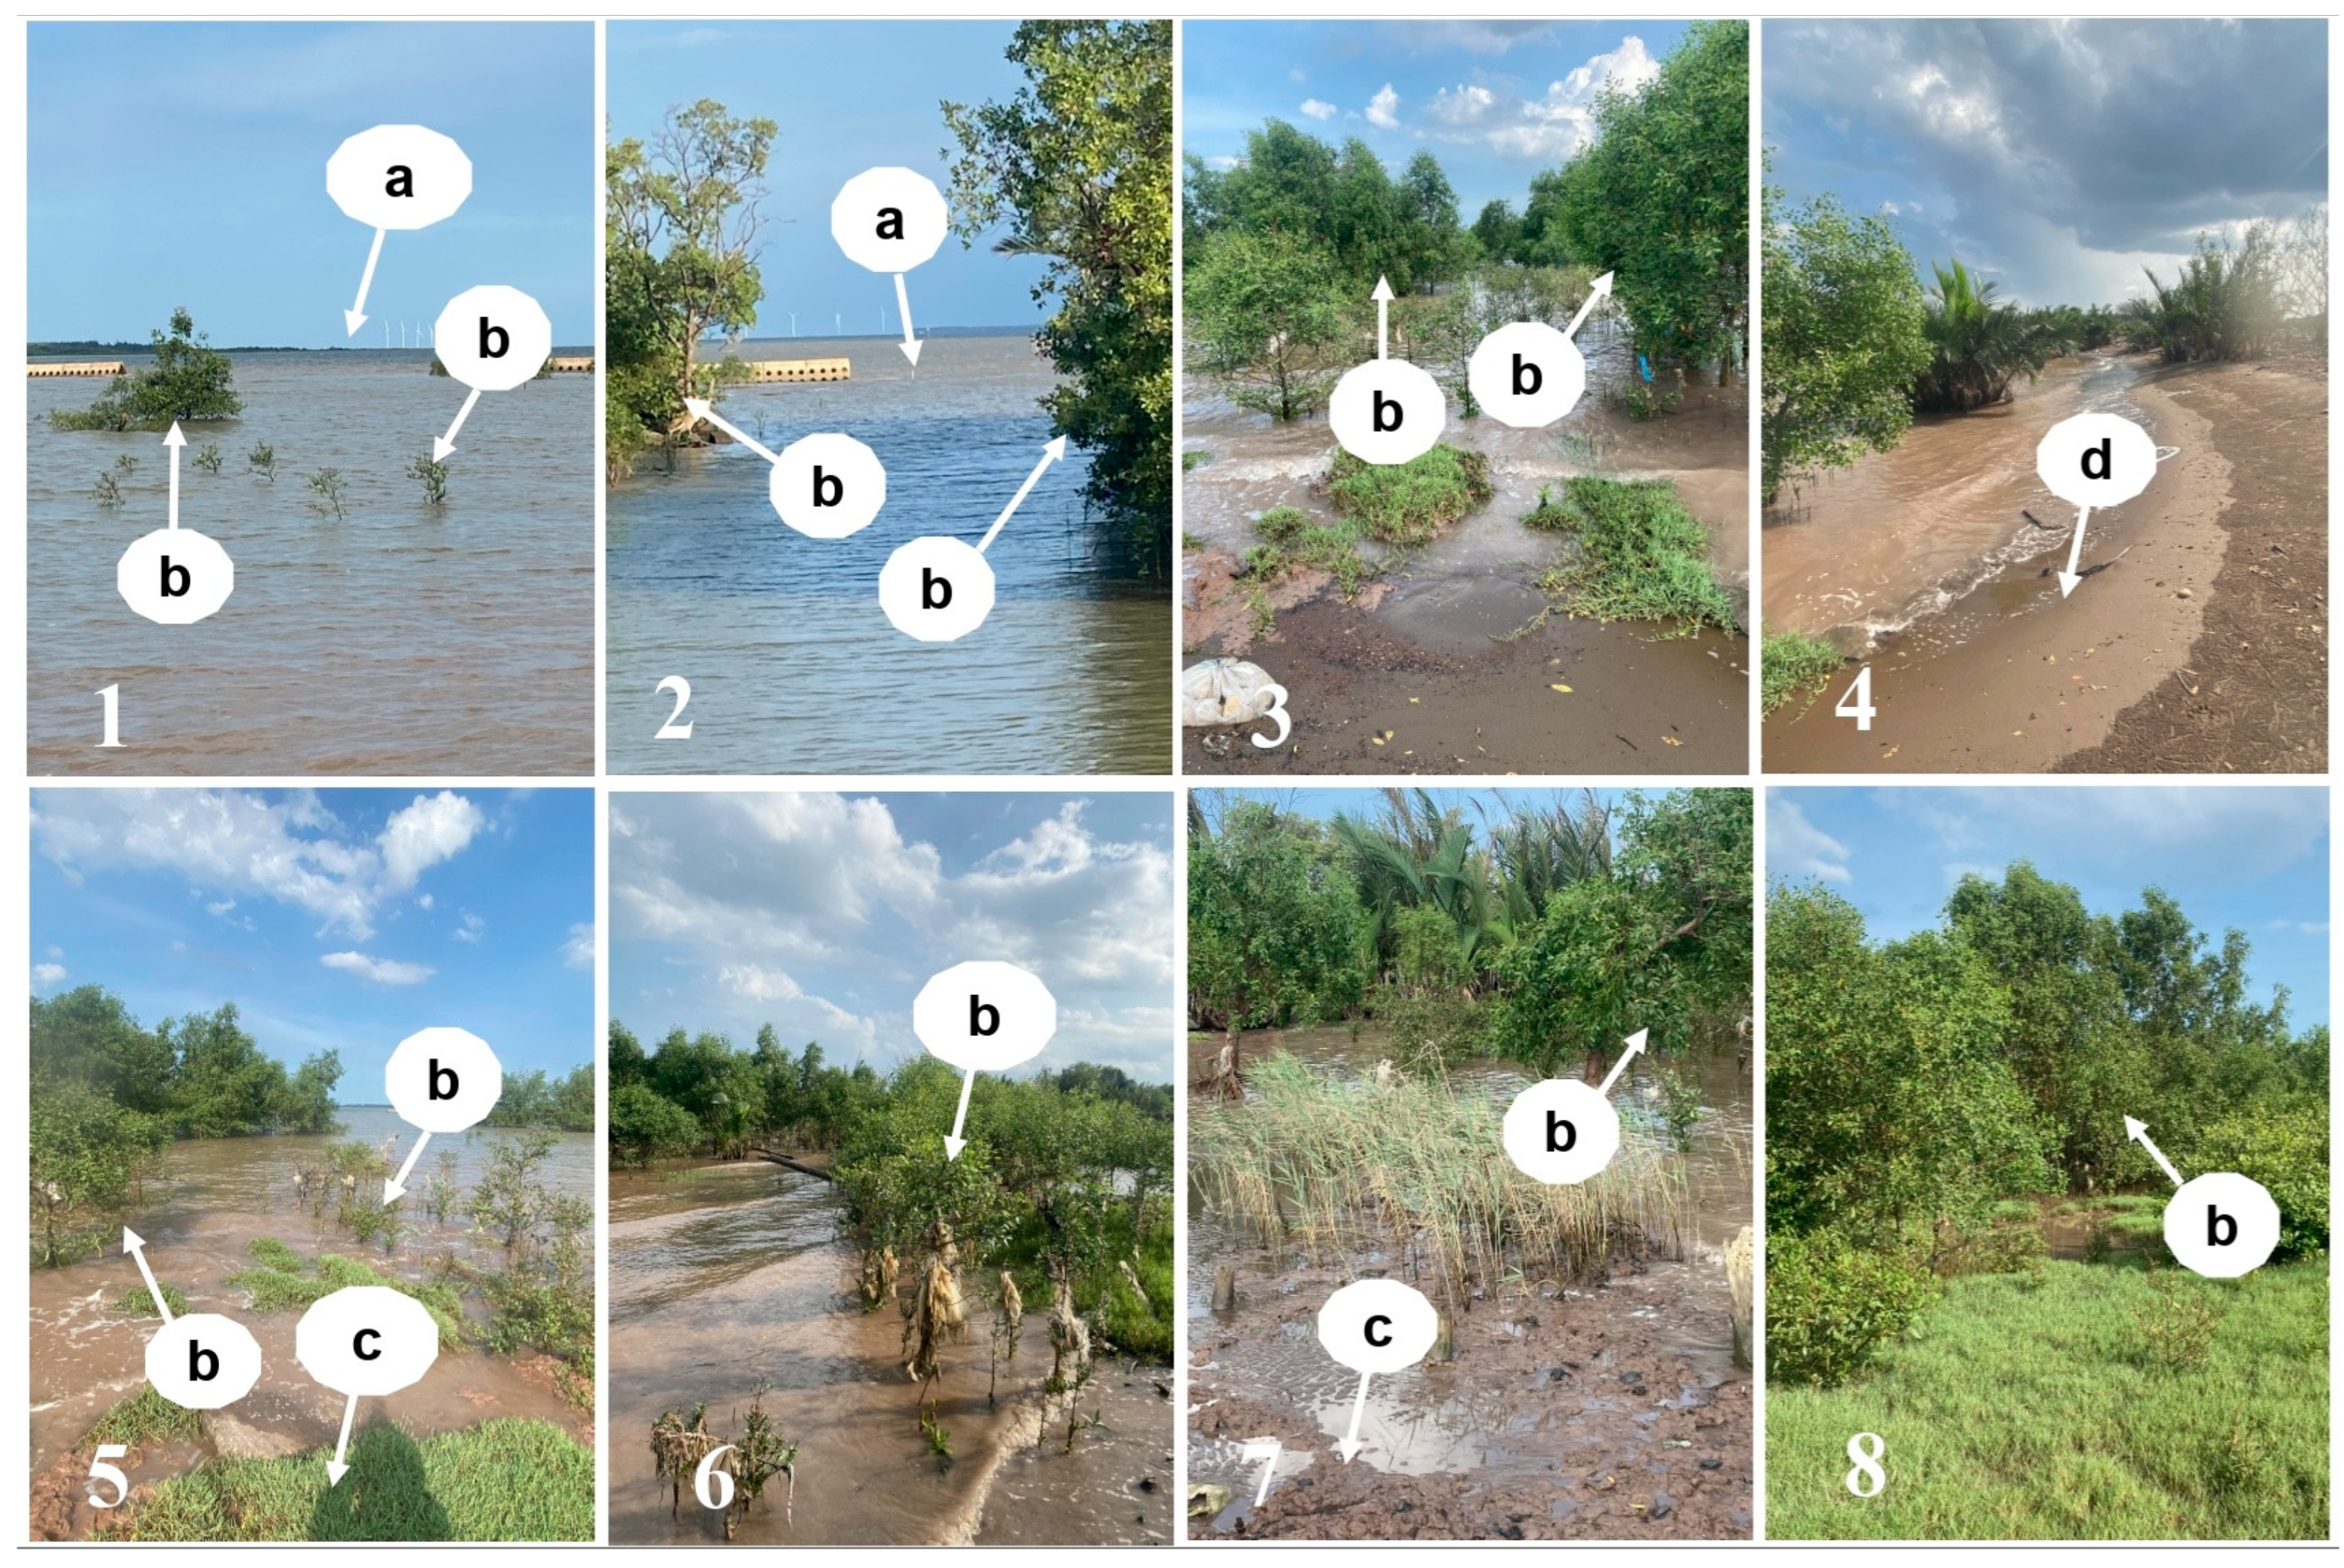
4.2. Mangrove Growth Process

The strong mangrove growth occurred partly due to the adaptation of mangrove species, with the dominance of Sonneratia and Bruguiera species to the site (estuarine areas) (two control sites). A previous study confirmed the occurrence of Sonneratia sp. in estuarine areas in many areas of the tropical areas [34]. A practical study showed that Sonneratia sp. can regenerate in well-protected or sheltered areas in the region [35].
Bruguiera species in the monitoring sites started growing in small clusters in 2000 (Table 4). In addition, weed species were growing strongly on remnants of eroded areas (brown clay soil) along the shore and coarse-grained sediment (mainly sand). The mangrove growth was possible particularly due to the existence of Ngang Island, which helped shelter the study site from the monsoon regimes (Figure 4). Ngang Island first appeared in approximately 2000 due to the gradual accumulation of sediment (NVC1) (Figure 4). The evolution of Ngang Island was fully reported [33]. This sediment may have been discharged from the Tieu River mouth (see Figure 5 for the location of the Tieu River mouth). Similar sedimentation processes have been reported in the region in previous studies [36,37,38,39]. The strong growth of the Bruguiera species and weed growth (Figure 6 and Table 4) indicate that the site has gradually stabilized, with increased vegetation cover since 2010 due to the existence of Ngang Island, which happened before Tien Giang HTBs were constructed. This means that mangrove species grew stronger and diverse under favorable conditions, and that there is no need to plant mangrove seedlings under similar conditions, which was confirmed by the previous studies [40,41].

4.3. Tien Giang HTBs in Mangrove Protection

Offshore breakwaters (emergent detached and submerged offshore structures) are increasingly being constructed to control coastal erosion in Vietnam [16,42,43,44] and have been increasingly used throughout Southeast Asia [45]. To date, previous studies have shown the effectiveness of offshore structures in dissipating the energy of strong incident waves [12,13,46,47]. In this study, the DSAS showed that Tien Giang HTBs were constructed in slightly eroded areas and in estuarine areas (Figure 5), after they had been numerically tested. Three different mangrove species (Sonneratia, Avicennia, and Bruguiera species) grew in estuarine areas, while only one species (Bruguiera species) grew in small clusters behind Tien Giang HTBs (Figure 4 and Figure 6 and Table 4). This means that numerical testing using wave parameters is insufficient for improving the effectiveness of HTBs in promoting mangrove growth or increasing vegetation cover. In addition, the current Tien Giang HTB location (slightly eroded areas and estuarine area) was not solid evidence that Tien Giang HTBs drove increases in vegetation cover or the natural regeneration of mangrove species in the study area. Therefore, the morpho-hydrodynamic characteristics of the site must be sufficiently considered during the design of HTBs, as previously recommended [48,49], to maximize their effectiveness. Likewise, HTBs should be constructed in areas other than stable or estuarine areas to test their ability to increase vegetation cover. Likewise, increases in vegetation cover and the natural regeneration of local mangrove forests appear not to have been the focus of the technical design of these structures, which were primarily constructed to dissipate wave energy and reduce shoreline erosion.

4.4. Limitations of This Study

The main objective of this study was to investigate the relationship between Tien Giang HTBs and vegetation cover increase. This was undertaken mainly using EVI calculations, DSAS, and field observations. The process underlying how Ngang Island supported natural regeneration and secondary succession of these mangroves and protected vegetation cover within the study site warrants further study. In addition, the reason why the LVC, MVC, and HVC decreased dramatically between 2000 and 2005 needs to be further studied. A targeted investigation of local morpho-hydrodynamic characteristics combined with appropriate monitoring could help to better understand the interactions between physical and ecological processes in this region of the Mekong Delta. If possible, morpho hydrodynamic characteristics should be examined in detail to better understand these processes. In addition, appropriate monitoring and evaluation should be implemented to better understand ecological processes.

5. Conclusions

The findings of this study on the relationship between Tien Giang HTBs and mangrove vegetation cover in Go Cong, Tien Giang, Vietnam, suggest that Tien Giang HTBs have yet to increase mangrove vegetation cover or promote any mangrove growth three years after their construction. The vegetation cover, dominated by Sonneratia, Avicennia, and Bruguiera species, steadily increased in parallel with a high level of mangrove growth, particularly with large areas of fully grown mangrove trees. An increase in vegetation cover, along with natural regeneration, occurred even before Tien Giang HTBs were constructed. This could be partly due to the existence of Ngang Island, which provided substantial shelter to the study site and the construction of these structures. In addition, Tien Giang HTBs were constructed in a rather stable area (both slightly eroded and estuarine area), and therefore, have yet to provide any noticeable benefits for mangrove regeneration three to five years after their construction.
This study shows that mangrove forests grew strongly in sheltered areas or estuarine areas, which were dominated by fine-grained sediments and that Tien Giang HTBs supported mangrove growth. There are, therefore, two options available to coastal managers. The first option is to construct HTBs in areas other than stable or estuarine areas to test their ability to increase vegetation cover. The second option is to apply a gradual expansion method [41] to ensure strong protection of mangrove forests and the Tien Giang coast. HTBs should be constructed in natural mangrove succession and/or strong mangrove growth as a first stage toward expanding existing mangrove areas along the coast. The second option is more suitable for those who are reluctant to adopt the first option as a solution.

Author Contributions

This article was written with contributions provided by all authors. N.T.P. was responsible for searching data/publications, conceptual format, analyzing the data, and finalizing, proofreading, and submitting the manuscript. N.B.T. was responsible for collecting field-based measurements and for data analysis and proofreading. N.N.T. was involved in data analysis and preparing the manuscript. All authors have read and agreed to the published version of the manuscript.

Funding

This research was funded by the Vietnam Academy of Science and Technology projects, grant numbers VAST05.04/22–23; UQĐTCB.03/22-23 and UQĐTCB.03/24-26.

Institutional Review Board Statement

Not applicable.

Informed Consent Statement

Not applicable.

Data Availability Statement

Data available in a publicly accessible repository.

Acknowledgments

This publication is part of Nguyen Bao Thuan’s graduate thesis at Faculty of Environment and Labour Safety, Ton Duc Thang University, Ho Chi Minh City, Vietnam. The views expressed in this publication do not necessarily reflect those of Ton Duc Thang University, nor do they criticize the construction of Tien Giang HTBs and the efforts of the parties involved in design and construction of Tien Giang HTBs. The authors would like to thank Dang Quang Huy, Chief of Irrigation Section of the Tien Giang Provincial Department of Agriculture & Rural Development (Tien Giang DARD), and Gian Van Toan, Chief of Staff of Tien Giang DARD for providing advice and information on coastal protection structures, mangrove forests, and local community members in Tan Phu Dong district for providing the information on coastal protection in the area. The authors would also like to thank the Coasts and People Organization for providing technical input and organizing field trips for the authors to the study site, and James Cook University, Queensland, Australia, for providing documents and library-related service. The authors would like to extend their sincere thanks to Nguyen Hao Quang for providing advice on the application of DSAS methods.

Conflicts of Interest

The authors declare no conflicts of interest.

References

  1. Cappietti, L. Converting Emergent Breakwaters into Submerged Breakwaters. J. Coast. Res. 2011, 64, 479–483. Available online: https://www.jstor.org/stable/26482218 (accessed on 29 December 2023).
  2. Sheng-Wen, T.; Cheng-Chung, C. A highly wave dissipation offshore breakwater. Ocean Eng. 2000, 27, 315–330. [Google Scholar] [CrossRef]
  3. Bacchiocchi, F.; Airoldi, L. Distribution and dynamics of epibiota on hard structures for coastal protection. Estuar. Coast. Shelf Sci. 2003, 56, 1157–1166. [Google Scholar] [CrossRef]
  4. Jackson, N.L.; Harley, M.D.; Armaroli, C.; Nordstrom, K. Beach morphologies induced by breakwaters with different orientations. Geomorphology 2015, 239, 48–57. [Google Scholar] [CrossRef]
  5. Becchi, C.; Ortolani, I.; Muir, A.; Cannicci, S. The effect of breakwaters on the structure of marine soft-bottom assemblages: A case study from a North-Western Mediterranean basin. Mar. Pollut. Bull. 2014, 87, 131–139. [Google Scholar] [CrossRef] [PubMed]
  6. Thomalla, F.; Vincent, C.E. Designing Offshore Breakwaters Using Empirical Relationships: A Case Study from Norfolk, United Kingdom. J. Coast. Res. 2004, 20, 1224–1230. Available online: https://www.jstor.org/stable/4299378 (accessed on 29 December 2023). [CrossRef]
  7. Pranzini, E.; Rossi, L.; Lami, G.; Jackson, N.I.; Norstrom, K.F. Reshaping beach morphology by modifying offshore breakwaters. Ocean Coast. Manag. 2018, 154, 168–177. [Google Scholar] [CrossRef]
  8. Birben, A.R.; Özölçer, I.H.; Karasu, S.; Kömürcü, M. Investigation of the effects of offshore breakwater parameters on sediment accumulation. Ocean. Eng. 2007, 34, 284–302. [Google Scholar] [CrossRef]
  9. Stanley, O.D.; Lewis, R.R., III. Strategies for mangrove rehabilitation in an eroded coastline of Selangor, peninsular Malaysia. J. Coast. Res. 2009, 12, 142–154. [Google Scholar]
  10. Hashim, R.; Kamali, B.; Tamin, N.M.; Zakaria, R. An integrated approach to coastal rehabilitation: Mangrove restoration in Sungai Haji Dorani, Malaysia. Estuar. Coast. Shelf Sci. 2010, 86, 118–124. [Google Scholar] [CrossRef]
  11. Mohamed Rashidi, A.H.; Jamal, M.H.; Hassan, H.Z.; Sendek, S.S.M.; Sopie, S.L.M.; Hamid, M.R.A. Coastal Structures as Beach Erosion Control and Sea Level Rise Adaptation in Malaysia: A Review. Water 2021, 13, 1741. [Google Scholar] [CrossRef]
  12. Tu, L.X.; Manh, L.H.; Ba, H.T.; Duong, D.V.; Vu, H.T.D.; Wright, D.; Bui, V.H.; Anh, D.T. Wave energy dissipation through a hollow triangle breakwater on the coastal Mekong Delta. Ocean. Eng. 2022, 245, 110419. [Google Scholar] [CrossRef]
  13. Tu, L.X.; Phong, N.C.; Thanh, V.Q.; Quan, T.Q.; Wright, D.P.; Anh, D.T. Multi-scale modelling for hydrodynamic and morphological changes of breakwater in coastal Mekong Delta in Vietnam. J. Coast. Conserv. 2022, 26, 18. [Google Scholar] [CrossRef]
  14. Akbar, A.A.; Sartohadi, J.; Djohan, T.S.; Rytohardoyo, S. The role of breakwaters on the rehabilitation of coastal and mangrove forests in West Kalimantan, Indonesia. Ocean Coast. Manag. 2017, 138, 50–59. [Google Scholar] [CrossRef]
  15. Luom, T.T.; Nguyen, T.P.; Anh, N.T.; Tung, N.T.; Tu, L.X.; Duong, T.A. Using Fine-Grained Sediment and Wave Attenuation as a New Measure for Evaluating the Efficacy of Offshore Breakwaters in Stabilizing an Eroded Muddy Coast: Insights from Ca Mau, the Mekong Delta of Vietnam. Sustainability 2021, 13, 4798. [Google Scholar] [CrossRef]
  16. Ministry of Agriculture; Rural Development of Vietnam (MARD). Coastal Mangrove Forests in the Mekong Delta Decreased in Area Over the Past 15 Years. 2017. Available online: http://vea.gov.vn/vn/quanlymt/baotondadangsh/tintuchoatdong/tintucvasukien/tintuc/Pages/Di%E1%BB%87n-t%C3%ADch-r%E1%BB%ABng-ng%E1%BA%ADp-m%E1%BA%B7n-%C4%90%E1%BB%93ng-b%E1%BA%B1ng-s%C3%B4ng-C%E1%BB%ADu-Long-gi%E1%BA%A3m-trong-5-n%C4%83m-qua.aspx (accessed on 12 December 2018).
  17. Vietnamese Prime Minister (VPM). Project on Prevention and Control of River Bank Erosion and Coastal Erosion Until 2030; VPM: Hanoi, Vietnam, 2020. [Google Scholar]
  18. Nguyen, T.P. Offshore structures, sea mud accumulation and mangrove regeneration: Insights from the Vietnamese Mekong Delta, Vietnam. Ocean. Coast. Manag. 2022, 225, 106243. [Google Scholar] [CrossRef]
  19. Tu, L.X.; Ba, T.H.; Thanh, V.Q.; Wright, D.P.; Tanim, A.H.; Anh, D.T. Evaluation of coastal protection strategies and proposing multiple lines of defense under climate change in the Mekong Delta for sustainable shoreline protection. Ocean. Coast. Manag. 2022, 228, 106301. [Google Scholar] [CrossRef]
  20. Tien Giang PPC. Decision No. 3441/QD-UBND Approving the Detailed Construction Masterplan for Con Ngang eco-Tourism Development Area (Scale 1/500) in Phu Tan Commune, Tan Phu Dong District; Tien Giang PPC: My Tho, Vietnam, 2009. [Google Scholar]
  21. Carlson, T.N.; Ripley, D.A. On the relation between NDVI, fractional vegetation cover, and Leaf Area Index. Remote Sens. Environ. 1997, 62, 241–252. [Google Scholar] [CrossRef]
  22. Huete, A.; Didan, K.; Miura, T.; Rodriguez, E.P.; Gao, X.; Ferreira, L.G. Overview of the radiometric and biophysical performance of the MODIS vegetation indices. Remote Sens. Environ. 2002, 83, 195–213. [Google Scholar] [CrossRef]
  23. Moore, L.J. Shoreline mapping techniques. J. Coast. Res. 2000, 16, 111–124. Available online: https://www.jstor.org/stable/4300016 (accessed on 29 December 2023).
  24. Genz, A.S.; Fletcher, C.H.; Dunn, R.A.; Frazer, L.N.; Rooney, J.J. The predictive accuracy of shoreline change rate methods and alongshore beach variation on Maui, Hawaii. J. Coast. Res. 2007, 231, 87–105. [Google Scholar] [CrossRef]
  25. Nguyen, T.P.; Nguyen, Q.H.; Sang, T.V. Shoreline Change and Community-based Climate Change Adaptation: Lessons Learnt from Brebes Regency, Indonesia. Ocean. Coast. Manag. 2022, 218, 106037. [Google Scholar] [CrossRef]
  26. Pimple, U.; Simonetti, D.; Peters, R.; Berger, U.; Podest, E.; Gond, V. Enhancing monitoring of mangrove spatiotemporal tree diversity and distribution patterns. Land Degrad. Dev. 2022, 34, 1265–1282. [Google Scholar] [CrossRef]
  27. Thompson, W.D.; Walter, S.D. A reappraisal of the Kappa Coeficient. J. Clin. Epidemiol. 1988, 41, 949–958. [Google Scholar] [CrossRef]
  28. Alberg, A.J.; Park, J.W.; Hager, B.W.; Brock, M.V.; Diener-West, M. The use of ‘Overall Accuracy’ to evaluate the validity of screening or diagnostic tests. J. Gen. Intern. Med. 2004, 19, 460–465. [Google Scholar] [CrossRef] [PubMed]
  29. Bheeroo, R.A.; Chandrasekar, N.; Kaliraj, S.; Magesh, N.S. Shoreline change rate and erosion risk assessment along the Trou Aux Biches–Mont Choisy beach on the northwest coast of Mauritius using GIS-DSAS technique. Environ. Earth Sci. 2016, 75, 444. [Google Scholar] [CrossRef]
  30. Burningham, H.; French, J. Understanding coastal change using shoreline trend analysis supported by cluster-based segmentation. Geomorphology 2017, 282, 131–149. [Google Scholar] [CrossRef]
  31. Nassar, K.; Mahmod, W.E.; Fath, H.; Masria, A.; Nadaoka, K.; Negm, A. Shoreline change detection using DSAS technique: Case of North Sinai coast, Egypt. Mar. Georesour. Geotechnol. 2019, 37, 81–95. [Google Scholar] [CrossRef]
  32. Nguyen, Q.H.; Takewaka, S. Land subsidence and its effects on coastal erosion in the Nam Dinh Coast (Vietnam). Cont. Shelf Res. 2020, 207, 104227. [Google Scholar] [CrossRef]
  33. Nguyen, T.P.; Thuan, N.B.; Loi, L.T.; Quoc, H.V. Morphological Evolution of an Intertidal Mudflat in Relation to Mangrove Growth: Implications for Future Erosion Control. Life 2024, 14, 711. [Google Scholar] [CrossRef]
  34. Duke, N.C. Australia’s Mangroves—The Authoritative Guide to Australia’s Mangrove Plants; University of Queensland: Queensland, Australia, 2006. [Google Scholar]
  35. Nguyen, T.P.; Luom, T.T.; Parnell, K.E. Mangrove transplantation in Brebes Regency, Indonesia: Lessons and Recommendations. Ocean. Coast. Manag. 2017, 149, 12–21. [Google Scholar] [CrossRef]
  36. Li, X.; Liu, J.P.; Saito, Y.; Nguyen, V.L. Recent evolution of the Mekong Delta and the impacts of dams. Earth-Sci. Rev. 2017, 175, 1–17. [Google Scholar] [CrossRef]
  37. Liu, Z.; Fagherazzi, S.; Cui, B. Success of coastal wetlands restoration is driven by sediment availability. Nat. Commun. Earth Environ. 2021, 2, 44. [Google Scholar] [CrossRef]
  38. Phan, H.M. Coastal and Seasonal Hydrodynamics and Morphodynamics of the Mekong Delta. Ph.D. Thesis, Delft University of Technology, Delft, The Netherlands, 2020. [Google Scholar] [CrossRef]
  39. Thanh, V.Q.; Reyns, J.; Wackerman, C.; Eidam, E.F.; Roelvink, D. Modelling suspended sediment dynamics on the subaqueous delta of the Mekong River. Cont. Shelf Res. 2017, 147, 213–230. [Google Scholar] [CrossRef]
  40. Kamali, B.; Hashim, R. Mangrove restoration without planting. Ecol. Eng. 2011, 37, 387–391. [Google Scholar] [CrossRef]
  41. Nguyen, T.P.; Parnell, K.E. Gradual expansion of mangrove areas as an ecological solution for stabilizing a severely eroded mangrove dominated muddy coast. Ecol. Eng. 2017, 107, 239–243. [Google Scholar] [CrossRef]
  42. VPM. Program to Upgrading and Reinforcing the Sea dyke System from Quang Ngai to Kien Giang Provinces; VPM: Hanoi, Vietnam, 2009. [Google Scholar]
  43. VPM. Resolution on Sustainable Socio-Economic Development for Adaptation to Climate Change; VPM: Hanoi, Vietnam, 2017. [Google Scholar]
  44. VPM. Resolution on Socio-Economic Development Orientation, National Defence and Security in the Mekong Delta of Vietnam Until 2030 with a Vision up to 2045; VPM: Hanoi, Vietnam, 2022. [Google Scholar]
  45. Tien, H.V.; Anh, N.T.; Nguyen, T.P.; Nhut, M.L.M. Ecological Engineering and Restoration of Eroded Muddy Coasts in South East Asia: Knowledge Gaps and Recommendations. Sustainability 2021, 13, 1248. [Google Scholar] [CrossRef]
  46. Minh, N.N.; Duong, D.V.; Tu, L.D.; San, D.C.; Truong, P.N.; Quyen, N.; Bang, T.; Wright, D.P.; Tamin, A.H.; Anh, D.T. Wave reduction efficiency for three classes of breakwaters on the coastal Mekong Delta. Appl. Ocean Res. 2022, 129, 103362. [Google Scholar] [CrossRef]
  47. San, D.C.; Duong, N.B.; Phong, N.C.; Tu, L.X.; Damien, P.V.B.; Guillou, S.; Dan, N.K. Numerical Study on Measures for Protecting the Go-Cong Coastlines (Vietnam) from Erosion. Water 2022, 14, 3850. [Google Scholar] [CrossRef]
  48. Winterwerp, J.C.; Borst, W.G.; De Vries, M.B. Pilot study on the erosion and rehabilitation of a mangrove mud coast. J. Coast. Res. 2005, 21, 223–230. [Google Scholar] [CrossRef]
  49. Winterwerp, J.C.; Erftemeijer, P.L.A.; Suryadiputra, N.; Van Eijk, P.; Zhang, L. Defining Eco-Morphodynamic Requirements for Rehabilitating Eroding Mangrove-Mud Coasts. Wetlands 2013, 33, 515–526. [Google Scholar] [CrossRef]
Figure 1. The location of the study site and the technical design of Tien Giang HTBs. (A) The location of Tien Giang Province in Vietnam (red color). (B) The 2022 EVI map, with the white dot indicating the study site and the two green dots indicating two sites outside the HTBs as the control sites. (C) The study profile with the Tien Giang HTB deployment and four random sites (green dots). (D) The technical design of Tien Giang HTB—Type A. (E) The technical design of HTB—Type B (adapted from previous studies in the area [12,13]). (See Table 2 for further information on technical design of Tien Giang HTBs and their length and types).
Life 15 00136 g001
Figure 2. Correlations between the different statistical methods EPR vs. LRR in the Tan Phu Dong district, Tien Giang Province, Vietnam.
Life 15 00136 g002
Figure 3. Vegetation cover changes at the study site between 2000 and 2022.
Life 15 00136 g003
Figure 4. The vegetation cover and EVI values at the Tan Phu Dong coast, Tien Giang Province, Vietnam between 2000 and 2022. The black arrow shows the location of the study site.
Life 15 00136 g004
Figure 5. The shoreline changes in Tan Phu Dong District, Tien Giang Province between 2000 and 2022. The left image shows the short-term change rates in meters per year (LRR values) during the above periods [33]. The graph indicates long-term net shoreline changes in meters (SCE and 371 NSM values) and short-term change rates in meters per year (LRR and EPR values).
Life 15 00136 g005
Figure 6. Natural growth of mangrove trees in the monitoring sites behind Tien Giang HTBs and two control sites. (16) Photos of the monitoring sites between Tien Giang HTBs and the shoreline, taken from the shore. (7,8) Photos of two control sites in the Dai river mouth areas, taken from the shore, showing the mangrove trees growing along the shore (see Figure 1, Figure 3 and Figure 6 for more information on the Tien Giang HTB deployment and the random and control sites). In the photo (1), (a) shows the 20 m space between two Tien Giang HTB sections; (b) indicates young Bruguiera trees growing behind HTBs. In the photo (2), (a) shows a 20 m space between two Tien Giang HTB sections; (b) is the fully grown Bruguiera trees behind HTBs along the shoreline. In the photos of 3,5–7, (b) shows a great number of young and fully grown trees of Sonneratia species, Avicennia sp, and Bruguiera species close to the shoreline and (c) are weeds (Cyperus stoloniferus) growing on clay soil. In the photo (4), (d) shows the sand accumulation along the shoreline. In the photo (8), (b) is fully grown trees of Sonneratia species, Avicennia sp., and Bruguiera species growing close to the shoreline and river mouth area, together with thick layers of weed species (Cyperus stoloniferus) growing on clay soil.
Life 15 00136 g006
Table 1. Satellite images were retrieved and analyzed in this study.
YearPathRowAcquisition DateSatellite ImageCloud CoverCloud Cover LandSpatial Resolution (m)
200012505327 September 2000Landsat-5 (TM)151330
200512505313 February 2005Landsat-5 (TM)1212
201012505327 February 2010Landsat-5 (TM)2023
20151250539 February 2015Landsat-8 (OLI)2.863.37
20201250536 January 2020Landsat-8 (OLI)2.282.18
202212505311 January 2022Landsat-8 (OLI)1.432.43
Table 2. Locations and types of Tien Giang HTBs in Tan Phu Dong District, Tien Giang Province.
SectionTypeGPS CoordinatesLength (m)
Start PointEnd Point
0 10°12′17.48″ N; 106°45′11.48″ E10°12′16.22″ N; 106°45′13.63″ E79
1BHTB—Type A10°12′16.23″ N; 106°45′13.84″ E10°12′18.59″ N; 106°45′17.20″ E127
2B10°12′18.87″ N; 106°45′17.82″ E10°12′21.38″ N; 106°45′21.48″ E136
3B10°12′21.74″ N; 106°45′22.04″ E10°12′24.24″ N; 106°45′25.73″ E135
4CHTB—Type B10°12′24.60″ N; 106°45′26.37″ E10°12′26.99″ N; 106°45′30.00″ E135
5C10°12′27.37″ N; 106°45′30.56″ E10°12′29.81″ N; 106°45′34.29″ E135
6C10°12′30.17″ N; 106°45′34.80″ E10°12′32.57″ N; 106°45′38.45″ E135
7C10°12′32.94″ N; 106°45′39.00″ E10°12′35.40″ N; 106°45′42.78″ E135
8C10°12′35.79″ N; 106°45′43.32″ E10°12′37.96″ N; 106°45′47.05″ E135
9C10°12′38.27″ N; 106°45′47.71″ E10°12′39.64″ N; 106°45′51.79″ E135
10C10°12′39.92″ N; 106°45′52.47″ E10°12′41.34″ N; 106°45′56.59″ E135
Table 3. Levels of vegetation cover and corresponding EVI values used in this study.
No.Levels of Vegetation CoverEVI Values
1Non-vegetation cover—Intertidal mudflats—NVC 1−1 < EVI ≤ 0
2Non-vegetation cover—Barren lands—NVC 20 < EVI ≤ 0.06
3Low vegetation cover—LVC0.06 < EVI ≤ 0.5
4Medium vegetation cover—MVC0.5 < EVI ≤ 1
5High vegetation cover—HVC1 < EVI ≤ 2.5
Table 4. Status of the monitoring sites as of May 2024.
Monitoring Sites
LocationMangrove ForestSeasonal InundationSediment AccumulationRemarks
The Monitoring Sites Behind the HTBs
1Bruguiera mature trees grew in clusters in seasonally inundated areas with fine-grained sediment
2Bruguiera mature trees grew in clusters in seasonally inundated areas with fine-grained sediment
3Bruguiera mature trees grew in clusters in seasonally inundated areas with fine-grained sediment
4Bruguiera mature trees grew in clusters in seasonally inundated areas with fine-grained sediment
The monitoring sites outside HTBs
5
Bruguiera Sonneratia and Avicennia mature trees grew in clusters in estuarine areas.
Coarse-grained sediment (mainly sand) found along the shore.
Weed species (Cyperus stoloniferus) growing on remnants of eroded area (mainly brown clay soil).
6
Bruguiera mature trees grew in clusters in seasonally inundated areas with fine-grained sediment
Coarse-grained sediment (mainly sand) found along the shore.
Weed species (Cyperus stoloniferus) growing on remnants of eroded area (mainly brown clay soil).
Disclaimer/Publisher’s Note: The statements, opinions and data contained in all publications are solely those of the individual author(s) and contributor(s) and not of MDPI and/or the editor(s). MDPI and/or the editor(s) disclaim responsibility for any injury to people or property resulting from any ideas, methods, instructions or products referred to in the content.

