
Prediction of Pregnancy-Associated Hypertension Using a Scoring System: A Multicenter Cohort Study
 , , , ,
Abstract
1. Introduction
2. Materials and Methods
2.1. Data Source
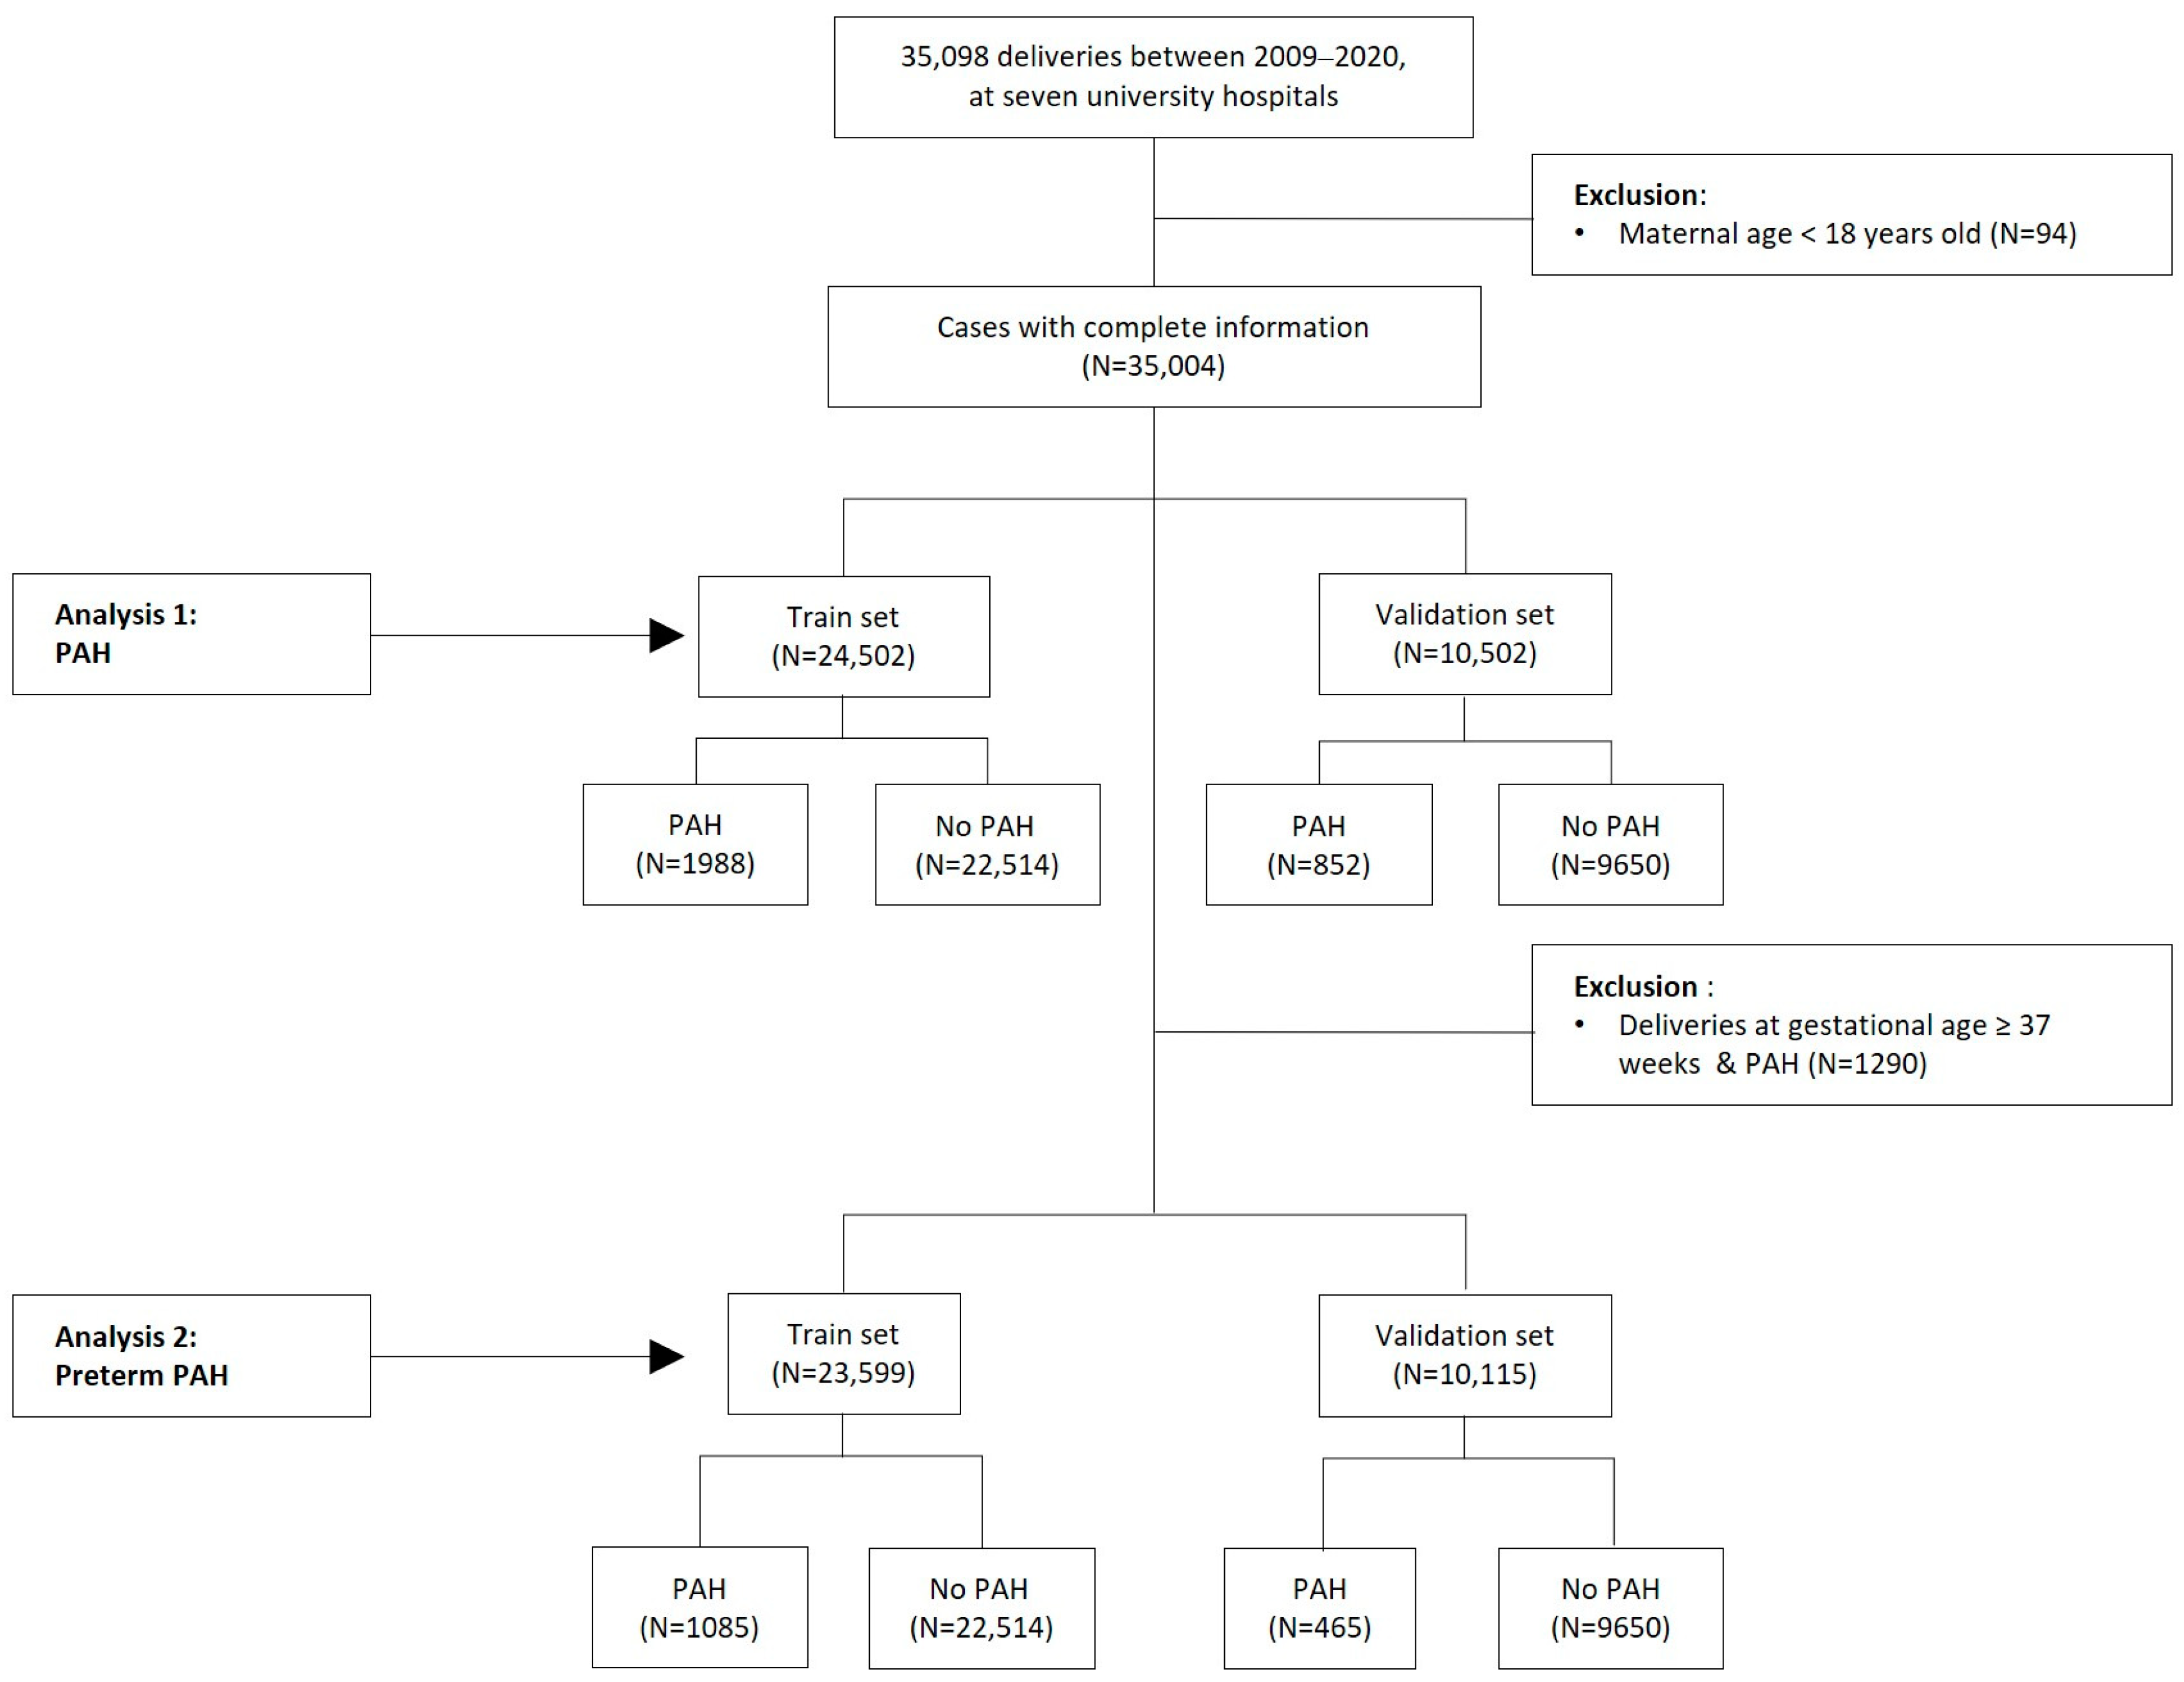
2.2. Study Design
2.3. Restricted Population
2.4. Datasets of Original and Restricted Populations
2.5. Statistics
3. Results
3.1. Baseline Characteristics
3.2. Identifying Risk Factors Using Univariate and Multivariate Logistic Regression Analyses
3.2.1. Univariate and Multivariate Logistic Regression Analyses of Risk Factors for PAH
- -
- A preliminary study in a population of patients from Korea
3.2.2. Univariate and Multivariate Logistic Regression Analyses of Risk Factors for Preterm PAH-Additional Analysis
3.2.3. Performance of Scoring Models for Predicting PAH and Preterm PAH in Total and Restricted Populations
3.2.4. Development of a Scoring System with Validation
4. Discussion
- -
- Limitations and strengths of this study
5. Conclusions
Author Contributions
Funding
Institutional Review Board Statement
Informed Consent Statement
Data Availability Statement
Acknowledgments
Conflicts of Interest
Appendix A

| PAH_R (N = 1862) | Preterm PAH_R (N = 1018) | Control (N = 22,174) | Analysis 1 p-Value | Analysis 2 p-Value | |
|---|---|---|---|---|---|
| Maternal age, years, mean ± SD | 33.16 ± 4.81 | 33.19 ± 4.71 | 32.71 ± 4.41 | <0.0001 | 0.0004 |
| Ethnicity | 0.1033 | 0.4466 | |||
| Korean | 1808 (97.10) | 990 (97.25) | 21,594 (97.38) | ||
| Northeast Asian | 25 (1.34) | 12 (1.18) | 220 (0.99) | ||
| Southwest Asian | 21 (1.13) | 11 (1.08) | 311 (1.40) | ||
| Uncertain | 8 (0.43) | 5 (0.49) | 49 (0.22) | ||
| Paternal age, years, mean ± SD | 35.66 ± 5.29 | 35.39 ± 5.04 | 35.32 ± 4.78 | 0.0226 | 0.7185 |
| Nulliparity, n (%) | 1140 (61.22) | 622 ± 61.10) | 11,622 (52.41) | <0.0001 | <0.0001 |
| IVF, n (%) | 103 (5.53) | 72 (7.07) | 914 (4.12) | 0.0037 | <0.0001 |
| Pre-pregnant BMI (kg/m2), mean ± SD | 24.44 ± 5.12 | 24.22 ± 4.80 | 21.54 ± 3.47 | <0.0001 | <0.0001 |
| Pre-pregnant BMI (kg/m2), n (%) | <0.0001 | <0.0001 | |||
| BMI < 25 kg/m2, n (%) | 1136 (61.61) | 634 (62.96) | 19,107 (86.51) | ||
| BMI ≥ 25 kg/m2, < 30 kg/m2, n (%) | 451 (24.46) | 256 (25.42) | 2331 (10.55) | ||
| BMI ≥ 30 kg/m2, n (%) | 257 (13.94) | 117 (11.62) | 648 (2.93) | ||
| Pre-pregnant smoking history, n (%) | 52 (2.79) | 20 (1.96) | 319 (1.44) | <0.0001 | 0.2585 |
| Pre-pregnant drinking history, n (%) | 22 (1.18) | 11 (1.08) | 128 (0.58) | 0.0061 | 0.0915 |
| Family history of hypertension, n (%) | 590 (31.69) | 318 (31.24) | 4214 (19.00) | <0.0001 | <0.0001 |
| Family history of diabetes, n (%) | 218 (11.71) | 123 (12.08) | 2601 (11.73) | 0.9773 | 0.4022 |
| History of a previous pregnancy | |||||
| Preterm birth, n (%) | 166 (8.92) | 105 (10.31) | 1267 (5.71) | <0.0001 | <0.0001 |
| Preeclampsia n (%) | 126 (6.77) | 69 (6.78) | 245 (1.10) | <0.0001 | <0.0001 |
| FDIU, n (%) | 16 (0.86) | 13 (1.28) | 135 (0.61) | <0.0001 | <0.0001 |
| GDM, n (%) | 39 (2.09) | 19 (1.87) | 340 (1.53) | <0.0001 | <0.0001 |
| FGR, n (%) | 52 (2.79) | 27 (2.65) | 400 (1.80) | <0.0001 | <0.0001 |
| Preexisting diseases | |||||
| Chronic hypertension, n (%) | 318 (17.08) | 158 (15.52) | 568 (2.56) | <0.0001 | <0.0001 |
| Diabetes, n (%) | 58 (3.11) | 27 (2.65) | 206 (0.93) | <0.0001 | <0.0001 |
| Renal disease, n (%) | 59 (3.17) | 41 (4.03) | 179 (0.81) | <0.0001 | <0.0001 |
| PCOS, n (%) | 33 (1.77) | 17 (1.67) | 499 (2.25) | 0.178 | 0.3324 |
| IGT, n (%) | 12 (0.64) | 9 (0.88) | 80 (0.36) | 0.0569 | 0.0077 |
| Hyperlipidemia, n (%) | 87 (4.67) | 37 (3.63) | 427 (1.93) | <0.0001 | 0.0003 |
| Lupus or APS, n (%) | 20 (1.07) | 12 (1.18) | 118 (0.53) | 0.0029 | 0.0143 |
| Rheumatic arthritis, n (%) | 24 (1.29) | 13 (1.28) | 440 (1.98) | 0.0362 | 0.1147 |
| Other rheumatic diseases, n (%) | 8 (0.43) | 2 (0.20) | 83 (0.37) | 0.7088 | 0.4425 |
| Aplastic anemia, n (%) | 10 (0.54) | 5 (0.49) | 87 (0.39) | 0.3442 | 0.8048 |
| Initial MAP (mmHg) 1, mean ± SD | 96.70 ± 15.38 | 98.34 ± 16.59 | 83.17 ± 9.63 | <0.0001 | <0.0001 |
| (n = 4586 women) | |||||
| PAPP-A (MoM) 2, mean ± SD | 1.12 ± 0.84 | 1.05 ± 0.79 | 1.21 ± 0.67 | 0.0019 | 0.007 |
| (n = 4593 women) | |||||
| Obstetric outcomes in this pregnancy | |||||
| Subgroups of PAH | |||||
| gestational hypertension, n (%) | 501 (26.91) | 184 (18.07) | |||
| preeclampsia, n (%) | 1073 (57.63) | 677 (66.50) | |||
| superimposed preeclampsia, n (%) | 173 (9.29) | 108 (10.61) | |||
| eclampsia, n (%) | 25 (1.34) | 21 (2.06) | |||
| unspecified maternal hypertension, n (%) | 90 (4.83) | 28 (2.75) | |||
| GDM, n (%) | 236 (12.67) | 110 (10.81) | 1656 (7.47) | <0.0001 | <0.0001 |
| Multiple pregnancy, n (%) | 155 (8.32) | 118 (11.59) | 1192 (5.38) | <0.0001 | <0.0001 |
| Cesarean section, n (%) | 1388 (74.54) | 877 (86.15) | 10,208 (46.04) | <0.0001 | <0.0001 |
| Gestational age at delivery (weeks), | 35.56 ± 3.52 | 33.41 ± 2.92 | 37.54 ± 3.32 | <0.0001 | <0.0001 |
| mean ± SD | |||||
| Delivery < 37 weeks, n (%) | 1030 (55.32) | 1018 (100.00) | 5145 (23.20) | <0.0001 | <0.0001 |
| Delivery < 34 weeks, n (%) | 465 (24.97) | 431 (42.34) | 2204 (9.94) | <0.0001 | <0.0001 |
| Neonatal birth weight (kg), mean ± SD | 2.36 ± 0.86 | 1.89 ± 0.68 | 2.90 ± 0.71 | <0.0001 | <0.0001 |
| SGA (birth weight < 10th percentile) | 570 (28.26) | 379 (33.36) | 1884 (8.06) | <0.0001 | <0.0001 |

| Univariate Analysis | Multivariate Analysis | |||||
|---|---|---|---|---|---|---|
| OR | 95% CI | p-Value | OR | 95% CI | p-Value | |
| Multiple pregnancy | 1.559 | (1.315–1.847) | <0.0001 | 4.096 | (2.013–8.335) | 0.0001 |
| Age, years | 1.029 | (1.019–1.040) | <0.0001 | |||
| Nulliparity | 1.458 | (1.327–1.602) | <0.0001 | |||
| IVF | 1.532 | (1.266–1.855) | <0.0001 | |||
| History of Preterm birth | 0.788 | (0.639–0.973) | 0.0265 | |||
| History of Preeclampsia | 8.753 | (7.078–10.825) | <0.0001 | 4.488 | (1.864–10.806) | 0.0008 |
| History of FDIU | 2.154 | (1.393–3.329) | 0.0006 | |||
| History of GDM | 1.551 | (1.114–2.159) | 0.0093 | |||
| History of FGR | 2.131 | (1.609–2.824) | <0.0001 | |||
| Pre-pregnant smoking history | 1.731 | (1.277–2.346) | 0.0004 | |||
| Pre-pregnant drinking history | 1.882 | (1.183–2.993) | 0.0076 | |||
| Pre-pregnant BMI | 1.161 | (1.150–1.173) | <0.0001 | 1.089 | (1.038–1.142) | 0.0005 |
| Family history of hypertension | 2.036 | (1.843–2.249) | <0.0001 | |||
| Preexisting aplastic anemia | 1.846 | (1.025–3.323) | 0.041 | |||
| Preexisting hypertension | 8.175 | (7.107–9.403) | <0.0001 | 3.522 | (2.119–5.853) | <0.0001 |
| Preexisting hyperlipidemia | 2.483 | (1.983–3.111) | <0.0001 | |||
| Preexisting diabetes | 3.289 | (2.460–4.398) | <0.0001 | |||
| Preexisting renal disease | 4.642 | (3.532–6.102) | <0.0001 | 2.645 | (1.138–6.147) | 0.0238 |
| Preexisting lupus or APS | 2.521 | (1.785–3.561) | <0.0001 | 3.995 | (1.703–9.375) | 0.0015 |
| Preexisting other rheumatic diseases | 2.172 | (1.400–3.368) | 0.0005 | |||
| MAP | 1.09 | (1.079–1.102) | <0.0001 | 1.055 | (1.036–1.075) | <0.0001 |
| PAPP-A | 0.418 | (0.290–0.603) | <0.0001 | 0.473 | (0.265–0.844) | 0.0113 |
| Univariate Analysis | Multivariate Analysis | |||||
|---|---|---|---|---|---|---|
| OR | 95% CI | p-Value | OR | 95% CI | p-Value | |
| Multiple pregnancy | 2.376 | (1.958–2.883) | <0.0001 | 6.267 | (2.369–16.578) | 0.0002 |
| Age, years | 1.028 | (1.014–1.042) | 0.0001 | |||
| Nulliparity | 1.348 | (1.191–1.527) | <0.0001 | |||
| IVF | 1.899 | (1.504–2.398) | <0.0001 | |||
| History of preterm birth | 0.639 | (0.496–0.824) | 0.0006 | |||
| History of preeclampsia | 7.975 | (6.078–10.464) | <0.0001 | |||
| History of FDIU | 2.346 | (1.370–4.017) | 0.0019 | |||
| History of GDM | 1.504 | (0.958–2.362) | 0.0761 | |||
| History of FGR | 2.118 | (1.480–3.033) | <0.0001 | |||
| Pre-pregnant smoking history | 1.265 | (0.793–2.017) | 0.3246 | |||
| Pre-pregnant drinking history | 1.276 | (0.594–2.744) | 0.5321 | |||
| Pre-pregnant BMI | 1.15 | (1.135–1.164) | <0.0001 | |||
| Family history of hypertension | 1.827 | (1.599–2.088) | <0.0001 | |||
| Preexisting aplastic anemia | 2.085 | (1.048–4.148) | 0.0363 | |||
| Preexisting hypertension | 7.194 | (6.006–8.616) | <0.0001 | 3.427 | (1.658–7.082) | 0.0009 |
| Preexisting hyperlipidemia | 2.059 | (1.502–2.823) | <0.0001 | |||
| Preexisting diabetes | 3.205 | (2.172–4.729) | <0.0001 | 6.145 | (2.026–18.633) | 0.0013 |
| Preexisting renal disease | 5.924 | (4.250–8.259) | <0.0001 | 5.299 | (1.938–14.489) | 0.0012 |
| Preexisting lupus or APS | 3.227 | (2.126–4.898) | <0.0001 | 8.227 | (2.994–22.605) | <0.0001 |
| Preexisting other rheumatic diseases | 2.27 | (1.304–3.954) | 0.0038 | |||
| MAP | 1.111 | (1.096–1.127) | <0.0001 | 1.081 | (1.056–1.105) | <0.0001 |
| PAPP-A | 0.366 | (0.204–0.658) | 0.0008 | 0.417 | (0.181–0.959) | 0.0395 |
References
- Ford, N.D.; Cox, S.; Ko, J.Y.; Ouyang, L.; Romero, L.; Colarusso, T.; Ferre, C.D.; Kroelinger, C.D.; Hayes, D.K.; Barfield, W.D. Hypertensive Disorders in Pregnancy and Mortality at Delivery Hospitalization—United States, 2017–2019. MMWR Morb. Mortal. Wkly. Rep. 2022, 71, 585–591. [Google Scholar] [CrossRef] [PubMed]
- Steegers, E.A.; von Dadelszen, P.; Duvekot, J.J.; Pijnenborg, R. Pre-eclampsia. Lancet 2010, 376, 631–644. [Google Scholar] [CrossRef] [PubMed]
- Askie, L.M.; Duley, L.; Henderson-Smart, D.J.; Stewart, L.A. Antiplatelet agents for prevention of pre-eclampsia: A meta-analysis of individual patient data. Lancet 2007, 369, 1791–1798. [Google Scholar] [CrossRef] [PubMed]
- Henderson, J.T.; Whitlock, E.P.; O’Connor, E.; Senger, C.A.; Thompson, J.H.; Rowland, M.G. Low-dose aspirin for prevention of morbidity and mortality from preeclampsia: A systematic evidence review for the U.S. Preventive Services Task Force. Ann. Intern. Med. 2014, 160, 695–703. [Google Scholar] [CrossRef]
- Roberge, S.; Bujold, E.; Nicolaides, K.H. Aspirin for the prevention of preterm and term preeclampsia: Systematic review and metaanalysis. Am. J. Obstet. Gynecol. 2018, 218, 287–293.e281. [Google Scholar] [CrossRef]
- ACOG Committee Opinion No. 743: Low-Dose Aspirin Use During Pregnancy. Obstet. Gynecol. 2018, 132, e44–e52. [CrossRef]
- National Institute for Health and Care Excellence: Guidelines. In Hypertension in Pregnancy: Diagnosis and Management; National Institute for Health and Care Excellence (NICE): London, UK, 2019.
- Rolnik, D.L.; Wright, D.; Poon, L.C.; O’Gorman, N.; Syngelaki, A.; de Paco Matallana, C.; Akolekar, R.; Cicero, S.; Janga, D.; Singh, M.; et al. Aspirin versus Placebo in Pregnancies at High Risk for Preterm Preeclampsia. N. Engl. J. Med. 2017, 377, 613–622. [Google Scholar] [CrossRef]
- Zeisler, H.; Llurba, E.; Chantraine, F.; Vatish, M.; Staff, A.C.; Sennström, M.; Olovsson, M.; Brennecke, S.P.; Stepan, H.; Allegranza, D.; et al. Predictive Value of the sFlt-1: PLGF Ratio in Women with Suspected Preeclampsia. N. Engl. J. Med. 2016, 374, 13–22. [Google Scholar] [CrossRef]
- Poon, L.C.; Shennan, A.; Hyett, J.A.; Kapur, A.; Hadar, E.; Divakar, H.; McAuliffe, F.; da Silva Costa, F.; von Dadelszen, P.; McIntyre, H.D.; et al. The International Federation of Gynecology and Obstetrics (FIGO) initiative on pre-eclampsia: A pragmatic guide for first-trimester screening and prevention. Int. J. Gynaecol. Obstet. 2019, 145 (Suppl. 1), 1. [Google Scholar] [CrossRef]
- Al-Rubaie, Z.; Askie, L.M.; Ray, J.G.; Hudson, H.M.; Lord, S.J. The performance of risk prediction models for pre-eclampsia using routinely collected maternal characteristics and comparison with models that include specialised tests and with clinical guideline decision rules: A systematic review. BJOG 2016, 123, 1441–1452. [Google Scholar] [CrossRef]
- Robbins, C.; Boulet, S.L.; Morgan, I.; D’Angelo, D.V.; Zapata, L.B.; Morrow, B.; Sharma, A.; Kroelinger, C.D. Disparities in Preconception Health Indicators—Behavioral Risk Factor Surveillance System, 2013–2015, and Pregnancy Risk Assessment Monitoring System, 2013–2014. MMWR Surveill. Summ. 2018, 67, 1. [Google Scholar] [CrossRef] [PubMed]
- Laopaiboon, M.; Lumbiganon, P.; Intarut, N.; Mori, R.; Ganchimeg, T.; Vogel, J.P.; Souza, J.P.; Gülmezoglu, A.M. Advanced maternal age and pregnancy outcomes: A multicountry assessment. BJOG 2014, 121 (Suppl. 1), 49–56. [Google Scholar] [CrossRef]
- Waldenström, U. Postponing parenthood to advanced age. Upsala J. Med. Sci. 2016, 121, 235–243. [Google Scholar] [CrossRef] [PubMed]
- Gestational Hypertension and Preeclampsia: ACOG Practice Bulletin Summary, Number 222. Obstet. Gynecol. 2020, 135, 1492–1495. [CrossRef]
- Kim, H.C.; Lee, H.; Lee, H.H.; Seo, E.; Kim, E.; Han, J.; Kwon, J.Y. Korean Society of Hypertension (KSH)–Hypertension Epidemiology Research Working Group. Korea hypertension fact sheet 2021: Analysis of nationwide population-based data with special focus on hypertension in women. Clin. Hypertens. 2022, 28, 1. [Google Scholar] [CrossRef]
- Vandorsten, J.P.; Dodson, W.C.; Espeland, M.A.; Grobman, W.A.; Guise, J.M.; Mercer, B.M.; Minkoff, H.L.; Poindexter, B.; Prosser, L.A.; Sawaya, G.F.; et al. NIH consensus development conference: Diagnosing gestational diabetes mellitus. NIH Consens. State Sci. 2013, 29, 1–31. [Google Scholar]
- ACOG Practice Bulletin No. 190: Gestational Diabetes Mellitus. Obstet. Gynecol. 2018, 131, e49–e64. [CrossRef]
- Phumsiripaiboon, P.; Suksai, M.; Suntharasaj, T.; Geater, A. Screening for pre-eclampsia: Performance of National Institute for Health and Care Excellence guidelines versus American College of Obstetricians and Gynecologists recommendations. J. Obstet. Gynaecol. Res. 2020, 46, 2323–2331. [Google Scholar] [CrossRef]
- Statistics Korea. Birth Statistics in 2021. Available online: https://kostat.go.kr/board.es?mid=a10301020300&bid=204&act=view&list_no=419974 (accessed on 19 March 2023).
- Ko, H.S.; Wie, J.H.; Choi, S.K.; Park, I.Y.; Park, Y.G.; Shin, J.C. Multiple birth rates of Korea and fetal/neonatal/infant mortality in multiple gestation. PLoS ONE 2018, 13, e0202318. [Google Scholar] [CrossRef]
- Kim, H.Y.; Lee, D.; Kim, J.; Noh, E.; Ahn, K.H.; Hong, S.C.; Kim, H.J.; Oh, M.J.; Cho, G.J. Secular trends in cesarean sections and risk factors in South Korea (2006–2015). Obstet. Gynecol. Sci. 2020, 63, 440–447. [Google Scholar] [CrossRef]
- Whelton, P.K.; Carey, R.M.; Aronow, W.S.; Casey, D.E., Jr.; Collins, K.J.; Dennison Himmelfarb, C.; DePalma, S.M.; Gidding, S.; Jamerson, K.A.; Jones, D.W.; et al. 2017 ACC/AHA/AAPA/ABC/ACPM/AGS/APhA/ASH/ASPC/NMA/PCNA Guideline for the Prevention, Detection, Evaluation, and Management of High Blood Pressure in Adults: Executive Summary: A Report of the American College of Cardiology/American Heart Association Task Force on Clinical Practice Guidelines. Hypertension 2018, 71, 1269–1324. [Google Scholar] [CrossRef] [PubMed]
- Sutton, E.F.; Hauspurg, A.; Caritis, S.N.; Powers, R.W.; Catov, J.M. Maternal Outcomes Associated with Lower Range Stage 1 Hypertension. Obstet. Gynecol. 2018, 132, 843–849. [Google Scholar] [CrossRef]
- Hauspurg, A.; Parry, S.; Mercer, B.M.; Grobman, W.; Hatfield, T.; Silver, R.M.; Parker, C.B.; Haas, D.M.; Iams, J.D.; Saade, G.R.; et al. Blood pressure trajectory and category and risk of hypertensive disorders of pregnancy in nulliparous women. Am. J. Obstet. Gynecol. 2019, 221, 277.e271–277.e278. [Google Scholar] [CrossRef] [PubMed]
- Greenberg, V.R.; Silasi, M.; Lundsberg, L.S.; Culhane, J.F.; Reddy, U.M.; Partridge, C.; Lipkind, H.S. Perinatal outcomes in women with elevated blood pressure and stage 1 hypertension. Am. J. Obstet. Gynecol. 2021, 224, e521.e1–e521.e11. [Google Scholar] [CrossRef]
- Tita, A.T.; Szychowski, J.M.; Boggess, K.; Dugoff, L.; Sibai, B.; Lawrence, K.; Hughes, B.L.; Bell, J.; Aagaard, K.; Edwards, R.K.; et al. Treatment for Mild Chronic Hypertension during Pregnancy. N. Engl. J. Med. 2022, 386, 1781–1792. [Google Scholar] [CrossRef]
- Society for Maternal-Fetal Medicine Statement: Antihypertensive therapy for mild chronic hypertension in pregnancy-The Chronic Hypertension and Pregnancy trial. Am. J. Obstet. Gynecol. 2022, 227, B24–B27. [CrossRef] [PubMed]
- Park, Y.; Cho, G.J.; Kim, L.Y.; Lee, T.S.; Oh, M.J.; Kim, Y.H. Preeclampsia Increases the Incidence of Postpartum Cerebrovascular Disease in Korean Population. J. Korean Med. Sci. 2018, 33, e35. [Google Scholar] [CrossRef]
- Burger, R.J.; Delagrange, H.; van Valkengoed, I.G.M.; de Groot, C.J.M.; van den Born, B.H.; Gordijn, S.J.; Ganzevoort, W. Hypertensive Disorders of Pregnancy and Cardiovascular Disease Risk Across Races and Ethnicities: A Review. Front. Cardiovasc. Med. 2022, 9, 933822. [Google Scholar] [CrossRef] [PubMed]
- Committee Opinion No. 640: Cell-Free DNA Screening for Fetal Aneuploidy. Obstet. Gynecol. 2015, 126, e31–e37. [CrossRef]
- Choe, S.A.; Lee, S.M.; Han, Y.J.; Kim, M.H.; Shim, J.Y.; Lee, M.Y.; Oh, S.Y.; Lee, J.H.; Kim, S.H.; Cha, D.H.; et al. Chromosomal Abnormality, fetal/neonatal Death and Socioeconomic Status: A Prospective Cohort Study. Matern. Child Health J. 2023, 27, 111–116. [Google Scholar] [CrossRef]
- Chaemsaithong, P.; Pooh, R.K.; Zheng, M.; Ma, R.; Chaiyasit, N.; Tokunaka, M.; Shaw, S.W.; Seshadri, S.; Choolani, M.; Wataganara, T.; et al. Prospective evaluation of screening performance of first-trimester prediction models for preterm preeclampsia in an Asian population. Am. J. Obstet. Gynecol. 2019, 221, 650.e1–650.e16. [Google Scholar] [CrossRef]
- O’Gorman, N.; Wright, D.; Syngelaki, A.; Akolekar, R.; Wright, A.; Poon, L.C.; Nicolaides, K.H. Competing risks model in screening for preeclampsia by maternal factors and biomarkers at 11–13 weeks gestation. Am. J. Obstet. Gynecol. 2016, 214, 103.e101–103.e112. [Google Scholar] [CrossRef]
- World Health Organization. Regional Office for the Western, P. In the Asia-Pacific Perspective: Redefining Obesity and Its Treatment; Health Communications Australia: Sydney, Australia, 2000. [Google Scholar]
- Jim, B.; Karumanchi, S.A. Preeclampsia: Pathogenesis, Prevention, and Long-Term Complications. Semin. Nephrol. 2017, 37, 386–397. [Google Scholar] [CrossRef] [PubMed]
- Tan, K.C. Appropriate body-mass index for Asian populations and its implications for policy and intervention strategies. Lancet 2004, 363, 157–163. [Google Scholar] [CrossRef]
- Committee of Clinical Practice Guidelines Korean Society for the Study of Obesity. Clinical Practice Guidelines for Obesity 2022; Korean Society for the Study of Obesity: Seoul, Republic of Korea, 2022. [Google Scholar]
- Cho, G.J.; Kim, H.Y.; Park, J.H.; Ahn, K.H.; Hong, S.C.; Kim, H.J.; Han, S.W.; Oh, M.J. Prepregnancy Factors Are Associated with Development of Hypertension Later in Life in Women with Pre-Eclampsia. J. Womens Health 2019, 28, 984–989. [Google Scholar] [CrossRef] [PubMed]
- Nahum Sacks, K.; Friger, M.; Shoham-Vardi, I.; Spiegel, E.; Sergienko, R.; Landau, D.; Sheiner, E. Prenatal exposure to preeclampsia as an independent risk factor for long-term cardiovascular morbidity of the offspring. Pregnancy Hypertens. 2018, 13, 181–186. [Google Scholar] [CrossRef]
- Yang, L.; Huang, C.; Zhao, M.; Lee, P.M.Y.; Zhang, C.; Yu, Y.; Xi, B.; Li, J. Maternal hypertensive disorders during pregnancy and the risk of offspring diabetes mellitus in childhood, adolescence, and early adulthood: A nationwide population-based cohort study. BMC Med. 2023, 21, 59. [Google Scholar] [CrossRef]
- Lee, S.M.; Nam, Y.; Choi, E.S.; Jung, Y.M.; Sriram, V.; Leiby, J.S.; Koo, J.N.; Oh, I.H.; Kim, B.J.; Kim, S.M.; et al. Development of early prediction model for pregnancy-associated hypertension with graph-based semi-supervised learning. Sci. Rep. 2022, 12, 15793. [Google Scholar] [CrossRef]


| PAH (N = 1988) | Preterm PAH (N = 1085) | Control (N = 22,514) | Analysis 1 p-Value | Analysis 2 p-Value | |
|---|---|---|---|---|---|
| Maternal age, years, mean ± SD | 33.30 ± 4.84 | 33.26 ± 4.68 | 32.74 ± 4.42 | <0.0001 | <0.0001 |
| Ethnicity | 0.4778 | 0.3666 | |||
| Korean | 1935 (97.33) | 1053 (97.05) | 21,937 (97.44) | ||
| Northeast Asian | 20 (1.01) | 15 (1.38) | 217 (0.96) | ||
| Southwest Asian | 23 (1.16) | 12 (1.11) | 291 (1.29) | ||
| Uncertain | 10 (0.50) | 5 (0.46) | 69 (0.31) | ||
| Paternal age, years, mean ± SD | 35.73 ± 5.09 | 35.48 ± 5.06 | 35.37 ± 4.81 | 0.004 | 0.3477 |
| Nulliparity, n (%) | 1219 (61.32) | 646 (59.54) | 11,726 (52.08) | <0.0001 | <0.0001 |
| IVF, n (%) | 127 (6.39) | 83 (7.65) | 960 (4.26) | <0.0001 | <0.0001 |
| Pre-pregnant BMI (kg/m2), mean ± SD | 24.36 ± 5.10 | 24.12 ± 4.87 | 21.55 ± 3.49 | <0.0001 | <0.0001 |
| Pre-pregnant BMI (kg/m2), n (%) | <0.0001 | <0.0001 | |||
| BMI < 25 kg/m2, n (%) | 1237 (62.70) | 695 (64.47) | 19,403 (86.49) | ||
| BMI ≥ 25 kg/m2, < 30 kg/m2, n (%) | 465 (23.57) | 258 (23.93) | 2344 (10.45) | ||
| BMI ≥ 30 kg/m2, n (%) | 271 (13.74) | 125 (11.60) | 686 (3.06) | ||
| Pre-pregnant smoking history, n (%) | 49 (2.46) | 19 (1.75) | 324 (1.44) | 0.0009 | 0.5782 |
| Pre-pregnant drinking history, n (%) | 21 (1.06) | 7 (0.65) | 127 (0.56) | 0.0092 | 0.8186 |
| Family history of hypertension, n (%) | 644 (32.39) | 330 (30.41) | 4289 (19.05) | <0.0001 | <0.0001 |
| Family history of diabetes, n (%) | 259 (13.03) | 136 (12.53) | 2626 (11.66) | 0.0704 | 0.3354 |
| History of a previous pregnancy | |||||
| Preterm birth, n (%) | 195 (9.81) | 130 (11.98) | 1348 (5.99) | <0.0001 | <0.0001 |
| Preeclampsia n (%) | 151 (7.60) | 78 (7.19) | 293 (1.30) | <0.0001 | <0.0001 |
| FDIU, n (%) | 24 (1.21) | 15 (1.38) | 159 (0.71) | <0.0001 | <0.0001 |
| GDM, n (%) | 41 (2.06) | 21 (1.94) | 378 (1.68) | <0.0001 | <0.0001 |
| FGR, n (%) | 60 (3.02) | 35 (3.23) | 412 (1.83) | <0.0001 | <0.0001 |
| Preexisting diseases | |||||
| Chronic hypertension, n (%) | 362 (18.21) | 177 (16.31) | 597 (2.65) | <0.0001 | <0.0001 |
| Diabetes, n (%) | 60 (3.02) | 30 (2.76) | 211 (0.94) | <0.0001 | <0.0001 |
| Renal disease, n (%) | 74 (3.72) | 46 (4.24) | 186 (0.83) | <0.0001 | <0.0001 |
| PCOS, n (%) | 40 (2.01) | 15 (1.38) | 487 (2.16) | 0.6564 | 0.0735 |
| IGT, n (%) | 14 (0.70) | 8 (0.74) | 81 (0.36) | 0.0178 | 0.0795 |
| Hyperlipidemia, n (%) | 96 (4.83) | 44 (4.06) | 451 (2.00) | <0.0001 | <0.0001 |
| Lupus or APS, n (%) | 40 (2.01) | 26 (2.40) | 182 (0.81) | <0.0001 | <0.0001 |
| Rheumatic arthritis, n (%) | 31 (1.56) | 13 (1.20) | 447 (1.99) | 0.1879 | 0.0393 |
| Other rheumatic diseases, n (%) | 24 (1.21) | 14 (1.29) | 126 (0.56) | 0.0004 | 0.0029 |
| Aplastic anemia, n (%) | 13 (0.65) | 9 (0.83) | 80 (0.36) | 0.038 | 0.0479 |
| Initial MAP (mmHg) 1, mean ± SD | 95.40 ± 14.44 | 100.21 ± 17.44 | 83.36 ± 9.73 | <0.0001 | <0.0001 |
| (n = 4822 women) | |||||
| PAPP-A (MoM) 2, mean ± SD | 1.04 ± 0.69 | 1.04 ± 0.71 | 1.19 ± 0.66 | <0.0001 | 0.0044 |
| (n = 4748 women) | |||||
| Obstetric outcomes in this pregnancy | |||||
| Subgroups of PAH | |||||
| gestational hypertension, n (%) | 523 (26.31) | 176 (16.22) | |||
| preeclampsia, n (%) | 1244 (62.57) | 770 (70.97) | |||
| superimposed preeclampsia, n (%) | 199 (10.01) | 120 (11.06) | |||
| eclampsia, n (%) | 22 (1.11) | 19 (1.75) | |||
| unspecified maternal hypertension, n (%) | 105 (5.28) | 45 (4.15) | |||
| GDM, n (%) | 262 (13.18) | 112 (10.32) | 1693 (7.52) | <0.0001 | 0.0005 |
| Multiple pregnancy, n (%) | 164 (8.25) | 128 (11.80) | 1228 (5.45) | <0.0001 | <0.0001 |
| Cesarean section, n (%) | 1465 (73.69) | 933 (85.99) | 10,404 (46.21) | <0.0001 | <0.0001 |
| Gestational age at delivery (weeks), | 35.57 ± 3.51 | 33.33 ± 3.05 | 37.56 ± 3.30 | <0.0001 | <0.0001 |
| mean ± SD | |||||
| Delivery < 37 weeks, n (%) | 1106 (55.63) | 1085 (100.00) | 5193 (23.07) | <0.0001 | <0.0001 |
| Delivery < 34 weeks, n (%) | 484 (24.35) | 476 (43.87) | 2198 (9.76) | <0.0001 | <0.0001 |
| Neonatal birth weight (kg), mean ± SD | 2.37 ± 0.86 | 1.86 ± 0.68 | 2.90 ± 0.71 | <0.0001 | <0.0001 |
| SGA (birth weight < 10th percentile) | 583 (27.09) | 418 (34.46) | 1967 (8.28) | <0.0001 | <0.0001 |
| Univariate Analysis | Multivariate Analysis | |||||
|---|---|---|---|---|---|---|
| OR | 95% CI | p-Value | OR | 95% CI | p-Value | |
| Multiple pregnancy | 1.559 | (1.315–1.847) | <0.0001 | 1.515 | (1.267–1.813) | <0.0001 |
| Age, years | 1.029 | (1.019–1.040) | <0.0001 | 1.023 | (1.011–1.034) | 0.0001 |
| Nulliparity | 1.765 | (1.597–1.952) | <0.0001 | 2.017 | (1.809–2.249) | <0.0001 |
| IVF | 1.532 | (1.266–1.855) | <0.0001 | |||
| History of preterm birth | 0.788 | (0.639–0.973) | 0.0265 | |||
| History of preeclampsia | 8.753 | (7.078–10.825) | <0.0001 | 3.654 | (2.843–4.697) | <0.0001 |
| History of FDIU | 2.154 | (1.393–3.329) | 0.0006 | |||
| History of GDM | 1.551 | (1.114–2.159) | 0.0093 | |||
| History of FGR | 2.131 | (1.609–2.824) | <0.0001 | |||
| Pre-pregnant smoking history | 1.731 | (1.277–2.346) | 0.0004 | |||
| Pre-pregnant drinking history | 1.882 | (1.183–2.993) | 0.0076 | 2.019 | (1.222–3.334) | 0.0061 |
| Pre-pregnant BMI | 1.161 | (1.150–1.173) | <0.0001 | 1.143 | (1.131–1.155) | <0.0001 |
| Family history of hypertension | 2.036 | (1.843–2.249) | <0.0001 | 1.645 | (1.476–1.834) | <0.0001 |
| Preexisting aplastic anemia | 1.846 | (1.025–3.323) | 0.041 | |||
| Preexisting hypertension | 8.175 | (7.107–9.403) | <0.0001 | 4.41 | (3.748–5.188) | <0.0001 |
| Preexisting hyperlipidemia | 2.483 | (1.983–3.111) | <0.0001 | |||
| Preexisting diabetes | 3.289 | (2.460–4.398) | <0.0001 | 1.572 | (1.119–2.208) | 0.0092 |
| Preexisting renal disease | 4.642 | (3.532–6.102) | <0.0001 | 2.137 | (1.542–2.961) | <0.0001 |
| Preexisting lupus or APS | 2.521 | (1.785–3.561) | <0.0001 | 1.722 | (1.154–2.571) | 0.0078 |
| Preexisting other rheumatic diseases | 2.172 | (1.400–3.368) | 0.0005 | |||
| Univariate Analysis | Multivariate Analysis | |||||
|---|---|---|---|---|---|---|
| OR | 95% CI | p-Value | OR | 95% CI | p-Value | |
| Multiple pregnancy | 1.559 | (1.315–1.847) | <0.0001 | 2.052 | (1.342–3.138) | 0.0009 |
| Age, years | 1.029 | (1.019–1.040) | <0.0001 | |||
| Nulliparity | 1.765 | (1.597–1.952) | <0.0001 | 1.958 | (1.430–2.681) | <0.0001 |
| IVF | 1.532 | (1.266–1.855) | <0.0001 | |||
| History of preterm birth | 0.788 | (0.639–0.973) | 0.0265 | |||
| History of preeclampsia | 8.753 | (7.078–10.825) | <0.0001 | 3.788 | (2.017–7.111) | <0.0001 |
| History of FDIU | 2.154 | (1.393–3.329) | 0.0006 | |||
| History of GDM | 1.551 | (1.114–2.159) | 0.0093 | |||
| History of FGR | 2.131 | (1.609–2.824) | <0.0001 | |||
| Pre-pregnant smoking history | 1.731 | (1.277–2.346) | 0.0004 | |||
| Pre-pregnant drinking history | 1.882 | (1.183–2.993) | 0.0076 | |||
| Pre-pregnant BMI | 1.161 | (1.150–1.173) | <0.0001 | 1.067 | (1.036–1.100) | <0.0001 |
| Family history of hypertension | 2.036 | (1.843–2.249) | <0.0001 | |||
| Preexisting aplastic anemia | 1.846 | (1.025–3.323) | 0.041 | |||
| Preexisting hypertension | 8.175 | (7.107–9.403) | <0.0001 | 3.498 | (2.420–5.056) | <0.0001 |
| Preexisting hyperlipidemia | 2.483 | (1.983–3.111) | <0.0001 | |||
| Preexisting diabetes | 3.289 | (2.460–4.398) | <0.0001 | 2 | (1.096–3.648) | 0.0238 |
| Preexisting renal disease | 4.642 | (3.532–6.102) | <0.0001 | 2.119 | (1.108–4.050) | 0.0231 |
| Preexisting lupus or APS | 2.521 | (1.785–3.561) | <0.0001 | 3.624 | (1.901–6.908) | <0.0001 |
| Preexisting other rheumatic diseases | 2.172 | (1.400–3.368) | 0.0005 | |||
| MAP | 1.09 | (1.079–1.102) | <0.0001 | 1.066 | (1.054–1.079) | <0.0001 |
| Univariate Analysis | Multivariate Analysis | |||||
|---|---|---|---|---|---|---|
| OR | 95% CI | p-Value | OR | 95% CI | p-Value | |
| Multiple pregnancy | 1.598 | (1.342–1.903) | <0.0001 | 2.328 | (1.901–2.851) | <0.0001 |
| Age, years | 1.023 | (1.012–1.034) | <0.0001 | 1.017 | (1.002–1.032) | 0.0279 |
| Nulliparity | 1.696 | (1.531–1.880) | <0.0001 | 1.749 | (1.519–2.013) | <0.0001 |
| IVF | 1.363 | (1.105–1.680) | 0.0038 | |||
| History of preterm birth | 0.741 | (0.598–0.918) | 0.0062 | |||
| History of preeclampsia | 8.901 | (7.071–11.204) | <0.0001 | 3.275 | (2.385–4.498) | <0.0001 |
| History of FDIU | 1.75 | (1.037–2.955) | 0.0361 | |||
| History of GDM | 1.716 | (1.221–2.411) | 0.0019 | |||
| History of FGR | 1.97 | (1.460–2.657) | <0.0001 | |||
| Pre-pregnant smoking history | 1.968 | (1.463–2.649) | <0.0001 | |||
| Pre-pregnant drinking history | 2.06 | (1.307–3.246) | 0.0018 | |||
| Pre-pregnant BMI | 1.166 | (1.154–1.178) | <0.0001 | 1.137 | (1.122–1.153) | <0.0001 |
| Family history of hypertension | 1.977 | (1.783–2.192) | <0.0001 | 1.536 | (1.334–1.769) | <0.0001 |
| Preexisting aplastic anemia | 1.372 | (0.712–2.644) | 0.3448 | |||
| Preexisting hypertension | 7.835 | (6.767–9.073) | <0.0001 | 3.937 | (3.186–4.865) | <0.0001 |
| Preexisting hyperlipidemia | 2.498 | (1.974–3.161) | <0.0001 | |||
| Preexisting diabetes | 3.429 | (2.552–4.606) | <0.0001 | 1.625 | (1.049–2.518) | 0.0298 |
| Preexisting renal disease | 4.021 | (2.984–5.418) | <0.0001 | 2.744 | (1.855–4.058) | <0.0001 |
| Preexisting lupus or APS | 2.03 | (1.261–3.268) | 0.0036 | 2.108 | (1.311–3.389) | 0.0021 |
| Preexisting other rheumatic diseases | 1.148 | (0.555–2.376) | 0.709 | |||
| Univariate Analysis | Multivariate Analysis | |||||
|---|---|---|---|---|---|---|
| OR | 95% CI | p-Value | OR | 95% CI | p-Value | |
| Multiple pregnancy | 2.376 | (1.958–2.883) | <0.0001 | 3.381 | (1.950–5.860) | <0.0001 |
| Age, years | 1.028 | (1.014–1.042) | 0.0001 | |||
| Nulliparity | 1.597 | (1.400–1.821) | <0.0001 | |||
| IVF | 1.899 | (1.504–2.398) | <0.0001 | |||
| History of preterm birth | 0.639 | (0.496–0.824) | 0.0006 | |||
| History of preeclampsia | 7.975 | (6.078–10.464) | <0.0001 | |||
| History of FDIU | 2.346 | (1.370–4.017) | 0.0019 | |||
| History of GDM | 1.504 | (0.958–2.362) | 0.0761 | |||
| History of FGR | 2.118 | (1.480–3.033) | <0.0001 | |||
| Pre-pregnant smoking history | 1.265 | (0.793–2.017) | 0.3246 | |||
| Pre-pregnant drinking history | 1.276 | (0.594–2.744) | 0.5321 | |||
| Pre-pregnant BMI | 1.15 | (1.135–1.164) | <0.0001 | 1.079 | (1.038–1.122) | 0.0001 |
| Family history of hypertension | 1.827 | (1.599–2.088) | <0.0001 | |||
| Preexisting aplastic anemia | 2.085 | (1.048–4.148) | 0.0363 | |||
| Preexisting hypertension | 7.194 | (6.006–8.616) | <0.0001 | 3.678 | (2.250–6.014) | <0.0001 |
| Preexisting hyperlipidemia | 2.059 | (1.502–2.823) | <0.0001 | |||
| Preexisting diabetes | 3.205 | (2.172–4.729) | <0.0001 | 2.846 | (1.336–6.062) | 0.0067 |
| Preexisting renal disease | 5.924 | (4.250–8.259) | <0.0001 | 3.91 | (1.834–8.336) | 0.0004 |
| Preexisting lupus or APS | 3.227 | (2.126–4.898) | <0.0001 | 6.553 | (2.898–14.818) | <0.0001 |
| Preexisting other rheumatic diseases | 2.27 | (1.304–3.954) | 0.0038 | |||
| MAP | 1.111 | (1.096–1.127) | <0.0001 | 1.083 | (1.067–1.100) | <0.0001 |
| N | AIC | AUC | 95% CI of AUC | Sensitivity for 10% FPR | FPR 95% CI | |
|---|---|---|---|---|---|---|
| Prediction of PAH (total population, N = 24,502) | ||||||
| Maternal factors by ACOG | 24,406 | 12,850.122 | 0.665 | (0.6522–0.6779) | 31 | (28.98–33.06) |
| Maternal factors by model 1 | 24,406 | 12,015.507 | 0.7504 | (0.7386–0.7621) | 41 | (38.78–43.12) |
| Maternal factors by model 2 | 4817 | 1762.618 | 0.8227 | (0.7963–0.8490) | 54.8 | (49.09–60.50) |
| Maternal factors by model 3 | 2253 | 782.326 | 0.8313 | (0.7938–0.8688) | 53.8 | (45.28–62.42) |
| Prediction of PAH_R (restricted population 1, N = 24,036) | ||||||
| Maternal factors by ACOG | 23,930 | 12,231.051 | 0.6582 | (0.6450–0.6715) | 29.4 | (27.31–31.47) |
| Maternal factors by model 1 | 23,930 | 11,419.799 | 0.748 | (0.7358–0.7603) | 41.5 | (39.24–43.73) |
| Maternal factors by model 2 | 4581 | 1446.519 | 0.8219 | (0.7915–0.8522) | 52.2 | (45.73–58.58) |
| Maternal factors by model 3 | 4581 | 1447.89 | 0.8223 | (0.7921–0.8524) | 50.4 | (44.00–56.86) |
| Prediction of preterm PAH (total population, N = 23,599) | ||||||
| Maternal factors by ACOG | 23,502 | 8287.182 | 0.6534 | (0.6357–0.6711) | 32.4 | (29.58–35.17) |
| Maternal factors by model 1 | 23,502 | 7859.837 | 0.7449 | (0.7290–0.7607) | 38.9 | (35.96–41.78) |
| Maternal factors by model 2 | 4648 | 936.453 | 0.8764 | (0.8444–0.9084) | 66.4 | (58.78–74.10) |
| Maternal factors by model 3 | 2227 | 398.474 | 0.859 | (0.8038–0.9141) | 60.3 | (47.76–72.93) |
| Prediction of preterm PAH_R (restricted population 1, N = 23,193) | ||||||
| Maternal factors by ACOG | 23,100 | 7846.415 | 0.6577 | (0.6399–0.6755) | 30.9 | 28.03–33.74 |
| Maternal factors by model 1 | 23,100 | 7410.101 | 0.7513 | (0.7351–0.7675) | 41.5 | 38.47–44.55 |
| Maternal factors by model 2 | 4436 | 754.51 | 0.7851 | (0.8385–0.9116) | 65.5 | 56.57–74.34 |
| Maternal factors by model 3 | 2129 | 330.176 | 0.8397 | (0.7738–0.9056) | 58.1 | 43.39–72.88 |
Disclaimer/Publisher’s Note: The statements, opinions and data contained in all publications are solely those of the individual author(s) and contributor(s) and not of MDPI and/or the editor(s). MDPI and/or the editor(s) disclaim responsibility for any injury to people or property resulting from any ideas, methods, instructions or products referred to in the content. |
© 2023 by the authors. Licensee MDPI, Basel, Switzerland. This article is an open access article distributed under the terms and conditions of the Creative Commons Attribution (CC BY) license (https://creativecommons.org/licenses/by/4.0/).
Share and Cite
Jo, Y.S.; Kim, W.J.; Choi, S.K.; Kim, S.M.; Shin, J.E.; Kil, K.C.; Kim, Y.H.; Wie, J.H.; Kim, H.W.; Hong, S.; et al. Prediction of Pregnancy-Associated Hypertension Using a Scoring System: A Multicenter Cohort Study. Life 2023, 13, 1330. https://doi.org/10.3390/life13061330
Jo YS, Kim WJ, Choi SK, Kim SM, Shin JE, Kil KC, Kim YH, Wie JH, Kim HW, Hong S, et al. Prediction of Pregnancy-Associated Hypertension Using a Scoring System: A Multicenter Cohort Study. Life. 2023; 13(6):1330. https://doi.org/10.3390/life13061330
Chicago/Turabian StyleJo, Yun Sung, Woo Jeng Kim, Sae Kyung Choi, Su Mi Kim, Jae Eun Shin, Ki Cheol Kil, Yeon Hee Kim, Jeong Ha Wie, Han Wool Kim, Subeen Hong, and et al. 2023. "Prediction of Pregnancy-Associated Hypertension Using a Scoring System: A Multicenter Cohort Study" Life 13, no. 6: 1330. https://doi.org/10.3390/life13061330
APA StyleJo, Y. S., Kim, W. J., Choi, S. K., Kim, S. M., Shin, J. E., Kil, K. C., Kim, Y. H., Wie, J. H., Kim, H. W., Hong, S., & Ko, H. S. (2023). Prediction of Pregnancy-Associated Hypertension Using a Scoring System: A Multicenter Cohort Study. Life, 13(6), 1330. https://doi.org/10.3390/life13061330