
OCTA and Doppler Ultrasound in Primary Open-Angle Glaucoma and Normal-Tension Glaucoma


Abstract
1. Introduction
2. Materials and Methods
3. Results
4. Discussion
5. Conclusions
Author Contributions
Funding
Institutional Review Board Statement
Informed Consent Statement
Data Availability Statement
Conflicts of Interest
References
- Morgan, J.E.; Uchida, H.; Caprioli, J. Retinal ganglion cell death in experimental glaucoma. Br. J. Ophthalmol. 2000, 84, 303–310. [Google Scholar] [CrossRef]
- Naskar, R.; Wissing, M.; Thanos, S. Detection of Early Neuron Degeneration and Accompanying Microglial Responses in the Retina of a Rat Model of Glaucoma. Investig. Ophthalmol. Vis. Sci. 2002, 43, 2962–2968. [Google Scholar]
- Shou, T.; Liu, J.; Wang, W.; Zhou, Y.; Zhao, K. Differential dendritic shrinkage of alpha and beta retinal ganglion cells in cats with chronic glaucoma. Investig. Ophthalmol. Vis. Sci. 2003, 44, 3005–3010. [Google Scholar] [CrossRef]
- Mukai, R.; Park, D.H.; Okunuki, Y.; Hasegawa, E.; Klokman, G.; Kim, C.B.; Krishnan, A.; Gregory-Ksander, M.; Husain, D.; Miller, J.W.; et al. Mouse model of ocular hypertension with retinal ganglion cell degeneration. PLoS ONE 2019, 14, e0208713. [Google Scholar] [CrossRef]
- Lestak, J.; Jiraskova, N.; Zakova, M.; Stredova, M. Normotensive glaucoma. Biomed. Pap. Med. Fac. Univ. Palacky Olomouc. Czech Repub. 2018, 162, 272–275. [Google Scholar] [CrossRef]
- Drance, S.M.; Douglas, G.R.; Wijsman, K.; Schulzer, M.; Britton, R.J. Response of blood flow to warm and cold in normal and low-tension glaucoma patients. Am. J. Ophthalmol. 1988, 105, 35–39. [Google Scholar] [CrossRef]
- Gasser, P.; Flammer, J. Blood-cell velocity in the nailfold capillaries of patients with normal-tension and high-tension glaucoma. Am. J. Ophthalmol. 1991, 111, 585–588. [Google Scholar] [CrossRef]
- Su, W.W.; Cheng, S.T.; Hsu, T.S.; Ho, W.J. Abnormal flow-mediated vasodilation in normal-tension glaucoma using a noninvasive determination for peripheral endothelial dysfunction. Investig. Ophthalmol. Vis. Sci. 2006, 47, 3390–3394. [Google Scholar] [CrossRef]
- Shields, M.B. Normal-tension glaucoma: Is it different from primary open-angle glaucoma? Curr. Opin. Ophthalmol. 2008, 19, 85–88. [Google Scholar] [CrossRef]
- Flammer, J.; Konieczka, K.; Flammer, A.J. The primary vascular dysregulation syndrome: Implications for eye diseases. EPMA J. 2013, 4, 14. [Google Scholar] [CrossRef]
- Plange, N.; Remky, A.; Arend, O. Colour Doppler imaging and fluorescein filling defects of the optic disc in normal tension glaucoma. Br. J. Ophthalmol. 2003, 87, 731–736. [Google Scholar] [CrossRef]
- Xu, S.; Huang, S.; Lin, Z.; Liu, W.; Zhong, Y. Color Doppler Imaging Analysis of Ocular Blood Flow Velocities in Normal Tension Glaucoma Patients: A Meta-Analysis. J. Ophthalmol. 2015, 2015, 919610. [Google Scholar] [CrossRef]
- Kuerten, D.; Fuest, M.; Bienert, M.; Walter, P.; Plange, N. Ocular hemodynamics in Acute Nonarteritic Anterior Ischemic Optic Neuropathy Compared with normal tension glaucoma. J. Glaucoma 2019, 28, 334–340. [Google Scholar] [CrossRef] [PubMed]
- Lešták, J.; Fůs, M.; Benda, A.; Bartošová, L.; Marešová, K. OCT Angiography and Doppler Ultrasound in Hypertension Glaucoma. Cesk. Slov. Oftalmol. 2021, 77, 130–133. [Google Scholar] [CrossRef]
- Lešták, J.; Fůs, M.; Benda, A.; Marešová, K. OCT Angiography and Doppler Ultrasound in Normal-Tension Glaucoma. Cesk. Slov. Oftalmol. 2020, 76, 120–123. [Google Scholar]
- Mozaffarieh, M.; Flammer, J. New insights in the pathogenesis and treatment of normal tension glaucoma. Curr. Opin. Pharmacol. 2013, 13, 43–49. [Google Scholar] [CrossRef]
- Topouzis, F.; Wilson, M.R.; Harris, A.; Founti, P.; Yu, F.; Anastasopoulos, E.; Pappas, T.; Koskosas, A.; Salonikiou, A.; Coleman, A.L. Association of open-angle glaucoma with perfusion pressure status in the Thessaloniki Eye Study. Am. J. Ophthalmol. 2013, 155, 843–851. [Google Scholar] [CrossRef]
- Grieshaber, M.C.; Flammer, J.; Mozaffarieh, M. What is the link between vascular dysregulation and glaucoma? Surv. Ophthalmol. 2007, 52 (Suppl. S2), S144–S154. [Google Scholar] [CrossRef]
- Ehrlich, R.; Harris, A.; Siesky, B.A.; Moss, A.M.; Ramanathan, M.; Pickett, M.A.; Wudunn, D.; Hawkes, M.; Shoshani, Y.Z. Repeatability of retrobulbar blood flow velocity measured using color Doppler imaging in the Indianapolis Glaucoma Progression Study. J. Glaucoma 2011, 20, 540–547. [Google Scholar] [CrossRef]
- Mammo, Z.; Heisler, M.; Balaratnasingam, C.; Lee, S.; Yu, D.Y.; Mackenzie, P.; Schendel, S.; Merkur, A.; Kirker, A.; Albiani, D.; et al. Quantitative Optical Coherence Tomography Angiography of Radial Peripapillary Capillaries in Glaucoma, Glaucoma Suspect, and Normal Eyes. Am. J. Ophthalmol. 2016, 170, 41–49. [Google Scholar] [CrossRef]
- Yarmohammadi, A.; Zangwill, L.M.; Diniz-Filho, A.; Suh, M.H.; Yousefi, S.; Saunders, L.J.; Belghith, A.; Manalastas, P.I.; Medeiros, F.A.; Weinreb, R.N. Relationship between Optical Coherence Tomography Angiography Vessel Density and Severity of Visual Field Loss in Glaucoma. Ophthalmology 2016, 123, 2498–2508. [Google Scholar] [CrossRef]
- Hou, H.; Moghimi, S.; Zangwill, L.M.; Shoji, T.; Ghahari, E.; Manalastas, P.I.C.; Penteado, R.C.; Weinreb, R.N. Inter-eye Asymmetry of Optical Coherence Tomography Angiography Vessel Density in Bilateral Glaucoma, Glaucoma Suspect, and Healthy Eyes. Am. J. Ophthalmol. 2018, 190, 69–77. [Google Scholar] [CrossRef]
- Hollo, G. Comparison of Peripapillary OCT Angiography Vessel Density and Retinal Nerve Fiber Layer Thickness Measurements for Their Ability to Detect Progression in Glaucoma. J. Glaucoma 2018, 27, 302–305. [Google Scholar] [CrossRef]
- Penteado, R.C.; Zangwill, L.M.; Daga, F.B.; Saunders, L.J.; Manalastas, P.I.C.; Shoji, T.; Akagi, T.; Christopher, M.; Yarmohammadi, A.; Moghimi, S.; et al. Optical Coherence Tomography Angiography Macular Vascular Density Measurements and the Central 10-2 Visual Field in Glaucoma. J. Glaucoma 2018, 27, 481–489. [Google Scholar] [CrossRef]
- Mangouritsas, G.; Koutropoulou, N.; Ragkousis, A.; Boutouri, E.; Diagourtas, A. Peripapillary Vessel Density In Unilateral Preperimetric Glaucoma. Clin. Ophthalmol. 2019, 13, 2511–2519. [Google Scholar] [CrossRef]
- Lommatzsch, C.; Rothaus, K.; Koch, J.M.; Heinz, C.; Grisanti, S. Vessel Density in Glaucoma of Different Entities as Measured with Optical Coherence Tomography Angiography. Clin. Ophthalmol. 2019, 17, 2527–2534. [Google Scholar] [CrossRef]
- Bojikian, K.D.; Chen, C.L.; Wen, J.C.; Zhang, Q.; Xin, C.; Gupta, D.; Mudumbai, R.C.; Johnstone, M.A.; Wang, R.K.; Chen, P.P. Optic Disc Perfusion in Primary Open Angle and Normal Tension Glaucoma Eyes Using Optical Coherence Tomography-Based Microangiography. PLoS ONE 2016, 11, e0154691. [Google Scholar] [CrossRef]
- Scripsema, N.K.; Garcia, P.M.; Bavier, R.D.; Chui, T.Y.P.; Krawitz, B.D.; Mo, S.; Agemy, S.A.; Xu, L.; Lin, Y.B.; Panarelli, J.F.; et al. Optical Coherence Tomography Angiography Analysis of Perfused Peripapillary Capillaries in Primary Open-Angle Glaucoma and Normal-Tension Glaucoma. Investig. Ophthalmol. Vis. Sci. 2016, 57, OCT611–OCT620. [Google Scholar] [CrossRef]
- Toshev, A.P.; Schuster, A.K.; Ul Hassan, S.N.; Pfeiffer, N.; Hoffmann, E.M. Optical Coherence Tomography Angiography of Optic Disc in Eyes with Primary Open-angle Glaucoma and Normal-tension Glaucoma. J. Glaucoma 2019, 28, 243–251. [Google Scholar] [CrossRef]
- Xu, H.; Zhai, R.; Zong, Y.; Kong, X.; Jiang, C.; Sun, X.; He, Y.; Li, X. Comparison of retinal microvascular changes in eyes with high-tension glaucoma or normal-tension glaucoma: A quantitative optic coherence tomography angiographic study. Graefe’s Arch. Clin. Exp. Ophthalmol. 2018, 256, 1179–1186. [Google Scholar] [CrossRef]
- Kral, J.; Lestak, J.; Nutterova, E. OCT angiography, RNFL and visual field at different values of intraocular pressure. Biomed. Rep. 2022, 16, 36. [Google Scholar] [CrossRef]
- Tsuda, Y.; Nakahara, T.; Ueda, K.; Mori, A.; Sakamoto, K.; Ishii, K. Effect of nafamostat on N-methyl-D-aspartate-induced retinal neuronal and capillary degeneration in rats. Biol. Pharm. Bull. 2012, 35, 2209–2213. [Google Scholar] [CrossRef] [PubMed]
- Vorwerk, C.K.; Gorla, M.S.; Dreyer, E.B. An experimental basis for implicating excitotoxicity in glaucomatous optic neuropathy. Surv. Ophthalmol. 1999, 43 (Suppl. S1), S142–S150. [Google Scholar] [CrossRef]
- Cheng, H.C.; Chan, C.M.; Yeh, S.I.; Yu, J.H.; Liu, D.Z. The hemorheological mechanisms in normal tension glaucoma. Curr. Eye Res. 2011, 36, 647–653. [Google Scholar] [CrossRef]
- Platt, J.F.; Ellis, J.H.; Rubin, J.M.; DiPietro, M.A.; Sedman, A.B. Intrarenal arterial Doppler sonography in patients with nonobstructive renal disease: Correlation of resistive index with biopsy findings. AJR Am. J. Roentgenol. 1980, 154, 1223–1227. [Google Scholar] [CrossRef]
- Rifkin, M.D.; Needleman, L.; Pasto, M.E.; Kurtz, A.B.; Foy, P.M.; McGlynn, E.; Canino, C.; Baltarowich, O.H.; Pennell, R.G.; Goldberg, B.B. Evaluation of renal transplant rejection by duplex Doppler examination: Value of the resistive index. AJR Am. J. Roentgenol. 1987, 148, 759–762. [Google Scholar] [CrossRef]
- Taylor, G.A.; Short, B.L.; Walker, L.K.; Traystman, R.J. Intracranial blood flow: Quantification with duplex Doppler and color Doppler flow US. Radiology 1900, 176, 231–236. [Google Scholar] [CrossRef]
- Wiermann, A.; Galambos, P.; Vafiadis, J.; Wagenfeld, L.; Richard, G.; Klemm, M.; Zeitz, O. Retrobulbar haemodynamics in normal and high tension glaucoma patients: The diagnostic importance of tinnitus, migraine and Raynaud-like symptoms. Klin. Monbl. Augenheilkd. 2007, 224, 396–400. [Google Scholar] [CrossRef]
- Zhong, Y.; Min, Y.; Jiang, Y.; Cheng, Y.; Qin, J.; Shen, X. Color Doppler imaging and pattern visual evoked potential in normal tension glaucoma and hypertension glaucoma. Doc. Ophthalmol. 2009, 119, 171–180. [Google Scholar] [CrossRef]
- Abegão Pinto, L.; Willekens, K.; Van Keer, K.; Shibesh, A.; Molenberghs, G.; Vandewalle, E.; Stalmans, I. Ocular blood flow in glaucoma—The Leuven Eye Study. Acta Ophthalmol. 2016, 94, 592–598. [Google Scholar] [CrossRef]
- Levene, R.Z. Low tension glaucoma: A critical review and new material. Surv. Ophthalmol. 1980, 24, 621–664. [Google Scholar] [CrossRef]
- Caprioli, J.; Spaeth, G.L. Comparison of visual field defects in the low-tension glaucomas with those in the high-tension glaucomas. Am. J. Ophthalmol 1984, 97, 730–737. [Google Scholar] [CrossRef] [PubMed]
- Zeiter, J.H.; Shin, D.H.; Juzych, M.S.; Jarvi, T.S.; Spoor, T.C.; Zwas, F. Visual field defects in patients with normal-tension glaucoma and patients with high-tension glaucoma. Am. J. Ophtalmol. 1992, 114, 758–763. [Google Scholar] [CrossRef]
- Araie, M.; Yamagami, J.; Suziki, Y. Visual field defects in normal-tension and high-tension glaucoma. Ophthalmology 1993, 100, 1808–1814. [Google Scholar] [CrossRef]


| HTG (40 Eyes) | NTG (40 Eyes) | p-Value | |
|---|---|---|---|
| Mean ± SD | |||
| age | 67.15 ± 12.86 | 66.68 ± 9.17 | p = 0.855 |
| VF [asb] | 2022.48 ± 154.30 | 1990.84 ± 294.07 | p = 0.550 |
| PP-VDa [%] | 550.08 ± 5.08 | 55.07 ± 5.38 | p = 0.992 |
| PP-VDs [%] | 48.96 ± 5.15 | 48.72 ± 5.36 | p = 0.844 |
| WI-VDa [%] | 52.81 ± 4.35 | 53.03 ± 3.97 | p = 0.815 |
| WI-VDs [%] | 46.49 ± 4.31 | 45.52 ± 7.26 | p = 0.471 |
| PSV-OA [%] | 40.11 ± 12.83 | 41.22 ± 9.20 | p = 0.662 |
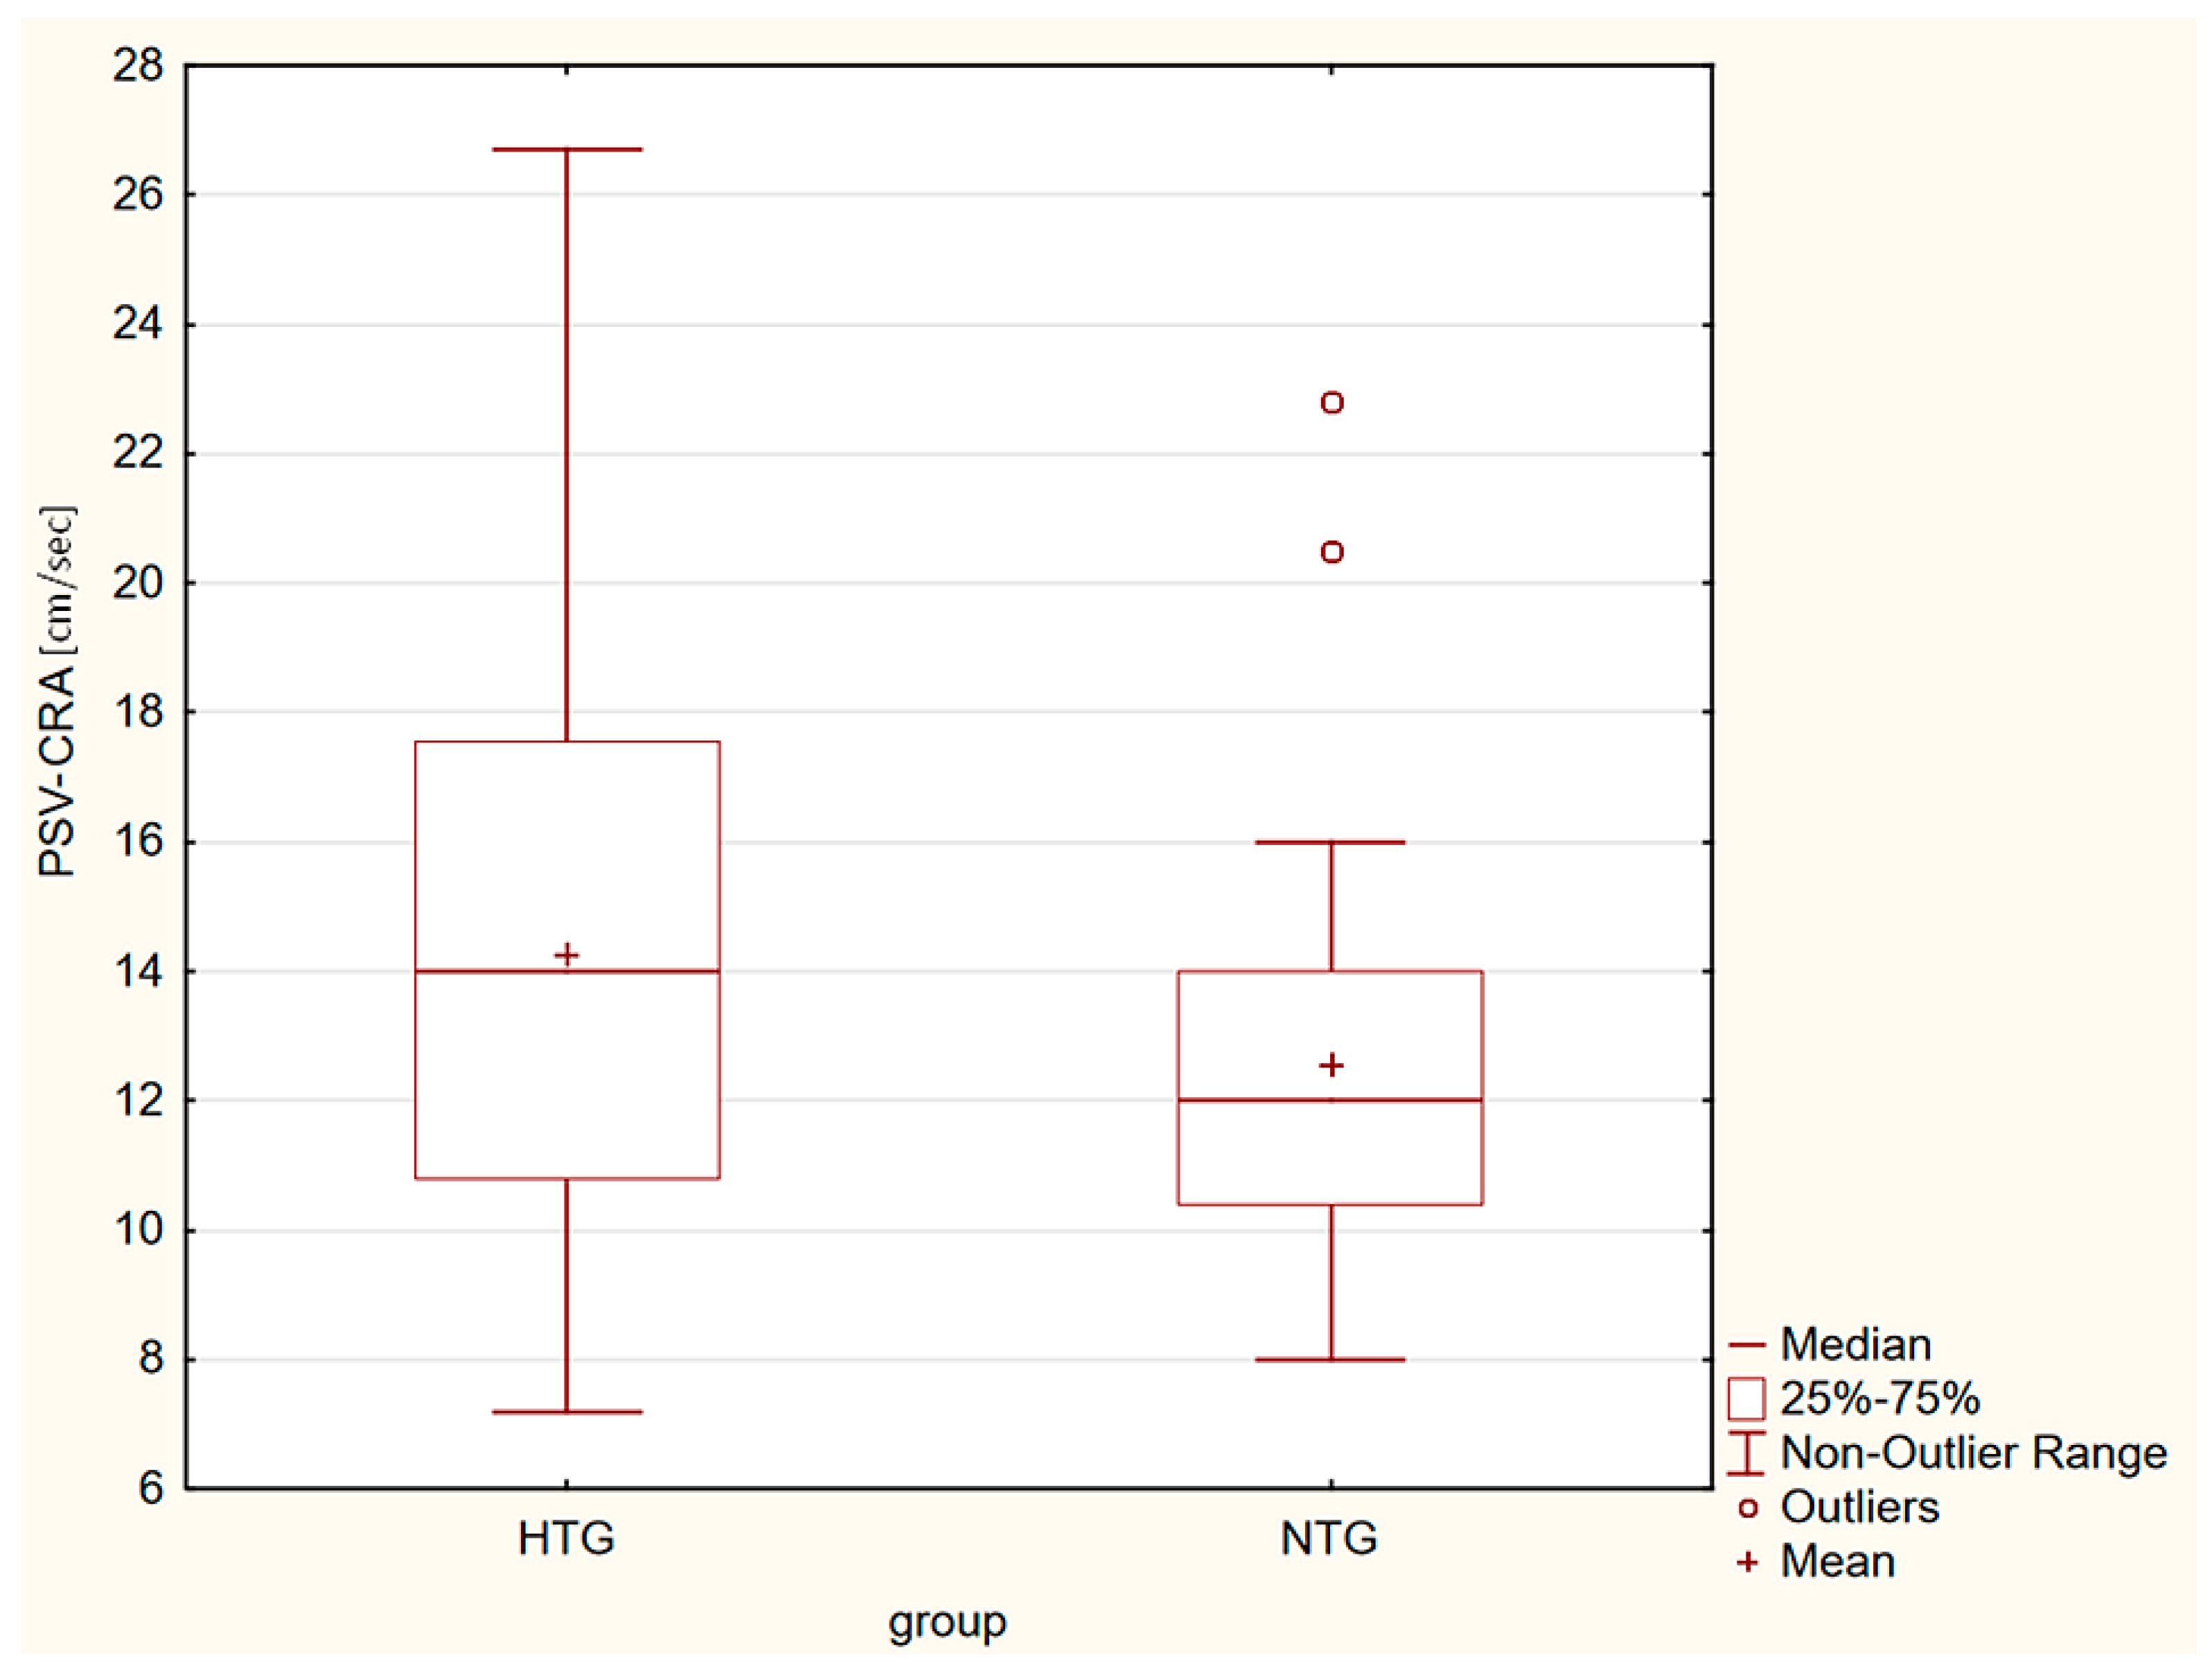
| PSV-CRA [cm/s] | 14.27 ± 4.17 | 12.55 ± 3.09 | p = 0.042 |
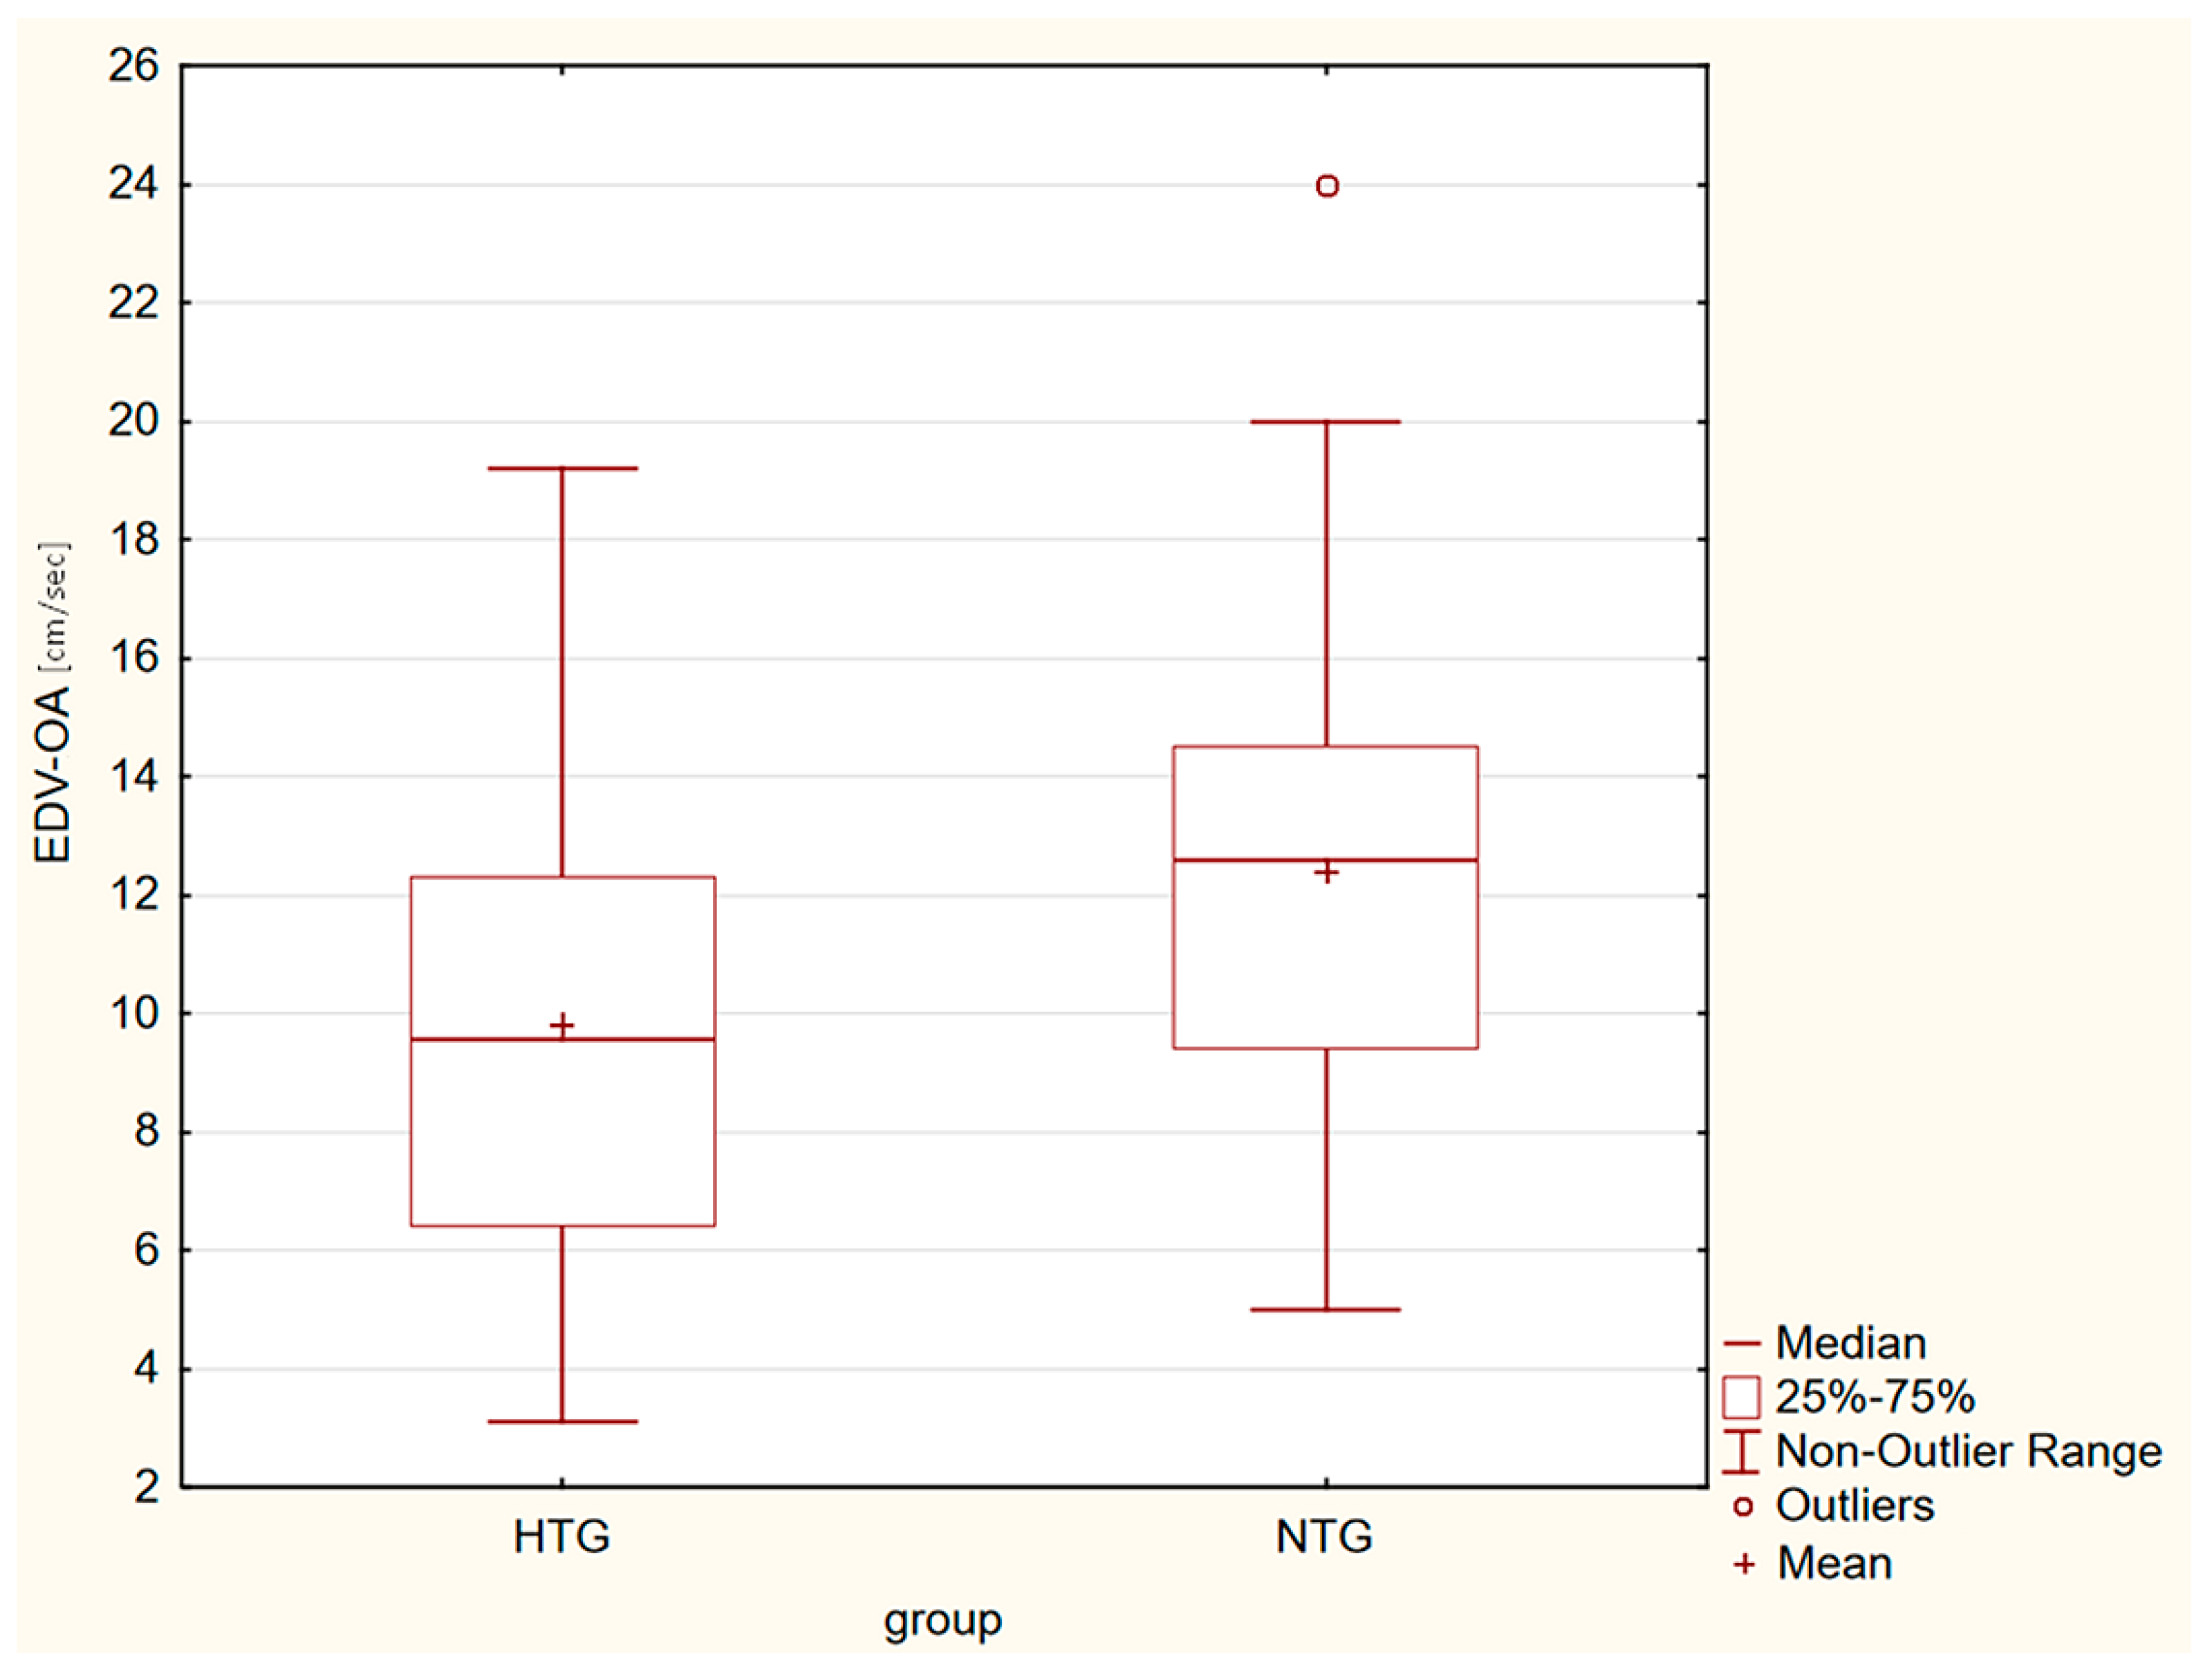
| EDV-OA [cm/s] | 9.82 ± 4.30 | 12.39 ± 4.22 | p = 0.009 |
| EDV-CRA [cm/s] | 4.17 ± 2.31 | 3.98 ± 1.09 | p = 0.638 |
| RI-OA [-] | 0.76 ± 0.07 | 0.70 ± 0.08 | p = 0.001 |
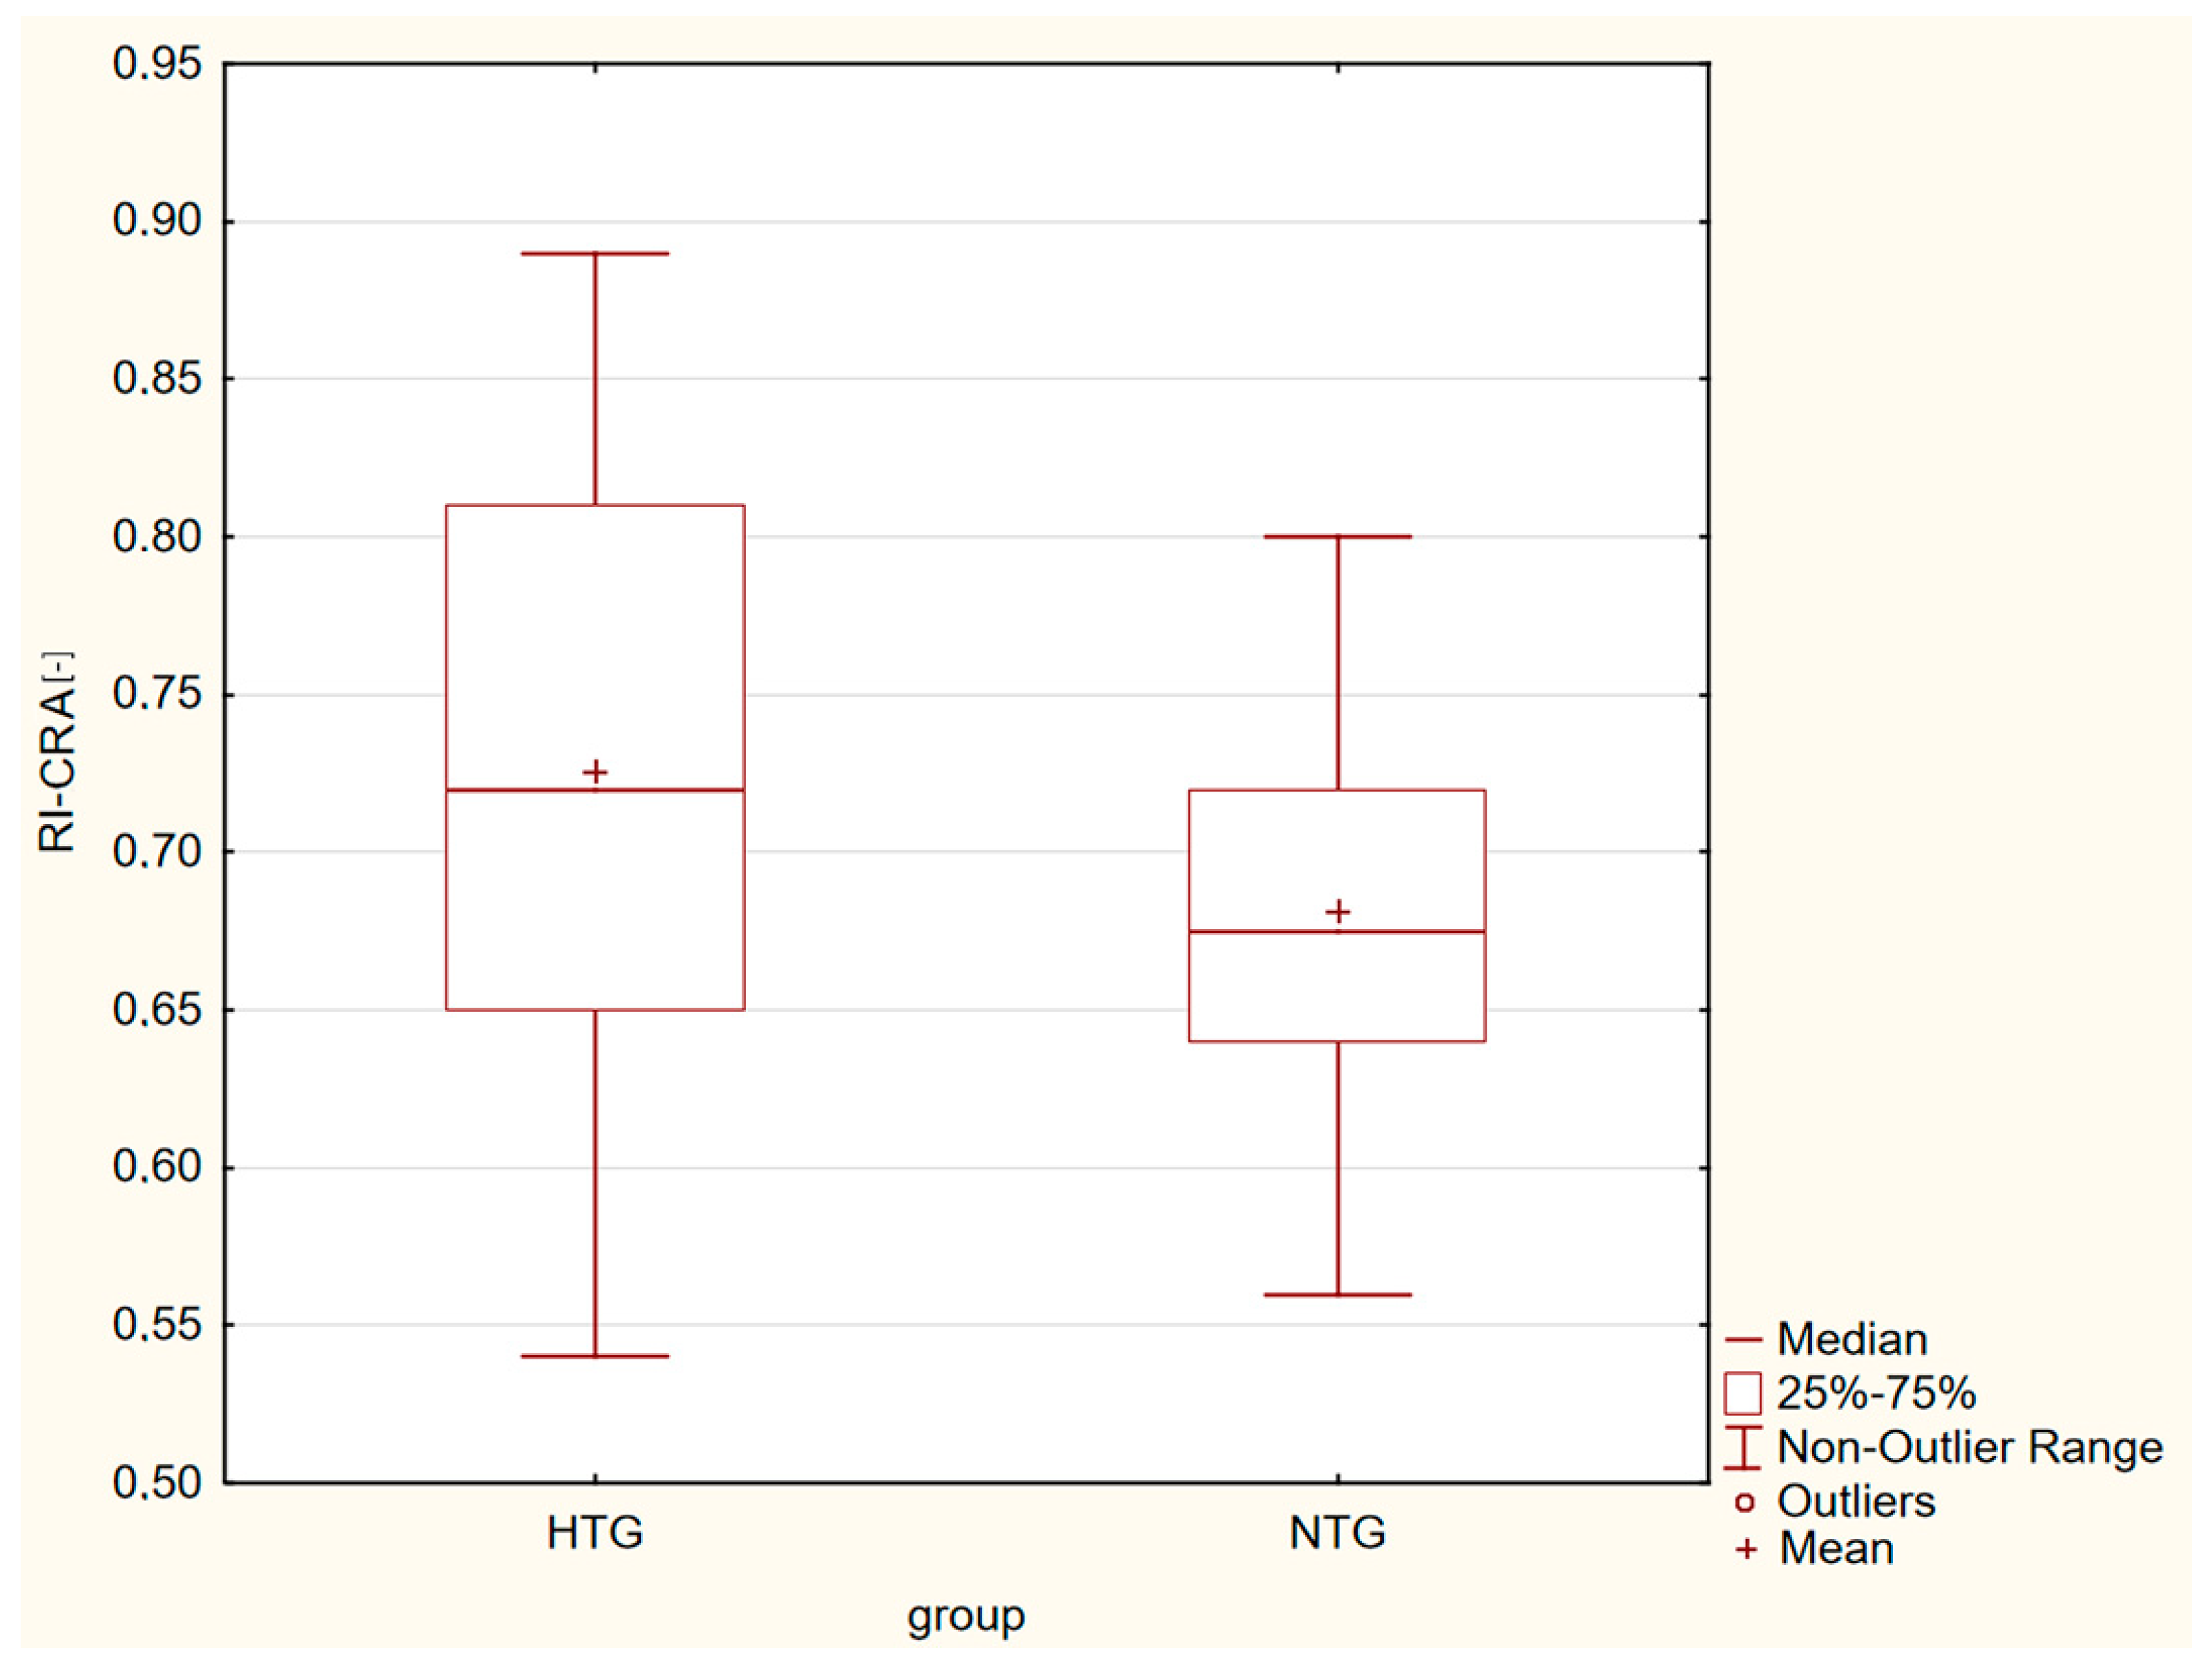
| RI-CRA [-] | 0.73 ± 0.09 | 0.68 ± 0.06 | p = 0.001 |
Disclaimer/Publisher’s Note: The statements, opinions and data contained in all publications are solely those of the individual author(s) and contributor(s) and not of MDPI and/or the editor(s). MDPI and/or the editor(s) disclaim responsibility for any injury to people or property resulting from any ideas, methods, instructions or products referred to in the content. |
© 2023 by the authors. Licensee MDPI, Basel, Switzerland. This article is an open access article distributed under the terms and conditions of the Creative Commons Attribution (CC BY) license (https://creativecommons.org/licenses/by/4.0/).
Share and Cite
Lestak, J.; Fus, M.; Rybář, M.; Benda, A. OCTA and Doppler Ultrasound in Primary Open-Angle Glaucoma and Normal-Tension Glaucoma. Life 2023, 13, 610. https://doi.org/10.3390/life13030610
Lestak J, Fus M, Rybář M, Benda A. OCTA and Doppler Ultrasound in Primary Open-Angle Glaucoma and Normal-Tension Glaucoma. Life. 2023; 13(3):610. https://doi.org/10.3390/life13030610
Chicago/Turabian StyleLestak, Jan, Martin Fus, Marain Rybář, and Antonin Benda. 2023. "OCTA and Doppler Ultrasound in Primary Open-Angle Glaucoma and Normal-Tension Glaucoma" Life 13, no. 3: 610. https://doi.org/10.3390/life13030610
APA StyleLestak, J., Fus, M., Rybář, M., & Benda, A. (2023). OCTA and Doppler Ultrasound in Primary Open-Angle Glaucoma and Normal-Tension Glaucoma. Life, 13(3), 610. https://doi.org/10.3390/life13030610