

Pre-Operative Functional Mapping in Patients with Brain Tumors by fMRI and MEG: Advantages and Disadvantages in the Use of One Technique over the Other


Abstract
Simple Summary
Abstract
1. Introduction
2. Methodological Comparison between fMRI and MEG
2.1. Approach to Measuring the Brain Activity
2.2. Spatial and Temporal Resolution
2.3. Issues with Signal Detection and Processing
3. Direct Comparison between fMRI and MEG in Pre-Operative Mapping
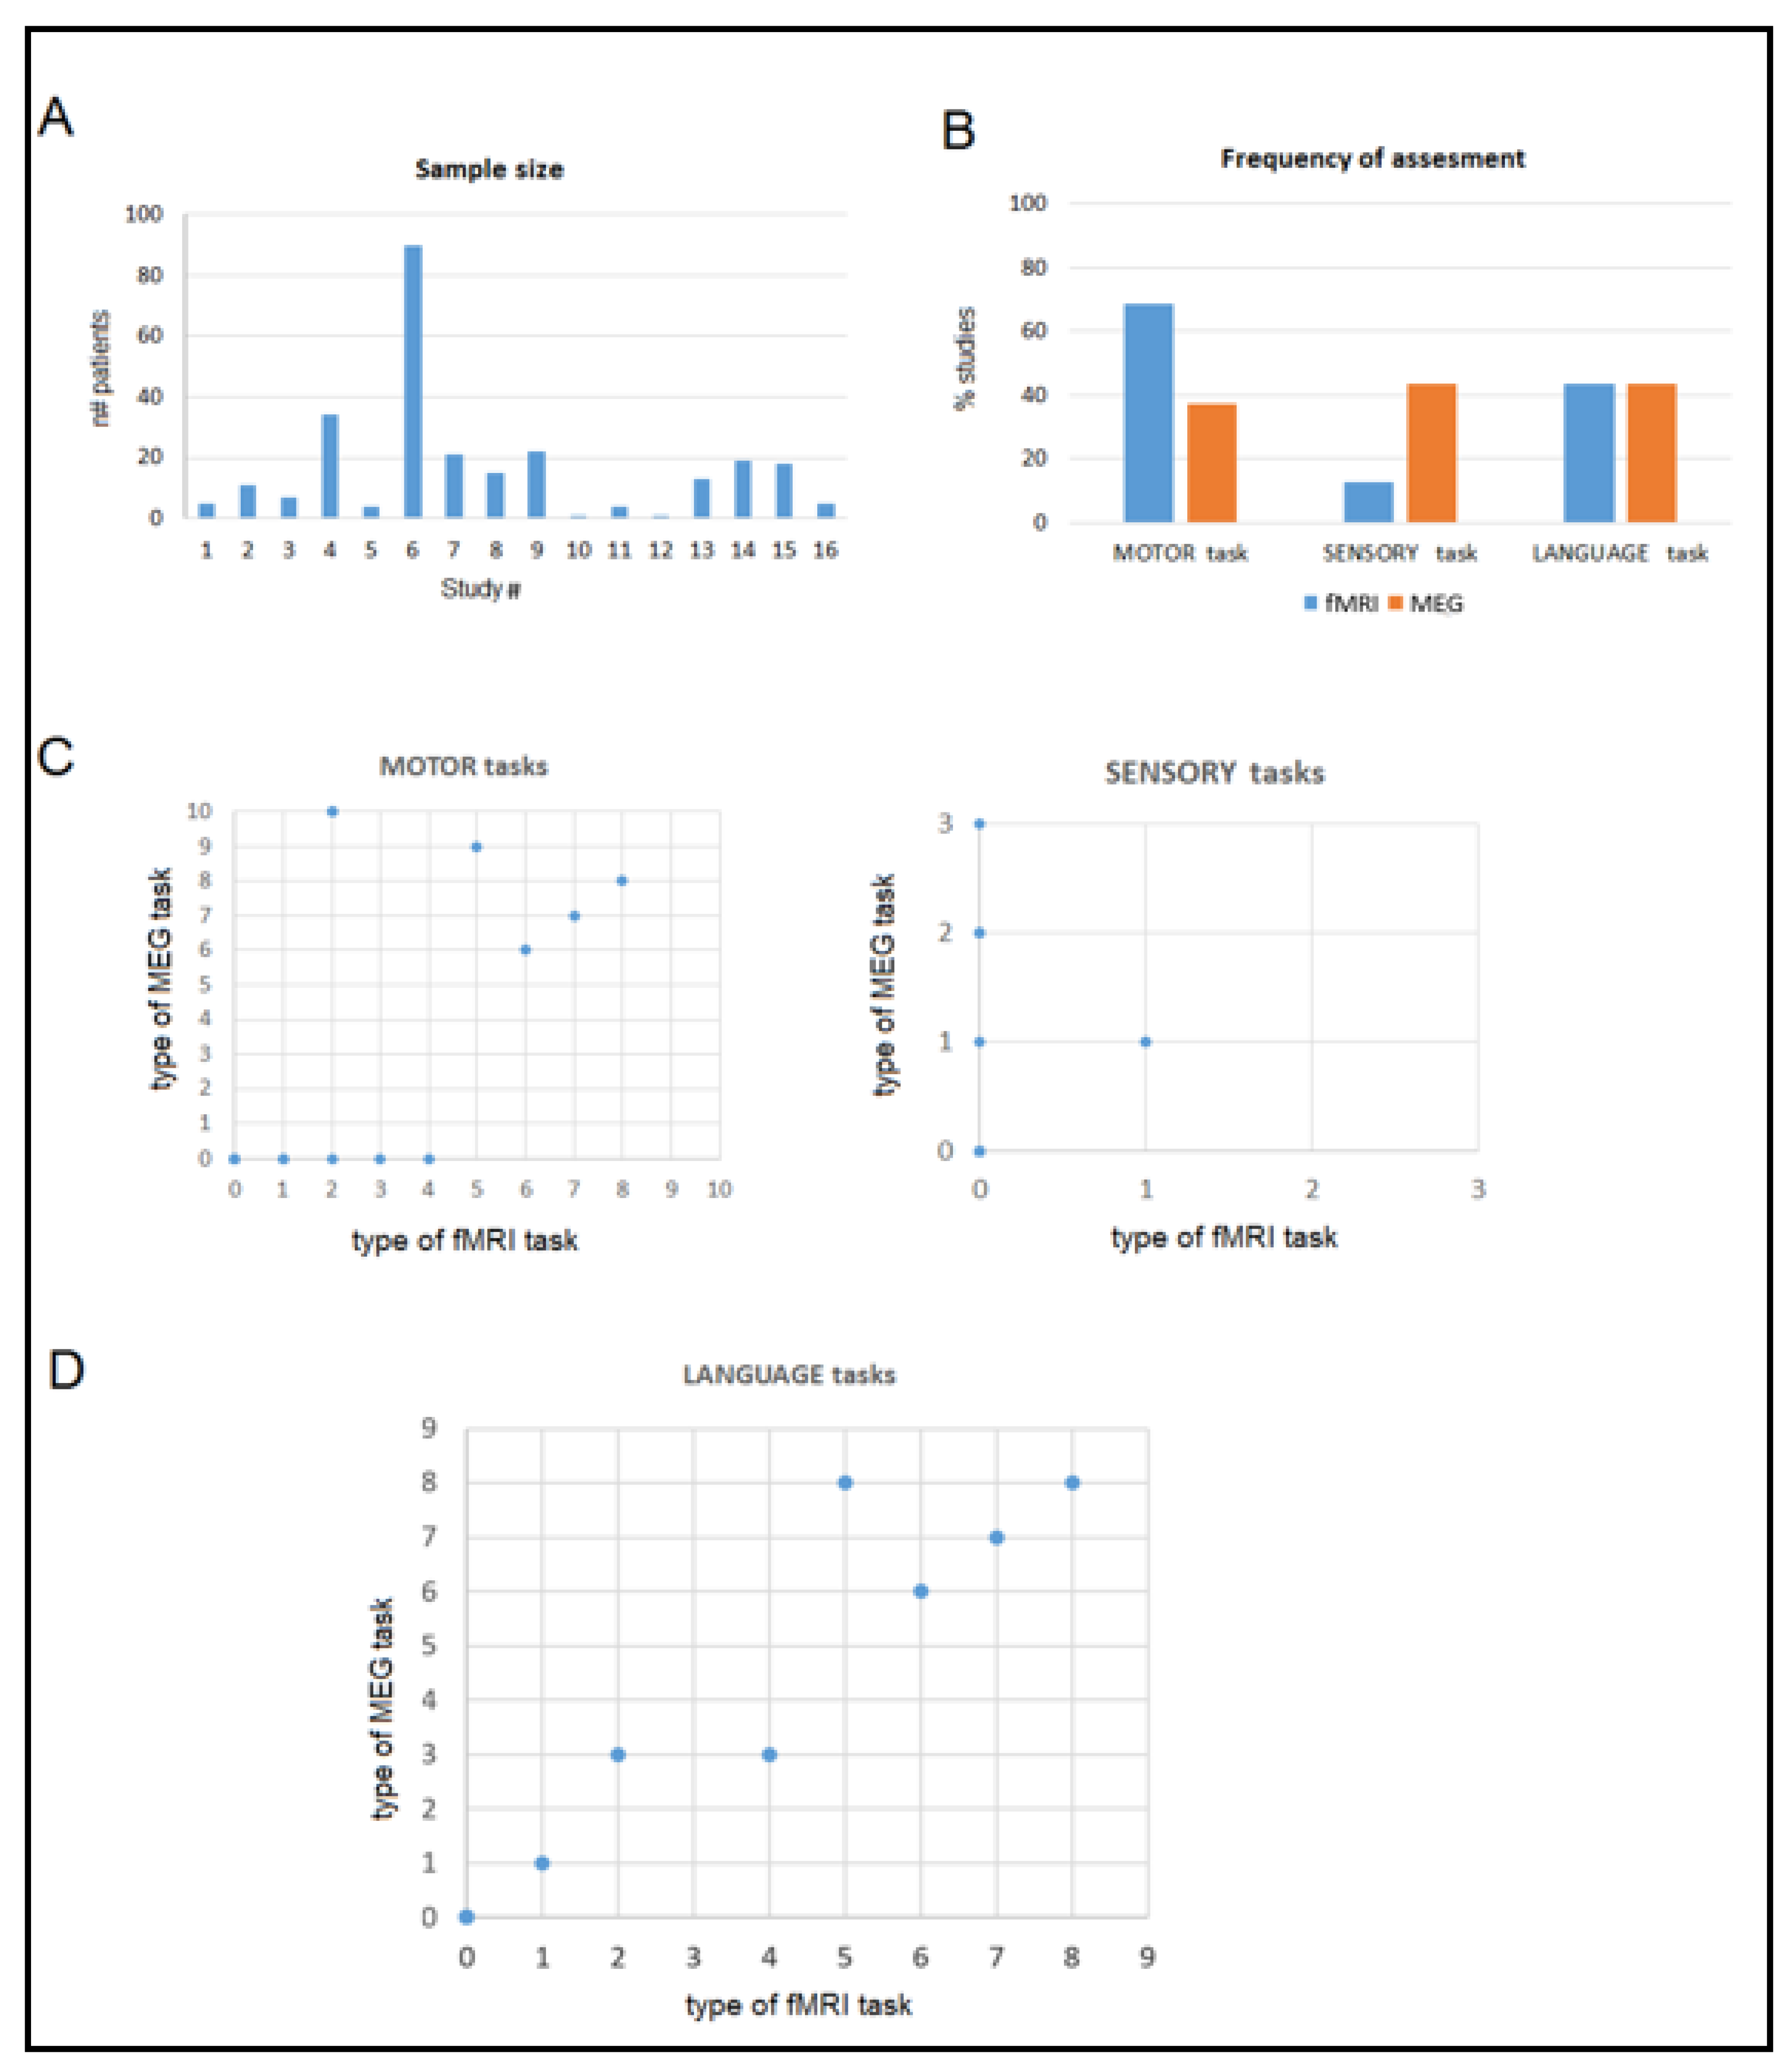
Quantitative Comparison
4. Conclusions
Author Contributions
Funding
Institutional Review Board Statement
Informed Consent Statement
Data Availability Statement
Conflicts of Interest
References
- Bast, T.; Oezkan, O.; Rona, S.; Stippich, C.; Seitz, A.; Rupp, A.; Fauser, S.; Zentner, J.; Rating, D.; Scherg, M. EEG and MEG source analysis of single and averaged interictal spikes reveals intrinsic epileptogenicity in focal cortical dysplasia. Epilepsia 2004, 45, 621–631. [Google Scholar] [CrossRef] [PubMed]
- Chowdhury, R.A.; Zerouali, Y.; Hedrich, T.; Heers, M.; Kobayashi, E.; Lina, J.M.; Grova, C. MEG-EEG Information fusion and electromagnetic source imaging: From theory to clinical application in epilepsy. Brain Topogr. 2015, 28, 785–812. [Google Scholar] [CrossRef] [PubMed]
- Malmivuo, J. Comparison of the properties of EEG and MEG in detecting the electric activity of the brain. Brain Topogr. 2012, 25, 1–19. [Google Scholar] [CrossRef] [PubMed]
- Hari, R. Magnetoencephalography: Methods and applications. In Niedermeyer’s Electroencephalography: Basic Principles, Clinical Applications, and Related Fields; Schomer, D.L., Lopes da Silva, F.H., Eds.; Lippincott Williams & Wilkins: Philadelphia, PA, USA, 2011; pp. 865–900. [Google Scholar]
- Cohen, D.; Cuffin, B.N. Demonstration of useful differences between magnetoencephalogram and electroencephalogram. Electroencephalogr. Clin. Neurophysiol. 1983, 56, 38–51. [Google Scholar] [CrossRef] [PubMed]
- Singh, S.P. Magnetoencephalography: Basic principles. Ann. Indian Acad. Neurol. 2014, 17, S107–S112. [Google Scholar] [CrossRef] [PubMed]
- Cargnelutti, E.; Ius, T.; Skrap, M.; Tomasino, B. What do we know about pre-and postoperative plasticity in patients with glioma? A review of neuroimaging and intraoperative mapping studies. Neuroimage Clin. 2020, 28, 102435. [Google Scholar] [CrossRef]
- Duffau, H. Brain plasticity and tumors. Adv. Tech. Stand. Neurosurg. 2008, 3, 3–33. [Google Scholar] [CrossRef]
- Weng, H.H.; Noll, K.R.; Johnson, J.M.; Prabhu, S.S.; Tsai, Y.H.; Chang, S.W.; Huang, Y.-C.; Lee, J.-D.; Yang, J.-T.; Yang, C.-T. Accuracy of presurgical functional MR imaging for language mapping of brain tumors: A systematic review and meta-analysis. Radiology 2018, 286, 512–523. [Google Scholar] [CrossRef]
- Bizzi, A.; Blasi, V.; Falini, A.; Ferroli, P.; Cadioli, M.; Danesi, U.; Aquino, D.; Marras, C.; Caldiroli, D.; Broggi, G. Presurgical functional MR imaging of language and motor functions: Validation with intraoperative electrocortical mapping. Radiology 2008, 248, 579–589. [Google Scholar] [CrossRef]
- Ellis, D.G.; White, M.L.; Hayasaka, S.; Warren, D.E.; Wilson, T.W.; Aizenberg, M.R. Accuracy analysis of fMRI and MEG activations determined by intraoperative mapping. Neurosurg. Focus 2020, 48, E13. [Google Scholar] [CrossRef]
- Kirsch, H.E.; Zhu, Z.; Honma, S.; Findlay, A.; Berger, M.S.; Nagarajan, S.S. Predicting the location of mouth motor cortex in patients with brain tumors by using somatosensory evoked field measurements. J. Neurosurg. 2007, 107, 481–487. [Google Scholar] [CrossRef] [PubMed]
- Nagarajan, S.; Kirsch, H.; Lin, P.; Findlay, A.; Honma, S.; Berger, M.S. Preoperative localization of hand motor cortex by adaptive spatial filtering of magnetoencephalography data. J. Neurosurg. 2008, 109, 228–237. [Google Scholar] [CrossRef] [PubMed]
- Schiffbauer, H.; Berger, M.S.; Ferrari, P.; Freudenstein, D.; Rowley, H.A.; Roberts, T.P. Preoperative magnetic source imaging for brain tumor surgery: A quantitative comparison with intraoperative sensory and motor mapping. Neurosurg. Focus 2003, 15, E7. [Google Scholar] [CrossRef] [PubMed]
- Tarapore, P.E.; Tate, M.C.; Findlay, A.M.; Honma, S.M.; Mizuiri, D.; Berger, M.S.; Nagarajan, S.S. Preoperative multimodal motor mapping: A comparison of magnetoencephalography imaging, navigated transcranial magnetic stimulation, and direct cortical stimulation. J. Neurosurg. 2012, 117, 354–362. [Google Scholar] [CrossRef]
- Hari, R.; Reinikainen, K.; Kaukoranta, E.; Hämäläinen, M.; Ilmoniemi, R.; Penttinen, A.; Salminen, J.; Teszner, D. Somatosensory evoked cerebral magnetic fields from SI and SII in man. Electroencephalogr. Clin. Neurophysiol. 1984, 57, 254–263. [Google Scholar] [CrossRef]
- Baillet, S. Magnetoencephalography for brain electrophysiology and imaging. Nat. Neurosci. 2017, 20, 327–339. [Google Scholar] [CrossRef]
- Hämäläinen, M.; Hari, R. Magnetoencephalographic characterization of dynamic brain activation: Basic principles and methods of data collection and source analysis. In Brain Mapping: The Methods; Mazziotta, J., Ed.; Elsevier: London, UK, 2002; pp. 227–253. [Google Scholar]
- Mäkelä, J.P.; Forss, N.; Jääskeläinen, J.; Kirveskari, E.; Korvenoja, A.; Paetau, R. Magnetoencephalography in neurosurgery. Neurosurgery 2006, 59, 493–511. [Google Scholar] [CrossRef]
- Gross, J. Magnetoencephalography in cognitive neuroscience: A primer. Neuron 2019, 104, 189–204. [Google Scholar] [CrossRef]
- Braeutigam, S. Magnetoencephalography: Fundamentals and established and emerging clinical applications in radiology. ISRN Radiol. 2013, 529463. [Google Scholar] [CrossRef]
- Constable, R.T.; Kennan, R.P.; Puce, A.; McCarthy, G.; Gore, J.C. Functional NMR imaging using fast spin echo at 1.5 T. Magn. Reson. Med. 1994, 31, 686–690. [Google Scholar] [CrossRef]
- Inoue, T.; Shimizu, H.; Nakasato, N.; Kumabe, T.; Yoshimoto, T. Accuracy and limitation of functional magnetic resonance imaging for identification of the central sulcus: Comparison with magnetoencephalography in patients with brain tumors. Neuroimage 1999, 10, 738–748. [Google Scholar] [CrossRef]
- Hou, B.L.; Bradbury, M.; Peck, K.K.; Petrovich, N.M.; Gutin, P.H.; Holodny, A.I. Effect of brain tumor neovasculature defined by rCBV on BOLD fMRI activation volume in the primary motor cortex. Neuroimage 2006, 32, 489–497. [Google Scholar] [CrossRef]
- Pillai, J.J.; Zacà, D. Clinical utility of cerebrovascular reactivity mapping in patients with low grade gliomas. World J. Clin. Oncol. 2011, 2, 397–403. [Google Scholar] [CrossRef]
- Zacà, D.; Jovicich, J.; Nadar, S.R.; Voyvodic, J.T.; Pillai, J.J. Cerebrovascular reactivity mapping in patients with low grade gliomas undergoing presurgical sensorimotor mapping with BOLD fMRI. J. Magn. Reson. Imaging 2014, 40, 383–390. [Google Scholar] [CrossRef]
- Gao, J.H.; Miller, I.; Lai, S.; Xiong, J.; Fox, P.T. Quantitative assessment of blood inflow effects in functional MRI signals. Magn. Reson. Med. 1996, 36, 314–319. [Google Scholar] [CrossRef]
- Morioka, T.; Yamamoto, T.; Mizushima, A.; Tombimatsu, S.; Shigeto, H.; Hasuo, K.; Nishio, S.; Fujii, K.; Fukui, M. Comparison of magnetoencephalography, functional MRI, and motor evoked potentials in the localization of the sensory-motor cortex. Neurol. Res. 1995, 17, 361–367. [Google Scholar] [CrossRef]
- Fred, A.L.; Kumar, S.N.; Kumar Haridhas, A.; Ghosh, S.; Purushothaman Bhuvana, H.; Sim, W.K.J.; Vimalan, V.; Givo, F.A.S.; Jousmäki, V.; Padmanabhan, P.; et al. A Brief introduction to magnetoencephalography (MEG) and its clinical applications. Brain Sci. 2022, 12, 788. [Google Scholar] [CrossRef]
- Puce, A.; Hämäläinen, M.S. A review of issues related to data acquisition and analysis in EEG/MEG studies. Brain Sci. 2017, 7, 58. [Google Scholar] [CrossRef]
- Ahlfors, S.P.; Han, J.; Lin, F.H.; Witzel, T.; Belliveau, J.W.; Hamalainen, M.S.; Halgren, E. Cancellation of EEG and MEG signals generated by extended and distributed sources. Hum. Brain Mapp. 2010, 31, 140–149. [Google Scholar] [CrossRef]
- Kober, H.; Möller, M.; Nimsky, C.; Vieth, J.; Fahlbusch, R.; Ganslandt, O. New approach to localize speech-relevant brain areas and hemispheric dominance using spatially filtered magnetoencephalography. Hum. Brain Mapp. 2001, 14, 236–250. [Google Scholar] [CrossRef]
- Sekihara, K.; Nagarajan, S.S.; Poeppel, D.; Marantz, A.; Miyashita, Y. Reconstructing spatiotemporal activities of neural sources using an MEG vector beamformer technique. IEEE Trans. Biomed. Eng. 2001, 48, 760–771. [Google Scholar] [CrossRef] [PubMed]
- Van Veen, B.D.; Van, D.W.; Yuchtman, M.; Suzuki, A. Localization of brain electrical activity via linearly constrained minimum variance spatial filtering. IEEE Trans. Biomed. Eng. 1997, 44, 867–880. [Google Scholar] [CrossRef] [PubMed]
- Baillet, S.; Mosher, J.C.; Leahy, R.M. Electromagnetic brain mapping. IEEE Signal Process. Mag. 2001, 18, 14–30. [Google Scholar] [CrossRef]
- Dale, A.M.; Liu, A.K.; Fischl, B.R.; Buckner, R.L.; Belliveau, J.W.; Lewine, J.D.; Halgren, E. Dynamic statistical parametric mapping: Combining fMRI and MEG for high-resolution imaging of cortical activity. Neuron 2000, 26, 55–67. [Google Scholar] [CrossRef]
- Pascual-Marqui, R.D. Standardized low-resolution brain electromagnetic tomography (sLORETA): Technical details. Methods Find Exp. Clin. Pharm. 2002, 24 (Suppl. D), 5–12. [Google Scholar]
- Kober, H.; Nimsky, C.; Vieth, J.; Fahlbusch, R.; Ganslandt, O. Co-registration of function and anatomy in frameless stereotaxy by contour fitting. Stereotact. Funct. Neurosurg. 2002, 79, 272–283. [Google Scholar] [CrossRef]
- Ganzetti, M.; Taberna, G.A.; Mantini, D. fMRI data processing in MRTOOL: To what extent does anatomical registration affect the reliability of functional results? Brain Imaging Behav. 2019, 13, 1538–1553. [Google Scholar] [CrossRef]
- Saad, Z.S.; Glen, D.R.; Chen, G.; Beauchamp, M.S.; Desai, R.; Cox, R.W. A new method for improving functional-to-structural MRI alignment using local Pearson correlation. Neuroimage 2009, 44, 839–848. [Google Scholar] [CrossRef]
- Hillebrand, A.; Barnes, G.R. Practical constraints on estimation of source extent with MEG beamformers. Neuroimage 2011, 54, 2732–2740. [Google Scholar] [CrossRef]
- Whalen, C.; Maclin, E.L.; Fabiani, M.; Gratton, G. Validation of a method for coregistering scalp recording locations with 3D structural MR images. Hum. Brain Mapp. 2008, 29, 1288–1301. [Google Scholar] [CrossRef]
- Sonntag, H.; Haueisen, J.; Maess, B. Quality assessment of MEG-to-MRI coregistrations. Phys. Med. Biol. 2018, 63, 075003. [Google Scholar] [CrossRef]
- Nimsky, C.; Ganslandt, O.; Kober, H.; Moller, M.; Ulmer, S.; Tomandl, B.; Fahlbusch, R. Integration of functional magnetic resonance imaging supported by magnetoencephalography in functional neuronavigation. Neurosurgery 1999, 44, 1249–1255. [Google Scholar] [CrossRef]
- Kober, H.; Nimsky, C.; Möller, M.; Hastreiter, P.; Fahlbusch, R.; Ganslandt, O. Correlation of sensorimotor activation with functional magnetic resonance imaging and magnetoencephalography in presurgical functional imaging: A spatial analysis. Neuroimage 2001, 14, 1214–1228. [Google Scholar] [CrossRef]
- Kamada, K.; Houkin, K.; Takeuchi, F.; Ishii, N.; Ikeda, J.; Sawamura, Y.; Kuriki, S.; Kawaguchi, H.; Iwasaki, Y. Visualization of the eloquent motor system by integration of MEG, functional, and anisotropic diffusion-weighted MRI in functional neuronavigation. Surg. Neurol. 2003, 59, 352–360. [Google Scholar] [CrossRef]
- Grummich, P.; Nimsky, C.; Pauli, E.; Buchfelder, M.; Ganslandt, O. Combining fMRI and MEG increases the reliability of presurgical language localization: A clinical study on the difference between and congruence of both modalities. Neuroimage 2006, 32, 1793–1803. [Google Scholar] [CrossRef]
- Kamada, K.; Takeuchi, F.; Kuriki, S.; Todo, T.; Morita, A.; Sawamura, Y. Dissociated expressive and receptive language functions on magnetoencephalography, functional magnetic resonance imaging, and amobarbital studies: Case report and review of the literature. J. Neurosurg. 2006, 104, 598–607. [Google Scholar] [CrossRef]
- Korvenoja, A.; Kirveskari, E.; Aronen, H.J.; Avikainen, S.; Brander, A.; Huttunen, J.; Ilmoniemi, R.J.; Jääskeläinen, J.E.; Kovala, T.; Mäkelä, J.P.; et al. Sensorimotor cortex localization: Comparison of magnetoencephalography, functional MR imaging, and intraoperative cortical mapping. Radiology 2006, 241, 213–222. [Google Scholar] [CrossRef]
- Kamada, K.; Todo, T.; Masutani, Y.; Aoki, S.; Ino, K.; Morita, A.; Saito, N. Visualization of the frontotemporal language fibers by tractography combined with functional magnetic resonance imaging and magnetoencephalography. J. Neurosurg. 2007, 106, 90–98. [Google Scholar] [CrossRef]
- Choudhri, A.F.; Narayana, S.; Rezaie, R.; Whitehead, M.T.; McAfee, S.S.; Wheless, J.W.; Boop, F.A.; Papanicolaou, A.C. Same day tri-modality functional brain mapping prior to resection of a lesion involving eloquent cortex: Technical feasibility. Neuroradiol. J. 2013, 26, 548–554. [Google Scholar] [CrossRef]
- De Martin, E.; Duran, D.; Ghielmetti, F.; Visani, E.; Aquino, D.; Marchetti, M.; Sebastiano, D.R.; Cusumano, D.; Bruzzone, M.G.; Panzica, F.; et al. Integration of functional magnetic resonance imaging and magnetoencephalography functional maps into a CyberKnife planning system: Feasibility study for motor activity localization and dose planning. World Neurosurg. 2017, 108, 756–762. [Google Scholar] [CrossRef]
- Izutsu, N.; Kinoshita, M.; Yanagisawa, T.; Nakanishi, K.; Sakai, M.; Kishima, H. Preservation of motor function after resection of lower-grade glioma at the precentral gyrus and prediction by presurgical functional magnetic resonance imaging and magnetoencephalography. World Neurosurg. 2017, 107, 1045-e5. [Google Scholar] [CrossRef]
- Zimmermann, M.; Rössler, K.; Kaltenhäuser, M.; Grummich, P.; Brandner, N.; Buchfelder, M.; Dörfler, A.; Kölble, K.; Stadlbauer, A. Comparative fMRI and MEG localization of cortical sensorimotor function: Bimodal mapping supports motor area reorganization in glioma patients. PLoS ONE 2019, 14, e0213371. [Google Scholar] [CrossRef]
- Zimmermann, M.; Rössler, K.; Kaltenhäuser, M.; Grummich, P.; Yang, B.; Buchfelder, M.; Dörfler, A.; Kölble, K.; Stadlbauer, A. Refined functional magnetic resonance imaging and magnetoencephalography mapping reveals reorganization in language-relevant areas of lesioned brains. World Neurosurg. 2020, 136, e41–e59. [Google Scholar] [CrossRef]
- Quiñones, I.; Amoruso, L.; Pomposo Gastelu, I.C.; Gil-Robles, S.; Carreiras, M. What can glioma patients teach us about language (re) organization in the bilingual brain: Evidence from fMRI and MEG. Cancers 2021, 13, 2593. [Google Scholar] [CrossRef]
- Huang, C.W.; Huang, M.X.; Ji, Z.; Swan, A.R.; Angeles, A.M.; Song, T.; Huang, J.W.; Lee, R.R. High-resolution MEG source imaging approach to accurately localize Broca’s area in patients with brain tumor or epilepsy. Clin. Neurophysiol. 2016, 127, 2308–2316. [Google Scholar] [CrossRef]
- Krieg, S.M.; Shiban, E.; Buchmann, N.; Gempt, J.; Foerschler, A.; Meyer, B.; Ringel, F. Utility of presurgical navigated transcranial magnetic brain stimulation for the resection of tumors in eloquent motor areas. J. Neurosurg. 2012, 116, 994–1001. [Google Scholar] [CrossRef]
- Krieg, S.M.; Shiban, E.; Buchmann, N.; Meyer, B.; Ringel, F. Presurgical navigated transcranial magnetic brain stimulation for recurrent gliomas in motor eloquent areas. Clin. Neurophysiol. 2013, 124, 522–527. [Google Scholar] [CrossRef] [PubMed]
- Cargnelutti, E.; Maieron, M.; Ius, T.; Skrap, M.; Tomasino, B. Relation between reading performance and white-matter alteration and reorganization in neurosurgical patients. Front. Neurol. 2020, 11, 563259. [Google Scholar] [CrossRef]
- Salvati, L.F.; De Marco, R.; Palmieri, G.; Minardi, M.; Massara, A.; Pesaresi, A.; Cagetti, B.; Melcarne, A.; Garbossa, D. The relevant role of navigated tractography in speech eloquent area glioma surgery: Single center experience. Brain Sci. 2021, 11, 1436. [Google Scholar] [CrossRef]
- Youden, W.J. Index for rating diagnostic tests. Cancer 1950, 3, 32–35. [Google Scholar] [CrossRef]
- Meier, M.P.; Ilmberger, J.; Fesl, G.; Ruge, M.I. Validation of functional motor and language MRI with direct cortical stimulation. Acta Neurochir. 2013, 155, 675–683. [Google Scholar] [CrossRef] [PubMed]


| Authors | Sample Size | Lesion | Aim | Reference | Additional Relevant Examinations | Results | fMRI–MEG Agreement |
|---|---|---|---|---|---|---|---|
| Morioka et al. (1995) [28] | 5 (4 F) | Various (glioma, AVM, cyst, metastasis, MG) in peri-rolandic areas | Pre-operative sensorimotor cortex localization | Intra-operative (median-nerve) somatosensory stimulation (phase-reversal algorithm) | MR angiography, motor-evoked potentials | fMRI failed correct localization in 4/5 patients due to edema or large cortical vein activation; MEG localized the sensory cortex correctly in all patients (agreement with intra-operative mapping in 4/5 patients) | N/A |
| Inoue et al. (1999) [23] | 11 (7 F) | Various (MG, lymphoma, cavernoma) in frontal/parietal areas | Pre-operative CS localization | Intra-operative (median-nerve) somatosensory stimulation (phase reversal and maximum amplitude algorithms) in 10 pts | MR angiography | By fMRI, the CS could not be defined in 7/11 affected hemispheres (wider activation areas including large veins). MEG defined it correctly in all, with agreement with intra-operative mapping | Coincidence in 9/11 patients for the affected hemisphere and in all for the healthy patients (and in all controls). In case of discrepancy (n = 2), intra-operative mapping confirmed MEG- and not fMRI-defined sulcus to be correct (in one case, fMRI defined the sulcus correctly following tumor resection) |
| Nimsky et al. (1999) [44] | 7 (6 F) | Various (glioma, cyst, metastasis, MG) adjacent to the motor cortex | Pre-operative central region localization | Intra-operative (median-nerve) somatosensory stimulation (phase-reversal algorithm) | None | Correct CS identification by both in all patients confirmed by intra-operative mapping (but MEG could not be performed in 2 patients because of severe artifacts or hemiparesis) | Correspondent results in all patients for both motor and sensory activations |
| Kober et al. (2001) [45] | 34 (24 F) | Various (glioma, angioma, cavernoma, cyst, epilepsy, MG, metastasis) adjacent to the motor cortex | Pre-operative central region localization | Intra-operative (median-nerve) somatosensory stimulation (phase-reversal algorithm) | None | CS localization successful in all cases using either fMRI or MEG (94% with sensory fMRI, 97% with motor fMRI, 97% with sensory MEG, and 79% with motor MEG). The latter could not be used in patients with hemiparesis, in which a small fMRI activity was detected. No clear superiority of one modality over the other | Overall, correspondent results, although localization significantly differed (Euclidean distance) for both sensory (15 ± 5 mm) and motor (10 ± 5 mm) activations |
| Kamada et al. (2003) [46] | 4 (1 F) | Various (glioma, cavernoma) involving the motor area | Pre-operative central region localization | Intra-operative (median-nerve) somatosensory stimulation (phase-reversal algorithm) | Anisotropic diffusion-weighted MRI | fMRI-MEG integration correctly identified the CS | N/A |
| Grummich et al. (2006) [47] | 90 | Various (glioma, AVM, metastasis, MG, other) in frontal or temporo-parietal areas of the dominant hemisphere | Pre-operative language mapping | Imaging-guided resection without post-operative sequelae; comparison with Wada test for 10 pts | Wada test for 10 pts | Broca and Wernicke’s areas correctly localized in all patients; however, fMRI data were too weak in the case of high-grade/large lesions and MEG data could not be used for tasks not performed regularly by the patients | Overall congruence in 77% of cases with greater agreement for Wernicke’s than Broca’s area |
| Kamada et al. (2006) [48] | 1 (M) + 20 as controls | Glioma in the right insula (in frontal/temporal areas for controls) | Pre-operative language mapping | Imaging-guided resection with mild post-operative language deficits + Wada test + control pts | Wada test | Both fMRI and MEG showed left-hemisphere dominance for expressive tasks and right-hemisphere dominance for receptive tasks (in agreement with findings from Wada test) | Concordant findings (not directly compared) for the word categorization task |
| Korvenoja et al. (2006) [49] | 15 (9 F) | Various (glioma, cavernous hemangioma, MG) close to the primary sensorimotor cortex | Pre-operative CS localization | Intra-operative (median-nerve) somatosensory stimulation (phase-reversal algorithm) and/or cortical stimulation (phase reversal) | None | MEG correctly localized the CS in all patients (N20m goodness-of-fit = 88.8–98.2%) and fMRI in 73% (in 27% it localized it in the post-central gyrus) | MEG dipoles within 1–6 mm Euclidean distance from nearest fMRI activation voxel and 6–36 mm from the fMRI maximal z-score voxel |
| Kamada et al. (2007) [50] | 22 (13 F) | Glioma in frontal/temporal areas of the language-dominant hemisphere | Pre-operative language mapping | Intra-operative cortical and subcortical mapping during execution of language tasks for 2 pts | Wada test, diffusion-tensor imaging | Both identified language areas and hemispheric language dominance correctly | N/A |
| Choudhri et al. (2013) [51] | 1 (F) | Glioma in the left inferior peri-rolandic cortex | Pre-operative facial motor area and language mapping | Imaging-guided resection; TMS | TMS, diffusion-tensor imaging and tracking | Both identified bilateral (but predominantly left-sided) language activation; agreement between MEG and TMS in localizing early somatosensory response; overall agreement between fMRI and TMS (slight discrepancy attributed to the use of different tasks) | N/A |
| De Martin et al. (2017) [52] | 4 (2 F) | Metastasis in the right-hand motor cortex | Pre-operative motor activity localization and dose planning | N/A | None | Both localized the functional areas, enabling reduced irradiation during CyberKnife treatment; in one pt, MEG could map functional area within the tumor | N/A |
| Izutsu et al. (2017) [53] | 1 (M) | Glioma in the right precentral gyrus | Pre-operative primary motor area localization | Imaging-guided resection without post-operative sequelae | None | Both showed motor activation shift to the post-central gyrus (and contralesional pre-central gyrus) | N/A |
| Zimmermann et al. (2019) [54] | 13 (4 F) | Glioma or AVM/hemangioma close to the sensorimotor cortex | Pre-operative sensorimotor cortex localization | Imaging-guided resection with general deficit improvement + 3 (1 F) healthy controls | None | fMRI–MEG agreement in the detection of functional reorganization in five pts. In one pt, MEG data were affected by severe artifacts | 60% of MEG localizations mapped within fMRI activations (the remaining localized at a mean Euclidean distance of 3.8 mm for sensory fields with sLORETA and 7.4 mm for motor fields with MNE) |
| Ellis et al. (2020) [11] | 19 | Various (glioma, cavernoma, metastasis) close to eloquent areas | Pre-operative motor and language mapping and quantitative assessment of its accuracy | Intra-operative somatosensory stimulation (phase-reversal algorithm) and direct cortical stimulation. Computation of the Youden’s J statistics to assess imaging mapping sensitivity and specificity (at a given distance between intra-operative and imaging localizations) | None | Accuracy highly dependent on distance to direct cortical stimulation site: highest accuracy (J statistic) for both motor and language fMRI at a 5-mm distance and for MEG at 40-mm distance for motor mapping and 15 mm distance for language mapping. fMRI–MEG combination increased accuracy. | Poor overlap between locations identified by each modality at the most commonly used 10-mm distance |
| Zimmermann et al. (2020) [55] | 18 (8 F) | Various (glioma, cavernoma, MG) in the left, language-dominant hemisphere | Pre-operative language mapping | Imaging-guided resection with general deficit improvement + 3 (1 F) healthy controls | Diffusion-tensor imaging | fMRI could not identify the activity in 5/13 language areas in 3/18 patients (with vascular/hemorrhagic alterations), whereas MEG provided strong activations | Excluding areas in which fMRI could not identify activity, congruent activations (mean Euclidean distance = 10.58 mm for activation maxima and 9.06 mm for centroids) |
| Quiñones et al. (2021) [56] | 5 (all M) | Glioma (all low-grade) in brain areas involved in bilingual language | Language mapping changes in bilinguals between pre- and post-surgery | N/A | None | Both revealed post-operative reorganization taking place for the two languages differently | Complementary and even convergent findings between the alpha/theta longitudinal indexes and fMRI longitudinal lateralization indexes |
| fMRI | MEG | |||||||||
|---|---|---|---|---|---|---|---|---|---|---|
| Authors | Tomograph | Imaging Sequence | Spatial Resolution | Task | Design | Activation Map Definition | Equipment | Task | Source Localization | Co-Registration to MRI |
| Morioka et al. (1995) [28] | 1.5 T | EPI | FOV = 240 × 180 mm2, matrix = 256 × 128, slice thickness = 7 mm | Self-paced hand clenching | N/A | Identification of hyperintense activated region | 37-channel neuro-magnetometer | Finger (no. 1, 2, and 5) stimulation (ISI = 400–500 ms, sampling rate = 520 Hz, filtering: 1–55 Hz) | ECD (N20 current peak) | ECD superimposition on MR images |
| Inoue et al. (1999) [23] | 1.5 T | Gradient-echo EPI | FOV = 240 × 240 mm2, matrix = 64 × 64, slice thickness = 10 mm | Hand clenching once/sec (30 sec/block) | Three activation and three resting blocks (10 EPI volumes each) | Cross-correlation (coefficient > 0.06 or >0.08) | MR-linked 122-channel system | Median nerve stimulation (200 stimuli, sampling rate = 1280 Hz, filtering = 0.03–400 Hz) | ECD (N20m current peak) | ECD superimposition on MR images |
| Nimsky et al. (1999) [44] | 1.5 T | EPI | FOV = 200 × 200 mm2, matrix = 64 × 64 (interpolated 128 × 128), slice thickness = 3 mm | Motor activation: hand clenching (once/sec); sensory activation: finger tactile stimulation (ISI = 800 ms) | Three activation and three resting blocks (10 EPI volumes each) | Cross-correlation (coefficient > 0.65 for motor and >0.55 for sensory activation) | 2 × 37-channel bio-magnetometer | Motor activation: brisk index finger flection (100 stimuli, ISI = 3000–5000 ms, sampling rate = 520.8 Hz, filtering = 1–100 Hz); sensory activation: see fMRI (200 stimuli, sampling rate = 1041.7 Hz, filtering = 1–200 Hz) | Single ECD (first peak for motor activation and M30 for sensory activation; correlation > 0.95) | ECD superimposition on MR images (by contour-fit algorithm) |
| Kober et al. (2001) [45] | 1.5 T | EPI | FOV = 200 × 200 mm2, matrix = 64 × 64 (interpolated 128 × 128), slice thickness = 3 mm | Motor activation: hand clenching (once/sec); sensory activation: finger tactile stimulation (ISI = 800 ms) | Three activation and three resting blocks (10 EPI volumes each) | Cross-correlation (coefficient > 0.65 for motor and >0.55 for sensory activation) | 2 × 37-channel bio-magnetometer | Motor activation: brisk finger flection (100 stimuli, ISI = 3000–5000 ms, sampling rate = 520.8 Hz, filtering = 0.1–100 Hz); sensory activation: see fMRI (200 stimuli, ISI = 800 ms, sampling rate = 1041.7 Hz, filtering = 1–200 Hz) | Single ECD (P35m current peak; correlation > 0.95 or + current localization by spatial filtering if <0.95) | ECD superimposition on MR images (by contour-fit algorithm) |
| Kamada et al. (2003) [46] | 1.5 T | EPI | FOV = 300 × 300 mm2, matrix = 128 × 128, slice thickness = 5 mm (2.5 mm gap) | Self-paced finger tapping (approximately once/sec) | Three activation and four resting blocks (five EPI volumes each) | Cross-correlation (Z > 3.5) | 204-channel bio-magnetometer | Median nerve stimulation (200 stimuli, ISI = 211 ms, filtering (averaged signals) = 1–70 Hz) | Single ECD (N20m current peak; correlation > 0.95 and confidence volume < 200 mm3) | ECD superimposition on MR images |
| Grummich et al. (2006) [47] | 1.5 T | EPI | Voxel size = 3 mm3 | Visually presented tasks selected according to the patient’s clinical features: word-reading task (300 stimuli), sentence-reading task (61 stimuli), picture-naming task (75 stimuli), verb-generation task, arithmetic task. ISI = 900–2000 ms | Six activation blocks interleaved with resting blocks | Cross-correlation (coefficient > 0.03, p < 0.000045, k ≥ 6) | 2 × 37-channel bio-magnetometer | See fMRI (but with ISI = 1200–2300 ms, sampling rate = 520.8 Hz, filtering = 0.1–200 Hz + 0.03–1 Hz) | Single ECD (correlation > 0.94 or current-density reconstruction for lower correlations) | ECD superimposition on MR images (by contour-fit algorithm) |
| Kamada et al. (2006) [48] | 1.5 T | EPI | FOV = 260 × 260 mm2, matrix = 64 × 128, slice thickness = 4 mm (2 mm gap) | Two tasks: expressive task (verb generation from acoustically presented nouns (ISI = 1600–2400 ms)) and receptive task (word categorization of visually displayed words (ISI = 1800–2200 ms)). | Three activation and four resting blocks (five EPI volumes each) | Z-score estimation (clusters with Z > 2.2 and k > 10) | 204-channel bio-magnetometer | Word categorization of visually displayed words (150 stimuli, ISI = 2800–3200 ms, filtering (averaged signals) = 0.01–30 Hz) | Single ECD (+multiple-current estimates to confirm results; correlation > 0.90) | ECD superimposition on MR images |
| Korvenoja et al. (2006) [49] | 1.5 T | Gradient-echo EPI | FOV = 256 × 256 mm2, matrix = 128 × 128, slice thickness = 3 mm | Self-paced hand clenching | Alternated activation and resting blocks (91–128 EPI volumes) | Z-score estimation (clusters with Z > 1.6 and neighborhood weighting = 0.427) | 122- or 306-channel magnetometer | Median-nerve stimulation (about 200 stimuli, sampling rate = 987 Hz, filtering = 0.03–320 Hz) | ECD (N20m current peak) | ECD superimposition on MR images |
| Kamada et al. (2007) [50] | 1.5 T | EPI | FOV = 260 × 260 mm2, matrix = 64 × 128, slice thickness = 4 mm (2 mm gap) | Verb generation from acoustically presented nouns (ISI = 1600–2400 ms) | Three activation and four resting blocks (five EPI volumes each) | Z-score estimation (clusters with Z > 2.2) | 204-channel bio-magnetometer | Word categorization of visually displayed words (150 stimuli, ISI = 2800–3200 ms, filtering (averaged signals) = 0.01–30 Hz) | Single ECD (N400m current peak; correlation = > 0.85) | ECD superimposition on MR images |
| Choudhri et al. (2013) [51] | 3 T | N/A | N/A | Motor tasks: tongue movement and lip puckering; language tasks: silent word generation, object naming, and sentence completion | Alternated activation and resting blocks (five volumes each) | N/A | 248-magnetomer system | Motor activation: index finger stimulation; language activation: auditory word recognition (sampling rate = 508 Hz, frequency range = 0.1–20 Hz) | N/A | Dipole superimposition on MR images |
| De Martin et al. (2017) [52] | 3 T | Gradient-echo EPI | Voxel size = 2.5 mm3 | Two tasks: hand lifting and hand lowering (21 sec/block) | 20 activation blocks alternated with resting blocks | GLM (voxels with p < 0.01 and Bonferroni correction) | 306-channel neuro-magnetometer | Brisk hand extension following a visual stimulation (at least 100 stimuli, sampling rate = 1000 Hz, filtering = 0.01–100 Hz) | dSPM (movement-related field peak; threshold = 80% of maximum value) | ECD superimposition on MR images (by iterative closest-point algorithm) |
| Izutsu et al. (2017) [53] | 3 T | Single-shot EPI | Voxel size = 3 mm3 (3.75 mm gap) | Hand grasping (15 sec/block) | Three alternated activation and resting blocks | GLM (clusters with t > 4.0) | 160-channel system | Hand grasping following either visual or auditory stimulation (ISI = 5500 ms, sampling rate = 1000 Hz, filtering > 200 Hz) | Event-related desynchronization (synthetic aperture magnetometry—a beamforming approach—to compute power changes in theta, alpha, beta, and low- and high-gamma bands) | N/A |
| Zimmermann et al. (2019) [54] | 1.5 T | EPI | FOV = 192 × 192 mm2, matrix = 64 × 64, slice thickness = 3 mm | Two tasks: flection-extension of all digits or toes | Three activation and three resting blocks (30 EPI volumes each) | Linear correlation (coefficient > 0.03, p < 0.000045, and clusters with k ≥ 4) | 248-magnetomer system | Flection-extension of digits two to five or toes (two separate tasks) following a tactile stimulation (300 stimuli, ISI = 3600 ms, sampling rate = 678 Hz, filtering = 0.01–200 Hz) | MNE, dSPM, sLORETA | ECD superimposition on MR images |
| Ellis et al. (2020) [11] | 3 T | Single-shot fast-field EPI | Voxel size = 3 mm3 | Motor tasks: finger tapping, foot movement, and lip pursing (following an acoustic signal (ISI = 1000 ms)); language task: word reading (15 sec/block) | 10 activation and 10 resting blocks (five EPI volumes each) | Thresholded by eye | 306-channel system (102 magnetometers and 204 planar radiometers) | Motor tasks (11 patients): finger tapping, foot movement, and face movement, following an auditory stimulation (about 120 stimuli, ISI = 3500–4000 ms); language task (11 patients): word reading (ISI = 3000 ms) (for both: sampling rate = 1000 Hz, filtering = 0.01–330 Hz) | Single ECD (Nelder-Mead nonlinear search algorithm; ≥90% variance and 95% confidence volumes < 3 cm) | ECD superimposition on MR images (by iterative closest-point algorithm and using a spherically symmetric single-conductor head model) |
| Zimmermann et al. (2020) [55] | 1.5 T | EPI | FOV = 192 × 192 mm2, matrix = 64 × 64, slice thickness = 3 mm | Two tasks: verb conjugation and sentence building (up to 150 stimuli each) | Three activation and three resting blocks (30 EPI volumes each) | Linear correlation (coefficient > 0.03, p < 0.000045, and clusters with k ≥ 4—or until signal appearance) | 248-magnetomer system | Two tasks: verb-conjugation task (300 stimuli, ISI = 3000 ms) and sentence-building task (300 stimuli, ISI = 2000 ms) from visually presented words (for both: sampling rate = 678 Hz, filtering = 0.1–200 Hz (0.03–95 Hz for averaged signals) + 50- and 60-Hz Notch) | dSPM | ECD superimposition on MR images |
| Quiñones et al. (2021) [56] | 3 T | EPI | voxel size = 2 mm3 | Naming task (object- and action-naming) in the two known languages (44 stimuli for each category, ISI = 2000–8000 ms) | event-related design (368 EPI) | Robust weighted least-squares regression with FDR correction (p < 0.05, height Threshold: p < 0.001, and k > 50) | 360-channel system | See fMRI (but ISI = 2000–3000 ms, sampling rate = 1000 Hz, filtering = 0.01–330 Hz) | Time-frequency representations (cluster-based permutation approach to compute power changes in theta, alpha, and beta bands) | ECD superimposition on MR images |
Disclaimer/Publisher’s Note: The statements, opinions and data contained in all publications are solely those of the individual author(s) and contributor(s) and not of MDPI and/or the editor(s). MDPI and/or the editor(s) disclaim responsibility for any injury to people or property resulting from any ideas, methods, instructions or products referred to in the content. |
© 2023 by the authors. Licensee MDPI, Basel, Switzerland. This article is an open access article distributed under the terms and conditions of the Creative Commons Attribution (CC BY) license (https://creativecommons.org/licenses/by/4.0/).
Share and Cite
Cargnelutti, E.; Tomasino, B. Pre-Operative Functional Mapping in Patients with Brain Tumors by fMRI and MEG: Advantages and Disadvantages in the Use of One Technique over the Other. Life 2023, 13, 609. https://doi.org/10.3390/life13030609
Cargnelutti E, Tomasino B. Pre-Operative Functional Mapping in Patients with Brain Tumors by fMRI and MEG: Advantages and Disadvantages in the Use of One Technique over the Other. Life. 2023; 13(3):609. https://doi.org/10.3390/life13030609
Chicago/Turabian StyleCargnelutti, Elisa, and Barbara Tomasino. 2023. "Pre-Operative Functional Mapping in Patients with Brain Tumors by fMRI and MEG: Advantages and Disadvantages in the Use of One Technique over the Other" Life 13, no. 3: 609. https://doi.org/10.3390/life13030609
APA StyleCargnelutti, E., & Tomasino, B. (2023). Pre-Operative Functional Mapping in Patients with Brain Tumors by fMRI and MEG: Advantages and Disadvantages in the Use of One Technique over the Other. Life, 13(3), 609. https://doi.org/10.3390/life13030609