
Recovery after Running an “Everesting” Mountain Ultramarathon

Abstract
:1. Introduction
2. Case Report
2.1. Participant and Ethical Approval
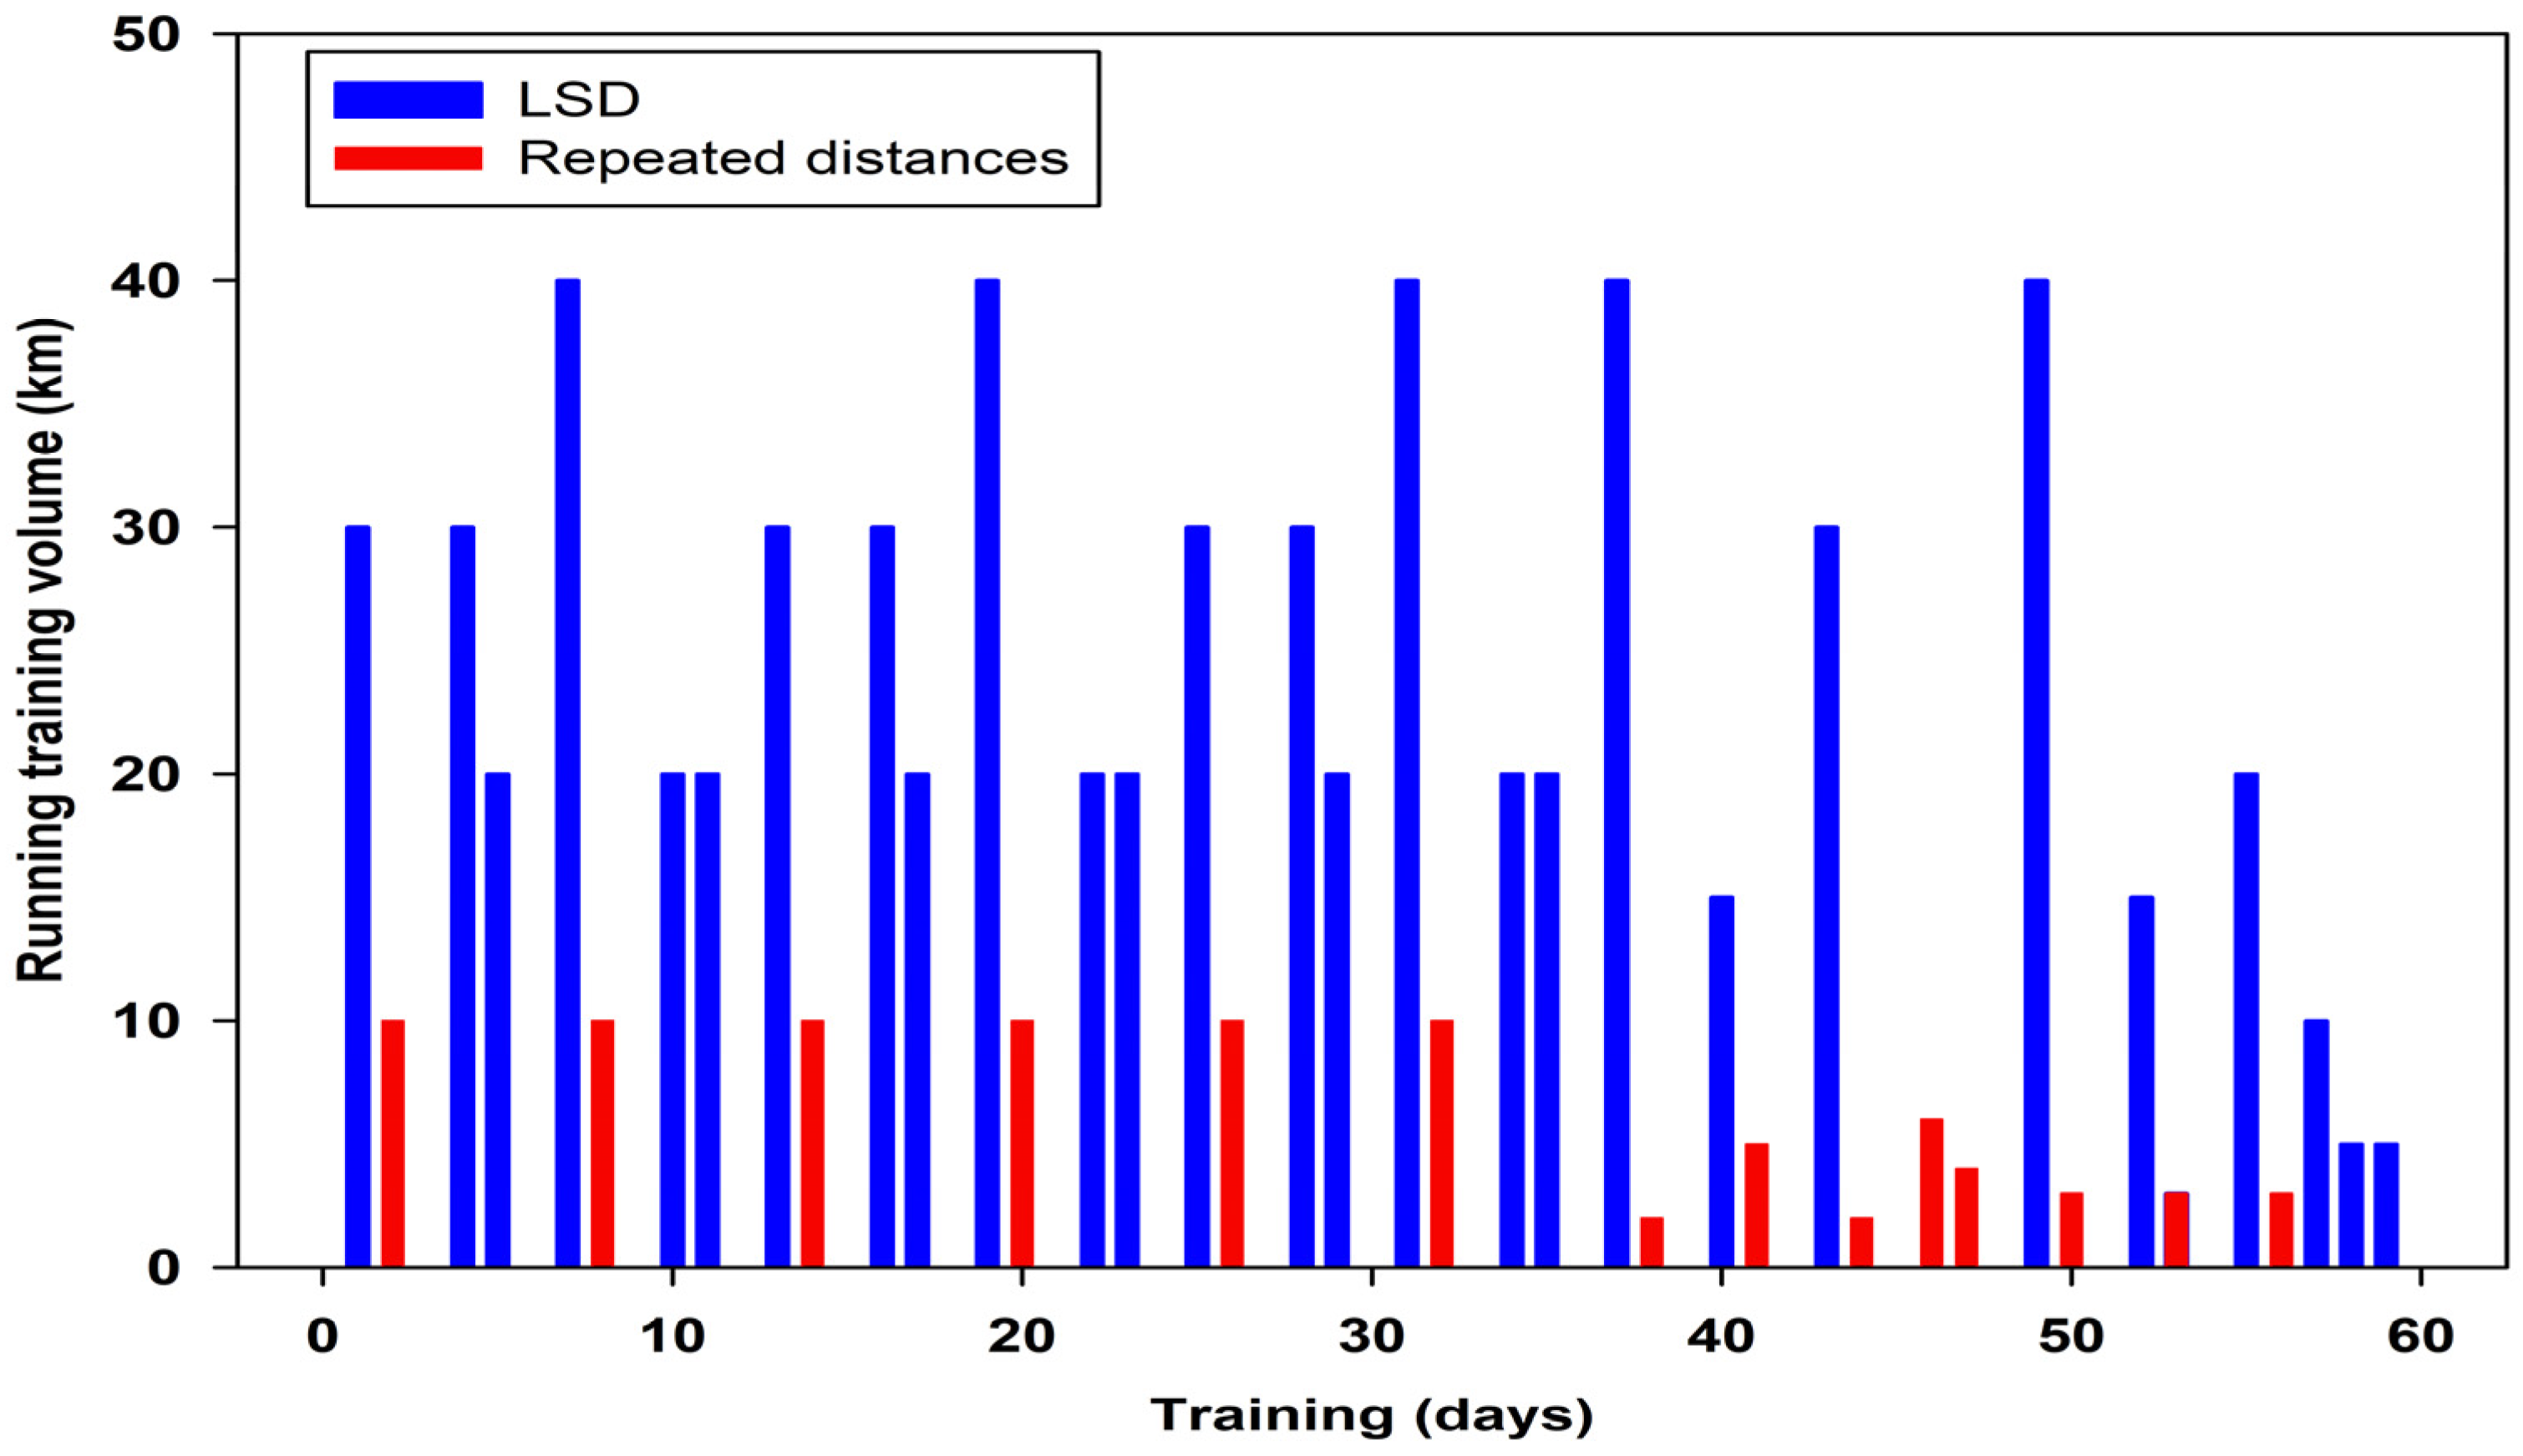
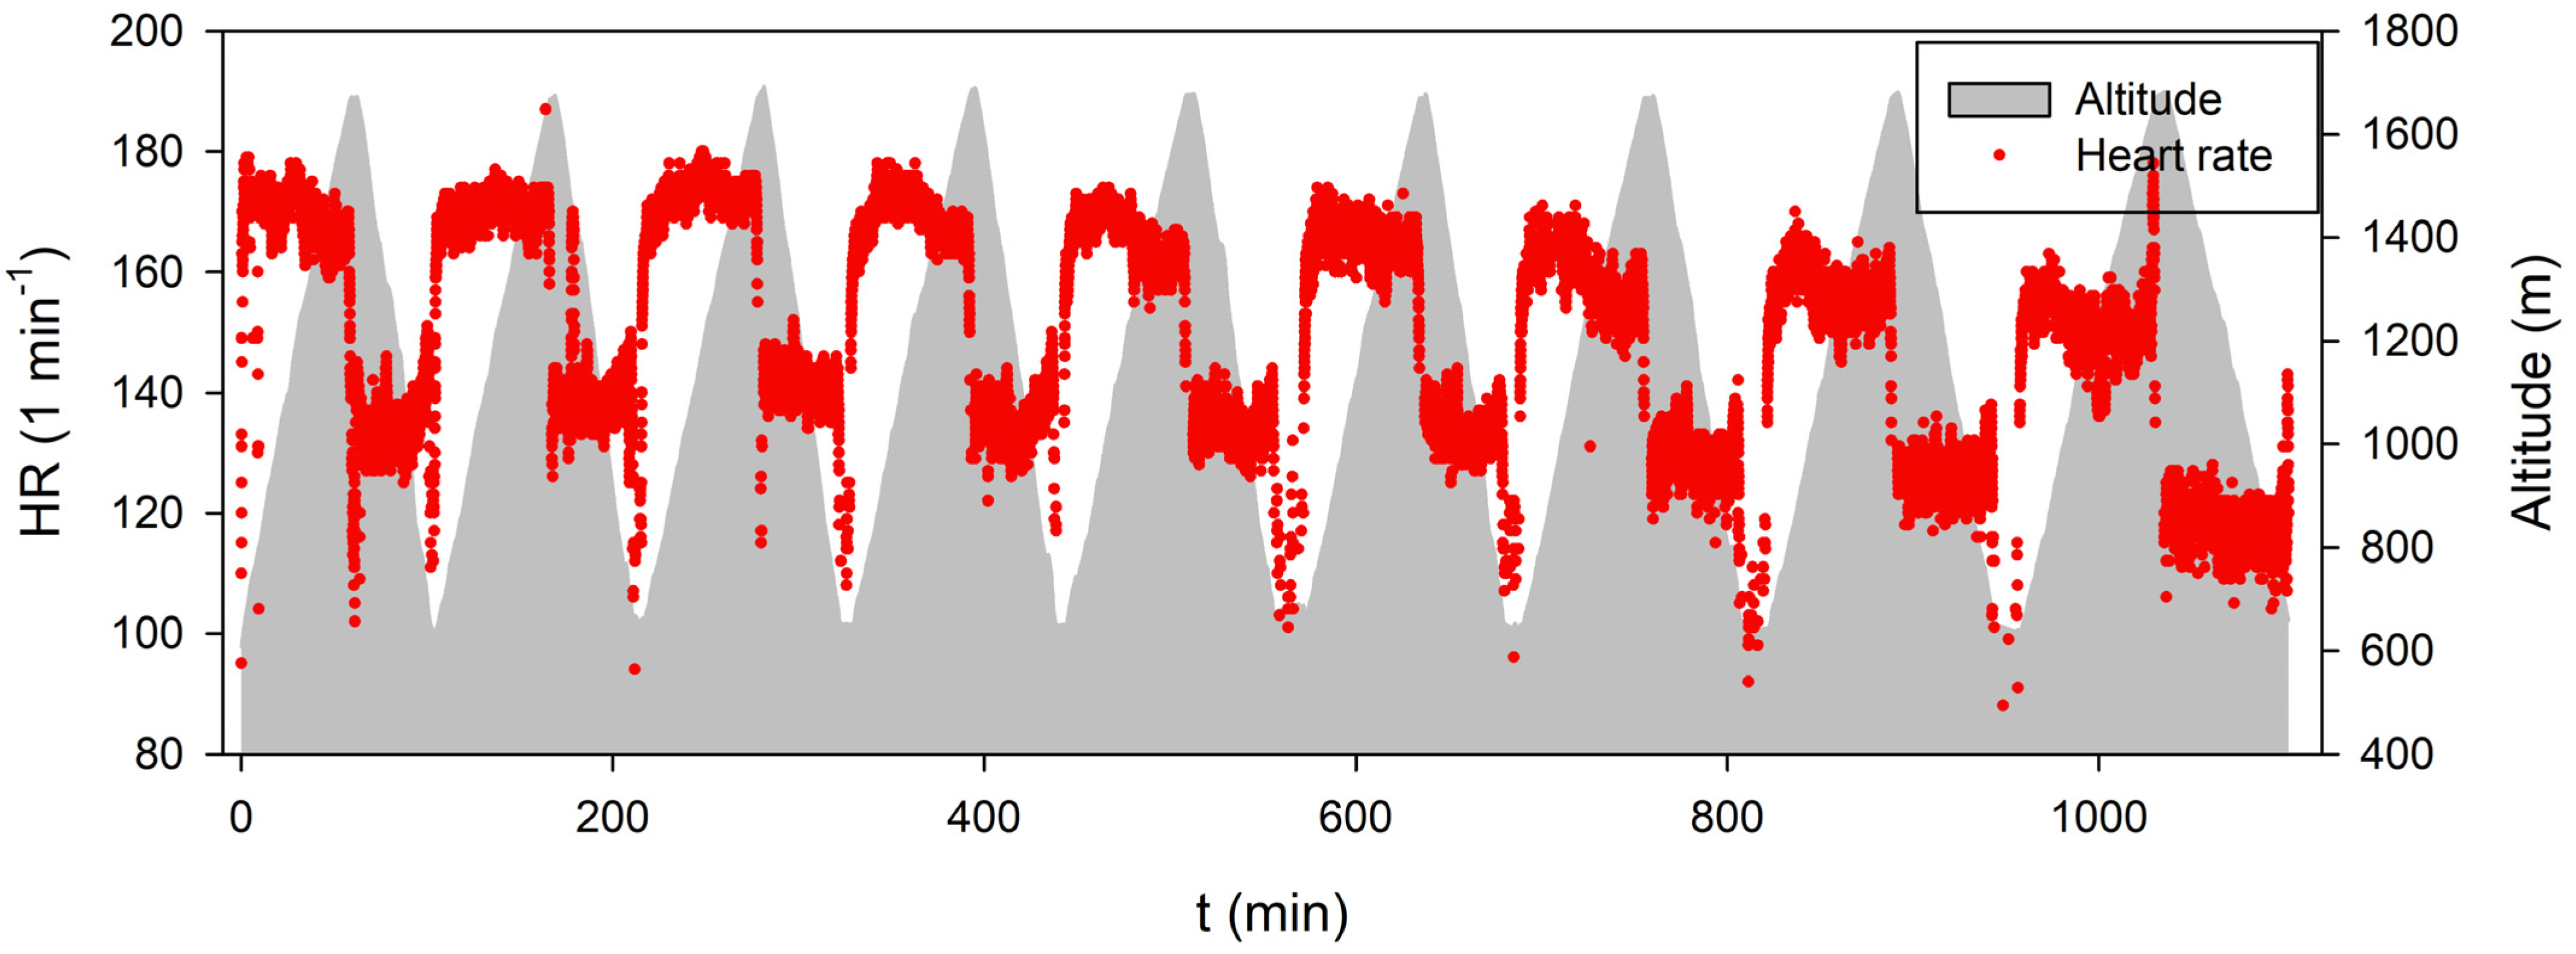
2.2. Experimental Design and Protocol
2.3. Measurements
2.3.1. Haematological Measurements
2.3.2. Body Composition
2.3.3. Incremental Testing Protocol
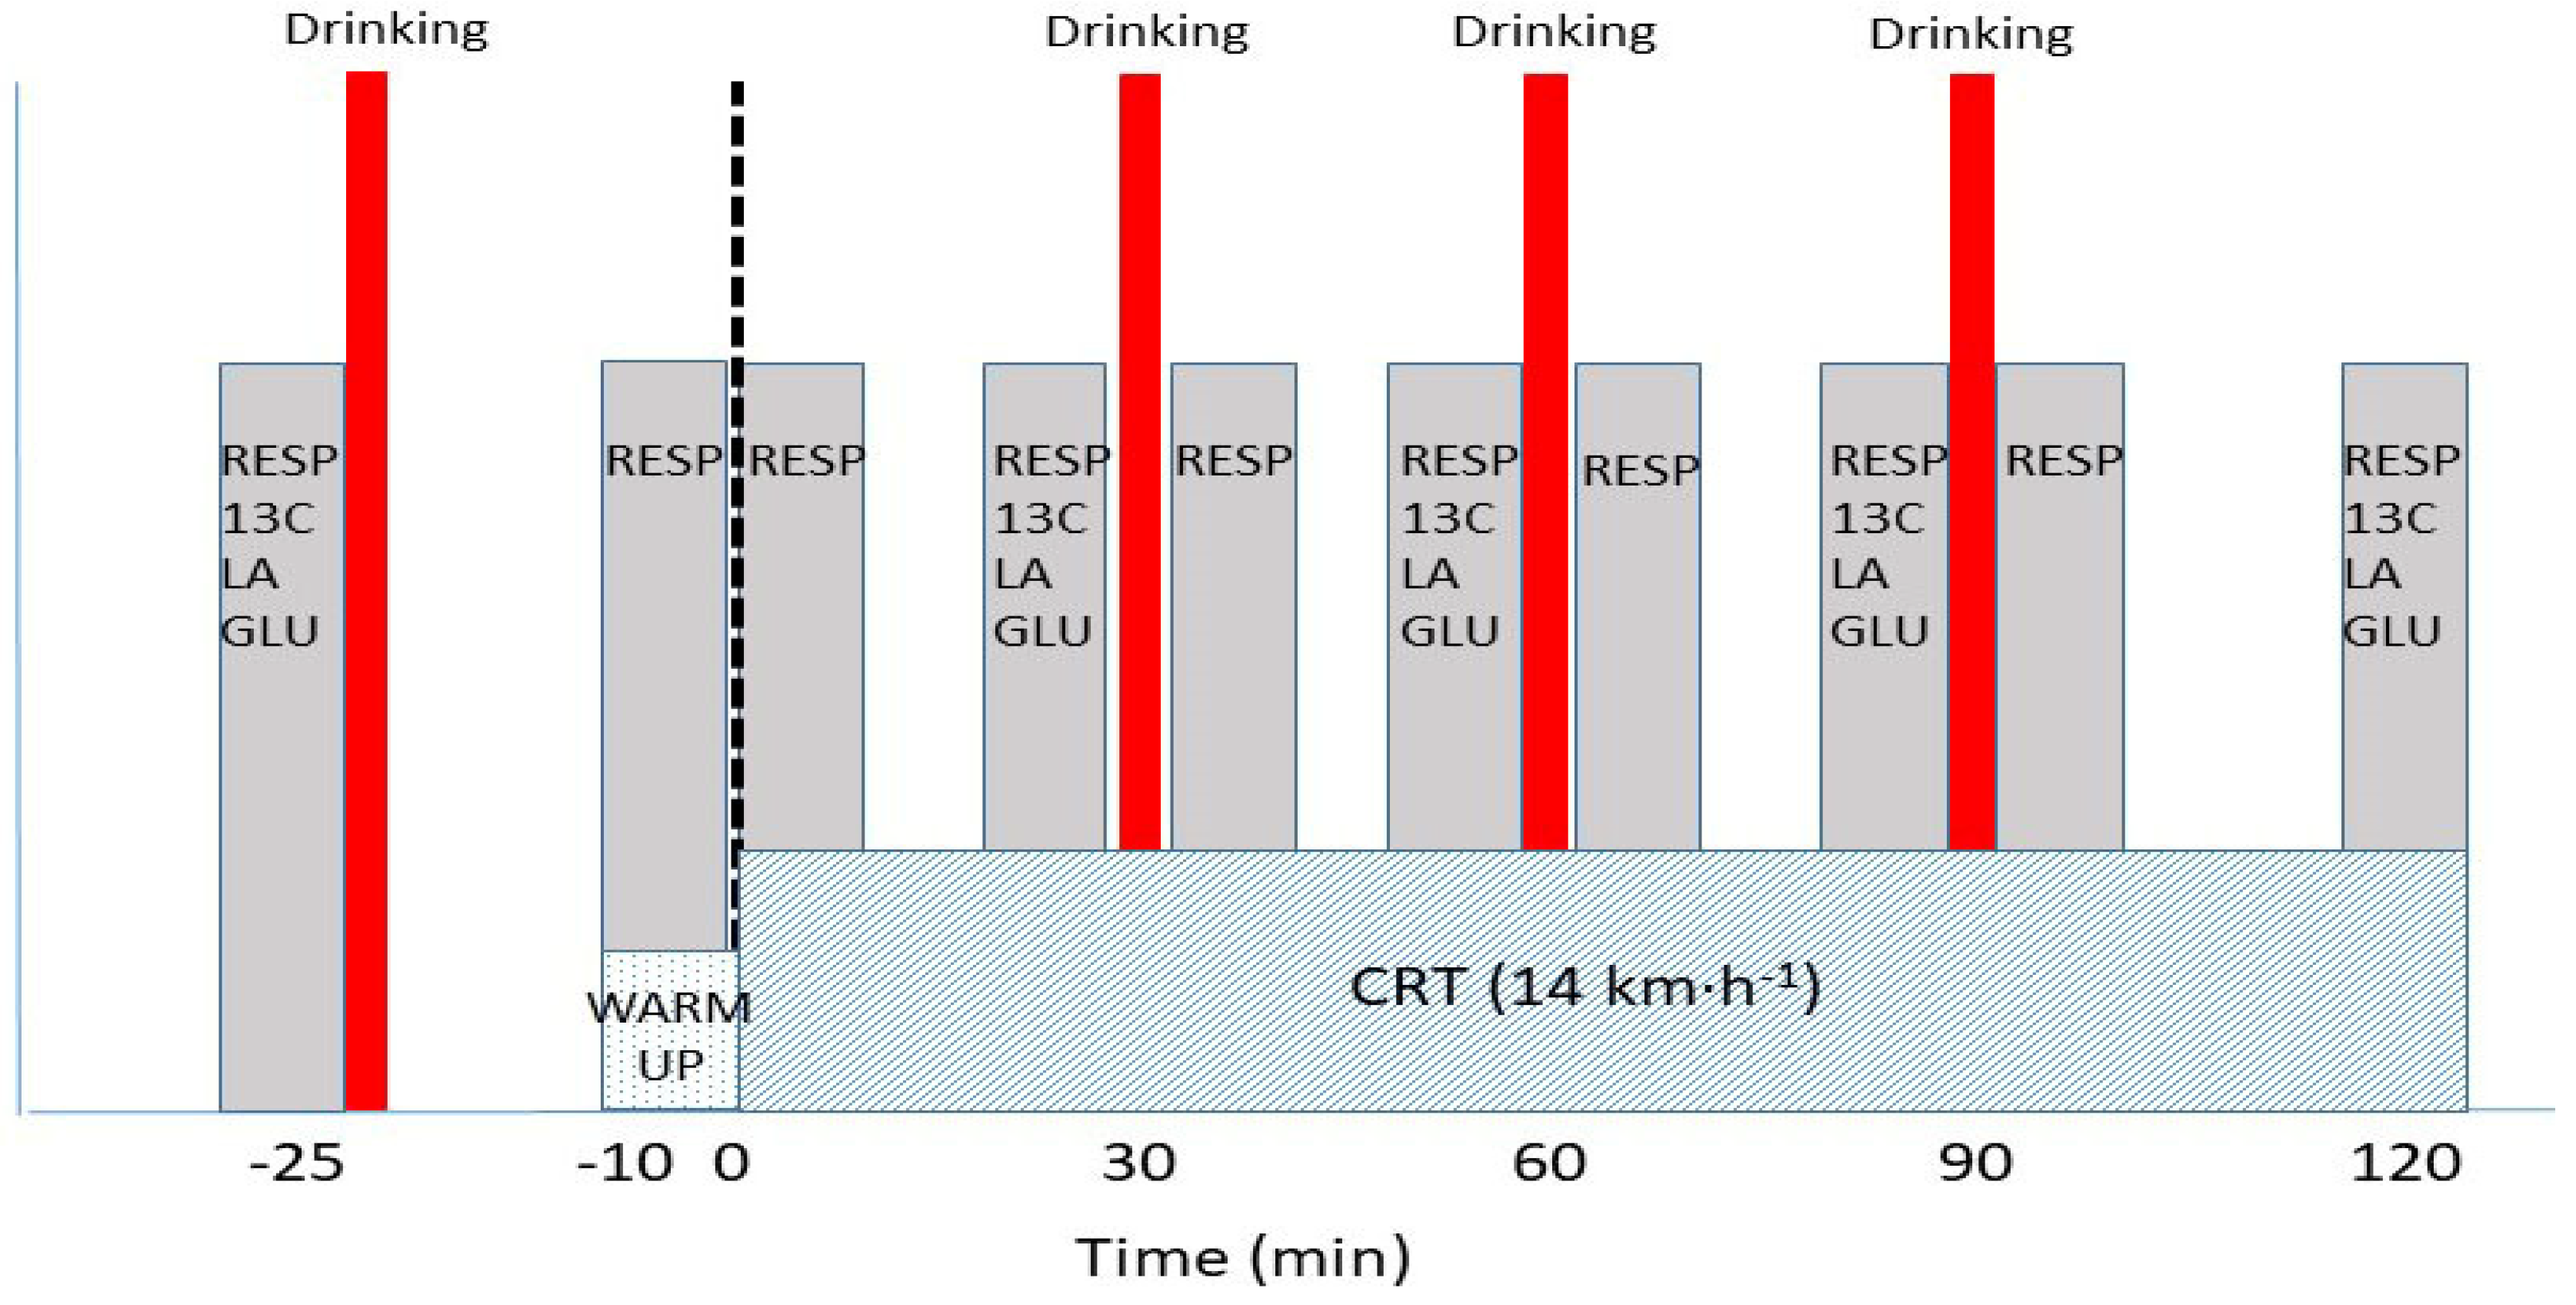
2.3.4. Continuous Running Test (CRT)
2.3.5. Calculations
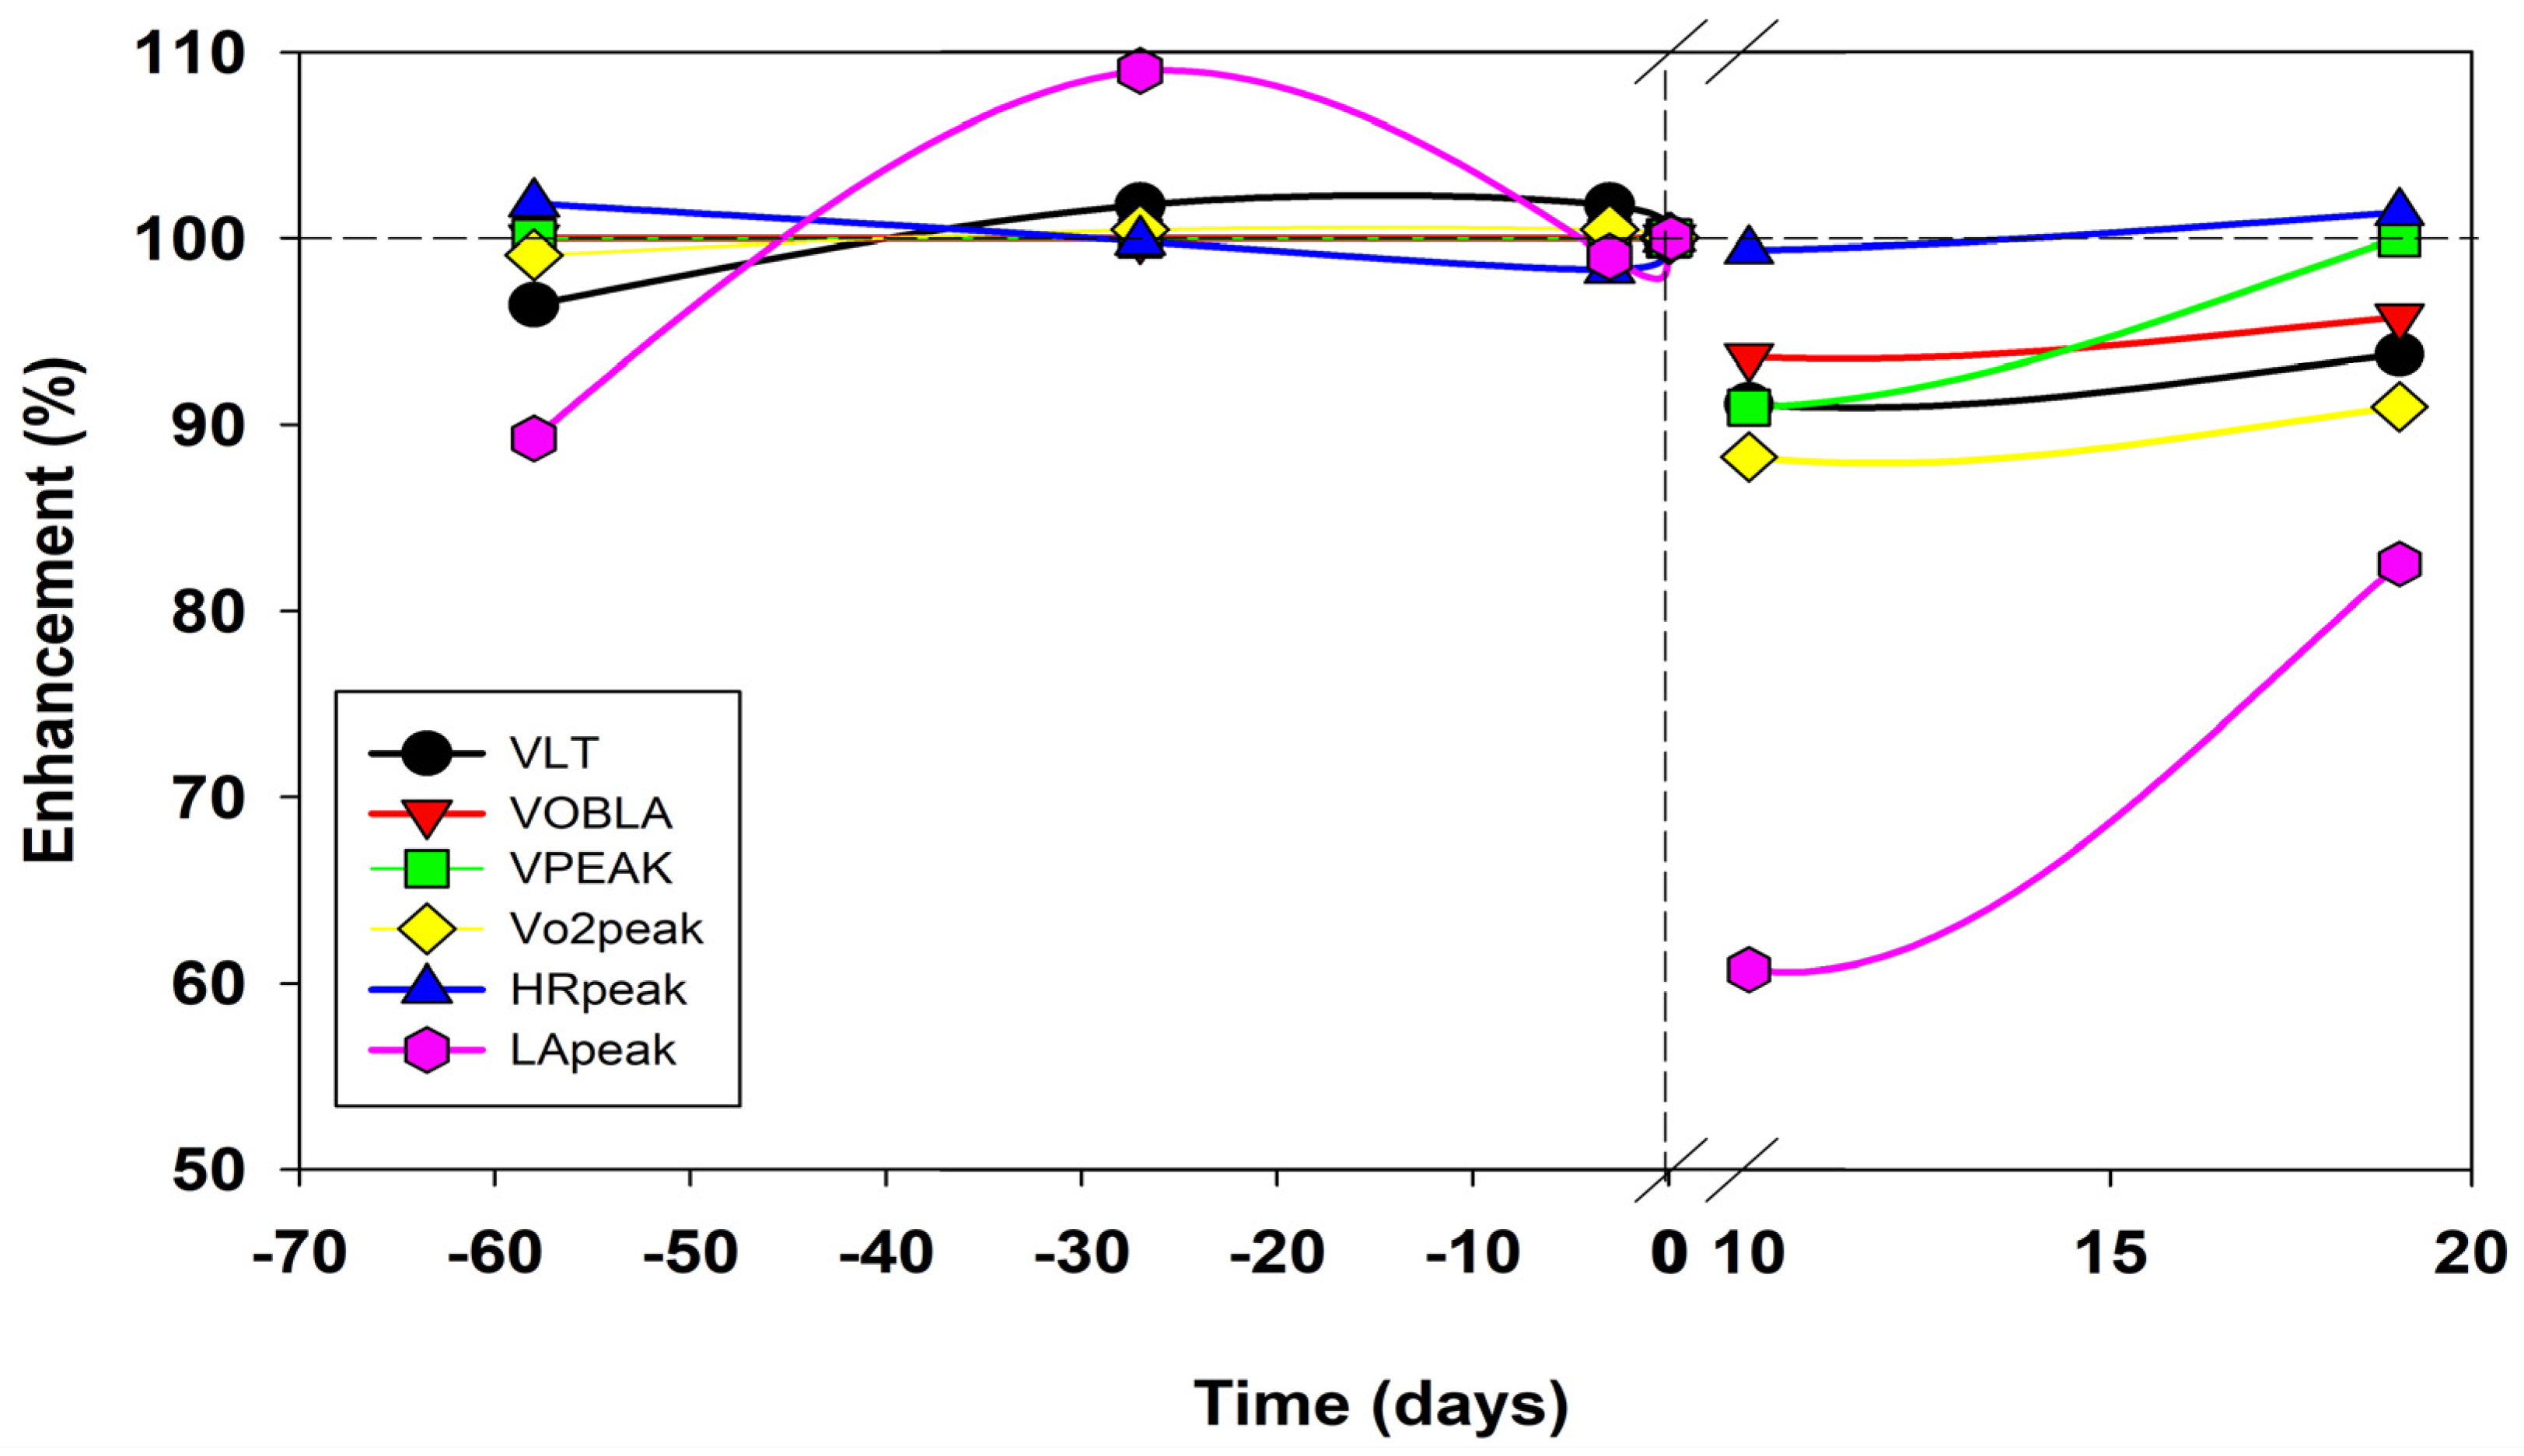
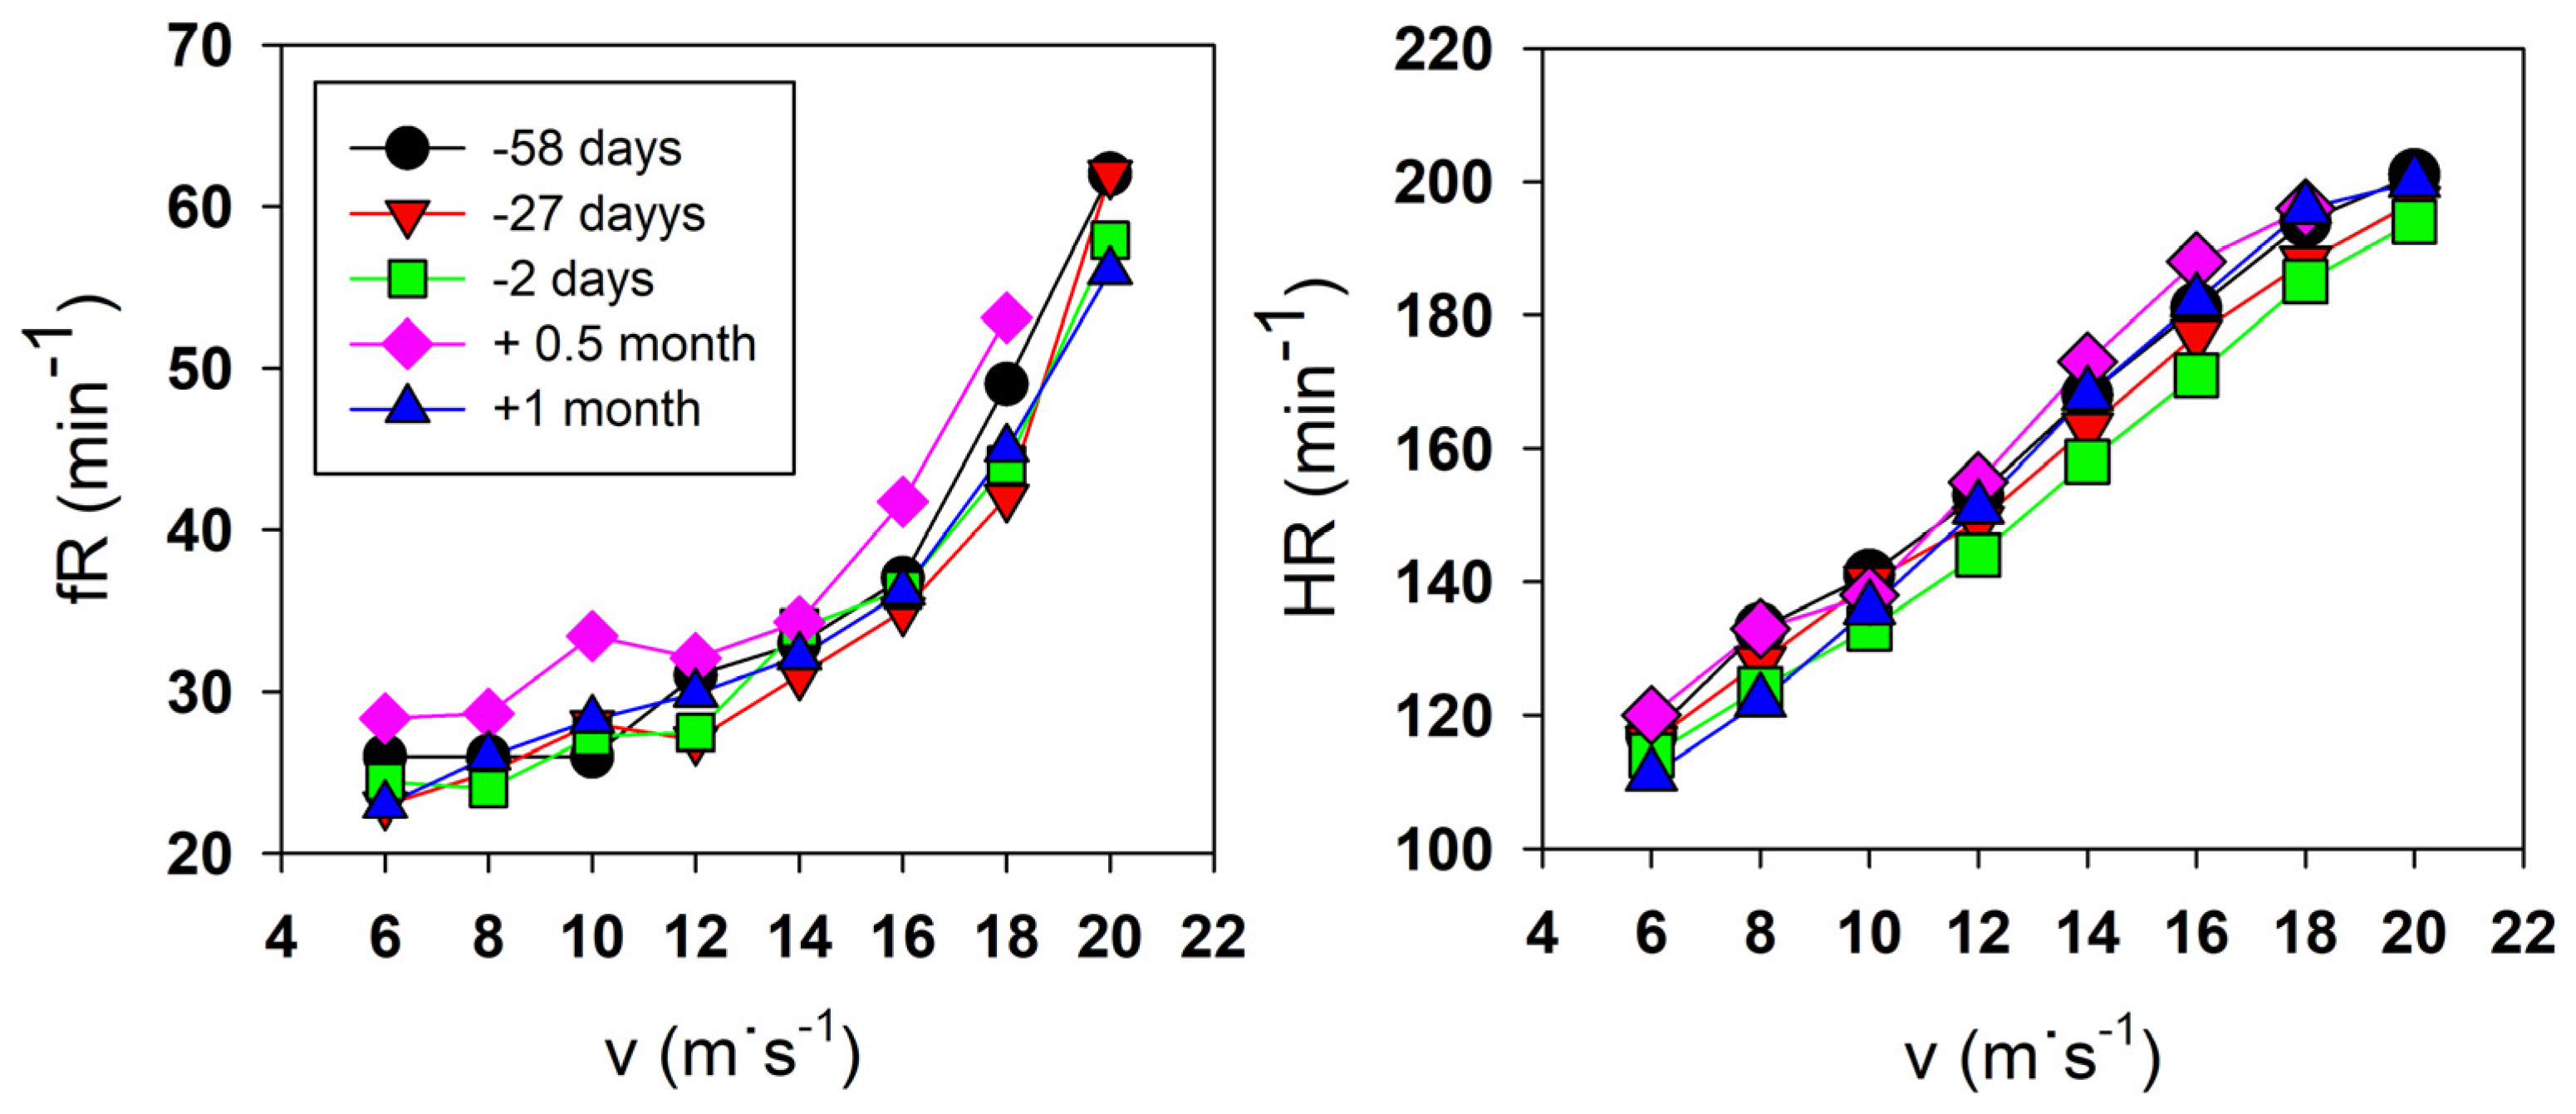
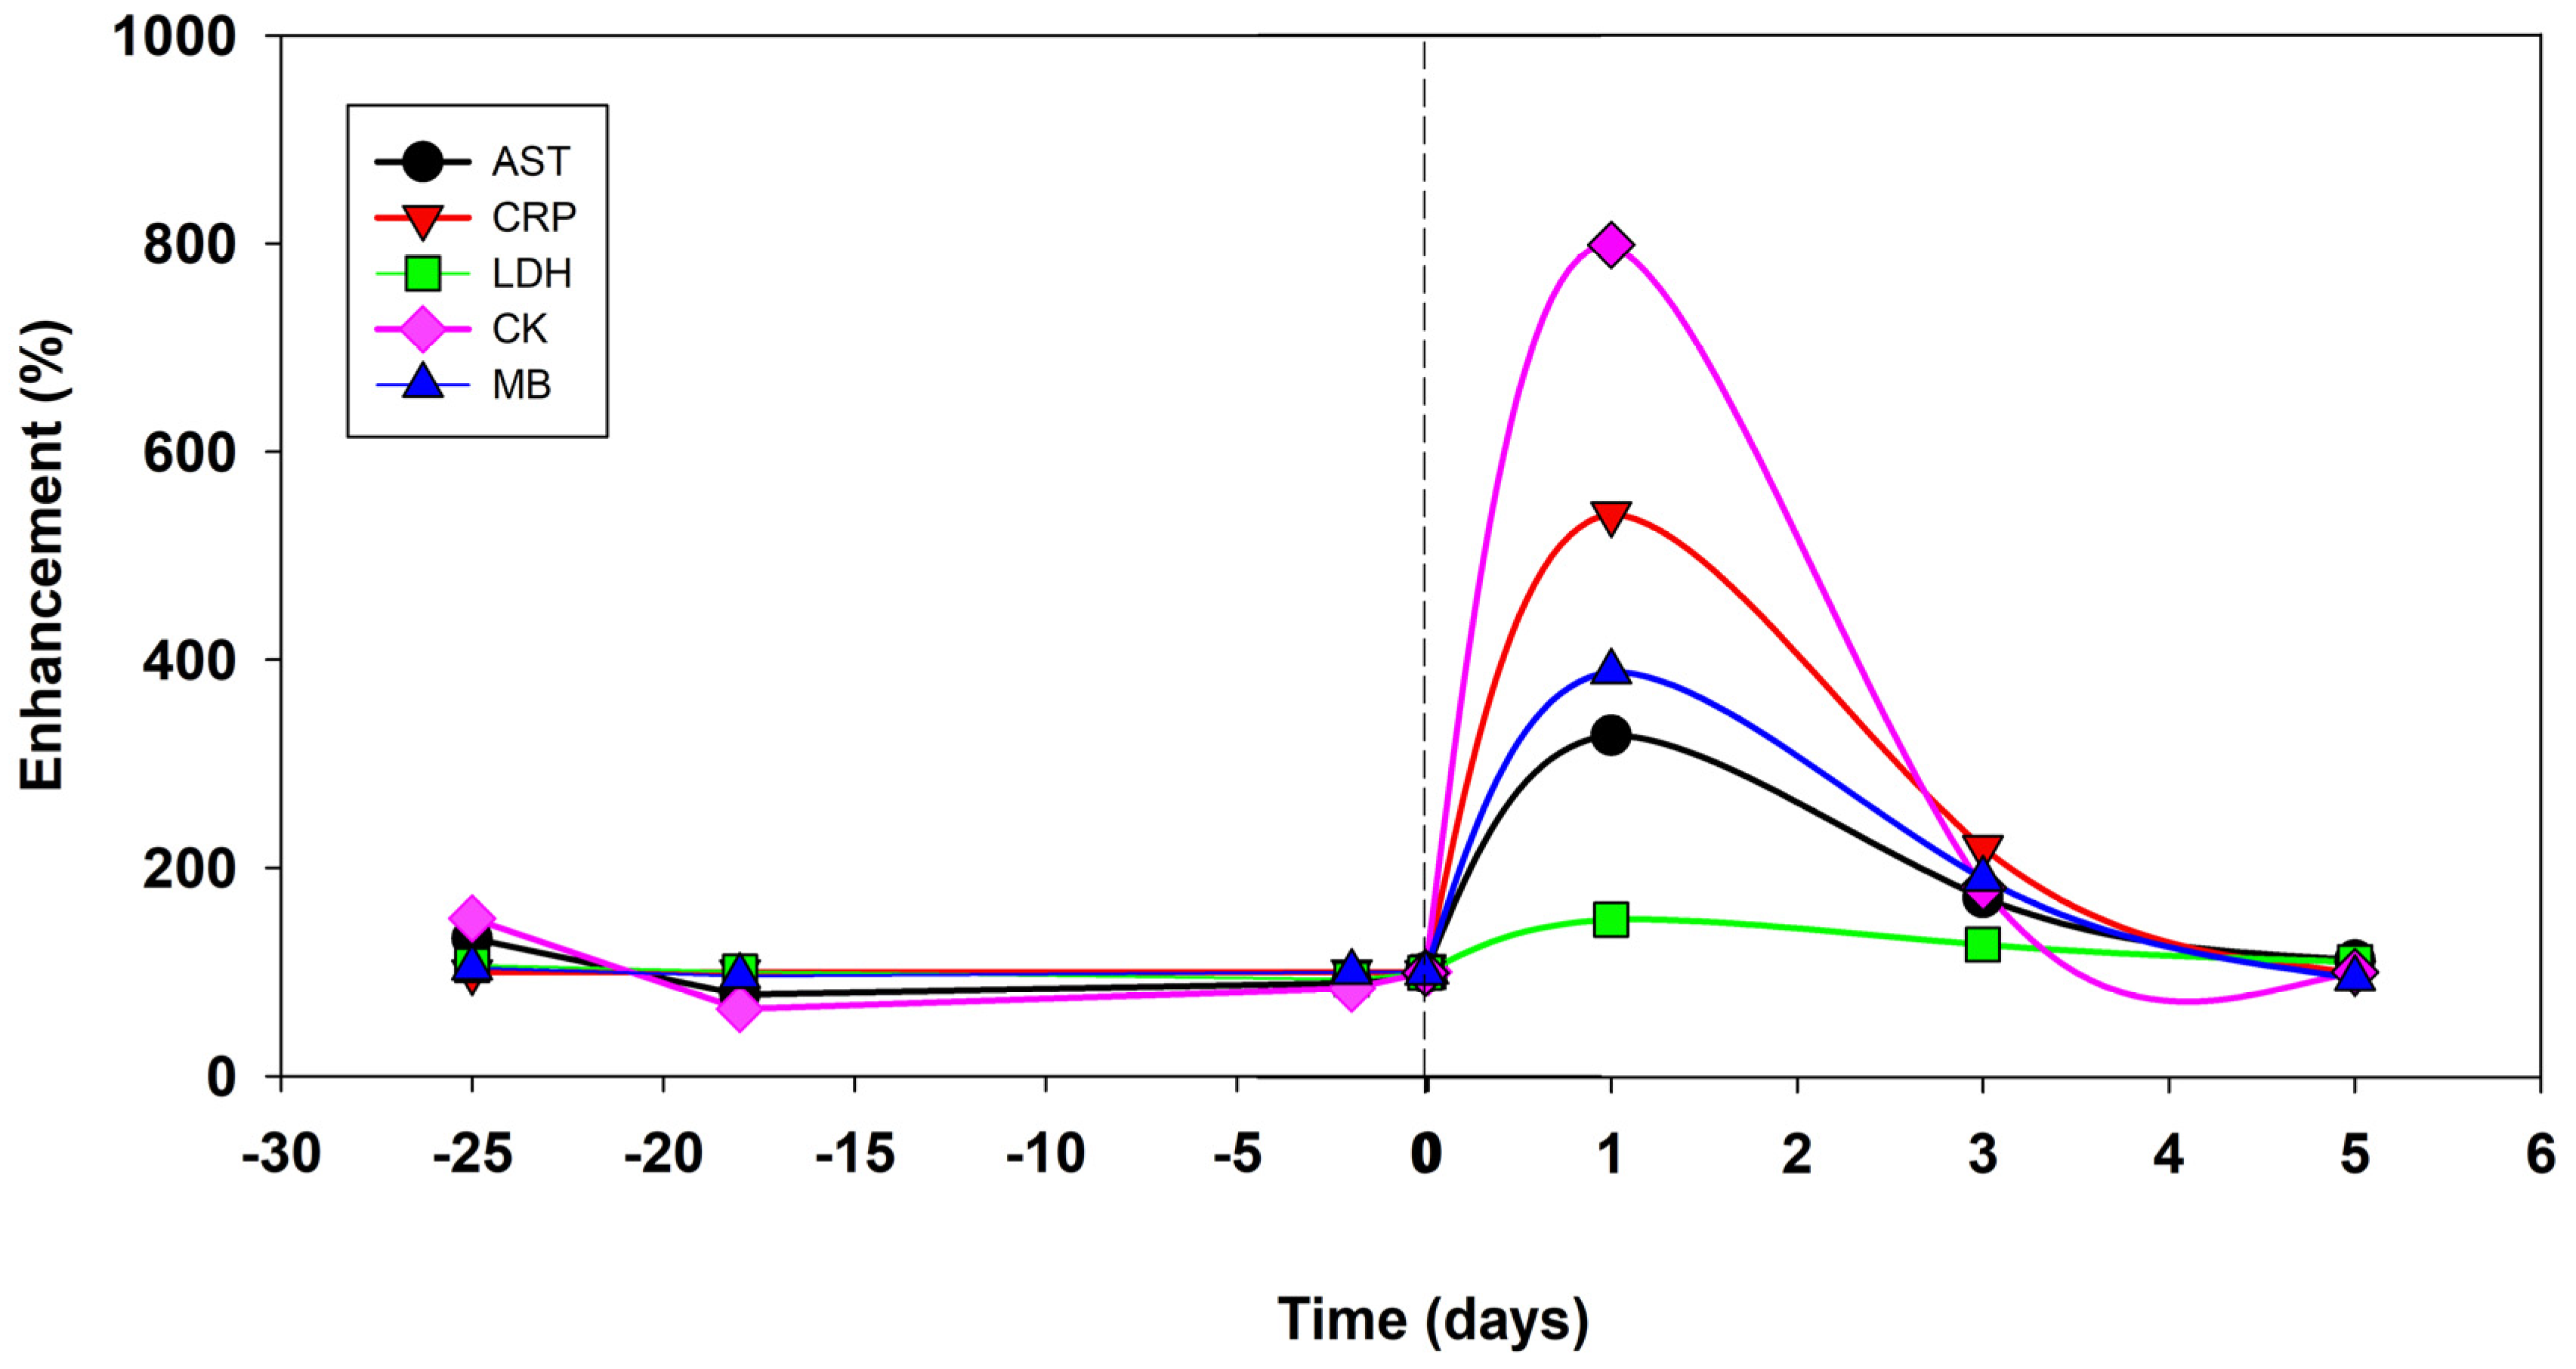
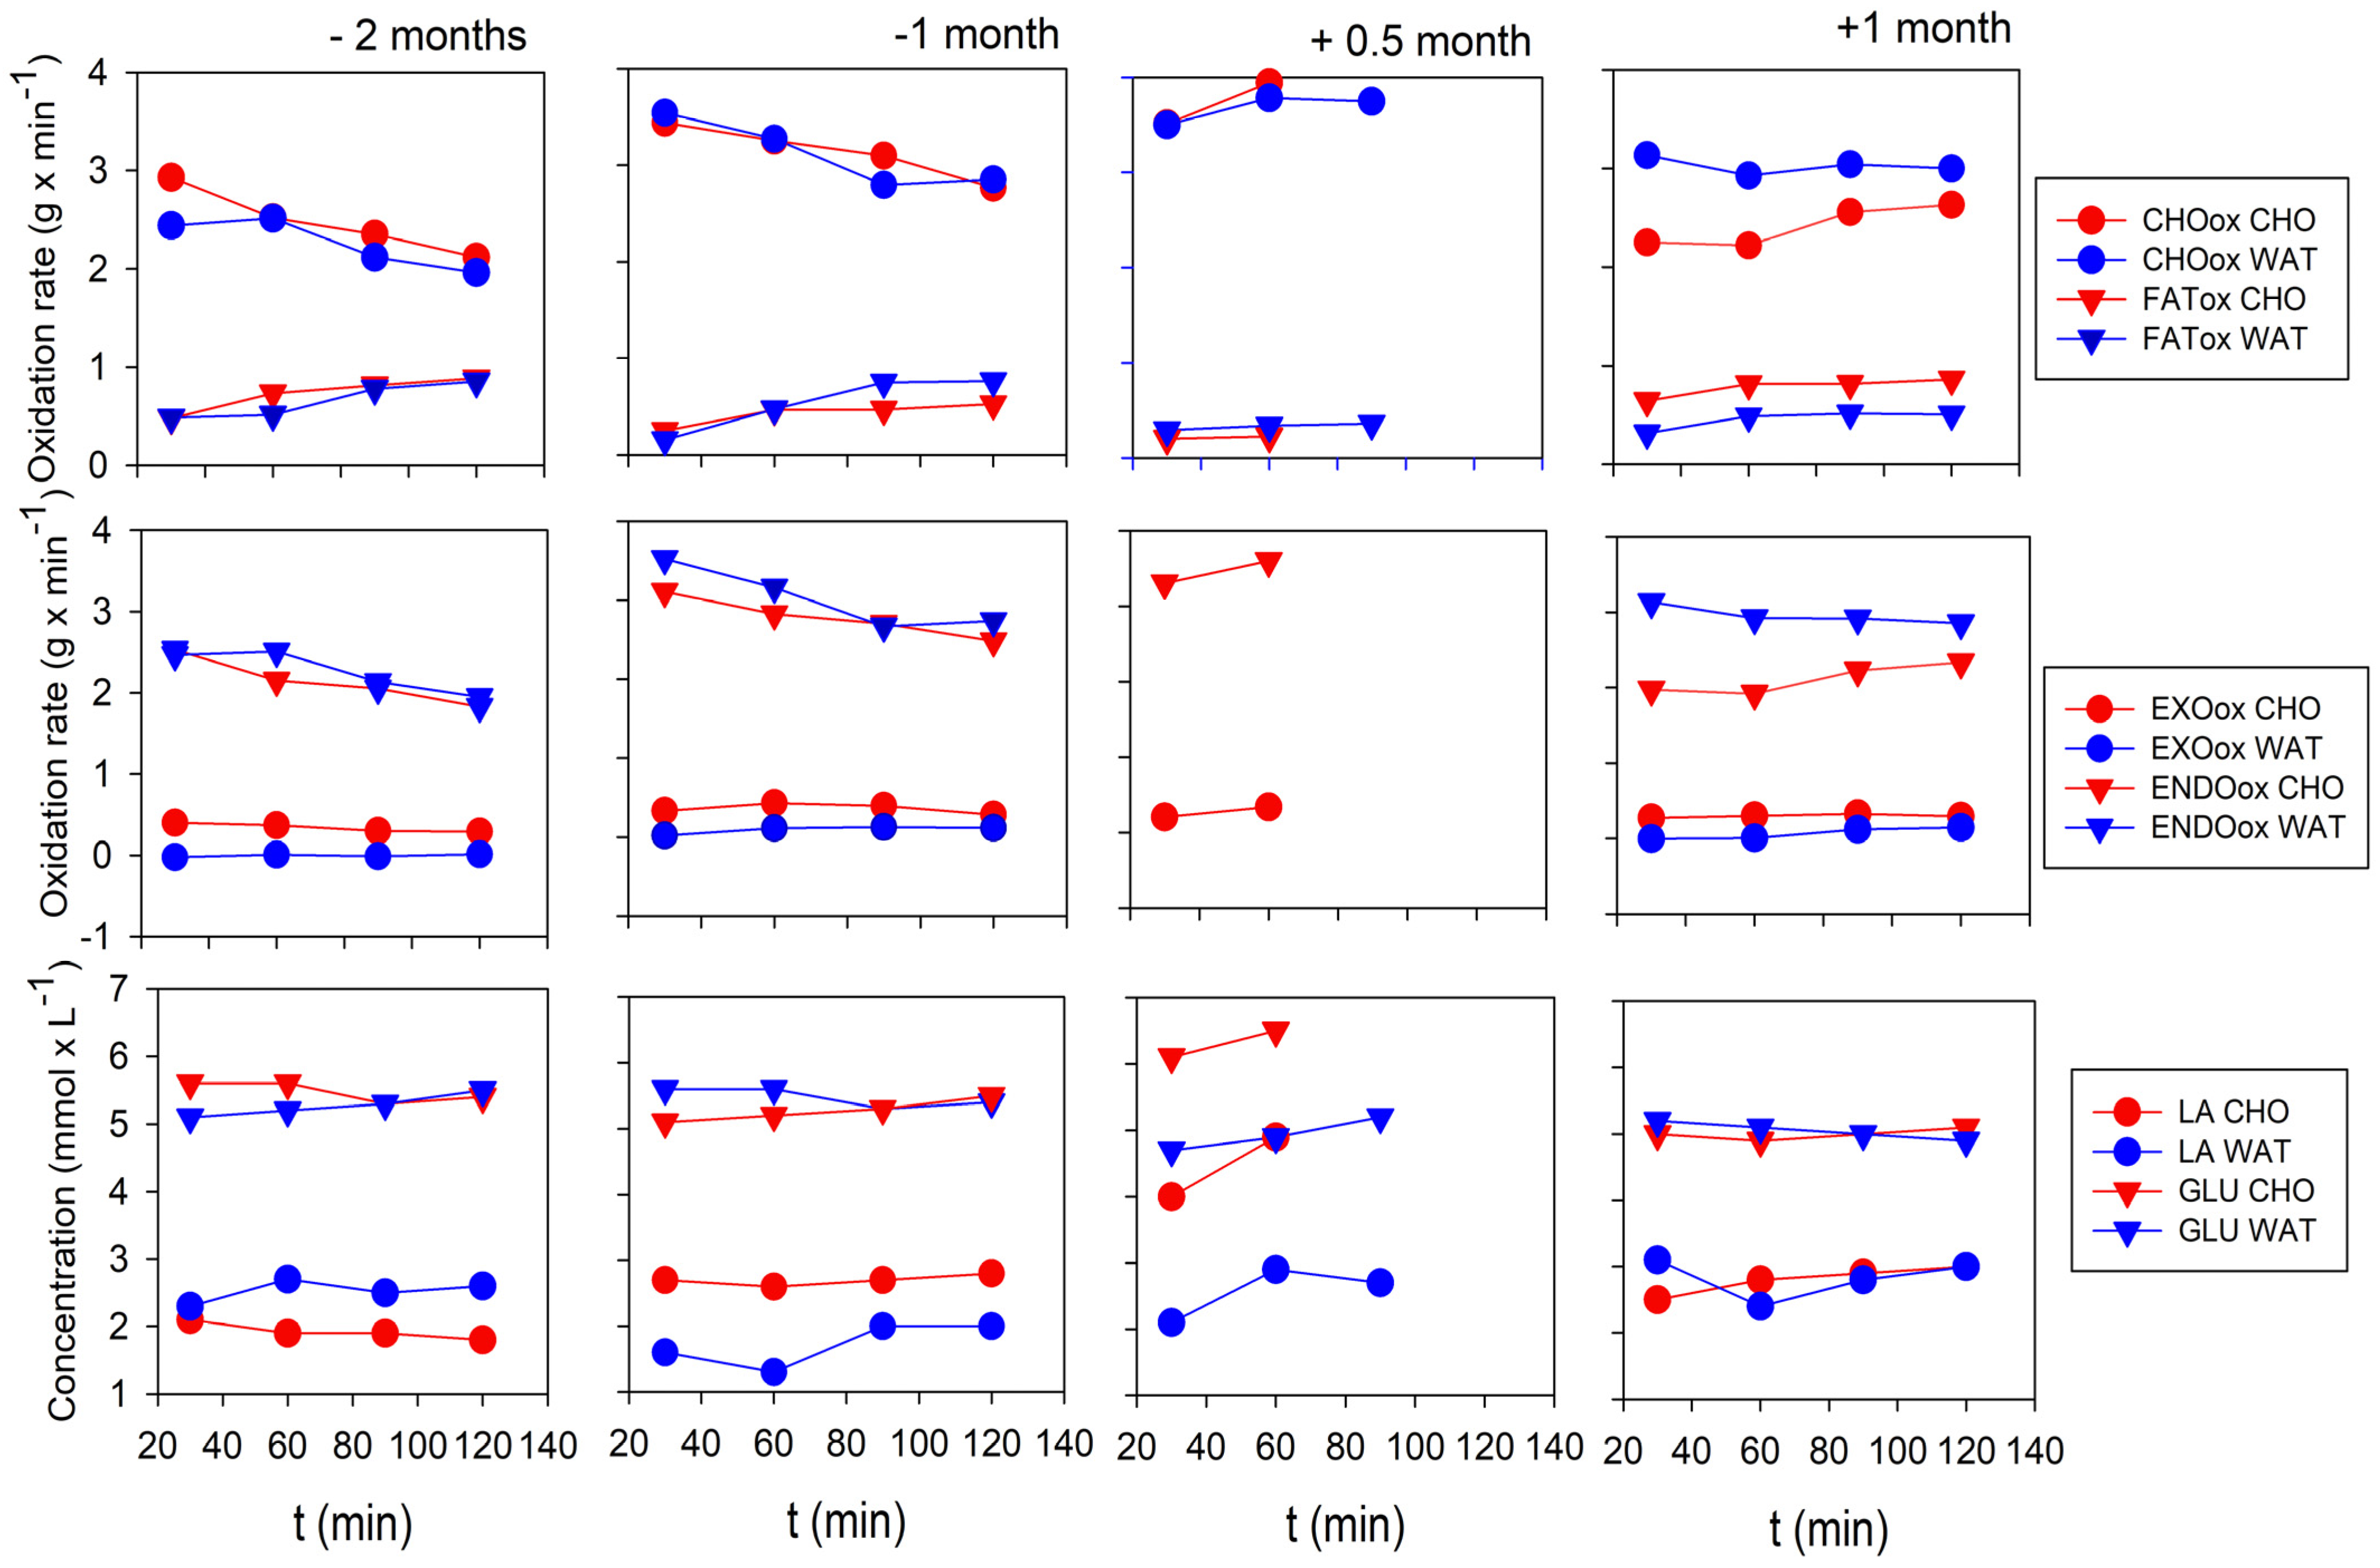
2.4. Results
3. Discussion
4. Conclusions
Author Contributions
Funding
Institutional Review Board Statement
Informed Consent Statement
Data Availability Statement
Conflicts of Interest
References
- Lazzer, S.; Salvadego, D.; Rejc, E.; Buglione, A.; Antonutto, G.; di Prampero, P.E. The energetics of ultra-endurance running. Eur. J. Appl. Physiol. 2012, 112, 1709–1715. [Google Scholar] [CrossRef]
- Gimenez, P.; Kerherve, H.; Messonnier, L.A.; Feasson, L.; Millet, G.Y. Changes in the energy cost of running during a 24 h treadmill exercise. Med. Sci. Sports Exerc. 2013, 45, 1807–1813. [Google Scholar] [CrossRef]
- Hikida, R.S.; Staron, R.S.; Hagerman, F.C.; Sherman, W.M.; Costill, D.L. Muscle fiber necrosis associated with human marathonrunners. J. Neuro. Sci. 1983, 59, 185–203. [Google Scholar] [CrossRef] [PubMed]
- Warhol, M.J.; Siegel, A.J.; Evans, W.J.; Silverman, L.M. Skeletal muscle injury and repair in marathon runners after competition. Am. J. Pathol. 1985, 118, 331–339. [Google Scholar] [PubMed]
- Mrakic-Sposta, S.; Gussoni, M.; Moretti, S.; Pratali, L.; Giardini, G.; Tacchini, P.; Vezzoli, A. Effects of mountain ultra-marathon running on ROS production and oxidative damage by micro-invasive analytical techniques. PLoS ONE 2015, 10, e0141780. [Google Scholar] [CrossRef] [PubMed]
- Thirupathi, A.; Pinho, R.A.; Ugbolue, U.C.; He, Y.; Meng, Y.; Gu, Y. Effect of running exercise on oxidative stress biomarkers: A systematic review. Front. Physiol. 2021, 11, 1789. [Google Scholar] [CrossRef]
- Rubio-Arias, J.A.; Avila-Gandia, V.; Romain, J.A.; Soto-Mendez, F.; Alcaraz, P.E.; Ramos-Campo, D.J. Muscle damage and inflammation biomerkers after two ultra-endurance mountain races of different distances: 54 km vs 111 km. Physiol. Behav. 2018, 205, 51–57. [Google Scholar] [CrossRef]
- Saugy, J.; Place, N.; Millet, G.Y.; Degache, F.; Schena, F.; Millet, G.P. Alterations of neuromuscular function after the world’s most challenging mountain ultra-marathon. PLoS ONE 2013, 8, e65596. [Google Scholar] [CrossRef]
- Khodaee, M.; Spittler, J.; VanBaak, K.; Changstrom, B.G.; Hill, J.C. Effects of running an ultramarathon on cardiac, hematologic, and metabolic biomarkers. Int. J. Sports Med. 2015, 36, 867–871. [Google Scholar] [CrossRef]
- Kim, H.J.; Lee, Y.H.; Kim, C.K. Biomarkers of muscle and cartilage damage and inflammation during 200 km run. Eur. J. Appl. Physiol. 2007, 99, 443–447. [Google Scholar] [CrossRef]
- Romer, L.M.; Polkey, M.I. Exercise-induced respiratory muscle fatigue: Implications for performance. J. Appl. Physiol. 2008, 104, 879–888. [Google Scholar] [CrossRef] [PubMed]
- Kupchak, B.R.; Kraemer, W.J.; Hoffman, M.D.; Phinney, S.D.; Volek, J.S. The impact of an ultramarathon on hormonal and biochemical parameters in men. Wilderness Environ. Med. 2014, 25, 278–288. [Google Scholar] [CrossRef] [PubMed]
- Hoffman, M.D.; Badowski, N.; Chin, J.; Stuempfle, K.J.; Parise, C.A. Determinants of recovery from a 161-km ultramarathon. J. Sports Sci. 2016, 35, 669–677. [Google Scholar] [CrossRef] [PubMed]
- Sherman, W.M.; Costill, D.L.; Fink, W.J.; Hagerman, F.C.; Armstrong, L.E.; Murray, T.F. Effects of 42.2 km footrace and subsequent rest or exercise on muscle glycogen and enzymes. J. Appl. Physiol. 1983, 55, 1219–1224. [Google Scholar] [CrossRef]
- Chambers, C.; Noaks, T.D.; Lambert, E.V.; Lambert, M.I. Time course of recovery of vertical jump height and heart rate vs running speed after a 90 km foot race. J. Sport. Sci. 1998, 16, 645–651. [Google Scholar] [CrossRef]
- Noaks, T.D. Lore of Running; Human Kinetics: Champaign, IL, USA, 2003. [Google Scholar]
- Milsum, J.H. Biological Control Systems Analysis; Mc Graw-Hill: New York, NY, USA, 1966. [Google Scholar]
- Beaver, W.L.; Wasserman, K.; Whipp, B. A new method for detecting anaerobic threshold by gas exchange. J. Appl. Physiol. 1986, 60, 2020–2027. [Google Scholar] [CrossRef]
- Usaj, A.; Starc, V. Blood pH and Lactate Kinetics in the Assessment of Running Endurance. Int. J. Sports Med. 1996, 17, 34–40. [Google Scholar] [CrossRef]
- Borg, G. Psychophysical bases of perceived exertion. Scand. J. Work. Environ. Health 1990, 14, 55–58. [Google Scholar] [CrossRef]
- Frayn, K.N. Calculation of substrate oxidation rates in vivo from gaseous exchange. J. Appl. Physiol. 1983, 55, 628–634. [Google Scholar] [CrossRef]
- Jentjens, R.; Venables, M.C.; Jeukendrup, A.E. Oxidation of exogenous glucose, sucrose, and maltose during prolonged cycling exercise. J. Appl. Physiol. 2003, 96, 1285–1291. [Google Scholar] [CrossRef]
- Mosora, F.; Lefebvre, P.; Pirnay, F.; Lacroix, M.; Luyckx, A.; Duchesne, J. Quantitative evaluation of the oxidation of an exogenous glucose load using naturally labeled 13C-Glucose. Metabolism 1976, 25, 1575–1582. [Google Scholar] [CrossRef]
- Pirnay, F.; Crielaard, J.M.; Pallikarakis, N.; Lacroix, M.; Mosora, F.; Krzentowski, G.; Lefebvre, P.J. Fate of exogenous glucose during exercise of different intensities in humans. J. Appl. Physiol. 1982, 53, 1620–1624. [Google Scholar] [CrossRef] [PubMed]
- Peronnet, F.; Massicotte, D.; Brisson, G.; Hillaire-Marcel, C. Use of 13C substrates for metabolic studies in exercise: Methodological considerations. J. Appl. Physiol. 1990, 69, 1047–1052. [Google Scholar] [CrossRef]
- Sjodin, B.; Schele, R.; Karlsson, J.; Linarsson, D.; Wallensten, R. The physiological background of onset of blood lactate accumulation (OBLA). In Exercise and Sport Biology; Komi, P.V., Ed.; Human Kinetics: Champaign, IL, USA, 1982; pp. 43–56. [Google Scholar]
- Panizo González, N.; Reque Santivañez, J.E.; Hernando Fuster, B.; Collado Boira, E.J.; Martinez-Navarro, I.; Chiva Bartoll, Ó.; Hernando Domingo, C. Quick recovery of renal alterations and inflammatory activation after a marathon. Kidney Dis. 2019, 5, 259–265. [Google Scholar] [CrossRef] [PubMed]
- Martinez-Navarro, I.; Sanchez-Gomez, J.M.; Aparicio, I.; Priego-Quesada, J.I.; Perez-Soriano, P.; Collado, E.; Hernando, C. Effect of mountain ultramarathon distance competition on biochemical variables, respiratory and lower-limb fatigue. PLoS ONE 2020, 15, e0238846. [Google Scholar] [CrossRef] [PubMed]
- Lambert, M.I.; Gibson, A.S.C.; Derman, W.; Noaks, T.D. Regeneration after ultra-endurance exercise. In Overload, Performance Incompetence, and Regeneration in Sport; Lehman, M., Foster, C., Gastmann, U., Keizer, H., Steinacker, J.M., Eds.; Kluwer Academic/Plenum Publishers: New York, NY, USA, 1999; pp. 163–172. [Google Scholar]
- Derman, K.D.; Hawley, J.A.; Noaks, T.D.; Dennis, S.C. Fuel kinetics during intense running and cycling when fed carbohydrate. Europ. J Appl Physiol. 1996, 74, 36–43. [Google Scholar] [CrossRef]
- Vernillo, G.; Rinaldo, N.; Giorgi, N.; Esposito, F.; Trabucci, P.; Millet, G.; Schena, F. Changes in lung function during an extreme mountain ultramarathon. Scand. J. Med. Sci. Sports 2014, 25, 374–380. [Google Scholar] [CrossRef]
- Wuthrich, T.; Marty, J.; Kerherve, H.; Millet, G.Y.; Verges, S.; Spengler, C.M. Aspects of respiratory muscle fatigue in a mountain ultramarathon race. Med. Sci. Sports Exerc. 2015, 47, 519–527. [Google Scholar] [CrossRef]


| Testing Day | −58 | −54 | −47 | −27 | −25 | −18 | −2 | 0 | 1 | 3 | 5 | 8 | 10 | 12 | 19 | 25 | 30 |
|---|---|---|---|---|---|---|---|---|---|---|---|---|---|---|---|---|---|
| Incremental test | X | X | X | TRIAL | X | X | |||||||||||
| Continuous running test | Xw | Xc | Xc | Xw | Xc | Xw | Xc | Xw | |||||||||
| Hematological analyses | X | X | X | X | X | X | |||||||||||
| Body composition | X | X | X | X | X | X | X | X | X |
| Preparatory Period | Recovery Period | |||||||||
|---|---|---|---|---|---|---|---|---|---|---|
| Testing (Days) | −47 | −18 | −2 | 0 | +1 | +3 | +5 | +8 | +19 | +25 |
| Body mass (kg) | 69 | 69 | 69 | 69 | 68 | 68 | 67 | 69 | 70 | |
| BMI (kg∙m2) | 21.6 | 21.7 | 21.7 | 21.6 | 21.3 | 21.3 | 21 | 21.2 | 21.8 | |
| Fat mass (kg) | 4.6 | 4.2 | 4.9 | 3.5 | 4.2 | 4.6 | 4.7 | 5.2 | 5.9 | |
| Visceral fat (%) | 18.9 | 17.5 | 19.2 | 11.1 | 11.4 | 14.1 | 11.1 | 14.7 | 21.8 | |
| Muscle mass (kg) | 37.3 | 36.9 | 37.7 | 37.7 | 36.7 | 36.6 | 36 | 36.8 | 37.4 | |
| Preparatory Period | Recovery Period | ||||||
|---|---|---|---|---|---|---|---|
| Testing (Days) | −25 | −18 | −2 | 0 | +1 | +3 | +5 |
| AST (μkat∙L−1) | 0.86 | 0.51 | 0.58 | 2.13 | 1.12 | 0.73 | |
| CRP (mg∙L−1) | 5 | 5 | 5 | 27 | 11 | 5 | |
| LDH (μkat∙L−1) | 3.86 | 3.63 | 3.37 | 5.47 | 4.60 | 4.00 | |
| CK (μkat∙L−1) | 8.34 | 3.55 | 4.64 | 43.96 | 10.01 | 5.55 | |
| Mb (μg∙L−1) | 36 | 33.3 | 34.6 | 134.6 | 65.9 | 32.8 | |
| Testosterone (μg∙L−1) | 2.81 | 2.76 | 2.84 | 1.72 | 1.90 | 2.77 | |
| Cortisol (nmol∙L−1) | 506 | 502 | 519 | 273 | 430 | 490 | |
| Preparatory Period | Recovery Period | |||||
|---|---|---|---|---|---|---|
| Testing (Days) | −58 | −27 | −3 | 0 | +10 | +19 |
| LT (m∙s−1) | 3.6 | 3.8 | 3.8 | 3.4 | 3.5 | |
| OBLA (m∙s−1) | 4.7 | 4.7 | 4.7 | 4.4 | 4.5 | |
| Vpeak (m∙s−1) | 5.5 | 5.5 | 5.5 | 5.0 | 5.5 | |
| Vo2peak (ml∙min−1∙kg−1) | 73 | 74 | 74 | 65 | 67 | |
| VEpeak (L∙min−1) | 160 | 161 | 162 | 137 | 150 | |
| fRpeak (min−1) | 62 | 62 | 58 | 53 | 56 | |
| VTpeak (L) | 2.58 | 2.60 | 2.80 | 2.58 | 2.68 | |
| HRpeak (min−1) | 201 | 197 | 194 | 196 | 200 | |
| LApeak (mmol·L−1) | 11.9 | 14.9 | 13.2 | 8.1 | 11.0 | |
| Preparatory Period | Recovery Period | |||||||||||||||
|---|---|---|---|---|---|---|---|---|---|---|---|---|---|---|---|---|
| −2 Months | −1 Month | +0.5 Month | +1 Month | |||||||||||||
| Time (Min) | 30 | 60 | 90 | 120 | 30 | 60 | 90 | 120 | 30 | 60 | 90 | 120 | 30 | 60 | 90 | 120 |
| Vo2 (L∙min−1) | 3.422 | 3.627 | 3.662 | 3.634 | 3.400 | 3.695 | 3.588 | 3.451 | 3.344 | 3.712 | 3.314 | 3.636 | 3.893 | 4.034 | ||
| Vo2 (ml∙min−1∙kg−1) | 50 | 53 | 53 | 53 | 49 | 53 | 54 | 50 | 49 | 55 | 48 | 53 | 56 | 58 | ||
| Cr (ml∙min−1∙m−1) | 0.19 | 0.21 | 0.21 | 0.21 | 0.19 | 0.21 | 0.20 | 0.19 | 0.19 | 0.23 | 0.18 | 0.22 | 0.22 | 0.25 | ||
| VE (L∙ min−1) | 80 | 83 | 83 | 82 | 82 | 91 | 87 | 82 | 84 | 95 | 81 | 89 | 96 | 102 | ||
| fR (min−1) | 30 | 35 | 37 | 38 | 34 | 40 | 38 | 40 | 35 | 43 | 33 | 40 | 41 | 42 | ||
| HR (min−1) | 168 | 174 | 177 | 180 | 163 | 167 | 170 | 175 | 180 | 188 | 170 | 175 | 180 | 185 | ||
Disclaimer/Publisher’s Note: The statements, opinions and data contained in all publications are solely those of the individual author(s) and contributor(s) and not of MDPI and/or the editor(s). MDPI and/or the editor(s) disclaim responsibility for any injury to people or property resulting from any ideas, methods, instructions or products referred to in the content. |
© 2023 by the authors. Licensee MDPI, Basel, Switzerland. This article is an open access article distributed under the terms and conditions of the Creative Commons Attribution (CC BY) license (https://creativecommons.org/licenses/by/4.0/).
Share and Cite
Ušaj, A.; Lihteneger Vidmajer, J.; Lojen, S. Recovery after Running an “Everesting” Mountain Ultramarathon. Life 2023, 13, 1946. https://doi.org/10.3390/life13101946
Ušaj A, Lihteneger Vidmajer J, Lojen S. Recovery after Running an “Everesting” Mountain Ultramarathon. Life. 2023; 13(10):1946. https://doi.org/10.3390/life13101946
Chicago/Turabian StyleUšaj, Anton, Jon Lihteneger Vidmajer, and Sonja Lojen. 2023. "Recovery after Running an “Everesting” Mountain Ultramarathon" Life 13, no. 10: 1946. https://doi.org/10.3390/life13101946
APA StyleUšaj, A., Lihteneger Vidmajer, J., & Lojen, S. (2023). Recovery after Running an “Everesting” Mountain Ultramarathon. Life, 13(10), 1946. https://doi.org/10.3390/life13101946