
Tff3 Deficiency Protects against Hepatic Fat Accumulation after Prolonged High-Fat Diet

 , ,
, ,  ,
,  ,
,  and
and 
Abstract
:1. Introduction
2. Materials and Methods
2.1. Animals and Diet Treatment
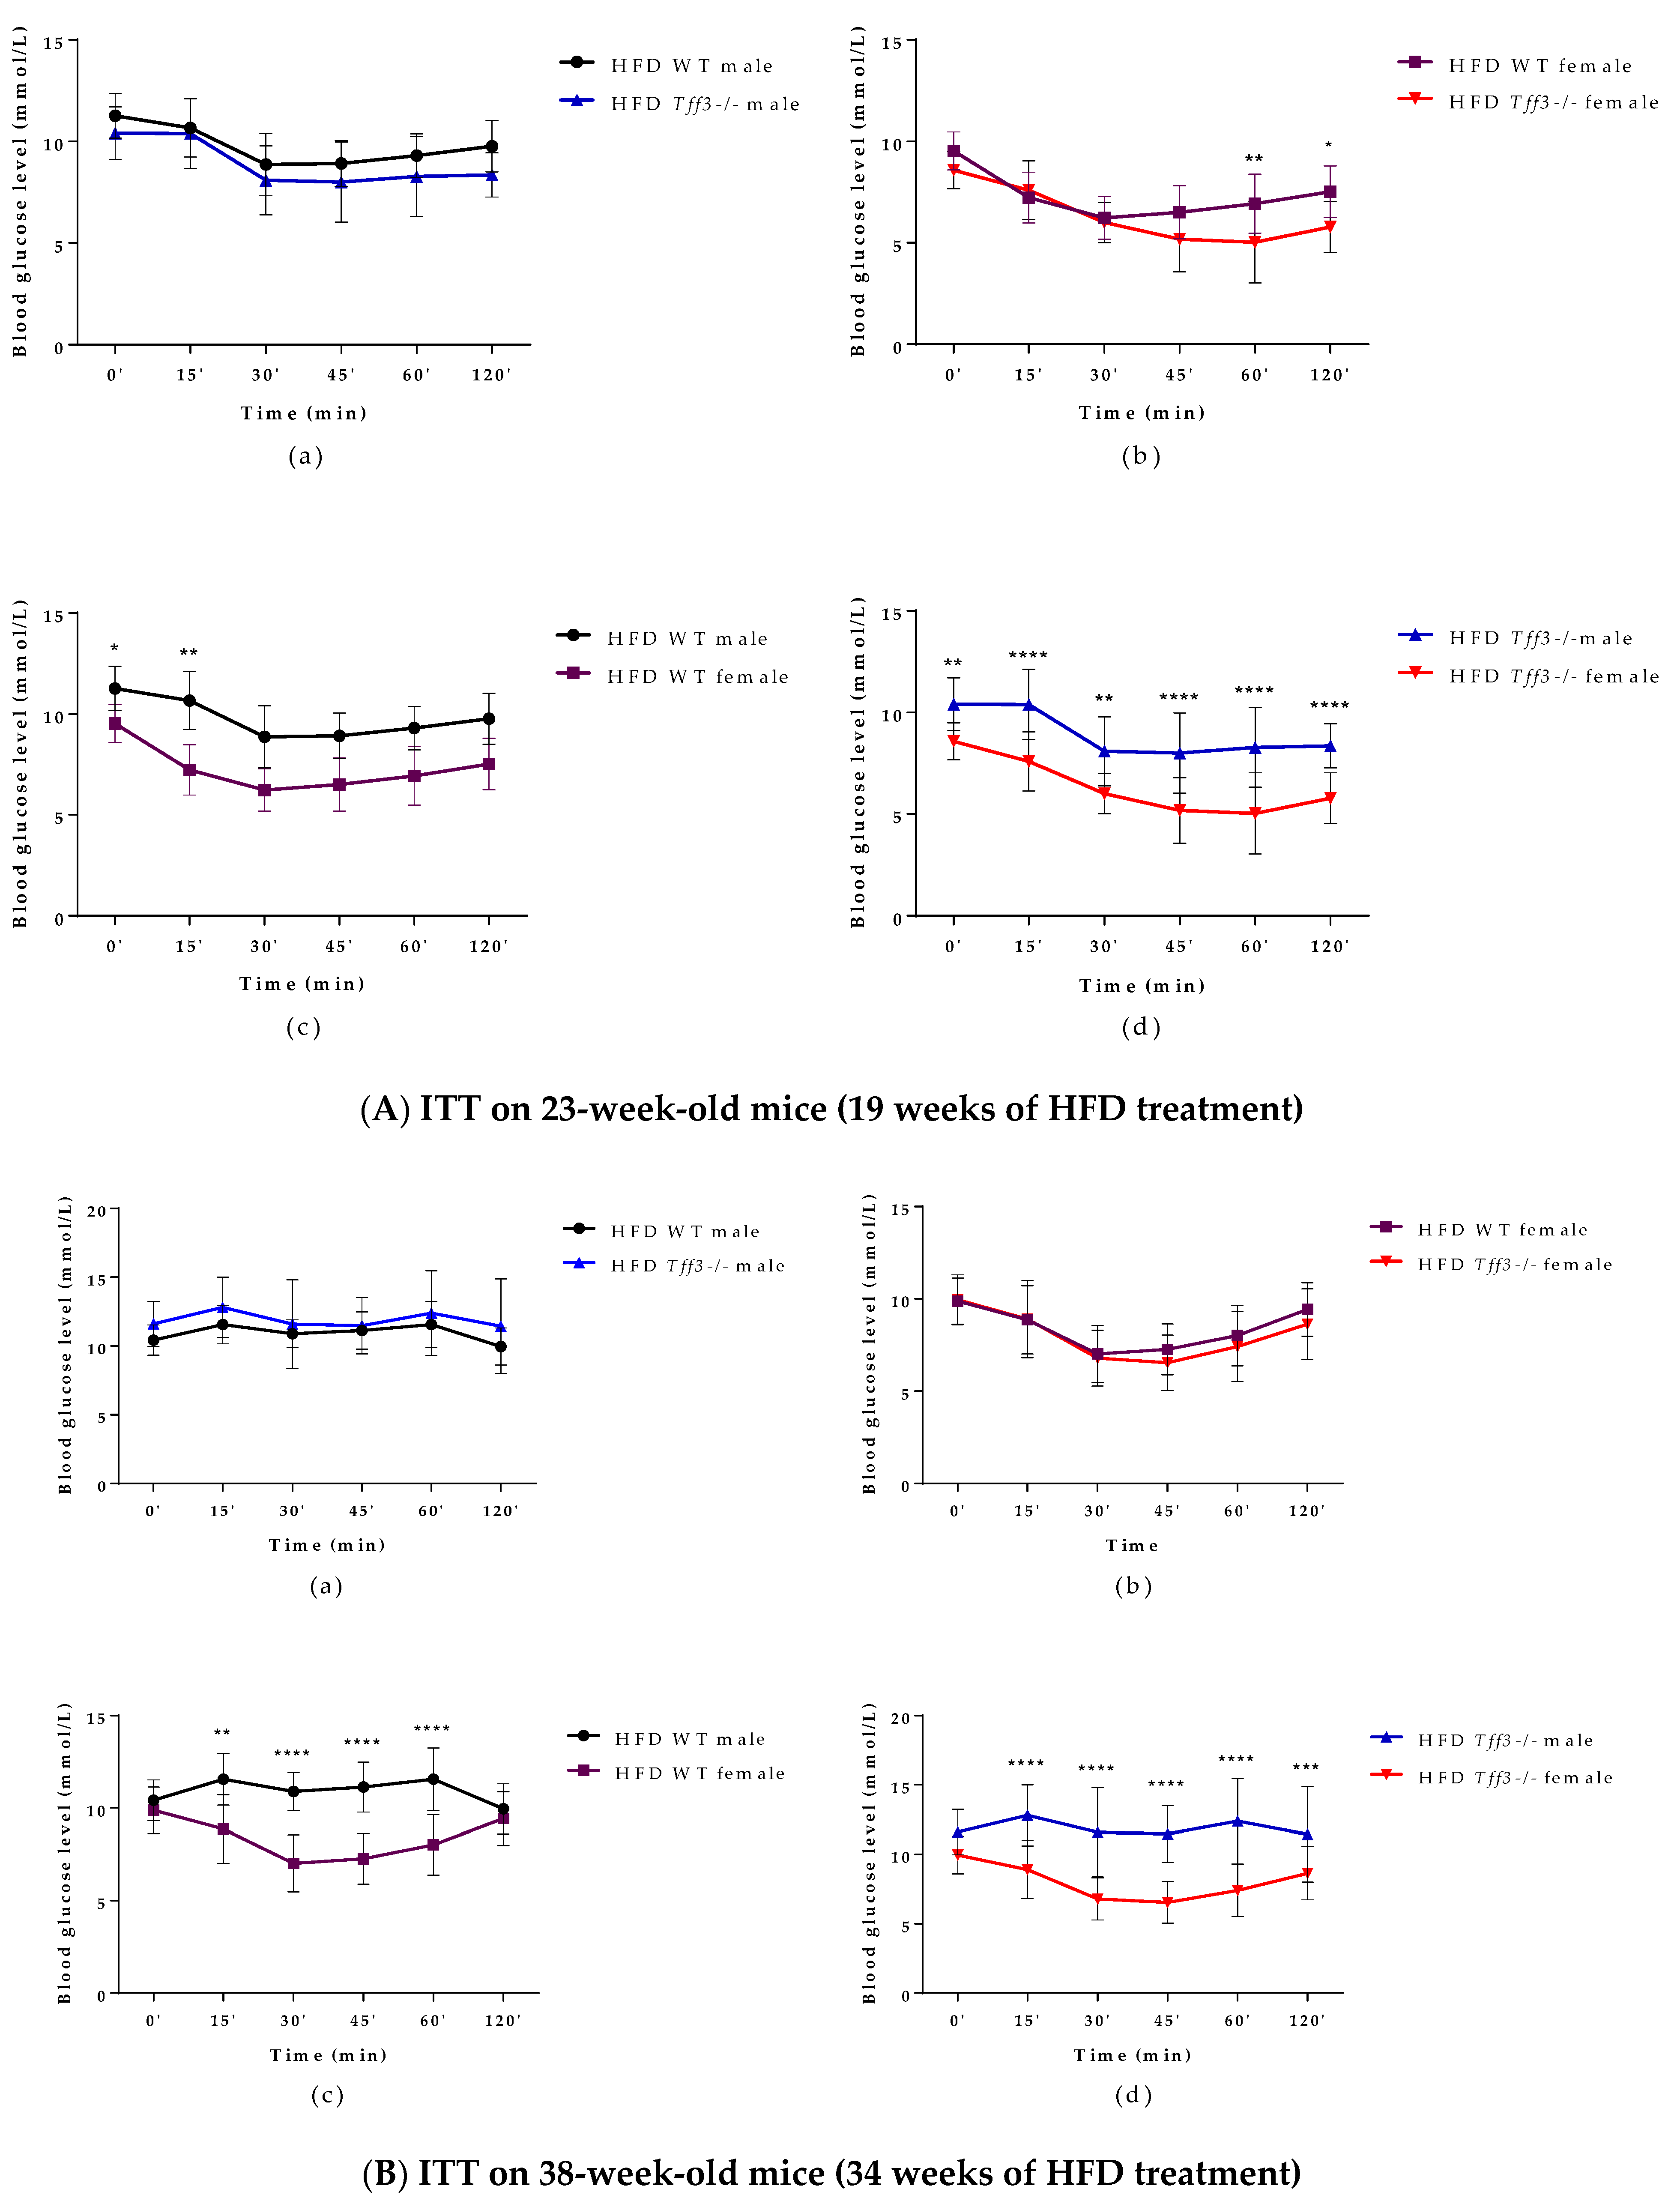
2.2. Glucose and Insulin Tolerance Test
2.3. Histological Analysis
2.4. Ultrastructural Analysis
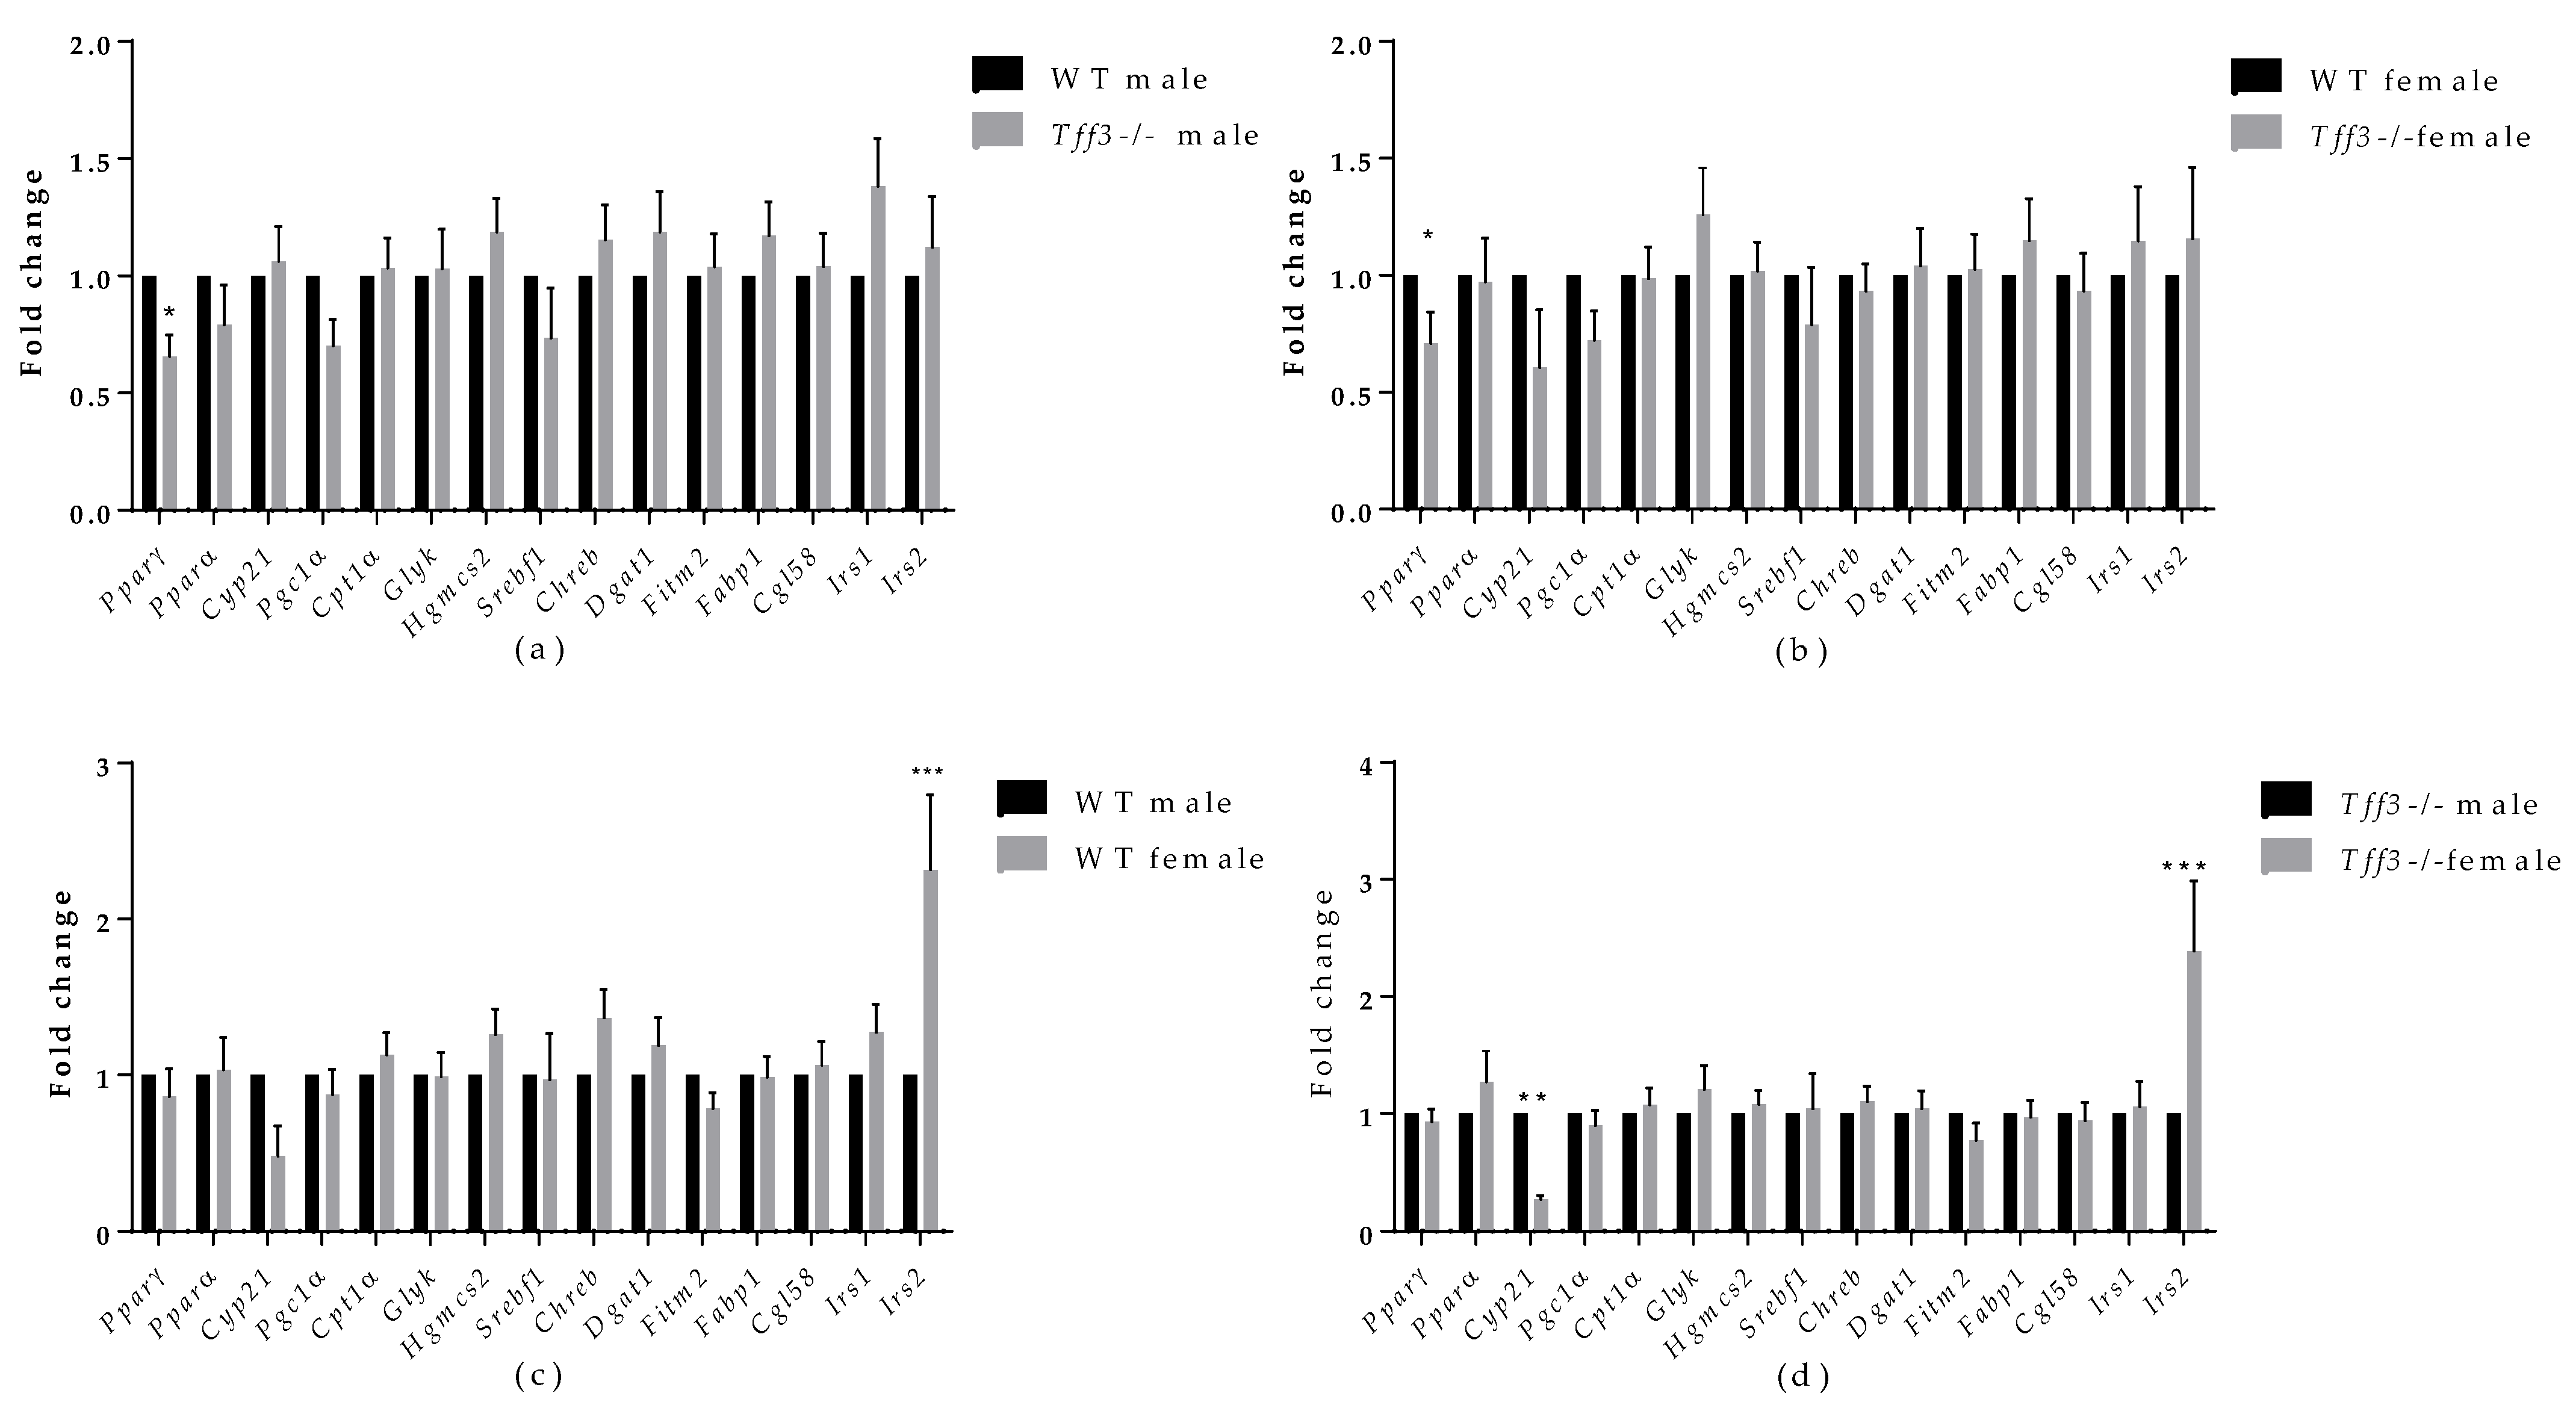
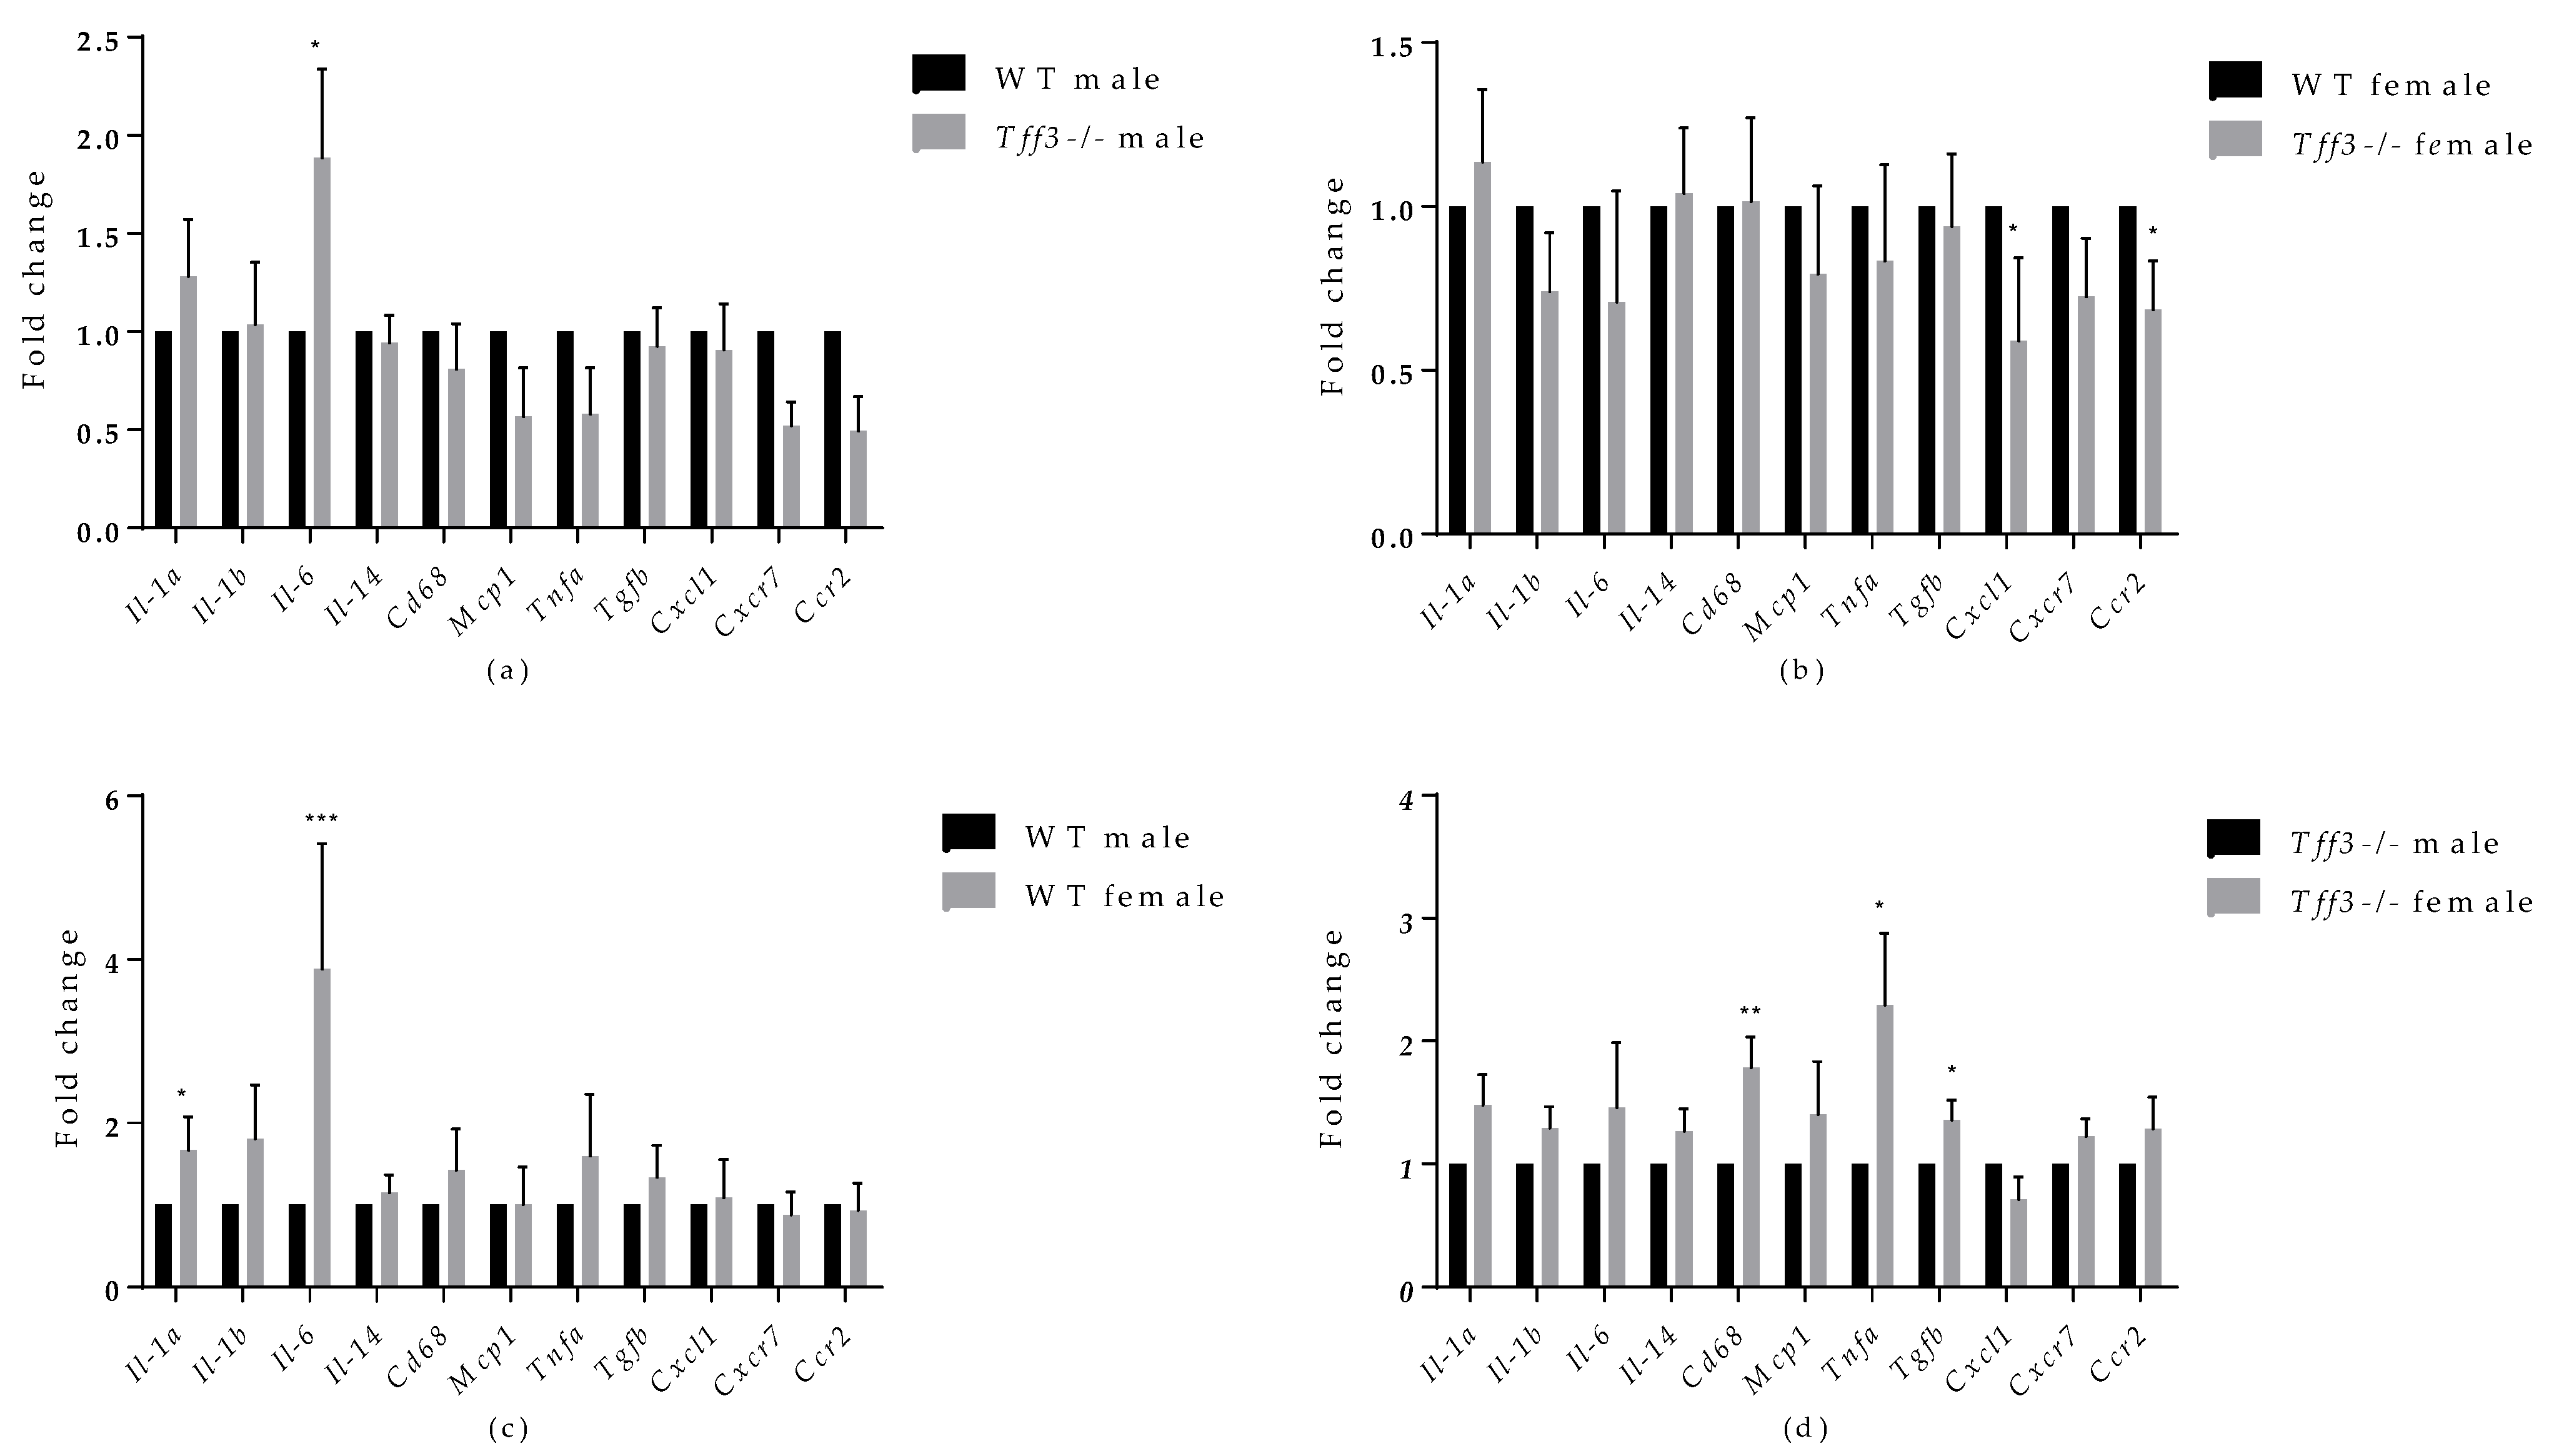
2.5. Q-PCR Analysis
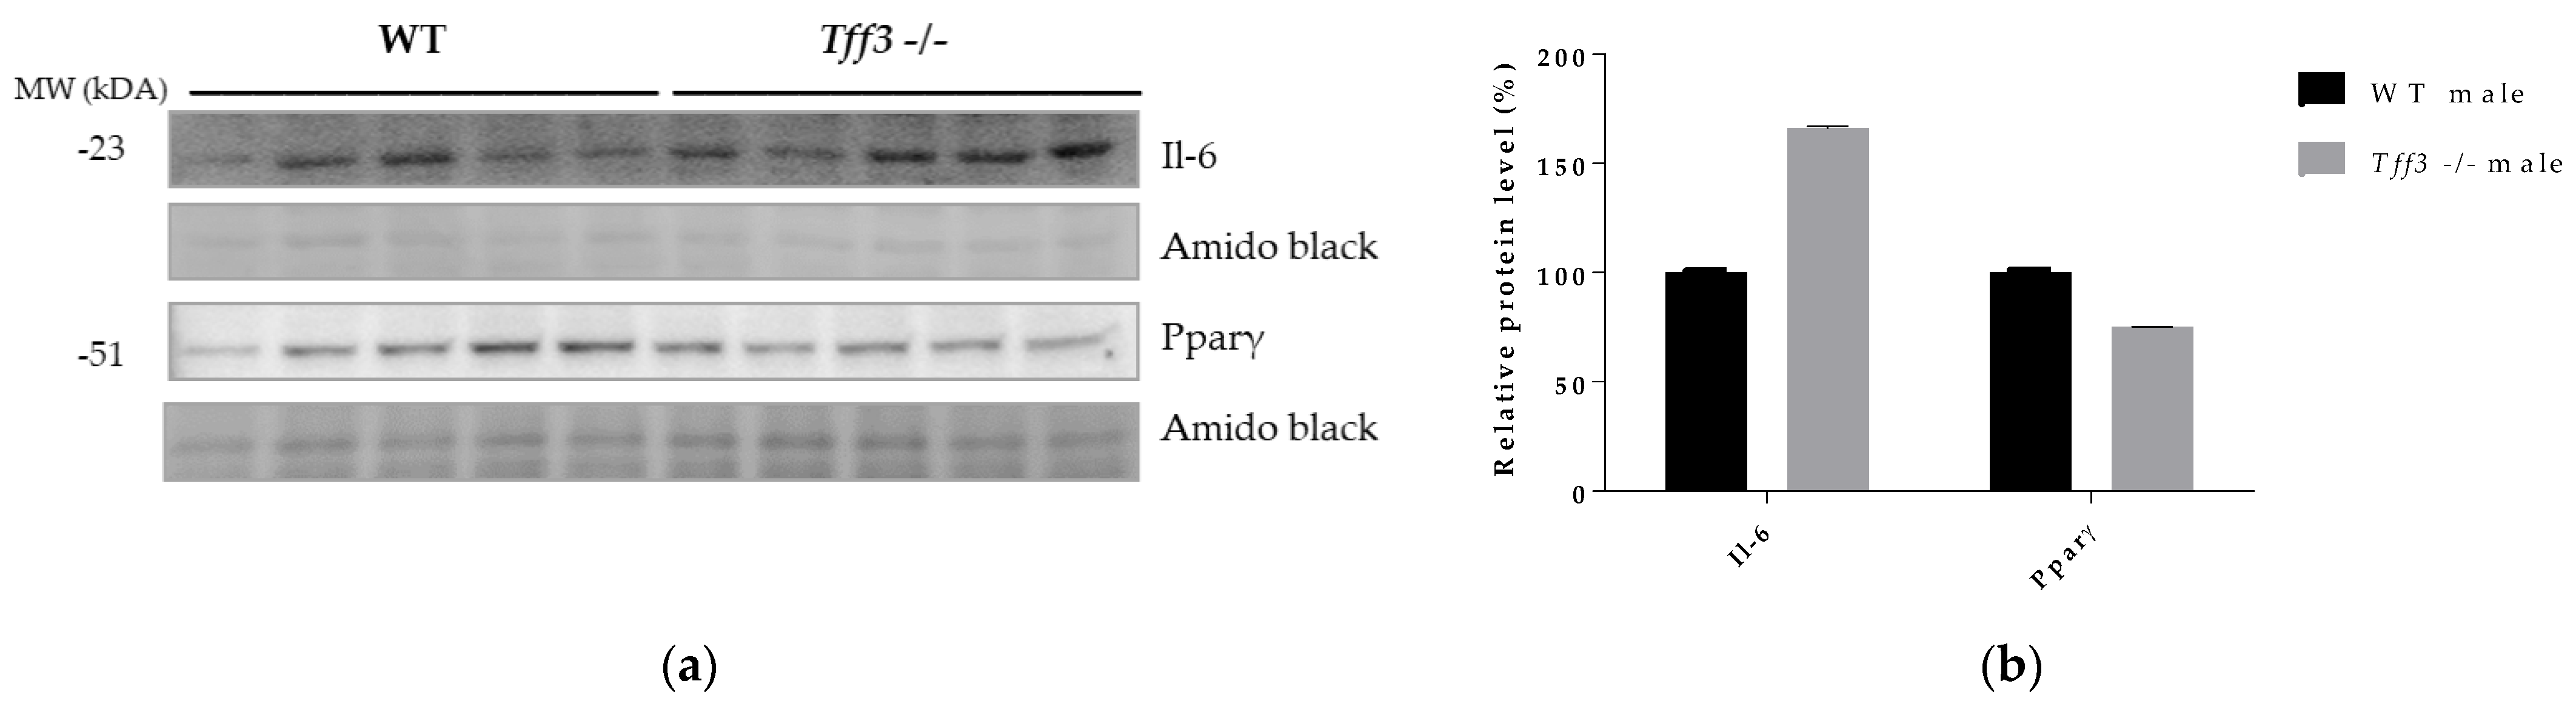
2.6. Western Blot
2.7. Fatty Acid Analyses
2.8. Statistical Analyses
3. Results
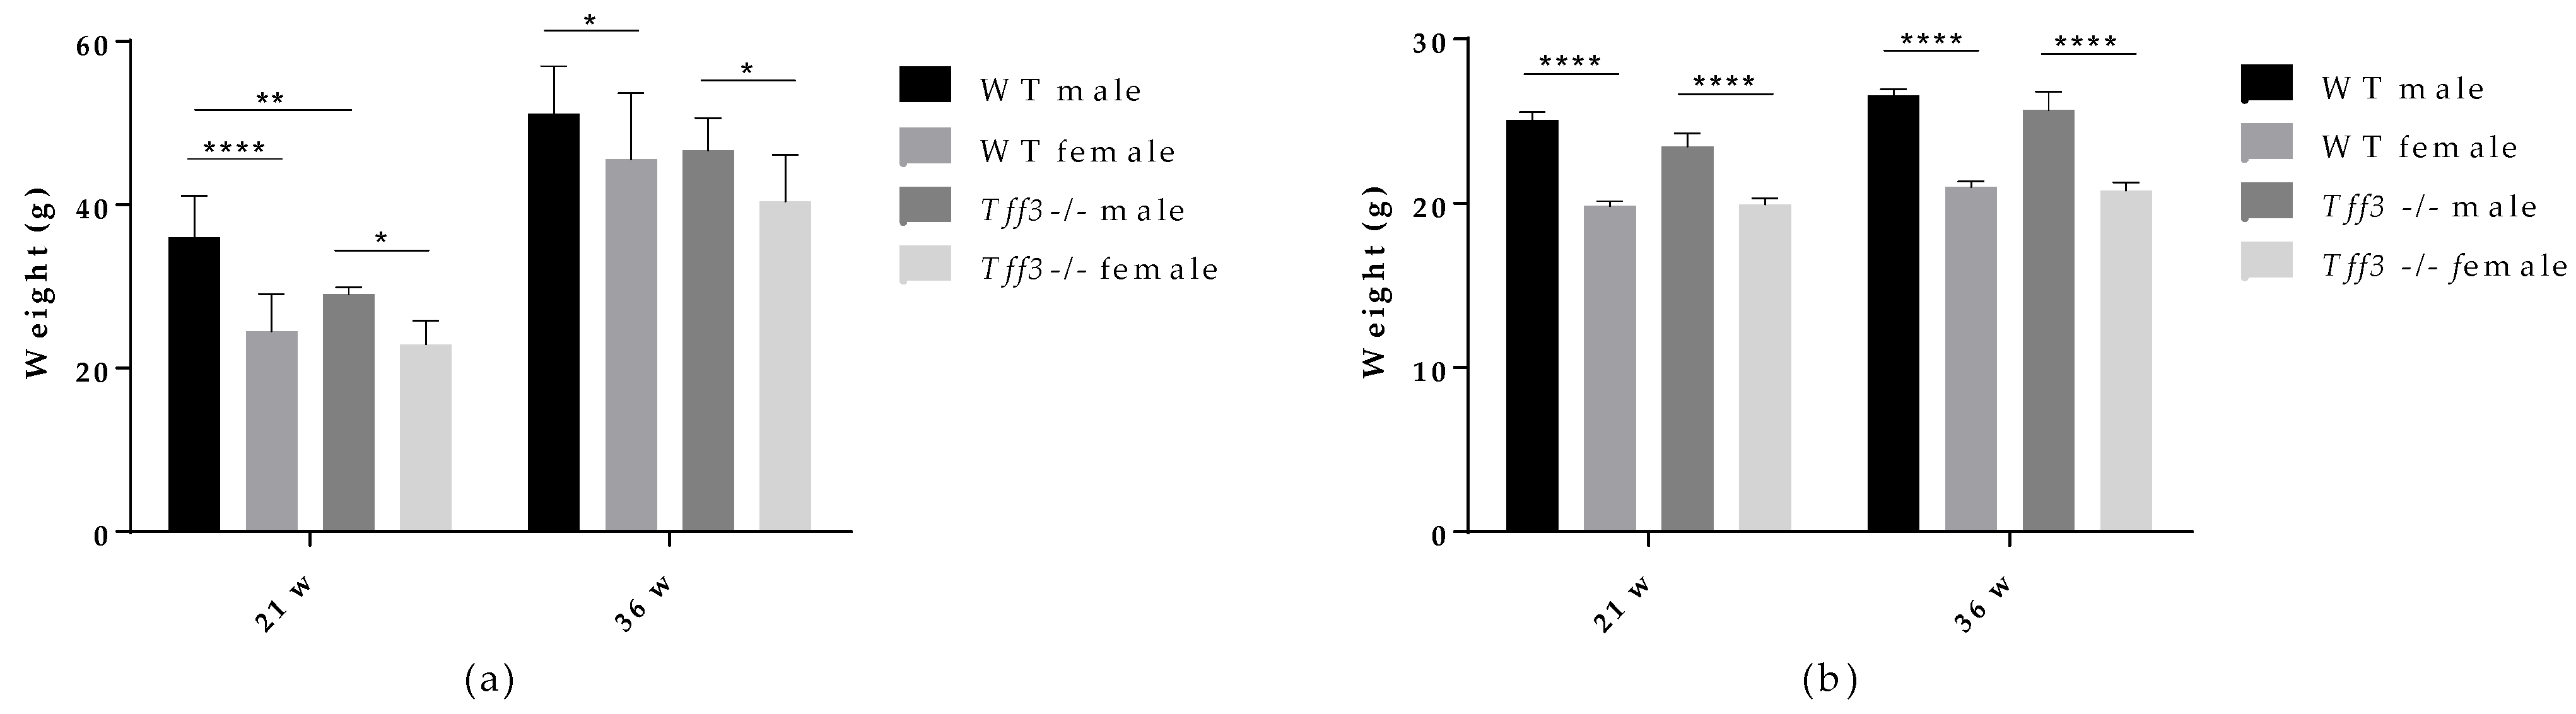
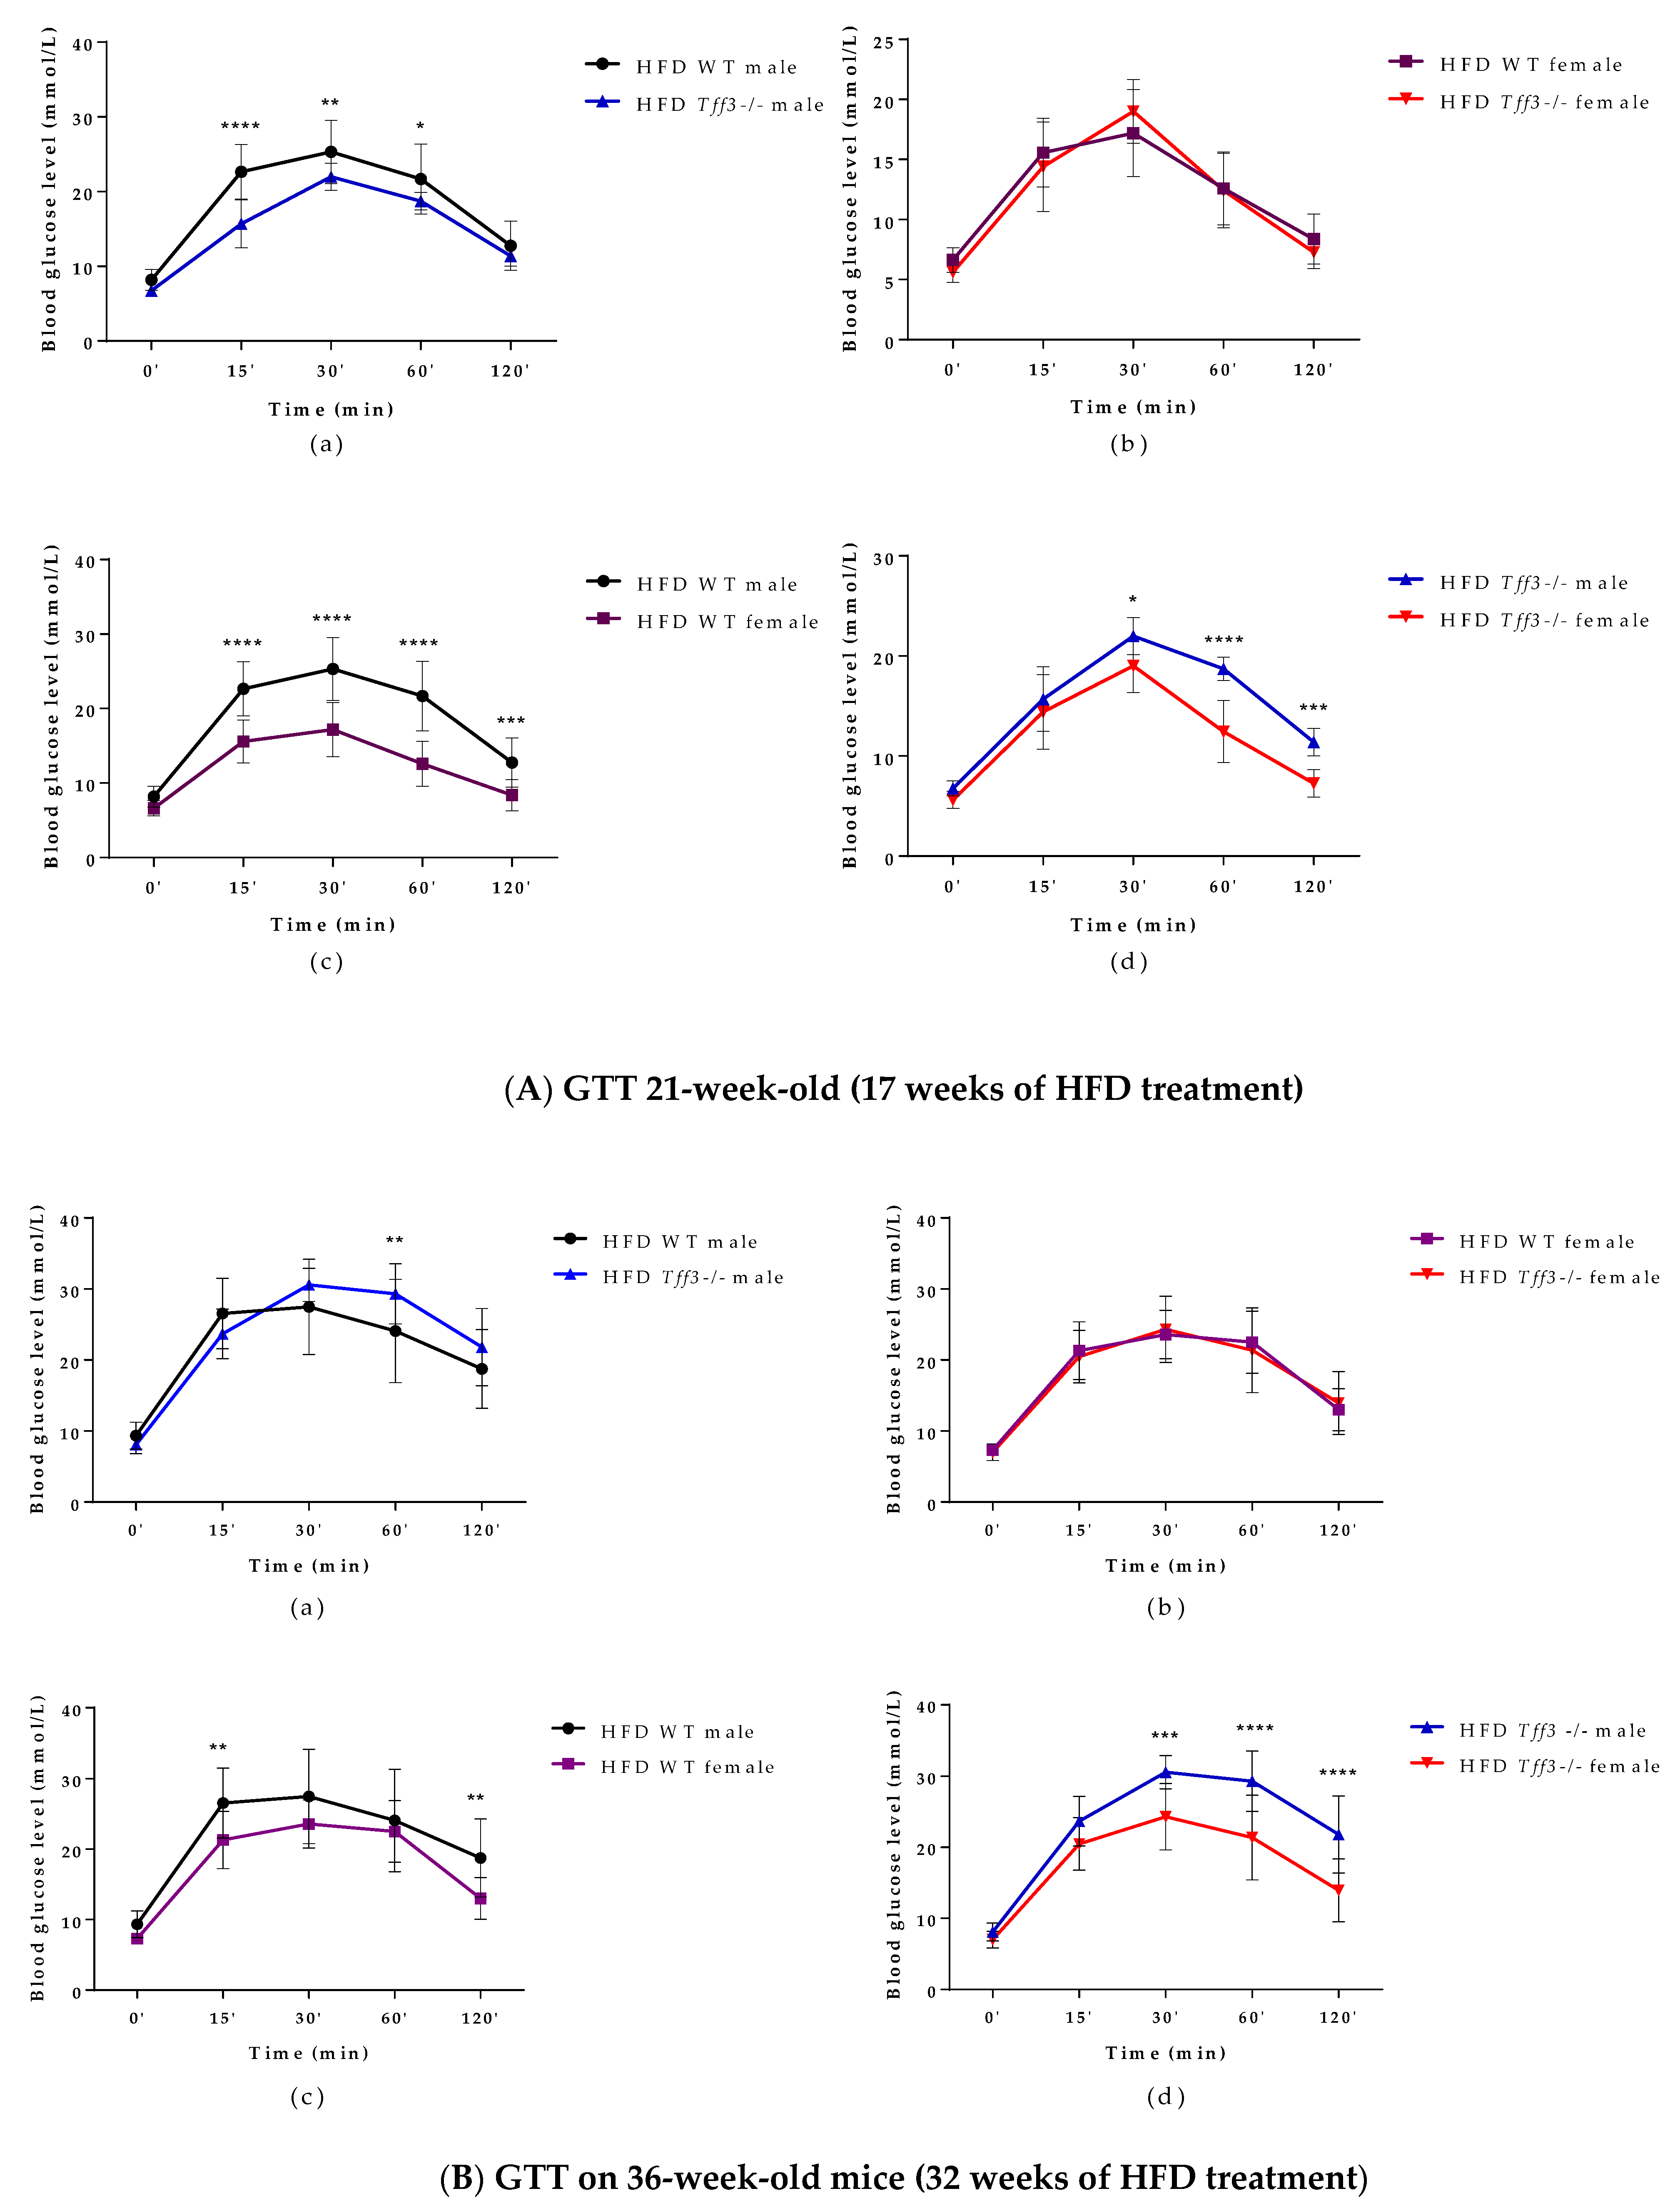
3.1. General Metabolic Parameters (Weight Measurments and Glucose and Insulin Tolerance Test)


3.2. Blood Serum Biochemistry
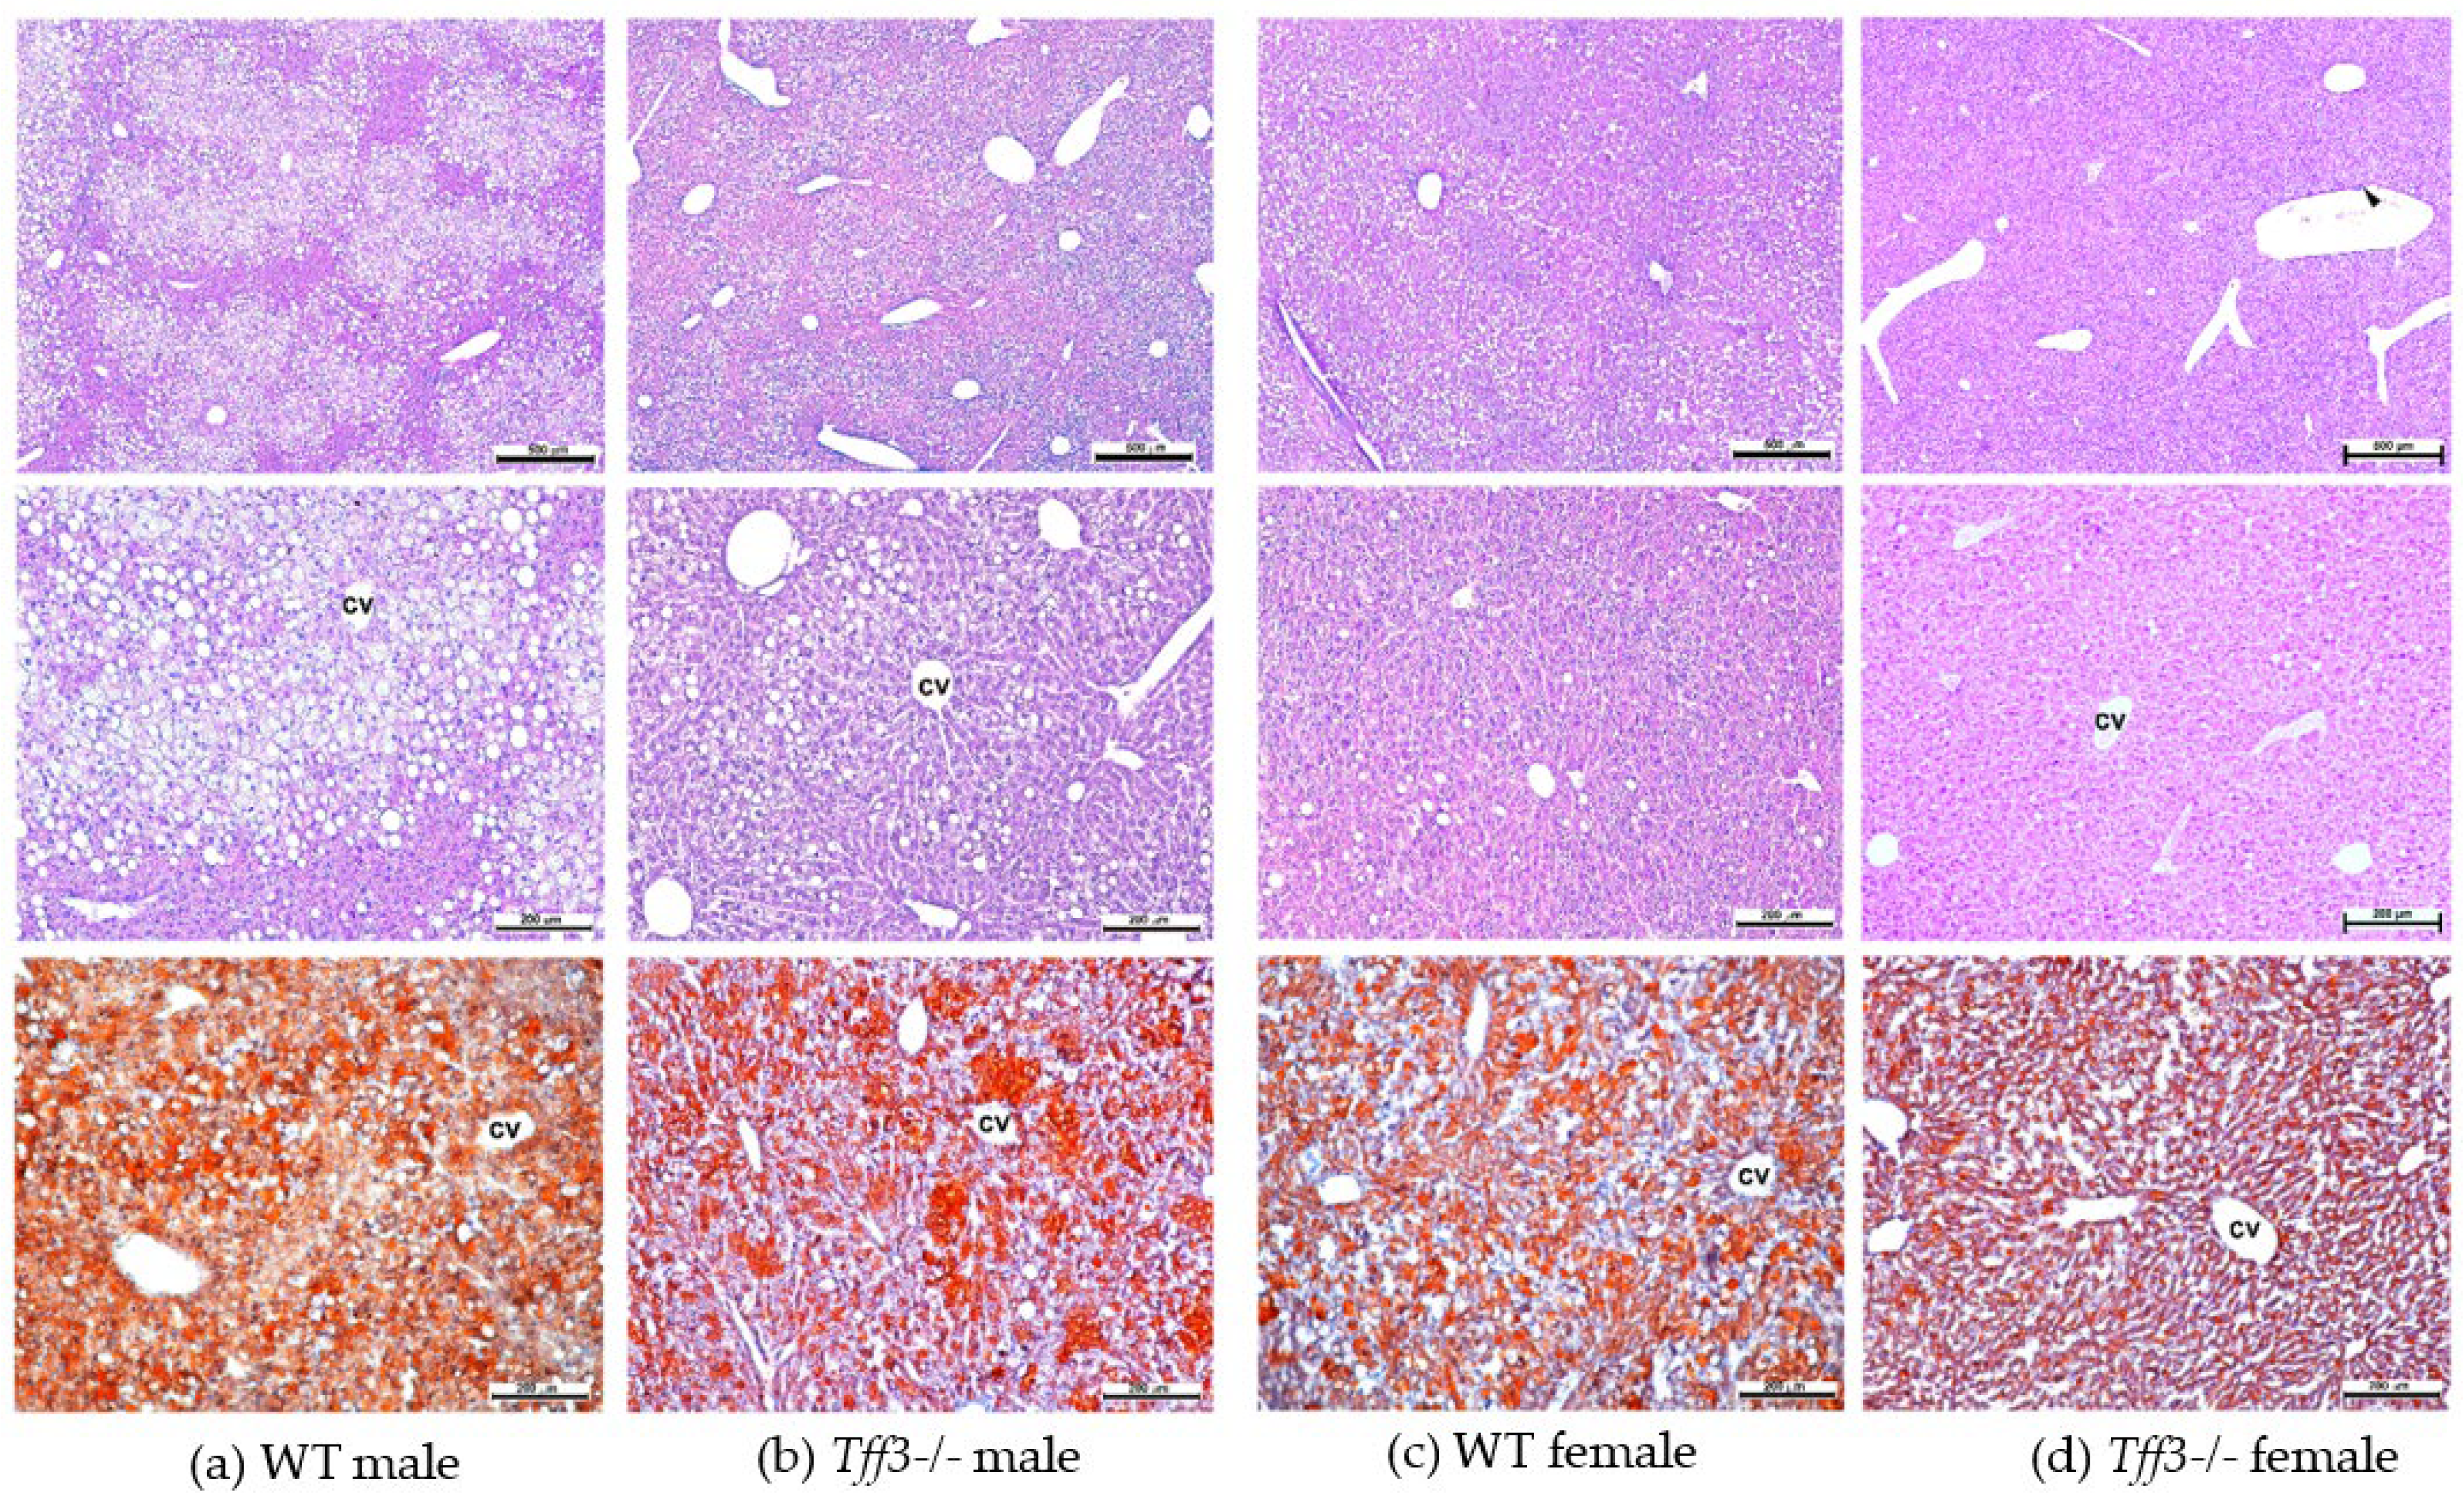
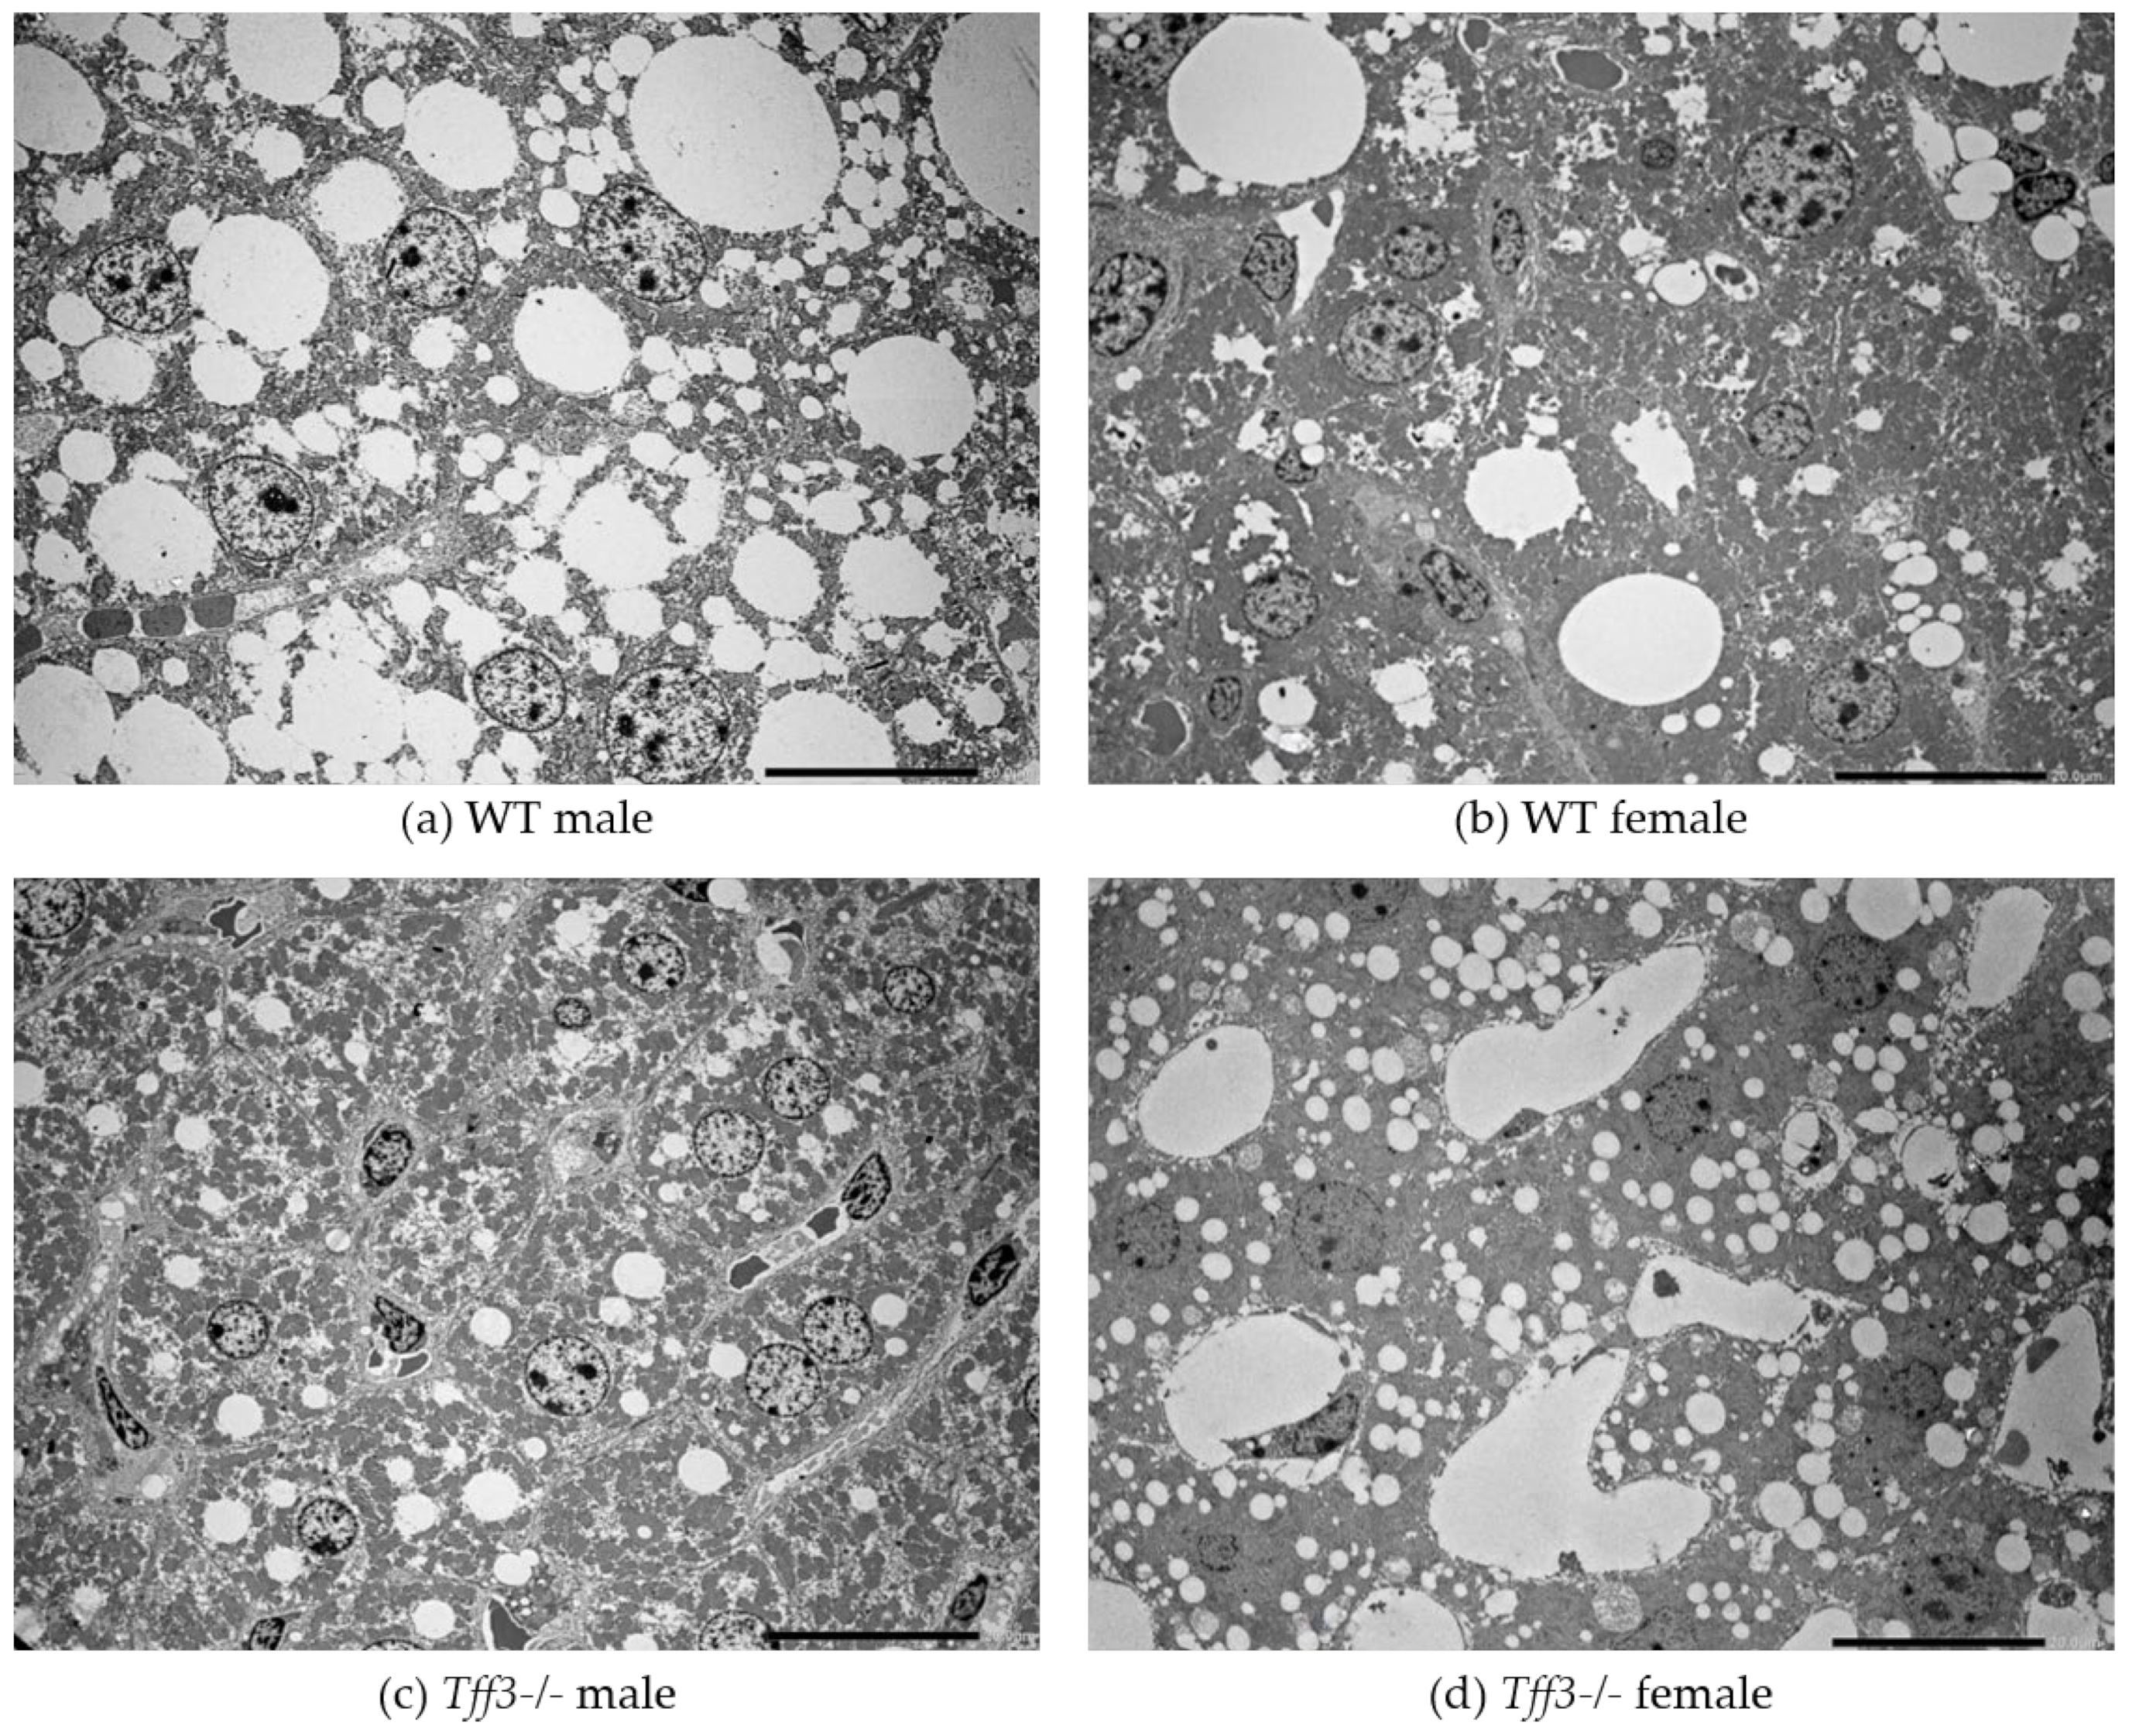
3.3. Liver Morphology and Ultrastructure
3.4. Average Fatty Acid Content in Liver and Abdominal Fat

| Main Fatty Acids | Group | |||
|---|---|---|---|---|
| (g of Fatty Acids/100 g of Total Fatty Acids) | WT ♂ | Tff3-/- ♂ | WT ♀ | Tff3-/- ♀ |
| C 14:0 | 0.47 | 0.45 | 0.44 | 0.45 |
| C 16:0 | 24.74 | 24.84 | 24.18 | 24.25 |
| C 16:1 | 5.26 | 4.46 | 3.74 | 3.22 |
| C 18:0 | 3.51 | 4.69 | 5.53 | 6.83 |
| C 18:1 | 43.04 | 38.00 | 41.16 | 33.19 |
| C 18:2, n-6 | 11.40 | 12.98 | 12.38 | 14.72 |
| C 18:3, n-6 | 0.28 | 0.30 | 0.37 | 0.51 |
| C 18:3, n-3 | 0.27 | 0.34 | 0.32 | 0.47 |
| C 20:1, n-9 | 1.05 * | 0.86 † | 0.54 | 0.33 |
| C 20:3, n-6 | 0.74 * | 0.78 † | 0.54 | 0.33 |
| C 20:4, n-6 | 3.72 * | 5.26 † | 5.13 | 7.21 |
| C 20:5, n-3 | 0.17 | 0.25 | 0.22 | 0.34 |
| C 22:4, n-6 | 0.48 | 0.51 † | 0.30 | 0.43 |
| C 22:5, n-6 | 0.23 | 0.25 † | 0.15 | 0.24 |
| C 22:5, n-3 | 0.41 * | 0.50 † | 0.29 | 0.45 |
| C 22:6, n-3 | 2.95 * | 4.17 | 3.91 | 5.78 |
| ∑ SFA 1 | 29.28 | 30.63 | 30.58 | 32.07 |
| ∑ MUFA 2 | 49.75 | 43.68 | 45.70 | 37.00 |
| ∑ PUFA 3 | 20.49 | 25.18 | 23.43 | 30.51 |
| n-6/n-3 PUFA 4 | 4.59:1 | 3.92:1 | 4.26:1 | 3.28:1 |
| Fat content (g/100 g liver) | 22.17 ± 1.18 ‡ | 14.37 ± 1.67 | 17.21 ± 1.87 § | 8.64 ± 1.25 |
3.5. Expression of Tff3, Fatty Acid Metabolism and Inflammation-Related Genes upon HFD Exposure


3.6. Protein Accumulation of Il-6 and Pparγ in Liver of Tff3-/- and WT Male Mice Fed an HFD for 8 Months
4. Discussion
Supplementary Materials
Author Contributions
Funding
Institutional Review Board Statement
Informed Consent Statement
Acknowledgments
Conflicts of Interest
Abbreviations
| Actβ | actin beta |
| ALT | alanin–aminotransferase |
| ALP | alkaline phoshatase |
| AST | aspartate aminotransferase |
| β2m | beta-2-microglobulin |
| BG | blood glucose |
| Ccr2 | chemokine (C-C motif) receptor 2 |
| Cd68 | mouse CD68 antigen |
| Cgl58 | abhydrolase domain containing 5 |
| Chreb | carbohydrate response element binding protein |
| Cpt1a | carnitine palmitoyltransferase I |
| CRP | C-reactive protein |
| Cxcl1 | C-X-C motif chemokine ligand 1 |
| Cxcr7 | atypical chemokine receptor 3 |
| Cyp21 | cytochrome P450, family 21, subfamily a, polypeptide 1 |
| Dgat1 | diacylglycerol O-acyltransferase 1 |
| Fabp1 | fatty acid binding protein 1 |
| Fitm2 | fat storage-inducing transmembrane protein 2 |
| GI | gastrointestinal |
| GlyK | glycerol kinase |
| HDL | high-density lipoprotein |
| HE | hematoxylin and eosin |
| HFD | high-fat diet |
| Hmgcs2 | hydroxymethylglutaryl-CoA synthase |
| Il-1α | interleukin 1 alpha |
| Il-1β | interleukin 1 beta |
| Il-6 | interleukin 6 |
| Il-14 | interleukin 14 |
| Irs1 | insulin receptor substrate 1 |
| Irs2 | insulin receptor substrate 2 |
| IPGTT | intraperitoneal glucose tolerance tests |
| IPITT | intraperitoneal insulin tolerance tests |
| Mcp1 | monocyte chemoattractant protein-1 |
| MUFA | monounsaturated fatty acids |
| NAFLD | nonalcoholic fatty liver disease |
| Pgc1α | Pparγ coactivator |
| Ppar α | peroxisome proliferator activated receptor alpha |
| Ppar γ | peroxisome proliferator activated receptor gamma |
| PUFA | polyunsaturated fatty acids |
| qPCR | quantitative polymerase chain reaction |
| SD | standard diet |
| SFA | saturated fatty acids |
| Srebf1 | sterol regulatory element binding transcription factor 1 |
| Stat3 | signal transducer activator of transcription 3 |
| T1D | type 1 diabetes |
| T2D | type 2 diabetes |
| Tffs | trefoil factor family proteins |
| Tff3 | trefoil factor family 3 |
| Tgfβ | tumor growth factor beta |
| Tnfα | tumor necrosis factor alpha |
| WT | Wild type |
References
- Gluchowski, N.L.; Becuwe, M.; Walther, T.C.; Farese, R.V., Jr. Lipid droplets and liver disease: From basic biology to clinical implications. Nat. Rev. Gastroenterol. Hepatol. 2017, 14, 343–355. [Google Scholar] [CrossRef] [PubMed]
- Targher, G.; Corey, K.E.; Byrne, C.D.; Roden, M. The complex link between NAFLD and type 2 diabetes mellitus—Mechanisms and treatments. Nat. Rev. Gastroenterol. Hepatol. 2021, 18, 599–612. [Google Scholar] [CrossRef] [PubMed]
- DeFronzo, R.A.; Ferrannini, E.; Groop, L.; Henry, R.R.; Herman, W.H.; Holst, J.J.; Hu, F.B.; Kahn, C.R.; Raz, I.; Shulman, G.; et al. Type 2 diabetes mellitus. Nat. Rev. Dis. Prim. 2015, 1, 15019. [Google Scholar] [CrossRef] [PubMed]
- Aihara, E.; Engevik, K.A.; Montrose, M.H. Trefoil Factor Peptides and Gastrointestinal Function. Annu. Rev. Physiol. 2017, 79, 357–380. [Google Scholar] [CrossRef] [PubMed] [Green Version]
- Carrasco, R.; Pera, M.; May, F.E.B.; Westley, B.R.; Martinez, A.; Morales, L. Trefoil factor family peptide 3 prevents the development and promotes healing of ischemia-reperfusion injury in weanling rats. J. Pediatr. Surg. 2004, 39, 1693–1700. [Google Scholar] [CrossRef] [PubMed]
- Greeley, M.A.; Van Winkle, L.S.; Edwards, P.C.; Plopper, C.G. Airway Trefoil Factor Expression during Naphthalene Injury and Repair. Toxicol. Sci. 2010, 113, 453–467. [Google Scholar] [CrossRef] [PubMed] [Green Version]
- Taupin, D.; Podolsky, D.K. Trefoil factors: Initiators of mucosal healing. Nat. Rev. Mol. Cell Biol. 2003, 4, 721–732. [Google Scholar] [CrossRef]
- Baus-Loncar, M.; Schmid, J.; Lalani, E.-N.; Rosewell, I.; Goodlad, R.; Stamp, G.; Blin, N.; Kayademir, T. Trefoil Factor 2 (Tff2) Deficiency in Murine Digestive Tract Influences the Immune System. Cell. Physiol. Biochem. 2005, 16, 31–42. [Google Scholar] [CrossRef] [Green Version]
- Hoffmann, W. Trefoil factor family (Tff) peptides and their links to inflammation: A re-evaluation and new medical perspectives. Int. J. Mol. Sci. 2021, 22, 94909. [Google Scholar]
- Madsen, J.; Nielsen, O.; Tornøe, I.; Thim, L.; Holmskov, U. Tissue Localization of Human Trefoil Factors 1, 2, and 3. J. Histochem. Cytochem. 2007, 55, 505–513. [Google Scholar] [CrossRef]
- Hertel, S.C.; Chwieralski, C.E.; Hinz, M.; Rio, M.-C.; Tomasetto, C.; Hoffmann, W. Profiling trefoil factor family (TFF) expression in the mouse: Identification of an antisense TFF1-related transcript in the kidney and liver. Peptides 2004, 25, 755–762. [Google Scholar] [CrossRef]
- Brown, A.C.; Olver, W.I.; Donnelly, C.J.; May, M.E.; Naggert, J.K.; Shaffer, D.J.; Roopenian, D.C. Searching QTL by gene expression: Analysis of diabesity. BMC Genet. 2005, 6, 12. [Google Scholar] [CrossRef] [Green Version]
- Xue, Y.; Shen, L.; Cui, Y.; Zhang, H.; Chen, Q.; Cui, A.; Fang, F.; Chang, Y. Tff3, as a Novel Peptide, Regulates Hepatic Glucose Metabolism. PLoS ONE 2013, 8, e75240. [Google Scholar] [CrossRef] [Green Version]
- Ge, H.; Gardner, J.; Wu, X.; Rulifson, I.; Wang, J.; Xiong, Y.; Ye, J.; Belouski, E.; Cao, P.; Tang, J.; et al. Trefoil Factor 3 (TFF3) Is Regulated by Food Intake, Improves Glucose Tolerance and Induces Mucinous Metaplasia. PLoS ONE 2015, 10, e0126924. [Google Scholar] [CrossRef]
- Wu, X.; Zheng, H.; Yang, R.; Luan, X.; Zhang, L.; Jin, Q.; Jin, Y.; Xue, J. Mouse trefoil factor 3 ameliorated high-fat-diet-induced hepatic steatosis via increasing peroxisome proliferator-activated receptor-α-mediated fatty acid oxidation. Am. J. Physiol. Metab. 2019, 317, E436–E445. [Google Scholar] [CrossRef]
- Guillén, N.; Navarro, M.A.; Arnal, C.; Noone, E.; Arbonés-Mainar, J.M.; Acín, S.; Surra, J.C.; Muniesa, P.; Roche, H.M.; Osada, J. Microarray analysis of hepatic gene expression identifies new genes involved in steatotic liver. Physiol. Genom. 2009, 37, 187–198. [Google Scholar] [CrossRef] [Green Version]
- Bujak, M.; Bujak, I.T.; Sobočanec, S.; Mihalj, M.; Novak, S.; Ćosić, A.; Levak, M.T.; Kopačin, V.; Mihaljević, B.; Balog, T.; et al. Trefoil Factor 3 Deficiency Affects Liver Lipid Metabolism. Cell. Physiol. Biochem. 2018, 47, 827–841. [Google Scholar] [CrossRef]
- Roa, J.B.; Tortolero, G.S.; Gonzalez, E. Trefoil factor 3 (TFF3) expression is regulated by insulin and glucose. J. Health Sci. 2013, 3, 1–12. [Google Scholar] [CrossRef]
- Mekada, K.; Abe, K.; Murakami, A.; Nakamura, S.; Nakata, H.; Moriwaki, K.; Obata, Y.; Yoshiki, A. Genetic Differences among C57BL/6 Substrains. Exp. Anim. 2009, 58, 141–149. [Google Scholar] [CrossRef] [Green Version]
- Toye, A.A.; Lippiat, J.D.; Proks, P.; Shimomura, K.; Bentley, L.; Hugill, A.; Mijat, V.; Goldsworthy, M.; Moir, L.; Haynes, A.; et al. A genetic and physiological study of impaired glucose homeostasis control in C57BL/6J mice. Diabetologia 2005, 48, 675–686. [Google Scholar] [CrossRef] [Green Version]
- Gameiro, P.A.; Laviolette, L.A.; Kelleher, J.K.; Iliopoulos, O.; Stephanopoulos, G. Cofactor Balance by Nicotinamide Nucleotide Transhydrogenase (NNT) Coordinates Reductive Carboxylation and Glucose Catabolism in the Tricarboxylic Acid (TCA) Cycle. J. Biol. Chem. 2013, 288, 12967–12977. [Google Scholar] [CrossRef] [Green Version]
- Ward, N.P.; Kang, Y.P.; Falzone, A.; Boyle, T.A.; DeNicola, G.M. Nicotinamide nucleotide transhydrogenase regulates mito-chondrial metabolism in NSCLC through maintenance of Fe-S protein function. J. Exp. Med. 2020, 217, e20191689. [Google Scholar] [CrossRef] [Green Version]
- McCambridge, G.; Agrawal, M.; Keady, A.; Kern, P.A.; Hasturk, H.; Nikolajczyk, B.S.; Bharath, L.P. Saturated Fatty Acid Activates T Cell Inflammation Through a Nicotinamide Nucleotide Transhydrogenase (NNT)-Dependent Mechanism. Biomolecules 2019, 9, 79. [Google Scholar] [CrossRef] [Green Version]
- Meimaridou, E.; Goldsworthy, M.; Chortis, V.; Fragouli, E.; Foster, P.A.; Arlt, W.; Cox, R.; Metherell, L.A. NNT is a key regulator of adrenal redox homeostasis and steroidogenesis in male mice. J. Endocrinol. 2018, 236, 13–28. [Google Scholar] [CrossRef] [Green Version]
- Ronchi, J.A.; Figueira, T.R.; Ravagnani, F.G.; Oliveira, H.C.F.; Vercesi, A.E.; Castilho, R.F. A spontaneous mutation in the nicotinamide nucleotide transhydrogenase gene of C57BL/6J mice results in mitochondrial redox abnormalities. Free Radic. Biol. Med. 2013, 63, 446–456. [Google Scholar] [CrossRef] [Green Version]
- Gambhir, L.; Sharma, V.; Kandwal, P.; Saxena, S. Perturbation in cellular redox homeostasis: Decisive regulator of T cell mediated immune responses. Int. Immunopharmacol. 2019, 67, 449–457. [Google Scholar] [CrossRef]
- Lingappan, K. NF-κB in oxidative stress. Curr. Opin. Toxicol. 2018, 7, 81–86. [Google Scholar] [CrossRef]
- Sun, L.; Wang, X.; Saredy, J.; Yuan, Z.; Yang, X.; Wang, H. Innate-adaptive immunity interplay and redox regulation in immune response. Redox Biol. 2020, 37, 101759. [Google Scholar] [CrossRef]
- Wolf, S.; Hainz, N.; Beckmann, A.; Maack, C.; Menger, M.D.; Tschernig, T.; Meier, C. Brain damage resulting from postnatal hypoxic-ischemic brain injury is reduced in C57BL/6J mice as compared to C57BL/6N mice. Brain Res. 2016, 1650, 224–231. [Google Scholar] [CrossRef]
- Salerno, A.G.; Rentz, T.; Dorighello, G.G.; Marques, A.C.; Lorza-Gil, E.; Wanschel, A.C.B.A.; De Moraes, A.; Vercesi, A.E.; Oliveira, H.C.F. Lack of mitochondrial NADP(H)-transhydrogenase expression in macrophages exacerbates atherosclerosis in hypercholesterolemic mice. Biochem. J. 2019, 476, 3769–3789. [Google Scholar] [CrossRef]
- Morales-Hernández, A.; Martinat, A.; Chabot, A.; Kang, G.; McKinney-Freeman, S. Elevated Oxidative Stress Impairs Hematopoietic Progenitor Function in C57BL/6 Substrains. Stem Cell Rep. 2018, 11, 334–347. [Google Scholar] [CrossRef] [PubMed] [Green Version]
- Rawle, D.J.; Le, T.T.; Dumenil, T.; Bishop, C.; Yan, K.; Nakayama, E.; Bird, P.I.; Suhrbier, A. Widespread discrepancy in Nnt genotypes and genetic backgrounds complicates granzyme A and other knockout mouse studies. eLife 2022, 11, e70207. [Google Scholar] [CrossRef] [PubMed]
- Fontaine, D.A.; Davis, D.B. Attention to Background Strain Is Essential for Metabolic Research: C57BL/6 and the International Knockout Mouse Consortium. Diabetes 2016, 65, 25–33. [Google Scholar] [CrossRef] [PubMed] [Green Version]
- Fisher-Wellman, K.H.; Ryan, T.E.; Smith, C.D.; Gilliam, L.A.; Lin, C.-T.; Reese, L.R.; Torres, M.J.; Neufer, P.D. A Direct Comparison of Metabolic Responses to High-Fat Diet in C57BL/6J and C57BL/6NJ Mice. Diabetes 2016, 65, 3249–3261. [Google Scholar] [CrossRef] [Green Version]
- Šešelja, K.; Bazina, I.; Welss, J.; Schicht, M.; Paulsen, F.; Bijelić, N.; Rođak, E.; Horvatić, A.; Gelemanović, A.; Mihalj, M.; et al. Effect of Tff3 Deficiency and ER Stress in the Liver. Int. J. Mol. Sci. 2019, 20, 84389. [Google Scholar] [CrossRef] [Green Version]
- Flanagan, K.L. Sexual dimorphism in biomedical research: A call to analyse by sex. Trans. R. Soc. Trop. Med. Hyg. 2014, 108, 385–387. [Google Scholar] [CrossRef] [Green Version]
- Intraperitoneal Glucose Tolerance Test (IPGTT) Protocol—IMPReSS. Available online: https://www.mousephenotype.org/impress/ProcedureInfo?action=list&procID=531 (accessed on 2 August 2022).
- Haj, F.G. Intraperitoneal Insulin Tolerance Test. Mouse Metab. Phenotyping Cent. 2012, 5–6. Available online: https://www.mmpc.org/shared/document.aspx?id=84&docType=Protocol (accessed on 10 August 2022).
- Park, P.W.; Goins, R.E. In Situ Preparation of Fatty Acid Methyl Esters for Analysis of Fatty Acid Composition in Foods. J. Food Sci. 1994, 59, 1262–1266. [Google Scholar] [CrossRef]
- Takahashi, Y.; Fukusato, T. Histopathology of nonalcoholic fatty liver disease/nonalcoholic steatohepatitis. World J. Gastroenterol. 2014, 20, 15539–15548. [Google Scholar] [CrossRef]
- Velázquez, K.T.; Enos, R.T.; Bader, J.E.; Sougiannis, A.T.; Carson, M.S.; Chatzistamou, I.; Carson, J.A.; Nagarkatti, P.S.; Nagarkatti, M.; Murphy, E.A. Prolonged high-fat-diet feeding promotes non-alcoholic fatty liver disease and alters gut microbiota in mice. World J. Hepatol. 2019, 11, 619–637. [Google Scholar] [CrossRef]
- Brunt, E.M.; Wong, V.W.-S.; Nobili, V.; Day, C.P.; Sookoian, S.; Maher, J.J.; Bugianesi, E.; Sirlin, C.B.; Neuschwander-Tetri, B.A.; Rinella, M.E. Nonalcoholic fatty liver disease. Nat. Rev. Dis. Prim. 2015, 1, 15080. [Google Scholar] [CrossRef]
- Shah, A.A.; Leidinger, P.; Keller, A.; Wendschlag, A.; Backes, C.; Baus-Loncar, M.; Meese, E.; Blin, N. The intestinal factor Tff3 and a miRNA network regulate murine caloric metabolism. RNA Biol. 2011, 8, 77–81. [Google Scholar] [CrossRef] [Green Version]
- Ingvorsen, C.; Karp, N.A.; Lelliott, C.J. The role of sex and body weight on the metabolic effects of high-fat diet in C57BL/6N mice. Nutr. Diabetes 2017, 7, e261. [Google Scholar] [CrossRef]
- Hwang, L.-L.; Wang, C.-H.; Li, T.-L.; Chang, S.-D.; Lin, L.-C.; Chen, C.-P.; Chen, C.-T.; Liang, K.-C.; Ho, I.-K.; Yang, W.-S.; et al. Sex Differences in High-fat Diet-induced Obesity, Metabolic Alterations and Learning, and Synaptic Plasticity Deficits in Mice. Obesity 2010, 18, 463–469. [Google Scholar] [CrossRef]
- Pettersson, U.S.; Waldén, T.B.; Carlsson, P.-O.; Jansson, L.; Phillipson, M. Female Mice are Protected against High-Fat Diet Induced Metabolic Syndrome and Increase the Regulatory T Cell Population in Adipose Tissue. PLoS ONE 2012, 7, e46057. [Google Scholar] [CrossRef]
- El Akoum, S.; Lamontagne, V.; Cloutier, I.; Tanguay, J.-F. Nature of fatty acids in high fat diets differentially delineates obesity-linked metabolic syndrome components in male and female C57BL/6J mice. Diabetol. Metab. Syndr. 2011, 3, 34. [Google Scholar] [CrossRef] [Green Version]
- Grove, K.L.; Fried, S.K.; Greenberg, A.S.; Xiao, X.Q.; Clegg, D.J. A microarray analysis of sexual dimorphism of adipose tissues in high-fat-diet-induced obese mice. Int. J. Obes. 2010, 34, 989–1000. [Google Scholar] [CrossRef] [Green Version]
- Meda, C.; Barone, M.; Mitro, N.; Lolli, F.; Pedretti, S.; Caruso, D.; Maggi, A.; Della Torre, S. Hepatic ERα accounts for sex differences in the ability to cope with an excess of dietary lipids. Mol. Metab. 2020, 32, 97–108. [Google Scholar] [CrossRef]
- Khristi, V.; Ratri, A.; Ghosh, S.; Pathak, D.; Borosha, S.; Dai, E.; Roy, R.; Chakravarthi, V.P.; Wolfe, M.W.; Rumi, M.K. Disruption of ESR1 alters the expression of genes regulating hepatic lipid and carbohydrate metabolism in male rats. Mol. Cell. Endocrinol. 2019, 490, 47–56. [Google Scholar] [CrossRef]
- Zheng, D.; Wang, X.; Antonson, P.; Gustafsson, J.Å.; Li, Z. Genomics of sex hormone receptor signaling in hepatic sexual dimorphism. Mol. Cell. Endocrinol. 2018, 471, 33–41. [Google Scholar] [CrossRef]
- Shi, H.-S.; Zhu, W.-L.; Liu, J.F.; Luo, Y.-X.; Si, J.-J.; Wang, S.-J.; Xue, Y.-X.; Ding, Z.-B.; Shi, J.; Lu, L. PI3K/Akt Signaling Pathway in the Basolateral Amygdala Mediates the Rapid Antidepressant-like Effects of Trefoil Factor 3. Neuropsychopharmacology 2012, 37, 2671–2683. [Google Scholar] [CrossRef]
- Justo, R.; Boada, J.; Frontera, M.; Oliver, J.; Bermudez, J.; Gianotti, M. Gender dimorphism in rat liver mitochondrial oxidative metabolism and biogenesis. Am. J. Physiol. Physiol. 2005, 289, C372–C378. [Google Scholar] [CrossRef] [Green Version]
- Lefebvre, P.; Staels, B. Hepatic sexual dimorphism—Implications for non-alcoholic fatty liver disease. Nat. Rev. Endocrinol. 2021, 17, 662–670. [Google Scholar] [CrossRef]
- Soares, A.F.; Paz-Montoya, J.; Lei, H.; Moniatte, M.; Gruetter, R. Sexual dimorphism in hepatic lipids is associated with the evolution of metabolic status in mice. NMR Biomed. 2017, 30, e3761. [Google Scholar] [CrossRef] [PubMed] [Green Version]
- Natarajan, S.K.; Rasineni, K.; Ganesan, M.; Feng, D.; McVicker, B.L.; McNiven, M.A.; Osna, N.A.; Mott, J.L.; Casey, C.A.; Kharbanda, K.K. Structure, Function and Metabolism of Hepatic and Adipose Tissue Lipid Droplets: Implications in Alcoholic Liver Disease. Curr. Mol. Pharmacol. 2017, 10, 237–248. [Google Scholar] [CrossRef] [PubMed] [Green Version]
- Schiffrin, M.; Winkler, C.; Quignodon, L.; Naldi, A.; Trötzmüller, M.; Köfeler, H.; Henry, H.; Parini, P.; Desvergne, B.; Gilardi, F. Sex Dimorphism of Nonalcoholic Fatty Liver Disease (NAFLD) in Pparg-Null Mice. Int. J. Mol. Sci. 2021, 22, 89969. [Google Scholar] [CrossRef] [PubMed]
- Ballestri, S.; Nascimbeni, F.; Baldelli, E.; Marrazzo, A.; Romagnoli, D.; Lonardo, A. NAFLD as a Sexual Dimorphic Disease: Role of Gender and Reproductive Status in the Development and Progression of Nonalcoholic Fatty Liver Disease and Inherent Cardiovascular Risk. Adv. Ther. 2017, 34, 1291–1326. [Google Scholar] [CrossRef] [PubMed]
- Navarro, C.D.C.; Figueira, T.R.; Francisco, A.; Dal’Bó, G.A.; Ronchi, J.A.; Rovani, J.C.; Escanhoela, C.A.; Oliveira, H.C.; Castilho, R.F.; Vercesi, A.E. Redox imbalance due to the loss of mitochondrial NAD(P)-transhydrogenase markedly aggravates high fat diet-induced fatty liver disease in mice. Free Radic. Biol. Med. 2017, 113, 190–202. [Google Scholar] [CrossRef]
- Dreyer, C.; Krey, G.; Keller, H.; Givel, F.; Helftenbein, G.; Wahli, W. Control of the peroxisomal β-oxidation pathway by a novel family of nuclear hormone receptors. Cell 1992, 68, 879–887. [Google Scholar] [CrossRef]
- Ahmadian, M.; Suh, J.M.; Hah, N.; Liddle, C.; Atkins, A.R.; Downes, M.; Evans, R.M. PPARγ signaling and metabolism: The good, the bad and the future. Nat. Med. 2013, 19, 557–566. [Google Scholar] [CrossRef] [Green Version]
- Wang, Y.-X. PPARs: Diverse regulators in energy metabolism and metabolic diseases. Cell Res. 2010, 20, 124–137. [Google Scholar] [CrossRef]
- Wang, Y.; Nakajima, T.; Gonzalez, F.J.; Tanaka, N. PPARs as Metabolic Regulators in the Liver: Lessons from Liver-Specific PPAR-Null Mice. Int. J. Mol. Sci. 2020, 21, 62061. [Google Scholar] [CrossRef] [Green Version]
- Lee, Y.K.; Park, J.E.; Lee, M.; Hardwick, J.P. Hepatic lipid homeostasis by peroxisome proliferator-activated receptor gamma 2. Liver Res. 2018, 2, 209–215. [Google Scholar] [CrossRef]
- Pydyn, N.; Miękus, K.; Jura, J.; Kotlinowski, J. New therapeutic strategies in nonalcoholic fatty liver disease: A focus on promising drugs for nonalcoholic steatohepatitis. Pharmacol. Rep. 2020, 72, 1–12. [Google Scholar] [CrossRef] [Green Version]
- Tarantino, G.; Citro, V.; Capone, D. Nonalcoholic Fatty Liver Disease: A Challenge from Mechanisms to Therapy. J. Clin. Med. 2020, 9, 15. [Google Scholar] [CrossRef] [Green Version]
- Kern, L.; Mittenbühler, M.J.; Vesting, A.J.; Ostermann, A.L.; Wunderlich, C.M.; Wunderlich, F.T. Obesity-Induced TNFα and IL-6 Signaling: The Missing Link between Obesity and Inflammation—Driven Liver and Colorectal Cancers. Cancers 2019, 11, 24. [Google Scholar] [CrossRef] [Green Version]
- Matthews, V.B.; Allen, T.L.; Risis, S.; Chan, M.H.S.; Henstridge, D.C.; Watson, N.; Zaffino, L.A.; Babb, J.R.; Boon, J.; Meikle, P.J.; et al. Interleukin-6-deficient mice develop hepatic inflammation and systemic insulin resistance. Diabetologia 2010, 53, 2431–2441. [Google Scholar] [CrossRef]
- Barrera, G.J.; Sanchez, G.; Gonzalez, J.E. Trefoil factor 3 isolated from human breast milk downregulates cytokines (IL8 and IL6) and promotes human beta defensin (hBD2 and hBD4) expression in intestinal epithelial cells HT-29. Bosn. J. Basic Med. Sci. 2012, 12, 256–264. [Google Scholar] [CrossRef] [Green Version]
- Jiang, G.-X.; Zhong, X.-Y.; Cui, Y.-F.; Liu, W.; Tai, S.; Wang, Z.-D.; Shi, Y.-G.; Zhao, S.-Y.; Li, C.-L. IL-6/STAT3/TFF3 signaling regulates human biliary epithelial cell migration and wound healing in vitro. Mol. Biol. Rep. 2010, 37, 3813–3818. [Google Scholar] [CrossRef]
- Nozaki, I.; Lunz, J.G.; Specht, S.; Park, J.-I.; Giraud, A.S.; Murase, N.; Demetris, A.J. Regulation and Function of Trefoil Factor Family 3 Expression in the Biliary Tree. Am. J. Pathol. 2004, 165, 1907–1920. [Google Scholar] [CrossRef] [Green Version]


| Parameter | Unit | Group | ||||
|---|---|---|---|---|---|---|
| WT ♂ | Tff3-/- ♂ | WT ♀ | Tff3-/- ♀ | Genotype × Sex | ||
| LDL | mmol/L | 3.19 ± 0.92 | 2.18 ± 0.49 | 1.54 ± 0.38 | 1.01 ± 0.27 | 0.304 |
| HDL | mmol/L | 2.17 ± 0.18 | 1.91 ± 0.17 | 1.29 ± 0.15 | 1.30 ± 0.20 | 0.058 |
| Total cholesterol | mmol/L | 5.74 ± 1.10 | 4.40 ± 0.69 | 3.18 ± 0.36 | 2.60 ± 0.43 | 0.178 |
| Triglycerides | mmol/L | 0.86 ± 0.16 | 0.67 ± 0.12 | 0.77 ± 0.12 | 0.65 ± 0.15 | 0.519 |
| BG | mmol/L | 14.7 ± 4.12 | 16.9 ± 3.88 | 14.5 ± 1.26 | 12.6 ± 3.69 | 0.135 |
| AST | U/L | 366.9 ± 187.9 | 304.0 ± 148.2 | 524.7 ± 320.8 | 378.4 ± 212.7 | 0.611 |
| ALT | U/L | 216.1 ± 115.1 | 83.2 ± 44.1 | 137.2 ± 114.6 | 61.6 ± 47.0 | 0.389 |
| CRP | mg/L | 0.16 ± 0.02 | 0.13 ± 0.02 | 0.13 ± 0.03 | 0.13 ± 0.02 | 0.255 |
| Urea | mmol/L | 9.17 ± 2.04 | 9.45 ± 1.32 | 8.07 ± 1.10 | 8.38 ± 1.09 | 0.978 |
| ALP | U/L | 81.8 ± 29.4 | 51.0 ± 5.3 | 67.3 ± 4.6 | 67.7 ± 12.6 | 0.031 * |
| Total protein | g/L | 54.3 ± 17.8 | 54.2 ± 4.07 | 58.0 ± 6.1 | 50.9 ± 3.6 | 0.395 |
Publisher’s Note: MDPI stays neutral with regard to jurisdictional claims in published maps and institutional affiliations. |
© 2022 by the authors. Licensee MDPI, Basel, Switzerland. This article is an open access article distributed under the terms and conditions of the Creative Commons Attribution (CC BY) license (https://creativecommons.org/licenses/by/4.0/).
Share and Cite
Šešelja, K.; Bazina, I.; Vrecl, M.; Welss, J.; Schicht, M.; Mihalj, M.; Kopačin, V.; Paulsen, F.; Pirman, T.; Baus Lončar, M. Tff3 Deficiency Protects against Hepatic Fat Accumulation after Prolonged High-Fat Diet. Life 2022, 12, 1288. https://doi.org/10.3390/life12081288
Šešelja K, Bazina I, Vrecl M, Welss J, Schicht M, Mihalj M, Kopačin V, Paulsen F, Pirman T, Baus Lončar M. Tff3 Deficiency Protects against Hepatic Fat Accumulation after Prolonged High-Fat Diet. Life. 2022; 12(8):1288. https://doi.org/10.3390/life12081288
Chicago/Turabian StyleŠešelja, Kate, Iva Bazina, Milka Vrecl, Jessica Welss, Martin Schicht, Martina Mihalj, Vjekoslav Kopačin, Friedrich Paulsen, Tatjana Pirman, and Mirela Baus Lončar. 2022. "Tff3 Deficiency Protects against Hepatic Fat Accumulation after Prolonged High-Fat Diet" Life 12, no. 8: 1288. https://doi.org/10.3390/life12081288
APA StyleŠešelja, K., Bazina, I., Vrecl, M., Welss, J., Schicht, M., Mihalj, M., Kopačin, V., Paulsen, F., Pirman, T., & Baus Lončar, M. (2022). Tff3 Deficiency Protects against Hepatic Fat Accumulation after Prolonged High-Fat Diet. Life, 12(8), 1288. https://doi.org/10.3390/life12081288