
A Comparative Study of High-Frequency Bioelectrical Impedance Analysis and Dual-Energy X-ray Absorptiometry for Estimating Body Composition


Abstract
:1. Introduction
2. Materials and Methods
2.1. Study Design
2.2. BMI (Anthropometric Measurement)
2.3. High-Frequency BIA (HF-BIA)
2.4. Dual-Energy X-ray Absorptiometry
2.5. Statistical Analysis
3. Results
4. Discussion
5. Conclusions
Author Contributions
Funding
Institutional Review Board Statement
Informed Consent Statement
Data Availability Statement
Acknowledgments
Conflicts of Interest
References
- Chen, L.K.; Woo, J.; Assantachai, P.; Auyeung, T.W.; Chou, M.Y.; Iijima, K.; Jang, H.C.; Kang, L.; Kim, M.; Kim, S.; et al. Asian Working Group for Sarcopenia: 2019 Consensus Update on Sarcopenia Diagnosis and Treatment. J. Am. Med. Dir. Assoc. 2020, 21, 300–307. [Google Scholar] [CrossRef]
- Cruz-Jentoft, A.J.; Bahat, G.; Bauer, J.; Boirie, Y.; Bruyère, O.; Cederholm, T.; Cooper, C.; Landi, F.; Rolland, Y.; Sayer, A.A.; et al. Sarcopenia: Revised European consensus on definition and diagnosis. Age Ageing 2019, 48, 16–31. [Google Scholar] [CrossRef] [Green Version]
- Dent, E.; Morley, J.E.; Cruz-Jentoft, A.J.; Arai, H.; Kritchevsky, S.B.; Guralnik, J.; Bauer, J.M.; Pahor, M.; Clark, B.C.; Cesari, M.; et al. International Clinical Practice Guidelines for Sarcopenia (ICFSR): Screening, Diagnosis and Management. J. Nutr. Health Aging 2018, 22, 1148–1161. [Google Scholar] [CrossRef]
- Akishita, M.; Kozaki, K.; Iijima, K.; Tanaka, T.; Shibasaki, K.; Ogawa, S.; Arai, H. Chapter 1 Definitions and diagnosis of sarcopenia. Geriatr. Gerontol. Int. 2018, 18 (Suppl. S1), 7–12. [Google Scholar] [CrossRef] [Green Version]
- Cederholm, T.; Barazzoni, R.; Austin, P.; Ballmer, P.; Biolo, G.; Bischoff, S.C.; Compher, C.; Correia, I.; Higashiguchi, T.; Holst, M.; et al. ESPEN guidelines on definitions and terminology of clinical nutrition. Clin. Nutr. 2017, 36, 49–64. [Google Scholar] [CrossRef]
- Holmes, C.J.; Racette, S.B. The Utility of Body Composition Assessment in Nutrition and Clinical Practice: An Overview of Current Methodology. Nutrients 2021, 13, 2493. [Google Scholar] [CrossRef]
- Beaudart, C.; McCloskey, E.; Bruyère, O.; Cesari, M.; Rolland, Y.; Rizzoli, R.; Araujo de Carvalho, I.; Amuthavalli Thiyagarajan, J.; Bautmans, I.; Bertière, M.C.; et al. Sarcopenia in daily practice: Assessment and management. BMC Geriatr. 2016, 16, 170. [Google Scholar] [CrossRef]
- Sheean, P.; Gonzalez, M.C.; Prado, C.M.; McKeever, L.; Hall, A.M.; Braunschweig, C.A. American Society for Parenteral and Enteral Nutrition Clinical Guidelines: The Validity of Body Composition Assessment in Clinical Populations. J. Parenter. Enter. Nutr. 2020, 44, 12–43. [Google Scholar] [CrossRef] [Green Version]
- Thomson, R.; Brinkworth, G.D.; Buckley, J.D.; Noakes, M.; Clifton, P.M. Good agreement between bioelectrical impedance and dual-energy X-ray absorptiometry for estimating changes in body composition during weight loss in overweight young women. Clin. Nutr. 2007, 26, 771–777. [Google Scholar] [CrossRef]
- Gaba, A.; Kapus, O.; Cuberek, R.; Botek, M. Comparison of multi- and single-frequency bioelectrical impedance analysis with dual-energy X-ray absorptiometry for assessment of body composition in post-menopausal women: Effects of body mass index and accelerometer-determined physical activity. J. Hum. Nutr. Diet. 2015, 28, 390–400. [Google Scholar] [CrossRef]
- Park, K.S.; Lee, D.H.; Lee, J.; Kim, Y.J.; Jung, K.Y.; Kim, K.M.; Kwak, S.H.; Choi, S.H.; Park, K.S.; Jang, H.C.; et al. Comparison between two methods of bioelectrical impedance analyses for accuracy in measuring abdominal visceral fat area. J. Diabetes Complicat. 2016, 30, 343–349. [Google Scholar] [CrossRef]
- Hurt, R.T.; Ebbert, J.O.; Croghan, I.; Nanda, S.; Schroeder, D.R.; Teigen, L.M.; Velapati, S.R.; Mundi, M.S. The Comparison of Segmental Multifrequency Bioelectrical Impedance Analysis and Dual-Energy X-ray Absorptiometry for Estimating Fat Free Mass and Percentage Body Fat in an Ambulatory Population. J. Parenter. Enter. Nutr. 2021, 45, 1231–1238. [Google Scholar] [CrossRef]
- Foster, K.R.; Lukaski, H.C. Whole-body impedance—What does it measure? Am. J. Clin. Nutr. 1996, 64, 388s–396s. [Google Scholar] [CrossRef] [Green Version]
- Kyle, U.G.; Bosaeus, I.; De Lorenzo, A.D.; Deurenberg, P.; Elia, M.; Gomez, J.M.; Heitmann, B.L.; Kent-Smith, L.; Melchior, J.C.; Pirlich, M.; et al. Bioelectrical impedance analysis--part I: Review of principles and methods. Clin. Nutr. 2004, 23, 1226–1243. [Google Scholar] [CrossRef]
- Qin, E.S.; Bowen, M.J.; James, S.L.; Chen, W.F. Multi-segment bioimpedance can assess patients with bilateral lymphedema. J. Plast. Reconstr. Aesthet. Surg. 2020, 73, 328–336. [Google Scholar] [CrossRef]
- Cha, K.; Chertow, G.M.; Gonzalez, J.; Lazarus, J.M.; Wilmore, D.W. Multifrequency bioelectrical impedance estimates the distribution of body water. J. Appl. Physiol. 1995, 79, 1316–1319. [Google Scholar] [CrossRef]
- Inbody Co., Ltd. BIA Technology. Available online: https://inbody.com/en/technology/contents/technology (accessed on 17 March 2022).
- Bum, W.J. Apparatus for Measuring Bioimpedance And Electrode-Side Board Thereof. U.S. Patent US11033197B2, 15 June 2018. [Google Scholar]
- Faul, F.; Erdfelder, E.; Lang, A.G.; Buchner, A. G*Power 3: A flexible statistical power analysis program for the social, behavioral, and biomedical sciences. Behav. Res. Methods 2007, 39, 175–191. [Google Scholar] [CrossRef]
- Faul, F.; Erdfelder, E.; Buchner, A.; Lang, A.G. Statistical power analyses using G*Power 3.1: Tests for correlation and regression analyses. Behav. Res. Methods 2009, 41, 1149–1160. [Google Scholar] [CrossRef] [Green Version]
- Who, J.; Consultation, F.E. Diet, nutrition and the prevention of chronic diseases. World Health Organ. Tech. Rep. Ser. 2003, 916, 1–149. [Google Scholar]
- Després, J.P.; Lemieux, I.; Bergeron, J.; Pibarot, P.; Mathieu, P.; Larose, E.; Rodés-Cabau, J.; Bertrand, O.F.; Poirier, P. Abdominal obesity and the metabolic syndrome: Contribution to global cardiometabolic risk. Arterioscler. Thromb. Vasc. Biol. 2008, 28, 1039–1049. [Google Scholar] [CrossRef]
- Goossens, G.H. The Metabolic Phenotype in Obesity: Fat Mass, Body Fat Distribution, and Adipose Tissue Function. Obes. Facts 2017, 10, 207–215. [Google Scholar] [CrossRef]
- Kim, J.; Wang, Z.; Heymsfield, S.B.; Baumgartner, R.N.; Gallagher, D. Total-body skeletal muscle mass: Estimation by a new dual-energy X-ray absorptiometry method. Am. J. Clin. Nutr. 2002, 76, 378–383. [Google Scholar] [CrossRef] [Green Version]
- Geisler, C.; Pourhassan, M.; Braun, W.; Schweitzer, L.; Müller, M.J. The prediction of total skeletal muscle mass in a Caucasian population—Comparison of Magnetic resonance imaging (MRI) and Dual-energy X-ray absorptiometry (DXA). Clin. Physiol. Funct. Imaging 2017, 37, 168–172. [Google Scholar] [CrossRef]
- Lester, R.M.; Ghatas, M.P.; Khan, R.M.; Gorgey, A.S. Prediction of thigh skeletal muscle mass using dual energy x-ray absorptiometry compared to magnetic resonance imaging after spinal cord injury. J. Spinal Cord Med. 2019, 42, 622–630. [Google Scholar] [CrossRef]
- Mijnarends, D.M.; Meijers, J.M.; Halfens, R.J.; ter Borg, S.; Luiking, Y.C.; Verlaan, S.; Schoberer, D.; Cruz Jentoft, A.J.; van Loon, L.J.; Schols, J.M. Validity and reliability of tools to measure muscle mass, strength, and physical performance in community-dwelling older people: A systematic review. J. Am. Med. Dir. Assoc. 2013, 14, 170–178. [Google Scholar] [CrossRef]
- Beaudart, C.; Reginster, J.Y.; Slomian, J.; Buckinx, F.; Dardenne, N.; Quabron, A.; Slangen, C.; Gillain, S.; Petermans, J.; Bruyère, O. Estimation of sarcopenia prevalence using various assessment tools. Exp. Gerontol. 2015, 61, 31–37. [Google Scholar] [CrossRef]
- González Correa, C.H.; Marulanda Mejía, F.; Castaño González, P.A.; Vidarte Claros, J.A.; Castiblanco Arroyabe, H.D. Bioelectrical impedance analysis and dual x-ray absorptiometry agreement for skeletal muscle mass index evaluation in sarcopenia diagnosis. Physiol. Meas. 2020, 41, 064005. [Google Scholar] [CrossRef]
- Fang, W.H.; Yang, J.R.; Lin, C.Y.; Hsiao, P.J.; Tu, M.Y.; Chen, C.F.; Tsai, D.J.; Su, W.; Huang, G.S.; Chang, H.; et al. Accuracy augmentation of body composition measurement by bioelectrical impedance analyzer in elderly population. Medicine 2020, 99, e19103. [Google Scholar] [CrossRef]
- Ling, C.H.; de Craen, A.J.; Slagboom, P.E.; Gunn, D.A.; Stokkel, M.P.; Westendorp, R.G.; Maier, A.B. Accuracy of direct segmental multi-frequency bioimpedance analysis in the assessment of total body and segmental body composition in middle-aged adult population. Clin. Nutr. 2011, 30, 610–615. [Google Scholar] [CrossRef] [Green Version]
- Meier, N.F.; Bai, Y.; Wang, C.; Lee, D.C. Validation of a Multielectrode Bioelectrical Impedance Analyzer with a Dual-Energy X-Ray Absorptiometer for the Assessment of Body Composition in Older Adults. J. Aging Phys. Act. 2020, 28, 598–604. [Google Scholar] [CrossRef]
- Kim, M.; Shinkai, S.; Murayama, H.; Mori, S. Comparison of segmental multifrequency bioelectrical impedance analysis with dual-energy X-ray absorptiometry for the assessment of body composition in a community-dwelling older population. Geriatr. Gerontol. Int. 2015, 15, 1013–1022. [Google Scholar] [CrossRef]
- Fujimoto, K.; Inage, K.; Eguchi, Y.; Orita, S.; Suzuki, M.; Kubota, G.; Sainoh, T.; Sato, J.; Shiga, Y.; Abe, K.; et al. Use of Bioelectrical Impedance Analysis for the Measurement of Appendicular Skeletal Muscle Mass/Whole Fat Mass and Its Relevance in Assessing Osteoporosis among Patients with Low Back Pain: A Comparative Analysis Using Dual X-ray Absorptiometry. Asian Spine J. 2018, 12, 839–845. [Google Scholar] [CrossRef] [Green Version]
- Fujimoto, K.; Inage, K.; Eguchi, Y.; Orita, S.; Toyoguchi, T.; Yamauchi, K.; Suzuki, M.; Kubota, G.; Sainoh, T.; Sato, J.; et al. Dual-Energy X-ray Absorptiometry and Bioelectrical Impedance Analysis are Beneficial Tools for Measuring the Trunk Muscle Mass of Patients with Low Back Pain. Spine Surg. Relat. Res. 2019, 3, 335–341. [Google Scholar] [CrossRef]
- Gade, J.; Astrup, A.; Vinther, A.; Zerahn, B. Comparison of a dual-frequency bio-impedance analyser with dual-energy X-ray absorptiometry for assessment of body composition in geriatric patients. Clin. Physiol. Funct. Imaging 2020, 40, 290–301. [Google Scholar] [CrossRef]
- Kim, M.; Kim, H. Accuracy of segmental multi-frequency bioelectrical impedance analysis for assessing whole-body and appendicular fat mass and lean soft tissue mass in frail women aged 75 years and older. Eur. J. Clin. Nutr. 2013, 67, 395–400. [Google Scholar] [CrossRef]
- Jeon, K.C.; Kim, S.Y.; Jiang, F.L.; Chung, S.; Ambegaonkar, J.P.; Park, J.H.; Kim, Y.J.; Kim, C.H. Prediction Equations of the Multifrequency Standing and Supine Bioimpedance for Appendicular Skeletal Muscle Mass in Korean Older People. Int. J. Environ. Res. Public Health 2020, 17, 5847. [Google Scholar] [CrossRef]
- Wang, H.; Hai, S.; Cao, L.; Zhou, J.; Liu, P.; Dong, B.R. Estimation of prevalence of sarcopenia by using a new bioelectrical impedance analysis in Chinese community-dwelling elderly people. BMC Geriatr. 2016, 16, 216. [Google Scholar] [CrossRef] [Green Version]
- Yanishi, M.; Kinoshita, H.; Tsukaguchi, H.; Kimura, Y.; Koito, Y.; Jino, E.; Watanabe, M.; Sugi, M.; Matsuda, T. Dual Energy X-ray Absorptiometry and Bioimpedance Analysis are Clinically Useful for Measuring Muscle Mass in Kidney Transplant Recipients with Sarcopenia. Transplant. Proc. 2018, 50, 150–154. [Google Scholar] [CrossRef]
- Benton, L.; Hans, D.; Kyle, U.G.; Pichard, C. Dual-Energy X-ray absorptiometry and body composition: Differences between devices and comparison with reference methods. Nutrition 2002, 18, 66–70. [Google Scholar]
- Shafer, K.J.; Siders, W.A.; Johnson, L.K.; Lukaski, H.C. Validity of segmental multiple-frequency bioelectrical impedance analysis to estimate body composition of adults across a range of body mass indexes. Nutrition 2009, 25, 25–32. [Google Scholar] [CrossRef]
- KOSIS. Median Age of Population in Korea. 2020. Available online: https://kosis.kr/statHtml/statHtml.do?orgId=101&tblId=DT_1IN1503&conn_path=I2 (accessed on 17 March 2022).
- Median Age of Population in World. 2020. Available online: https://population.un.org/wpp/Download/Standard/Population/ (accessed on 17 March 2022).

| Male (n = 55) | Female (n = 54) | p-Value | |
|---|---|---|---|
| Age (y) | 43.4 ± 14.7 | 44.9 ± 14.1 | 0.568 |
| Height (cm) | 171.6 ± 5.9 | 160.5 ± 6.1 | <0.001 |
| Weight (kg) | 75.1 ± 20.4 | 62.1 ± 18.9 | <0.001 |
| BMI (kg/m2) | 25.5 ± 6.7 | 24.0 ± 6.4 | 0.244 |
| ALM (kg/m2) * | 26.1 ± 5.6 | 17.8 ± 5.4 | <0.001 |
| Fat percent (%) * | 26.6 ± 8.7 | 34.7 ± 7.8 | <0.001 |
| DEXA (Mean ± SD) | InBody970 (Mean ± SD) | BWA (Clamp) (Mean ± SD) | BWA (Adhesive) (Mean ± SD) | p-Value (ANOVA) | |
|---|---|---|---|---|---|
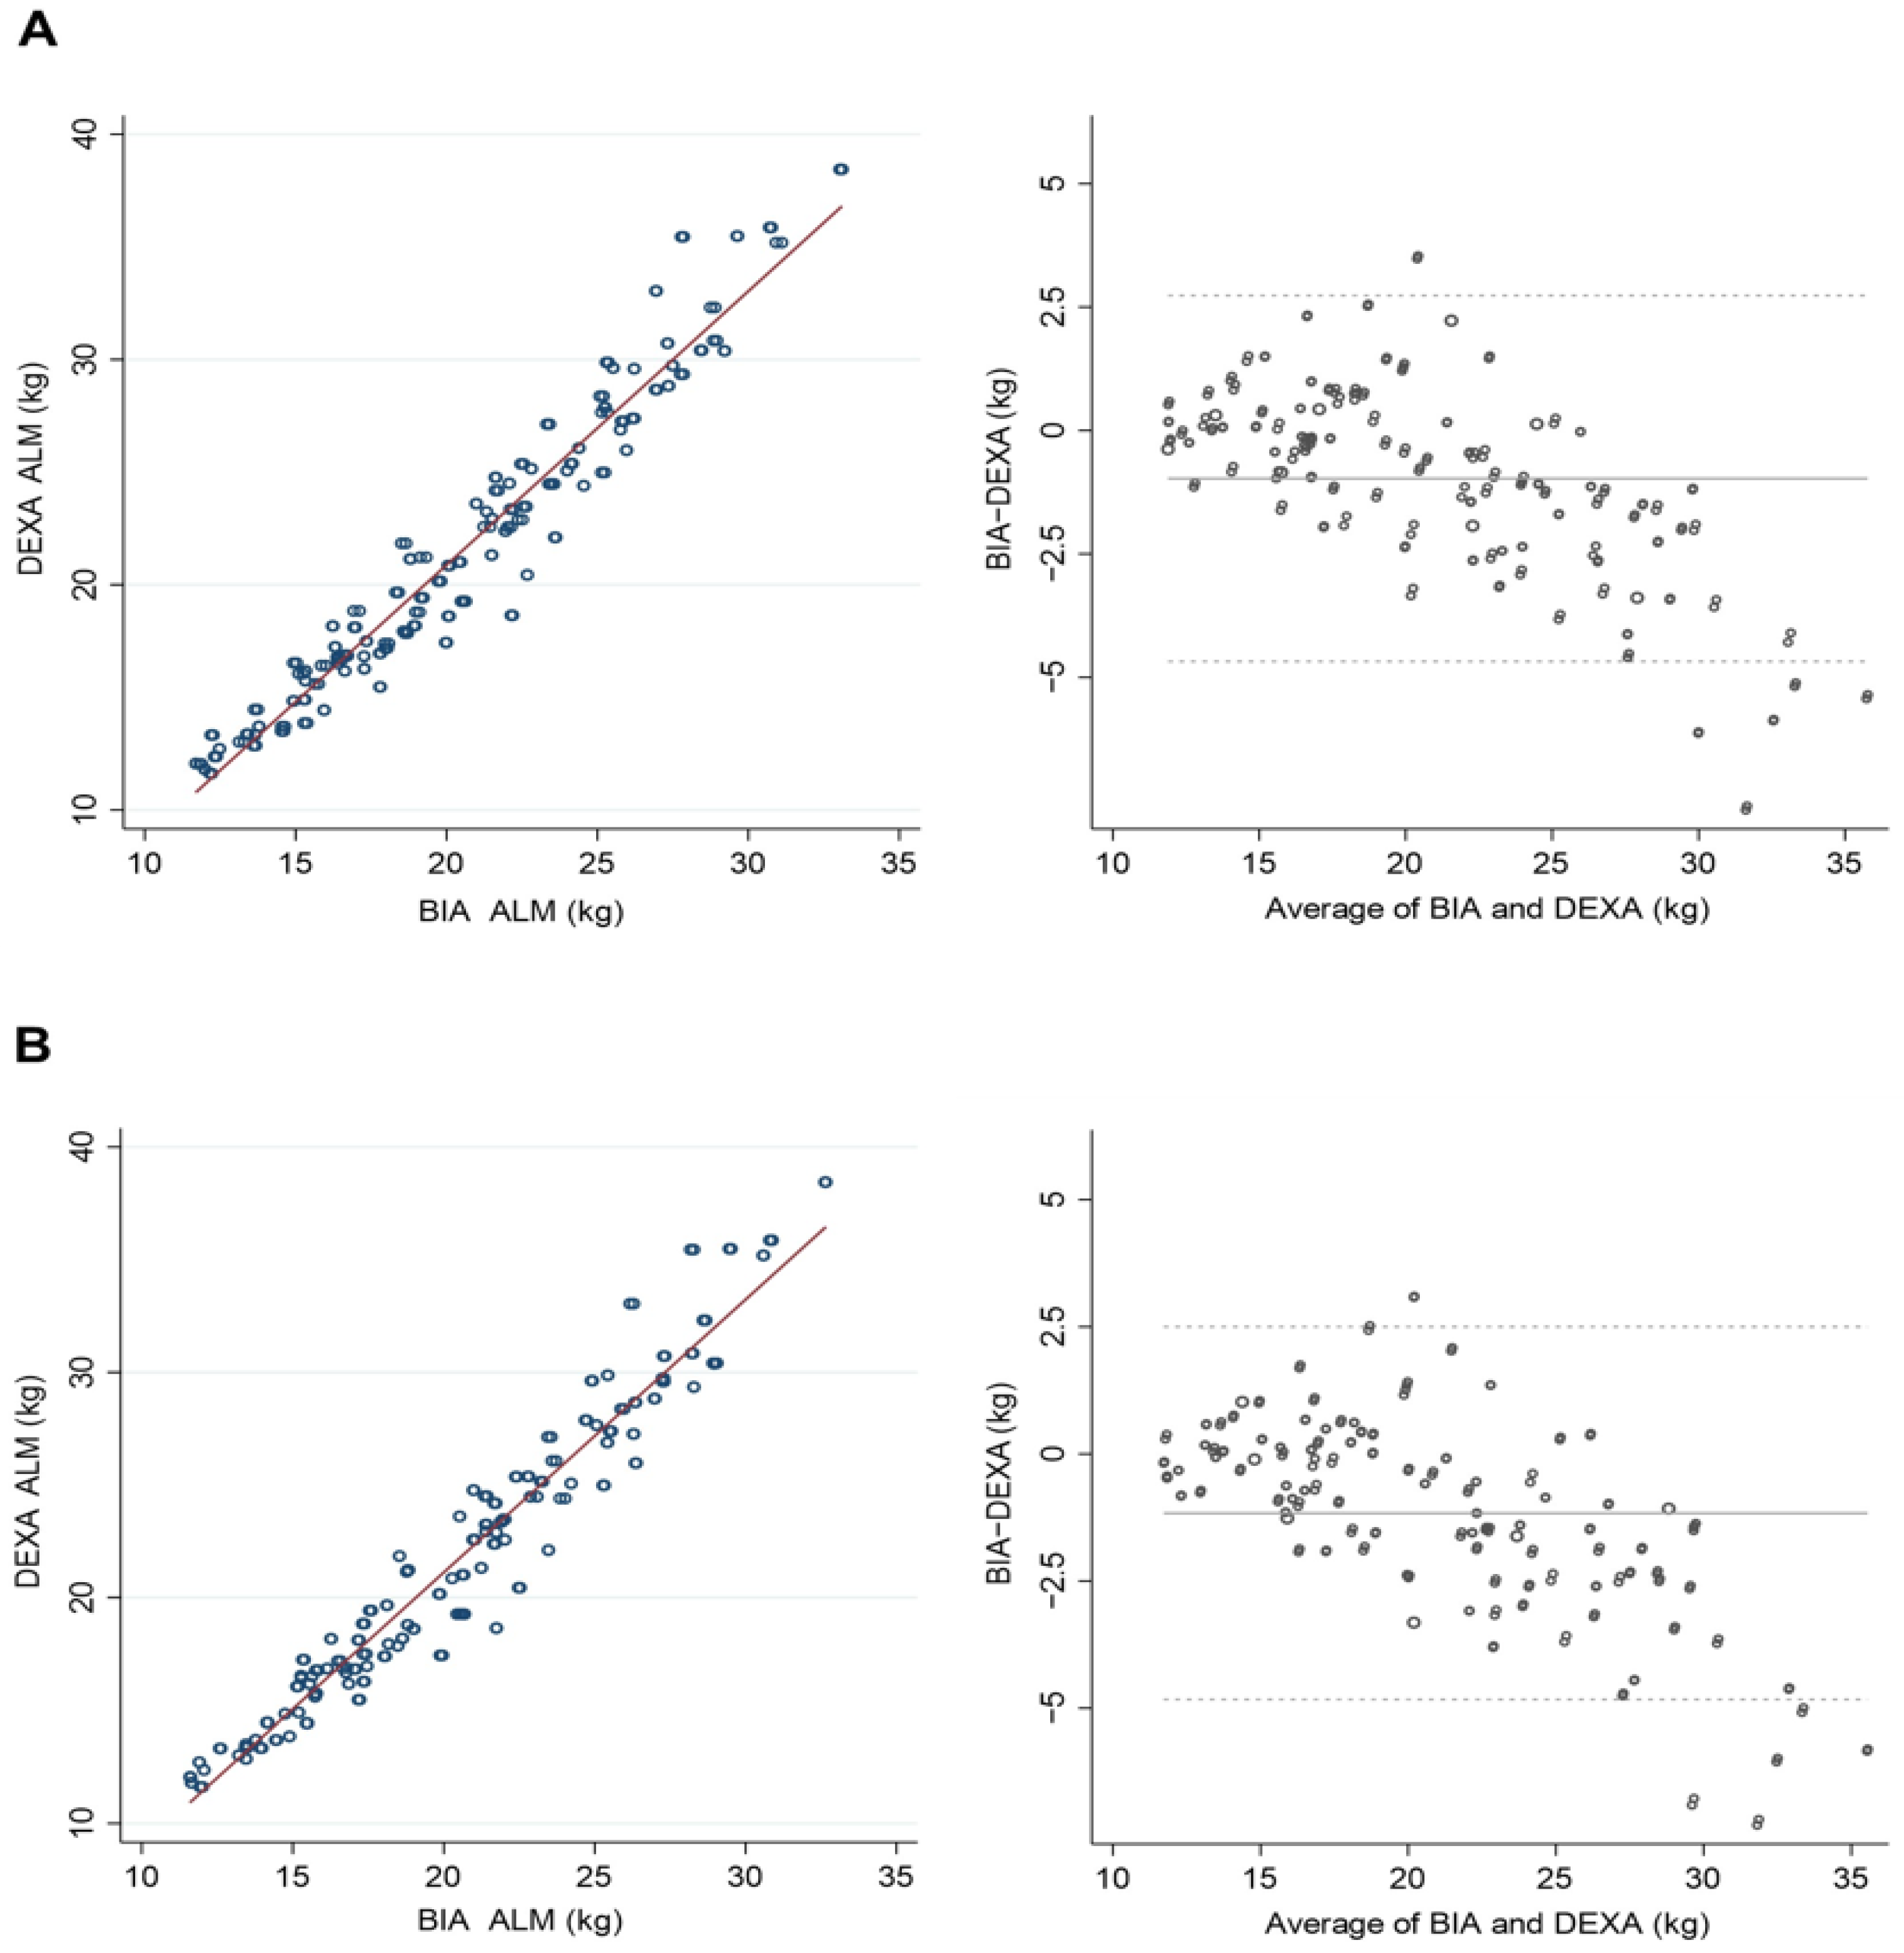
| ALM | |||||
| Overall | 21.40 ± 4.99 | 20.42 ± 3.92 | 20.23 ± 3.94 | 20.30 ± 3.90 | <0.01 |
| Male | 25.38 ± 5.75 | 23.91 ± 4.00 | 23.77 ± 4.06 | 23.88 ± 3.97 | <0.01 |
| Female | 17.34 ± 4.07 | 16.88 ± 3.40 | 16.63 ± 3.27 | 16.66 ± 3.20 | <0.01 |
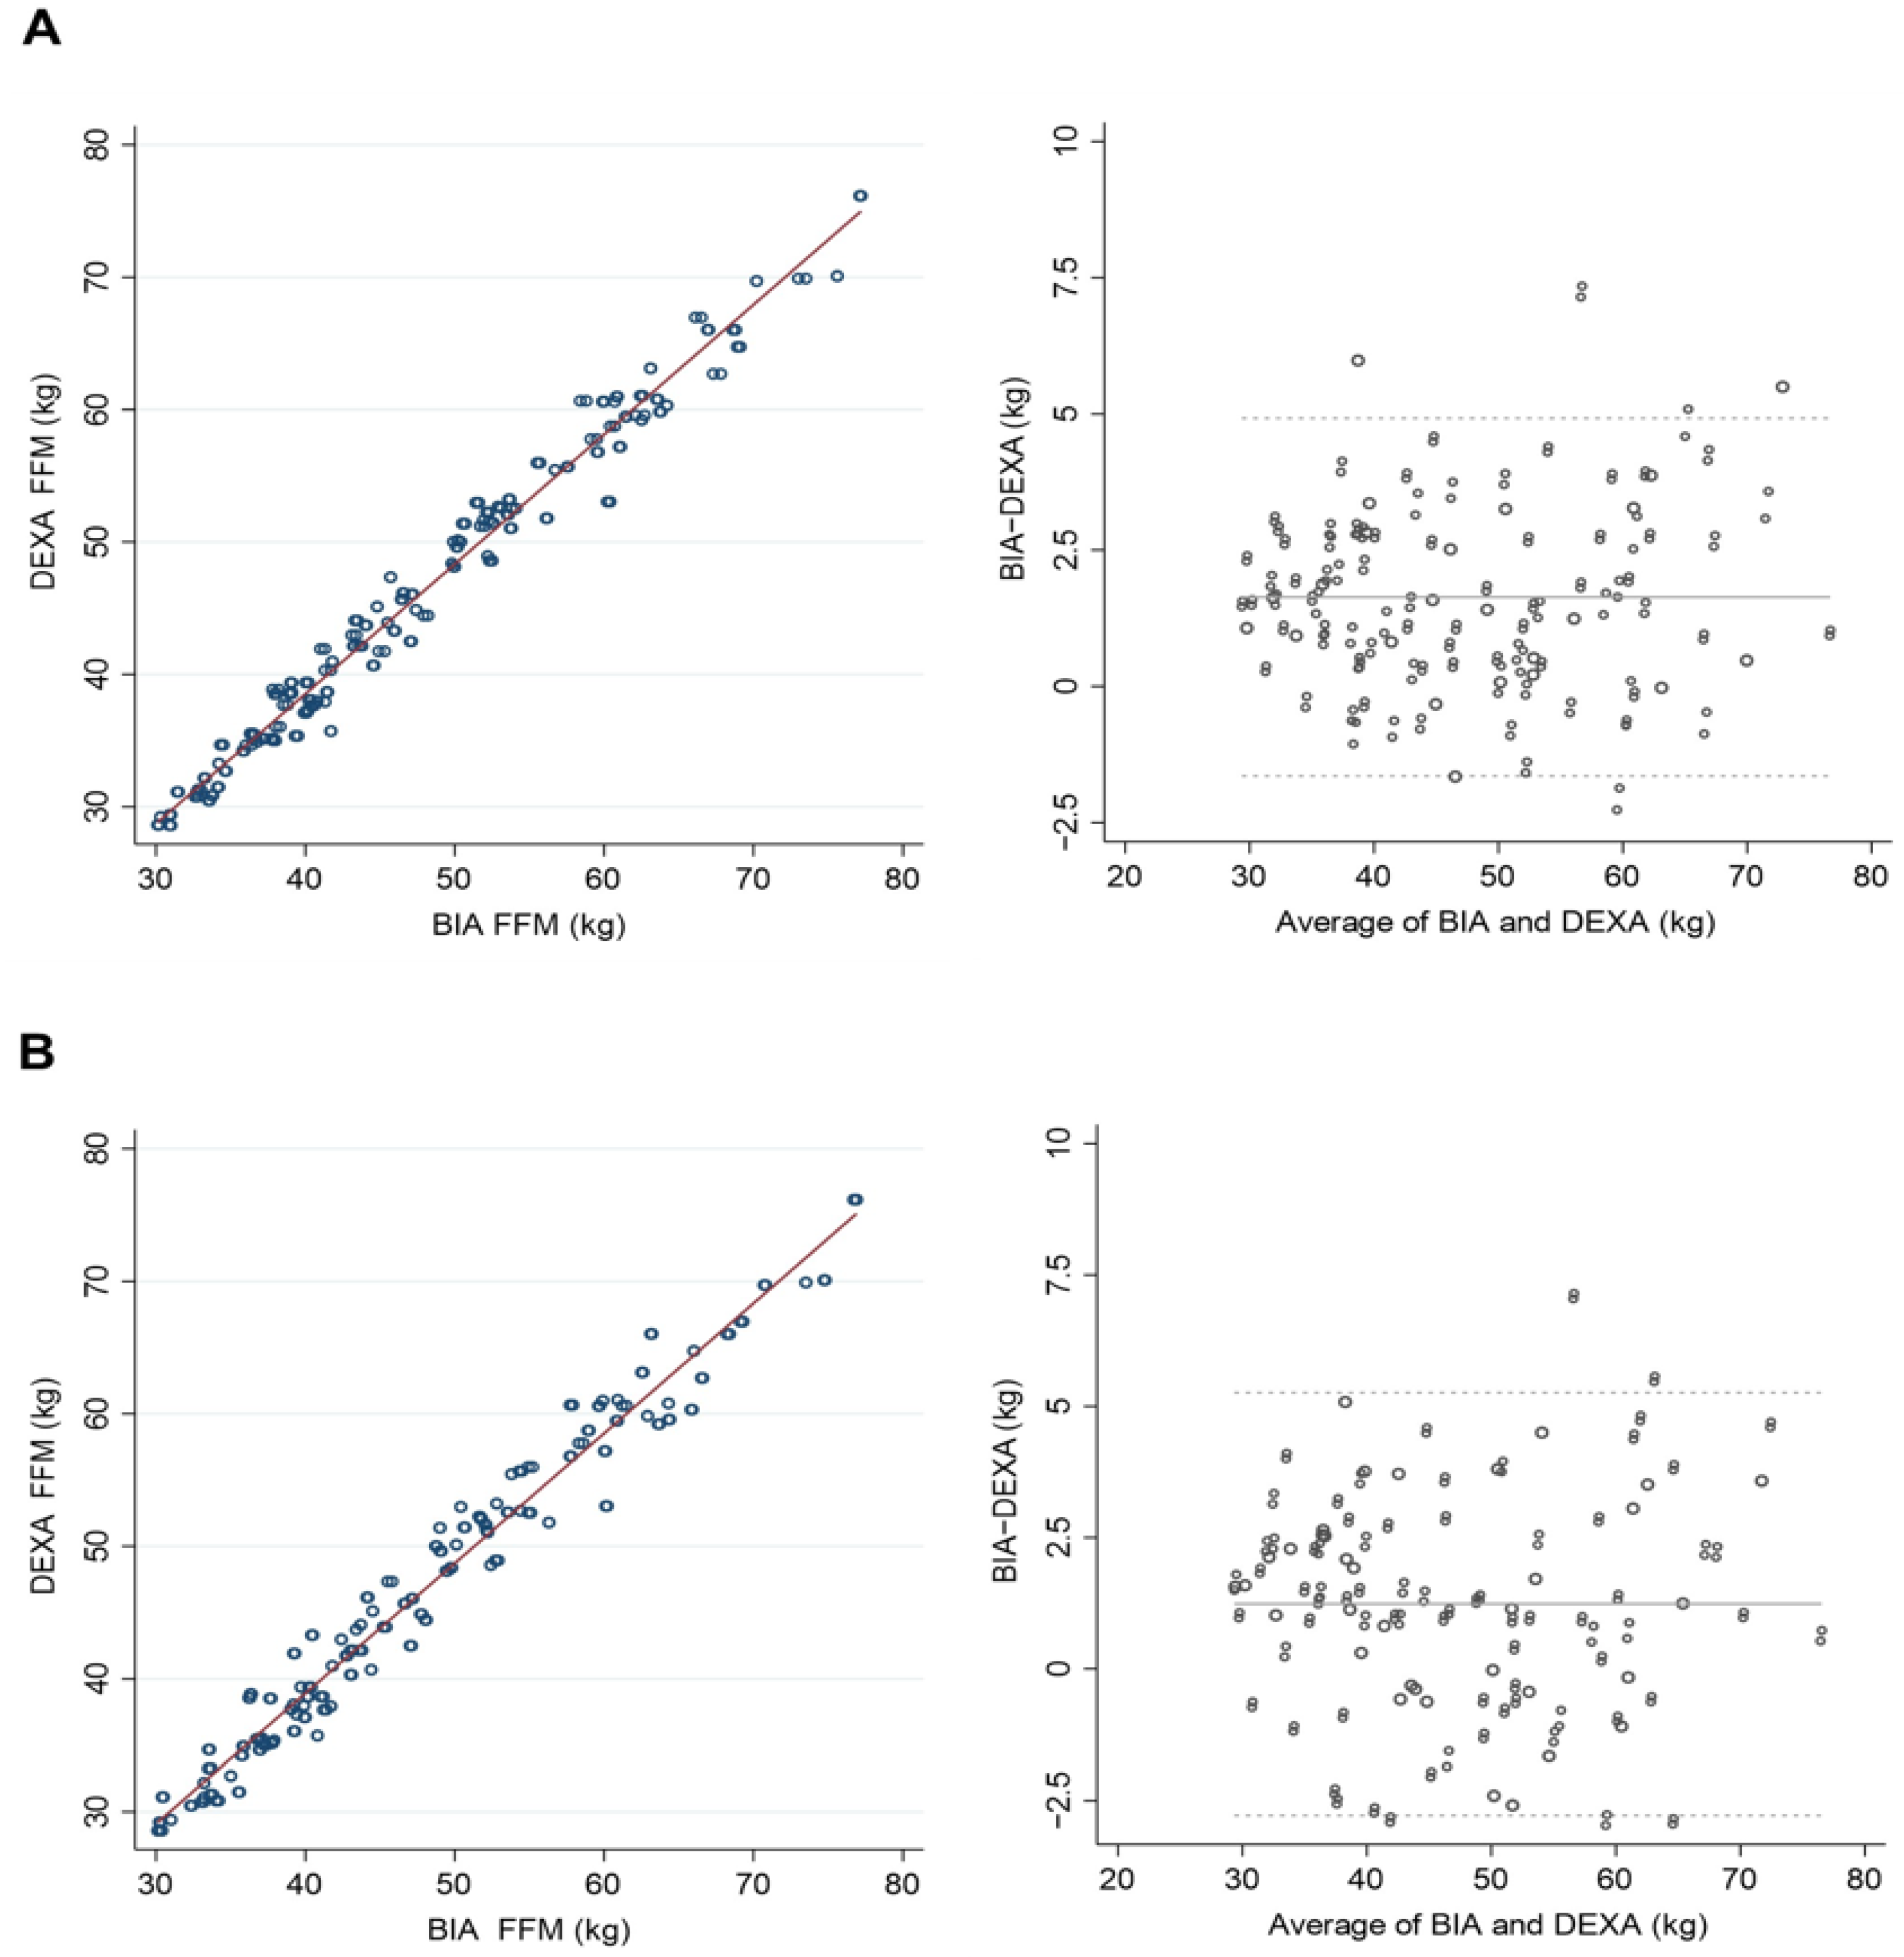
| FFM | |||||
| Overall | 46.5 ± 11.45 | 48.14 ± 11.56 | 47.75 ± 11.49 | 47.89 ± 11.47 | <0.01 |
| Male | 50.21 ± 11.21 | 51.93 ± 11.38 | 51.66 ± 11.36 | 51.84 ± 11.31 | <0.01 |
| Female | 42.74 ± 10.41 | 44.29 ± 10.40 | 43.76 ± 10.15 | 43.86 ± 10.13 | <0.01 |
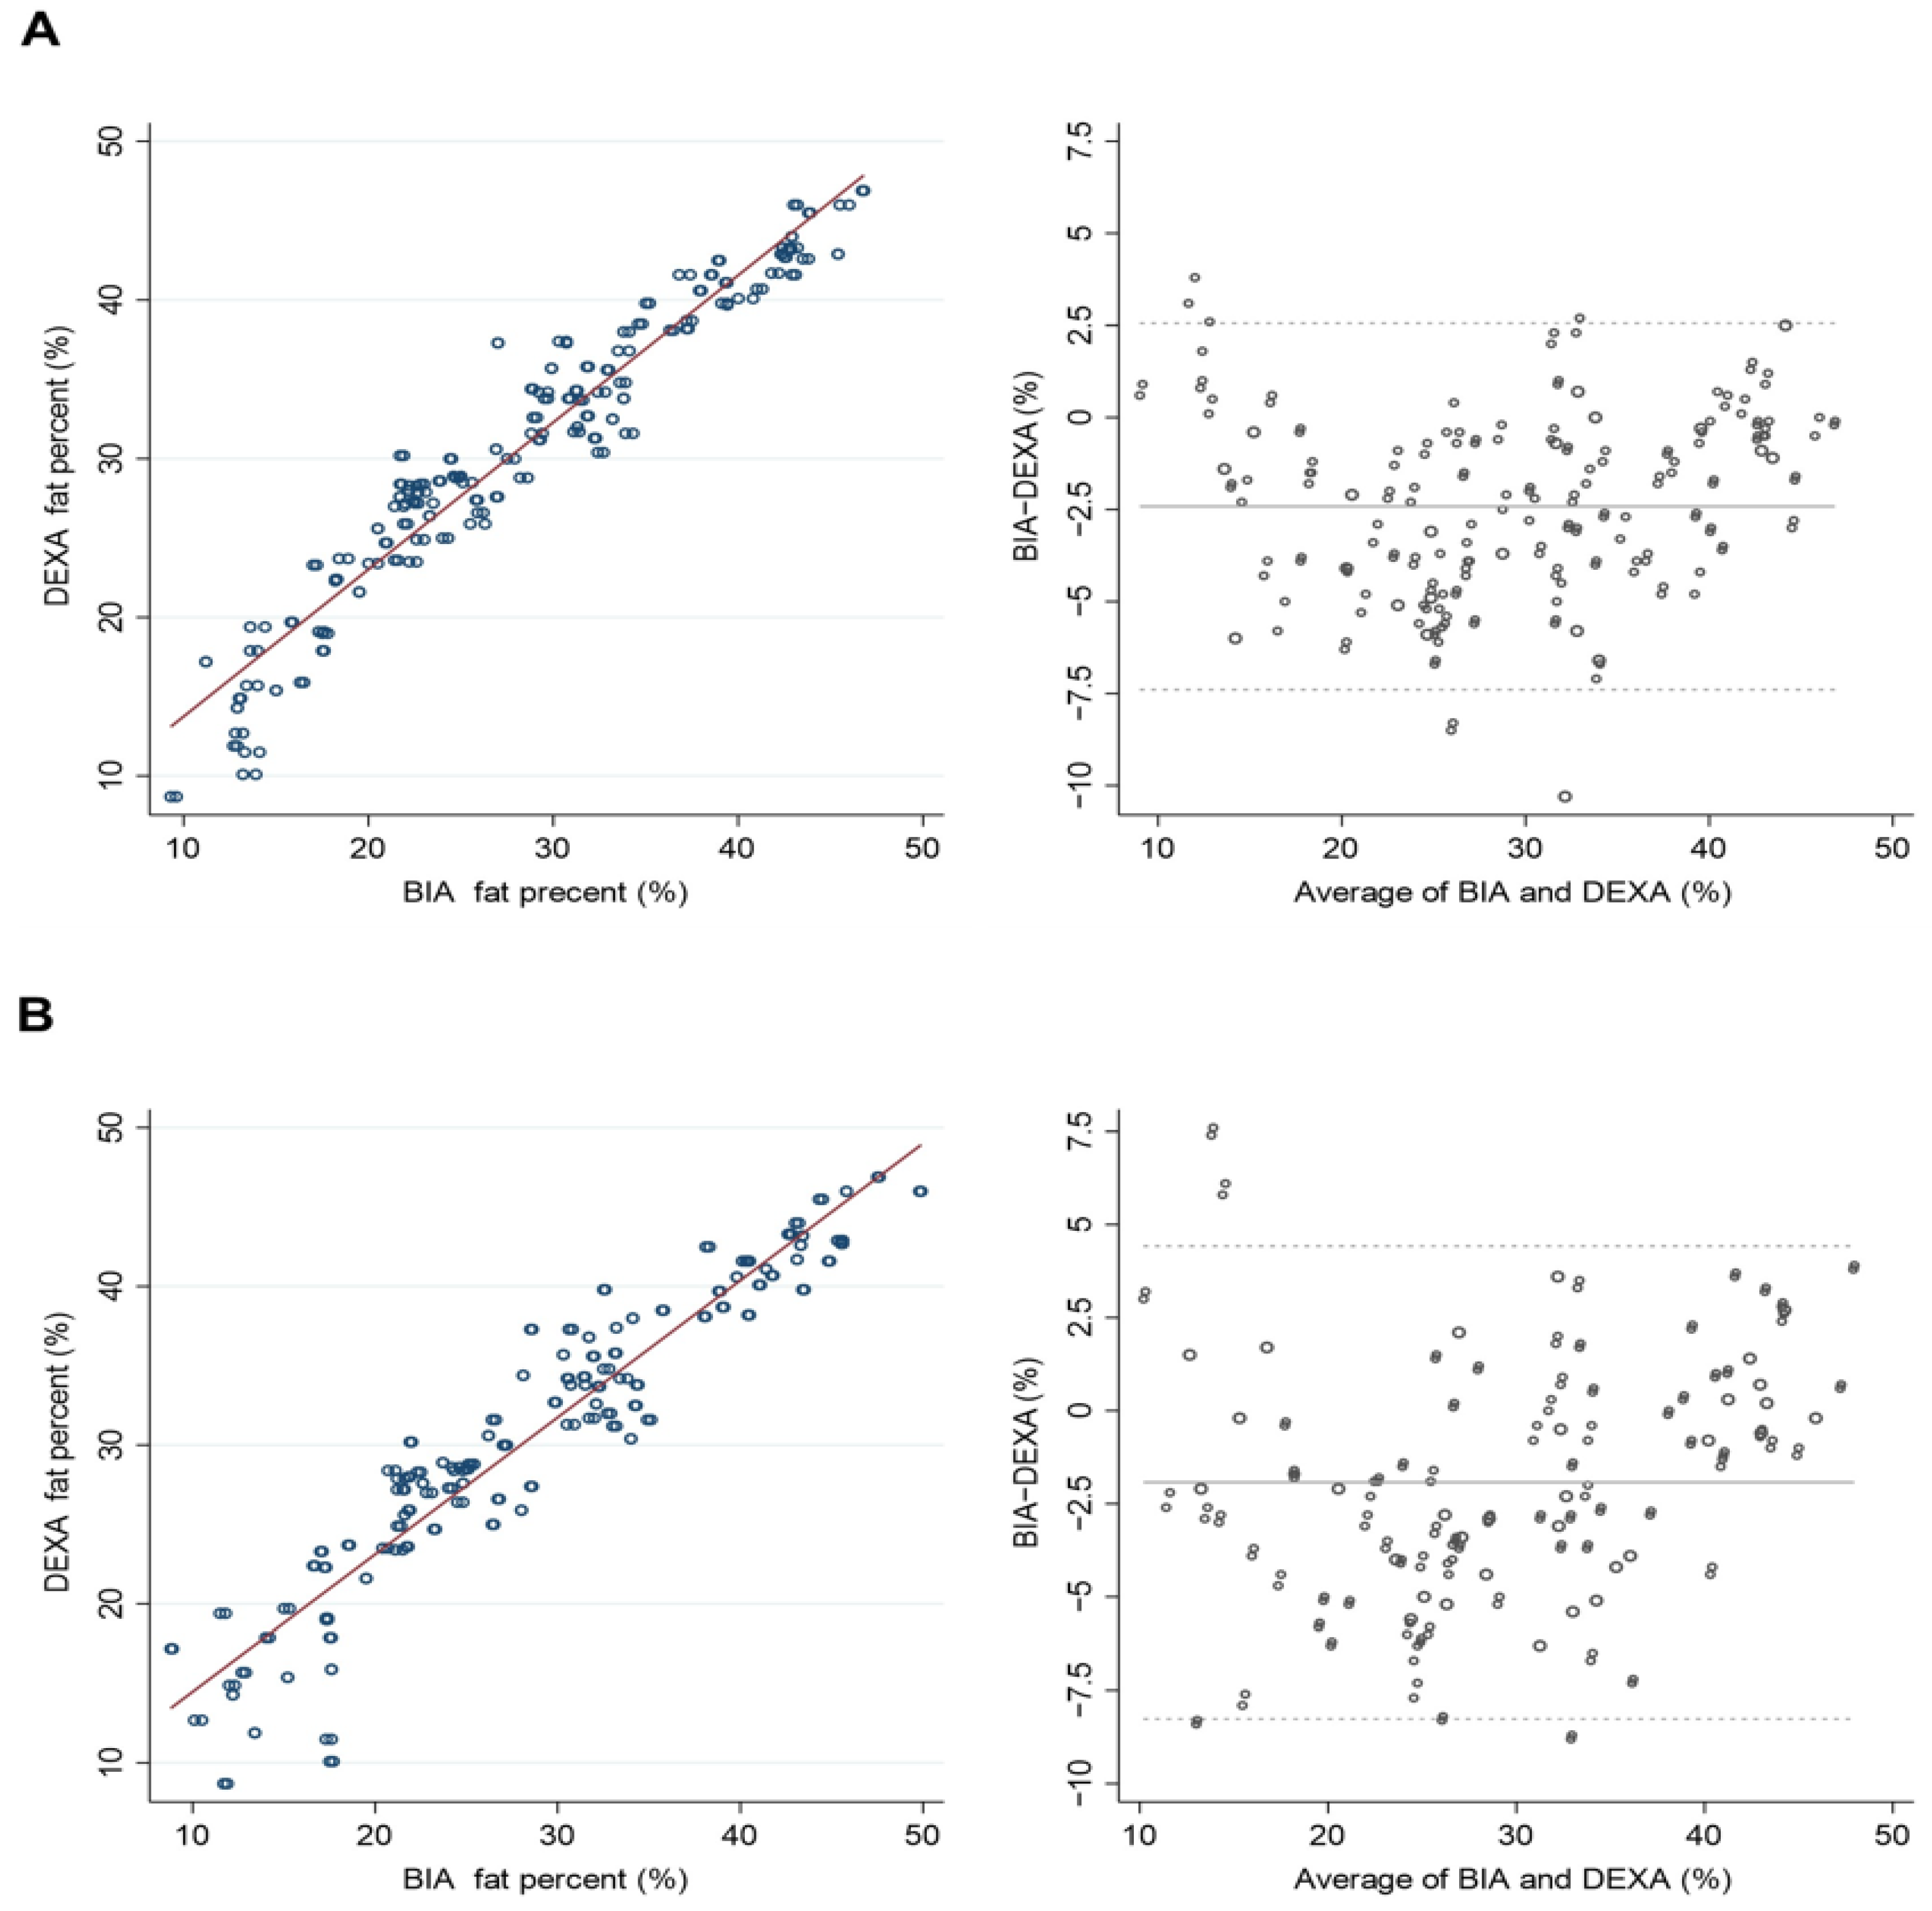
| PBF | |||||
| Overall | 30.63 ± 9.18 | 28.21 ± 9.54 | 28.71 ± 10.07 | 28.46 ± 10.26 | <0.01 |
| Male | 29.18 ± 8.92 | 26.76 ± 9.18 | 27.08 ± 9.58 | 26.78 ± 9.79 | <0.01 |
| Female | 32.11 ± 9.20 | 29.70 ± 9.67 | 30.37 ± 10.29 | 30.17 ± 10.44 | <0.01 |
| ALM | Fat-Free Mass | Percent Body Fat | |||||||
|---|---|---|---|---|---|---|---|---|---|
| β | R2 | RMSE (kg) | β | R2 | RMSE (kg) | β | R2 | RMSE (%) | |
| InBody 970 | |||||||||
| Overall | 0.971 | 0.943 | 1.567 | 0.989 | 0.979 | 1.663 | 0.964 | 0.929 | 2.448 |
| Male | 0.956 | 0.914 | 1.692 | 0.988 | 0.977 | 1.714 | 0.962 | 0.925 | 2.447 |
| Female | 0.960 | 0.923 | 1.139 | 0.988 | 0.976 | 1.621 | 0.964 | 0.929 | 2.465 |
| BWA (clamp) | |||||||||
| Overall | 0.971 | 0.944 | 1.523 | 0.984 | 0.968 | 2.045 | 0.947 | 0.897 | 2.937 |
| Male | 0.954 | 0.911 | 1.728 | 0.984 | 0.968 | 2.002 | 0.949 | 0.900 | 2.837 |
| Female | 0.965 | 0.931 | 1.075 | 0.980 | 0.961 | 2.080 | 0.944 | 0.891 | 3.049 |
| BWA (adhesive) | |||||||||
| Overall | 0.969 | 0.939 | 1.587 | 0.985 | 0.970 | 1.982 | 0.953 | 0.908 | 2.773 |
| Male | 0.952 | 0.906 | 1.769 | 0.985 | 0.971 | 1.929 | 0.955 | 0.912 | 2.655 |
| Female | 0.962 | 0.926 | 1.110 | 0.981 | 0.963 | 2.017 | 0.949 | 0.902 | 2.902 |
Publisher’s Note: MDPI stays neutral with regard to jurisdictional claims in published maps and institutional affiliations. |
© 2022 by the authors. Licensee MDPI, Basel, Switzerland. This article is an open access article distributed under the terms and conditions of the Creative Commons Attribution (CC BY) license (https://creativecommons.org/licenses/by/4.0/).
Share and Cite
Yi, Y.; Baek, J.Y.; Lee, E.; Jung, H.-W.; Jang, I.-Y. A Comparative Study of High-Frequency Bioelectrical Impedance Analysis and Dual-Energy X-ray Absorptiometry for Estimating Body Composition. Life 2022, 12, 994. https://doi.org/10.3390/life12070994
Yi Y, Baek JY, Lee E, Jung H-W, Jang I-Y. A Comparative Study of High-Frequency Bioelectrical Impedance Analysis and Dual-Energy X-ray Absorptiometry for Estimating Body Composition. Life. 2022; 12(7):994. https://doi.org/10.3390/life12070994
Chicago/Turabian StyleYi, Youngseok, Ji Yeon Baek, Eunju Lee, Hee-Won Jung, and Il-Young Jang. 2022. "A Comparative Study of High-Frequency Bioelectrical Impedance Analysis and Dual-Energy X-ray Absorptiometry for Estimating Body Composition" Life 12, no. 7: 994. https://doi.org/10.3390/life12070994
APA StyleYi, Y., Baek, J. Y., Lee, E., Jung, H.-W., & Jang, I.-Y. (2022). A Comparative Study of High-Frequency Bioelectrical Impedance Analysis and Dual-Energy X-ray Absorptiometry for Estimating Body Composition. Life, 12(7), 994. https://doi.org/10.3390/life12070994