
The Optimization of Dietary Protein Level and Carbon Sources on Biofloc Nutritive Values, Bacterial Abundance, and Growth Performances of Whiteleg Shrimp (Litopenaeus vannamei) Juveniles

 ,
, 
 ,
,  and
and
Abstract
:1. Introduction
2. Materials and Methods
2.1. Whiteleg Shrimp Juveniles
2.2. Experimental Design and Set-Up
2.3. Water Quality Analysis
2.4. Carbon Sources and Biofloc Analysis
2.5. Total Heterotrophic Bacteria
2.6. Growth Performance and Feed Utilization Parameters
2.7. Statistical Analysis
3. Results
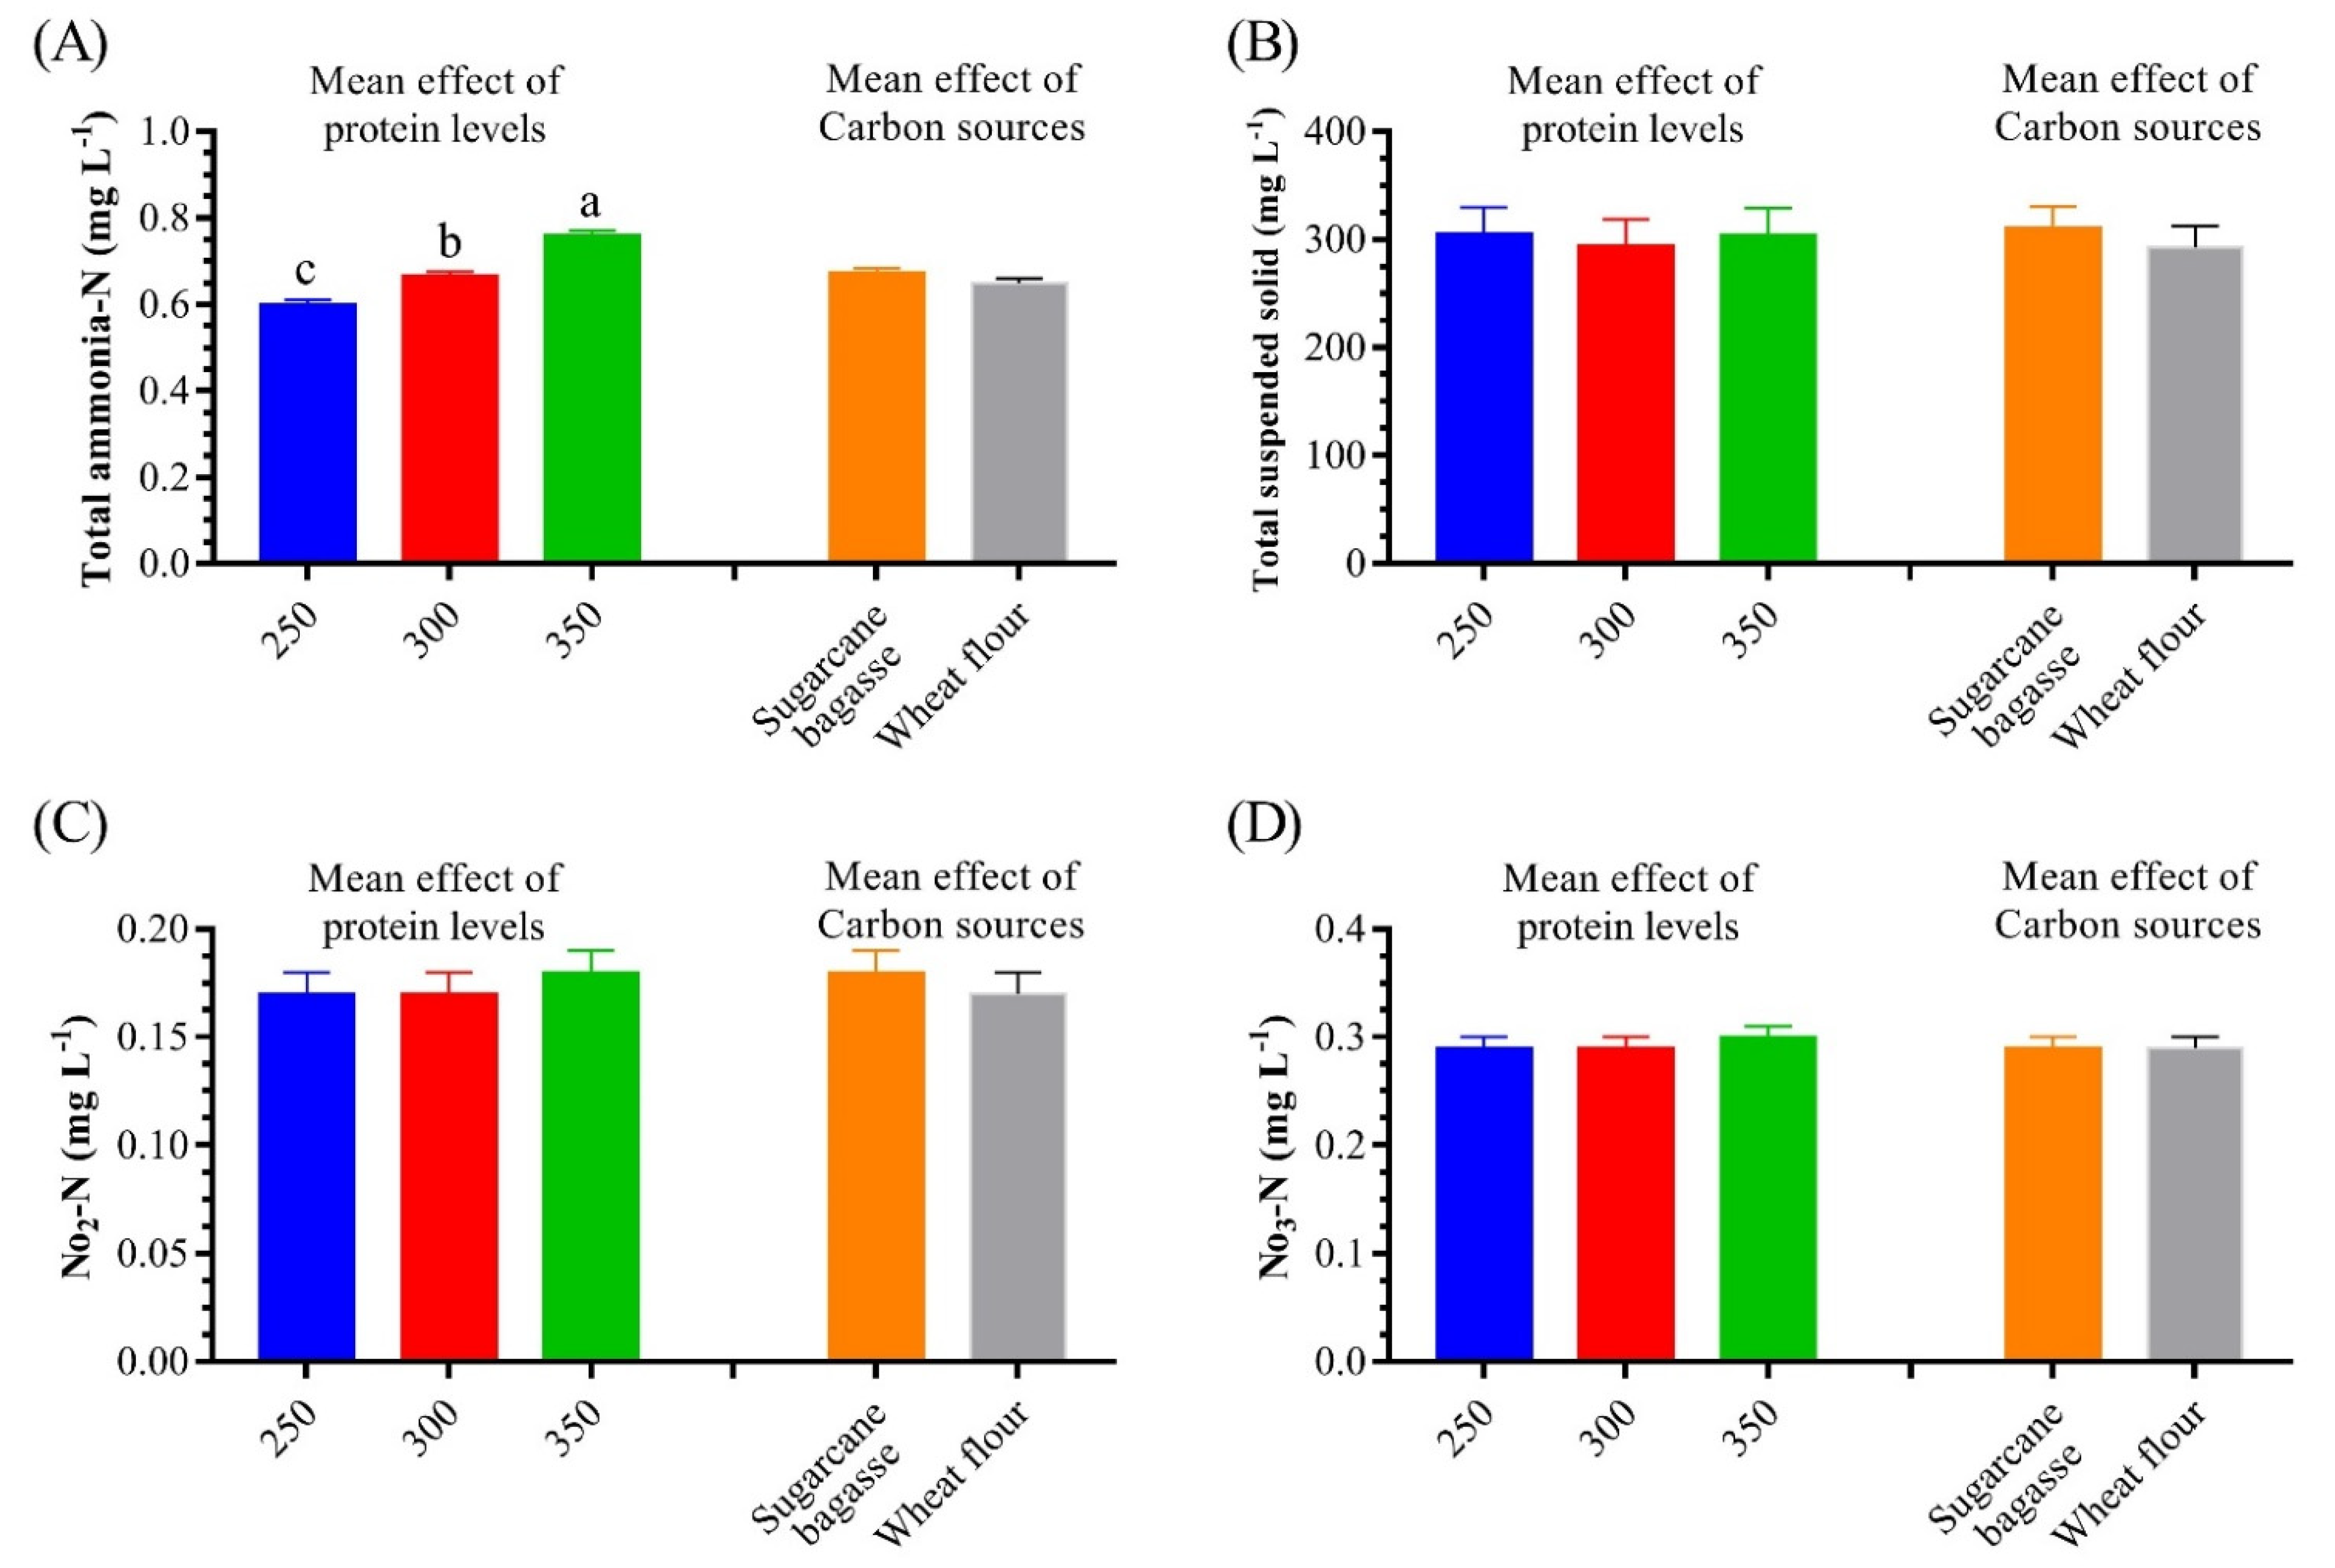
3.1. Water Quality
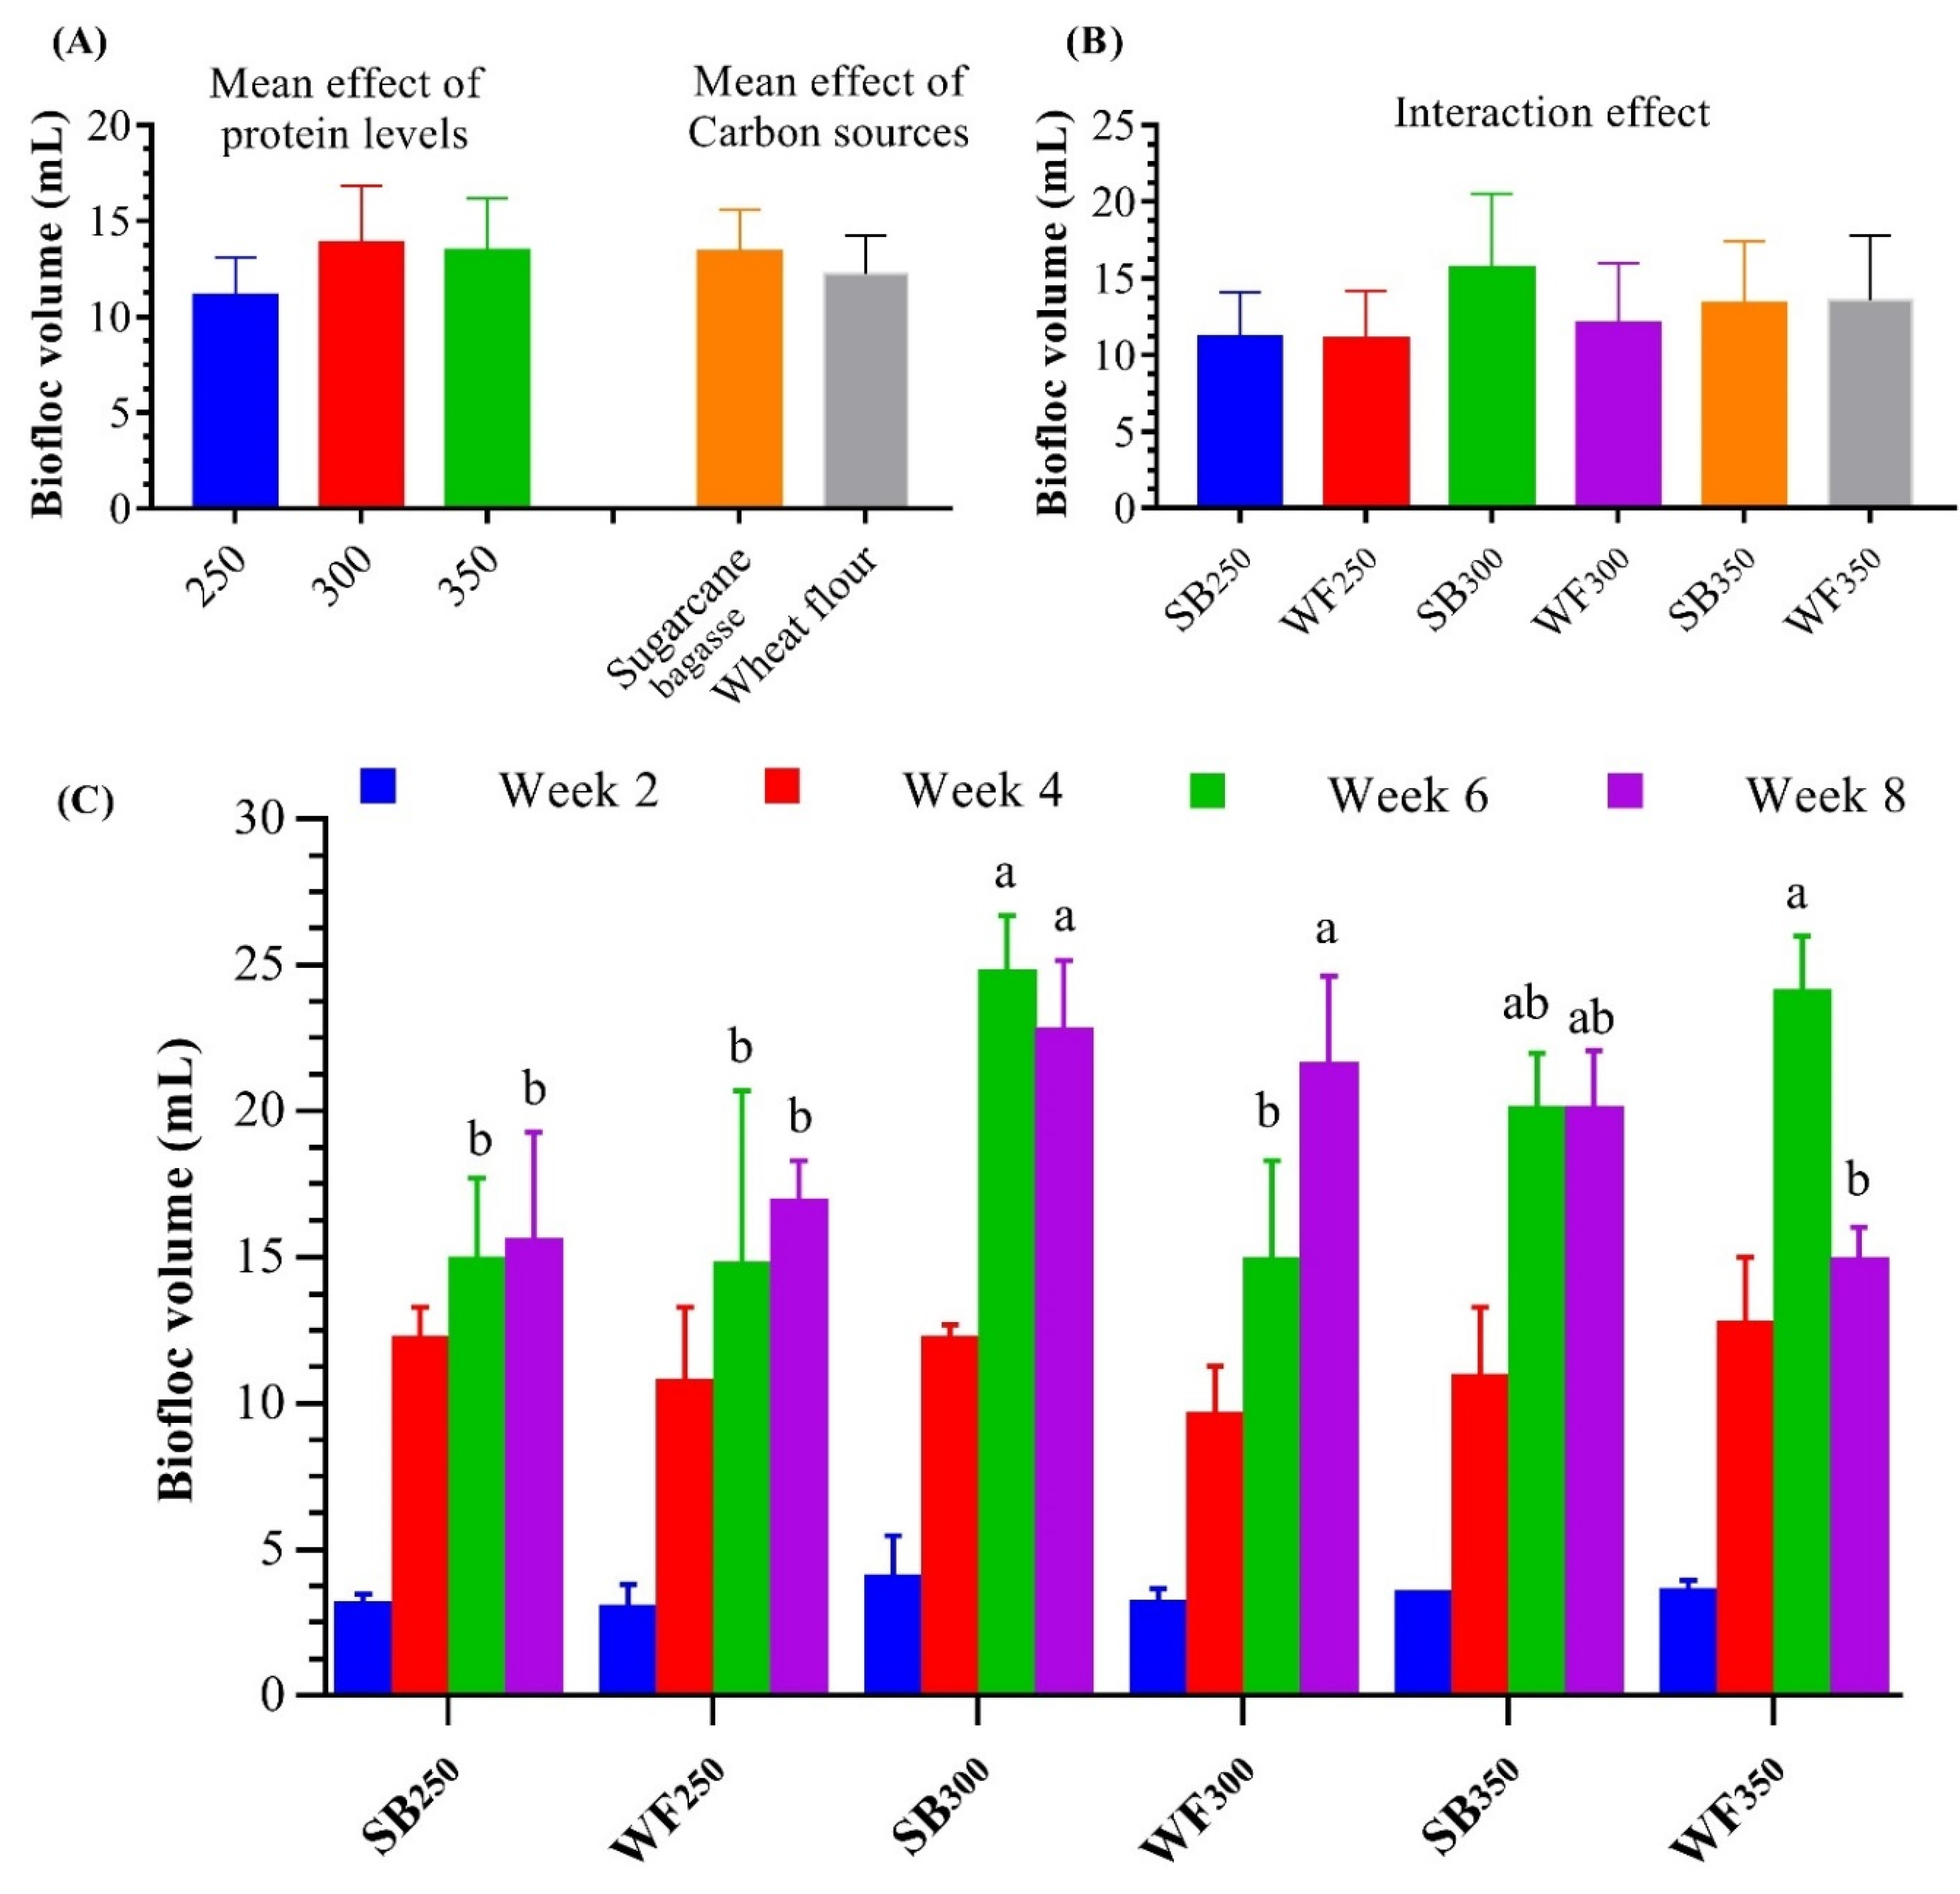
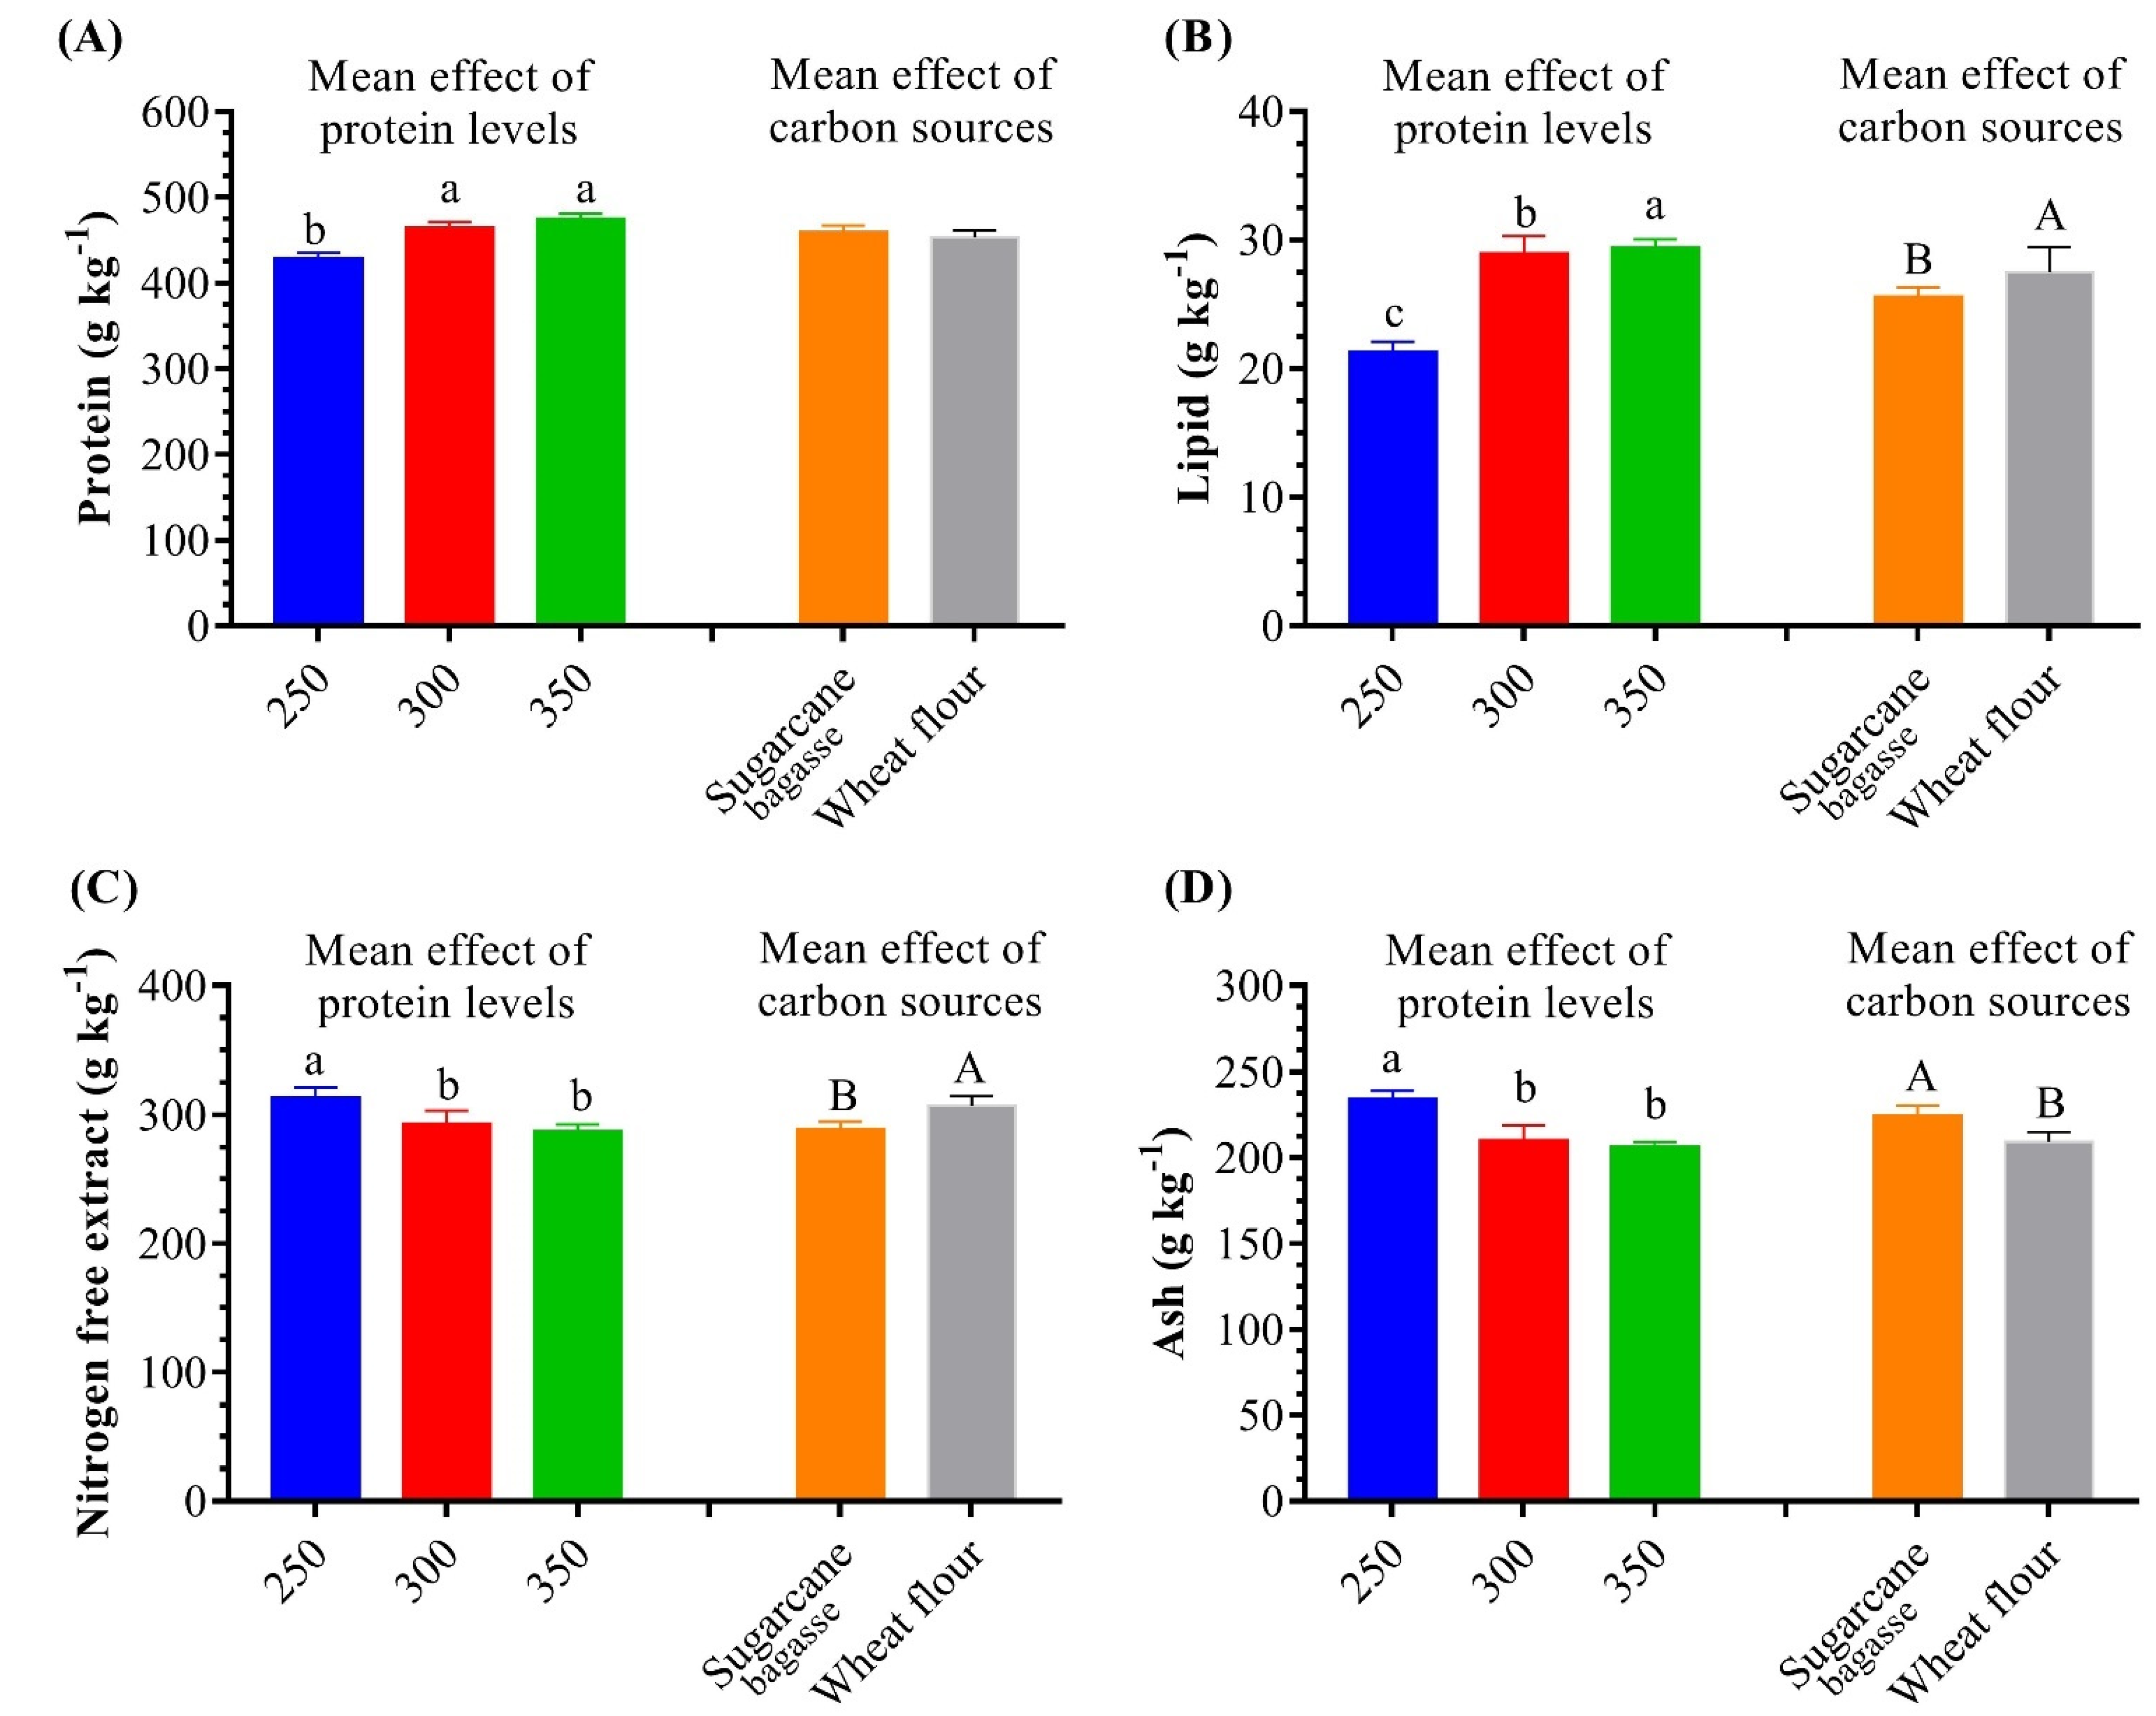
3.2. Biofloc Volume and Nutritional Values
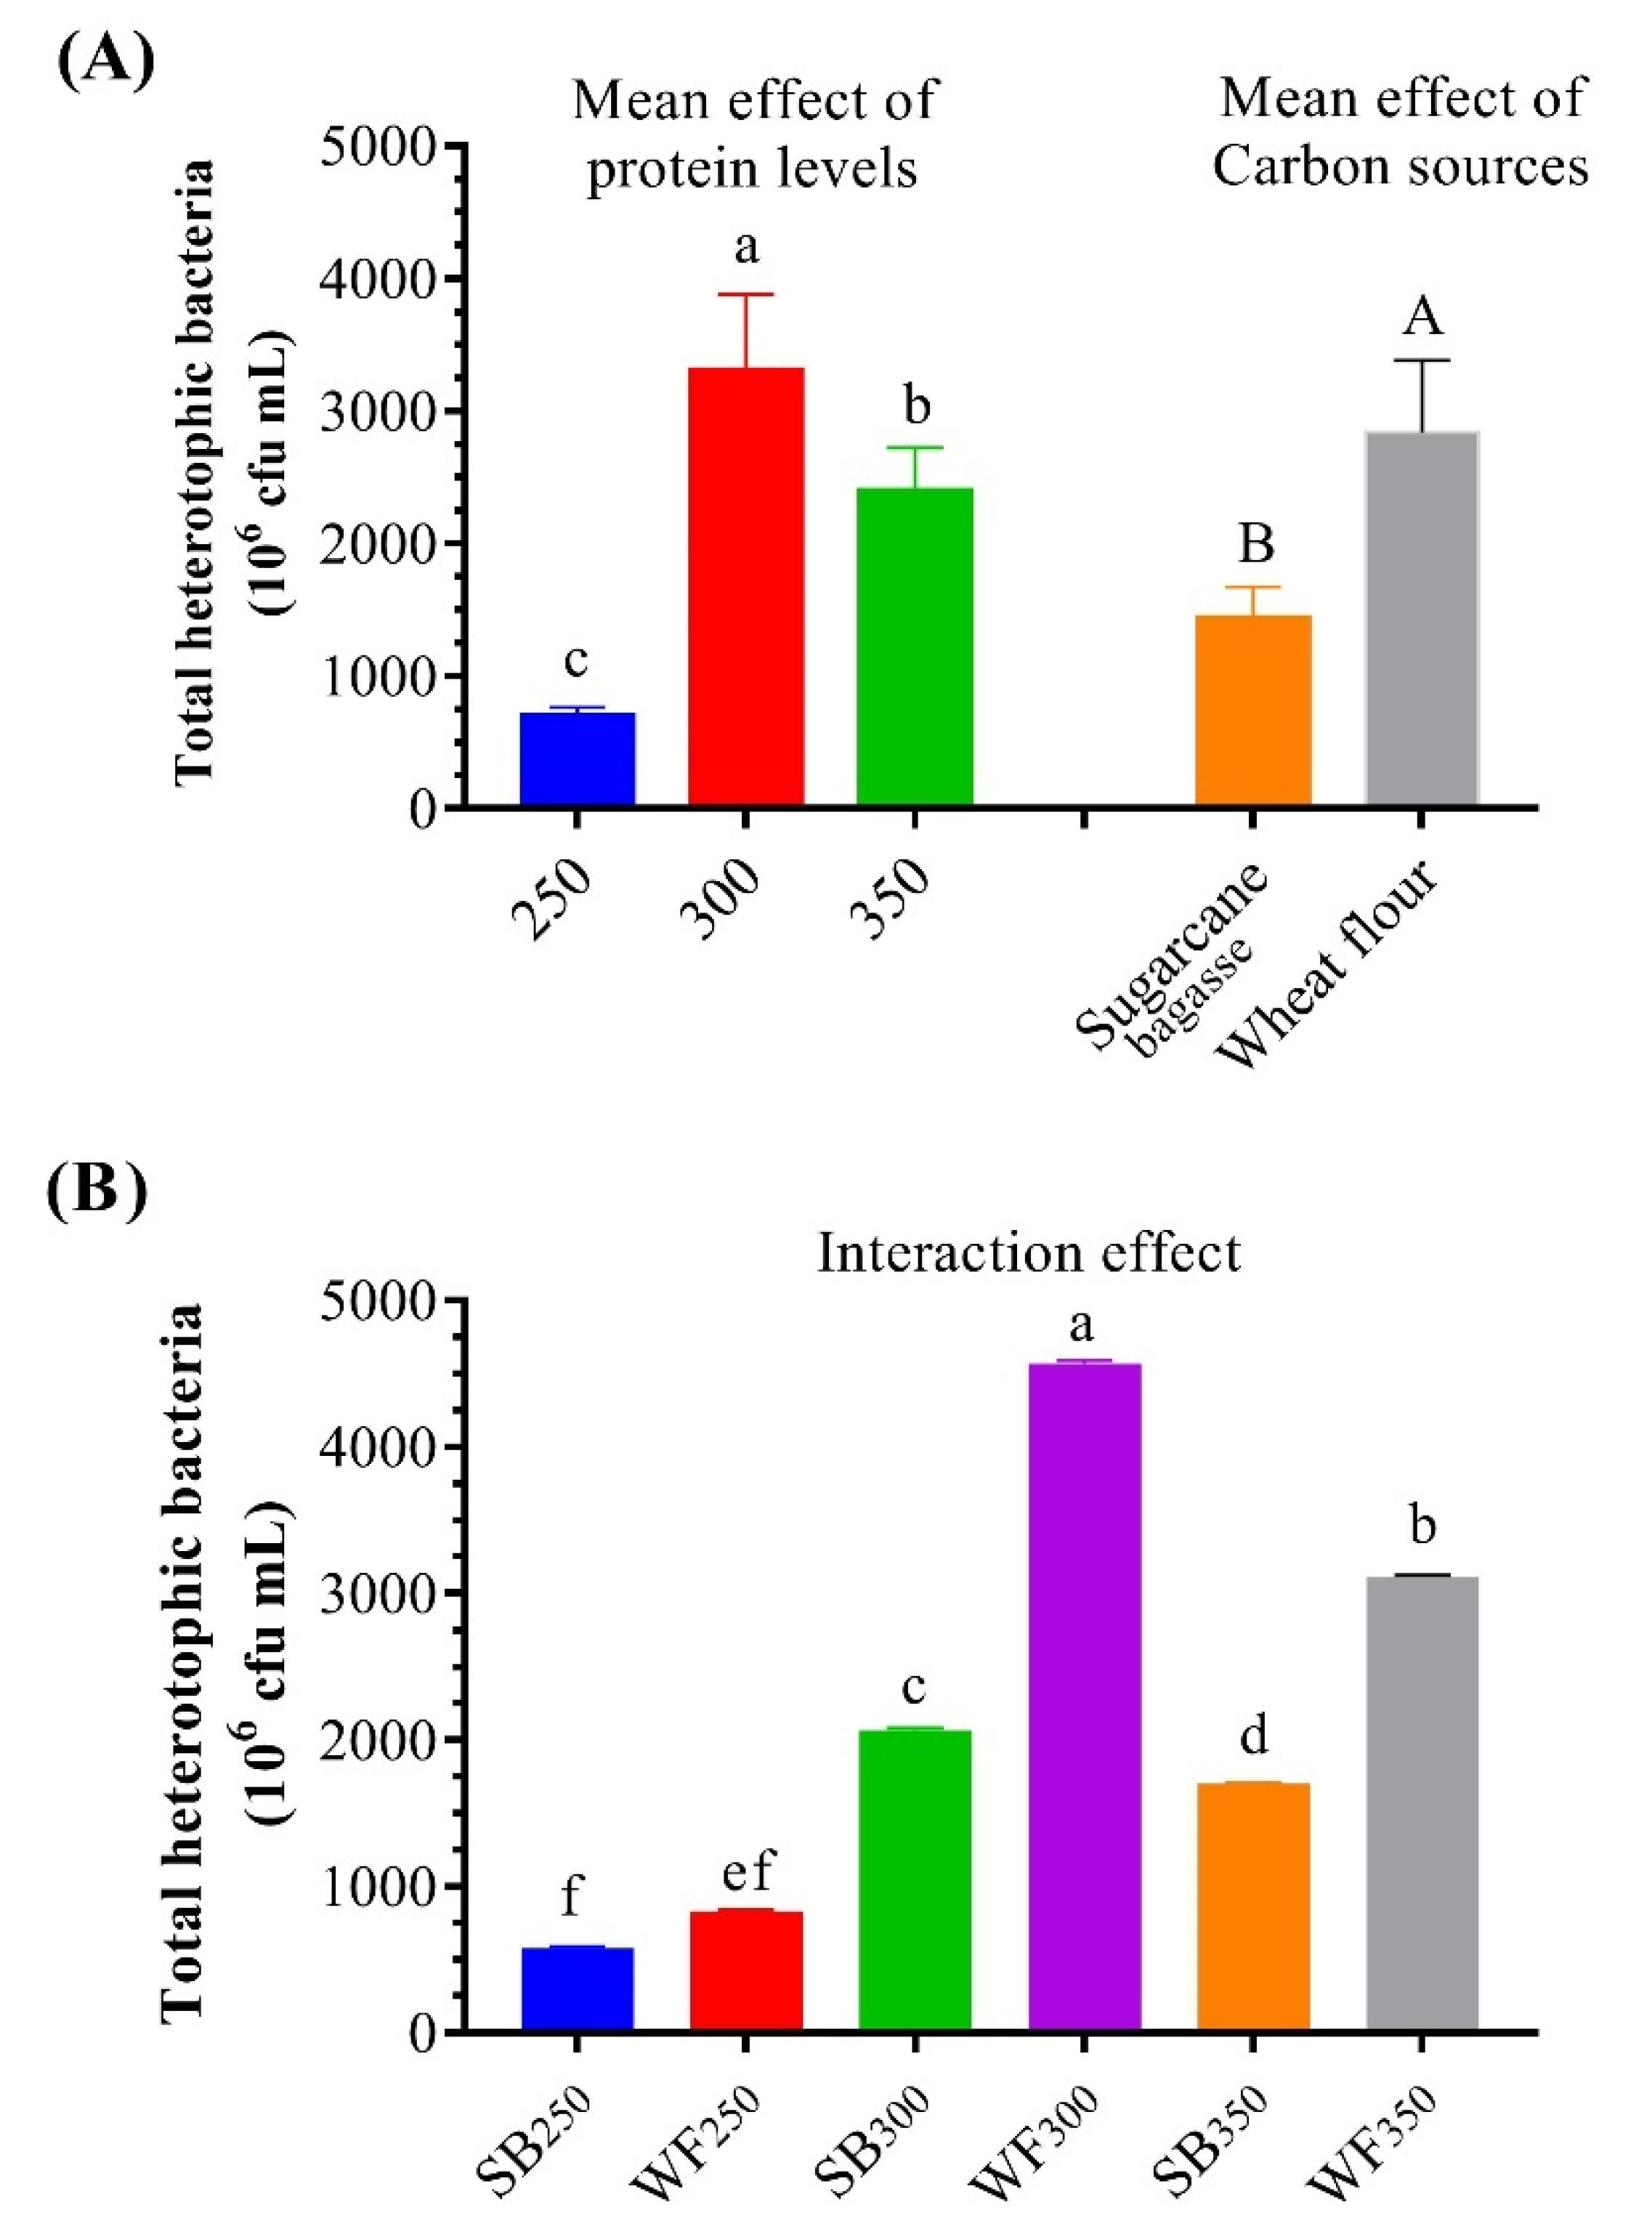
3.3. Microbial Community/Total Bacteria Count
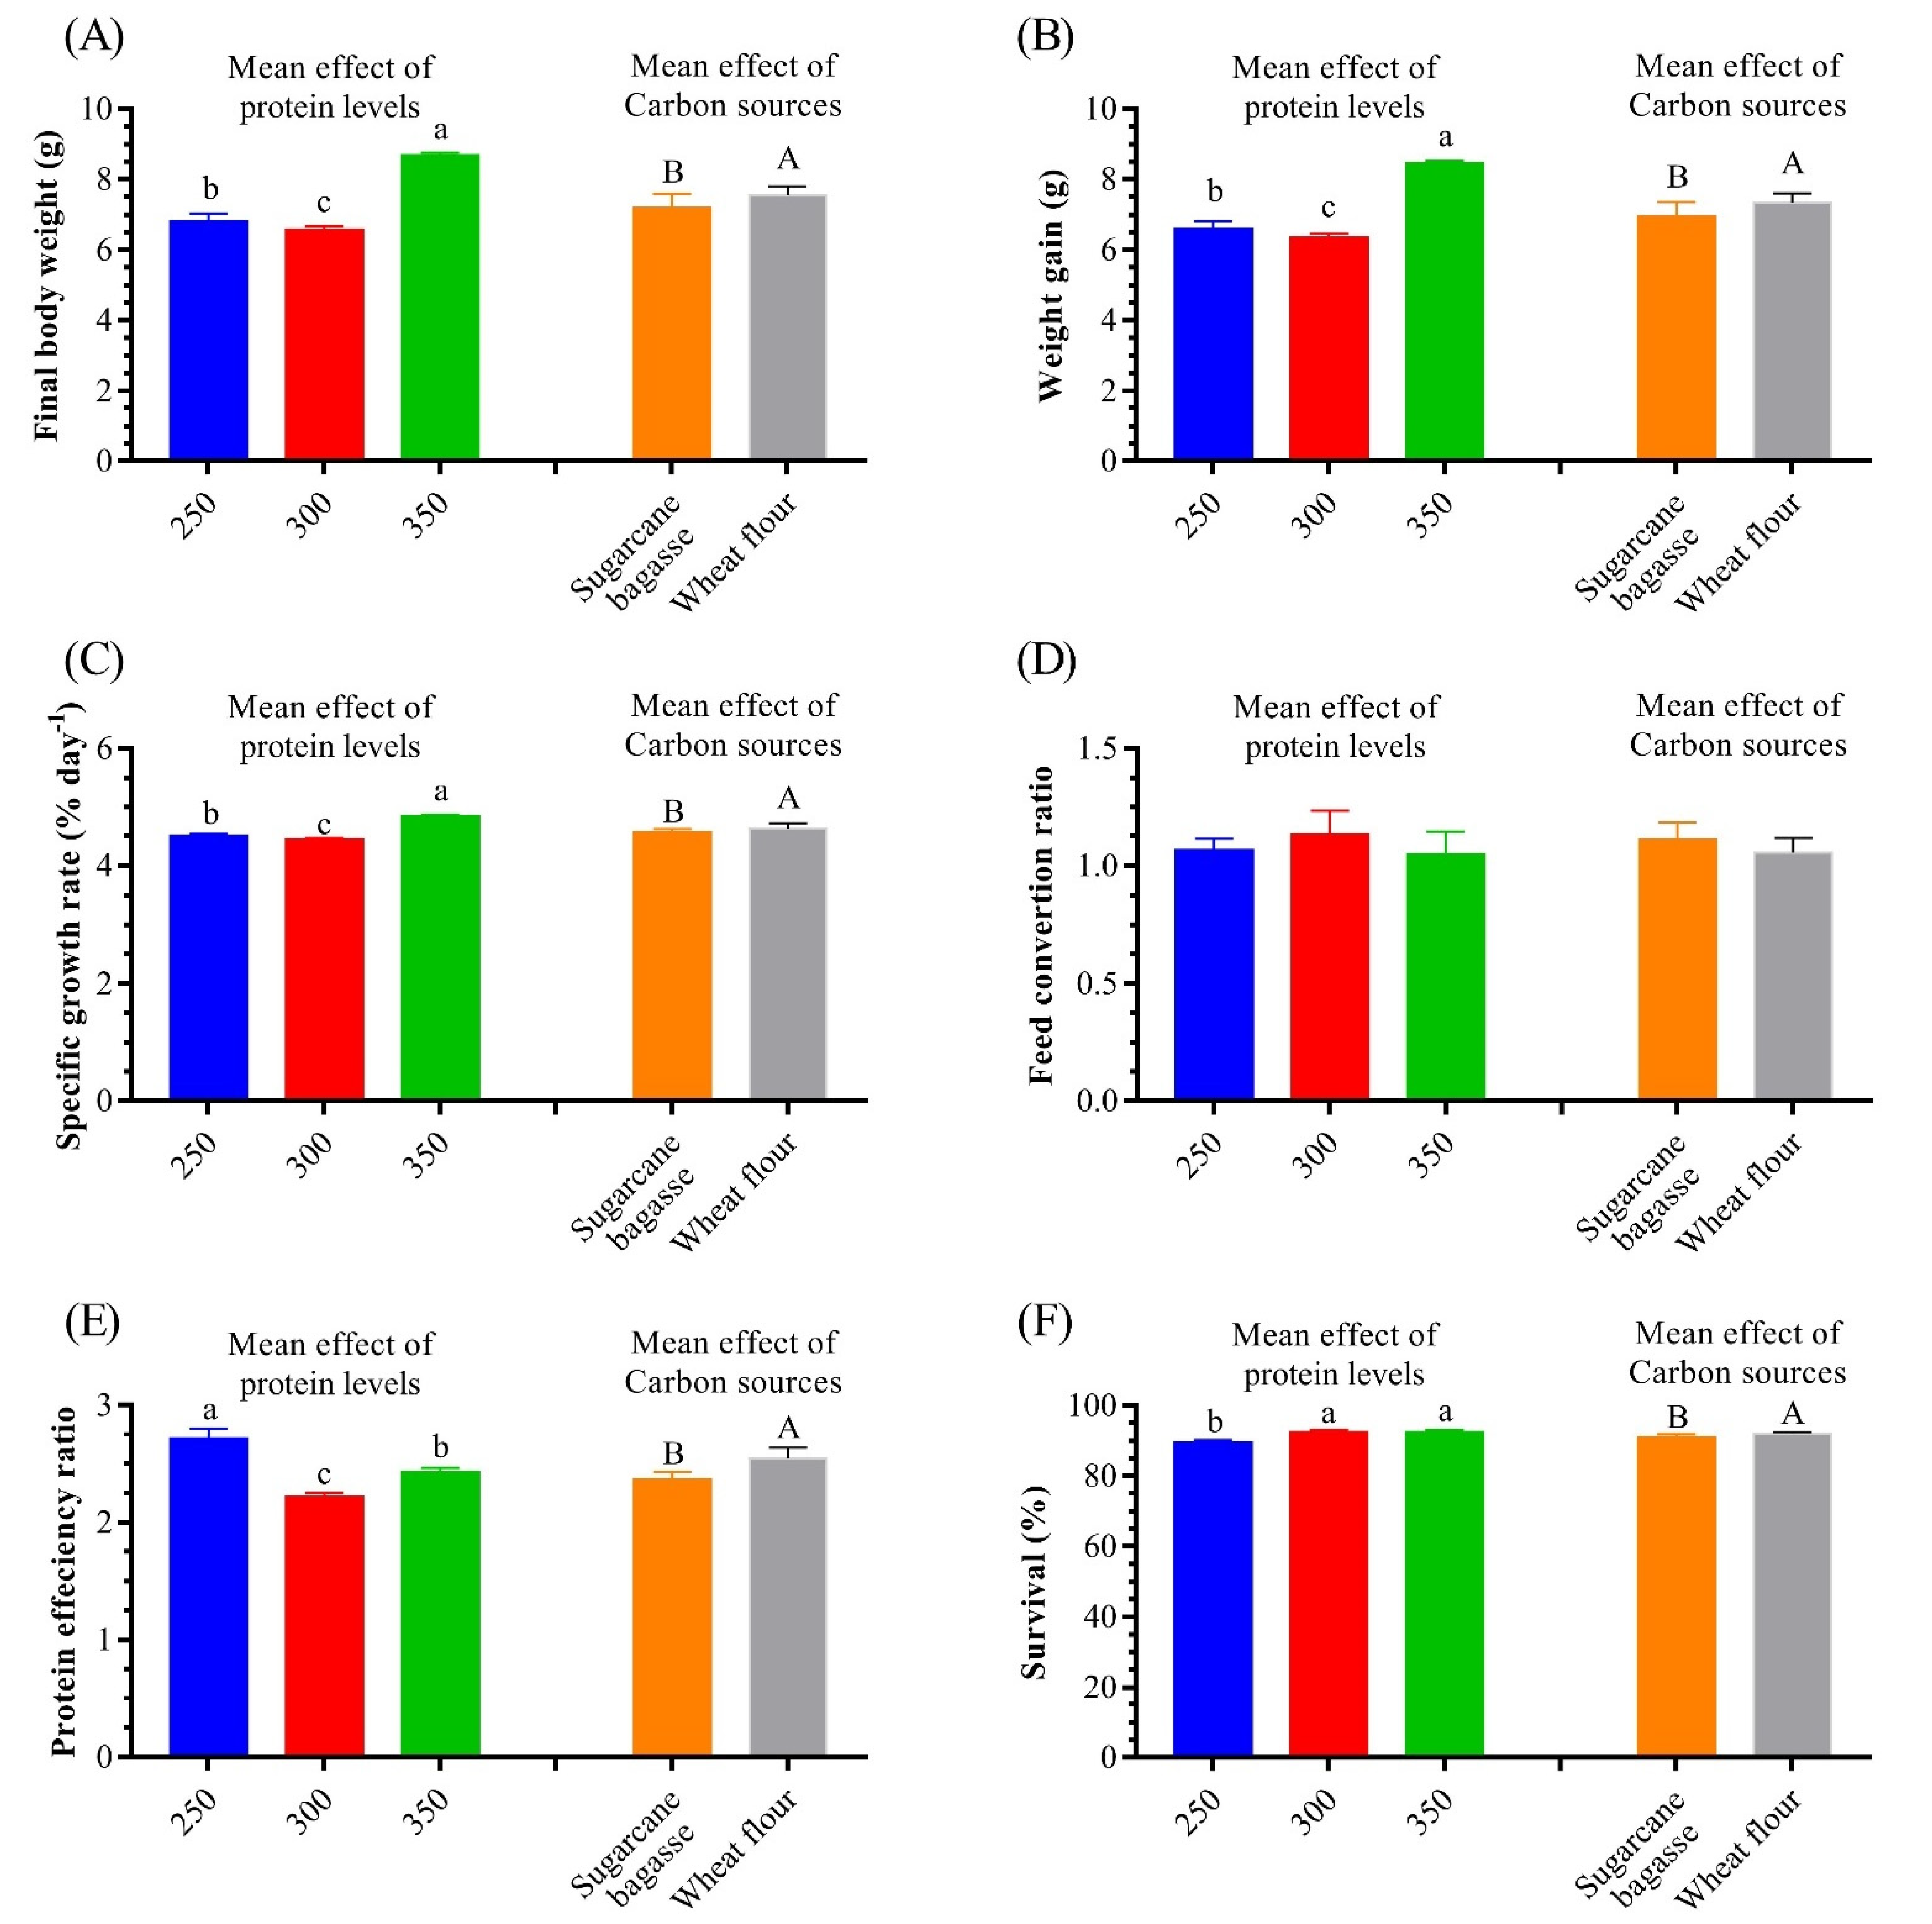
3.4. Growth Performance
4. Discussion
5. Conclusions
Author Contributions
Funding
Institutional Review Board Statement
Informed Consent Statement
Data Availability Statement
Acknowledgments
Conflicts of Interest
References
- Abbas, E.M.; Ali, F.S.; Desouky, M.G.; Ashour, M.; El-Shafei, A.; Maaty, M.M.; Sharawy, Z.Z. Novel Comprehensive Molecular and Ecological Study Introducing Coastal Mud Shrimp (Solenocera Crassicornis) Recorded at the Gulf of Suez, Egypt. J. Mar. Sci. Eng. 2020, 9, 9. [Google Scholar] [CrossRef]
- Mabrouk, M.M.; Ashour, M.; Labena, A.; Zaki, M.A.A.; Abdelhamid, A.F.; Gewaily, M.S.; Dawood, M.A.O.; Abualnaja, K.M.; Ayoub, H.F. Nanoparticles of Arthrospira platensis improves growth, antioxidative and immunological responses of Nile tilapia (Oreochromis niloticus) and its resistance to Aeromonas hydrophila. Aquac. Res. 2022, 53, 125–135. [Google Scholar] [CrossRef]
- Sharawy, Z.Z.; Ashour, M.; Abbas, E.; Ashry, O.; Helal, M.; Nazmi, H.; Kelany, M.; Kamel, A.; Hassaan, M.; Rossi, W.; et al. Effects of dietary marine microalgae, Tetraselmis suecica, on production, gene expression, protein markers and bacterial count of Pacific white shrimp Litopenaeus vannamei. Aquac. Res. 2020, 51, 2216–2228. [Google Scholar] [CrossRef]
- Sharawy, Z.Z.; Ashour, M.; Labena, A.; Alsaqufi, A.S.; Mansour, A.T.; Abbas, E.M. Effects of dietary Arthrospira platensis nanoparticles on growth performance, feed utilization, and growth-related gene expression of Pacific white shrimp, Litopenaeus vannamei. Aquaculture 2022, 551, 737905. [Google Scholar] [CrossRef]
- Ashour, M.; Mabrouk, M.M.; Abo-Taleb, H.A.; Sharawy, Z.Z.; Ayoub, H.F.; Van Doan, H.; Davies, S.J.; El-Haroun, E.; Goda, A.M.S.A. A liquid seaweed extract (TAM®) improves aqueous rearing environment, diversity of zooplankton community, whilst enhancing growth and immune response of Nile tilapia, Oreochromis niloticus, challenged by Aeromonas hydrophila. Aquaculture 2021, 543, 736915. [Google Scholar] [CrossRef]
- Mansour, A.T.; Ashour, M.; Alprol, A.E.; Alsaqufi, A.S. Aquatic plants and aquatic animals in the context of sustainability: Cultivation techniques, integration, and blue revolution. Sustainability 2022, 14, 3257. [Google Scholar] [CrossRef]
- De Schryver, P.; Crab, R.; Defoirdt, T.; Boon, N.; Verstraete, W. The basics of bio-flocs technology: The added value for aquaculture. Aquaculture 2008, 277, 125–137. [Google Scholar] [CrossRef]
- Stokstad, E. Down on the Shrimp Farm; American Association for the Advancement of Science: Washington, DC, USA, 2010. [Google Scholar]
- Avnimelech, Y. Biofloc Technology: A Practical Guide Book; World Aquaculture Society: Baton Rouge, LA, USA, 2009. [Google Scholar]
- Crab, R.; Defoirdt, T.; Bossier, P.; Verstraete, W. Biofloc technology in aquaculture: Beneficial effects and future challenges. Aquaculture 2012, 356, 351–356. [Google Scholar] [CrossRef]
- Xu, W.-J.; Pan, L.-Q. Enhancement of immune response and antioxidant status of Litopenaeus vannamei juvenile in biofloc-based culture tanks manipulating high C/N ratio of feed input. Aquaculture 2013, 412, 117–124. [Google Scholar] [CrossRef]
- Burford, M.A.; Thompson, P.J.; McIntosh, R.P.; Bauman, R.H.; Pearson, D.C. The contribution of flocculated material to shrimp (Litopenaeus vannamei) nutrition in a high-intensity, zero-exchange system. Aquaculture 2004, 232, 525–537. [Google Scholar] [CrossRef] [Green Version]
- Xu, W.-J.; Pan, L.-Q. Effects of bioflocs on growth performance, digestive enzyme activity and body composition of juvenile Litopenaeus vannamei in zero-water exchange tanks manipulating C/N ratio in feed. Aquaculture 2012, 356, 147–152. [Google Scholar] [CrossRef]
- Yun, H.; Shahkar, E.; Katya, K.; Jang, I.K.; Kim, S.K.; Bai, S.C. Effects of bioflocs on dietary protein requirement in juvenile whiteleg shrimp, Litopenaeus vannamei. Aquac. Res. 2016, 47, 3203–3214. [Google Scholar] [CrossRef]
- Sharawy, Z.Z.; Abbas, E.M.; Abdelkhalek, N.K.; Ashry, O.A.; Abd El-Fattah, L.S.; El-Sawy, M.A.; Helal, M.F.; El-Haroun, E. Effect of organic carbon source and stocking densities on growth indices, water microflora, and immune-related genes expression of Litopenaeus vannamei Larvae in intensive culture. Aquaculture 2022, 546, 737397. [Google Scholar] [CrossRef]
- Arnold, S.J.; Coman, F.E.; Jackson, C.J.; Groves, S.A. High-intensity, zero water-exchange production of juvenile tiger shrimp, Penaeus monodon: An evaluation of artificial substrates and stocking density. Aquaculture 2009, 293, 42–48. [Google Scholar] [CrossRef]
- Emerenciano, M.; Ballester, E.L.; Cavalli, R.O.; Wasielesky, W. Biofloc technology application as a food source in a limited water exchange nursery system for pink shrimp Farfantepenaeus brasiliensis (Latreille, 1817). Aquac. Res. 2012, 43, 447–457. [Google Scholar] [CrossRef]
- Wasielesky Jr, W.; Atwood, H.; Stokes, A.; Browdy, C.L. Effect of natural production in a zero exchange suspended microbial floc based super-intensive culture system for white shrimp Litopenaeus vannamei. Aquaculture 2006, 258, 396–403. [Google Scholar] [CrossRef]
- Ju, Z.Y.; Forster, I.; Conquest, L.; Dominy, W.; Kuo, W.C.; David Horgen, F. Determination of microbial community structures of shrimp floc cultures by biomarkers and analysis of floc amino acid profiles. Aquac. Res. 2008, 39, 118–133. [Google Scholar] [CrossRef]
- Ekasari, J.; Crab, R.; Verstraete, W. Primary nutritional content of bio-flocs cultured with different organic carbon sources and salinity. Hayati J. Biosci. 2010, 17, 125–130. [Google Scholar] [CrossRef] [Green Version]
- Lara, G.; Krummenauer, D.; Abreu, P.C.; Poersch, L.H.; Wasielesky, W. The use of different aerators on Litopenaeus vannamei biofloc culture system: Effects on water quality, shrimp growth and biofloc composition. Aquac. Int. 2017, 25, 147–162. [Google Scholar] [CrossRef]
- Crab, R.; Chielens, B.; Wille, M.; Bossier, P.; Verstraete, W. The effect of different carbon sources on the nutritional value of bioflocs, a feed for Macrobrachium rosenbergii postlarvae. Aquac. Res. 2010, 41, 559–567. [Google Scholar] [CrossRef]
- Xu, W.J.; Pan, L.Q. Dietary protein level and C/N ratio manipulation in zero-exchange culture of Litopenaeus vannamei: Evaluation of inorganic nitrogen control, biofloc composition and shrimp performance. Aquac. Res. 2014, 45, 1842–1851. [Google Scholar]
- Kim, S.K.; Pang, Z.; Seo, H.C.; Cho, Y.R.; Samocha, T.; Jang, I.K. Effect of bioflocs on growth and immune activity of Pacific white shrimp, Litopenaeus vannamei postlarvae. Aquac. Res. 2014, 45, 362–371. [Google Scholar] [CrossRef]
- Haslun, J.A.; Correia, E.; Strychar, K.; Morris, T.; Samocha, T. Characterization of bioflocs in a no water exchange super-intensive system for the production of food size pacific white shrimp Litopenaeus vannamei. Int. J. Aquac. 2012, 2, 29–38. [Google Scholar]
- Zhao, P.; Huang, J.; Wang, X.-H.; Song, X.-L.; Yang, C.-H.; Zhang, X.-G.; Wang, G.-C. The application of bioflocs technology in high-intensive, zero exchange farming systems of Marsupenaeus japonicus. Aquaculture 2012, 354, 97–106. [Google Scholar] [CrossRef]
- Luo, G.; Gao, Q.; Wang, C.; Liu, W.; Sun, D.; Li, L.; Tan, H. Growth, digestive activity, welfare, and partial cost-effectiveness of genetically improved farmed tilapia (Oreochromis niloticus) cultured in a recirculating aquaculture system and an indoor biofloc system. Aquaculture 2014, 422, 1–7. [Google Scholar] [CrossRef]
- Liu, L.; Hu, Z.; Dai, X.; Avnimelech, Y. Effects of addition of maize starch on the yield, water quality and formation of bioflocs in an integrated shrimp culture system. Aquaculture 2014, 418, 79–86. [Google Scholar] [CrossRef]
- Browdy, C.L.; Ray, A.J.; Leffler, J.W.; Avnimelech, Y. Biofloc-Based Aquaculture Systems; Wiley-Blackwell: New Delhi, India, 2012. [Google Scholar]
- El-Sayed, A.F.M. Use of biofloc technology in shrimp aquaculture: A comprehensive review, with emphasis on the last decade. Rev. Aquac. 2021, 13, 676–705. [Google Scholar] [CrossRef]
- Panigrahi, A.; Sundaram, M.; Saranya, C.; Swain, S.; Dash, R.; Dayal, J.S. Carbohydrate sources deferentially influence growth performances, microbial dynamics and immunomodulation in Pacific white shrimp (Litopenaeus vannamei) under biofloc system. Fish Shellfish Immunol. 2019, 86, 1207–1216. [Google Scholar] [CrossRef]
- Abakari, G.; Luo, G.; Kombat, E.O.; Alhassan, E.H. Supplemental carbon sources applied in biofloc technology aquaculture systems: Types, effects and future research. Rev. Aquac. 2021, 13, 1193–1222. [Google Scholar] [CrossRef]
- Elabd, H.; Wang, H.P.; Shaheen, A.; Yao, H.; Abbass, A. Astragalus membranaceus (AM) enhances growth performance and antioxidant stress profiles in bluegill sunfish (Lepomis macrochirus). Fish Physiol. Biochem. 2016, 42, 955–966. [Google Scholar] [CrossRef]
- Zhao, D.; Pan, L.; Huang, F.; Wang, C.; Xu, W. Effects of different carbon sources on bioactive compound production of biofloc, immune response, antioxidant level, and growth performance of Litopenaeus vannamei in zero-water exchange culture tanks. J. World Aquac. Soc. 2016, 47, 566–576. [Google Scholar] [CrossRef]
- Mansour, A.T.; Esteban, M.Á. Effects of carbon sources and plant protein levels in a biofloc system on growth performance, and the immune and antioxidant status of Nile tilapia (Oreochromis niloticus). Fish Shellfish Immunol. 2017, 64, 202–209. [Google Scholar] [CrossRef]
- Ekasari, J.; Azhar, M.H.; Surawidjaja, E.H.; Nuryati, S.; De Schryver, P.; Bossier, P. Immune response and disease resistance of shrimp fed biofloc grown on different carbon sources. Fish Shellfish Immunol. 2014, 41, 332–339. [Google Scholar] [CrossRef]
- Khanjani, M.H.; Sharifinia, M. Biofloc technology as a promising tool to improve aquaculture production. Rev. Aquac. 2020, 12, 1836–1850. [Google Scholar] [CrossRef]
- Abualnaja, K.M.; Alprol, A.E.; Abu-Saied, M.; Ashour, M.; Mansour, A.T. Removing of anionic dye from aqueous solutions by adsorption using of multiwalled carbon nanotubes and poly (acrylonitrile-styrene) impregnated with activated carbon. Sustainability 2021, 13, 7077. [Google Scholar] [CrossRef]
- Tacon, A.; Cody, J.; Conquest, L.; Divakaran, S.; Forster, I.; Decamp, O. Effect of culture system on the nutrition and growth performance of Pacific white shrimp Litopenaeus vannamei (Boone) fed different diets. Aquac. Nutr. 2002, 8, 121–137. [Google Scholar] [CrossRef] [Green Version]
- Ashour, M.; Alprol, A.E.; Heneash, A.M.; Saleh, H.; Abualnaja, K.M.; Alhashmialameer, D.; Mansour, A.T. Ammonia bioremediation from aquaculture wastewater effluents using Arthrospira platensis NIOF17/003: Impact of biodiesel residue and potential of ammonia-loaded biomass as rotifer feed. Materials 2021, 14, 5460. [Google Scholar] [CrossRef]
- Kureshy, N.; Davis, D.A. Protein requirement for maintenance and maximum weight gain for the Pacific white shrimp, Litopenaeus vannamei. Aquaculture 2002, 204, 125–143. [Google Scholar] [CrossRef]
- Shahkar, E.; Yun, H.; Park, G.; Jang, I.-K.; kyoung Kim, S.; Katya, K.; Bai, S.C. Evaluation of optimum dietary protein level for juvenile whiteleg shrimp (Litopenaeus vannamei). J. Crust. Biol. 2014, 34, 552–558. [Google Scholar] [CrossRef] [Green Version]
- Hu, Y.; Tan, B.; Mai, K.; Ai, Q.; Zheng, S.; Cheng, K. Growth and body composition of juvenile white shrimp, Litopenaeus vannamei, fed different ratios of dietary protein to energy. Aquac. Nutr. 2008, 14, 499–506. [Google Scholar] [CrossRef]
- Martinez-Cordova, L.R.; Porchas-Cornejo, M.A.; Villarreal-Colemnares, H.; Calderon-Perez, J.A.; Naranjo-Paramo, J. Evaluation of three feeding strategies on the culture of white shrimp Penaeus vannamei Boone 1931 in low water exchange ponds. Aquac. Eng. 1998, 17, 21–28. [Google Scholar] [CrossRef]
- Hamidoghli, A.; Yun, H.; Shahkar, E.; Won, S.; Hong, J.; Bai, S.C. Optimum dietary protein-to-energy ratio for juvenile whiteleg shrimp, Litopenaeus vannamei, reared in a biofloc system. Aquac. Res. 2018, 49, 1875–1886. [Google Scholar] [CrossRef]
- Smith, L.L.; Lee, P.G.; Lawrence, A.L.; Strawn, K. Growth and digestibility by three sizes of Penaeus vannamei Boone: Effects of dietary protein level and protein source. Aquaculture 1985, 46, 85–96. [Google Scholar] [CrossRef]
- Liu, D.; He, J.; Liu, Y.; Zheng, S.; Tian, L. Effects of dietary protein levels on growth performance and immune condition of Pacific white shrimp Litopenaeus vannamei juveniles at very low salinity. Acta Sci. Nat. Univ. Sunyatseni 2005, 44, 217–223. [Google Scholar]
- Hari, B.; Kurup, B.M.; Varghese, J.T.; Schrama, J.; Verdegem, M. Effects of carbohydrate addition on production in extensive shrimp culture systems. Aquaculture 2004, 241, 179–194. [Google Scholar] [CrossRef]
- Schneider, O.; Sereti, V.; Eding, E.; Verreth, J. Analysis of nutrient flows in integrated intensive aquaculture systems. Aquac. Eng. 2005, 32, 379–401. [Google Scholar] [CrossRef]
- Hargreaves, J.A. Photosynthetic suspended-growth systems in aquaculture. Aquac. Eng. 2006, 34, 344–363. [Google Scholar] [CrossRef]
- Lee, C.; Lee, K.-J. Dietary protein requirement of Pacific white shrimp Litopenaeus vannamei in three different growth stages. Fish. Aquat. Sci. 2018, 21, 30–36. [Google Scholar] [CrossRef] [Green Version]
- AOAC. Official Methods of Analysis of the Association of Official Analytical Chemists, 17th ed.; The Association of Official Analytical Chemists: Washington, DC, USA, 2003; Volume I. [Google Scholar]
- Avnimelech, Y. Biofloc-Based Aquaculture Systems. Aquaculture Production Systems; Wiley-Blackwell: New Delhi, India, 2012. [Google Scholar]
- Parsons, T.R. A Manual of Chemical & Biological Methods for Seawater Analysis; Elsevier: Amsterdam, The Netherlands, 2013. [Google Scholar]
- Avnimelech, Y.; Kochba, M. Evaluation of nitrogen uptake and excretion by tilapia in bio floc tanks, using 15N tracing. Aquaculture 2009, 287, 163–168. [Google Scholar] [CrossRef]
- Jackson, M.L. Soil Chemical Analysis: Advanced Course; UW-Madison Libraries Parallel Press: Madison, WI, USA, 2005. [Google Scholar]
- Bremner, J. Determination of nitrogen in soil by the Kjeldahl method. J. Agric. Sci. 1960, 55, 11–33. [Google Scholar] [CrossRef]
- Matsler, A.; Siebenmorgen, T. Evaluation of operating conditions for surface lipid extraction from rice using a soxtec system. Cereal Chem. 2005, 82, 282–286. [Google Scholar] [CrossRef] [Green Version]
- Kumar, S.; Anand, P.S.S.; De, D.; Deo, A.D.; Ghoshal, T.K.; Sundaray, J.K.; Ponniah, A.G.; Jithendran, K.P.; Raja, R.A.; Biswas, G. Effects of biofloc under different carbon sources and protein levels on water quality, growth performance and immune responses in black tiger shrimp Penaeus monodon (Fabricius, 1978). Aquac. Res. 2017, 48, 1168–1182. [Google Scholar] [CrossRef]
- Kumar, S.; Shyne Anand, P.; De, D.; Sundaray, J.; Ananda Raja, R.; Biswas, G.; Ponniah, A.; Ghoshal, T.; Deo, A.; Panigrahi, A. Effects of carbohydrate supplementation on water quality, microbial dynamics and growth performance of giant tiger prawn (Penaeus monodon). Aquac. Int. 2014, 22, 901–912. [Google Scholar] [CrossRef]
- Duncan, D.B. Multiple range and multiple F tests. Biometrics 1955, 11, 1–42. [Google Scholar] [CrossRef]
- Wang, L.; Yin, N.; Sagada, G.; Hua, Y.; Li, H.; Zhang, J.; Shao, Q. Partial replacement of fishmeal with corn gluten meal, pea protein isolate and their mixture in diet of black sea bream (Acanthopagrus schlegelii) juveniles: Effects on growth performance, feed utilization and haematological parameters. Aquac. Res. 2020, 51, 2071–2083. [Google Scholar] [CrossRef]
- Mohanty, R.K.; Ambast, S.; Panigrahi, P.; Mandal, K. Water quality suitability and water use indices: Useful management tools in coastal aquaculture of Litopenaeus vannamei. Aquaculture 2018, 485, 210–219. [Google Scholar] [CrossRef]
- Emerenciano, M.; Cuzon, G.; Paredes, A.; Gaxiola, G. Biofloc technology applied to intensive broodstock farming of pink shrimp Farfantepenaeus duorarum (Part I): Growout, water quality, microorganisms profile and proximate analysis of biofloc. Aquac. Res. 2012, 45, 1713–1726. [Google Scholar] [CrossRef]
- Chen, Y.; Avnimelech, Y. The Role of Organic Matter in Modern Agriculture; Springer Science & Business Media: Berlin/Heidelberg, Germany, 2012; Volume 25. [Google Scholar]
- Heo, W.-S.; Kim, Y.-R.; Kim, E.-Y.; Bai, S.C.; Kong, I.-S. Effects of dietary probiotic, Lactococcus lactis subsp. lactis I2, supplementation on the growth and immune response of olive flounder (Paralichthys olivaceus). Aquaculture 2013, 376, 20–24. [Google Scholar] [CrossRef]
- Cleveland, J.; Montville, T.J.; Nes, I.F.; Chikindas, M.L. Bacteriocins: Safe, natural antimicrobials for food preservation. Int. J. Food Microbiol. 2001, 71, 1–20. [Google Scholar] [CrossRef]
- de Paiva Maia, E.; Modesto, G.A.; Brito, L.O.; Galvez, A.O.; Gesteira, T.C.V. Intensive culture system of Litopenaeus vannamei in commercial ponds with zero water exchange and addition of molasses and probiotics. Rev. Biol. Mar. Oceanogr. 2016, 51, 61–67. [Google Scholar] [CrossRef] [Green Version]
- Anand, P.; Kumar, S.; Panigrahi, A.; Ghoshal, T.; Syama Dayal, J.; Biswas, G.; Sundaray, J.; De, D.; Ananda Raja, R.; Deo, A. Effects of C: N ratio and substrate integration on periphyton biomass, microbial dynamics and growth of Penaeus monodon juveniles. Aquac. Int. 2013, 21, 511–524. [Google Scholar] [CrossRef]
- Rajkumar, M.; Pandey, P.K.; Aravind, R.; Vennila, A.; Bharti, V.; Purushothaman, C.S. Effect of different biofloc system on water quality, biofloc composition and growth performance in Litopenaeus vannamei (Boone, 1931). Aquac. Res. 2016, 47, 3432–3444. [Google Scholar] [CrossRef]
- Becerril-Cortés, D.; Monroy-Dosta, M.D.C.; Emerenciano, M.G.C.; Castro-Mejía, G.; Sofia, B.; Bermúdez, S.; Correa, G.V. Effect on nutritional composition of produced bioflocs with different carbon sources (molasses, coffee waste and rice bran) in Biofloc system. Int. J. Fish. Aquat. Stud. 2018, 6, 541–547. [Google Scholar]
- Emerenciano, M.; Cuzon, G.; Paredes, A.; Gaxiola, G. Evaluation of biofloc technology in pink shrimp Farfantepenaeus duorarum culture: Growth performance, water quality, microorganisms profile and proximate analysis of biofloc. Aquac. Int. 2013, 21, 1381–1394. [Google Scholar] [CrossRef]
- Webster, C.D.; Lim, C. Nutrient Requirements and Feeding of Finfish for Aquaculture; CABI: Wallingford, UK, 2002. [Google Scholar]
- Browdy, C.L.; Bratvold, D.; Stokesland, A.D.; McIntosh, P. Perspective on the Application of Closed Shrimp Culture Systems; The World Aquaculture Society: Baton Rouge, LA, USA, 2001. [Google Scholar]
- Prangnell, D.I.; Castro, L.F.; Ali, A.S.; Browdy, C.L.; Samocha, T.M. The performance of juvenile Litopenaeus vannamei fed commercial diets of differing protein content, in a super-intensive biofloc-dominated system. J. Appl. Aquac. 2022, 34, 1–22. [Google Scholar] [CrossRef]
- Ahmad, I.; Babitha Rani, A.; Verma, A.; Maqsood, M. Biofloc technology: An emerging avenue in aquatic animal healthcare and nutrition. Aquac. Int. 2017, 25, 1215–1226. [Google Scholar] [CrossRef] [Green Version]
- Avnimelech, Y. Feeding with microbial flocs by tilapia in minimal discharge bio-flocs technology ponds. Aquaculture 2007, 264, 140–147. [Google Scholar] [CrossRef]
- Emerenciano, M.; Ballester, E.L.; Cavalli, R.O.; Wasielesky, W. Effect of biofloc technology (BFT) on the early postlarval stage of pink shrimp Farfantepenaeus paulensis: Growth performance, floc composition and salinity stress tolerance. Aquac. Int. 2011, 19, 891–901. [Google Scholar] [CrossRef]
- Alprol, A.E.; Ashour, M.; Mansour, A.T.; Alzahrani, O.M.; Mahmoud, S.F.; Gharib, S.M. Assessment of water quality and phytoplankton structure of eight alexandria beaches, southeastern mediterranean sea, Egypt. J. Mar. Sci. Eng. 2021, 9, 1328. [Google Scholar] [CrossRef]
- Alprol, A.E.; Heneash, A.M.M.; Soliman, A.M.; Ashour, M.; Alsanie, W.F.; Gaber, A.; Mansour, A.T. Assessment of water quality, eutrophication, and zooplankton community in lake burullus, Egypt. Diversity 2021, 13, 268. [Google Scholar] [CrossRef]
- Anderson, R.K.; Parker, P.L.; Lawrence, A. A 13C/12C tracer study of the utilization of presented feed by a commercially important shrimp Penaeus vannamei in a pond growout system. J. World Aquac. Soc. 1987, 18, 148–155. [Google Scholar] [CrossRef]
- Lee Chen, Y.; Chen, H. Juvenile Penaeus monodon as effective zooplankton predators. Aquaculture 1992, 103, 35–44. [Google Scholar] [CrossRef]
- Ballester, E.; Abreu, P.; Cavalli, R.; Emerenciano, M.; De Abreu, L.; Wasielesky, W., Jr. Effect of practical diets with different protein levels on the performance of Farfantepenaeus paulensis juveniles nursed in a zero exchange suspended microbial flocs intensive system. Aquac. Nutr. 2010, 16, 163–172. [Google Scholar] [CrossRef]
- Decamp, O.; Conquest, L.; Forster, I.; Tacon, A. The Nutrition and Feeding of Marine Shrimp within Zero-Water Exchange Aquaculture Production Systems: Role of Eukaryotic Microorganisms; The World Aquaculture Socety: Baton Rouge, LA, USA, 2002. [Google Scholar]
- Santacruz-Reyes, R.A.; Chien, Y.-H. The potential of Yucca schidigera extract to reduce the ammonia pollution from shrimp farming. Bioresour. Technol. 2012, 113, 311–314. [Google Scholar] [CrossRef] [PubMed]


| Ingredients (g kg−1) | Experimental Diets (g Protein kg−1 Diet) | Control Diet (450 g Protein kg−1 Diet) | ||
|---|---|---|---|---|
| 250 | 300 | 350 | ||
| Fish meal | 90 | 270 | 270 | 450 |
| Soybean meal | 330 | 230 | 330 | 330 |
| Yellow corn | 280 | 250 | 205 | 90 |
| Wheat bran | 195 | 155 | 100 | 45 |
| Fish oil | 60 | 50 | 50 | 40 |
| Cholesterol | 5 | 5 | 5 | 5 |
| Di-calcium phosphate | 20 | 20 | 20 | 20 |
| Vitamin and minerals 1 | 20 | 20 | 20 | 20 |
| Proximate analysis (g kg−1) | ||||
| Dry matter | 893.5 | 899.6 | 901.8 | 906 |
| Crude protein | 256.2 | 319.6 | 352.1 | 451.7 |
| Crude lipid | 71.8 | 92.6 | 89.3 | 81.2 |
| Ash content | 78.1 | 81.2 | 90.1 | 112.3 |
| Crude fiber | 49.8 | 39.3 | 39.8 | 33.8 |
| Nitrogen-free extract 2 | 544.1 | 467.3 | 428.7 | 321 |
| Gross energy (MJ kg−1 diet) 3 | 18.70 | 19.22 | 19.20 | 19.38 |
| Carbon Sources | Total Organic Carbon | Total Protein | Total Lipid | Nitrogen-Free Extract | Ash | Fiber |
|---|---|---|---|---|---|---|
| Sugarcane bagasse | 395 ± 2.1 | 15.2 ± 0.1 | 15.3 ± 0.1 | 244 ± 0.3 | 76 ± 0.2 | 650 ± 2.1 |
| Wheat flour | 411 ± 1.1 | 122 ± 0.3 | 12.5 ± 0.2 | 812 ± 11 | 41.5 ± 0.2 | 13 ± 0.2 |
| Protein Levels (g kg−1) | Control (450) * | 250 | 300 | 350 | p-Value of Two-Way ANOVA | |||||
|---|---|---|---|---|---|---|---|---|---|---|
| Carbon Sources | SB | WF | SB | WF | SB | WF | Protein Levels | Carbon Source | Interaction | |
| Protein | – | 432.20 ± 13.00 b | 426.30 ± 18.50 c | 467.80 ± 17.70 a | 463.80 ± 15.20 a | 479.80 ± 15.60 a | 471.6 ± 16.30 a | 0.001 | 0.436 | 0.972 |
| Lipid | – | 23.00 ± 0.10 b | 19.80 ± 0.30 c | 26.00 ± 0.20 b | 32.00 ± 0.10 a | 28.00 ± 0.30 a | 31.00 ± 0.40 a | <0.001 | <0.001 | <0.001 |
| Nitrogen-free extract | – | 303.50 ± 13.30 a | 324.90 ± 19.00 a | 274.80 ± 15.10 c | 312.40 ± 13.6 b | 290.30 ± 15.50 b | 285.50 ± 12.80 b | 0.028 | 0.026 | 0.090 |
| Ash | – | 241.3 ± 7.80 a | 229.00 ± 9.90 a | 231.40 ± 8.40 a | 191.80 ± 6.30 b | 201.90 ± 6.90 b | 211.90 ± 8.80 c | <0.001 | 0.002 | 0.003 |
| Protein Levels (g kg−1) | Control (450) | 250 | 300 | 350 | p-Value of Two-Way ANOVA | |||||
|---|---|---|---|---|---|---|---|---|---|---|
| Carbon Sources | SB | WF | SB | WF | SB | WF | Protein Levels | Carbon Source | Interaction | |
| FBW | 6.83 ± 0.04 d | 6.35 ± 0.02 e | 7.31 ± 0.01 c | 6.37 ± 0.07 e | 6.80 ± 0.02 d | 8.83 ± 0.03 a | 8.55 ± 0.07 b | 0.001 | 0.001 | 0.001 |
| WG | 6.60 ± 0.04 d | 6.12 ± 0.02 e | 7.08 ± 0.01 c | 6.14 ± 0.07 e | 6.57 ± 0.02 d | 8.60 ± 0.03 a | 8.32 ± 0.07 b | 0.001 | 0.001 | 0.001 |
| SGR | 4.52 ± 0.01 | 4.43 ± 0.01 | 4.61 ± 0.01 | 4.43 ± 0.02 | 4.52 ± 0.01 | 4.86 ± 0.01 | 4.82 ± 0.01 | 0.001 | 0.001 | 0.10 |
| PER | 1.52 ± 0.01 e | 2.54 ± 0.01 b | 2.92 ± 0.01 a | 2.12 ± 0.01 d | 2.26 ± 0.01 c | 2.52 ± 0.01 b,c | 2.44 ± 0.01 b | 0.001 | 0.001 | 0.001 |
| FCR | 1.30 ± 0.36 | 1.09 ± 0.11 | 0.97 ± 0.09 | 1.25 ± 0.34 | 1.03 ± 0.09 | 0.93 ± 0.08 | 1.17 ± 0.32 | 0.74 | 0.55 | 0.11 |
| SR | 93.94 ± 3.32 a | 87.88 ± 5.92 c | 90.91 ± 4.57 b | 93.97 ± 5.74 a | 90.91 ± 6.55 b | 90.91 ± 4.57 b | 93.97 ± 3.45 a | 0.001 | 0.001 | 0.001 |
Publisher’s Note: MDPI stays neutral with regard to jurisdictional claims in published maps and institutional affiliations. |
© 2022 by the authors. Licensee MDPI, Basel, Switzerland. This article is an open access article distributed under the terms and conditions of the Creative Commons Attribution (CC BY) license (https://creativecommons.org/licenses/by/4.0/).
Share and Cite
Mansour, A.T.; Ashry, O.A.; Ashour, M.; Alsaqufi, A.S.; Ramadan, K.M.A.; Sharawy, Z.Z. The Optimization of Dietary Protein Level and Carbon Sources on Biofloc Nutritive Values, Bacterial Abundance, and Growth Performances of Whiteleg Shrimp (Litopenaeus vannamei) Juveniles. Life 2022, 12, 888. https://doi.org/10.3390/life12060888
Mansour AT, Ashry OA, Ashour M, Alsaqufi AS, Ramadan KMA, Sharawy ZZ. The Optimization of Dietary Protein Level and Carbon Sources on Biofloc Nutritive Values, Bacterial Abundance, and Growth Performances of Whiteleg Shrimp (Litopenaeus vannamei) Juveniles. Life. 2022; 12(6):888. https://doi.org/10.3390/life12060888
Chicago/Turabian StyleMansour, Abdallah Tageldein, Ola A. Ashry, Mohamed Ashour, Ahmed Saud Alsaqufi, Khaled M. A. Ramadan, and Zaki Z. Sharawy. 2022. "The Optimization of Dietary Protein Level and Carbon Sources on Biofloc Nutritive Values, Bacterial Abundance, and Growth Performances of Whiteleg Shrimp (Litopenaeus vannamei) Juveniles" Life 12, no. 6: 888. https://doi.org/10.3390/life12060888
APA StyleMansour, A. T., Ashry, O. A., Ashour, M., Alsaqufi, A. S., Ramadan, K. M. A., & Sharawy, Z. Z. (2022). The Optimization of Dietary Protein Level and Carbon Sources on Biofloc Nutritive Values, Bacterial Abundance, and Growth Performances of Whiteleg Shrimp (Litopenaeus vannamei) Juveniles. Life, 12(6), 888. https://doi.org/10.3390/life12060888