Abstract
Arthrospira platensis (Spirulina) biomass is a valuable source of sustainable proteins, and the basis for new food and feed products. State-of-the-art production of Spirulina biomass in open pond systems only allows limited control of essential process parameters, such as light color, salinity control, or mixotrophic growth, due to the high risk of contaminations. Closed photobioreactors offer a highly controllable system to optimize all process parameters affecting Spirulina biomass production (quantity) and biomass composition (quality). However, a comprehensive analysis of the impact of light color, salinity effects, and mixotrophic growth modes of Spirulina biomass production has not been performed yet. In this study, Response Surface Methodology (RSM) was employed to develop statistical models, and define optimal mixotrophic process conditions yielding maximum quantitative biomass productivity and high-quality biomass composition related to cellular protein and phycocyanin content. The individual and interaction effects of 0, 5, 15, and 30 g/L of sodium chloride (S), and 0, 1.5, 2, and 2.5 g/L of glucose (G) in three costume-made LED panels (L) where the dominant color was white (W), red (R), and yellow (Y) were investigated in a full factorial design. Spirulina was cultivated in 200 mL cell culture flasks in different treatments, and data were collected at the end of the log growth phase. The lack-of-fit test showed that the cubic model was the most suitable to predict the biomass concentration and protein content, and the two-factor interaction (2FI) was preferred to predict the cellular phycocyanin content (p > 0.05). The reduced models were produced by excluding insignificant terms (p > 0.05). The experimental validation of the RSM optimization showed that the highest biomass concentration (1.09, 1.08, and 0.85 g/L), with improved phycocyanin content of 82.27, 59.47, 107 mg/g, and protein content of 46.18, 39.76, 53.16%, was obtained under the process parameter configuration WL4.28S2.5G, RL10.63S1.33G, and YL1.00S0.88G, respectively.
Keywords:
Spirulina; mixotrophic; salinity; light color; glucose; LED; response surface methodology; RSM 1. Introduction
There is an increasing demand for proteins, natural pigments, and lipids in the food, pharmaceutical, and aquaculture industries [1] that can be obtained in a sustainable way from microalgae biomass [2], as it does not interfere with animal feed or human food production. Therefore, these organisms are known as the flagship of the third generation of food resources [3].
Arthrospira platensis (Spirulina) is known as a superfood that contains valuable compounds, such as high-digestible proteins [4,5], vitamins [6], unsaturated fatty acids such as gamma-linolenic acid [7], and pigments, especially for the anti-cancer blue phycocyanin [8].
The biomass productivity and biochemical composition of Spirulina biomasses are highly dependent on the adjusted cultivation conditions, such as temperature [9], light quality (spectrum) [10,11,12] and quantity (intensity) [13,14], and the availability of nutrients [15]. Spirulina is commonly cultivated in large-scale open raceway ponds using natural sunlight. Despite the low biomass production costs using raceway ponds compared to closed photobioreactors, this way of production is associated with a lower biomass productivity, a high risk of contamination, and limited options for process control. Hence, attention has increasingly been paid to developing closed photobioreactors (PBRs) for boosting production [16], and more flexibility for exploiting the metabolites from Spirulina by optimizing the essential process conditions, such as light color, salinity, and availability of organic carbon sources. However, comprehensive studies investigating both the individual, as well as combinatorial, effects of these process conditions to control the quantity and quality of the product biomass have not yet been conducted. Spirulina offers a high metabolic flexibility, and can grow under photoautotrophic, heterotrophic, and mixotrophic conditions [12]. In heterotrophic cultures, a long lag phase, a low specific growth rate, and a decrease in the cellular phycocyanin content were reported [17], whereas under mixotrophic growth conditions, Marquez et al. showed that there was no significant lag phase [18], and the growth rate was equal to the sum of the photoautotrophic and heterotrophic growth [17]. Mixotrophic conditions can thus lead to an increase in quantitative biomass yield compared to photoautotrophic or heterotrophic conditions.
Salinity is one of the most important factors affecting growth and valuable cellular compounds in algae [19]. Due to the high tolerance of Spirulina towards various salinity conditions, the use of high salinity is considered as one way to control undesired contamination [20,21,22]. Most studies dealing with the salinity tolerance of Spirulina have been performed in photoautotrophic environments, with contradictory results [19,23,24,25,26]. In mixotrophic process conditions, high salinity was reported to have a negative effect on biomass production [27]. Due to a lack of knowledge on the interaction of trophic growth modes and salinity tolerance, further studies are necessary to specifically analyze how varying salinity in mixotrophic conditions affects the quantity and quality of Spirulina biomass production.
Light quality, i.e., the spectral composition of photosynthetic active radiation (PAR), is another important factor affecting biomass productivity and biomass composition. Due to the cell-specific pigmentation, phototrophic microorganisms, such as microalgae and cyanobacteria, are not able to absorb all spectral parts of PAR [28,29]. Among the various sources of artificial light, light-emitting diodes (LEDs) are characterized by a high level of efficiency, a long lifetime, low energy consumption, and the absence of toxic materials in their composition [30,31]. White, blue, red, green, yellow, and orange LEDs have been reported in previous studies to affect Spirulina, biomass productivity, and quality in terms of its chemical composition or pigment content [32,33,34,35,36,37]. For instance, red LED light improved the growth rate of Spirulina by 29–67%, whereas blue LED light increased the production of cellular fats, carbohydrates, and phycocyanin; however, the highest protein production was reported using green and white LED light [11,32,33,38,39,40]. Tian et al. [30] suggested that the presence of blue light is necessary to improve metabolic functions in photosynthesis. Red light is needed for the efficient operation of photosystems I (700 nm) and II (680 nm). Therefore, the concept of using different spectral parts of light was suggested to improve both the quantity and quality of algal biomass [30]. The most suitable spectral light composition for photoautotrophic Spirulina cultivation was suggested to be a combination of three LEDs emitting red, green, and blue light, with a ratio of 80:5:15, respectively [37]. However, Bachchhav et al. [34] reported that under mixotrophic conditions, yellow LEDs were more efficient than red LEDs, leading to the hypothesis that a combination of mixotrophic process conditions with balanced salinity, and LED light with dominant yellow spectral parts, can be beneficial for biomass production (quantity), as well as protein and phycocyanin content (quality).
Response Surface Methodology (RSM) is a mathematical and statistical technique to assess the effect of several independent variables on a respond of interest. Despite the basics of RSM dating back to the 1920s, this approach is widely-used in current research and process development in various disciplines, such as environmental biotechnology [41], bioprocess engineering, and wastewater treatment [42]. Breig and Luti 2021 [43] highlighted the power of RSM to optimize microbial production of primary and secondary metabolites. Karimifard and Moghaddam 2018 [44] presented RSM approaches in order to optimize the physicochemical wastewater treatment. Also, many recent studies successfully used the RSM approach to optimize Spirulina growth conditions for the enhancement of biomass productivity [45], air revitalization [46], developing screening photobioreactors [47], and phycocyanin extraction [48].
In this study, RSM was used to study the effect of salinity, glucose concentration (mixotrophic and heterotrophic conditions), and light color, as well as the combinatorial effects of these input parameters on Spirulina biomass productivity (quantity) and biomass composition (quality). For this purpose, both an in-house illumination system for the realization of different light colors with constant photon flux density, and a screening cultivation system based on small-scale cell culture flasks, were realized. The statistical analysis, based on 144 cultivations performed under varying process conditions, yielded a comprehensive knowledge on interaction effects of the process parameters (variables) on the process responses of biomass productivity and the product quality of Spirulina biomass.
2. Materials and Methods
The experiments were conducted in the experimental facilities of the Institute of Natural Materials Technology (TU Dresden, Dresden, Germany) for a period of 8 months during 2020–2021. The following methods were used to investigate, in detail, the influence of the process parameters light color, salinity, and glucose concentration (mixotrophic growth) on the biomass productivity, cellular protein, and phycocyanin content of Spirulina. The approach is intended to prove the hypothesis that a well-balanced combination of the above-mentioned process parameters has a positive effect on the biomass quantity and quality.
2.1. Microorganism
A. platensis PCC7345 was obtained from the Pasteur Culture Collection (PCC, Paris, France). Stock cultures were grown in a sterile filtrated modified Zarrouk medium containing (g/L): 16.8 NaHCO3 (99.5%, VWR Chemicals, Darmstadt, Germany), 0.5 K2HPO4 (99%, Carl Roth, Karlsruhe, Germany), 2.5 NaNO3 (99.9%, VWR chemicals, Darmstadt, Germany), 1.0 K2SO4 (99.5%, VWR chemicals, Darmstadt, Germany), 1.0 NaCl (99%, Carl Roth, Karlsruhe, Germany), 0.2 MgSO4∙7H2O (99%, Carl Roth, Karlsruhe, Germany), 0.04 CaCl2∙2H2O (99%, Carl Roth, Karlsruhe, Germany) [11], and 100 µL/L of Hutner’s trace element solution [49]. A. platensis stock cultures were maintained in 300 mL Erlenmeyer flasks at 26 °C, 150 rpm, and 75 µmol/m2s fluorescent light (light/dark cycles of 16/8 h, WB750, Mytron Bio- und Solartechnik GmbH, Heilbad Heiligenstadt, Germany). Liquid stock cultures were sub-cultivated every two weeks to prevent aging and cell death.
2.2. Light Panels
To customize the spectral lighting conditions, single high-power LEDs (3 W, 2.3–3.5 V, 700 mA, opening angle of 120°, World Trading Net GmbH & Co. KG, Bleicherode, Germany) were purchased in white (5000–7000 °K), blue (470 nm), yellow (590 nm), red (625 nm), and green (525 nm). Twenty LEDs using the ratio recommended by Mao and Guo [37] were arranged on three light panels (L) in the following configuration: WL) 100% white; RL) 80% red, 15% blue, 5% green; and YL) 80% yellow, 15% blue, 5% green. The spectral composition of each light panel was measured with a USB-650 spectrometer (Ocean Optics, Orlando, FL, USA), and was normalized to improve the comparison as visualized in Figure 1.
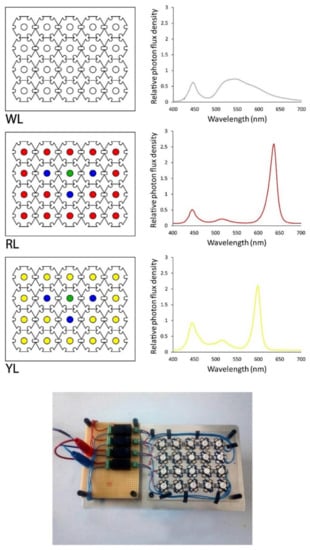
Figure 1.
Arrangement of LEDs on light panels with customized spectral composition (photograph below graphs). The LED panels were named WL (white light panel), RL (red light panel), and YL (yellow light panel).
2.3. Adaptation and Inoculation of Cultivation Units
A gradual preadaptation of Spirulina using varying concentrations of sodium chloride (S) and glucose (G) was performed before each experimental run under continuous light (white fluorescent light, 100 µmol/m2s, 30 °C, WB750, Mytron Bio- und Solartechnik GmbH, Heilbad Heiligenstadt, Germany) and axenic conditions (Figure 2). First, pre-cultures were adapted to 1, 5, 15, 30 g/L of S (3–5 days depending to the amount of S), whereas the second pre-cultures were adapted to 0 or 1 g/L of G (3 days). To adjust the desired concentrations of S and G for the experimental runs, stock solutions of NaCl 200 % (99%, Carl Roth, Karlsruhe, Germany) and glucose 100 % (99.5%, Carl Roth, Karlsruhe, Germany) were added to the modified Zarrouk medium described in Section 2.1. The initial pH was adjusted to 9.5 by adding 1 N sodium hydroxide solution (99.8%, Carl Roth, Karlsruhe, Germany). Secondary pre-cultures growing at the log phase were used to inoculate the experimental runs in cell culture bottles at 0.1 g/L (200cc filter screw cap cell culture bottles, Greiner Bio-One, Frickenhausen, Germany). The final working volume of each bottle was adjusted to 50 mL. The dimensions of the bottles were 8 × 3.5 × 13 cm, yielding an illuminated surface of 45.5 cm2. This costume-made screening setup allowed performing of 24 parallel cultivations at homogenous light color and light intensity conditions, and formed the basis for the statistical analysis of biomass productivity and quality.
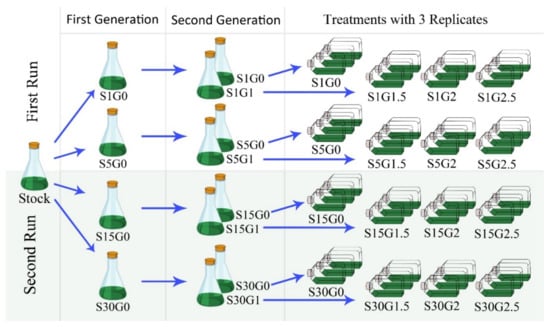
Figure 2.
Routine for the adaptation of Arthrospira platensis (Spirulina) with varying concentrations of sodium chloride (S) and glucose (G) before each experimental run.
2.4. Experimental Conditions at Screening Scale for the Design of Experiments Approach
A total of 144 assays were performed with six runs (2 runs for each light panel with 24 assays). The cell culture bottles were fixed on a rotary platform shaker with a speed of 200 rpm in a controlled temperature environment at 30 °C [40]. In order to provide an equal photon flux density of 150 µmol/m2s for all bottles, the distance of the light source was adapted to ensure that the experimental runs were under comparable light quantity conditions [50] (Figure 3). The photon flux density of the light panels was measured using a PAR-quantum sensor DK-PHAR 2.010BS (Deka Sensor + Technologie Entwicklungs- und Vertriebgesellschaft mbH, Teltow, Germany). The light panels were exposed to light/dark cycles of 16/8 h.
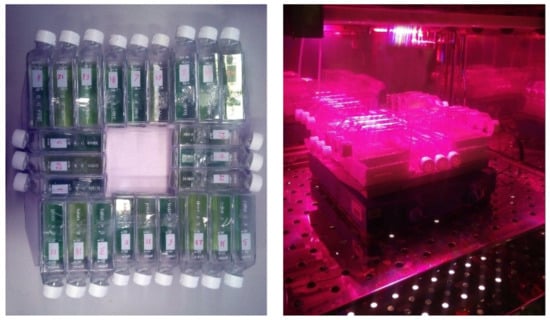
Figure 3.
Arrangement of the experimental unit for the design of experiments approach in the incubator. The photograph shows the exposure of 24 culture bottles to the RL.
2.5. Sampling and Analytical Methods
Each experimental screening run was performed for 5 days. Sampling was conducted daily; however, the analysis of biochemical composition (quality) was performed at the end of the dark cycle on the third cultivation day. This time was determined in pre-tests (data not shown) to ensure there was non-limited growth at the end of the exponential growth phase for all tested conditions.
2.6. Determination of Dry Weight Concentration
The biomass dry weight concentration was measured as changes in optical density (OD750) using a spectrophotometer (Genesys 150, ThermoFisher Scientific, Waltham, MA, USA). Routines for cell dry weight determination and optical density correlation were recently described by Franke et al. [51].
2.7. In-Vivo Phycocyanin Quantification of Suspended Cells
The quantification of the cellular phycocyanin content, cPC (mg/g), of Spirulina was performed as recently described by Franke et al. [51]. In brief, culture samples were diluted using saline solution (0.9 % NaCL) to a final OD750 of 0.1 in a 3 mL cuvette that was clear on all sides, and made from polystyrene. The intracellular phycocyanin was excited with light in the spectral range of 600–630 nm, and the maximum of phycocyanin absorption (step with 5 nm, measurement speed: 1200 nm/min), using a fluorescence spectrometer (LS-55, PerkinElmer Inc., Waltham, MA, USA). Fluorescence emission was detected in the range of 650–670 nm with a peak intensity (If, max) at 655 nm. If, max was detected in triplicate, and used to calculate the cellular phycocyanin content following Equation (1).
CPC = 0.4484 × If max
2.8. Quantification of Cellular Protein Content and pH Measurement
At the end of the dark cycle on the third cultivation day, 10 mL of cell suspensions were taken from each cell culture bottle to determine the protein content of the biomass. First, the pH of the medium was measured using a pH meter (Xylem Analytics Germany Sales GmbH & Co. KG, Weilheim, Germany), followed by biomass separation at 10,000 rpm (3–30 ks, Refrigerated Centrifuge, Sigma Laborzentrifugen GmbH, Osterode, Germany) for 20 min at 4 °C. The pelleted biomass was washed with 1 mL saline water (same salinity as respective culture medium). This washing step was repeated a total of three times [52]. The collected biomass was freeze-dried (LSCplus, Martin Christ Gefriertrocknungsanlagen GmbH, Osterode, Germany) to analyze the protein content with a Lowry assay using the procedure described by Slocombe et al. [53].
2.9. Design of Experiment—Modulation of Responses
The design of experiments approach was planned as a full factorial design of 3 × 4 × 4 (Table 1). All experiments were carried out in triplicate, yielding a total of 144 experimental runs to identify the impact of the three process variables: (1) light quality (L), (2) sodium chloride concentration (S), and (3) glucose concentration (G), on the respond parameters of the biomass dry weight concentration (g/L), cellular phycocyanin content (mg/g), and protein content (%) in batch cultures. Each experimental run was assigned an ID, which is structured as follows: YLS30G0 indicates yellow light conditions (YL), a salinity (S) of 30 g/L, and a glucose concentration (G) of 0 g/L.

Table 1.
Experimental independent variables and levels.
The statistical effect of each factor was determined with the analysis of variance (ANOVA) method using Design-Expert (Version 12) at a confidence coefficient level of α = 0.05. The model fit accuracy was assessed based on the model validity (lack of fit) and the explained variation (R2). To validate the quality of the DOE models, experiments were conducted under the predicted optimal process conditions, and compared to the predicted model outcomes.
3. Results
The experimental basis for the RSM approach was provided by the 144 cultivations carried out under variation of the input variables: light color, salinity, and glucose concentration. In the following sections, the results of process analytics, as well as the modeling and the validation of the model prediction, are presented.
3.1. DOE—Output Responses and Model Fitting
The analyzed mean output parameter presented in Table 2 shows a huge variance in the obtained biomass dry weight concentration, as well as the cellular protein and phycocyanin content, dependent on the applied process conditions. The biomass dry weight concentration after three days of cultivation ranged from 0.65 g/L (YLS30G0) to 1.25 g/L (RL15S2.5G); the cellular phycocyanin content from 48 mg/g (RL5S2.5G) to 114 mg/g (YL1SG0); and the protein content from 23% (RL30S2.5G and WL30S2.5G) to 64% of freeze-dried biomass (YL1S0G).
Table 2.
The response of Arthrospira platensis (Spirulina) to different levels of sodium chloride (S) and glucose (G) concentration under different light panels (L) where the dominant color was white (W), red (R), and yellow (Y); standard deviation is calculated from three independent experimental runs (n = 3).
The experimental data were used to identify model equations for each light color condition. The multiple regression analyses of variance for the significance of the different-order polynomial equations of experimental data are shown in Table 3. For the lack-of-fit test, the p > 0.05 indicates that the model is significant at a 95% confidence interval. The sequential sum of squares for the two-factor interaction (2FI) was fitted to the target parameter “phycocyanin content,” whereas the cubic model was fitted for the target parameter “biomass concentrations” and “protein content,” yielding an estimated R2 of 0.66, 0.85, and 0.77, respectively.
Table 3.
Analysis of variance of model statistics.
3.2. Model Development and RSM
The results of ANOVA tests for the effect of DOE parameters and their interactions are presented in Table 4, and indicate an interaction effect between the studied input parameters. In the cubic model accounting for the biomass concentration of S, G, L, SG, and SL: S2, S2G, S2L, and S3 were identified as significant model terms (p < 0.05); in the 2FI model applied for phycocyanin S, G, L, SL, and GL, and in the cubic model used to describe the protein content of S, L, SL, GL, and SGL: S2L and S3 were identified as significant model terms (p < 0.05).
Table 4.
The p-values and F-values of the parameters to biomass, phycocyanin, and protein response.
The optimized and reduced models for each light color condition produced by removing insignificant interactions are shown in Equations (2)–(10), where S and G in the equations represent the values of sodium chloride (g/L) and glucose (g/L), respectively.
Red light conditions:
Biomass (g/L) = 0.774378 + 0.007S + 0.153028G + 0.003046SG + 0.001222S2 − 0.046097G2 − 0.000302S2G + 0.001913SG2 − 0.00005S3
Phycocyanin (mg/g) = 58.78636 + 0.356963S− 2.34278G
Protein (%) = 41.43973 + 1.64206S + 1.22094G − 0.089108SG − 0.217611S2 − 0.272088G2 + 0.004940S3
White light conditions:
Biomass (g/L) = 1.00961 − 0.03227S + 0.153028G + 0.003046SG + 0.002291S2 − 0.0461G2 − 0.0003S2G + 0.001913SG2 − 0.00005S3
Phycocyanin (mg/g) = 86.46885 − 0.5755S − 0.50084G
28.39144 + 3.19007S + 5.81073G − 0.226657SG − 0.248256S2 − 0.705852G2 + 0.004940S3
White light conditions:
Biomass (g/L) = 0.78752 − 0.03441S + 0.153028G + 0.003046SG + 0.002506S2 − 0.0461G2 − 0.000302S2G + 0.001913SG2 − 0.00005S3
Phycocyanin (mg/g) = 114.2279 − 1.02457S − 6.47468G
Protein (%) = 62.45694 + 0.303057S − 11.10308G + 0.095447SG − 0.192155S2 + 3.33310G2 + 0.004940S3
The response surfaces for the biomass concentration, and protein and phycocyanin content in the three lighting conditions studied were developed following the optimized polynomial models, and are visualized in Figure 4, Figure 5 and Figure 6.
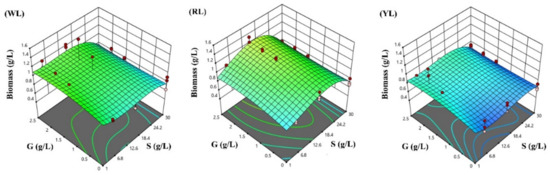
Figure 4.
Response surface methodology presenting the effects of sodium chloride (S) and glucose (G) concentration on Spirulina biomass concentration after three days of cultivation (g/L): (WL) white light panel, (RL) red light panel, and (YL) yellow light panel; the circles are the designated points.
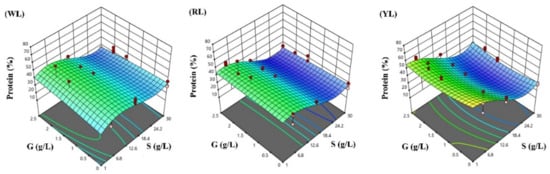
Figure 5.
Response surface methodology presenting the effects of sodium chloride (S) and glucose (G) concentrations on the Spirulina protein content (%): (WL) white light panel, (RL) red light panel, and (YL) yellow light panel; the circles are the designated points.
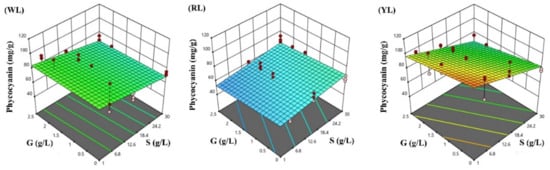
Figure 6.
Response surface methodology presenting the effects of sodium chloride (S) and glucose (G) concentrations on the Spirulina phycocyanin content (mg/g): (WL) white light panel, (RL) red light panel, and (YL) yellow light panel; the circles are the designated points.
The ability of microalgae to use different light spectra is related to the photosynthetic pigment composition [29], and the availability of photons due to light attenuation in suspension [54]. Under phototrophic conditions (0G), and with typical salinity (1S), the highest biomass concentration was obtained under WL (1.03 g/L) conditions, whereas the biomass concentration achieved with RL (0.85 g/L) and YL (0.66 g/L) was reduced in a similar range. Previous studies that have investigated the dependence of biomass productivity on light color have presented far different results. In general, light in the blue spectral range shows good penetration in water, and can be efficiently absorbed by chlorophyll and carotenoids, but a too high dose of blue light can result in non-photochemical quenching processes [55]. Light in the red spectral range can be efficiently absorbed by chlorophyll and phycocyanin [56,57], resulting in high biomass concentrations and growth rates, reported in recent studies [11,34,58,59,60].
Chainapong et al. [36] reported a higher growth rate of Spirulina under white light in comparison to red and yellow lights produced by plastic filters. Ravelonandro et al. [61] used colored polyethylene films to obtain different light spectra, and found that the final biomass of A. platensis exposed to green or white light was higher compared to red light. In contrast, Mao and Guo [37] reported a facilitated growth rate under red-dominated light treatments. However, they used a white light source with a higher blue spectral component and supplementary CO2 bubbling compared to this study. Tayebati et al. [60] reported a higher biomass concentration under red LED light conditions compared to white, yellow, and blue light. Park and Dinh [62] observed no significant difference in the growth of A. maxima cultivated under red (660 nm) and white light, whereas Zittelli et al. [63] found an improved biomass productivity of Spirulina under orange light (620 nm) compared to white and blue light conditions. The severely disparate results of these studies may be attributed to the different experimental setups, different species, and various sources and wavelengths of light. The high pH value under red light conditions (11.15) observed in this study indicates a high photosynthetic activity; however, a beneficial growth effect of red-dominated light could not be confirmed in this study, as the biomass concentration of Spirulina was reduced by approx. 17.5% under phototrophic conditions (0 g/L glucose), and 1 g/L NaCl under RL conditions, compared to WL.
According to the RSM prediction, the biomass concentration can be boosted by the addition of glucose under mixotrophic conditions with the following configuration of cultivation parameters for each lighting condition (after 3 days of cultivation): 1.21 g/L for RL panel adjusting a salinity of 16.85 g/L and 2.5 g/L glucose; 0.89 g/L for WL adjusting a salinity of 1 g/L and 2.5 g/L glucose; and finally, 0.89 g/L at YL adjusting 1 g/L salinity and 1.76 g/L glucose, respectively. However, the predicted protein content under RL (28.56%) is significantly lower than under WL (38.98%) and YL (53.52%), respectively.
In contrast, the lowest biomass concentration is achieved at the following parameter configuration: 0.67 g/L for YL at 0.89 g/L glucose and 4.96 g/L NaCl; 0.88 g/L for WL at 0 g/L glucose and 6.30 g/L NaCl; and 0.89 g/L at 0 g/L glucose and 30 g/L NaCl. The RSM coefficients of glucose remained equal for the different light panels used, indicating that the interaction between the light color and glucose concentration on biomass production of Spirulina was not significant, i.e., the color of the light did not have a significant effect on the mixotrophic growth of Spirulina.
In recent studies, the effect of increasing NaCl on Spirulina production has been assessed [19,64,65,66], indicating that the growth of Spirulina remains stable, using NaCl concentrations up to 13 g/L, whereas higher salinities resulted in a reduction in growth rates. In the literature, the growth reduction at high salinity conditions is mainly attributed to two effects. The first effect is an increase in maintenance costs: the best salinity level for phytoplankton is equal to the salinity of their cytoplasm; higher or lower values are controlled by osmotic mechanisms. In the case of high salinity, the first strategy is the extrusion of sodium ions by using energy; alongside this, a high amount of compatible osmolytes accumulate inside of the cell to balance the osmolality [67]. Additionally, Spirulina produces a huge amount of extracellular polymeric substances, which enhances salt tolerance [54,60]. In this manner, along with the energy used for osmotic adjustments, the cell protects sub-cellular structures from damage. The second effect is a reduced photosynthetic activity, photoinhibition, and an increase in respiration, which were reported in recent studies [24,50,68,69]: salt stress led to a 40% loss of a thylakoid membrane protein known as D1, whereas salinity stress proportional to the intensity of PAR blocked electron transport, and inhibited PSII electron transport [69].
In contrast, Dhiab et al. [70] reported that an elevated salt concentration, even at 500 mM (29.22 g/L), enhanced the growth and photosynthetic efficiency of Spirulina. This discrepancy in the results may be explained by the fact that the authors used a light intensity of 20 µmol/m2s, which is much lower than that in the above studies [25,69,71]. Low light intensity seems to be a suitable approach of maintaining the vitality and growth of the cells under raised salinity; however, high light intensities result in reduced growth due to photoinhibition.
In this study, the average biomass under RL with 1 g/L and 5 g/L NaCl (assays 49–60 and 61–72) was 25% and 11% lower compared to the same conditions in WL (assays 1–12 and 13–24). In contrast, the average biomass under RL with 15 g/L NaCl (assays 73–84) was 12% higher than WL (assays 25–36). The optimum pH for Spirulina growth is 10.5. At a pH close to 11, cells undergo deterioration [72], a possible reason for the poorer performance of the RL with 1 and 5 g/L NaCl (average pH of 10.93) than WL with 1 and 5 g/L NaCl (average pH of 10.64) and RL with 15 g/L (average pH of 10.38).
Mixotrophic conditions using glucose as an additional carbon source enhanced the biomass productivity under varying light color conditions. An inhibitory effect was not observed under any of the analyzed conditions using glucose at a concentration up to 2.5 g/L. Results of the current study are consistent with earlier research that studied the growth of Spirulina cultured with different organic carbon sources [34,36,73,74,75]. Rasouli et al. [75] reported that the biomass productivity of Spirulina was significantly reduced by the addition of more than 4 g/L glucose. However, Spirulina can survive in media containing up to 20 g/L of glucose. Therefore, these authors recommended applying glucose in the concentration range of 0–1.5 g/L. Bachchhav et al. [34] observed that a mixotrophic culture using yellow LED light achieved a higher final biomass concentration compared to red and white LEDs. This difference could be attributed to the fact that their study lasted 10 days with a final biomass of 6.6 g/L, with a poor level of details.
In mixotrophic culture conditions, the adverse effect of high salinity up to 15 g/L is mediated by heterotrophic growth. Rasouli et al. [75] reported that the osmolarity of Spirulina was significantly improved by the addition of glucose. Moreover, the results of current study are in line with Mata et al. [27], who reported an improved biomass productivity of Spirulina in mixotrophic conditions (1 g/L glucose) with a reduced NaCl content.
Spirulina cultivation can be an alternative method to produce proteins for food or feed industries; thus, the protein content is an important factor when considering the nutritional value of Spirulina [76]. At phototrophic conditions with a normal NaCl content (1 g/L), the highest protein content was obtained under YL (64%), and the protein content under RL (44%) was higher than under WL (31%). The higher protein content under YL probably is the result of the higher phycocyanin content and stable pH conditions achieved at this parameter combination. Furthermore, our results also confirm the hypothesis that the protein level in Spirulina is favored by slow growth [77]. Only few studies have been carried out addressing the effect of light color on the protein content of Spirulina. For instance, Ravelonandro et al. [61] observed a higher protein content under white compared to green, red, and blue light, respectively. In Milia et al. [78], the protein content of Spirulina was higher under blue and white fluorescent light compared to orange light in the studies by Markou [11] and da Fontoura Prates et al. [10], and the protein productivity under red or red and green LEDs was higher than under white LEDs. However, the spectral conditions of the light sources were not presented by the authors, which makes it difficult to interpret and compare the results.
According to RSM prediction, the highest cellular protein levels will be achieved under YL (62.57%), and then in WL (46.43%), both under 6.57 g/L NaCl and 2.50 g/L glucose. Under RL, the highest protein level (45.53%) will be achieved under 3.99 g/L NaCl and 1.59 g/L glucose. The lowest protein levels will be achieved under RL (19.70%) with 26.19 g/L NaCl and 2.40 g/L glucose, then in YL (21.41%) under 24.76 g/L NaCl and 1.31 g/L glucose, and in WL (25.59%) under 26.92 g/L NaCl and 2.50 g/L glucose.
The results of this study are in agreement with other studies [64,65,79,80]. Under stress, microalgae undergo significant metabolic and physiological changes, yielding an increase of cellular lipids, carbohydrates, carotenoids, and antioxidant enzymes [81]. Crucial alterations occur in the Spirulina proteome under salinity stress, yielding a reduction in the cellular protein content [82]. Previous studies have demonstrated the complete blockage of protein synthesis alongside carbohydrate incensement in cyanobacteria after salt stress [83,84]. According to Vonshak [54], in the presence of 0.5 mol/L (29.3 g/L) NaCl in the medium, the carbohydrate content of Spirulina biomass reached up to 64.4%. Similarly, Mary Leema et al. [85] reported a 79 % increase in the carbohydrate content of the biomass when Spirulina was cultivated in pre-treated seawater. Accordingly, the protein reduction observed in our study might be related to both an increase in carbohydrate and lipid production, and the suppression of protein synthesis.
In phototrophic conditions G (0 g/L) and normal S (1 g/L), the highest phycocyanin content was achieved under YL (114 mg/g), and the phycocyanin content under WL (87 mg/g) was higher than RL (63 mg/g). According to the model prediction, the highest phycocyanin content will be achieved under YL (113.20 mg/g), followed by WL (85.90 mg/g), both under 1 g/L NaCl without glucose. Under RL, the highest phycocyanin (69.5 mg/g) will be achieved under 30 g/L NaCl without glucose. The lowest phycocyanin contents will be achieved under RL (53.29 mg/g) exposed to 1 g/L NaCl and 2.5 g/L glucose, then in YL (67.30 mg/g), and WL (67.95 mg/g), both under 30 g/L NaCl and 2.5 g/L glucose.
Phycobilisomes, the main light-harvesting complexes in cyanobacteria, are strongly influenced by environmental changes [86]. Light is the main environmental parameter that affects the overall growth rate for photoautotrophic microorganisms [87]. The two main pigments of Spirulina are chlorophyll a, with an absorption peak of 429 and 662 nm [88], and phycocyanin, with an absorption peak of 620 nm [57], depending on the relative light emitted from each panel (Figure 1). The light emitted by the RL panel shows a better overlap with chlorophyll a absorption, whereas the YL panel shows a better overlap with the phycocyanin absorption range. Therefore, this spectral fitting of the light source and photosynthetic pigment absorption might be responsible for the increased phycocyanin content using YL. These results are in accordance with Bachchhav et al. [34], who investigated the phycocyanin content of Spirulina under different LED colors, and found an increase in the phycocyanin content in cells exposed to yellow LED light. Tayebati et al. [60] found the highest phycocyanin content under monochromatic red LED light (with 660 nm peak), which was higher than white, yellow (with 590 nm peak), and blue light conditions. Milia et al. [78], investigated the effect of white, orange, and blue light treatment on the phycocyanin content of A. platensis M, A. platensis M2M, and A. maxima, indicating that various Spirulina strains show different responses in the cellular phycocyanin content towards changing light color conditions.
In this study, we found that mixotrophic cultivation had a significant negative effect on the phycocyanin content, but the effect of high salinity was even higher. Phycocyanin is an accessory pigment, and photosynthesis is essential for phycocyanin biosynthesis [39]. Glucose is an effective substrate for respiration that can inhibit the photosynthetic processes [89]. Consequently, during mixotrophic cultivation, the metabolism may switch between phototrophic or heterotrophic [90]. Chen and Zhang [90] reported a constant phycocyanin content during phototrophic cultivation. In contrast, with a mixotrophic culture, the phycocyanin content was affected by the glucose concentration and cell intensity, in which mutual shading and photolimitation occurs in dense cultures. Indeed, at high glucose concentrations (more than 1 g/L) or high cell densities, Spirulina tends towards a heterotrophic metabolism, and the phycocyanin content decreases rapidly [90,91]. In contrast, Bachchhav et al. [34] reported a higher phycocyanin content under mixotrophic conditions using a low initial glucose concentration of 1 g/L, which could lead to the metabolization of glucose at an early stage in the experiment. Chainapong et al. [36] detected a similar phycocyanin content in mixotrophic conditions under yellow and red light, probably due to the use of filtered sunlight resulting in spectral overlaps in light colors.
When the amount of NaCl was increased, the mean cellular phycocyanin concentration decreased under WL (−10% in 15 g/L NaCl to −20% in 30 g/L NaCl) and YL (−10% in 15 g/L NaCl to −30% g/L NaCl), respectively, but it increased under RL (+8.6% in 15 g/L NaCl to +10% in 30 g/L NaCl). The reduction in the phycocyanin content at high salinities has been confirmed in many previous studies [19,80,92]. According to Rafiqul et al. [64], the phycocyanin content of Spirulina decreased, whereas the carotenoid and lipid content increased under salt stress conditions. Lu and Vonshak [93] reported that the amount of chlorophyll remained stable, whereas the amount of phycocyanin decreased to 50% of control treatment when Spirulina was exposed to 46.75 g/L sodium chloride for 12 h.
3.3. Optimization and RSM Validation
In order to validate the predictive power of the RSM models, experiments were performed using the predicted optimum conditions of glucose concentration and salinity for each of the spectral lighting conditions.
The predicted and measured parameters under optimized variable conditions are shown in Table 5. The goal of this study was to find the best-balanced growth conditions for both a high quantitative biomass productivity and a high-quality biomass composition, represented by a high cellular protein and phycocyanin content. The optimized process parameter configurations which were suggested by the RSM model are YL using 1.00 g/L NaCl and 0.88 g/L glucose, WL using 5.30 g/L NaCl and 2.46 g/L glucose, and RL at 9.10 g/L NaCl and 1.30 g/L glucose.
Table 5.
Predicted and experimentally determined number of responses under optimized variable conditions.
Biomass concentration and protein content were close to the predicted values; however, the cellular phycocyanin contents under WL and RL were higher than the predicted response. As observed in this study, the phycocyanin content is a highly dynamic parameter compared to the biomass concentration and protein content. For a more accurate prediction of phycocyanin content, more variables would need to be added to the RSM model, such as the initial phycocyanin concentration and the culture medium pH.
4. Conclusions
In this study, the authors intended to optimize Spirulina batch cultivation by balancing the process parameters of light color, salinity, and glucose concentration in order to produce a high quantity of biomass (productivity) with a high quality (maximum protein and phycocyanin contents). By developing a screening system that allows 24 parallel cultivations under homogeneous light conditions, and a fine-tuned analysis for small sample volumes (especially protein and phycocyanin content), it was possible, for the first time, to identify the impact of single factors, as well as combinatorial effects, on product quantity and quality. RSM proved to be a powerful tool for model prediction under varying spectral light conditions (RL, WL, YL), modes of trophic growth (phototrophic vs. mixotrophic), and salinities. The RSM models obtained are useful for developing Spirulina production in photobioreactors with artificial light, and optimizing the growing conditions for the phototrophic or mixotrophic cultivation of Spirulina with brackish and saline water supplies.
All the experimental variables in the cultivation of Spirulina had an effect on the biomass concentration and phycocyanin content, but glucose did not have a significant effect on the protein content. WL led to the highest biomass concentration after three days of cultivation, but higher protein and phycocyanin contents were achieved under YL light. A mixotrophic culture increased the biomass concentration, whereas increasing salinity decreased the biomass, phycocyanin, and protein contents. The main hypothesis of this study was that Spirulina production could be increased by combining LEDs with yellow light predominance under optimal mixotrophic and salinity conditions. Although the highest level of biomass production was observed in predominantly red light, quality indicators were higher in algae produced with yellow light. Consequently, in line with the optimized conditions, we recommend using YL1.00S0.88G, WL5.30S2.46G, and RL9.10S1.30G, respectively, to produce the highest level of biomass with the highest quality.
For further studies, it is recommended to use the spectral composition of light panels instead of the number ratio of LEDs. In addition, performing experiments in a pH-controlled system will have more accurate results, and larger scales in semi-batch or continuous cultures with commercial mediums are needed to bridge the gap between laboratory results to industrial use.
Author Contributions
Conceptualization, A.N. and A.E.F.; methodology, A.N., A.E.F. and F.K.; software, A.N.; investigation, A.N.; data curation, A.N.; writing—original draft preparation, A.N.; writing—review and editing, A.E.F. and F.K.; supervision, A.E.F. and F.K.; project administration, A.N. All authors have read and agreed to the published version of the manuscript.
Funding
This research was funded by the German Research Foundation (DFG; grant no. KR 5050/2−1).
Institutional Review Board Statement
Not applicable.
Informed Consent Statement
Not applicable.
Data Availability Statement
Raw data of this research are available by contacting the authors.
Acknowledgments
The authors would like to thank Thomas Walther for hosting this experiment and for donations. Furthermore, we wish to express our appreciation to Christoph Otto for the technical support and contribution in the design of the light panels.
Conflicts of Interest
The authors declare no conflict of interest.
References
- De Mejia, E.G.; Zhang, Q.; Penta, K.; Eroglu, A.; Lila, M.A. The Colors of Health: Chemistry, Bioactivity, and Market Demand for Colorful Foods and Natural Food Sources of Colorants. Annu. Rev. Food Sci. Technol. 2020, 11, 145–182. [Google Scholar] [CrossRef] [PubMed]
- Doppler, P.; Kornpointner, C.; Halbwirth, H.; Remias, D.; Spadiut, O. Tetraedron Minimum, First Reported Member of Hydrodictyaceae to Accumulate Secondary Carotenoids. Life 2021, 11, 107. [Google Scholar] [CrossRef] [PubMed]
- Moncada, J.; Cardona, C.A.; Rincón, L.E. Design and Analysis of a Second and Third Generation Biorefinery: The Case of Castorbean and Microalgae. Bioresour. Technol. 2015, 198, 836–843. [Google Scholar] [CrossRef] [PubMed]
- Ciferri, O.; Tiboni, O. The Biochemistry and Industrial Potential of Spirulina. Annu. Rev. Microbiol. 1985, 39, 503–526. [Google Scholar] [CrossRef]
- Shimamatsu, H. Mass Production of Spirulina, an Edible Microalga. Hydrobiologia 2004, 512, 39–44. [Google Scholar] [CrossRef]
- Carcea, M.; Sorto, M.; Batello, C.; Narducci, V.; Aguzzi, A.; Azzini, E.; Fantauzzi, P.; Finotti, E.; Gabrielli, P.; Galli, V.; et al. Nutritional Characterization of Traditional and Improved Dihé, Alimentary Blue-Green Algae from the Lake Chad Region in Africa. LWT Food Sci. Technol. 2015, 62, 753–763. [Google Scholar] [CrossRef]
- Mahajan, G.; Kamat, M. γ-Linolenic Acid Production from Spirulina platensis. Appl. Microbiol. Biotechnol. 1995, 43, 466–469. [Google Scholar] [CrossRef]
- Braune, S.; Krüger-Genge, A.; Kammerer, S.; Jung, F.; Küpper, J.-H. Phycocyanin from Arthrospira platensis as Potential Anti-Cancer Drug: Review of In Vitro and In Vivo Studies. Life 2021, 11, 91. [Google Scholar] [CrossRef]
- Colla, L.M.; Reinehr, C.O.; Reichert, C.; Costa, J.A.V. Production of Biomass and Nutraceutical Compounds by Spirulina Platensis under Different Temperature and Nitrogen Regimes. Bioresour. Technol. 2007, 98, 1489–1493. [Google Scholar] [CrossRef]
- Da Fontoura Prates, D.; Duarte, J.H.; Vendruscolo, R.G.; Wagner, R.; Ballus, C.A.; da Silva Oliveira, W.; Godoy, H.T.; Barcia, M.T.; de Morais, M.G.; Radmann, E.M.; et al. Role of Light Emitting Diode (LED) Wavelengths on Increase of Protein Productivity and Free Amino Acid Profile of Spirulina sp. Cultures. Bioresour. Technol. 2020, 306, 123184. [Google Scholar] [CrossRef]
- Markou, G. Effect of Various Colors of Light-Emitting Diodes (LEDs) on the Biomass Composition of Arthrospira platensis Cultivated in Semi-Continuous Mode. Appl. Biochem. Biotechnol. 2014, 172, 2758–2768. [Google Scholar] [CrossRef] [PubMed]
- Chojnacka, K.; Zielińska, A. Evaluation of Growth Yield of Spirulina (Arthrospira) sp. in Photoautotrophic, Heterotrophic and Mixotrophic Cultures. World J. Microbiol. Biotechnol. 2012, 28, 437–445. [Google Scholar] [CrossRef] [PubMed]
- Buso, D.; Zissis, G.; Prudhomme, T. Influence of Light Intensity and Photoperiod on Energy Efficiency of Biomass and Pigment Production of Spirulina (Arthrospira platensis). OCL 2021, 28, 37. [Google Scholar] [CrossRef]
- Chaiklahan, R.; Chirasuwan, N.; Srinorasing, T.; Attasat, S.; Nopharatana, A.; Bunnag, B. Enhanced Biomass and Phycocyanin Production of Arthrospira (Spirulina) Platensis by a Cultivation Management Strategy: Light Intensity and Cell Concentration. Bioresour. Technol. 2022, 343, 126077. [Google Scholar] [CrossRef] [PubMed]
- Li, X.; Li, W.; Zhai, J.; Wei, H. Effect of Nitrogen Limitation on Biochemical Composition and Photosynthetic Performance for Fed-Batch Mixotrophic Cultivation of Microalga Spirulina platensis. Bioresour. Technol. 2018, 263, 555–561. [Google Scholar] [CrossRef]
- Jung, C.H.; Braune, S.; Waldeck, P.; Küpper, J.-H.; Petrick, I.; Jung, F. Morphology and Growth of Arthrospira platensis during Cultivation in a Flat-Type Bioreactor. Life 2021, 11, 536. [Google Scholar] [CrossRef] [PubMed]
- Marquez, F.J.; Sasaki, K.; Kakizono, T.; Nishio, N.; Nagai, S. Growth Characteristics of Spirulina platensis in Mixotrophic and Heterotrophic Conditions. J. Ferment. Bioeng. 1993, 76, 408–410. [Google Scholar] [CrossRef]
- Marquez, F.J.; Nishio, N.; Nagai, S.; Sasaki, K. Enhancement of Biomass and Pigment Production during Growth of Spirulina platensis in Mixotrophic Culture. J. Chem. Technol. Biotechnol. 1995, 62, 159–164. [Google Scholar] [CrossRef]
- Mutawie, H. Growth and Metabolic Response of the Filamentous Cyanobacterium Spirulina platensis to Salinity Stress of Sodium Chloride. Life Sci. J. 2015, 12, 71–78. [Google Scholar]
- Intarasirisawat, R.; Benjakul, S.; Wu, J.; Visessanguan, W. Isolation of Antioxidative and ACE Inhibitory Peptides from Protein Hydrolysate of Skipjack (Katsuwana pelamis) Roe. J. Funct. Foods 2013, 5, 1854–1862. [Google Scholar] [CrossRef]
- Rocha, J.M.S.; Garcia, J.E.C.; Henriques, M.H.F. Growth Aspects of the Marine Microalga Nannochloropsis gaditana. Biomol. Eng. 2003, 20, 237–242. [Google Scholar] [CrossRef]
- Bartley, M.L.; Boeing, W.J.; Dungan, B.N.; Holguin, F.O.; Schaub, T. PH Effects on Growth and Lipid Accumulation of the Biofuel Microalgae Nannochloropsis salina and Invading Organisms. J. Appl. Phycol. 2014, 26, 1431–1437. [Google Scholar] [CrossRef]
- Kebede, E. Response of Spirulina Platensis (=Arthrospira fusiformis) from Lake Chitu, Ethiopia, to Salinity Stress from Sodium Salts. J. Appl. Phycol. 1997, 9, 551–558. [Google Scholar] [CrossRef]
- Zeng, M.T.; Vonshak, A. Adaptation of Spirulina platensis to Salinity-Stress. Comp. Biochem. Physiol. A Mol. Integr. Physiol. 1998, 120, 113–118. [Google Scholar] [CrossRef]
- Lu, C.; Torzillo, G.; Vonshak, A. Kinetic Response of Photosystem II Photochemistry in the Cyanobacterium Spirulina platensis to High Salinity Is Characterized by Two Distinct Phases. Aust. J. Plant Physiol. 1999, 26, 283–292. [Google Scholar] [CrossRef]
- Lu, C.; Zhang, J. Role of Light in the Response of PSII Photochemistry to Salt Stress in the Cyanobacterium Spirulina platensis. J. Exp. Bot. 2000, 51, 911–917. [Google Scholar] [CrossRef]
- Mata, T.M.; Martins, A.A.; Oliveira, O.; Oliveira, S.; Mendes, A.M.; Caetano, N.S. Lipid Content and Productivity of Arthrospira platensis and Chlorella vulgaris under Mixotrophic Conditions and Salinity Stress. Chem. Eng. Trans. 2016, 49, 187–192. [Google Scholar] [CrossRef]
- Schulze, P.S.C.; Barreira, L.A.; Pereira, H.G.C.; Perales, J.A.; Varela, J.C.S. Light Emitting Diodes (LEDs) Applied to Microalgal Production. Trends Biotechnol. 2014, 32, 422–430. [Google Scholar] [CrossRef]
- Wang, S.K.; Stiles, A.R.; Guo, C.; Liu, C.Z. Microalgae Cultivation in Photobioreactors: An Overview of Light Characteristics. Eng. Life Sci. 2014, 14, 550–559. [Google Scholar] [CrossRef]
- Tian, F.; Buso, D.; Wang, T.; Lopes, M.; Niangoran, U.; Zissis, G. Effect of Red and Blue LEDs on the Production of Phycocyanin by Spirulina platensis Based on Photosynthetically Active Radiation. J. Sci. Technol. Lighting 2018, 41, 148–152. [Google Scholar] [CrossRef]
- Olle, M.; Viršile, A. The Effects of Light-Emitting Diode Lighting on Greenhouse Plant Growth and Quality. Agric. Food Sci. 2013, 22, 223–234. [Google Scholar] [CrossRef]
- Wang, C.Y.; Fu, C.C.; Liu, Y.C. Effects of Using Light-Emitting Diodes on the Cultivation of Spirulina platensis. Biochem. Eng. J. 2007, 37, 21–25. [Google Scholar] [CrossRef]
- Chen, H.B.; Wu, J.Y.; Wang, C.F.; Fu, C.C.; Shieh, C.J.; Chen, C.I.; Wang, C.Y.; Liu, Y.C. Modeling on Chlorophyll a and Phycocyanin Production by Spirulina platensis under Various Light-Emitting Diodes. Biochem. Eng. J. 2010, 53, 52–56. [Google Scholar] [CrossRef]
- Bachchhav, M.B.; Kulkarni, M.V.; Ingale, A.G. Enhanced Phycocyanin Production from Spirulina platensis Using Light Emitting Diode. J. Inst. Eng. India Ser. E 2017, 98, 41–45. [Google Scholar] [CrossRef]
- Jao, C.L.; Ko, W.C. 1,1-Diphenyl-2-Picrylhydrazyl (DPPH) Radical Scavenging by Protein Hydrolyzates from Tuna Cooking Juice. Fish. Sci. 2002, 68, 430–435. [Google Scholar] [CrossRef]
- Chainapong, T.; Traichaiyaporn, S.; Deming, R.L. Effect of Light Quality on Biomass and Pigment Production in Photoautotrophic and Mixotrophic Cultures of Spirulina platensis. J. Agric. Technol. 2012, 8, 1593–1604. [Google Scholar]
- Mao, R.; Guo, S. Performance of the Mixed LED Light Quality on the Growth and Energy Efficiency of Arthrospira platensis. Appl. Microbiol. Biotechnol. 2018, 102, 5245–5254. [Google Scholar] [CrossRef]
- Walter, A.; de Carvalho, J.C.; Soccol, V.T.; de Faria, A.B.B.; Ghiggi, V.; Soccol, C.R. Study of Phycocyanin Production from Spirulina platensis under Different Light Spectra. Braz. Arch. Biol. Technol. 2011, 54, 675–682. [Google Scholar] [CrossRef]
- Chen, F.; Zhang, Y.; Guo, S. Growth and Phycocyanin Formation of Spirulina platensis in Photoheterotrophic Culture. Biotechnol. Lett. 1996, 18, 603–608. [Google Scholar] [CrossRef]
- Shi, W.Q.; Li, S.D.; Li, G.R.; Wang, W.H.; Chen, Q.X.; Li, Y.Q.; Ling, X.W. Investigation of Main Factors Affecting the Growth Rate of Spirulina. Optik 2016, 127, 6688–6694. [Google Scholar] [CrossRef]
- Zahri, K.N.M.; Zulkharnain, A.; Gomez-Fuentes, C.; Sabri, S.; Abdul Khalil, K.; Convey, P.; Ahmad, S.A. The Use of Response Surface Methodology as a Statistical Tool for the Optimisation of Waste and Pure Canola Oil Biodegradation by Antarctic Soil Bacteria. Life 2021, 11, 456. [Google Scholar] [CrossRef] [PubMed]
- Galan, J.; Trilleras, J.; Zapata, P.A.; Arana, V.A.; Grande-Tovar, C.D. Optimization of Chitosan Glutaraldehyde-Crosslinked Beads for Reactive Blue 4 Anionic Dye Removal Using a Surface Response Methodology. Life 2021, 11, 85. [Google Scholar] [CrossRef] [PubMed]
- Breig, S.J.M.; Luti, K.J.K. Response Surface Methodology: A Review on Its Applications and Challenges in Microbial Cultures. Mater. Today Proc. 2021, 42, 2277–2284. [Google Scholar] [CrossRef]
- Karimifard, S.; Moghaddam, M.R.A. Application of Response Surface Methodology in Physicochemical Removal of Dyes from Wastewater: A Critical Review. Sci. Total Environ. 2018, 640, 772–797. [Google Scholar] [CrossRef] [PubMed]
- Li, L.; Zhong, X.; Zheng, Y.; Guo, S.; Shi, X.; Huang, J. Enhancement of Biomass Production and Productivity of Arthrospira platensis GMPA7 Using Response Surface Monitoring Methodology and Turbidostatic Cultivation Strategy. J. Appl. Phycol. 2021, 33, 755–763. [Google Scholar] [CrossRef]
- Soreanu, G.; Cretescu, I.; Diaconu, M.; Cojocaru, C.; Ignat, M.; Samoila, P.; Harabagiu, V. Investigation of a Biosystem Based on Arthrospira platensis for Air Revitalisation in Spacecrafts: Performance Evaluation through Response Surface Methodology. Chemosphere 2021, 264, 128465. [Google Scholar] [CrossRef]
- Busnel, A.; Samhat, K.; Gérard, E.; Kazbar, A.; Marec, H.; Dechandol, E.; Le Gouic, B.; Hauser, J.-L.; Pruvost, J. Development and Validation of a Screening System for Characterizing and Modeling Biomass Production from Cyanobacteria and Microalgae: Application to Arthrospira platensis and Haematococcus Pluvialis. Algal Res. 2021, 58, 102386. [Google Scholar] [CrossRef]
- Benchikh, Y.; Filali, A.; Rebai, S. Modeling and Optimizing the Phycocyanins Extraction from Arthrospira platensis (Spirulina) Algae and Preliminary Supplementation Assays in Soft Beverage as Natural Colorants and Antioxidants. J. Food Process. Preserv. 2021, 45, e15170. [Google Scholar] [CrossRef]
- Hutner, S.H.; Provasoli, L.; Schatz, A.; Haskins, C.P. Some Approaches to the Study of the Role of Metals in the Metabolism of Microorganisms. Source Proc. Am. Philos. Soc. 1950, 94, 152–170. [Google Scholar]
- Vonshak, A.; Guy, R.; Guy, M. The Response of the Filamentous Cyanobacterium Spirulina platensis to Salt Stress. Arch. Microbiol. 1988, 150, 417–420. [Google Scholar] [CrossRef]
- Franke, S.; Steingröwer, J.; Walther, T.; Krujatz, F. The Oxygen Paradigm—Quantitative Impact of High Concentrations of Dissolved Oxygen on Kinetics and Large-Scale Production of Arthrospira platensis. ChemEngineering 2022, 6, 14. [Google Scholar] [CrossRef]
- Fan, X.; Hu, S.; Wang, K.; Yang, R.; Zhang, X. Coupling of Ultrasound and Subcritical Water for Peptides Production from Spirulina platensis. Food Bioprod. Process. 2020, 121, 105–112. [Google Scholar] [CrossRef]
- Slocombe, S.P.; Ross, M.; Thomas, N.; McNeill, S.; Stanley, M.S. A Rapid and General Method for Measurement of Protein in Micro-Algal Biomass. Bioresour. Technol. 2013, 129, 51–57. [Google Scholar] [CrossRef]
- Vonshak, A. Spirulina Platensis Arthrospira: Physiology, Cell-Biology and Biotechnology; CRC Press: Boca Raton, FL, USA, 1997. [Google Scholar]
- Fu, W.; Guomundsson, Ó.; Paglia, G.; Herjólfsson, G.; Andrésson, Ó.S.; Palsson, B.O.; Brynjólfsson, S. Enhancement of Carotenoid Biosynthesis in the Green Microalga Dunaliella salina with Light-Emitting Diodes and Adaptive Laboratory Evolution. Appl. Microbiol. Biotechnol. 2013, 97, 2395–2403. [Google Scholar] [CrossRef] [PubMed]
- Rakhimberdieva, M.G.; Boichenko, V.A.; Karapetyan, N.V.; Stadnichuk, I.N. Interaction of Phycobilisomes with Photosystem II Dimers and Photosystem I Monomers and Trimers in the Cyanobacterium Spirulina platensis. Biochemistry 2001, 40, 15780–15788. [Google Scholar] [CrossRef] [PubMed]
- Chen, H.W.; Yang, T.S.; Chen, M.J.; Chang, Y.C.; Wang, E.I.C.; Ho, C.L.; Lai, Y.J.; Yu, C.C.; Chou, J.C.; Chao, L.K.P.; et al. Purification and Immunomodulating Activity of C-Phycocyanin from Spirulina platensis Cultured Using Power Plant Flue Gas. Process Biochem. 2014, 49, 1337–1344. [Google Scholar] [CrossRef]
- Rivera, C.; Nino, L.; Gelves, G. Modeling of Phycocyanin Production from Spirulina Platensis Using Different Light-Emitting Diodes. S. Afr. J. Chem. Eng. 2021, 37, 167–178. [Google Scholar] [CrossRef]
- Szwarc, D.; Zieliński, M. Effect of Lighting on the Intensification of Phycocyanin Production in a Culture of Arthrospira platensis. Multidiscip. Digit. Publ. Inst. Proc. 2018, 2, 1305. [Google Scholar] [CrossRef]
- Tayebati, H.; Pajoum Shariati, F.; Soltani, N.; Sepasi Tehrani, H. Effect of Various Light Spectra on Amino Acids and Pigment Production of Arthrospira platensis Using Flat-Plate Photobioreactor. Prep. Biochem. Biotechnol. 2021, 1–12. [Google Scholar] [CrossRef]
- Ravelonandro, P.H.; Ratianarivo, D.H.; Joannis-Cassan, C.; Isambert, A.; Raherimandimby, M. Influence of Light Quality and Intensity in the Cultivation of Spirulina platensis from Toliara (Madagascar) in a Closed System. J. Chem. Technol. Biotechnol. 2008, 83, 842–848. [Google Scholar] [CrossRef]
- Park, J.; Dinh, T.B. Contrasting Effects of Monochromatic LED Lighting on Growth, Pigments and Photosynthesis in the Commercially Important Cyanobacterium Arthrospira Maxima. Bioresour. Technol. 2019, 291, 121846. [Google Scholar] [CrossRef] [PubMed]
- Zittelli, G.C.; Mugnai, G.; Milia, M.; Cicchi, B.; Benavides, A.S.; Angioni, A.; Addis, P.; Torzillo, G. Effects of Blue, Orange and White Lights on Growth, Chlorophyll Fluorescence, and Phycocyanin Production of Arthrospira platensis Cultures. Algal Res. 2022, 61, 102583. [Google Scholar] [CrossRef]
- Rafiqul, I.M.; Hassan, A.; Sulebele, G.; Orosco, C.A.; Roustaian, P.; Jalal, K.C.A. Salt Stress Culture of Blue-Green Algae Spirulina fusiformis. Pak. J. Biol. Sci. 2003, 6, 648–650. [Google Scholar] [CrossRef]
- Bezerra, P.Q.M.; Moraes, L.; Cardoso, L.G.; Druzian, J.I.; Morais, M.G.; Nunes, I.L.; Costa, J.A.V. Spirulina sp. LEB 18 Cultivation in Seawater and Reduced Nutrients: Bioprocess Strategy for Increasing Carbohydrates in Biomass. Bioresour. Technol. 2020, 316, 123883. [Google Scholar] [CrossRef] [PubMed]
- Çelekli, A.; Yavuzatmaca, M.; Bozkurt, H. Modeling of Biomass Production by Spirulina platensis as Function of Phosphate Concentrations and PH Regimes. Bioresour. Technol. 2009, 100, 3625–3629. [Google Scholar] [CrossRef]
- Warr, S.R.C.; Reed, R.H.; Chudek, J.A.; Foster, R.; Stewart, W.D.P. Osmotic Adjustment in Spirulina platensis. Planta 1985, 163, 424–429. [Google Scholar] [CrossRef]
- Lu, C.; Vonshak, A. Characterization of PSII Photochemistry in Salt-Adapted Cells of Cyanobacterium Spirulina platensis. New Phytol. 1999, 141, 231–239. [Google Scholar] [CrossRef]
- Sudhir, P.R.; Pogoryelov, D.; Kovács, L.; Garab, G.; Murthy, S.D.S. The Effects of Salt Stress on Photosynthetic Electron Transport and Thylakoid Membrane Proteins in the Cyanobacterium Spirulina platensis. J. Biochem. Mol. Biol. 2005, 38, 481–485. [Google Scholar] [CrossRef]
- Ben Dhiab, R.; Ben Ouada, H.; Boussetta, H.; Franck, F.; Elabed, A.; Brouers, M. Growth, Fluorescence, Photosynthetic O2 Production and Pigment Content of Salt Adapted Cultures of Arthrospira (Spirulina) Platensis. J. Appl. Phycol. 2007, 19, 293–301. [Google Scholar] [CrossRef]
- Vonshak, A.; Kancharaksa, N.; Bunnag, B.; Tanticharoen, M. Role of Light and Photosynthesis on the Acclimation Process of the Cyanobacterium Spirulina platensis to Salinity Stress. J. Appl. Phycol. 1996, 8, 119–124. [Google Scholar] [CrossRef]
- Richmond, A.; Grobbelaar, J.U. Factors Affecting the Output Rate of Spirulina platensis with Reference to Mass Cultivation. Biomass 1986, 10, 253–264. [Google Scholar] [CrossRef]
- Lodi, A.; Binaghi, L.; De Faveri, D.; Carvalho, J.C.M.; Converti, A.; Del Borghi, M. Fed-Batch Mixotrophic Cultivation of Arthrospira (Spirulina) Platensis (Cyanophycea) with Carbon Source Pulse Feeding. Ann. Microbiol. 2005, 55, 181–185. [Google Scholar]
- Chen, T.; Zheng, W.; Yang, F.; Bai, Y.; Wong, Y.S. Mixotrophic Culture of High Selenium-Enriched Spirulina platensis on Acetate and the Enhanced Production of Photosynthetic Pigments. Enzym. Microb. Technol. 2006, 39, 103–107. [Google Scholar] [CrossRef]
- Rasouli, Z.; Parsa, M.; Ahmadzadeh, H. Features of Spirulina platensis Cultivated Under Autotrophic and Mixotrophic Conditions. Food Sci. Technol. 2019, 12, 33–42. [Google Scholar] [CrossRef]
- Spolaore, P.; Joannis-Cassan, C.; Duran, E.; Isambert, A. Commercial Applications of Microalgae. J. Biosci. Bioeng. 2006, 101, 87–96. [Google Scholar] [CrossRef]
- Junique, L.; Watier, L.; Lejeune, H.; Viudes, F.; Deblieck, M.; Watier, D. Determination by Response Surface Methodology of Optimal Protein and Phycocyanin Productivity Conditions in Arthrospira (Spirulina) Platensis under Different Combinations of Photoperiod Variation and Lighting Intensity. Bioresour. Technol. Rep. 2021, 15, 100763. [Google Scholar] [CrossRef]
- Milia, M.; Corrias, F.; Addis, P.; Zitelli, G.C.; Cicchi, B.; Torzillo, G.; Andreotti, V.; Angioni, A. Influence of Different Light Sources on the Biochemical Composition of Arthrospira Spp. Grown in Model Systems. Foods 2022, 11, 399. [Google Scholar] [CrossRef]
- Ravelonandro, P.H.; Ratianarivo, D.H.; Joannis-Cassan, C.; Isambert, A.; Raherimandimby, M. Improvement of the Growth of Arthrospira (Spirulina) Platensis from Toliara (Madagascar): Effect of Agitation, Salinity and CO2 Addition. Food Bioprod. Process. 2011, 89, 209–216. [Google Scholar] [CrossRef]
- Chentir, I.; Doumandji, A.; Ammar, J.; Zili, F.; Jridi, M.; Markou, G.; Ben Ouada, H. Induced Change in Arthrospira sp. (Spirulina) Intracellular and Extracellular Metabolites Using Multifactor Stress Combination Approach. J. Appl. Phycol. 2018, 30, 1563–1574. [Google Scholar] [CrossRef]
- Elisabeth, B.; Rayen, F.; Behnam, T. Microalgae Culture Quality Indicators: A Review. Crit. Rev. Biotechnol. 2021, 41, 457–473. [Google Scholar] [CrossRef]
- Volkmann, H.; Imianovsky, U.; Oliveira, J.L.B.; Sant’Anna, E.S. Cultivation of Arthrospira (Spirulina) Platensis in Desalinator Wastewater and Salinated Synthetic Medium: Protein Content and Amino-Acid Profile. Braz. J. Microbiol. 2008, 39, 98–101. [Google Scholar] [CrossRef] [PubMed]
- Sheikh, T.A.; Baba, Z.A.; Sofi, P. Effect of NaCl on Growth and Physiological Traits of Anabena cylindrica L. Pak. J. Biol. Sci. 2006, 9, 2528–2530. [Google Scholar] [CrossRef][Green Version]
- Hagemann, M.; Wolfel, L.; Kruger, B. Alterations of Protein Synthesis in the Cyanobacterium Synechocystis sp. PCC 6803 after a Salt Shock. J. Gen. Microbiol. 1990, 136, 1393–1399. [Google Scholar] [CrossRef]
- Mary Leema, J.T.; Kirubagaran, R.; Vinithkumar, N.V.; Dheenan, P.S.; Karthikayulu, S. High Value Pigment Production from Arthrospira (Spirulina) Platensis Cultured in Seawater. Bioresour. Technol. 2010, 101, 9221–9227. [Google Scholar] [CrossRef]
- Grossman, A.R.; Schaefer, M.R.; Chiang, G.G.; Collier, J.L. Environmental Effects on the Light-Harvesting Complex of Cyanobacteria. J. Bacteriol. 1993, 175, 575–582. [Google Scholar] [CrossRef]
- Carvalho, A.P.; Malcata, F.X. Kinetic Modeling of the Autotrophic Growth of Pavlova lutheri: Study of the Combined Influence of Light and Temperature. Biotechnol. Prog. 2003, 19, 1128–1135. [Google Scholar] [CrossRef]
- Munawaroh, H.S.H.; Fathur, R.M.; Gumilar, G.; Aisyah, S.; Yuliani, G.; Mudzakir, A.; Wulandari, A.P. Characterization and physicochemical properties of chlorophyll extract from Spirulina sp. In Proceedings of the Journal of Physics: Conference Series, Medan, Indonesia, 19–20 July 2019; Volume 1280, p. 22013. [Google Scholar]
- Lewitus, A.J.; Kana, T.M. Responses of Estuarine Phytoplankton to Exogenous Glucose: Stimulation versus Inhibition of Photosynthesis and Respiration. Limnol. Oceanogr. 1994, 39, 182–189. [Google Scholar] [CrossRef]
- Chen, F.; Zhang, Y. High Cell Density Mixotrophic Culture of Spirulina platensis on Glucose for Phycocyanin Production Using a Fed-Batch System. Enzym. Microb. Technol. 1997, 20, 221–224. [Google Scholar] [CrossRef]
- Zhang, X.W.; Zhang, Y.M.; Chen, F. Application of Mathematical Models to the Determination Optimal Glucose Concentration and Light Intensity for Mixotrophic Culture of Spirulina platensis. Process Biochem. 1999, 34, 477–481. [Google Scholar] [CrossRef]
- Zhou, W.; Li, Y.; Gao, Y.; Zhao, H. Nutrients Removal and Recovery from Saline Wastewater by Spirulina platensis. Bioresour. Technol. 2017, 245, 10–17. [Google Scholar] [CrossRef]
- Lu, C.; Vonshak, A. Effects of Salinity Stress on Photosystem II Function in Cyanobacterial Spirulina platensis Cells. Physiol. Plant. 2002, 114, 405–413. [Google Scholar] [CrossRef] [PubMed]
Publisher’s Note: MDPI stays neutral with regard to jurisdictional claims in published maps and institutional affiliations. |
© 2022 by the authors. Licensee MDPI, Basel, Switzerland. This article is an open access article distributed under the terms and conditions of the Creative Commons Attribution (CC BY) license (https://creativecommons.org/licenses/by/4.0/).