
Ventilation-Associated Particulate Matter Is a Potential Reservoir of Multidrug-Resistant Organisms in Health Facilities

 ,
,
Abstract
1. Introduction
2. Materials and Methods
2.1. Sampling and PM Chemical Evaluation
2.2. Viruses Evaluation
2.3. Bacterial Evaluation
2.4. Fungi Evaluation
2.5. Statistical Analysis
3. Results
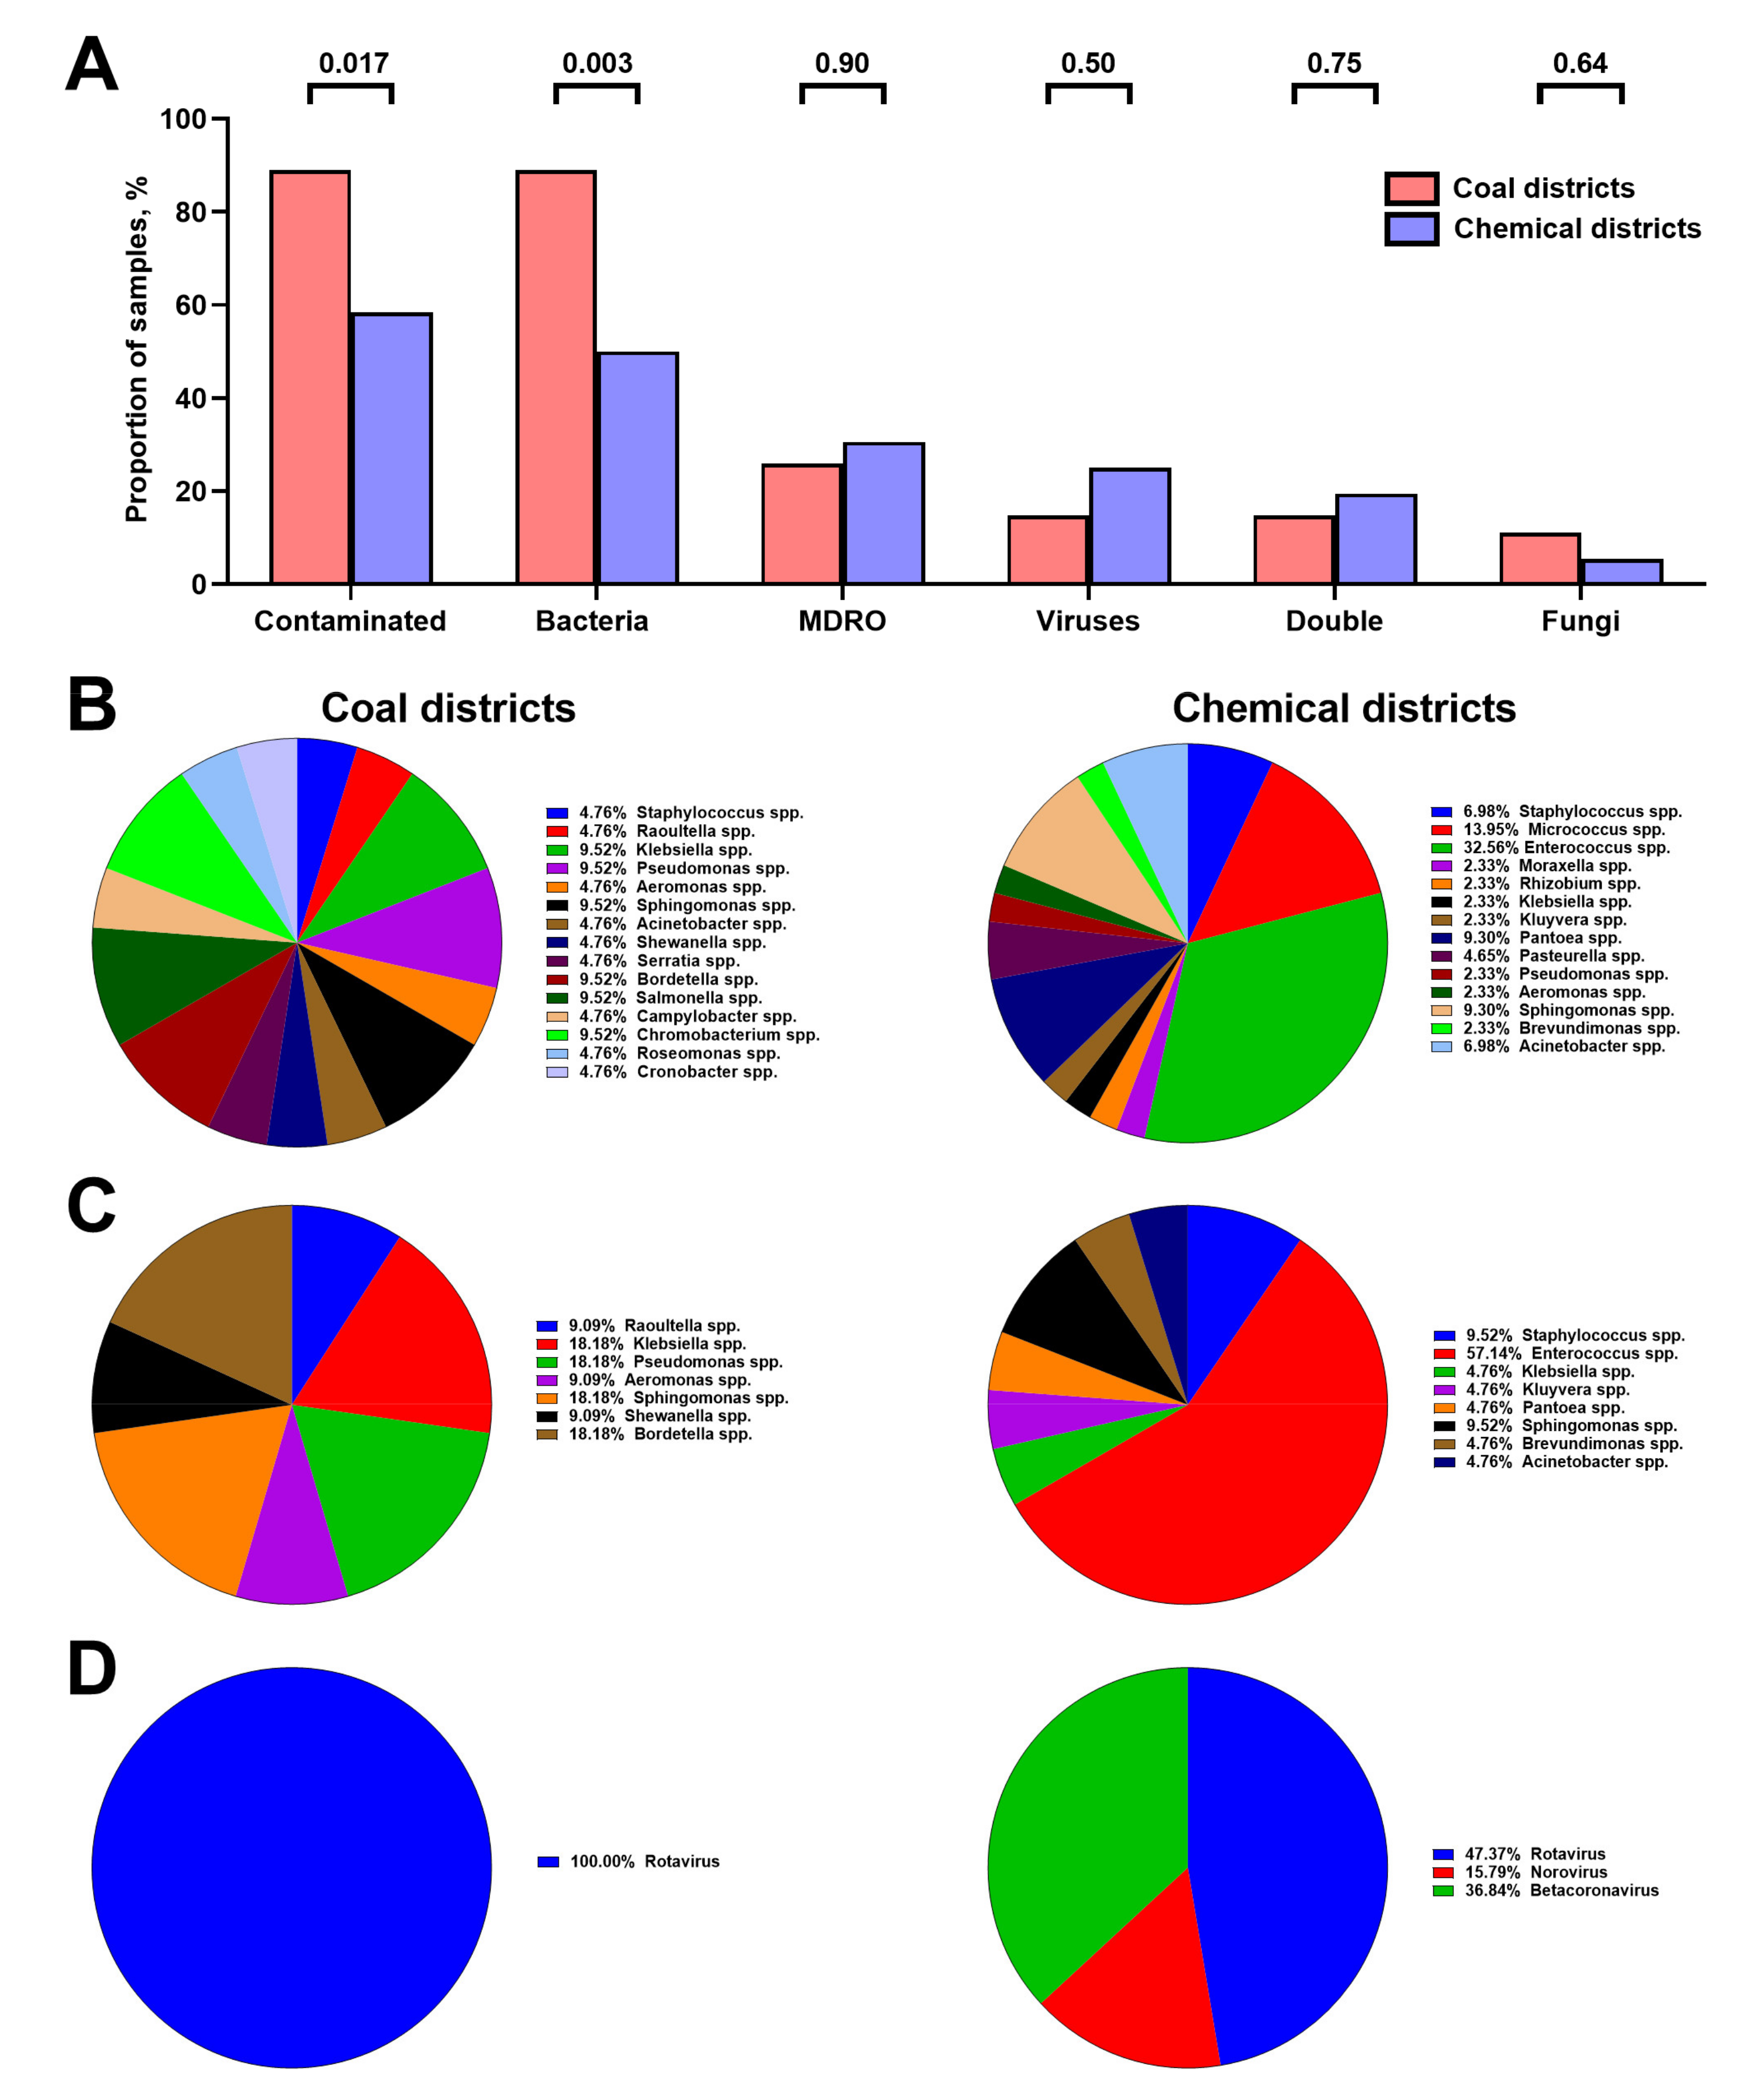
3.1. Chemical Composition of Hospital Vent-PM Is Environment-Dependent and Differs between Non-Surgical and Surgical Units but Not Elective and Intensive Care Units
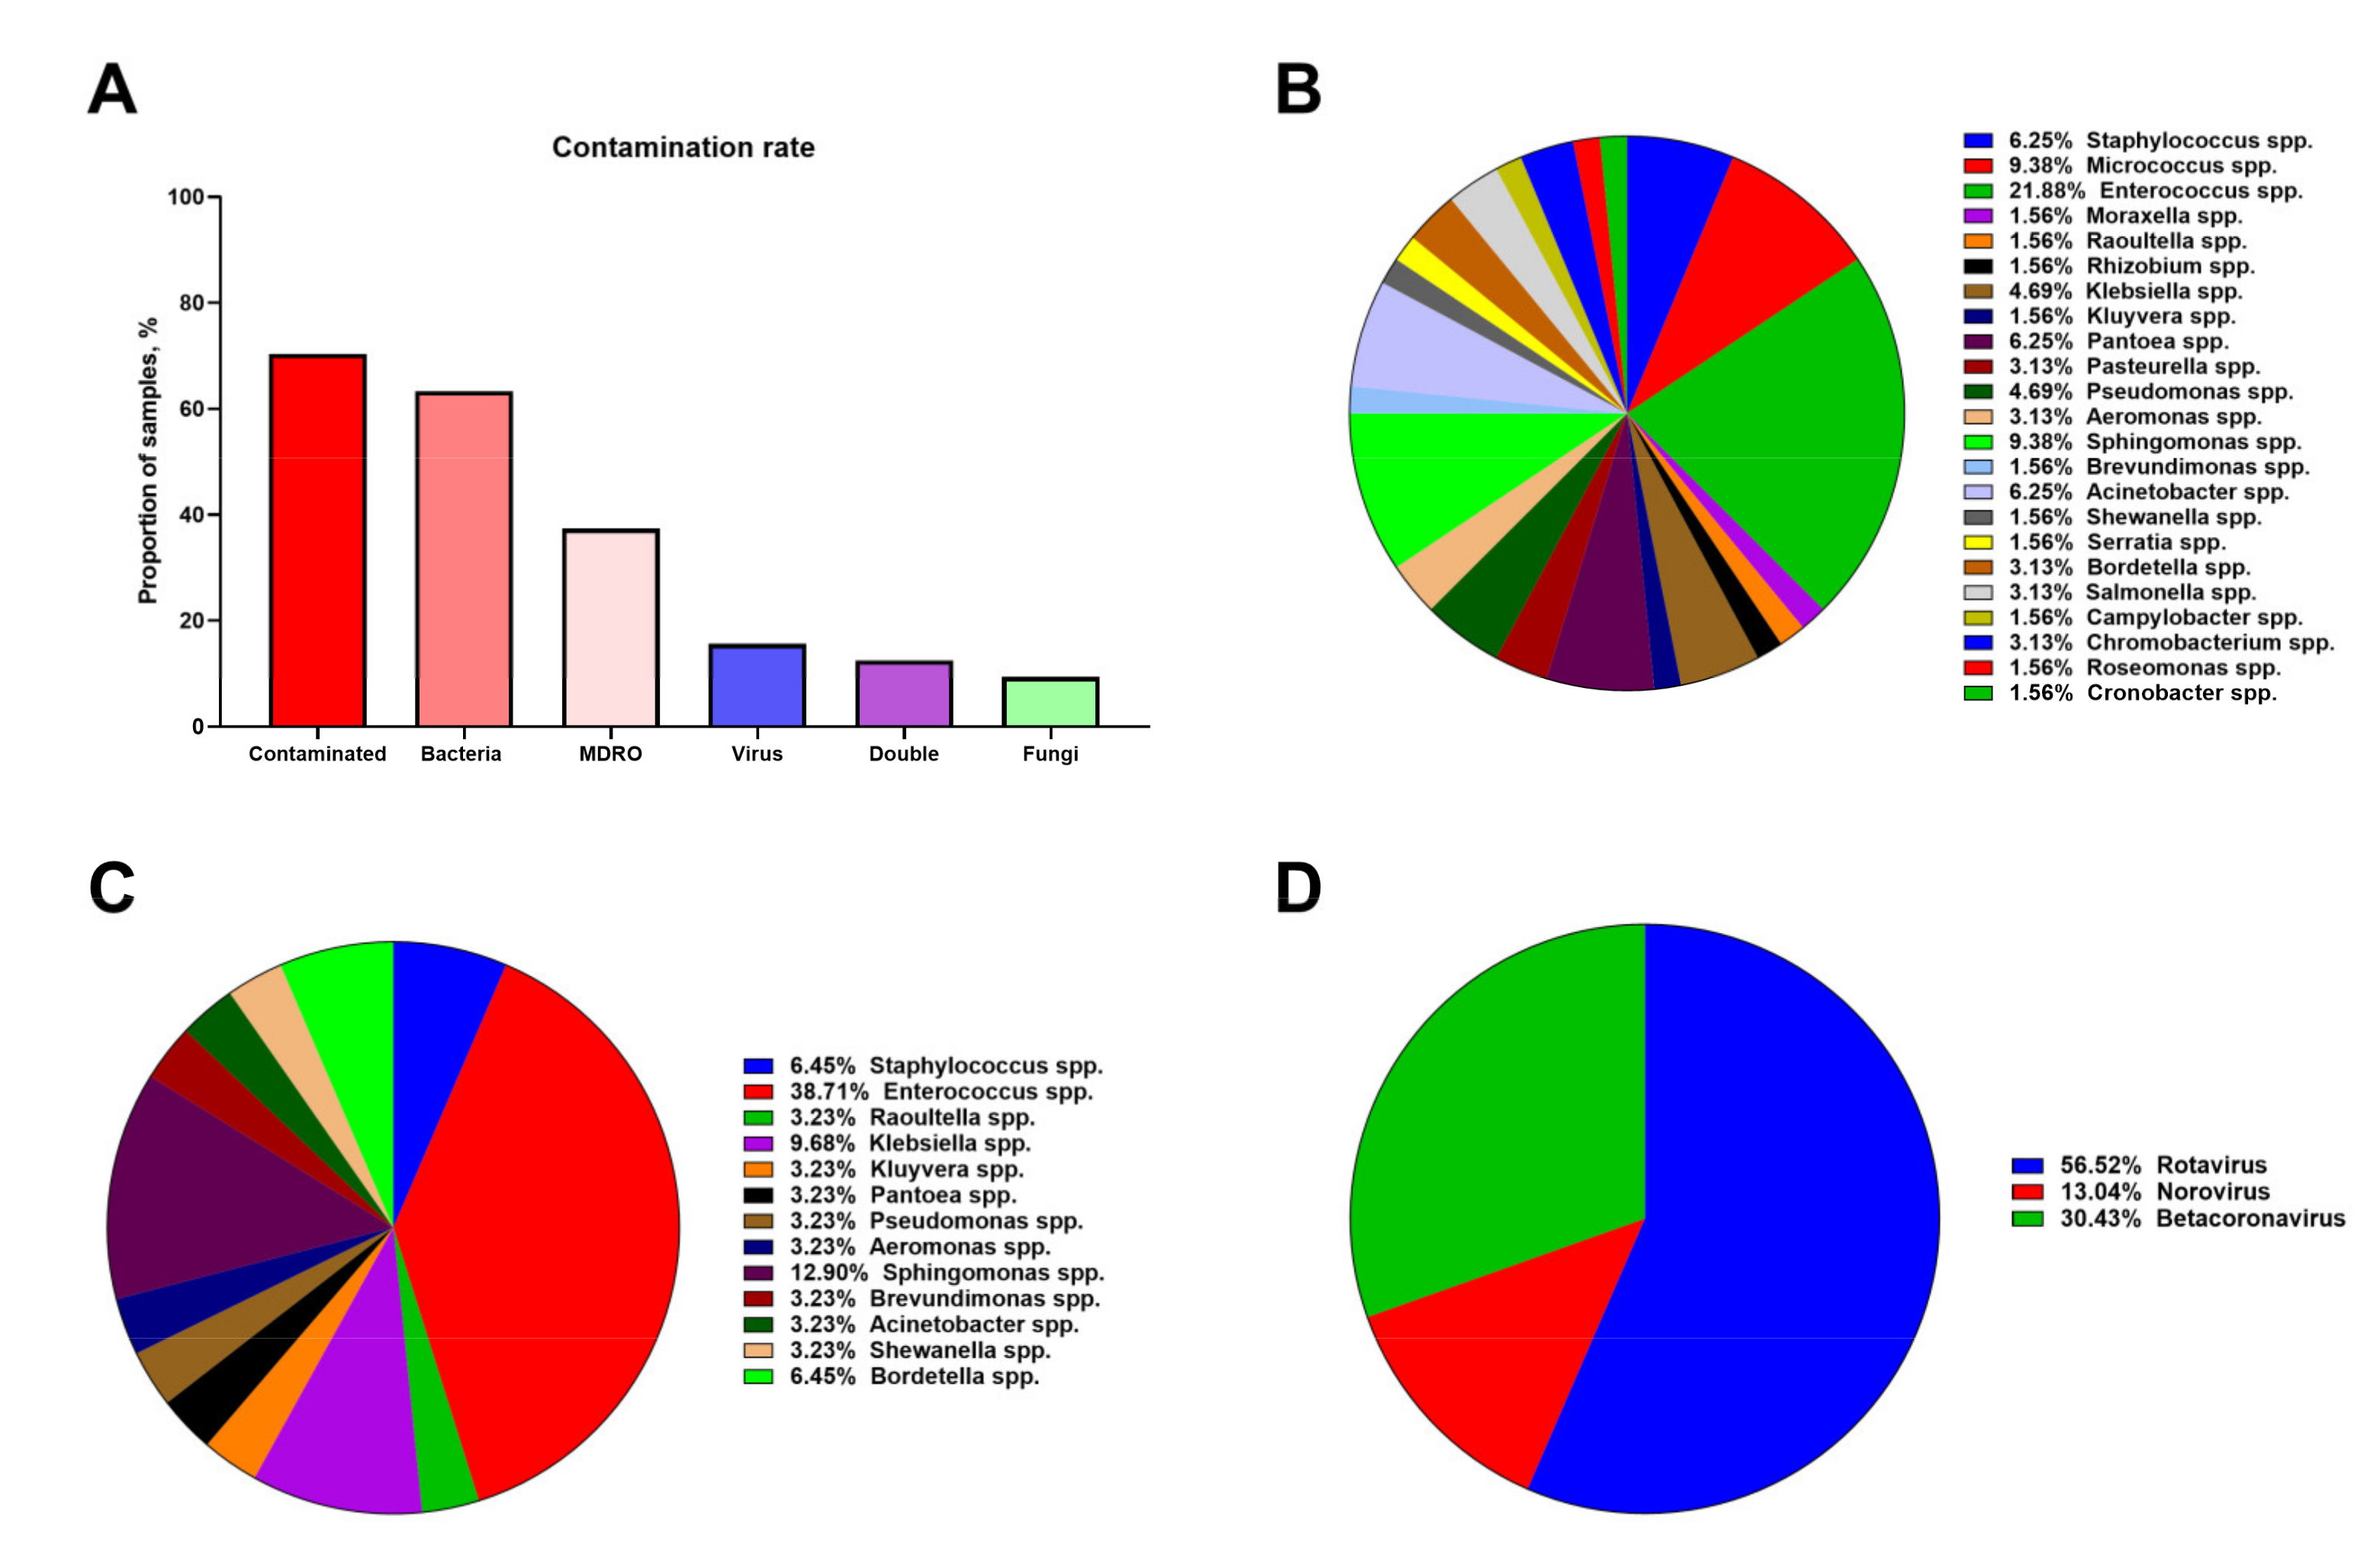
3.2. Hospital Vent-PM Is Frequently Contaminated by Multidrug-Resistant Organisms and Viruses
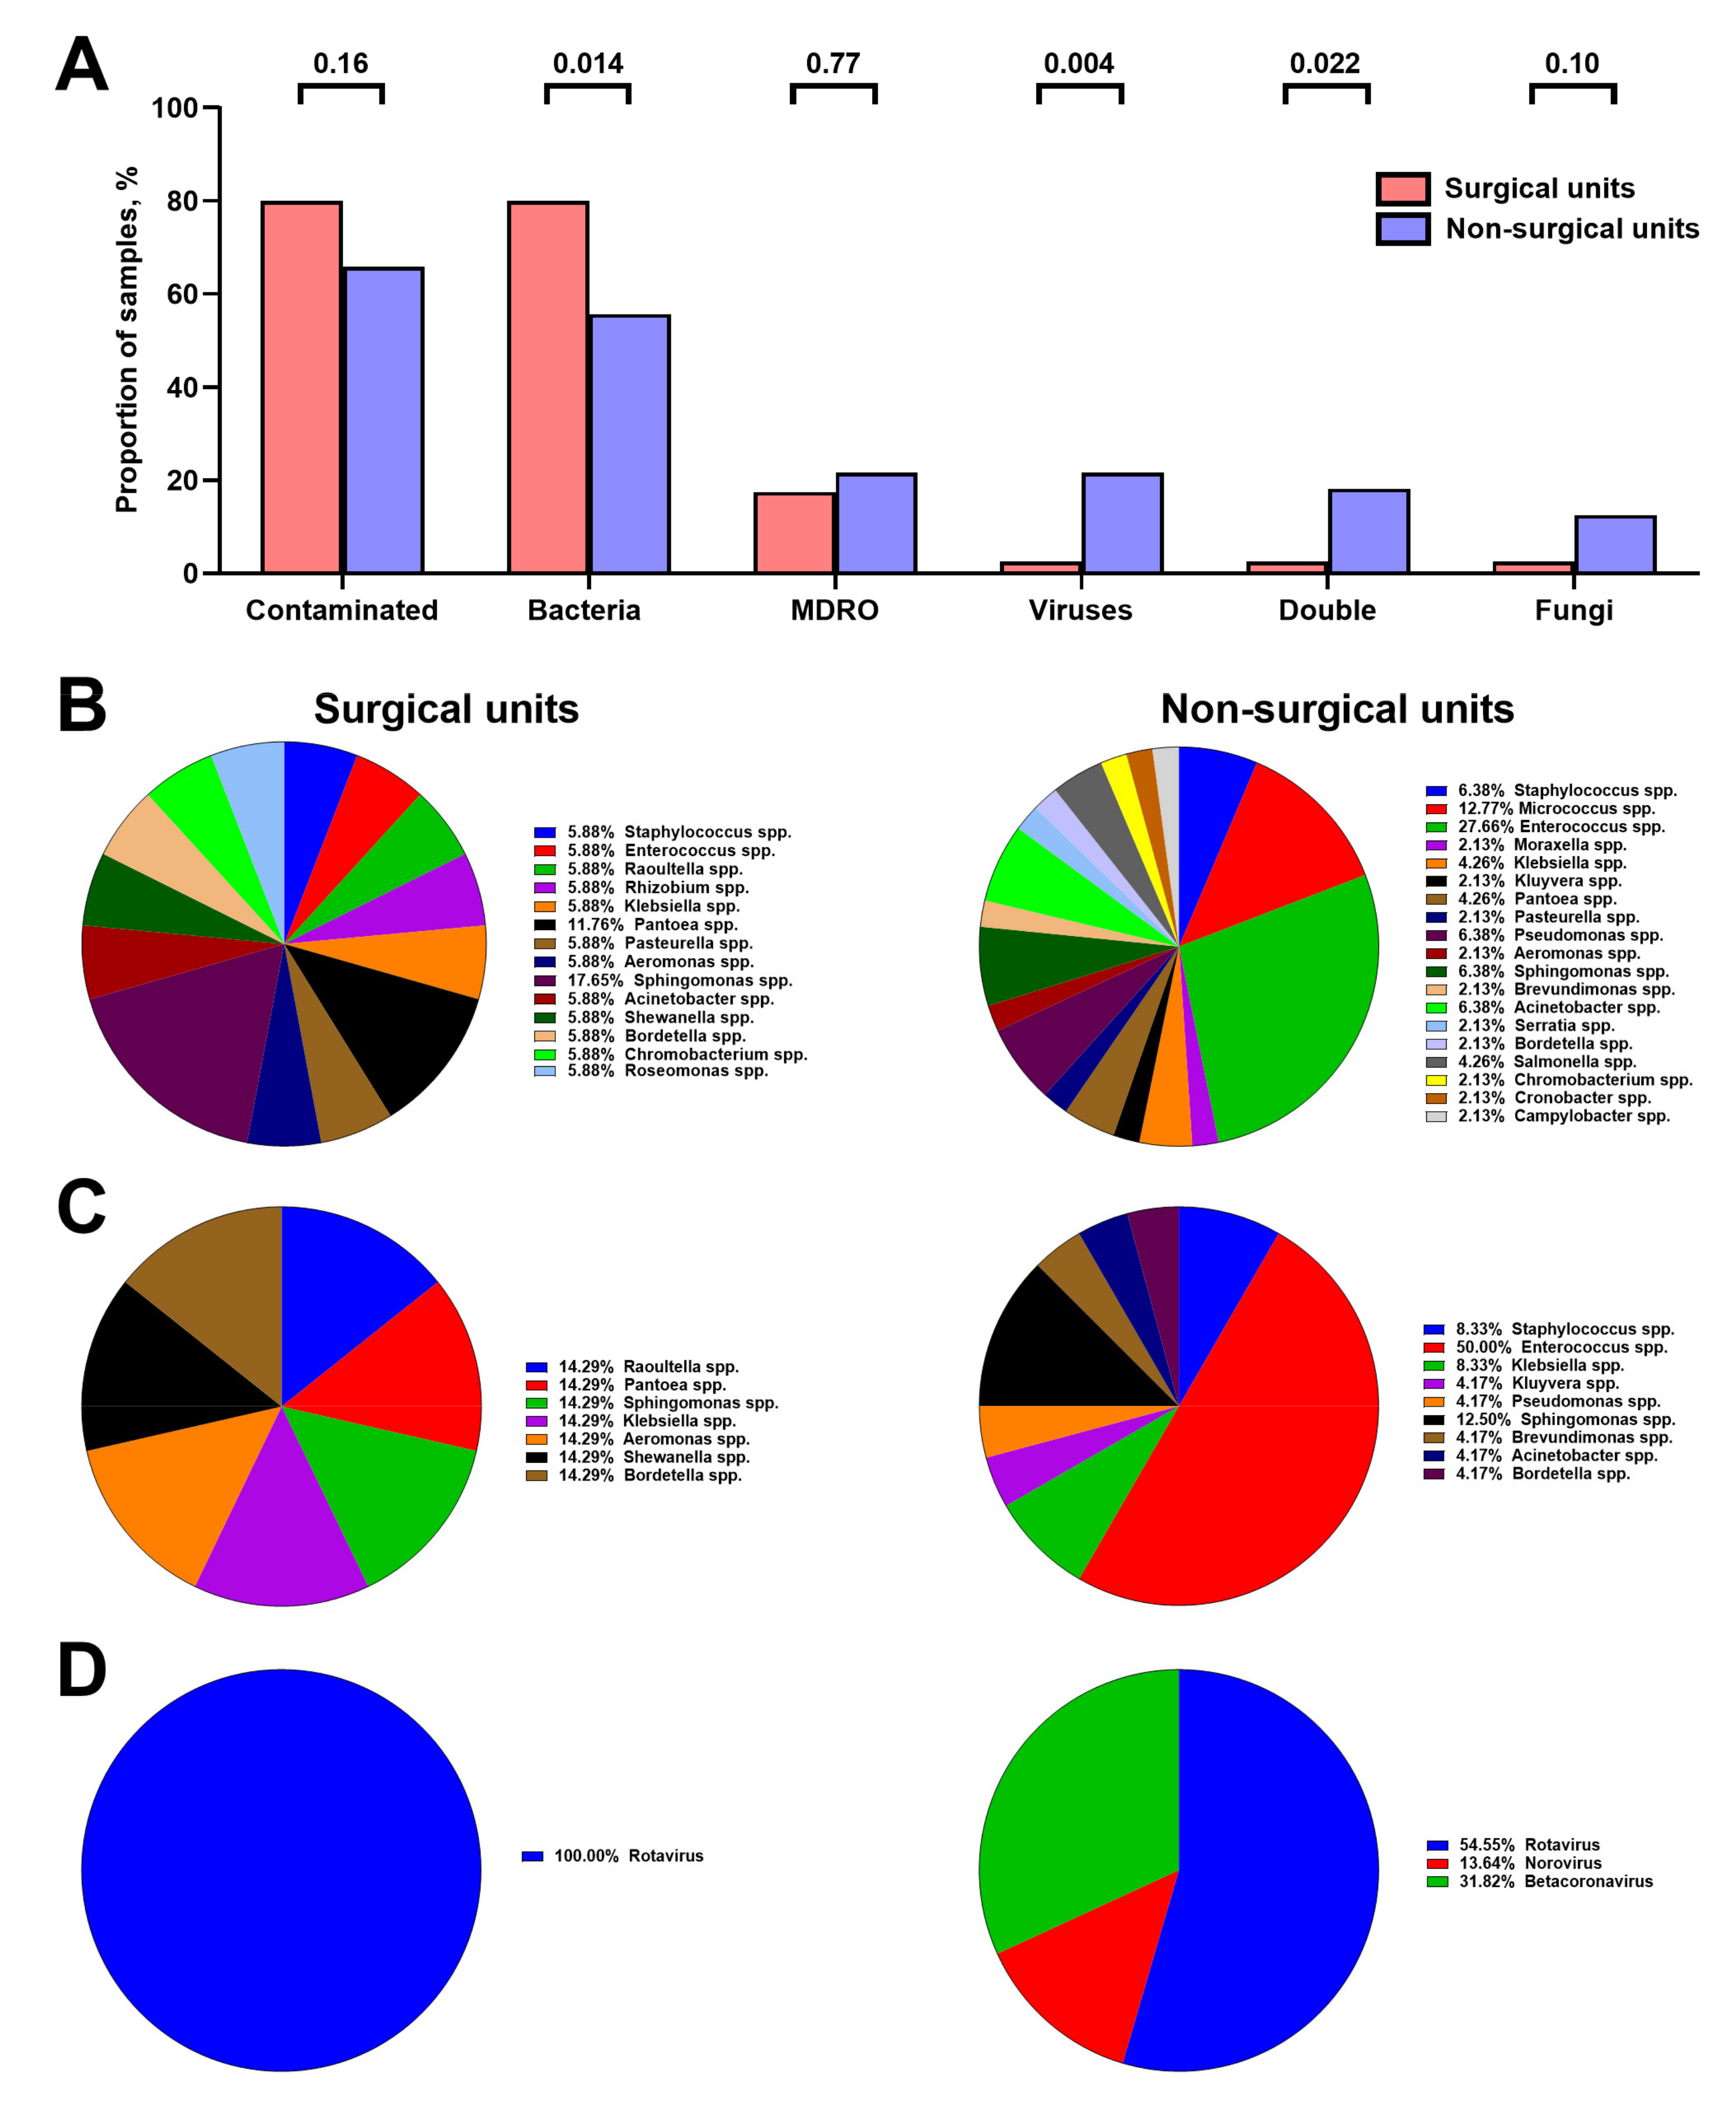
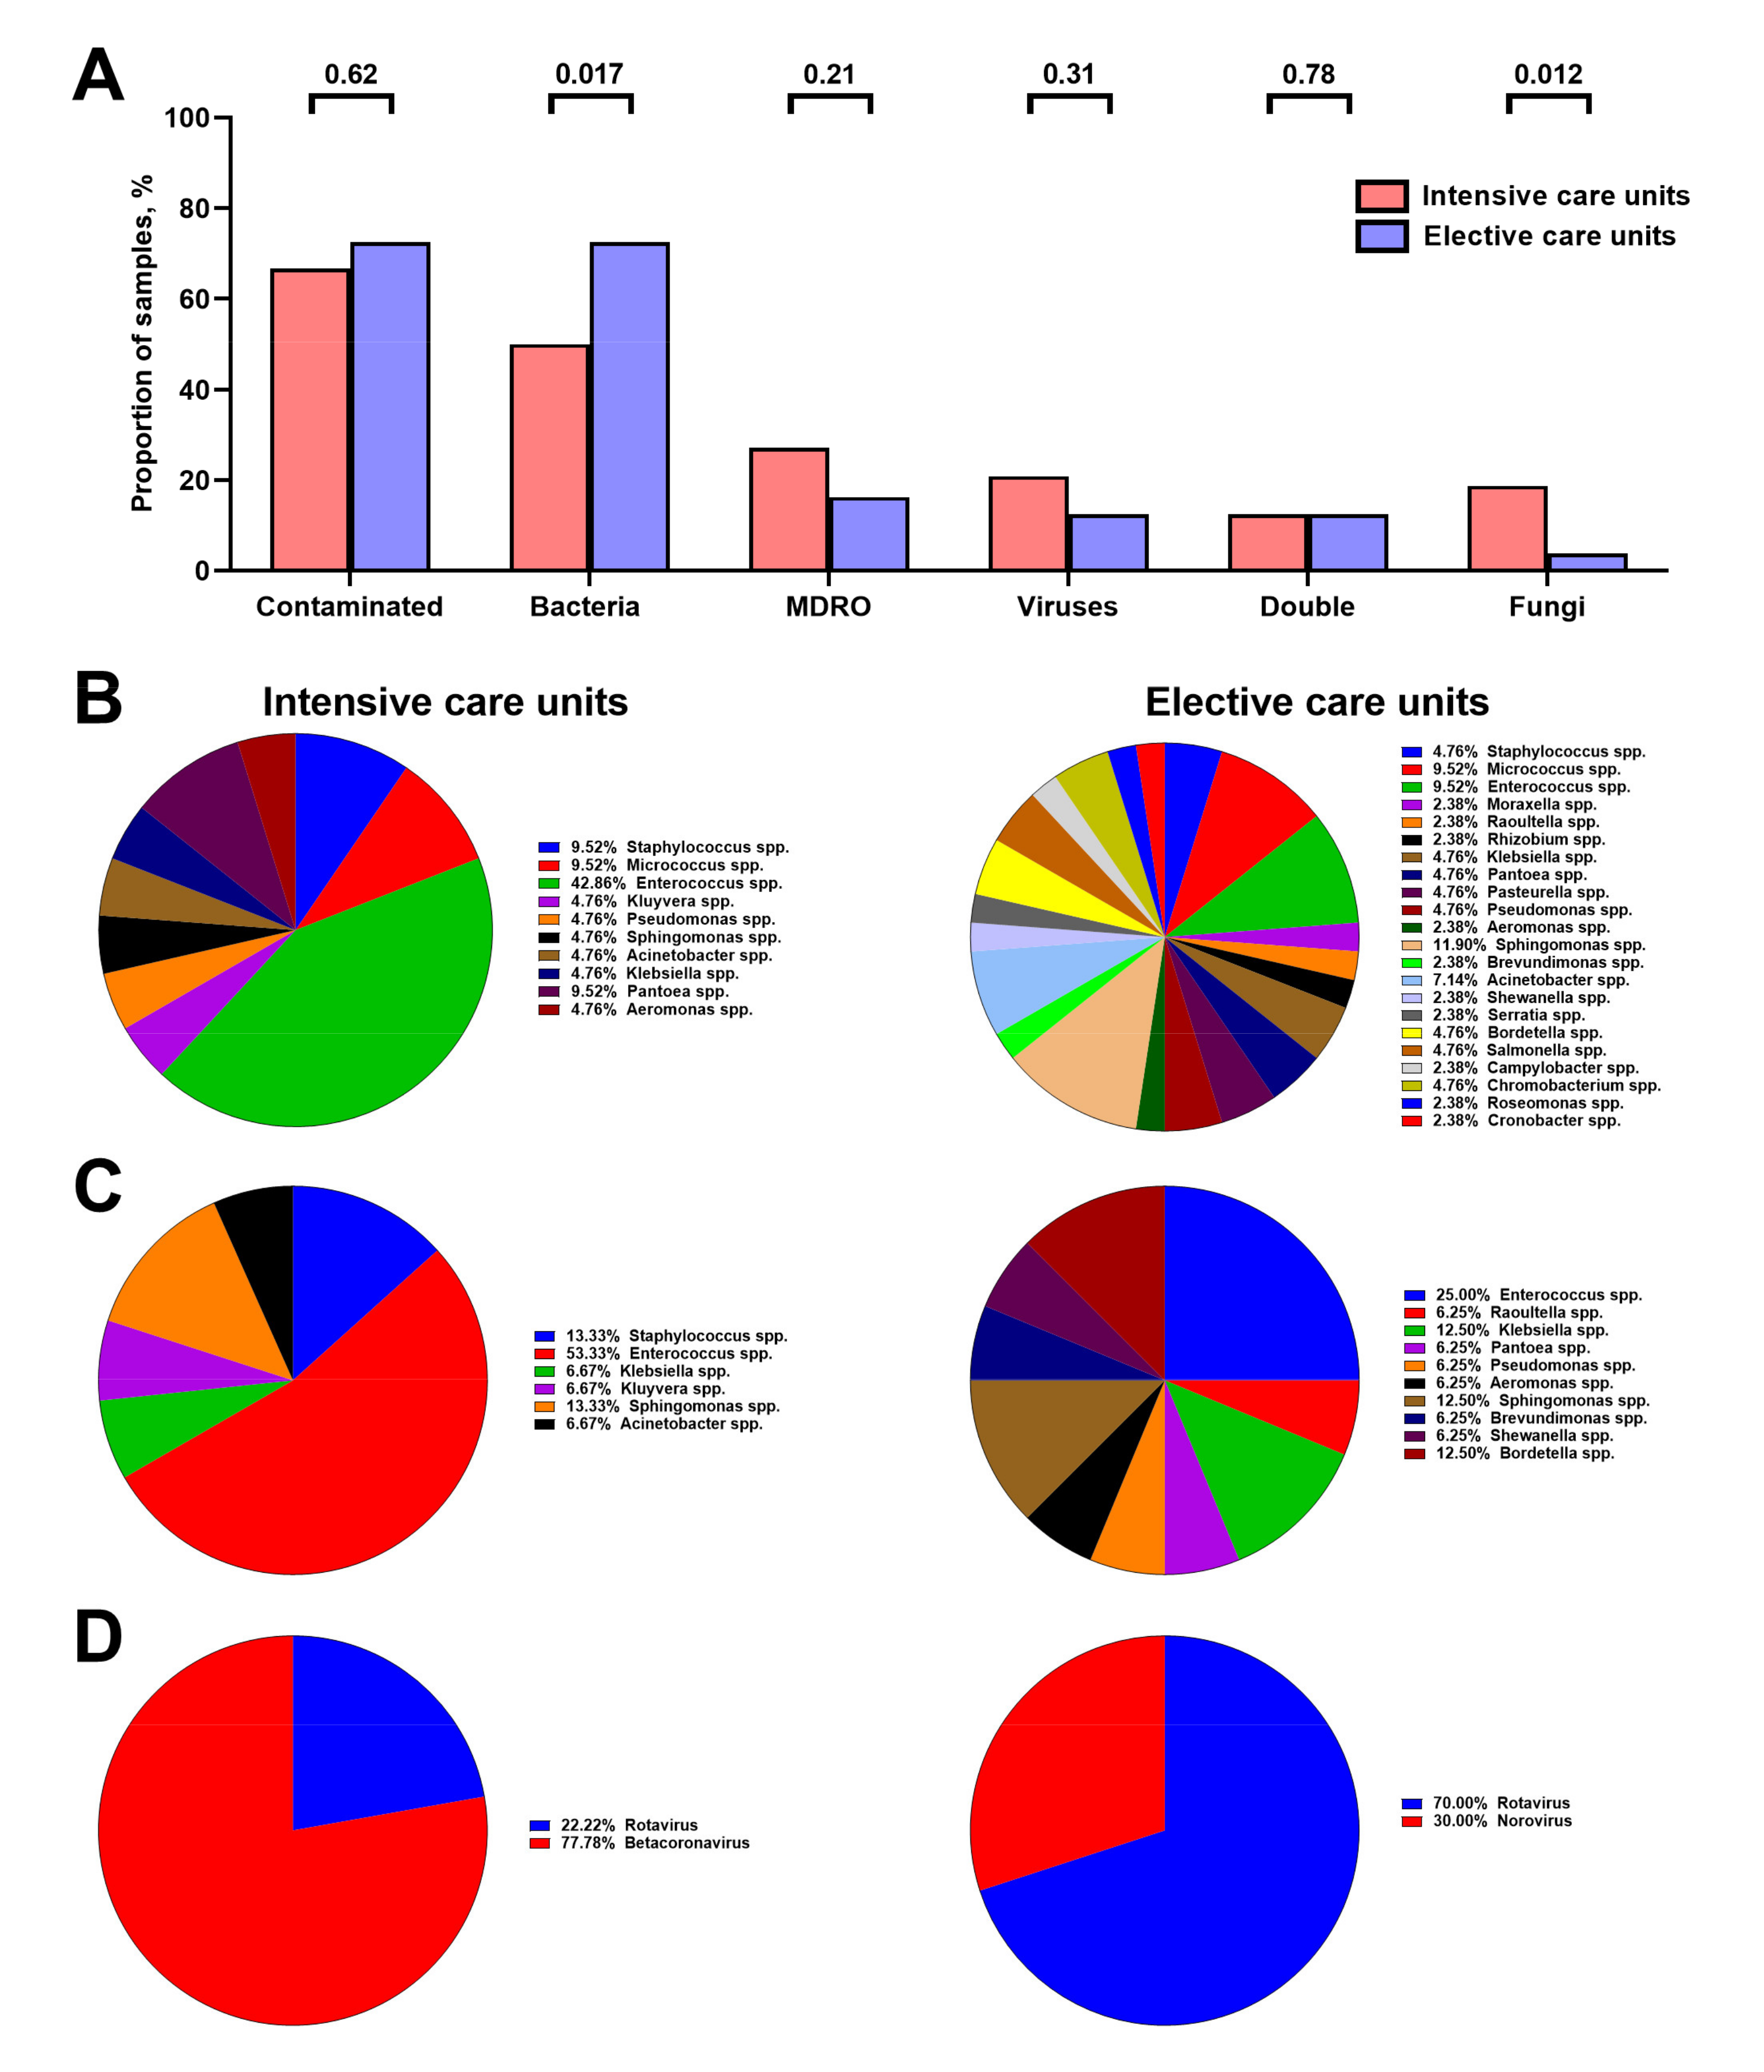
3.3. Microbial Composition of Hospital Vent-PM Is Patient-Dependent and Environment-Dependent
4. Discussion
5. Conclusions
Supplementary Materials
Author Contributions
Funding
Institutional Review Board Statement
Informed Consent Statement
Data Availability Statement
Conflicts of Interest
References
- Zingg, W.; Storr, J.; Park, B.J.; Ahmad, R.; Tarrant, C.; Castro-Sanchez, E.; Tomczyk, S.; Kilpatrick, C.; Allegranzi, B.; Cardo, D.; et al. 2017 Geneva IPC-Think Tank. Implementation research for the prevention of antimicrobial resistance and healthcare-associated infections; 2017 Geneva infection prevention and control (IPC)-think tank (part 1). Antimicrob. Resist. Infect. Control 2019, 8, 87. [Google Scholar] [CrossRef]
- Zarb, P.; Coignard, B.; Griskeviciene, J.; Muller, A.; Vankerckhoven, V.; Weist, K.; Goossens, M.; Vaerenberg, S.; Hopkins, S.; Catry, B.; et al. National Contact Points for the ECDC pilot point prevalence survey; Hospital Contact Points for the ECDC pilot point prevalence survey. The European Centre for Disease Prevention and Control (ECDC) pilot point prevalence survey of healthcare-associated infections and antimicrobial use. Eur. Surveill. 2012, 17, 20316. [Google Scholar] [CrossRef]
- Magill, S.S.; O’Leary, E.; Janelle, S.J.; Thompson, D.L.; Dumyati, G.; Nadle, J.; Wilson, L.E.; Kainer, M.A.; Lynfield, R.; Greissman, S.; et al. Emerging Infections Program Hospital Prevalence Survey Team. Changes in Prevalence of Health Care-Associated Infections in U.S. Hospitals. N. Engl. J. Med. 2018, 379, 1732–1744. [Google Scholar] [CrossRef]
- Zimlichman, E.; Henderson, D.; Tamir, O.; Franz, C.; Song, P.; Yamin, C.K.; Keohane, C.; Denham, C.R.; Bates, D.W. Health care-associated infections: A meta-analysis of costs and financial impact on the US health care system. JAMA Intern. Med. 2013, 173, 2039–2046. [Google Scholar] [CrossRef] [PubMed]
- Guest, J.F.; Keating, T.; Gould, D.; Wigglesworth, N. Modelling the annual NHS costs and outcomes attributable to healthcare-associated infections in England. BMJ Open 2020, 10, e033367. [Google Scholar] [CrossRef]
- Serra-Burriel, M.; Keys, M.; Campillo-Artero, C.; Agodi, A.; Barchitta, M.; Gikas, A.; Palos, C.; López-Casasnovas, G. Impact of multi-drug resistant bacteria on economic and clinical outcomes of healthcare-associated infections in adults: Systematic review and meta-analysis. PLoS ONE 2020, 15, e0227139. [Google Scholar] [CrossRef]
- Assadian, O.; Harbarth, S.; Vos, M.; Knobloch, J.K.; Asensio, A.; Widmer, A.F. Practical recommendations for routine cleaning and disinfection procedures in healthcare institutions: A narrative review. J. Hosp. Infect. 2021, 113, 104–114. [Google Scholar] [CrossRef] [PubMed]
- Nikaido, H. Multidrug resistance in bacteria. Annu. Rev. Biochem. 2009, 78, 119–146. [Google Scholar] [CrossRef] [PubMed]
- Blair, J.M.; Webber, M.A.; Baylay, A.J.; Ogbolu, D.O.; Piddock, L.J. Molecular mechanisms of antibiotic resistance. Nat. Rev. Microbiol. 2015, 13, 42–51. [Google Scholar] [CrossRef]
- Munita, J.M.; Arias, C.A. Mechanisms of Antibiotic Resistance. Microbiol. Spectr. 2016, 4, 481–511. [Google Scholar] [CrossRef]
- Peterson, E.; Kaur, P. Antibiotic Resistance Mechanisms in Bacteria: Relationships between Resistance Determinants of Antibiotic Producers, Environmental Bacteria, and Clinical Pathogens. Front. Microbiol. 2018, 9, 2928. [Google Scholar] [CrossRef]
- Christaki, E.; Marcou, M.; Tofarides, A. Antimicrobial Resistance in Bacteria: Mechanisms, Evolution, and Persistence. J. Mol. Evol. 2020, 88, 26–40. [Google Scholar] [CrossRef] [PubMed]
- Weiner-Lastinger, L.M.; Abner, S.; Edwards, J.R.; Kallen, A.J.; Karlsson, M.; Magill, S.S.; Pollock, D.; See, I.; Soe, M.M.; Walters, M.S.; et al. Antimicrobial-resistant pathogens associated with adult healthcare-associated infections: Summary of data reported to the National Healthcare Safety Network, 2015–2017. Infect. Control Hosp. Epidemiol. 2020, 41, 1–18. [Google Scholar] [CrossRef]
- Weiner-Lastinger, L.M.; Abner, S.; Benin, A.L.; Edwards, J.R.; Kallen, A.J.; Karlsson, M.; Magill, S.S.; Pollock, D.; See, I.; Soe, M.M.; et al. Antimicrobial-resistant pathogens associated with pediatric healthcare-associated infections: Summary of data reported to the National Healthcare Safety Network, 2015–2017. Infect. Control Hosp. Epidemiol. 2020, 41, 19–30. [Google Scholar] [CrossRef] [PubMed]
- Jones, R.N.; Castanheira, M.; Hu, B.; Ni, Y.; Lin, S.S.; Mendes, R.E.; Wang, Y. Update of contemporary antimicrobial resistance rates across China: Reference testing results for 12 medical centers (2011). Diagn. Microbiol. Infect. Dis. 2013, 77, 258–266. [Google Scholar] [CrossRef]
- Vickery, K.; Deva, A.; Jacombs, A.; Allan, J.; Valente, P.; Gosbell, I.B. Presence of biofilm containing viable multiresistant organisms despite terminal cleaning on clinical surfaces in an intensive care unit. J. Hosp. Infect. 2012, 80, 52–55. [Google Scholar] [CrossRef] [PubMed]
- Russotto, V.; Cortegiani, A.; Raineri, S.M.; Giarratano, A. Bacterial contamination of inanimate surfaces and equipment in the intensive care unit. J. Intensive Care 2015, 3, 54. [Google Scholar] [CrossRef]
- Shek, K.; Patidar, R.; Kohja, Z.; Liu, S.; Gawaziuk, J.P.; Gawthrop, M.; Kumar, A.; Logsetty, S. Rate of contamination of hospital privacy curtains on a burns and plastic surgery ward: A cross-sectional study. J. Hosp. Infect. 2017, 96, 54–58. [Google Scholar] [CrossRef]
- Bhatta, D.R.; Hamal, D.; Shrestha, R.; Hosuru Subramanya, S.; Baral, N.; Singh, R.K.; Nayak, N.; Gokhale, S. Bacterial contamination of frequently touched objects in a tertiary care hospital of Pokhara, Nepal: How safe are our hands? Antimicrob. Resist. Infect. Control 2018, 7, 97. [Google Scholar] [CrossRef]
- Johani, K.; Abualsaud, D.; Costa, D.M.; Hu, H.; Whiteley, G.; Deva, A.; Vickery, K. Characterization of microbial community composition, antimicrobial resistance and biofilm on intensive care surfaces. J. Infect. Public Health 2018, 11, 418–424. [Google Scholar] [CrossRef]
- Costa, D.M.; Johani, K.; Melo, D.S.; Lopes, L.K.O.; Lopes Lima, L.K.O.; Tipple, A.F.V.; Hu, H.; Vickery, K. Biofilm contamination of high-touched surfaces in intensive care units: Epidemiology and potential impacts. Lett. Appl. Microbiol. 2019, 68, 269–276. [Google Scholar] [CrossRef]
- Bhatta, D.R.; Hosuru Subramanya, S.; Hamal, D.; Shrestha, R.; Gauchan, E.; Basnet, S.; Nayak, N.; Gokhale, S. Bacterial contamination of neonatal intensive care units: How safe are the neonates? Antimicrob. Resist. Infect. Control 2021, 10, 26. [Google Scholar] [CrossRef] [PubMed]
- Ledwoch, K.; Dancer, S.J.; Otter, J.A.; Kerr, K.; Roposte, D.; Rushton, L.; Weiser, R.; Mahenthiralingam, E.; Muir, D.D.; Maillard, J.Y. Beware biofilm! Dry biofilms containing bacterial pathogens on multiple healthcare surfaces; a multi-centre study. J. Hosp. Infect. 2018, 100, e47–e56. [Google Scholar] [CrossRef] [PubMed]
- Smith, J.; Adams, C.E.; King, M.F.; Noakes, C.J.; Robertson, C.; Dancer, S.J. Is there an association between airborne and surface microbes in the critical care environment? J. Hosp. Infect. 2018, 100, e123–e129. [Google Scholar] [CrossRef]
- Noguchi, C.; Koseki, H.; Horiuchi, H.; Yonekura, A.; Tomita, M.; Higuchi, T.; Sunagawa, S.; Osaki, M. Factors contributing to airborne particle dispersal in the operating room. BMC Surg. 2017, 17, 78. [Google Scholar] [CrossRef]
- Cutler, H.S.; Romero, J.A.; Minor, D.; Huo, M.H. Sources of contamination in the operating room: A fluorescent particle powder study. Am. J. Infect. Control 2020, 48, 948–950. [Google Scholar] [CrossRef]
- Huang, J.; Cui, C.; Zhou, S.; Chen, M.; Wu, H.; Jin, R.; Chen, X. Impact of multicenter unified enhanced environmental cleaning and disinfection measures on nosocomial infections among patients in intensive care units. J. Int. Med. Res. 2020, 48, 300060520949766. [Google Scholar] [CrossRef]
- Stockwell, R.E.; Ballard, E.L.; O’Rourke, P.; Knibbs, L.D.; Morawska, L.; Bell, S.C. Indoor hospital air and the impact of ventilation on bioaerosols: A systematic review. J. Hosp. Infect. 2019, 103, 175–184. [Google Scholar] [CrossRef] [PubMed]
- Tian, Y.; Liu, H.; Wu, Y.; Si, Y.; Li, M.; Wu, Y.; Wang, X.; Wang, M.; Chen, L.; Wei, C.; et al. Ambient particulate matter pollution and adult hospital admissions for pneumonia in urban China: A national time series analysis for 2014 through 2017. PLoS Med. 2019, 16, e1003010. [Google Scholar] [CrossRef]
- Yee, J.; Cho, Y.A.; Yoo, H.J.; Yun, H.; Gwak, H.S. Short-term exposure to air pollution and hospital admission for pneumonia: A systematic review and meta-analysis. Environ. Health 2021, 20, 6. [Google Scholar] [CrossRef]
- Nhung, N.T.T.; Amini, H.; Schindler, C.; Kutlar Joss, M.; Dien, T.M.; Probst-Hensch, N.; Perez, L.; Künzli, N. Short-term association between ambient air pollution and pneumonia in children: A systematic review and meta-analysis of time-series and case-crossover studies. Environ. Pollut 2017, 230, 1000–1008. [Google Scholar] [CrossRef]
- MacIntyre, E.A.; Gehring, U.; Mölter, A.; Fuertes, E.; Klümper, C.; Krämer, U.; Quass, U.; Hoffmann, B.; Gascon, M.; Brunekreef, B.; et al. Air pollution and respiratory infections during early childhood: An analysis of 10 European birth cohorts within the ESCAPE Project. Environ. Health Perspect. 2014, 122, 107–113. [Google Scholar] [CrossRef]
- Sonego, M.; Pellegrin, M.C.; Becker, G.; Lazzerini, M. Risk factors for mortality from acute lower respiratory infections (ALRI) in children under five years of age in low and middle-income countries: A systematic review and meta-analysis of observational studies. PLoS ONE 2015, 10, e0116380. [Google Scholar] [CrossRef]
- Hobday, R.A.; Dancer, S.J. Roles of sunlight and natural ventilation for controlling infection: Historical and current perspectives. J. Hosp. Infect. 2013, 84, 271–282. [Google Scholar] [CrossRef]
- Shajahan, A.; Culp, C.H.; Williamson, B. Effects of indoor environmental parameters related to building heating, ventilation, and air conditioning systems on patients’ medical outcomes: A review of scientific research on hospital buildings. Indoor Air 2019, 29, 161–176. [Google Scholar] [CrossRef]
- Fink, J.B.; Ehrmann, S.; Li, J.; Dailey, P.; McKiernan, P.; Darquenne, C.; Martin, A.R.; Rothen-Rutishauser, B.; Kuehl, P.J.; Häussermann, S.; et al. Reducing Aerosol-Related Risk of Transmission in the Era of COVID-19: An Interim Guidance Endorsed by the International Society of Aerosols in Medicine. J. Aerosol. Med. Pulm. Drug. Deliv. 2020, 33, 300–304. [Google Scholar] [CrossRef] [PubMed]
- Li, J.; Cao, J.; Zhu, Y.G.; Chen, Q.L.; Shen, F.; Wu, Y.; Xu, S.; Fan, H.; Da, G.; Huang, R.J.; et al. Global Survey of Antibiotic Resistance Genes in Air. Environ. Sci. Technol. 2018, 52, 10975–10984. [Google Scholar] [CrossRef]
- Li, Z.; Zheng, W.; Wang, Y.; Li, B.; Wang, Y. Spatiotemporal variations in the association between particulate matter and airborne bacteria based on the size-resolved respiratory tract deposition in concentrated layer feeding operations. Environ. Int. 2021, 150, 106413. [Google Scholar] [CrossRef]
- Xie, J.; Jin, L.; He, T.; Chen, B.; Luo, X.; Feng, B.; Huang, W.; Li, J.; Fu, P.; Li, X. Bacteria and Antibiotic Resistance Genes (ARGs) in PM2.5 from China: Implications for Human Exposure. Environ. Sci. Technol. 2019, 53, 963–972. [Google Scholar] [CrossRef] [PubMed]
- Setti, L.; Passarini, F.; De Gennaro, G.; Barbieri, P.; Perrone, M.G.; Borelli, M.; Palmisani, J.; Di Gilio, A.; Torboli, V.; Fontana, F.; et al. SARS-Cov-2RNA found on particulate matter of Bergamo in Northern Italy: First evidence. Environ. Res. 2020, 188, 109754. [Google Scholar] [CrossRef] [PubMed]
- Nor, N.S.M.; Yip, C.W.; Ibrahim, N.; Jaafar, M.H.; Rashid, Z.Z.; Mustafa, N.; Hamid, H.H.A.; Chandru, K.; Latif, M.T.; Saw, P.E.; et al. Particulate matter (PM(2.5)) as a potential SARS-CoV-2 carrier. Sci. Rep. 2021, 11, 2508. [Google Scholar] [CrossRef]
- Mannucci, P.M.; Harari, S.; Martinelli, I.; Franchini, M. Effects on health of air pollution: A narrative review. Intern. Emerg. Med. 2015, 10, 657–662. [Google Scholar] [CrossRef] [PubMed]
- Li, M.H.; Fan, L.C.; Mao, B.; Yang, J.W.; Choi, A.M.K.; Cao, W.J.; Xu, J.F. Short-term Exposure to Ambient Fine Particulate Matter Increases Hospitalizations and Mortality in COPD: A Systematic Review and Meta-analysis. Chest 2016, 149, 447–458. [Google Scholar] [CrossRef] [PubMed]
- DeVries, R.; Kriebel, D.; Sama, S. Outdoor Air Pollution and COPD-Related Emergency Department Visits, Hospital Admissions, and Mortality: A Meta-Analysis. COPD 2017, 14, 113–121. [Google Scholar] [CrossRef]
- Park, J.; Kim, H.J.; Lee, C.H.; Lee, C.H.; Lee, H.W. Impact of long-term exposure to ambient air pollution on the incidence of chronic obstructive pulmonary disease: A systematic review and meta-analysis. Environ. Res. 2021, 194, 110703. [Google Scholar] [CrossRef]
- Tam, W.W.; Wong, T.W.; Ng, L.; Wong, S.Y.; Kung, K.K.; Wong, A.H. Association between air pollution and general outpatient clinic consultations for upper respiratory tract infections in Hong Kong. PLoS ONE 2014, 9, e86913. [Google Scholar] [CrossRef]
- Zhang, F.; Zhang, H.; Wu, C.; Zhang, M.; Feng, H.; Li, D.; Zhu, W. Acute effects of ambient air pollution on clinic visits of college students for upper respiratory tract infection in Wuhan, China. Environ. Sci. Pollut. Res. Int. 2021. [Google Scholar] [CrossRef]
- Dancer, S.J. Controlling hospital-acquired infection: Focus on the role of the environment and new technologies for decontamination. Clin. Microbiol. Rev. 2014, 27, 665–690. [Google Scholar] [CrossRef]
- Beggs, C.; Knibbs, L.D.; Johnson, G.R.; Morawska, L. Environmental contamination and hospital-acquired infection: Factors that are easily overlooked. Indoor Air 2015, 25, 462–474. [Google Scholar] [CrossRef]
- Hime, N.J.; Marks, G.B.; Cowie, C.T. A Comparison of the Health Effects of Ambient Particulate Matter Air Pollution from Five Emission Sources. Int. J. Environ. Res. Public Health 2018, 15, 1206. [Google Scholar] [CrossRef]
- Adams, K.; Greenbaum, D.S.; Shaikh, R.; van Erp, A.M.; Russell, A.G. Particulate matter components, sources, and health: Systematic approaches to testing effects. J. Air Waste Manag. Assoc. 2015, 65, 544–558. [Google Scholar] [CrossRef]
- Gilbert, J.A.; Stephens, B. Microbiology of the built environment. Nat. Rev. Microbiol. 2018, 16, 661–670. [Google Scholar] [CrossRef] [PubMed]
- Lax, S.; Gilbert, J.A. Hospital-associated microbiota and implications for nosocomial infections. Trends Mol. Med. 2015, 21, 427–432. [Google Scholar] [CrossRef] [PubMed]
- Arnold, C. Rethinking sterile: The hospital microbiome. Environ. Health Perspect. 2014, 122, A182–A187. [Google Scholar] [CrossRef] [PubMed][Green Version]
- Roope, L.S.J.; Smith, R.D.; Pouwels, K.B.; Buchanan, J.; Abel, L.; Eibich, P.; Butler, C.C.; Tan, P.S.; Walker, A.S.; Robotham, J.V.; et al. The challenge of antimicrobial resistance: What economics can contribute. Science 2019, 364, eaau4679. [Google Scholar] [CrossRef]
- Crofts, T.S.; Gasparrini, A.J.; Dantas, G. Next-generation approaches to understand and combat the antibiotic resistome. Nat. Rev. Microbiol. 2017, 15, 422–434. [Google Scholar] [CrossRef] [PubMed]
- Miyoshi-Akiyama, T.; Tada, T.; Ohmagari, N.; Viet Hung, N.; Tharavichitkul, P.; Pokhrel, B.M.; Gniadkowski, M.; Shimojima, M.; Kirikae, T. Emergence and Spread of Epidemic Multidrug-Resistant Pseudomonas aeruginosa. Genome Biol. Evol. 2017, 9, 3238–3245. [Google Scholar] [CrossRef]
- Klemm, E.J.; Wong, V.K.; Dougan, G. Emergence of dominant multidrug-resistant bacterial clades: Lessons from history and whole-genome sequencing. Proc. Natl. Acad. Sci. USA 2018, 115, 12872–12877. [Google Scholar] [CrossRef] [PubMed]
- Leale, A.M.; Kassen, R. The emergence, maintenance, and demise of diversity in a spatially variable antibiotic regime. Evol. Lett. 2018, 2, 134–143. [Google Scholar] [CrossRef] [PubMed]
- Boyce, J.M. Modern technologies for improving cleaning and disinfection of environmental surfaces in hospitals. Antimicrob. Resist. Infect. Control 2016, 5, 10. [Google Scholar] [CrossRef]
- Doll, M.; Stevens, M.; Bearman, G. Environmental cleaning and disinfection of patient areas. Int. J. Infect. Dis. 2018, 67, 52–57. [Google Scholar] [CrossRef] [PubMed]
- Casini, B.; Tuvo, B.; Totaro, M.; Aquino, F.; Baggiani, A.; Privitera, G. Evaluation of the Cleaning Procedure Efficacy in Prevention of Nosocomial Infections in Healthcare Facilities Using Cultural Method Associated with High Sensitivity Luminometer for ATP Detection. Pathogens 2018, 7, 71. [Google Scholar] [CrossRef]
- Shams, A.M.; Rose, L.J.; Edwards, J.R.; Cali, S.; Harris, A.D.; Jacob, J.T.; LaFae, A.; Pineles, L.L.; Thom, K.A.; McDonald, L.C.; et al. Assessment of the Overall and Multidrug-Resistant Organism Bioburden on Environmental Surfaces in Healthcare Facilities. Infect. Control Hosp. Epidemiol. 2016, 37, 1426–1432. [Google Scholar] [CrossRef]
- Wille, I.; Mayr, A.; Kreidl, P.; Brühwasser, C.; Hinterberger, G.; Fritz, A.; Posch, W.; Fuchs, S.; Obwegeser, A.; Orth-Höller, D.; et al. Cross-sectional point prevalence survey to study the environmental contamination of nosocomial pathogens in intensive care units under real-life conditions. J. Hosp. Infect. 2018, 98, 90–95. [Google Scholar] [CrossRef]
- Kumari, D.N.; Haji, T.C.; Keer, V.; Hawkey, P.M.; Duncanson, V.; Flower, E. Ventilation grilles as a potential source of methicillin-resistant Staphylococcus aureus causing an outbreak in an orthopaedic ward at a district general hospital. J. Hosp. Infect. 1998, 39, 127–133. [Google Scholar] [CrossRef]
- Poza, M.; Gayoso, C.; Gómez, M.J.; Rumbo-Feal, S.; Tomás, M.; Aranda, J.; Fernández, A.; Bou, G. Exploring bacterial diversity in hospital environments by GS-FLX Titanium pyrosequencing. PLoS ONE 2012, 7, e44105. [Google Scholar] [CrossRef]
- Christoff, A.P.; Sereia, A.F.R.; Cruz, G.N.F.; Bastiani, D.C.; Silva, V.L.; Hernandes, C.; Nascente, A.P.M.; Reis, A.A.D.; Viessi, R.G.; Marques, A.D.S.P.; et al. One year cross-sectional study in adult and neonatal intensive care units reveals the bacterial and antimicrobial resistance genes profiles in patients and hospital surfaces. PLoS ONE 2020, 15, e0234127. [Google Scholar] [CrossRef] [PubMed]
- Ji, W.; Zhao, B. Estimating mortality derived from indoor exposure to particles of outdoor origin. PLoS ONE 2015, 10, e0124238. [Google Scholar] [CrossRef] [PubMed]
- Huang, L.; Pu, Z.; Li, M.; Sundell, J. Characterizing the Indoor-Outdoor Relationship of Fine Particulate Matter in Non-Heating Season for Urban Residences in Beijing. PLoS ONE 2015, 10, e0138559. [Google Scholar] [CrossRef]
- Guo, Z.D.; Wang, Z.Y.; Zhang, S.F.; Li, X.; Li, L.; Li, C.; Cui, Y.; Fu, R.B.; Dong, Y.Z.; Chi, X.Y.; et al. Aerosol and Surface Distribution of Severe Acute Respiratory Syndrome Coronavirus 2 in Hospital Wards, Wuhan, China, 2020. Emerg. Infect. Dis. 2020, 26, 1583–1591. [Google Scholar] [CrossRef] [PubMed]
- Chia, P.Y.; Coleman, K.K.; Tan, Y.K.; Ong, S.W.X.; Gum, M.; Lau, S.K.; Lim, X.F.; Lim, A.S.; Sutjipto, S.; Lee, P.H.; et al. Singapore 2019 Novel Coronavirus Outbreak Research Team. Detection of air and surface contamination by SARS-CoV-2 in hospital rooms of infected patients. Nat. Commun. 2020, 11, 2800. [Google Scholar] [CrossRef] [PubMed]
- Stern, R.A.; Koutrakis, P.; Martins, M.A.G.; Lemos, B.; Dowd, S.E.; Sunderland, E.M.; Garshick, E. Characterization of hospital airborne SARS-CoV-2. Respir. Res. 2021, 22, 73. [Google Scholar] [CrossRef] [PubMed]
- Weber, D.J.; Kanamori, H.; Rutala, W.A. ‘No touch’ technologies for environmental decontamination: Focus on ultraviolet devices and hydrogen peroxide systems. Curr. Opin. Infect. Dis. 2016, 29, 424–431. [Google Scholar] [CrossRef] [PubMed]


| Total (n = 128, 13 + 15) | ||||||
|---|---|---|---|---|---|---|
| SU40 (4 + 8) | NSU (88, 9 + 7) | ICU (48, 4 + 6) | ECU (80, 9 + 9) | Coal or chemical districts (63, 13 + 15) | Mixed districts (65) | |
| Coal 27 (3 + 8) | Chem 36 (10 + 7) | |||||
| Total (n = 128, 13 + 15) | |||||||||||
|---|---|---|---|---|---|---|---|---|---|---|---|
| Coal or Chemical Districts (n = 63, 13 + 15) | Mixed Districts (n = 65) | ||||||||||
| Coal Districts (n = 27, 3 + 8) | Chemical Districts (n = 36, 10 + 7) | ||||||||||
| SU (11, 1 + 5) | NSU (16, 2 + 3) | ICU (3, 0 + 1) | ECU (24, 3 + 7) | SU (6, 3 + 3) | NSU (30, 7 + 4) | ICU (14, 4 + 5) | ECU (22, 6 + 2) | SU (23) | NSU (42) | ICU (31) | ECU (34) |
| Sample Number | Collected Area | Sample Size | Sample Collection Date | Investigation Technique | ||
|---|---|---|---|---|---|---|
| 1 | NSU | ICU | Chem | ≈0.05–0.2 g | 15.12.2018 | Microbial diversity analysis, SEM |
| 2 | SU | ECU | Chem | ≈0.05–0.2 g | 15.12.2018 | Microbial diversity analysis, SEM |
| 3 | NSU | ICU | Chem | ≈0.05–0.2 g | 15.12.2018 | Microbial diversity analysis, SEM |
| 4 | NSU | ECU | Chem | ≈0.05–0.2 g | 15.12.2018 | Microbial diversity analysis, SEM |
| 5 | NSU | ICU | Chem | ≈0.05–0.2 g | 15.12.2018 | Microbial diversity analysis, SEM |
| 6 | NSU | ECU | Chem | ≈0.05–0.2 g | 15.12.2018 | Microbial diversity analysis, SEM |
| 7 | NSU | ICU | Chem | ≈0.05–0.2 g | 15.12.2018 | Microbial diversity analysis, SEM |
| 8 | SU | ECU | Chem | ≈0.05–0.2 g | 15.12.2018 | Microbial diversity analysis, SEM |
| 9 | SU | ICU | Chem | ≈0.05–0.2 g | 15.12.2018 | Microbial diversity analysis, SEM |
| 10 | SU | ECU | Chem | ≈0.05–0.2 g | 15.12.2018 | Microbial diversity analysis, SEM |
| 11 | SU | ECU | Chem | ≈0.05–0.2 g | 15.12.2018 | Microbial diversity analysis, SEM |
| 12 | NSU | ECU | Chem | ≈0.05–0.2 g | 15.12.2018 | Microbial diversity analysis, SEM |
| 13 | SU | ECU | Coal | ≈0.05–0.2 g | 25.02.2019 | Microbial diversity analysis, SEM |
| 14 | SU | ECU | Coal | ≈0.05–0.2 g | 25.02.2019 | Microbial diversity analysis, SEM |
| 15 | SU | ECU | Coal | ≈0.05–0.2 g | 25.02.2019 | Microbial diversity analysis, SEM |
| 16 | SU | ECU | Coal | ≈0.05–0.2 g | 25.02.2019 | Microbial diversity analysis, SEM |
| 17 | SU | ECU | Coal | ≈0.05–0.2 g | 25.02.2019 | Microbial diversity analysis, SEM |
| 18 | SU | ECU | Coal | ≈0.05–0.2 g | 25.02.2019 | Microbial diversity analysis, SEM |
| 19 | NSU | ICU | Coal | ≈0.05–0.2 g | 25.02.2019 | Microbial diversity analysis |
| 20 | NSU | ICU | Coal | ≈0.05–0.2 g | 25.02.2019 | Microbial diversity analysis, SEM |
| 21 | NSU | ECU | Coal | ≈0.05–0.2 g | 25.02.2019 | Microbial diversity analysis, SEM |
| 22 | NSU | ECU | Coal | ≈0.05–0.2 g | 25.02.2019 | Microbial diversity analysis |
| 23 | NSU | ECU | Coal | ≈0.05–0.2 g | 25.02.2019 | Microbial diversity analysis, SEM |
| 24 | NSU | ECU | Coal | ≈0.05–0.2 g | 25.02.2019 | Microbial diversity analysis, SEM |
| 25 | NSU | ECU | Coal | ≈0.05–0.2 g | 25.02.2019 | Microbial diversity analysis, SEM |
| 26 | NSU | ECU | Coal | ≈0.05–0.2 g | 25.02.2019 | Microbial diversity analysis |
| 27 | NSU | ICU | Chem | ≈0.05–0.2 g | 06.03.2019 | Microbial diversity analysis, SEM |
| 28 | NSU | ICU | Chem | ≈0.05–0.2 g | 06.03.2019 | Microbial diversity analysis, SEM |
| 29 | NSU | ICU | Chem | ≈0.05–0.2 g | 06.03.2019 | Microbial diversity analysis, SEM |
| 30 | NSU | ICU | Chem | ≈0.05–0.2 g | 06.03.2019 | Microbial diversity analysis, SEM |
| 31 | SU | ECU | Chem | ≈0.05–0.2 g | 06.03.2019 | Microbial diversity analysis, SEM |
| 32 | NSU | ECU | Chem | ≈0.05–0.2 g | 12.03.2019 | Microbial diversity analysis |
| 33 | NSU | ECU | Chem | ≈0.05–0.2 g | 12.03.2019 | Microbial diversity analysis |
| 34 | NSU | ICU | Chem | ≈0.05–0.2 g | 12.03.2019 | Microbial diversity analysis |
| 35 | NSU | ICU | Chem | ≈0.05–0.2 g | 12.03.2019 | Microbial diversity analysis |
| 36 | NSU | ECU | Chem | ≈0.05–0.2 g | 12.03.2019 | Microbial diversity analysis |
| 37 | NSU | ECU | Chem | ≈0.05–0.2 g | 12.03.2019 | Microbial diversity analysis |
| 38 | NSU | ECU | Chem | ≈0.05–0.2 g | 12.03.2019 | Microbial diversity analysis |
| 39 | NSU | ECU | Chem | ≈0.05–0.2 g | 12.03.2019 | Microbial diversity analysis |
| 40 | NSU | ECU | Chem | ≈0.05–0.2 g | 12.03.2019 | Microbial diversity analysis |
| 41 | NSU | ECU | Chem | ≈0.05–0.2 g | 12.03.2019 | Microbial diversity analysis |
| 42 | NSU | ECU | Coal | ≈0.05–0.2 g | 11.09.2019 | Microbial diversity analysis |
| 43 | NSU | ECU | Coal | ≈0.05–0.2 g | 11.09.2019 | Microbial diversity analysis |
| 44 | NSU | ECU | Coal | ≈0.05–0.2 g | 11.09.2019 | Microbial diversity analysis |
| 45 | NSU | ICU | Coal | ≈0.05–0.2 g | 11.09.2019 | Microbial diversity analysis |
| 46 | NSU | ECU | Chem | ≈0.05–0.2 g | 25.02.2020 | Microbial diversity analysis |
| 47 | NSU | ECU | Chem | ≈0.05–0.2 g | 25.02.2020 | Microbial diversity analysis |
| 48 | NSU | ECU | Chem | ≈0.05–0.2 g | 25.02.2020 | Microbial diversity analysis |
| 49 | NSU | ICU | Chem | ≈0.05–0.2 g | 25.02.2020 | Microbial diversity analysis |
| 50 | NSU | ICU | Chem | ≈0.05–0.2 g | 25.02.2020 | Microbial diversity analysis |
| 51 | NSU | ICU | Chem | ≈0.05–0.2 g | 25.02.2020 | Microbial diversity analysis |
| 52 | NSU | ECU | Chem | ≈0.05–0.2 g | 25.02.2020 | Microbial diversity analysis |
| 53 | NSU | ECU | Chem | ≈0.05–0.2 g | 25.02.2020 | Microbial diversity analysis |
| 54 | NSU | ECU | Chem | ≈0.05–0.2 g | 25.02.2020 | Microbial diversity analysis |
| 55 | SU | ECU | Coal | ≈0.05–0.2 g | 11.09.2019 | Microbial diversity analysis |
| 56 | SU | ECU | Coal | ≈0.05–0.2 g | 11.09.2019 | Microbial diversity analysis |
| 57 | SU | ECU | Coal | ≈0.05–0.2 g | 11.09.2019 | Microbial diversity analysis |
| 58 | SU | ECU | Coal | ≈0.05–0.2 g | 11.09.2019 | Microbial diversity analysis |
| 59 | SU | ECU | Coal | ≈0.05–0.2 g | 11.09.2019 | Microbial diversity analysis |
| 60 | NSU | ECU | Coal | ≈0.05–0.2 g | 11.09.2019 | Microbial diversity analysis |
| 61 | NSU | ECU | Coal | ≈0.05–0.2 g | 11.09.2019 | Microbial diversity analysis |
| 62 | NSU | ECU | Coal | ≈0.05–0.2 g | 11.09.2019 | Microbial diversity analysis |
| 63 | NSU | ECU | Coal | ≈0.05–0.2 g | 11.09.2019 | Microbial diversity analysis |
| 64 | NSU | ECU | Mixed | ≈0.05–0.2 g | 16.08.2020 | Microbial diversity analysis |
| 65 | NSU | ECU | Mixed | ≈0.05–0.2 g | 16.08.2020 | Microbial diversity analysis |
| 66 | NSU | ECU | Mixed | ≈0.05–0.2 g | 16.08.2020 | Microbial diversity analysis |
| 67 | NSU | ECU | Mixed | ≈0.05–0.2 g | 16.08.2020 | Microbial diversity analysis |
| 68 | NSU | ECU | Mixed | ≈0.05–0.2 g | 16.08.2020 | Microbial diversity analysis |
| 69 | NSU | ECU | Mixed | ≈0.05–0.2 g | 16.08.2020 | Microbial diversity analysis |
| 70 | NSU | ECU | Mixed | ≈0.05–0.2 g | 16.08.2020 | Microbial diversity analysis |
| 71 | NSU | ECU | Mixed | ≈0.05–0.2 g | 16.08.2020 | Microbial diversity analysis |
| 72 | SU | ECU | Mixed | ≈0.05–0.2 g | 16.08.2020 | Microbial diversity analysis |
| 73 | NSU | ECU | Mixed | ≈0.05–0.2 g | 16.08.2020 | Microbial diversity analysis |
| 74 | NSU | ECU | Mixed | ≈0.05–0.2 g | 16.08.2020 | Microbial diversity analysis |
| 75 | NSU | ECU | Mixed | ≈0.05–0.2 g | 21.09.2020 | Microbial diversity analysis |
| 76 | SU | ECU | Mixed | ≈0.05–0.2 g | 21.09.2020 | Microbial diversity analysis |
| 77 | SU | ECU | Mixed | ≈0.05–0.2 g | 21.09.2020 | Microbial diversity analysis |
| 78 | SU | ECU | Mixed | ≈0.05–0.2 g | 21.09.2020 | Microbial diversity analysis |
| 79 | SU | ECU | Mixed | ≈0.05–0.2 g | 21.09.2020 | Microbial diversity analysis |
| 80 | SU | ECU | Mixed | ≈0.05–0.2 g | 21.09.2020 | Microbial diversity analysis |
| 81 | SU | ECU | Mixed | ≈0.05–0.2 g | 21.09.2020 | Microbial diversity analysis |
| 82 | SU | ECU | Mixed | ≈0.05–0.2 g | 21.09.2020 | Microbial diversity analysis |
| 83 | SU | ECU | Mixed | ≈0.05–0.2 g | 21.09.2020 | Microbial diversity analysis |
| 84 | SU | ECU | Mixed | ≈0.05–0.2 g | 21.09.2020 | Microbial diversity analysis |
| 85 | SU | ECU | Mixed | ≈0.05–0.2 g | 21.09.2020 | Microbial diversity analysis |
| 86 | SU | ECU | Mixed | ≈0.05–0.2 g | 21.09.2020 | Microbial diversity analysis |
| 87 | SU | ECU | Mixed | ≈0.05–0.2 g | 21.09.2020 | Microbial diversity analysis |
| 88 | SU | ECU | Mixed | ≈0.05–0.2 g | 21.09.2020 | Microbial diversity analysis |
| 89 | SU | ECU | Mixed | ≈0.05–0.2 g | 21.09.2020 | Microbial diversity analysis |
| 90 | SU | ECU | Mixed | ≈0.05–0.2 g | 21.09.2020 | Microbial diversity analysis |
| 91 | SU | ECU | Mixed | ≈0.05–0.2 g | 21.09.2020 | Microbial diversity analysis |
| 92 | SU | ECU | Mixed | ≈0.05–0.2 g | 21.09.2020 | Microbial diversity analysis |
| 93 | SU | ECU | Mixed | ≈0.05–0.2 g | 21.09.2020 | Microbial diversity analysis |
| 94 | SU | ECU | Mixed | ≈0.05–0.2 g | 21.09.2020 | Microbial diversity analysis |
| 95 | SU | ECU | Mixed | ≈0.05–0.2 g | 21.09.2020 | Microbial diversity analysis |
| 96 | SU | ECU | Mixed | ≈0.05–0.2 g | 21.09.2020 | Microbial diversity analysis |
| 97 | SU | ECU | Mixed | ≈0.05–0.2 g | 01.04.2021 | Microbial diversity analysis |
| 98 | NSU | ICU | Mixed | ≈0.05–0.2 g | 01.04.2021 | Microbial diversity analysis |
| 99 | NSU | ICU | Mixed | ≈0.05–0.2 g | 01.04.2021 | Microbial diversity analysis |
| 100 | NSU | ICU | Mixed | ≈0.05–0.2 g | 01.04.2021 | Microbial diversity analysis |
| 101 | NSU | ICU | Mixed | ≈0.05–0.2 g | 01.04.2021 | Microbial diversity analysis |
| 102 | NSU | ICU | Mixed | ≈0.05–0.2 g | 01.04.2021 | Microbial diversity analysis |
| 103 | NSU | ICU | Mixed | ≈0.05–0.2 g | 01.04.2021 | Microbial diversity analysis |
| 104 | NSU | ICU | Mixed | ≈0.05–0.2 g | 01.04.2021 | Microbial diversity analysis |
| 105 | NSU | ICU | Mixed | ≈0.05–0.2 g | 01.04.2021 | Microbial diversity analysis |
| 106 | NSU | ICU | Mixed | ≈0.05–0.2 g | 01.04.2021 | Microbial diversity analysis |
| 107 | NSU | ICU | Mixed | ≈0.05–0.2 g | 01.04.2021 | Microbial diversity analysis |
| 108 | NSU | ICU | Mixed | ≈0.05–0.2 g | 01.04.2021 | Microbial diversity analysis |
| 109 | NSU | ICU | Mixed | ≈0.05–0.2 g | 01.04.2021 | Microbial diversity analysis |
| 110 | NSU | ICU | Mixed | ≈0.05–0.2 g | 01.04.2021 | Microbial diversity analysis |
| 111 | NSU | ICU | Mixed | ≈0.05–0.2 g | 01.04.2021 | Microbial diversity analysis |
| 112 | NSU | ICU | Mixed | ≈0.05–0.2 g | 01.04.2021 | Microbial diversity analysis |
| 113 | NSU | ICU | Mixed | ≈0.05–0.2 g | 01.04.2021 | Microbial diversity analysis |
| 114 | NSU | ICU | Mixed | ≈0.05–0.2 g | 01.04.2021 | Microbial diversity analysis |
| 115 | NSU | ICU | Mixed | ≈0.05–0.2 g | 01.04.2021 | Microbial diversity analysis |
| 116 | NSU | ICU | Mixed | ≈0.05–0.2 g | 01.04.2021 | Microbial diversity analysis |
| 117 | NSU | ICU | Mixed | ≈0.05–0.2 g | 01.04.2021 | Microbial diversity analysis |
| 118 | NSU | ICU | Mixed | ≈0.05–0.2 g | 01.04.2021 | Microbial diversity analysis |
| 119 | NSU | ICU | Mixed | ≈0.05–0.2 g | 01.04.2021 | Microbial diversity analysis |
| 120 | NSU | ICU | Mixed | ≈0.05–0.2 g | 01.04.2021 | Microbial diversity analysis |
| 121 | NSU | ICU | Mixed | ≈0.05–0.2 g | 01.04.2021 | Microbial diversity analysis |
| 122 | NSU | ICU | Mixed | ≈0.05–0.2 g | 01.04.2021 | Microbial diversity analysis |
| 123 | NSU | ICU | Mixed | ≈0.05–0.2 g | 01.04.2021 | Microbial diversity analysis |
| 124 | NSU | ICU | Mixed | ≈0.05–0.2 g | 01.04.2021 | Microbial diversity analysis |
| 125 | NSU | ICU | Mixed | ≈0.05–0.2 g | 01.04.2021 | Microbial diversity analysis |
| 126 | NSU | ICU | Mixed | ≈0.05–0.2 g | 01.04.2021 | Microbial diversity analysis |
| 127 | NSU | ICU | Mixed | ≈0.05–0.2 g | 01.04.2021 | Microbial diversity analysis |
| 128 | NSU | ICU | Mixed | ≈0.05–0.2 g | 01.04.2021 | Microbial diversity analysis |
| Sample Number | Collected Area | Contamination Status | Bacteria | MDRO | Viruses | Fungi | ||
|---|---|---|---|---|---|---|---|---|
| 1 | NSU | ICU | Chem | + | + | + | + | - |
| 2 | SU | ECU | Chem | - | - | - | - | - |
| 3 | NSU | ICU | Chem | + | + | + | - | - |
| 4 | NSU | ECU | Chem | - | - | - | - | - |
| 5 | NSU | ICU | Chem | - | - | - | - | - |
| 6 | NSU | ECU | Chem | - | - | - | - | - |
| 7 | NSU | ICU | Chem | + | - | - | + | - |
| 8 | SU | ECU | Chem | + | + | - | - | - |
| 9 | SU | ICU | Chem | + | + | + | - | - |
| 10 | SU | ECU | Chem | + | + | + | - | - |
| 11 | SU | ECU | Chem | + | + | - | - | - |
| 12 | NSU | ECU | Chem | + | + | - | + | - |
| 13 | SU | ECU | Coal | + | + | + | - | - |
| 14 | SU | ECU | Coal | + | + | + | + | - |
| 15 | SU | ECU | Coal | + | + | - | - | - |
| 16 | SU | ECU | Coal | + | + | + | - | - |
| 17 | SU | ECU | Coal | + | + | + | - | - |
| 18 | SU | ECU | Coal | + | + | - | - | - |
| 19 | NSU | ICU | Coal | - | - | - | - | - |
| 20 | NSU | ICU | Coal | + | + | - | - | - |
| 21 | NSU | ECU | Coal | + | + | + | - | - |
| 22 | NSU | ECU | Coal | - | - | - | - | - |
| 23 | NSU | ECU | Coal | + | + | + | + | - |
| 24 | NSU | ECU | Coal | + | + | - | + | - |
| 25 | NSU | ECU | Coal | + | + | - | + | + |
| 26 | NSU | ECU | Coal | + | + | - | - | - |
| 27 | NSU | ICU | Chem | + | - | - | - | + |
| 28 | NSU | ICU | Chem | - | - | - | - | - |
| 29 | NSU | ICU | Chem | - | - | - | - | - |
| 30 | NSU | ICU | Chem | + | - | - | + | + |
| 31 | SU | ECU | Chem | - | - | - | - | - |
| 32 | NSU | ECU | Chem | - | - | - | - | - |
| 33 | NSU | ECU | Chem | + | + | - | - | - |
| 34 | NSU | ICU | Chem | + | + | - | - | - |
| 35 | NSU | ICU | Chem | - | - | - | - | - |
| 36 | NSU | ECU | Chem | - | - | - | - | - |
| 37 | NSU | ECU | Chem | - | - | - | - | - |
| 38 | NSU | ECU | Chem | - | - | - | - | - |
| 39 | NSU | ECU | Chem | - | - | - | - | - |
| 40 | NSU | ECU | Chem | - | - | - | - | - |
| 41 | NSU | ECU | Chem | - | - | - | - | - |
| 42 | NSU | ECU | Coal | + | + | - | - | - |
| 43 | NSU | ECU | Coal | + | + | + | - | + |
| 44 | NSU | ECU | Coal | + | + | - | - | - |
| 45 | NSU | ICU | Coal | - | - | - | - | - |
| 46 | NSU | ECU | Chem | + | + | - | + | - |
| 47 | NSU | ECU | Chem | + | + | + | + | - |
| 48 | NSU | ECU | Chem | + | + | + | + | - |
| 49 | NSU | ICU | Chem | + | + | + | - | - |
| 50 | NSU | ICU | Chem | + | + | + | - | - |
| 51 | NSU | ICU | Chem | + | + | + | - | - |
| 52 | NSU | ECU | Chem | + | + | + | + | - |
| 53 | NSU | ECU | Chem | + | + | + | + | - |
| 54 | NSU | ECU | Chem | + | + | - | - | - |
| 55 | SU | ECU | Coal | + | + | - | - | - |
| 56 | SU | ECU | Coal | + | + | - | - | - |
| 57 | SU | ECU | Coal | + | + | - | - | + |
| 58 | SU | ECU | Coal | + | + | - | - | - |
| 59 | SU | ECU | Coal | + | + | - | - | - |
| 60 | NSU | ECU | Coal | + | + | - | - | - |
| 61 | NSU | ECU | Coal | + | + | - | - | - |
| 62 | NSU | ECU | Coal | + | + | - | - | - |
| 63 | NSU | ECU | Coal | + | + | - | - | - |
| 64 | NSU | ECU | Mixed | - | - | - | - | - |
| 65 | NSU | ECU | Mixed | - | - | - | - | - |
| 66 | NSU | ECU | Mixed | - | - | - | - | - |
| 67 | NSU | ECU | Mixed | + | + | - | - | - |
| 68 | NSU | ECU | Mixed | + | + | - | - | - |
| 69 | NSU | ECU | Mixed | + | + | - | - | - |
| 70 | NSU | ECU | Mixed | + | + | - | - | - |
| 71 | NSU | ECU | Mixed | + | + | - | - | - |
| 72 | SU | ECU | Mixed | + | + | - | - | - |
| 73 | NSU | ECU | Mixed | + | + | - | - | - |
| 74 | NSU | ECU | Mixed | - | - | - | - | - |
| 75 | NSU | ECU | Mixed | + | + | - | - | - |
| 76 | SU | ECU | Mixed | - | - | - | - | - |
| 77 | SU | ECU | Mixed | + | + | - | - | - |
| 78 | SU | ECU | Mixed | + | + | - | - | - |
| 79 | SU | ECU | Mixed | + | + | - | - | - |
| 80 | SU | ECU | Mixed | + | + | - | - | - |
| 81 | SU | ECU | Mixed | + | + | - | - | - |
| 82 | SU | ECU | Mixed | + | + | + | - | - |
| 83 | SU | ECU | Mixed | + | + | - | - | - |
| 84 | SU | ECU | Mixed | + | + | - | - | - |
| 85 | SU | ECU | Mixed | - | - | - | - | - |
| 86 | SU | ECU | Mixed | + | + | - | - | - |
| 87 | SU | ECU | Mixed | + | + | - | - | - |
| 88 | SU | ECU | Mixed | + | + | - | - | - |
| 89 | SU | ECU | Mixed | + | + | - | - | - |
| 90 | SU | ECU | Mixed | + | + | - | - | - |
| 91 | SU | ECU | Mixed | + | + | - | - | - |
| 92 | SU | ECU | Mixed | - | - | - | - | - |
| 93 | SU | ECU | Mixed | - | - | - | - | - |
| 94 | SU | ECU | Mixed | + | + | - | - | - |
| 95 | SU | ECU | Mixed | + | + | - | - | - |
| 96 | SU | ECU | Mixed | - | - | - | - | - |
| 97 | SU | ECU | Mixed | - | - | - | - | - |
| 98 | NSU | ICU | Mixed | + | + | + | + | - |
| 99 | NSU | ICU | Mixed | - | - | - | - | - |
| 100 | NSU | ICU | Mixed | + | + | + | - | - |
| 101 | NSU | ICU | Mixed | + | - | - | - | + |
| 102 | NSU | ICU | Mixed | - | - | - | - | - |
| 103 | NSU | ICU | Mixed | - | - | - | - | - |
| 104 | NSU | ICU | Mixed | + | + | + | + | + |
| 105 | NSU | ICU | Mixed | + | + | + | - | - |
| 106 | NSU | ICU | Mixed | + | - | - | + | + |
| 107 | NSU | ICU | Mixed | - | - | - | - | - |
| 108 | NSU | ICU | Mixed | - | - | - | - | - |
| 109 | NSU | ICU | Mixed | + | + | + | - | - |
| 110 | NSU | ICU | Mixed | + | + | + | + | - |
| 111 | NSU | ICU | Mixed | + | + | - | + | - |
| 112 | NSU | ICU | Mixed | + | + | + | - | - |
| 113 | NSU | ICU | Mixed | + | + | - | + | - |
| 114 | NSU | ICU | Mixed | + | + | - | + | - |
| 115 | NSU | ICU | Mixed | + | + | - | - | - |
| 116 | NSU | ICU | Mixed | - | - | - | - | - |
| 117 | NSU | ICU | Mixed | - | - | - | - | - |
| 118 | NSU | ICU | Mixed | + | + | - | - | - |
| 119 | NSU | ICU | Mixed | + | + | - | - | + |
| 120 | NSU | ICU | Mixed | + | + | - | - | - |
| 121 | NSU | ICU | Mixed | - | - | - | - | - |
| 122 | NSU | ICU | Mixed | + | + | - | - | - |
| 123 | NSU | ICU | Mixed | + | - | - | - | + |
| 124 | NSU | ICU | Mixed | - | - | - | - | - |
| 125 | NSU | ICU | Mixed | + | - | - | - | + |
| 126 | NSU | ICU | Mixed | - | - | - | - | - |
| 127 | NSU | ICU | Mixed | + | - | - | - | + |
| 128 | NSU | ICU | Mixed | + | + | - | - | - |
Publisher’s Note: MDPI stays neutral with regard to jurisdictional claims in published maps and institutional affiliations. |
© 2021 by the authors. Licensee MDPI, Basel, Switzerland. This article is an open access article distributed under the terms and conditions of the Creative Commons Attribution (CC BY) license (https://creativecommons.org/licenses/by/4.0/).
Share and Cite
Chezganova, E.; Efimova, O.; Sakharova, V.; Efimova, A.; Sozinov, S.; Kutikhin, A.; Ismagilov, Z.; Brusina, E. Ventilation-Associated Particulate Matter Is a Potential Reservoir of Multidrug-Resistant Organisms in Health Facilities. Life 2021, 11, 639. https://doi.org/10.3390/life11070639
Chezganova E, Efimova O, Sakharova V, Efimova A, Sozinov S, Kutikhin A, Ismagilov Z, Brusina E. Ventilation-Associated Particulate Matter Is a Potential Reservoir of Multidrug-Resistant Organisms in Health Facilities. Life. 2021; 11(7):639. https://doi.org/10.3390/life11070639
Chicago/Turabian StyleChezganova, Evgenia, Olga Efimova, Vera Sakharova, Anna Efimova, Sergey Sozinov, Anton Kutikhin, Zinfer Ismagilov, and Elena Brusina. 2021. "Ventilation-Associated Particulate Matter Is a Potential Reservoir of Multidrug-Resistant Organisms in Health Facilities" Life 11, no. 7: 639. https://doi.org/10.3390/life11070639
APA StyleChezganova, E., Efimova, O., Sakharova, V., Efimova, A., Sozinov, S., Kutikhin, A., Ismagilov, Z., & Brusina, E. (2021). Ventilation-Associated Particulate Matter Is a Potential Reservoir of Multidrug-Resistant Organisms in Health Facilities. Life, 11(7), 639. https://doi.org/10.3390/life11070639