Article

Effect of Five Polymorphisms on Percentage of Oleic Acid in Beef and Investigation of Linkage Disequilibrium to Confirm the Locations of Quantitative Trait Loci on BTA19 in Japanese Black Cattle

1
Laboratory of Animal Breeding and Genetics, Graduate School of Agricultural Science, Kobe University, Kobe 657-8501, Japan
2
Food Resources Education & Research Center, Kobe University, Kasai 675-2103, Japan
*
Author to whom correspondence should be addressed.
Life 2021, 11(7), 597; https://doi.org/10.3390/life11070597
Submission received: 13 May 2021 / Revised: 18 June 2021 / Accepted: 21 June 2021 / Published: 22 June 2021
(This article belongs to the Special Issue Quantitative Trait Loci)

Abstract

:
Five polymorphisms associated with the percentage of oleic acid (C18:1) in beef fat were previously reported on bovine chromosome 19 in different Japanese Black cattle populations. This study aimed to verify the effects of these five polymorphisms on C18:1 using the same Japanese Black cattle population and conduct linkage disequilibrium (LD) analysis in order to determine the locations of the quantitative trait loci (QTLs). We genotyped the five polymorphisms (SREBP1 c.1065 + 83 (84bp indel), STARD3 c.1187 C > T, GH c.379 C > G, FASN g.841 G > C, and FASN g.16024 A > G) in two populations, which were bred in Hyogo and Gifu Prefectures, Japan (n = 441 and 443, respectively) in order to analyze their effects on C18:1 using analysis of variance (ANOVA). In the Hyogo population, SREBP1 c.1065 + 83 and STARD3 c.1187 C > T were significantly associated with C18:1 (p < 0.001). Meanwhile, FASN g.841 G > C, FASN g.16024 A > G, and GH c.379 C > G were significantly associated with C18:1 (p < 0.01) in the Gifu population. LD analysis was subsequently conducted to detect the range of the QTLs, which ranged from 32.2 to 46.4 Mbp and from 47.8 to 52.1 Mbp in the Hyogo and Gifu populations, respectively. In conclusion, this study confirmed the existence of QTLs on BTA19 and divided the candidate region for each QTL based on LD coefficients. These results could contribute to efficient searches for responsible genes and polymorphisms for fatty acid composition.

1. Introduction

Fat quality has been an important indicator of beef quality in the past few decades. In particular, a percentage of fatty acids, known as the fatty acid composition, is regarded worldwide as essential for beef flavor and tenderness. A high percentage of unsaturated fatty acids (UFAs) exhibits a positive impact on beef tenderness due to the lower melting point of UFAs [1]. Additionally, UFAs in phospholipids exhibit an important role in flavor development [2]. Therefore, beef with a high percentage of UFAs is evaluated as being of high quality. Oleic acid (C18:1) usually forms the highest percentage of all UFAs included in beef [2]. Therefore, the percentage of C18:1 is one of the factors that determines the palatability of beef and is an important indicator of beef quality.
In Japanese Black cattle, some researchers reported associations between fatty acid composition and polymorphisms within genes. Interestingly, some of the polymorphisms are dominantly localized in the region from 35 to 52 Mbp on BTA19. Among them, two single-nucleotide polymorphisms (SNPs) within the FASN gene (g.841 G > C and g.16024 A > G), which are located on about 51.4 Mbp, are well known for being polymorphisms that are likely responsible for fatty acid composition because of associations between the polymorphisms and fatty acid composition in various cattle populations [3,4,5,6]. Additionally, three polymorphisms within the SREBP1, STARD3, and GH genes have also been reported to be significantly associated with fatty acid composition [7,8,9]. These three polymorphisms, SREBP1 c.1065 + 83, STARD3 c.1187 C > T, and GH c.379 C > G, were located on about 35.2, 40.7, and 48.6 Mbp on BTA19, respectively.
Previous studies have verified the possibility that these polymorphisms are responsible for fatty acid composition. Among them, FASN polymorphisms were reported as the most likely candidates, principally in terms of FASN gene function and the impacts of polymorphisms on gene structure. The FASN gene demonstrates a role in the synthesis of fatty acids, especially palmitate (C16:0) [10]. As an increase in C16:0 content in beef can cause a decrease in the percentage of C18:1, the FASN gene could be a promising candidate. Additionally, researchers suggested that FASN polymorphisms either alter the spatial structure of the β-ketoacyl reductase domain, which is important for FASN activity, [3] or change the expression level of FASN gene by the alteration of binding activity of the transcription factor Sp1 [11]. Hence, FASN polymorphisms could affect the percentage of C18:1 in beef by changing the function of the FASN gene.
However, SREBP1, STARD3, and GH polymorphisms are not that plausible as responsible polymorphisms for fatty acid composition. The SREBP1 gene encodes a transcription factor for genes involved in fatty acid metabolism, such as Stearoyl-CoA desaturase (SCD), which regulates fatty acid desaturation [12]. A previous study by Gamarra et al. [13] reported that the expression level of the SREBP1 gene was correlated with the expression level of the SCD gene and the content of each fatty acid. However, the study also showed that the genotype of SREBP1 c.1065 + 83 was not significantly associated with the expression level of the SREBP1 gene. Therefore, this study concluded that further study is needed to elucidate the effect of the indel on the function of the SREBP1 gene. Meanwhile, the STARD3 gene encodes a transmembrane protein, which exhibits a role in the maintenance of cholesterol distribution and homeostasis [14,15], and the GH gene encodes a peptide hormone to enhance muscle growth and regulate adipose tissue in cattle [16,17]. Although they are certainly related to fat metabolism, the functional relationships between these genes and fatty acid composition remain unclear.
As described above, five polymorphisms that were significantly associated with fatty acid composition were identified on BTA19 in Japanese Black cattle in previous studies. Among them, FASN polymorphisms are likely to be responsible for fatty acid composition and could be effective markers for selection. However, the associations between fatty acid composition and the other polymorphisms within the three genes imply the existence of other responsible polymorphisms near the FASN polymorphisms. Alternatively, the association could be caused by high linkage disequilibrium (LD) between the FASN polymorphisms and the other three polymorphisms. Conducting LD analysis between these five polymorphisms could provide some evidence to clarify this possibility. However, doing this has not yet been possible because the previous studies about these five polymorphisms were conducted in different populations. Therefore, this investigation started to try to estimate the effect of the five polymorphisms on the percentage of C18:1 in beef by using the same population and analyzing LD to verify the position of their quantitative trait loci (QTLs) on BTA19.

2. Materials and Methods

Two Japanese Black cattle populations (“Hyogo population” and “Gifu population”) were used to verify the effects of the five polymorphisms for fatty acid composition on BTA19 (Table 1). Since Japanese Black cattle has been managed under the different breeding systems according to the prefecture, the genetic background for the populations depends on the history of breeding in the prefecture in which they have been bred. The Hyogo population comprised the commercial cattle produced in Hyogo Prefecture, Japan from 2010 to 2011 and included 441 cattle (352 steers and 89 heifers). Similarly, the Gifu population comprised the commercial cattle produced in Gifu Prefecture, Japan from 2007 to 2009 and included 443 cattle which were all steers. The average ages at slaughter in the Hyogo and Gifu populations were 31.69 ± 1.24 and 28.32 ± 1.10 months, respectively. DNA was extracted from either the longissimus cervicis or thoracic muscle of these animals using the standard phenol–chloroform method [18].
Intramuscular fat tissue samples were collected from the longissimus thoracis muscle in both populations. Total lipid extraction was performed in order to analyze the percentage of C18:1 in the fatty acid of beef samples following a previous study [19]. The extracted fat was saponified with potassium hydrate–ethanol solution and then methyl-esterified with a boron trifluoride–methanol complex. Then, the processed fat was analyzed using gas chromatography (6890A; Agilent Technologies, Santa Clara, CA, USA) under the following conditions: the temperature of the inlet was 150 °C, the oven was warmed from 150 °C to 220 °C, and the temperature of the detector sensor was 220 °C. Helium gas was used as a carrier, a capillary column (TC-70, 0.25 mm I.D. × 60 m, df = 0.25 μm; GL Science, Tokyo, Japan), and a flame ionization detector for detection. The C18:1 content of the beef was finally expressed as a percentage of the total fatty acid content. The average percentage of C18:1 in the Hyogo and Gifu populations was 54.76% ± 3.01% and 51.92% ± 3.29%, respectively.
The current study was focused on five polymorphisms (Table 2). Among them, SREBP1 c.1065 + 83 (84bp indel), STARD3 c.1187 C > T, and FASN g.16024 A > G were genotyped in the Hyogo population in previous studies [8,20]. Additionally, FASN g.16024 A > G was also previously genotyped in the Gifu population [5]. The genotyping results were obtained for each animal from these previous studies. Additionally, genotyped FASN g.841 G > C was obtained in both populations and SREBP1 c.1065 + 83 and STARD3 c.1187 C > T in the Gifu population using the method described in the previous studies [5,7,8]. GH c.379 C > G was additionally genotyped using restriction fragment length polymorphism of fragments amplified by polymerase chain reaction and TaqMan hydrolysis probes in the Hyogo and Gifu populations. The primer and probe sequences, reaction conditions, and restriction enzymes are shown in Table 3.
Illumina BovineSNP50 v3 BeadChip (Illumina, San Diego, CA, USA) was applied to 200 randomly selected animals from the Hyogo population. Illumina BovineSNP50 v2 BeadChip (Illumina, San Diego, CA, USA) was applied to all animals in the Gifu population in a previous study [22]. Image data were analyzed using the Chromosome Viewer tool in BEADSTUDIO (Illumina) software. In this study, the genotype data of SNPs on BTA19 were used to calculate LD coefficients (r2). The set of SNPs was named as “50K SNPs.”
The effects of the five gene markers on the percentage of C18:1 were statistically tested using analysis of variance (ANOVA) and an appropriate model for each population. The model included the effect of genotype, slaughter month, sex, sire, and linear and quadratic covariates for the age at slaughter. However, the effect of slaughter month, sex, and sire were reduced from the model in Gifu population since they were not statistically significant.
A total of 1420 and 1391 SNPs were located on BTA19 in Illumina BovineSNP50 v2 BeadChip and Illumina BovineSNP50 v3 BeadChip, respectively. Among the 50K SNPs, 201 and 439 SNPs were excluded since their alleles were completely fixed in each population used in this study. Finally, 1219 and 952 SNPs were used to conduct LD analysis in Gifu and Hyogo populations, respectively. The LD coefficients (r2) between polymorphisms were calculated using HAPLOVIEW 4.0 with default settings.

3. Results

3.1. Genotype and Allele Frequency

Five gene polymorphisms were genotyped in the Hyogo and Gifu populations (Table 4 and Table 5). In the Hyogo population, the minor allele frequencies of SREBP1 c.1065 + 83, STARD3 c.1187 C > T, and FASN g.16024 A > G were 0.21, 0.45, and 0.10, respectively. GH c.379 C > G and FASN g.841 G > C were genotyped for only about 50 animals, since it became clear that their alleles were almost fixed according to their genotyping results. These two markers were excluded from the statistical analysis. In the Gifu population, all five markers were polymorphic, and the minor allele frequencies ranged from 0.09 to 0.49.

3.2. Association between C18:1 and Gene Markers

Table 4 and Table 5 show the associations between the five gene markers and the percentage of C18:1 based on ANOVA. SREBP1 and STARD3 polymorphisms were significantly associated with the percentage of C18:1 in the Hyogo population (p < 0.001), while FASN g.16024 A > G was not (p = 0.614). In contrast, FASN g.16024 A > G showed a significant association in the Gifu population (p = 0.001). Moreover, GH c.379 C > G and FASN g.841 G > C were also significantly associated in the Gifu population (p < 0.01).

3.3. LD among Five Gene Polymorphisms

In the Hyogo population, the LD coefficient (r2) between SREBP1 c.1065 + 83 and STARD3 c.1187 C > T showed a medium level of LD (r2 = 0.29; Figure 1A). However, FASN g.16024 A > G showed an extremely low level of LD with the other two markers (r2 = 0.01 and 0.05). In the Gifu population, the coefficient among all five markers was calculated (Figure 1B). Two markers on the FASN gene showed a medium level of LD (r2 = 0.25), while the others showed an extremely low level of LD (r2 = 0.01–0.12).

3.4. LD between 50K SNPs and Gene Polymorphisms

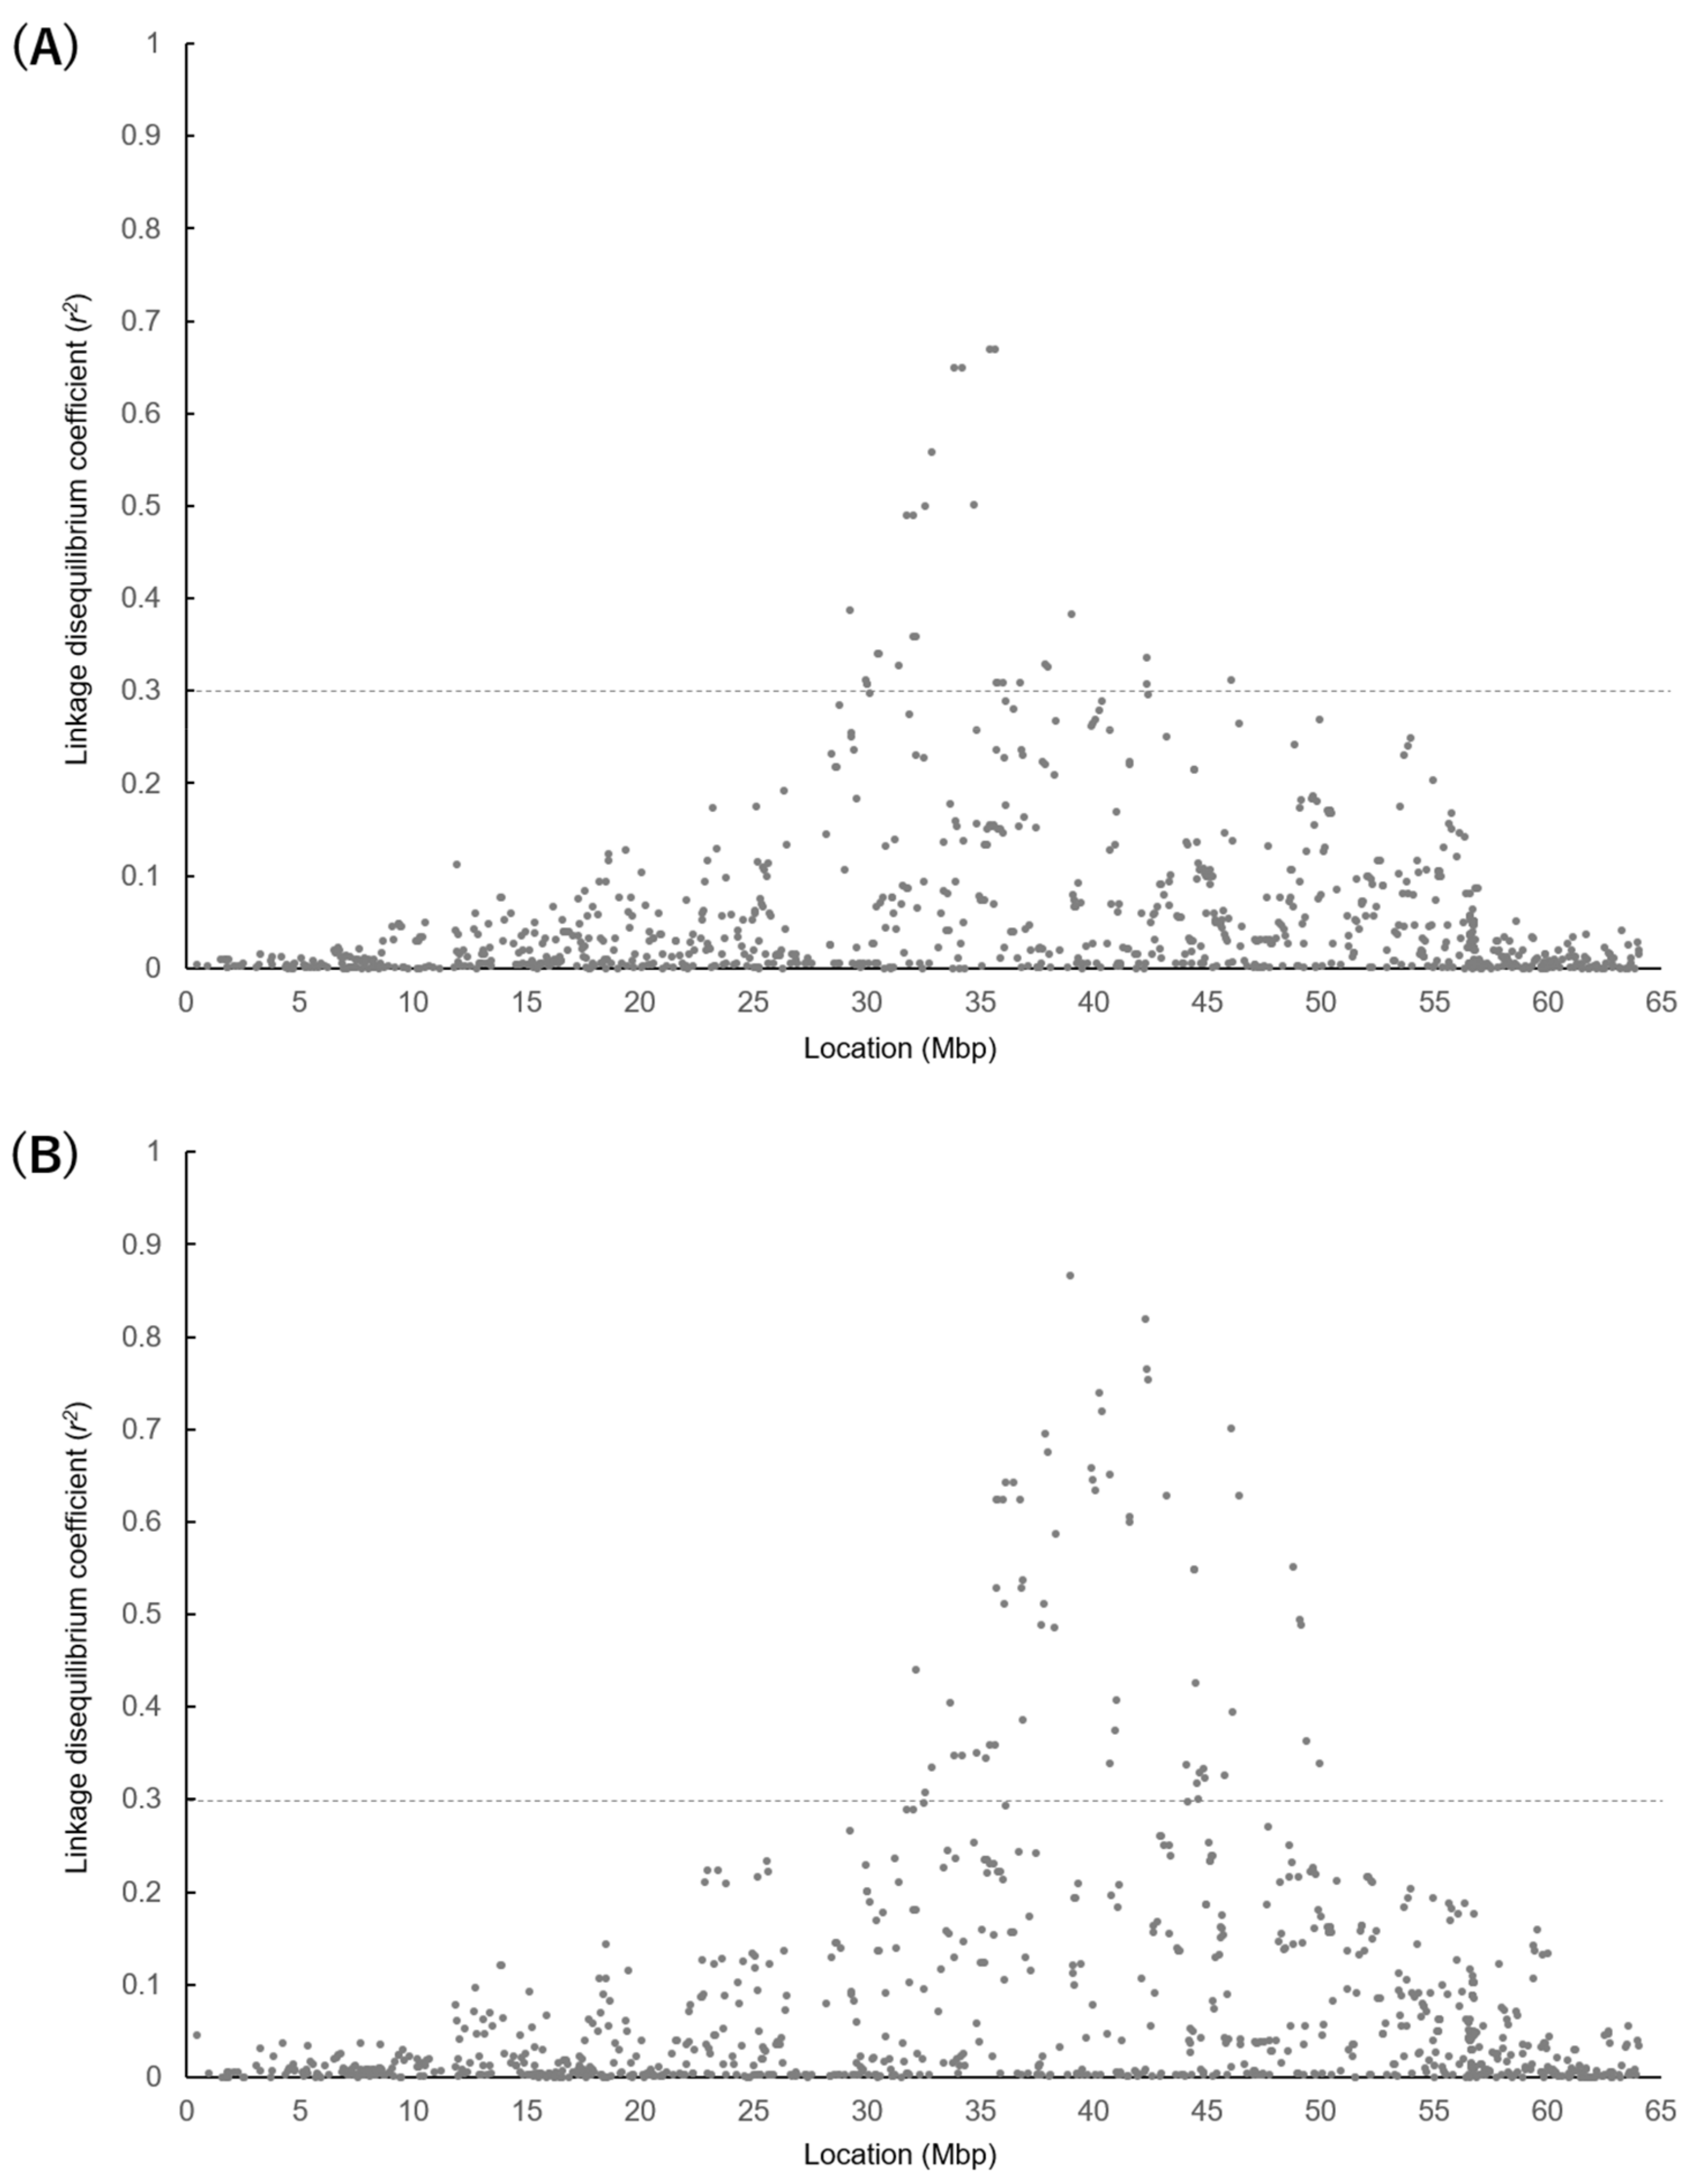
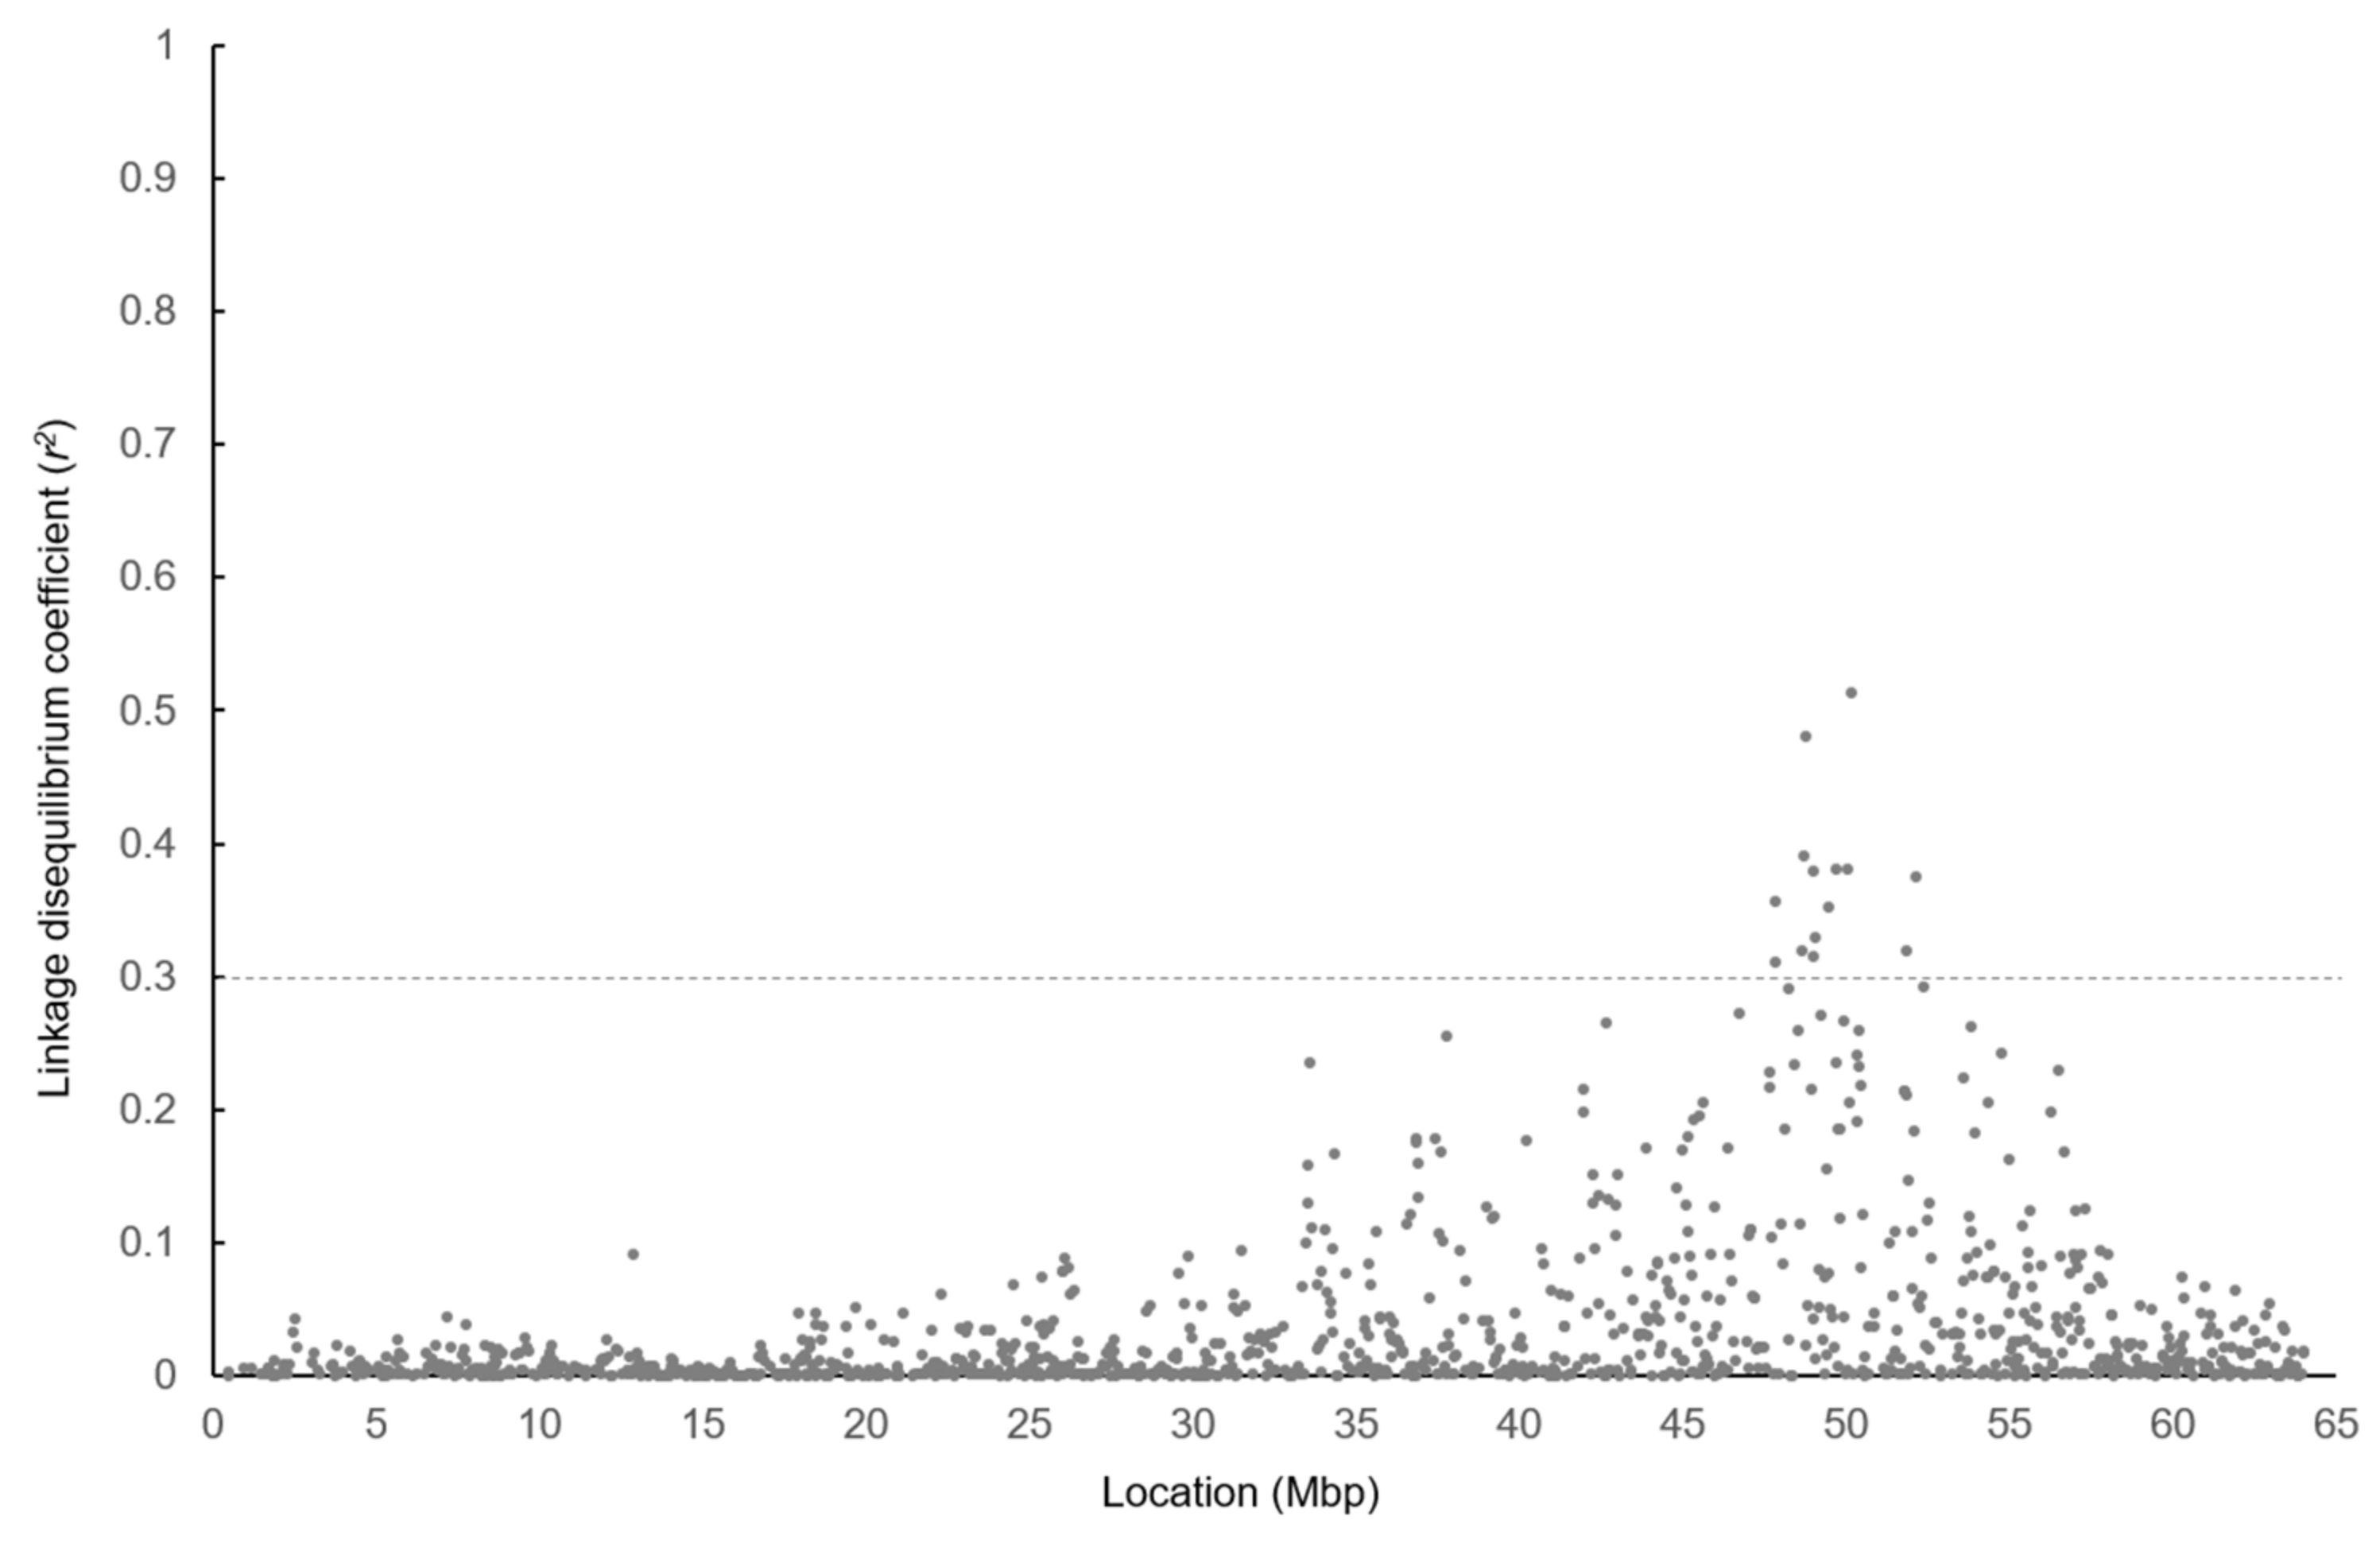
The LD coefficient (r2) between 50K SNPs and SREBP1 c.1065 + 83 or STARD3 c.1187 C > T in the Hyogo population can be seen in Figure 2, and the LD coefficient between the 50K SNPs and GH c.379 C > G in the Gifu population can be seen in Figure 3. Additionally, they provide an estimate of the range of the candidate region for the responsible gene of the QTL. An r2 > 0.30 was found for the SREBP1 and STARD3 polymorphisms from 29.2 to 46.4 Mbp and from 32.2 to 49.9 Mbp, respectively, in the Hyogo population. Among the 50K SNPs, UA-IFASA-6016 showed the maximum LD coefficient for the STARD3 polymorphism (r2 = 0.87). However, the LD (r2 > 0.30) for the GH polymorphism was observed in a relatively narrow range of about 47.8–52.1 Mbp in the Gifu population. Moreover, the maximum LD coefficient was not very high (r2 = 0.51).

4. Discussion

This study was focused on five gene polymorphisms in order to estimate the QTL region for the percentage of C18:1 on BTA19 in Japanese Black cattle. First, the association was verified between the five polymorphisms and the percentage of C18:1 in two Japanese Black cattle populations (i.e., the Hyogo and Gifu populations). Previous studies have reported that FASN polymorphisms are significantly associated with fatty acid composition in cattle populations [3,4,5,6], whereas FASN polymorphisms demonstrated no effect on the percentage of C18:1 in the Hyogo population. This finding could be caused by the fixing of alleles in both SNPs, which is corroborated by the finding that the minor allele frequencies of FASN g.841G > C and g.16024 A > G were 0.00 in 44 animals and 0.10 in 441 animals, respectively. Moreover, SCD gene polymorphism, which is another polymorphism that is likely responsible for fatty acid composition, has been found to be also almost fixed in Japanese Black cattle from the Hyogo Prefecture [20]. Although the beef produced in Hyogo is known for its quality, and these results suggest that the Hyogo population had been selected for fatty acid composition, this population has never been directly selected for it. These polymorphisms might have been indirectly selected under selection pressure. The Hyogo population is also known for a high level of inbreeding due to the uniquely closed breeding without any migrations from other populations. In fact, Honda et al. [23] reported that the average inbreeding coefficients for the Japanese Black cattle population of the Hyogo Prefecture in 1960, 1970, 1980, and 1998 were 0.03, 0.05, 0.08, 0.14, and 0.19, respectively. The recent inbreeding level was higher than the inbreeding level in the entire Japanese Black cattle population during the same period (<0.06) [24]. This is because the Hyogo population has been almost closed to the others and intensive inbreeding has been conducted for the improvement of beef quality. Therefore, the alleles in a genomic region associated with beef quality were fixed because composition of fatty acids partly determines the total quality. In conclusion, the fixing of FASN and SCD polymorphisms could have been caused by selection for beef quality in the Hyogo population. This might also provide evidence for the large effects of these polymorphisms on beef quality.
However, the STARD3 and SREBP1 polymorphisms were significantly associated with the percentage of C18:1 in the Hyogo population and were in moderate LD (r2 = 0.29). Previous studies reported that polymorphisms in relatively low LD (r2 = 0.10–0.28) show similar effects [25,26]. Considering this, the polymorphisms within the STARD3 (position: 35,234,637 bp to 35,250,672 bp) and SREBP1 (position: 40,664,260 bp to 40,688,948 bp) genes seem to be included in a single candidate region for a common responsible gene. Therefore, both polymorphisms are significantly associated with C18:1 in the Hyogo population. As the molecular mechanisms that affect fatty acid composition by these polymorphisms have not been demonstrated yet, another polymorphism might be responsible for the QTLs near the STARD3 and SREBP1 genes. Additionally, a more accurate range of the candidate region for a responsible gene of the QTL was estimated by calculating an LD coefficient (r2) between 50K SNPs and STARD3 or SREBP1 polymorphisms. As STARD3 and SREBP1 polymorphisms showed a strong association with the percentage of C18:1, these polymorphisms are in relatively high LD with a responsible polymorphism (at least r2 = 0.30). Hence, we focused on SNPs that showed an r2 of more than 0.30 with both STARD3 and SREBP1 polymorphisms, and we found that the SNPs were located from 32.2 to 46.4 Mbp. The responsible polymorphism for the QTL would be located within the candidate region.
In the Gifu population, FASN and GH polymorphisms were significantly associated with the percentage of C18:1. The two FASN polymorphisms were in moderate LD (r2 = 0.25) with each other. Moreover, a previous study [5] suggested that the SNP g.841 G > C is responsible for fatty acid composition in the Japanese Black cattle population in Gifu Prefecture. In this previous study, g.841 G > C and g.16024 A > G were genotyped in order to compare their effects on fatty acid composition, and both SNPs were significantly associated with fatty acid composition. However, the SNP g.16024 A > G exhibited little or no effects on fatty acid composition when its effect was analyzed using an analytical model including the effect of the g.841 G > C genotype as a co-factor. Considering these results, g.841 G > C is responsible for the percentage of C18:1 in the Gifu population, and the effect of g.16024 A > G was observed due to LD with g.841 G > C.
The GH polymorphism showed extremely low LD with g.841 G > C. Matsuhashi et al. [9] also reported that the GH polymorphism was significantly associated with the percentage of C18:1 in a Japanese Black cattle population that was bred during a different period in Gifu Prefecture. Although the functional mechanism for the regulation of fatty acid composition by the GH gene has not been elucidated, a responsible polymorphism is likely to be located within or near the gene. The range of the candidate region for a responsible gene of the QTL was additionally determined based on the LD coefficient (r2) between the 50K SNPs and GH polymorphism. Similar to the QTL in the Hyogo population, we focused on SNPs with an r2 of more than 0.30 with GH polymorphism. As the SNPs were located from 47.8 to 52.1 Mbp, it would be possible to identify a responsible gene and polymorphism for the percentage of C18:1 by further investigating the candidate region.
Additionally, another difference between the Gifu and Hyogo populations was detected. SREBP1 and STARD3 polymorphisms were not significantly associated with the percentage of C18:1 in the Gifu population, while they exhibited a large effect on the trait in the Hyogo population. Therefore, the QTL might not be located near the SREBP1 and STARD3 genes in the Gifu population. However, SREBP1 showed a value close to significant association with the percentage of C18:1 (p = 0.06). Additionally, a responsible polymorphism for the QTL could be relatively distant from the SREBP1 and STARD3 polymorphisms, as the candidate region identified in the Hyogo population exhibited a wide range. Considering these facts, the difference between populations might be due to lower LD between these polymorphisms and a responsible polymorphism in the Gifu population rather than in the Hyogo population. Additionally, the SREBP1 polymorphism was previously found to be significantly associated with fatty acid composition in other populations of Japanese Black cattle and foreign cattle breeds in previous studies [13,27,28]. Therefore, it is necessary to conduct further verification for the existence of a QTL near the SREBP1 and STARD3 genes using other polymorphisms in the Gifu population.
In the current study, the QTL for the percentage of C18:1 near the FASN gene was verified. Additionally, we detected a candidate region for the percentage of C18:1 including the SREBP1 and STARD3 polymorphisms in the Hyogo population and the GH polymorphism in the Gifu population (Figure 4). In Hyogo population, the allele of GH polymorphism was almost fixed and, therefore, the QTL near the GH gene was not detected in this study. Meanwhile, the QTL near SREBP1 and STARD3 genes was also not detected, probably due to extremely low level of LD with a responsible polymorphism in the Gifu population. In conclusion, the QTL position depends on populations because of various factors such as allele frequency and LD. The current study, moreover, succeeded in dividing each QTL region based on LD coefficients. A novel responsible gene and polymorphism for the percentage of C18:1 would be identified within each region by further investigations. Although this was the first study to verify the effects and LD of previously reported polymorphisms, which were investigated using different populations, our results suggest that verification using the same population reveals a more accurate number and position of the QTL. In the past few decades, several studies have reported significant associations between polymorphisms and economic traits in cattle. However, most of the responsible polymorphisms have not been elucidated yet. Further research is required, using a verification approach similar to that of the current study, in order to more clearly define the candidate regions and contribute to an efficient search for responsible genes and polymorphisms.

Author Contributions

Conceptualization and methodology, F.K. (Fuki Kawaguchi), F.K. (Fuka Kakiuchi), H.M. and S.S.; validation, F.K. (Fuki Kawaguchi) and F.K. (Fuka Kakiuchi); formal analysis, F.K. (Fuki Kawaguchi); investigation, F.K. (Fuka Kakiuchi); resources, K.O.; data curation, F.K. (Fuki Kawaguchi) and F.K. (Fuka Kakiuchi); writing—original draft preparation, F.K. (Fuki Kawaguchi); writing—review and editing, F.K. (Fuki Kawaguchi), K.O. and S.S.; visualization, F.K. (Fuki Kawaguchi); supervision, H.M.; project administration, S.S. All authors have read and agreed to the published version of the manuscript.

Funding

This research received no external funding.

Institutional Review Board Statement

Ethical review and approval were waived for this study, due to the collection of the tissue samples from slaughterhouses to go on a market.

Informed Consent Statement

Not applicable.

Data Availability Statement

Not applicable.

Acknowledgments

We thank the Wagyu Registry Association for providing the pedigree information of Japanese Black.

Conflicts of Interest

The authors declare no conflict of interest.

References

  1. Yang, A.; Larsen, T.W.; Powell, V.H.; Tume, R.K. A comparison of fat composition of Japanese and long-term grain-fed Australian steers. Meat Sci. 1999, 51, 1–9. [Google Scholar] [CrossRef]
  2. Wood, J.D.; Richardson, R.I.; Nute, G.R.; Fisher, A.V.; Campo, M.M.; Kasapidou, E.; Sheard, P.R.; Enser, M. Effects of fatty acids on meat quality: A review. Meat Sci. 2003, 66, 21–32. [Google Scholar] [CrossRef]
  3. Abe, T.; Saburi, J.; Hasebe, H.; Nakagawa, T.; Misumi, S.; Nade, T.; Nakajima, H.; Shoji, N.; Kobayashi, M.; Kobayashi, E. Novel mutations of the FASN gene and their effect of fatty acid composition in Japanese Black beef. Biochem. Genet. 2009, 47, 397–411. [Google Scholar] [CrossRef] [PubMed]
  4. Bartoň, L.; Bureš, D.; Kott, T.; Řehák, D. Associations of polymorphisms in bovine DGAT1, FABP4, FASN, and PPARGC1A genes with intramuscular fat content and the fatty acid composition of muscle and subcutaneous fat in Fleckvieh bulls. Meat Sci. 2016, 114, 18–23. [Google Scholar] [CrossRef]
  5. Hayakawa, K.; Sakamoto, T.; Ihii, A.; Yamaji, K.; Uemoto, Y.; Sasago, N.; Kobayashi, E.; Kobayashi, N.; Matsuhashi, T.; Maruyama, S.; et al. The g.841G>C SNP of FASN gene is associated with fatty acid composition in beef cattle. Anim. Sci. J. 2015, 86, 737–746. [Google Scholar] [CrossRef] [PubMed]
  6. Zhang, S.; Knight, T.J.; Reecy, J.M.; Beitz, D.C. DNA polymorphisms in bovine fatty acid synthase are associated with beef fatty acid composition. Anim. Genet. 2008, 39, 62–70. [Google Scholar] [CrossRef]
  7. Hoashi, S.; Ashida, N.; Ohsaki, H.; Utsugi, T.; Sasazaki, S.; Taniguchi, M.; Oyama, K.; Mukai, F.; Mannen, H. Genotype of bovine sterol regulatory element binding protein-1 (SREBP-1) is associated with fatty acid composition in Japanese Black cattle. Mamm. Genome 2007, 18, 880–886. [Google Scholar] [CrossRef]
  8. Kigoshi, H.; Kawaguchi, F.; Oyama, K.; Mannen, H.; Sasazaki, S. Effect of STARD3 gene polymorphism on carcass traits and fatty acid composition in Japanese Black cattle. J. Anim. Genet. 2019, 47, 37–45. [Google Scholar] [CrossRef]
  9. Matsuhashi, T.; Maruyama, S.; Uemoto, Y.; Kobayashi, N.; Mannen, H.; Abe, T.; Sakaguchi, S.; Kobayashi, E. Effects of bovine fatty acid synthase, stearoyl-coenzyme A desaturase, sterol regulatory element-binding protein 1, and growth hormone gene polymorphisms on fatty acid composition and carcass traits in Japanese Black cattle. J. Anim. Sci. 2011, 89, 12–22. [Google Scholar] [CrossRef] [Green Version]
  10. Chakravarty, B.; Gu, Z.; Chirala, S.S.; Wakil, S.J.; Quiocho, F.A. Human fatty acid synthase: Structure and substrate selectivity of the thioesterase domain. Proc. Natl. Acad. Sci. USA 2004, 101, 15567–15572. [Google Scholar] [CrossRef] [Green Version]
  11. Ordovás, L.; Roy, R.; Pampín, S.; Zaragoza, P.; Osta, R.; Rodríguez-Rey, J.C.; Rodellar, C. The g.763G>C SNP of the bovine FASN gene affects its promoter activity via Sp-mediated regulation: Implications for the bovine lactating mammary gland. Physiol. Genom. 2008, 34, 144–148. [Google Scholar] [CrossRef] [PubMed] [Green Version]
  12. Shimano, H. Sterol regulatory element-binding proteins (SREBPs): Transcriptional regulators of lipid synthetic genes. Prog. Lipid Res. 2001, 40, 439–452. [Google Scholar] [CrossRef]
  13. Gamarra, D.; Aldai, N.; Arakawa, A.; de Pancorbo, M.M.; Taniguchi, M. Effect of a genetic polymorphism in SREBP1 on fatty acid composition and related gene expression in subcutaneous fat tissue of beef cattle breeds. Anim. Sci. J. 2021, 92, e13521. [Google Scholar] [CrossRef] [PubMed]
  14. Aply, F.; Stoeckel, M.E.; Dierich, A.; Escola, J.M.; Wendling, C.; Chenard, M.P.; Vanier, M.T.; Gruenberg, J.; Tomasetto, C.; Rio, M.C. The steroidogenic acute regulatory protein homolog MLN64, a late endosomal cholesterol-binging protein. J. Biol. Chem. 2001, 276, 4261–4269. [Google Scholar]
  15. Wilhelm, L.P.; Wendling, C.; Védie, B.; Kobayashi, T.; Chenard, M.P.; Tomasetto, C.; Drin, G.; Alpy, F. STARD3 mediates endoplasmic reticulum-to-endosome cholesterol trans port at membrane contact sites. EMBO J. 2017, 36, 1412–1433. [Google Scholar] [CrossRef] [PubMed]
  16. Hocquette, J.F. Endocrine and metabolic regulation of muscle growth and body composition in cattle. Animal 2010, 4, 1797–1809. [Google Scholar] [CrossRef] [Green Version]
  17. Troike, K.M.; Henry, B.E.; Jensen, E.A.; Young, J.A.; List, E.O.; Kopchick, J.J.; Berryman, D.E. Impact of growth hormone on regulation of adipose tissue. Compr. Physiol. 2017, 7, 819–840. [Google Scholar]
  18. Sambrook, J.; Russell, D.W. Molecular Cloning: A Laboratory Manual, 3rd ed.; Cold Spring Harbor Laboratory Press: Cold Spring Harbor, NY, USA, 2001. [Google Scholar]
  19. Folch, J.; Lees, M.; Stanley, G.H.S. A simple method for the isolation and purification of total lipides from animal tissues. J. Biol. Chem. 1957, 226, 497–509. [Google Scholar] [CrossRef]
  20. Ookura, K.; Akiyama, T.; Yoshida, E.; Fukushima, M.; Iwamoto, E.; Oka, A.; Matsumoto, H.; Sasazaki, S.; Oyama, K.; Mannen, H. Effects of genes on economically important traits of Japanese Black cattle in Hyogo population. Nihon Chikusan Gakkaiho 2013, 84, 157–162. [Google Scholar] [CrossRef] [Green Version]
  21. Chikuni, K.; Nagatsuma, T.; Tabata, T.; Monma, M.; Saito, M.; Ozawa, S.; Ozutsumi, K. Genetic variations of the growth hormone gene in Japanese cattle. Anim. Sci. Technol. 1994, 65, 340–346. [Google Scholar]
  22. Ishii, A.; Yamaji, K.; Uemoto, Y.; Sasago, N.; Kobayashi, E.; Kobayashi, N.; Matsuhashi, T.; Maruyama, S.; Matsumoto, H.; Sasazaki, S.; et al. Genome-wide association study for fatty acid composition in Japanese Black cattle. Anim. Sci. J. 2013, 84, 675–682. [Google Scholar] [CrossRef] [PubMed]
  23. Honda, T.; Nomura, T.; Fukushima, M.; Mukai, F. Genetic diversity of a closed population of Japanese Black cattle in Hyogo Prefecture. Anim. Sci. J. 2001, 72, 378–385. [Google Scholar] [CrossRef]
  24. Nomura, T.; Honda, T.; Mukai, F. Inbreeding and effective population size of Japanese Black cattle. J. Anim. Sci. 2001, 79, 366–370. [Google Scholar] [CrossRef]
  25. Jia, P.; Cai, C.; Qu, K.; Chen, N.; Jia, Y.; Hanif, Q.; Liu, J.; Zhang, J.; Che, H.; Huang, B.; et al. Four novel SNPs of MYO1A gene associated with heat-tolerance in Chinese cattle. Animals 2019, 9, 964. [Google Scholar] [CrossRef] [Green Version]
  26. Weikard, R.; Kühn, C.; Goldammer, T.; Freyer, G.; Schwerin, M. The bovine PPARGC1A gene: Molecular characterization and association of an SNP with variation of milk fat synthesis. Physiol. Genom. 2005, 21, 1–13. [Google Scholar] [CrossRef] [Green Version]
  27. Ohsaki, H.; Tanaka, A.; Hoashi, S.; Sasazaki, S.; Oyama, K.; Taniguchi, M.; Mukai, F.; Mannen, H. Effect of SCD and SREBP genotypes on fatty acid composition in adipose tissue of Japanese Black cattle herds. Anim. Sci. J. 2009, 80, 225–232. [Google Scholar] [CrossRef] [PubMed]
  28. Xu, L.; Zhang, L.P.; Yuan, Z.R.; Guo, L.P.; Zhu, M.; Gao, X.; Gao, H.J.; Li, J.Y.; Xu, S.Z. Polymorphism of SREBP1 is associated with beef fatty acid composition in Simmental bulls. Genet. Mol. Res. 2013, 12, 5802–5809. [Google Scholar] [CrossRef]
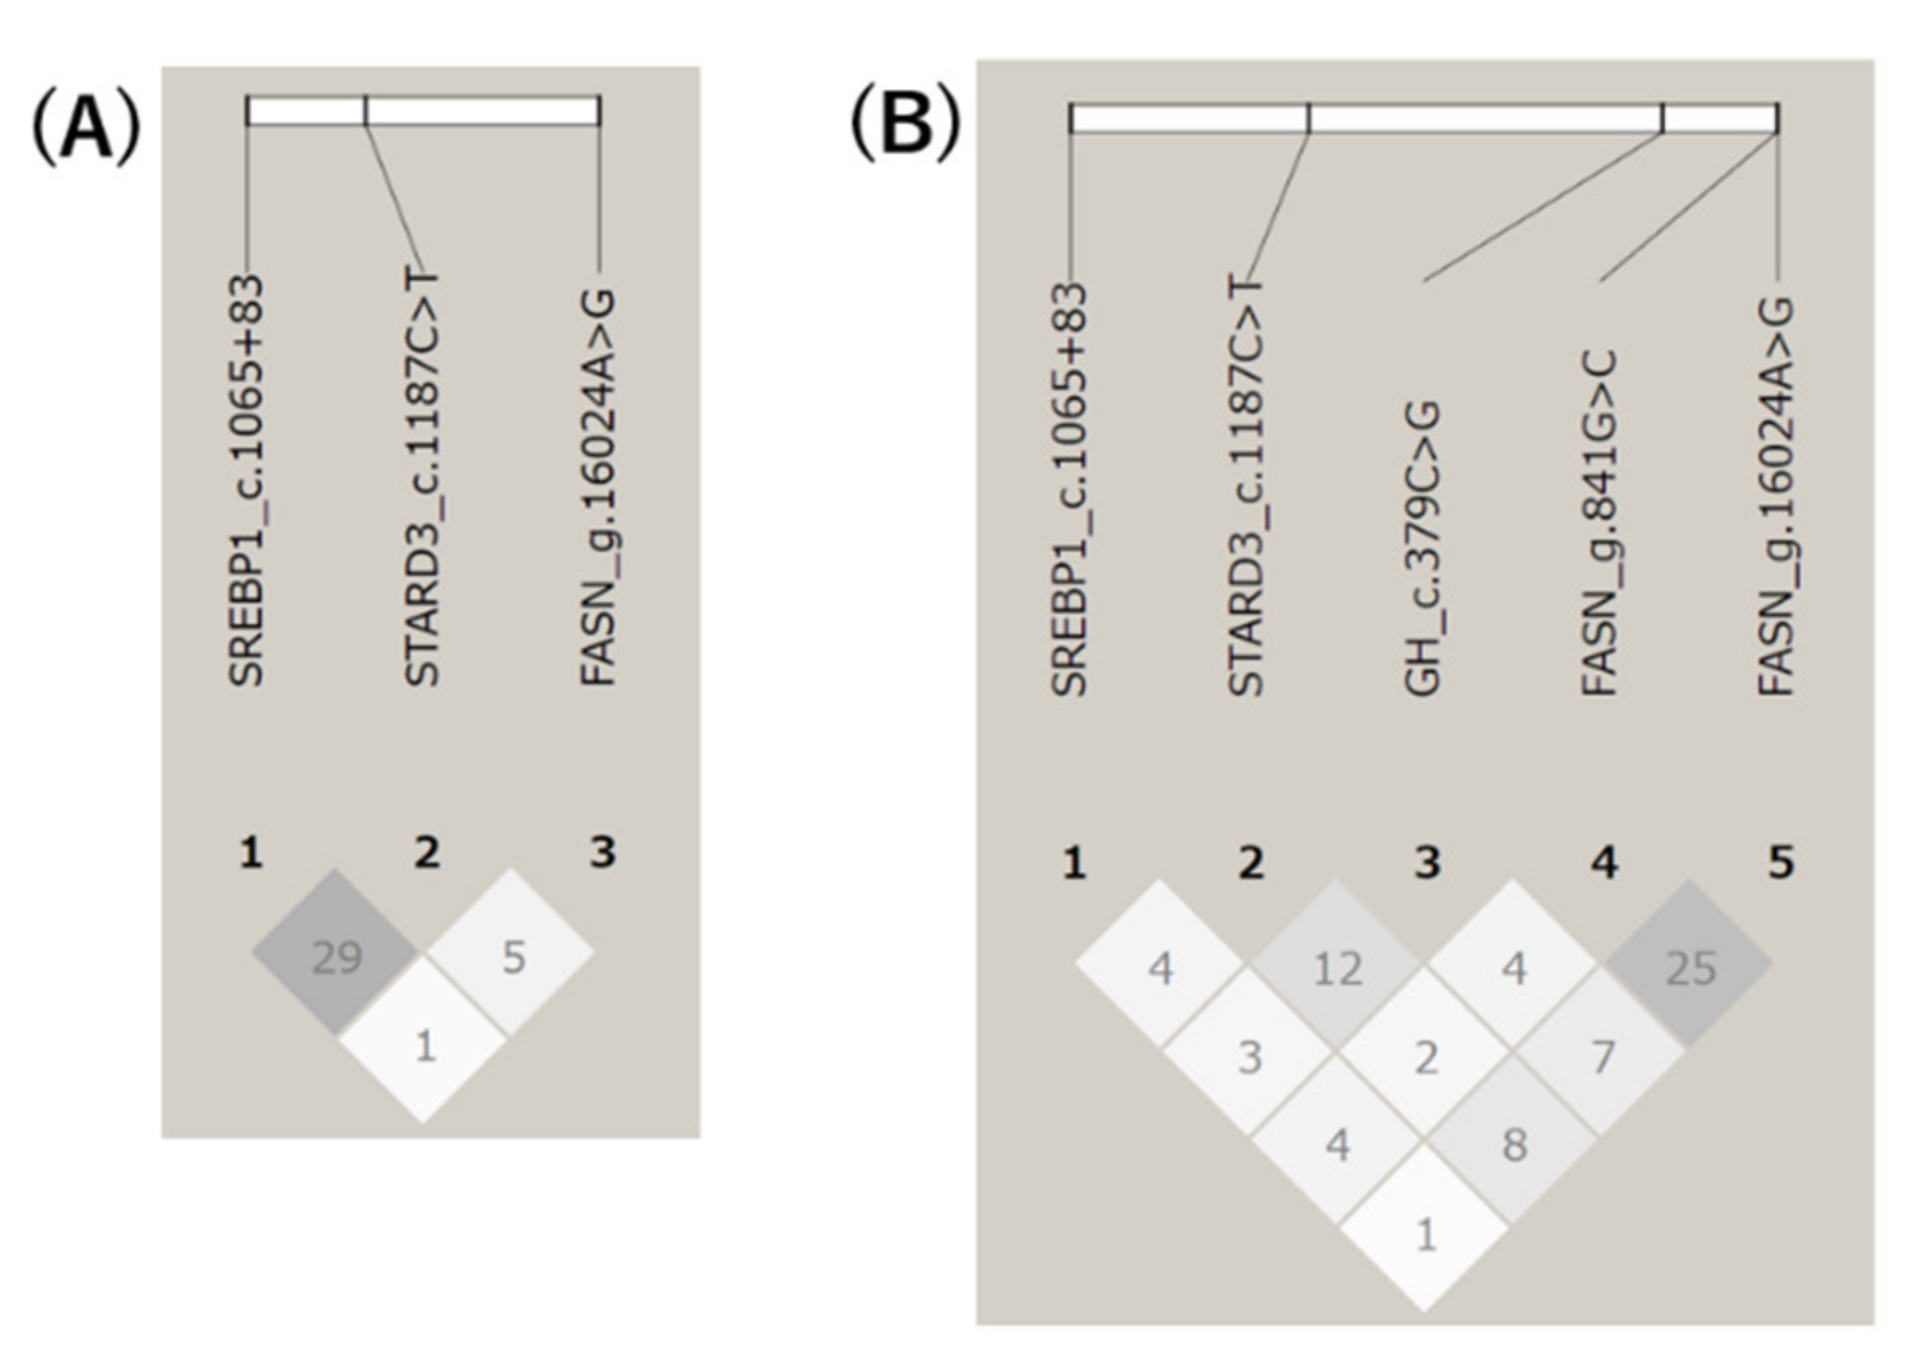
Figure 1. Linkage disequilibrium among the polymorphisms in Hyogo (A) and Gifu (B) populations. The r2 values are shown in each box with darker color representing stronger LD.
Life 11 00597 g001
Figure 2. Linkage disequilibrium coefficients (r2) between 50K SNPs and SREBP1 c.1065 + 83 (A) or STARD3 c.1187 C > T (B) in Hyogo population (n = 200). X-axis represents SNP locations of 50K SNPs on BTA19 while y-axis represents r2-values.
Life 11 00597 g002
Figure 3. Linkage disequilibrium coefficients (r2) between 50K SNPs and GH c.379 C>G in Gifu population (n = 443). The X-axis represents SNP locations of 50K SNPs on BTA19 while the y-axis represents r2-values.
Life 11 00597 g003
Figure 4. Estimated QTL positions on BTA19 in each population. The closed bar indicates a part of bovine chromosome 19 with approximate locations (Mbp). The dotted boxes indicate positions of estimated QTL in Hyogo (A) and Gifu (B) populations. The inverted triangles indicate positions of the polymorphisms which were significantly associated with C18:1 percentage (closed) or not associated (opened).
Life 11 00597 g004
Table 1. Summary statistics of the two Japanese Black populations.
Hyogo PopulationGifu Population
nTotal441443
steers/heifers352/89443/0
Sires 757
Age at slaughter (months)Mean ± SD31.69 ± 1.2428.32 ± 1.10
Max35.8734.62
Min28.4425.74
C18:1 percentage (%)Mean ± SD54.76 ± 3.0151.92 ± 3.29
Max64.0160.54
Min45.4543.67
Table 2. Polymorphisms located on BTA19 and significantly associated with fatty acid composition in Japanese Black cattle in previous studies.
LocationIDGenePositionPolymorphismAmino AcidReference
35,244,514rs133958066SREBP1Intron 5c.1065+83 (84bp indel)-[7]
40,687,937rs134877666STARD3Exon 14c.1187 C > TS396L[8]
48,768,916rs41923484GHExon 5c.379 C > GL127V[21]
51,384,984rs41920005FASNExon 1g.841 G>C-[5]
51,400,139rs480320793FASNExon 34g.16024 A>GT1950A[3]
Location, location of polymorphisms on BTA19 based on the genome reference, Bos_taurus_UMD_3.1.1; Position, position of polymorphism for each gene; Amino acid, substitution of amino acids caused by the polymorphism.
Table 3. Protocol summary for genotyping by PCR-RFLP or TaqMan method.
Gene MarkerMethodSequence (from 5′ to 3′)ATPLREReference
SREBP1 c.1065 + 83PCRF: CCA CAA CGC CAT CGA GAA ACG CTA C60348/432-[7]
R: GGC CTT CCC TGA CCA CCC AAC TTA G
STARD3 c.1187 C > TPCR-RFLPF: AGG AGG ATT TGA GCA CCC CAT60351MscI[8]
R: CAA GGT CAC ACA GCA CAC TCC
GH c.379 C > GPCR-RFLPF: CTT AGC CAG GAG AAT GCA CG66605AlwNI-
R: ATG CCT GCT ATT GTC TTC CC
Taq-ManF: CAA ATT TGT CAT AGG TCT GCT TG64228--
R: CCC TCT TTC TAG CAG TCC AG
P1: FAM- CAT CTT CCA GCT CCT GCC A -BHQ
P2: HEX- CAT CTT CCA CCT CCT GCC A -BHQ
FASN g.841 G > CTaq-ManF: ACA CTC CAT CCT CGC TC60102-[5]
R: TCC CGA CTC GCA ACT TC
P1: FAM- ACA GCC GCC CGC G -BHQ
P2: HEX- ACA GCC CCC CGC GC -BHQ
AT, annealing temperature (°C); PL, PCR product length (bp); RE restriction enzyme.
Table 4. Genotype and allele frequencies for the five polymorphisms and their association with the percentage of C18:1 in the Hyogo population (n = 441).
PolymorphismA AlleleB AlleleGenotype FrequencyAllele Frequencyp-ValueMeans ± SE of C18:1
AAABBBABAAABBB
SREBP1 c.1065 + 83LS210180510.790.214.00 × 10−455.28 ± 0.2054.56 ± 0.2153.32 ± 0.47
STARD3 c.1187 C > TCT141206940.550.451.68 × 10−555.88 ± 0.2554.65 ± 0.1953.29 ± 0.29
GH c.379 C > GGC48001.000.00----
FASN g.841 G > CGC44001.000.00----
FASN g.16024 A > GAG3607380.900.100.61454.63 ± 0.1655.33 ± 0.3455.09 ± 1.22
p-value: association was analyzed by analysis of variance.
Table 5. Genotype and allele frequencies for the five polymorphisms and their association with the percentage of C18:1 in Gifu population (n = 443).
PolymorphismA AlleleB AlleleGenotype FrequencyAllele Frequencyp-ValueMeans ± SE of C18:1
AAABBBABAAABBB
SREBP1 c.1065 + 83LS159218660.610.390.06052.06 ± 0.2652.09 ± 0.2251.02 ± 0.37
STARD3 c.1187 C > TCT1102271060.510.490.14351.60 ± 0.3351.83 ± 0.2152.42 ± 0.31
GH c.379 C > GGC189208460.660.344.00 × 10−352.58 ± 0.2351.42 ± 0.2451.46 ± 0.42
FASN g.841 G > CGC3627830.910.098.24 × 10−552.23 ± 0.1750.44 ± 0.3752.79 ± 3.65
FASN g.16024 A > GAG305126120.830.171.00 × 10−352.25 ± 0.1951.25 ± 0.2850.53 ± 1.03
p-value: association was analyzed by analysis of variance.
Publisher’s Note: MDPI stays neutral with regard to jurisdictional claims in published maps and institutional affiliations.