Use of Reflective Tape to Detect Ultrasound Transducer Movement: A Validation Study


Abstract
1. Introduction
2. Materials and Methods
2.1. Design and Ethics
2.2. Sample
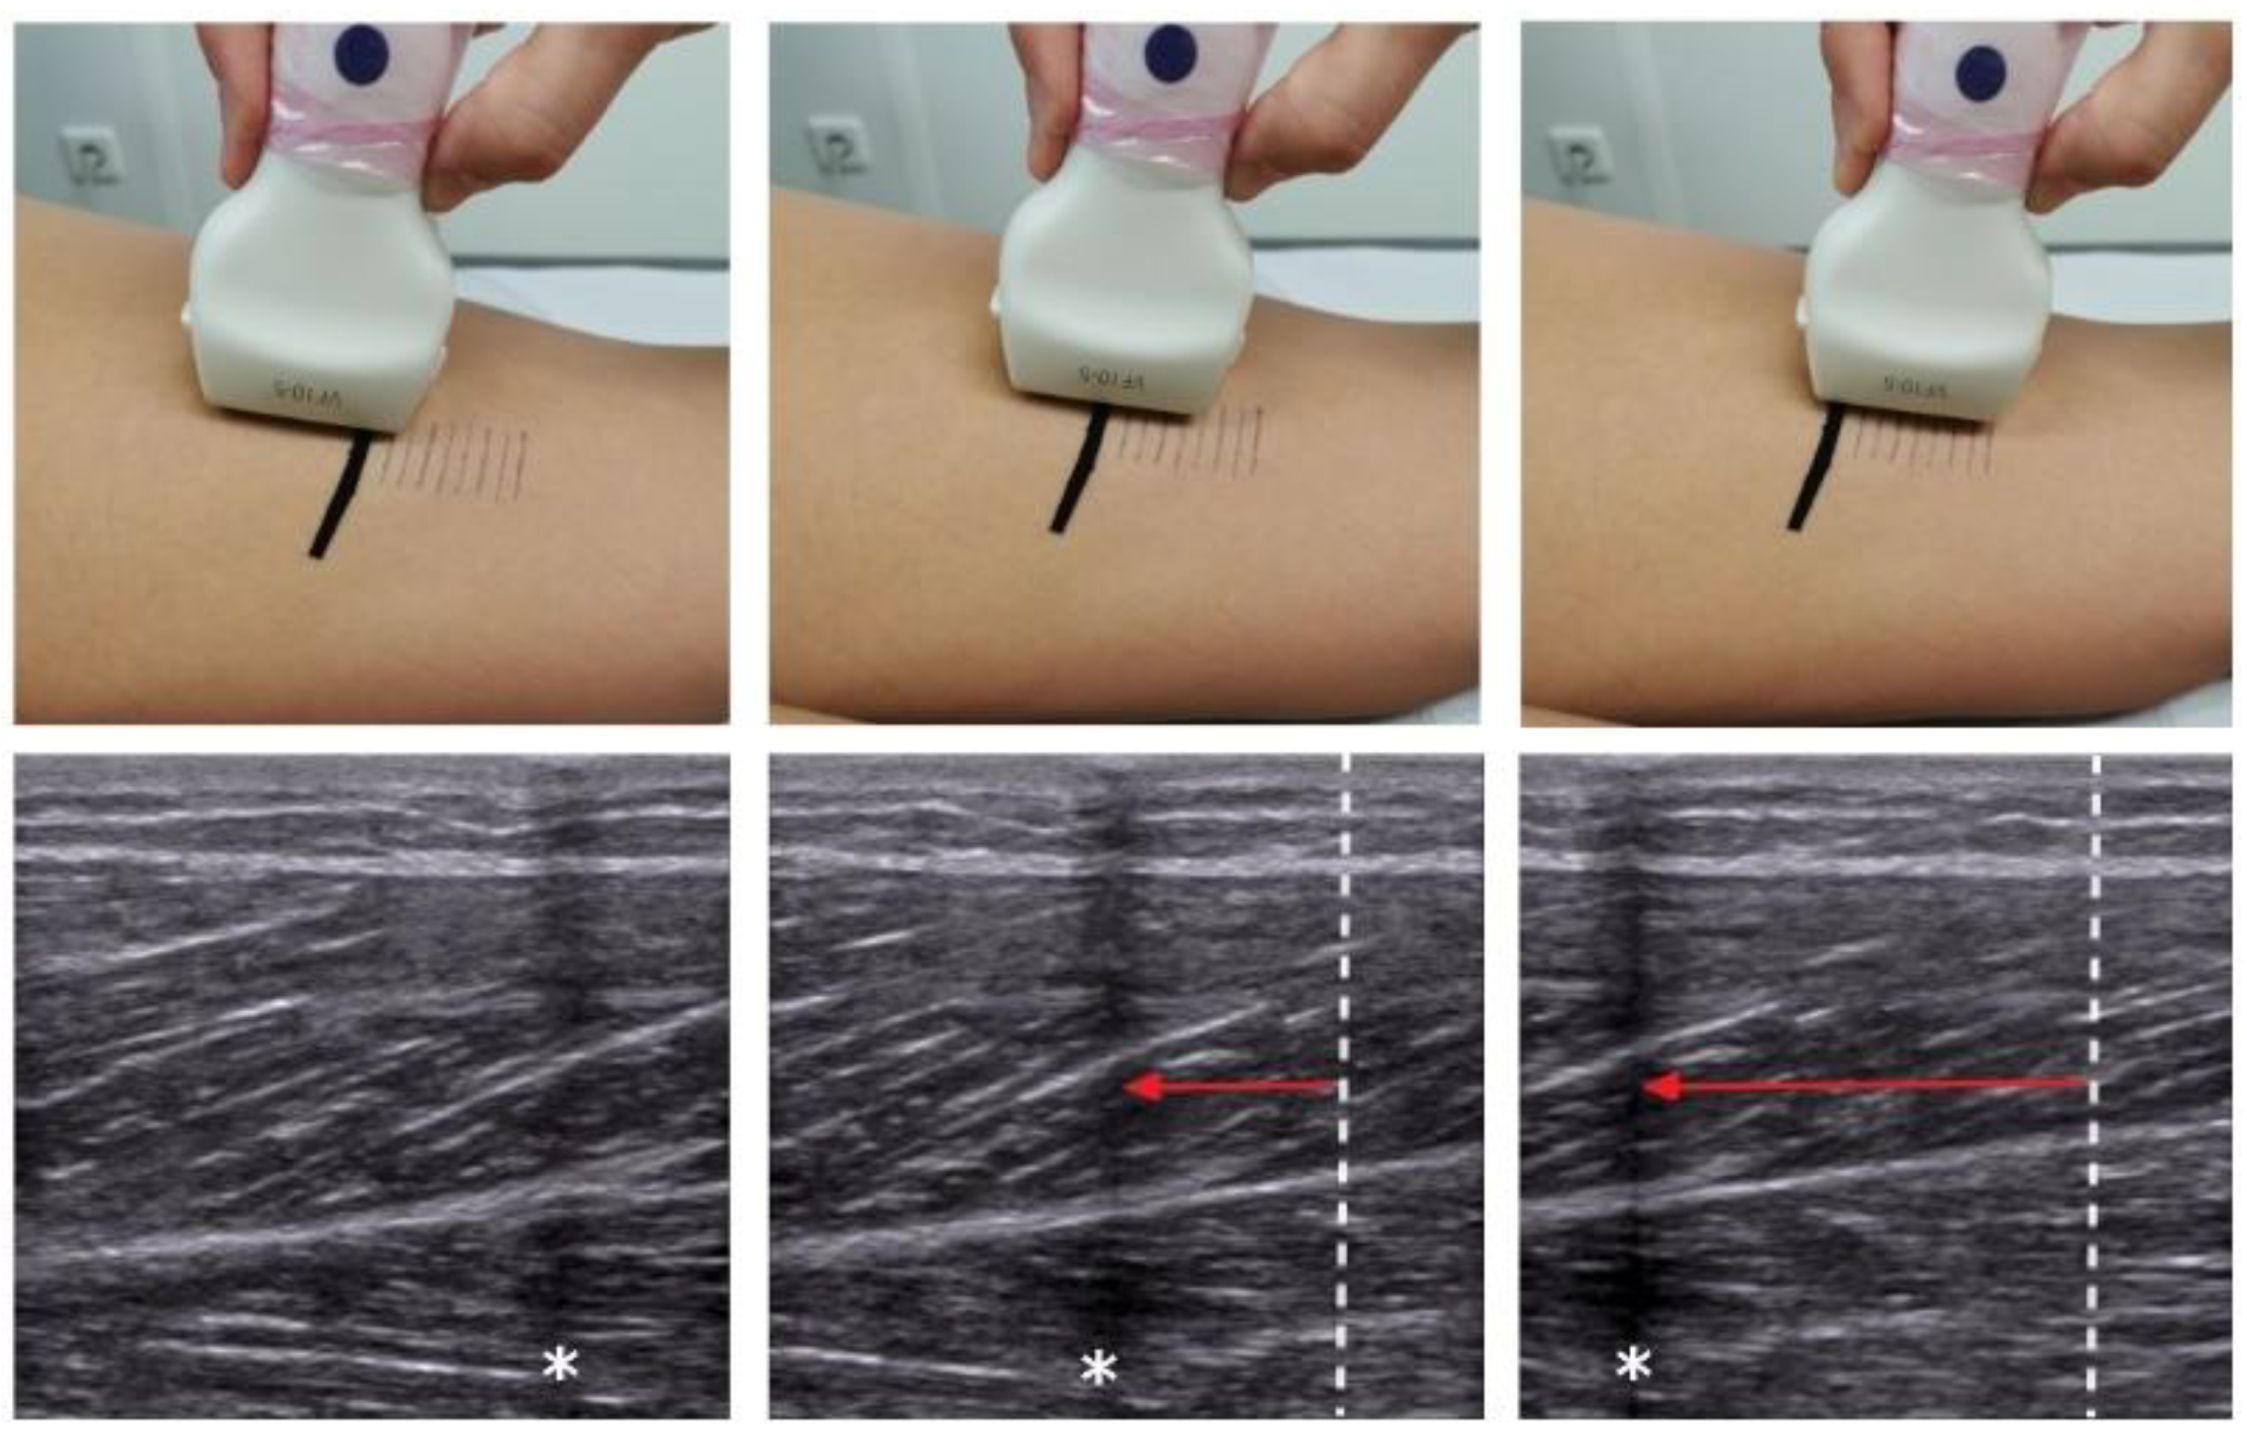
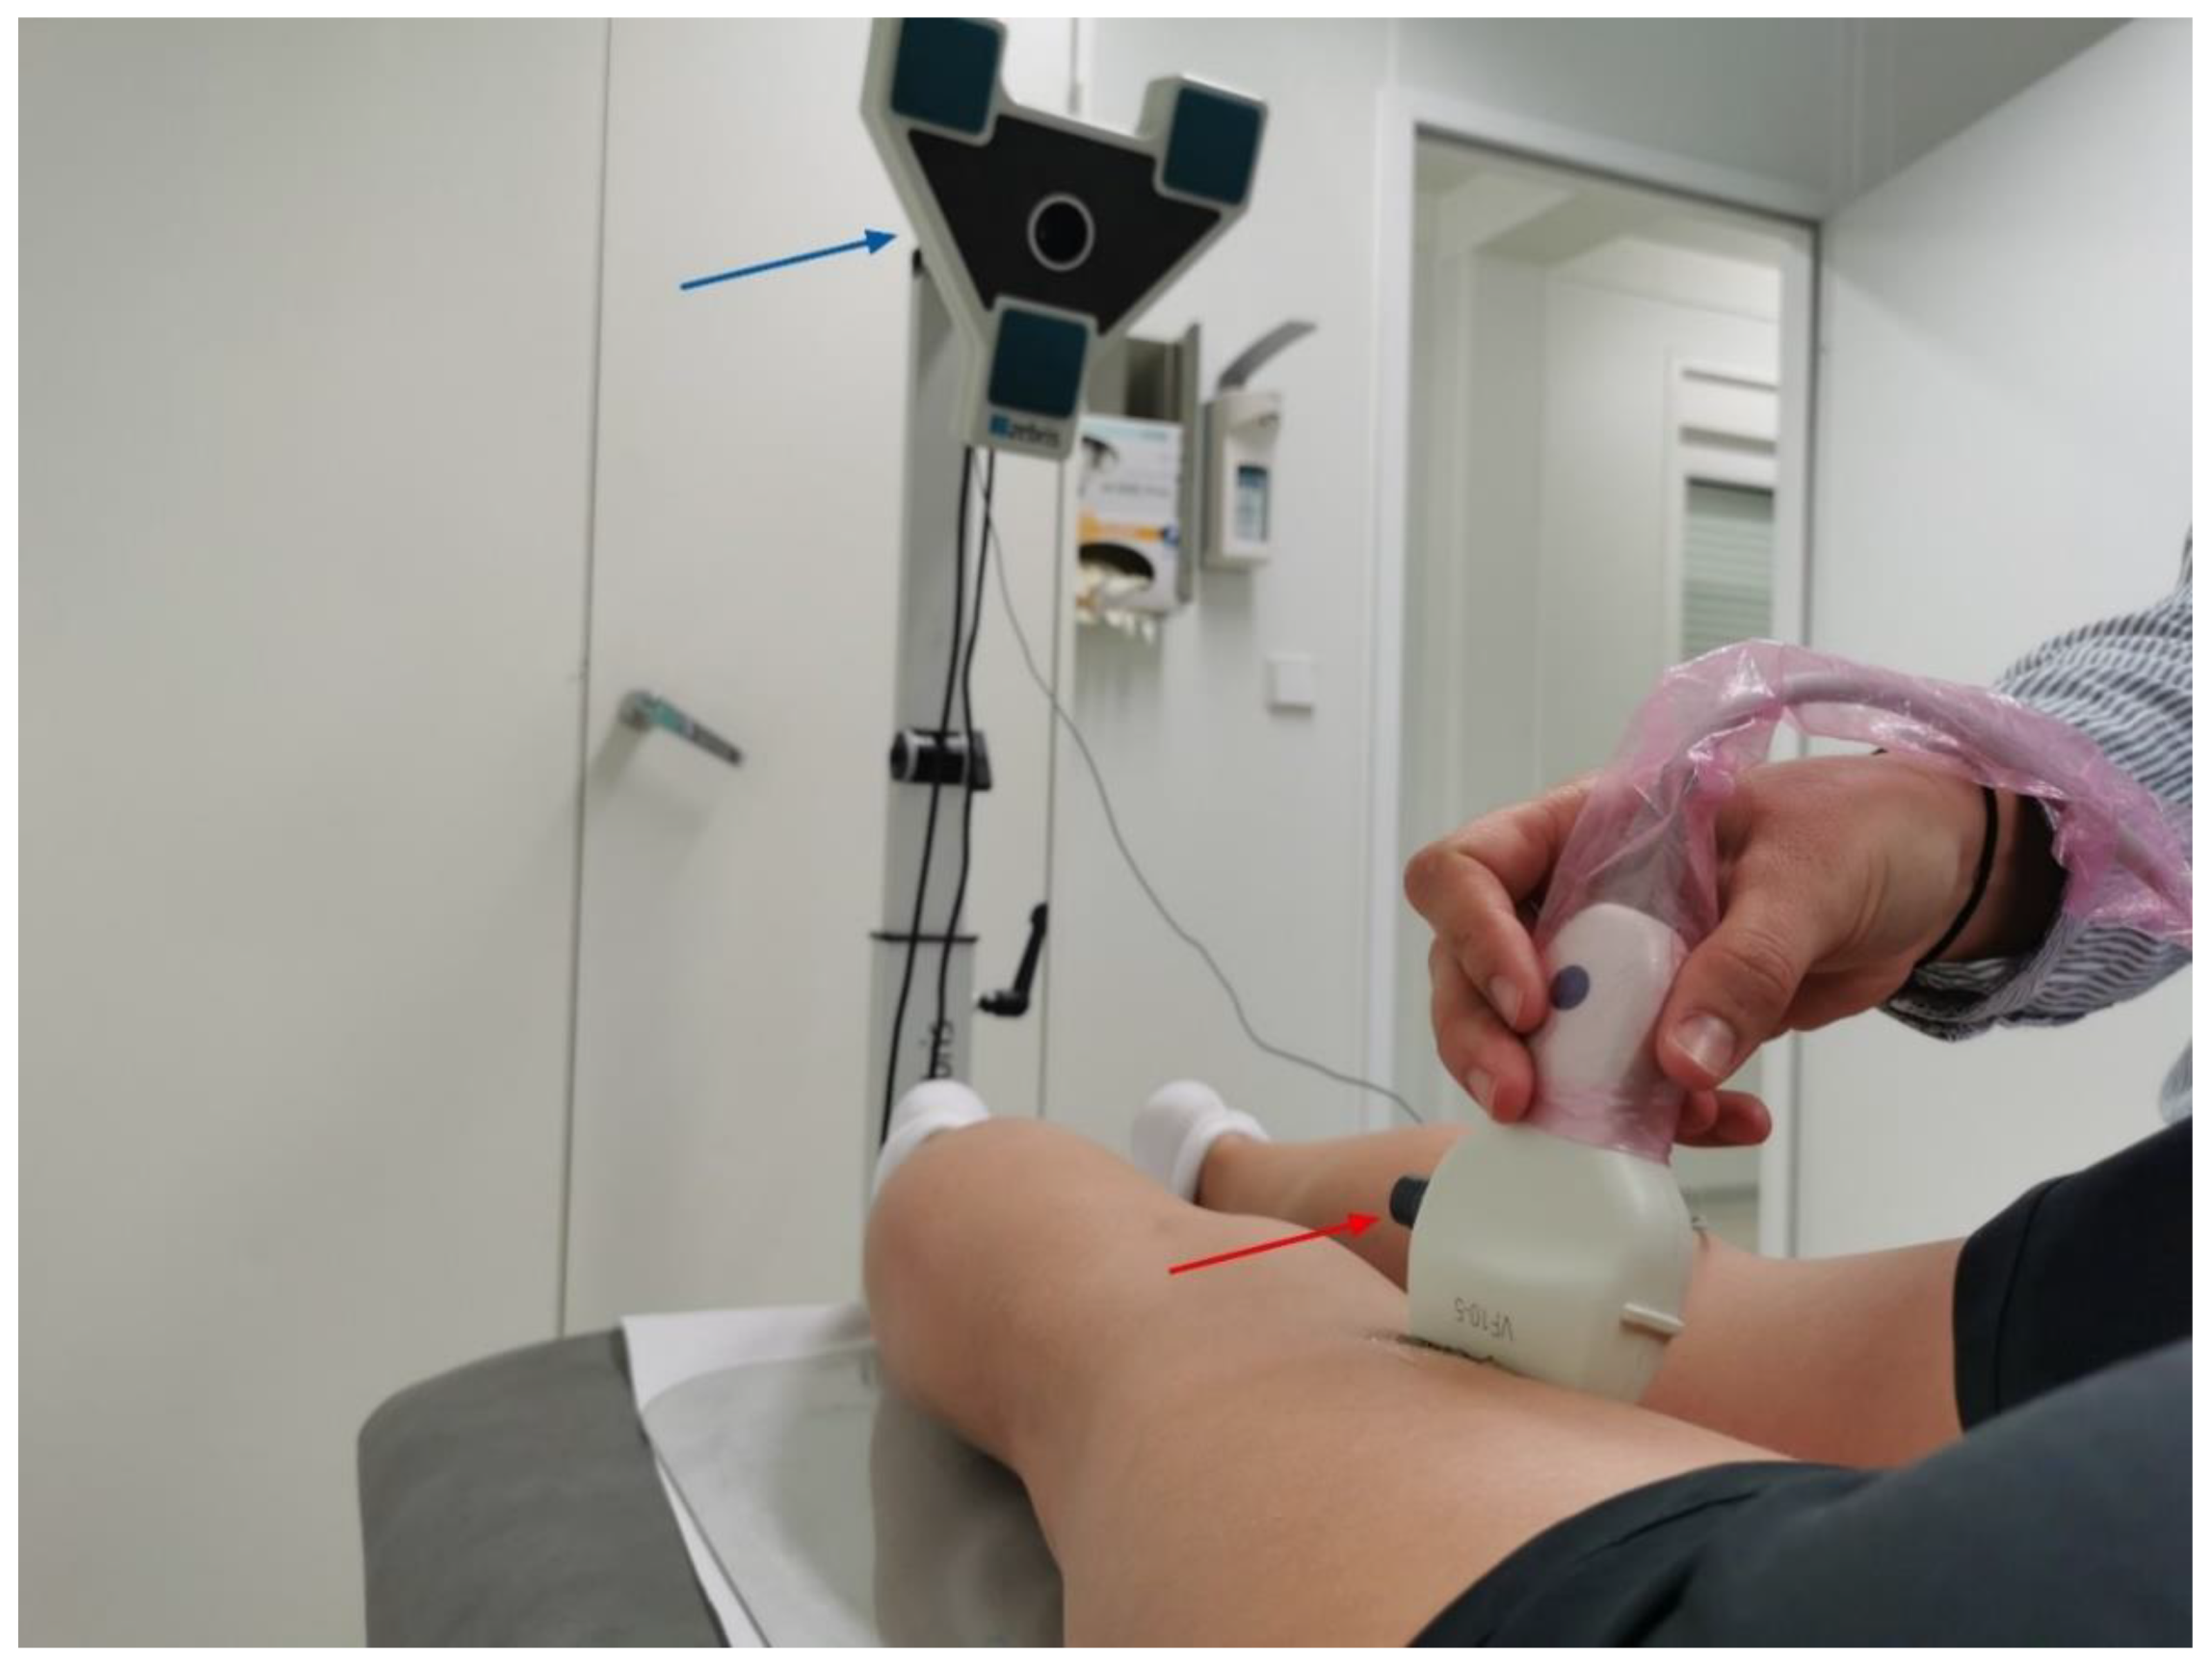
2.3. Examination
2.4. Outcomes
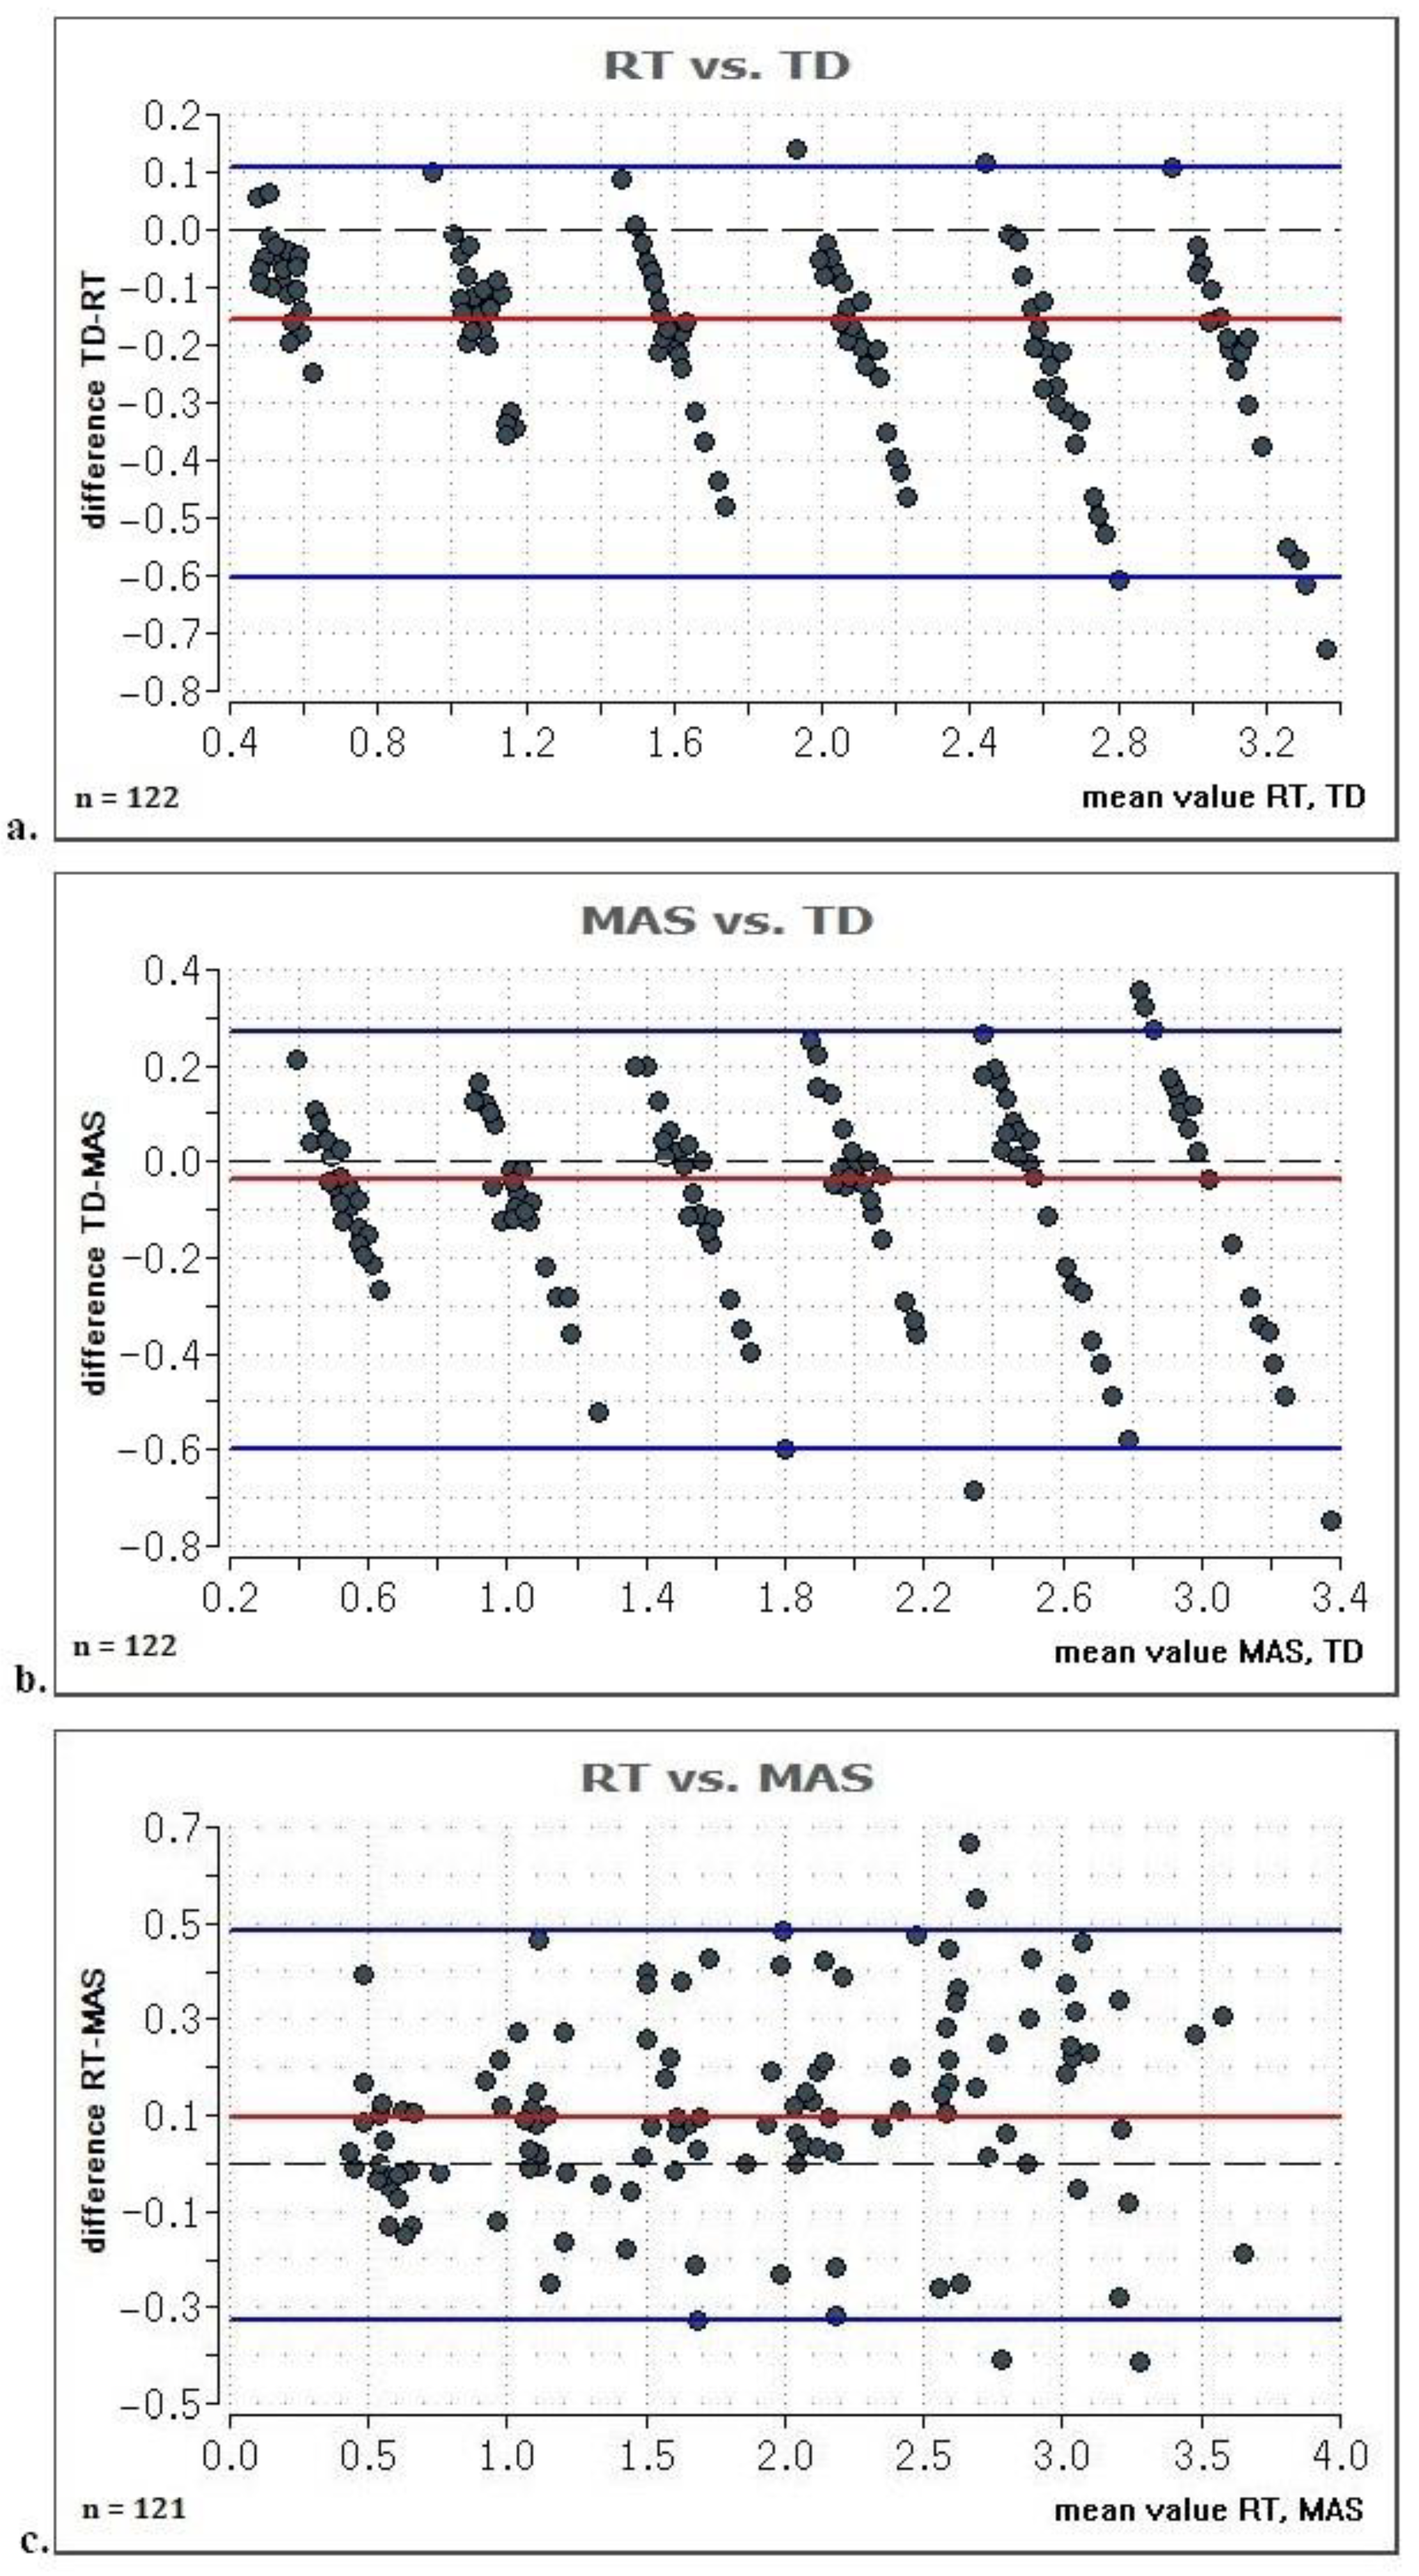
3. Results
4. Discussion
5. Conclusions
Author Contributions
Funding
Institutional Review Board Statement
Informed Consent Statement
Data Availability Statement
Acknowledgments
Conflicts of Interest
References
- ShahAli, S.; Shanbehzadeh, S.; ShahAli, S.; Takamjani, I.E. Application of Ultrasonography in the Assessment of Abdominal and Lumbar Trunk Muscle Activity in Participants with and without Low Back Pain: A Systematic Review. J. Manip. Physiol. Ther. 2019, 42, 541–550. [Google Scholar] [CrossRef]
- Abe, T.; Loenneke, J.P.; Thiebaud, R.S. Morphological and functional relationships with ultrasound measured muscle thickness of the lower extremity: A brief review. Ultrasound 2015, 23, 166–173. [Google Scholar] [CrossRef]
- Roy, J.-S.; Braën, C.; Leblond, J.; Desmeules, F.; Dionne, C.E.; MacDermid, J.C.; Bureau, N.J.; Frémont, P. Diagnostic accuracy of ultrasonography, MRI and MR arthrography in the characterisation of rotator cuff disorders: A systematic review and meta-analysis. Br. J. Sports Med. 2015, 49, 1316–1328. [Google Scholar] [CrossRef] [PubMed]
- Cronin, N.J.; Lichtwark, G. The use of ultrasound to study muscle-tendon function in human posture and locomotion. Gait Posture 2013, 37, 305–312. [Google Scholar] [CrossRef]
- Rothwell, D.T.; Fong, D.T.P.; Stapley, S.A.; Williams, D.J. A clinically applicable tool for rapidly estimating muscle volume using ultrasound images. Eur. J. Appl. Physiol. 2019, 119, 2685–2699. [Google Scholar] [CrossRef] [PubMed]
- Lee, H.-J.; Ha, H.-G.; Hahn, J.; Lim, S.; Lee, W.-H. Intra- and inter-rater reliabilities for novel muscle thickness assessment during Co-contraction with dual-rehabilitative ultrasound imaging. Phys. Ther. Sport 2018, 32, 109–114. [Google Scholar] [CrossRef] [PubMed]
- Morse, C.I.; Smith, J.; Denny, A.; Tweedale, J.; Searle, N.D. Gastrocnemius medialis muscle architecture and physiological cross sectional area in adult males with Duchenne muscular dystrophy. J. Musculoskelet. Neuronal Interact. 2015, 15, 154–160. [Google Scholar] [PubMed]
- Pillen, S.; van Alfen, N. Skeletal muscle ultrasound. Neurol. Res. 2011, 33, 1016–1024. [Google Scholar] [CrossRef] [PubMed]
- Pretorius, A.; Keating, J.L. Validity of real time ultrasound for measuring skeletal muscle size. Phys. Ther. Rev. 2008, 13, 415–426. [Google Scholar] [CrossRef]
- Meyer, N.B.; Jacobson, J.A.; Kalia, V.; Kim, S.M. Musculoskeletal ultrasound: Athletic injuries of the lower extremity. Ultrasonography 2018, 37, 175–189. [Google Scholar] [CrossRef]
- Purohit, N.B.; King, L.J. Ultrasound of lower limb sports injuries. Ultrasound 2015, 23, 149–157. [Google Scholar] [CrossRef] [PubMed]
- Im Suk, J.; Walker, F.O.; Cartwright, M.S. Ultrasonography of peripheral nerves. Curr. Neurol. Neurosci. Rep. 2013, 13, 328. [Google Scholar] [CrossRef] [PubMed]
- Krause, F.; Wilke, J.; Niederer, D.; Vogt, L.; Banzer, W. Acute effects of foam rolling on passive tissue stiffness and fascial sliding: Study protocol for a randomized controlled trial. Trials 2017, 18, 114. [Google Scholar] [CrossRef] [PubMed]
- Wilke, J.; Debelle, H.; Tenberg, S.; Dilley, A.; Maganaris, C. Ankle Motion Is Associated With Soft Tissue Displacement in the Dorsal Thigh: An in vivo Investigation Suggesting Myofascial Force Transmission Across the Knee Joint. Front. Physiol. 2020, 11, 180. [Google Scholar] [CrossRef] [PubMed]
- Sikdar, S.; Wei, Q.; Cortes, N. Dynamic ultrasound imaging applications to quantify musculoskeletal function. Exerc. Sport Sci. Rev. 2014, 42, 126–135. [Google Scholar] [CrossRef]
- Petscavage-Thomas, J. Clinical applications of dynamic functional musculoskeletal ultrasound. RMI 2014, 27. [Google Scholar] [CrossRef]
- Löfstedt, T.; Ahnlund, O.; Peolsson, M.; Trygg, J. Dynamic ultrasound imaging--a multivariate approach for the analysis and comparison of time-dependent musculoskeletal movements. BMC Med. Imaging 2012, 12, 29. [Google Scholar] [CrossRef]
- Klimstra, M.; Dowling, J.; Durkin, J.L.; MacDonald, M. The effect of ultrasound probe orientation on muscle architecture measurement. J. Electromyogr. Kinesiol. 2007, 17, 504–514. [Google Scholar] [CrossRef]
- Ehsani, F.; Salavati, M.; Arab, A.M.; Dolati, M.H. Ultrasound imaging transducer motion during standing postural tasks with and without using transducer fixator. Musculoskelet. Sci. Pract. 2017, 32, 57–63. [Google Scholar] [CrossRef]
- Dupont, A.C.; Sauerbrei, E.E.; Fenton, P.V.; Shragge, P.C.; Loeb, G.E.; Richmond, F.J. Real-time sonography to estimate muscle thickness: Comparison with MRI and CT. J. Clin. Ultrasound 2001, 29, 230–236. [Google Scholar] [CrossRef]
- Reddy, A.P.; DeLancey, J.O.; Zwica, L.M.; Ashton-Miller, J.A. On-screen vector-based ultrasound assessment of vesical neck movement. Am. J. Obstet. Gynecol. 2001, 185, 65–70. [Google Scholar] [CrossRef] [PubMed]
- Whittaker, J.L.; Warner, M.B.; Stokes, M.J. Ultrasound imaging transducer motion during clinical maneuvers: Respiration, active straight leg raise test and abdominal drawing in. Ultrasound Med. Biol. 2010, 36, 1288–1297. [Google Scholar] [CrossRef] [PubMed]
- Balius, R.; Pedret, C.; Iriarte, I.; Sáiz, R.; Cerezal, L. Sonographic landmarks in hamstring muscles. Skelet. Radiol. 2019, 48, 1675–1683. [Google Scholar] [CrossRef] [PubMed]
- Morse, C.I.; Degens, H.; Seynnes, O.R.; Maganaris, C.N.; Jones, D.A. The acute effect of stretching on the passive stiffness of the human gastrocnemius muscle tendon unit. J. Physiol. (Lond.) 2008, 586, 97–106. [Google Scholar] [CrossRef] [PubMed]
- Conn, P.M. Imaging and Spectroscopic Analysis of Living Cells. Live Cell Imaging of Cellular Elements and Functions, 1st ed.; Elsevier: Amsterdam, The Netherlands, 2012; ISBN 9780123919076. [Google Scholar]
- Himmelreich, H.; Stefanicki, E.; Banzer, W. Die Ultraschallgesteuerte Anthropometrie (UGA)—Zur Entwicklung eines neuen Verfahrens in der Asymmetriediagnostik. Sportverletz. Sportschaden 1998, 12, 60–65. [Google Scholar] [CrossRef] [PubMed]
- Natalis, M.; König, A. Nichtinvasive, akkurate und reliable Messung der Halswirbelsäulenbeweglichkeit mittels ultraschallgestützter 3D-Echtzeit-Bewegungsanalyse. Ultraschall Med. 1999, 20, 70–73. [Google Scholar] [CrossRef]
- Koo, T.K.; Li, M.Y. A Guideline of Selecting and Reporting Intraclass Correlation Coefficients for Reliability Research. J. Chiropr. Med. 2016, 15, 155–163. [Google Scholar] [CrossRef]
- Greening, J.; Dilley, A.; Lynn, B. In vivo study of nerve movement and 4 mechanosensitivity of the median nerve in whiplash and non-specific arm pain patients. Pain 2005, 115, 248–253. [Google Scholar] [CrossRef]
- Langevin, H.M.; Fox, J.R.; Koptiuch, C.; Badger, G.J.; Greenan-Naumann, A.C.; Bouffard, N.A.; Konofagou, E.E.; Lee, W.-N.; Triano, J.J.; Henry, S.M. Reduced thoracolumbar fascia shear strain in human chronic low back pain. BMC Musculoskelet. Disord. 2011, 12, 203. [Google Scholar] [CrossRef]
- Couppé, C.; Svensson, R.B.; Josefsen, C.O.; Kjeldgaard, E.; Magnusson, S.P. Ultrasound speckle tracking of Achilles tendon in individuals with unilateral tendinopathy: A pilot study. Eur. J. Appl. Physiol. 2020, 120, 579–589. [Google Scholar] [CrossRef]
- Wilke, J.; Banzer, W. Die nicht invasive Untersuchung faszialer Strukturen—Eine narrative Übersichtsarbeit. Phys. Rehab. Kur. Med. 2014, 24, 117–124. [Google Scholar] [CrossRef]
- Williams, M.A.; McCarthy, C.J.; Chorti, A.; Cooke, M.W.; Gates, S. A systematic review of reliability and validity studies of methods for measuring active and passive cervical range of motion. J. Manip. Physiol. Ther. 2010, 33, 138–155. [Google Scholar] [CrossRef] [PubMed]
- Mijnarends, D.M.; Meijers, J.M.M.; Halfens, R.J.G.; ter Borg, S.; Luiking, Y.C.; Verlaan, S.; Schoberer, D.; Cruz Jentoft, A.J.; van Loon, L.J.C.; Schols, J.M.G.A. Validity and reliability of tools to measure muscle mass, strength, and physical performance in community-dwelling older people: A systematic review. J. Am. Med. Dir. Assoc. 2013, 14, 170–178. [Google Scholar] [CrossRef] [PubMed]
- Pons, C.; Borotikar, B.; Garetier, M.; Burdin, V.; Ben Salem, D.; Lempereur, M.; Brochard, S. Quantifying skeletal muscle volume and shape in humans using MRI: A systematic review of validity and reliability. PLoS ONE 2018, 13, e0207847. [Google Scholar] [CrossRef] [PubMed]
- Fölsch, C.; Schlögel, S.; Lakemeier, S.; Wolf, U.; Timmesfeld, N.; Skwara, A. Test-retest reliability of 3D ultrasound measurements of the thoracic spine. PM R J. Inj. Funct. Rehabil. 2012, 4, 335–341. [Google Scholar] [CrossRef] [PubMed]
- Quinlan, J.F.; Mullett, H.; Stapleton, R.; FitzPatrick, D.; McCormack, D. The use of the Zebris motion analysis system for measuring cervical spine movements in vivo. Proc. Inst. Mech. Eng. Part H J. Eng. Med. 2006, 220, 889–896. [Google Scholar] [CrossRef] [PubMed]
- Abbo, E.D.; Zhang, Q.; Zelder, M.; Huang, E.S. The increasing number of clinical items addressed during the time of adult primary care visits. J. Gen. Intern. Med. 2008, 23, 2058–2065. [Google Scholar] [CrossRef]


| TD [cm] | RT [cm] | MAS [cm] | ∆TD-RT [cm] | ∆TD-RT [%] | ∆TD-MAS [cm] | ∆TD-MAS [%] |
|---|---|---|---|---|---|---|
| 0.5 | 0.582 | 0.557 | 0.082 | 16.5 | 0.057 | 11.4 |
| 1 | 1.150 | 1.088 | 0.150 | 15.0 | 0.088 | 8.8 |
| 1.5 | 1.679 | 1.583 | 0.179 | 11.9 | 0.083 | 5.5 |
| 2 | 2.177 | 2.069 | 0.177 | 8.8 | 0.069 | 3.5 |
| 2.5 | 2.751 | 2.572 | 0.251 | 10.0 | 0.072 | 2.9 |
| 3 | 3.258 | 3.062 | 0.258 | 8.6 | 0.062 | 2.1 |
Publisher’s Note: MDPI stays neutral with regard to jurisdictional claims in published maps and institutional affiliations. |
© 2021 by the authors. Licensee MDPI, Basel, Switzerland. This article is an open access article distributed under the terms and conditions of the Creative Commons Attribution (CC BY) license (http://creativecommons.org/licenses/by/4.0/).
Share and Cite
Mohr, L.; Vogt, L.; Wilke, J. Use of Reflective Tape to Detect Ultrasound Transducer Movement: A Validation Study. Life 2021, 11, 104. https://doi.org/10.3390/life11020104
Mohr L, Vogt L, Wilke J. Use of Reflective Tape to Detect Ultrasound Transducer Movement: A Validation Study. Life. 2021; 11(2):104. https://doi.org/10.3390/life11020104
Chicago/Turabian StyleMohr, Lisa, Lutz Vogt, and Jan Wilke. 2021. "Use of Reflective Tape to Detect Ultrasound Transducer Movement: A Validation Study" Life 11, no. 2: 104. https://doi.org/10.3390/life11020104
APA StyleMohr, L., Vogt, L., & Wilke, J. (2021). Use of Reflective Tape to Detect Ultrasound Transducer Movement: A Validation Study. Life, 11(2), 104. https://doi.org/10.3390/life11020104