
Correlation between Volumes Determined by Echocardiography and Cardiac MRI in Controls and Atrial Fibrillation Patients

 , ,
, ,
Abstract
1. Introduction
2. Materials and Methods
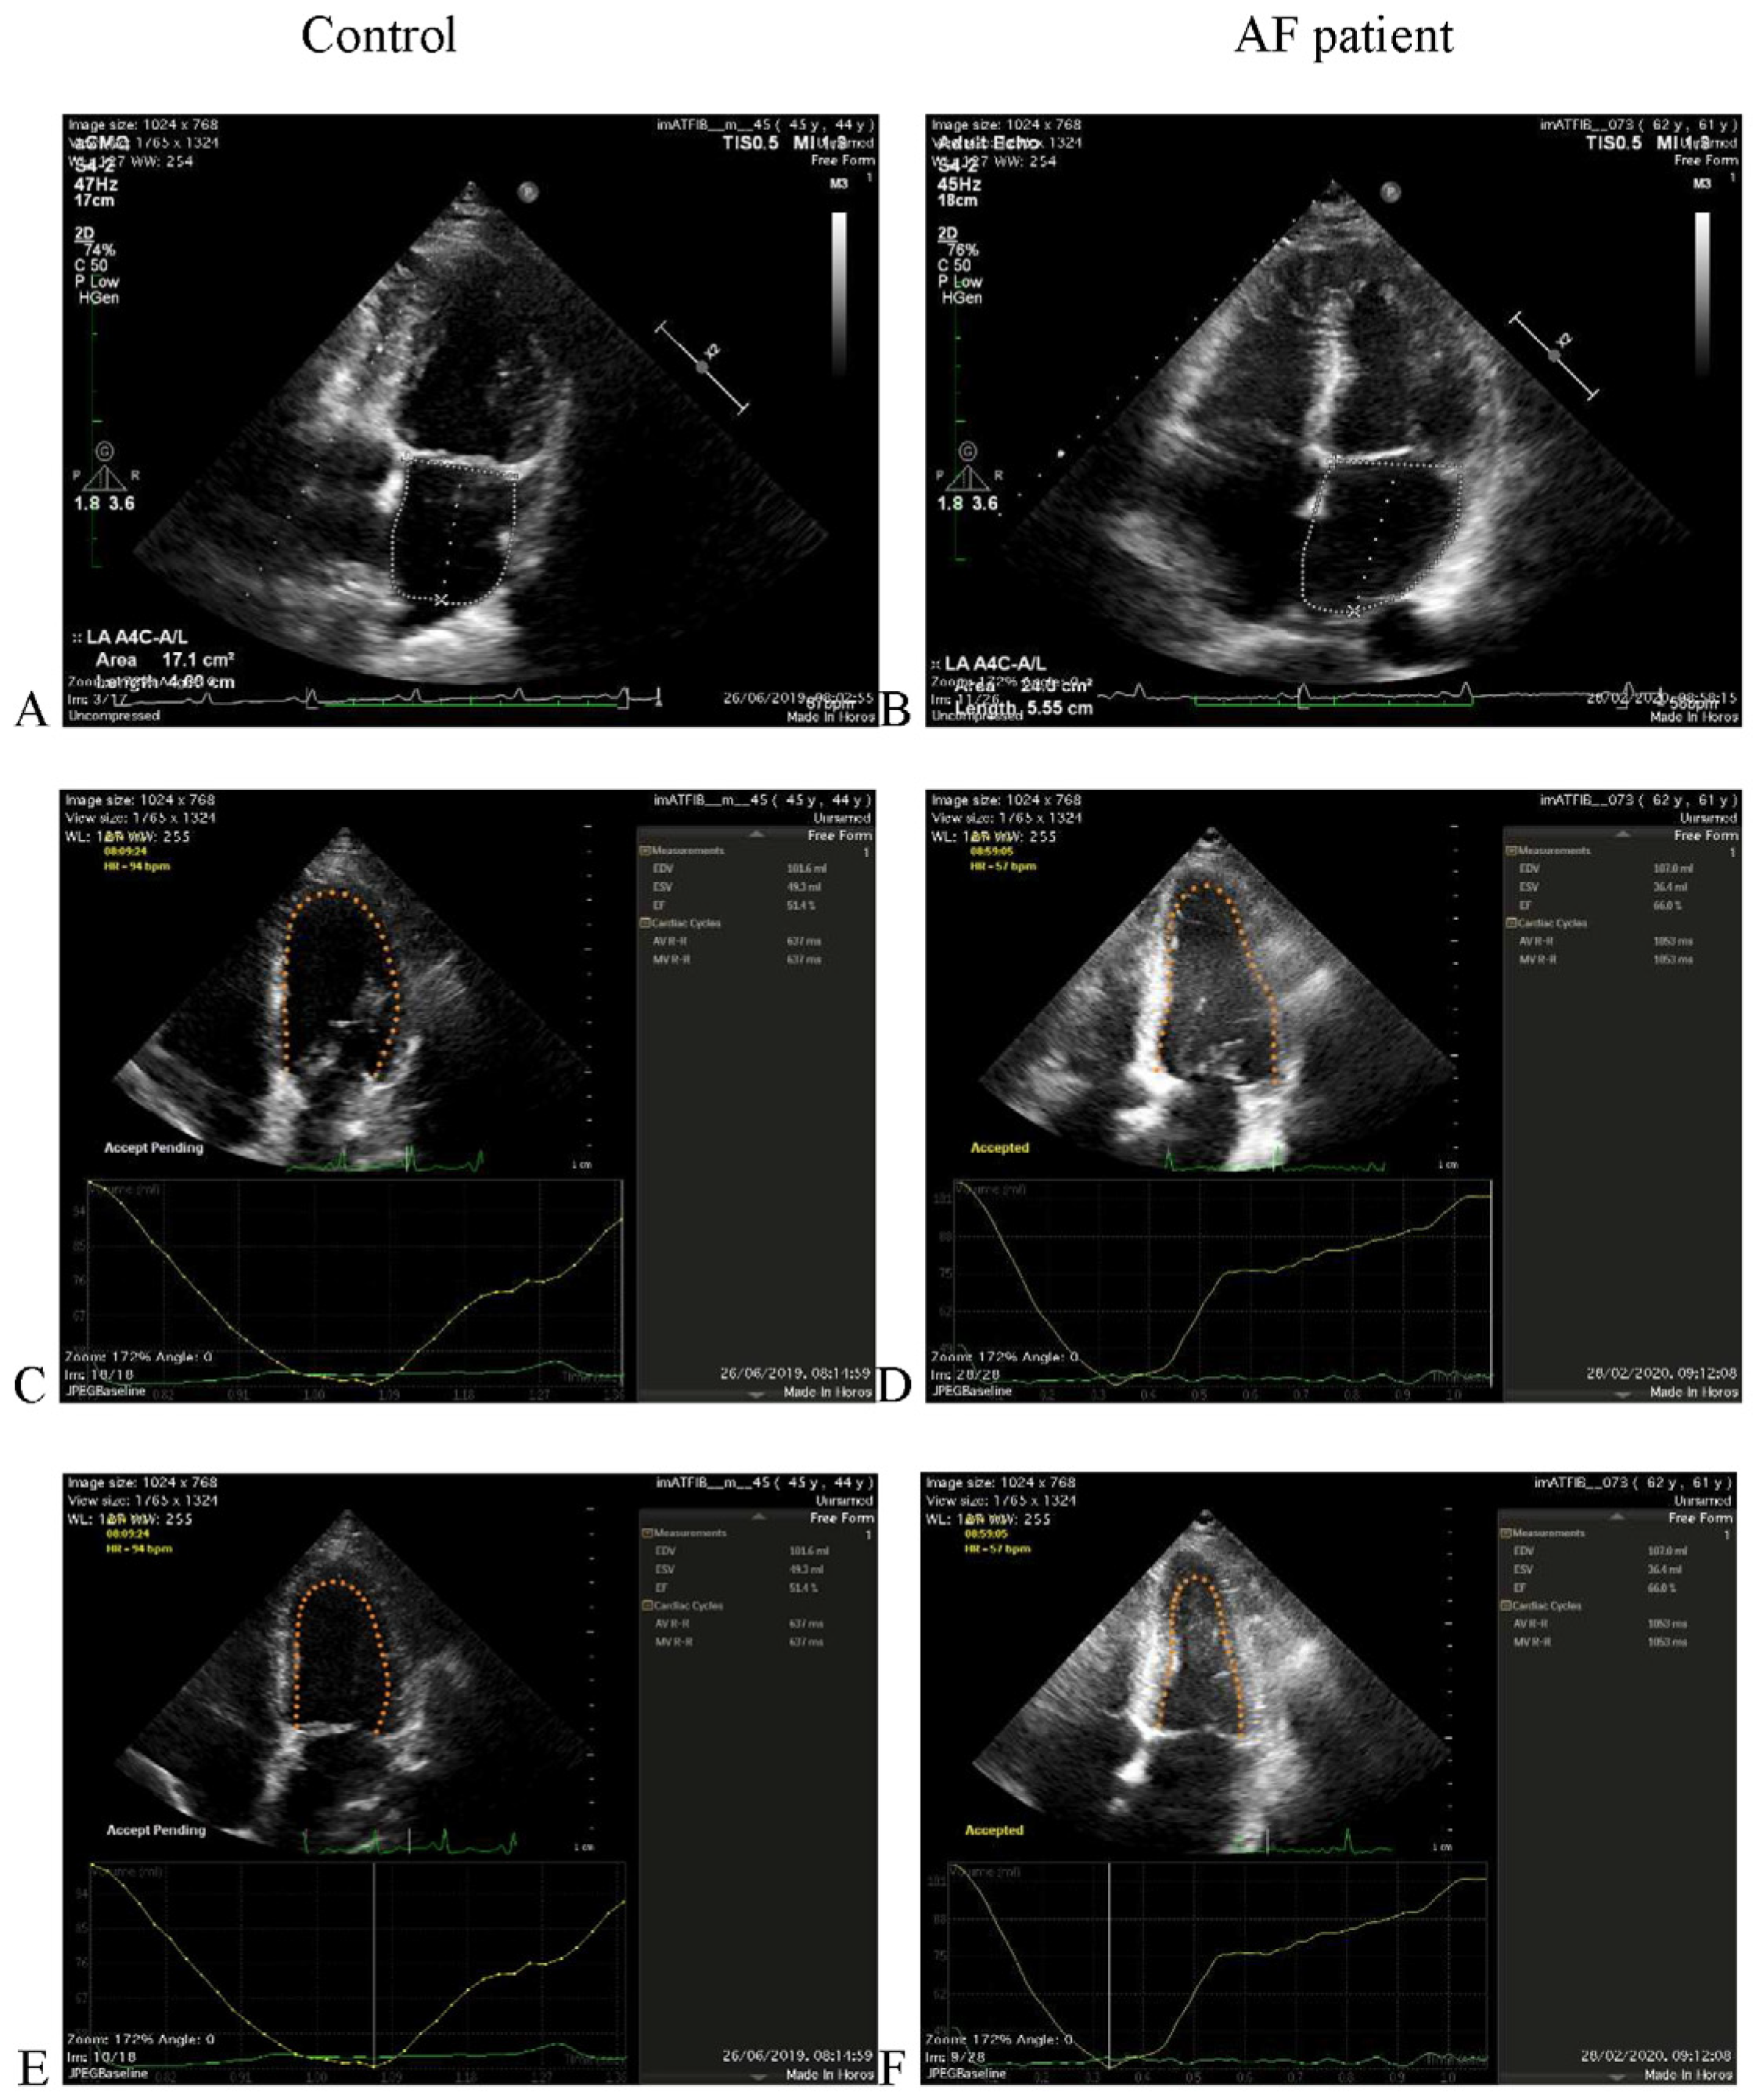
2.1. Echocardiographic Acquisition
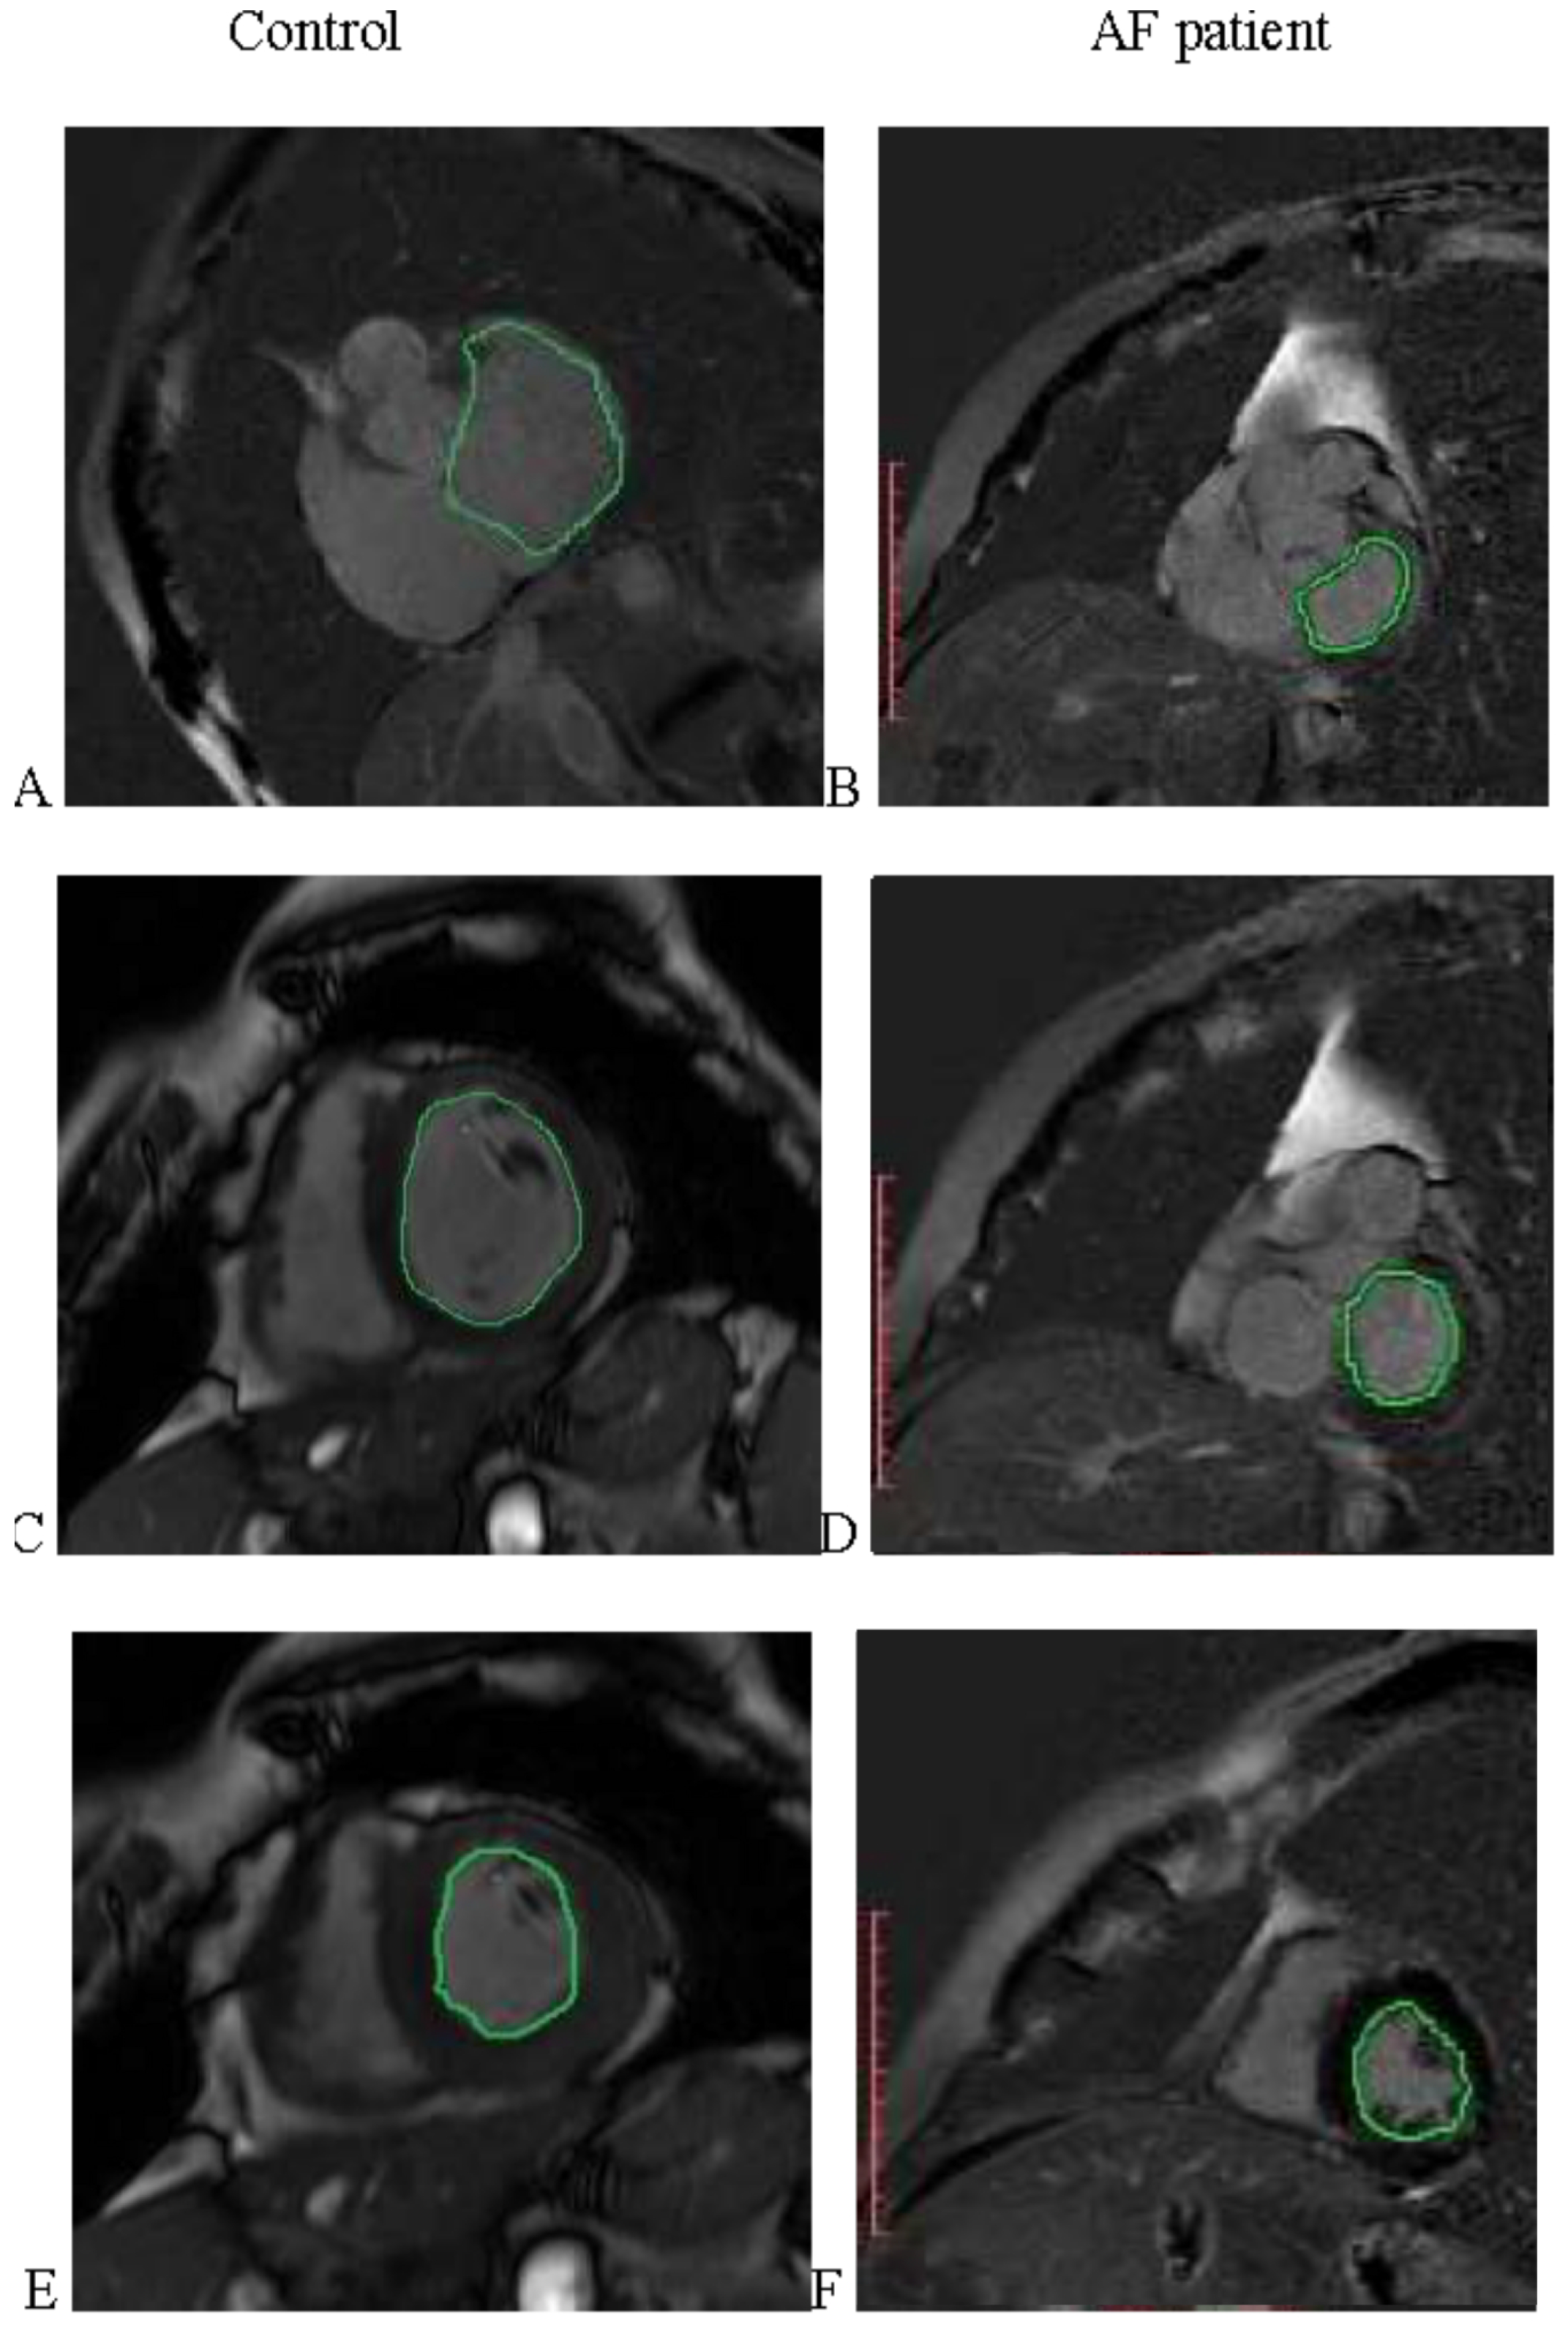
2.2. MRI Acquisition
2.3. Statistical Analysis
3. Results
4. Discussion
5. Limitations
6. Conclusions
Supplementary Materials
Author Contributions
Funding
Institutional Review Board Statement
Informed Consent Statement
Data Availability Statement
Acknowledgments
Conflicts of Interest
References
- Burns, R.J.; Gibbons, R.J.; Yi, Q.; Roberts, R.S.; Miller, T.D.; Schaer, G.L.; Anderson, J.L.; Yusuf, S. The relationships of left ventricular ejection fraction, end-systolic volume index and infarct size to six-month mortality after hospital discharge following myocardial infarction treated by thrombolysis. J. Am. Coll. Cardiol. 2002, 39, 30–36. [Google Scholar] [CrossRef]
- Bellenger, N.G.; Burgess, M.I.; Ray, S.G.; Lahiri, A.; Coats, A.J.S.; Cleland, J.G.F.; Pennell, D.J. Comparison of left ventricular ejection fraction and volumes in heart failure by echocardiography, radionuclide ventriculography and cardiovascular magnetic resonance. Are they interchangeable? Eur. Heart J. 2000, 21, 1387–1396. [Google Scholar] [CrossRef]
- Tsang, T.S.M.; Barnes, M.E.; Gersh, B.J.; Bailey, K.R.; Seward, J.B. Left atrial volume as a morphophysiologic expression of left ventricular diastolic dysfunction and relation to cardiovascular risk burden. Am. J. Cardiol. 2002, 90, 1284–1289. [Google Scholar] [CrossRef]
- White, H.D.; Norris, R.M.; Brown, M.A.; Brandt, P.W.; Whitlock, R.M.; Wild, C.J. Left ventricular end-systolic volume as the major determinant of survival after recovery from myocardial infarction. Circulation 1987, 76, 44–51. [Google Scholar] [CrossRef]
- Armstrong, A.C.; Gidding, S.; Gjesdal, O.; Wu, C.; Bluemke, D.A.; Lima, J.A. LV mass assessed by echocardiography and CMR, cardiovascular outcomes, and medical practice. JACC Cardiovasc. Imaging 2012, 5, 837–848. [Google Scholar] [CrossRef] [PubMed]
- Inciardi, R.M.; Rossi, A. Left atrium: A forgotten biomarker and a potential target in cardiovascular medicine. J. Cardiovasc. Med. 2019, 20, 797–808. [Google Scholar] [CrossRef]
- Anter, E.; Jessup, M.; Callans, D.J. Atrial fibrillation and heart failure: Treatment considerations for a dual epidemic. Circulation 2009, 119, 2516–2525. [Google Scholar] [CrossRef] [PubMed]
- Falk, R.H. Atrial fibrillation. N. Engl. J. Med. 2001, 344, 1067–1078. [Google Scholar] [CrossRef]
- Nattel, S. New ideas about atrial fibrillation 50 years on. Nature 2002, 415, 219–226. [Google Scholar] [CrossRef] [PubMed]
- Marwick, T.H.; Neubauer, S.; Petersen, S.E. Use of cardiac magnetic resonance and echocardiography in population-based studies: Why, where, and when? Circ. Cardiovasc. Imaging 2013, 6, 590–596. [Google Scholar] [CrossRef]
- Lang, R.M.; Badano, L.P.; Victor, M.A.; Afilalo, J.; Armstrong, A.; Ernande, L.; Flachskampf, F.A.; Foster, E.; Goldstein, S.A.; Kuznetsova, T.; et al. Recommendations for cardiac chamber quantification by echocardiography in adults: An update from the American Society of Echocardiography and the European Association of Cardiovascular Imaging. J. Am. Soc. Echocardiogr. 2015, 28, 1–39.e14. [Google Scholar] [CrossRef]
- Hendel, R.C.; Patel, M.R.; Kramer, C.M.; Poon, M.; Hendel, R.C.; Carr, J.C.; Gerstad, N.A.; Gillam, L.D.; Hodgson, J.M.; Kim, R.J.; et al. ACCF/ACR/SCCT/SCMR/ASNC/NASCI/SCAI/SIR 2006 Appropriateness Criteria for Cardiac Computed Tomography and Cardiac Magnetic Resonance Imaging. J. Am. Coll. Cardiol. 2006, 48, 1475–1497. [Google Scholar] [CrossRef] [PubMed]
- Pombo, J.F.; Troy, B.L.; Russell, R.O., Jr. Left ventricular volumes and ejection fraction by echocardiography. Circulation 1971, 43, 480–490. [Google Scholar] [CrossRef]
- Tsang, T.S.; Barnes, M.E.; Gersh, B.J.; Takemoto, Y.; Rosales, A.G.; Bailey, K.R.; Seward, J.B. Prediction of risk for first age-related cardiovascular events in an elderly population: The incremental value of echocardiography. J. Am. Coll. Cardiol. 2003, 42, 1199–1205. [Google Scholar] [CrossRef]
- Monaghan, M.J. Role of real time 3D echocardiography in evaluating the left ventricle. Heart Br. Card. Soc. 2006, 92, 131–136. [Google Scholar] [CrossRef] [PubMed]
- Bhave, N.M.; Lang, R.M. Evaluation of left ventricular structure and function by three-dimensional echocardiography. Curr. Opin. Crit. Care 2013, 19, 387–396. [Google Scholar] [CrossRef] [PubMed]
- Salerno, M.; Kramer, C.M. Advances in Parametric Mapping with CMR Imaging. JACC Cardiovasc. Imaging 2013, 6, 806–822. [Google Scholar] [CrossRef] [PubMed]
- Gardner, B.I.; Bingham, S.E.; Allen, M.R.; Blatter, D.D.; Anderson, J.L. Cardiac magnetic resonance versus transthoracic echocardiography for the assessment of cardiac volumes and regional function after myocardial infarction: An intrasubject comparison using simultaneous intrasubject recordings. Cardiovasc. Ultrasound 2009, 7, 38. [Google Scholar] [CrossRef] [PubMed]
- Schiau, C.; Leucuța, D.-C.; Dudea, S.M.; Manole, S. Myocardial Fibrosis as a Predictor of Ventricular Arrhythmias in Patients With Non-ischemic Cardiomyopathy. In Vivo 2021, 35, 1677–1685. [Google Scholar] [CrossRef]
- Shimada, Y.J.; Shiota, T. A Meta-Analysis and Investigation for the Source of Bias of Left Ventricular Volumes and Function by Three-Dimensional Echocardiography in Comparison with Magnetic Resonance Imaging. Am. J. Cardiol. 2011, 107, 126–138. [Google Scholar] [CrossRef]
- Shimada, Y.J.; Shiota, M.; Siegel, R.J.; Shiota, T. Accuracy of right ventricular volumes and function determined by three-dimensional echocardiography in comparison with magnetic resonance imaging: A meta-analysis study. J. Am. Soc. Echocardiogr. 2010, 23, 943–953. [Google Scholar] [CrossRef] [PubMed]
- Greupner, J.; Zimmermann, E.; Grohmann, A.; Dübel, H.P.; Althoff, T.F.; Borges, A.C.; Rutsch, W.; Schlattmann, P.; Hamm, B.; Dewey, M. Head-to-head comparison of left ventricular function assessment with 64-row computed tomography, biplane left cineventriculography, and both 2- and 3-dimensional transthoracic echocardiography: Comparison with magnetic resonance imaging as the reference standard. J. Am. Coll. Cardiol. 2012, 59, 1897–1907. [Google Scholar] [CrossRef]
- Rigolli, M.; Anandabaskaran, S.; Christiansen, J.P.; Whalley, G.A. Bias associated with left ventricular quantification by multimodality imaging: A systematic review and meta-analysis. Open Heart 2016, 3, e000388. [Google Scholar] [CrossRef] [PubMed]
- Agner, B.F.; Kühl, J.T.; Linde, J.J.; Kofoed, K.F.; Åkeson, P.; Rasmussen, B.V.; Jensen, G.B.; Dixen, U. Assessment of left atrial volume and function in patients with permanent atrial fibrillation: Comparison of cardiac magnetic resonance imaging, 320-slice multi-detector computed tomography, and transthoracic echocardiography. Eur. Heart J. Cardiovasc. Imaging 2014, 15, 532–540. [Google Scholar] [CrossRef][Green Version]
- Kleijn, S.A.; Brouwer, W.P.; Aly, M.F.; Rüssel, I.K.; de Roest, G.J.; Beek, A.M.; van Rossum, A.C.; Kamp, O. Comparison between three-dimensional speckle-tracking echocardiography and cardiac magnetic resonance imaging for quantification of left ventricular volumes and function. Eur. Heart J. Cardiovasc. Imaging 2012, 13, 834–839. [Google Scholar] [CrossRef] [PubMed]
- van den Berg, N.W.E.; Chan Pin Yin, D.; Berger, W.R.; Neefs, J.; De Bruin-Bon, R.; Marquering, H.A.; Slaar, A.; Planken, R.N.; de Groot, J.R. Comparison of non-triggered magnetic resonance imaging and echocardiography for the assessment of left atrial volume and morphology. Cardiovasc. Ultrasound 2018, 16, 17. [Google Scholar] [CrossRef]
- Whitlock, M.; Garg, A.; Gelow, J.; Jacobson, T.; Broberg, C. Comparison of left and right atrial volume by echocardiography versus cardiac magnetic resonance imaging using the area-length method. Am. J. Cardiol. 2010, 106, 1345–1350. [Google Scholar] [CrossRef]
- Zhang, Q.; Wang, J.F.; Dong, Q.Q.; Yan, Q.; Luo, X.H.; Wu, X.Y.; Liu, J.; Sun, Y.P. Evaluation of left atrial volume and function using single-beat real-time three-dimensional echocardiography in atrial fibrillation patients. BMC Med. Imaging 2017, 17, 44. [Google Scholar] [CrossRef]
- Curta, A.; Fichtner, S.; Wakili, R.; Estner, H.; Kramer, H. Prospective evaluation of left atrial function and late gadolinium enhancement with 3 T MRI in patients with atrial fibrillation before and after catheter ablation. Int. J. Cardiovasc. Imaging 2019, 35, 499–504. [Google Scholar] [CrossRef]
- Markl, M.; Carr, M.; Ng, J.; Lee, D.C.; Jarvis, K.; Carr, J.; Goldberger, J.J. Assessment of left and right atrial 3D hemodynamics in patients with atrial fibrillation: A 4D flow MRI study. Int. J. Cardiovasc. Imaging 2016, 32, 807–815. [Google Scholar] [CrossRef]
- Strisciuglio, T.; Di Gioia, G.; Chatzikyriakou, S.; Silva Garcia, E.; Barbato, E.; Geelen, P.; De Potter, T. Left atrial volume computed by 3D rotational angiography best predicts atrial fibrillation recurrence after circumferential pulmonary vein isolation. Int. J. Cardiovasc. Imaging 2018, 34, 337–342. [Google Scholar] [CrossRef] [PubMed]
- Santos-Gallego, C.; Vahl, T.; Gaebelt, H.; Lopez, M.; Ares-Carrasco, S.; Sanz, J.; Goldman, M.; Hajjar, R.; Fuster, V.; Badimon, J. 3d-Echocardiography Demonstrates Excellent Correlation with Cardiac Magnetic Resonance for Assessment of Left Ventricular Function and Volumes in a Model of Myocardial Infarction. J. Am. Coll. Cardiol. 2012, 59, E1564. [Google Scholar] [CrossRef]
- Russo, I.; Micotti, E.; Fumagalli, F.; Magnoli, M.; Ristagno, G.; Latini, R.; Staszewsky, L. A novel echocardiographic method closely agrees with cardiac magnetic resonance in the assessment of left ventricular function in infarcted mice. Sci. Rep. 2019, 9, 3580. [Google Scholar] [CrossRef]
- Jiamsripong, P.; Honda, T.; Reuss, C.; Hurst, R.T.; Chaliki, H.; Grill, D.; Schneck, S.; Tyler, R.; Khandheria, B.; Lester, S. Three methods for evaluation of left atrial volume. Eur. J. Echocardiogr. 2008, 9, 351–355. [Google Scholar] [CrossRef]
- Ujino, K.; Barnes, M.E.; Cha, S.S.; Langins, A.P.; Bailey, K.R.; Seward, J.B.; Tsang, T.S. Two-dimensional echocardiographic methods for assessment of left atrial volume. Am. J. Cardiol. 2006, 98, 1185–1188. [Google Scholar] [CrossRef] [PubMed]
- Jenkins, C.; Bricknell, K.; Marwick, T.H. Use of real-time three-dimensional echocardiography to measure left atrial volume: Comparison with other echocardiographic techniques. J. Am. Soc. Echocardiogr. 2005, 18, 991–997. [Google Scholar] [CrossRef]
- Rodevan, O.; Bjornerheim, R.; Ljosland, M.; Maehle, J.; Smith, H.J.; Ihlen, H. Left atrial volumes assessed by three- and two-dimensional echocardiography compared to MRI estimates. Int. J. Card. Imaging 1999, 15, 397–410. [Google Scholar] [CrossRef]
- Gouda, S.; AbdelWahab, A.; Salem, M.; AbdelHamid, M. Discrepancy between MRI and echocardiography in assessing functional left ventricular parameters and scar characteristics in patients with chronic ischemic cardiomyopathy. Egypt Heart J. 2015, 67, 267–273. [Google Scholar] [CrossRef][Green Version]
- Yvorchuk, K.J.; Davies, R.A.; Chan, K.L. Measurement of left ventricular ejection fraction by acoustic quantification and comparison with radionuclide angiography. Am. J. Cardiol. 1994, 74, 1052–1056. [Google Scholar] [CrossRef]
- Hoffmann, R.; Barletta, G.; von Bardeleben, S.; Vanoverschelde, J.L.; Kasprzak, J.; Greis, C.; Becher, H. Analysis of left ventricular volumes and function: A multicenter comparison of cardiac magnetic resonance imaging, cine ventriculography, and unenhanced and contrast-enhanced two-dimensional and three-dimensional echocardiography. J. Am. Soc. Echocardiogr. 2014, 27, 292–301. [Google Scholar] [CrossRef]


| N = 99 Cohort for Left Atrial Measurements | Healthy Controls | AF Patients | p Value |
|---|---|---|---|
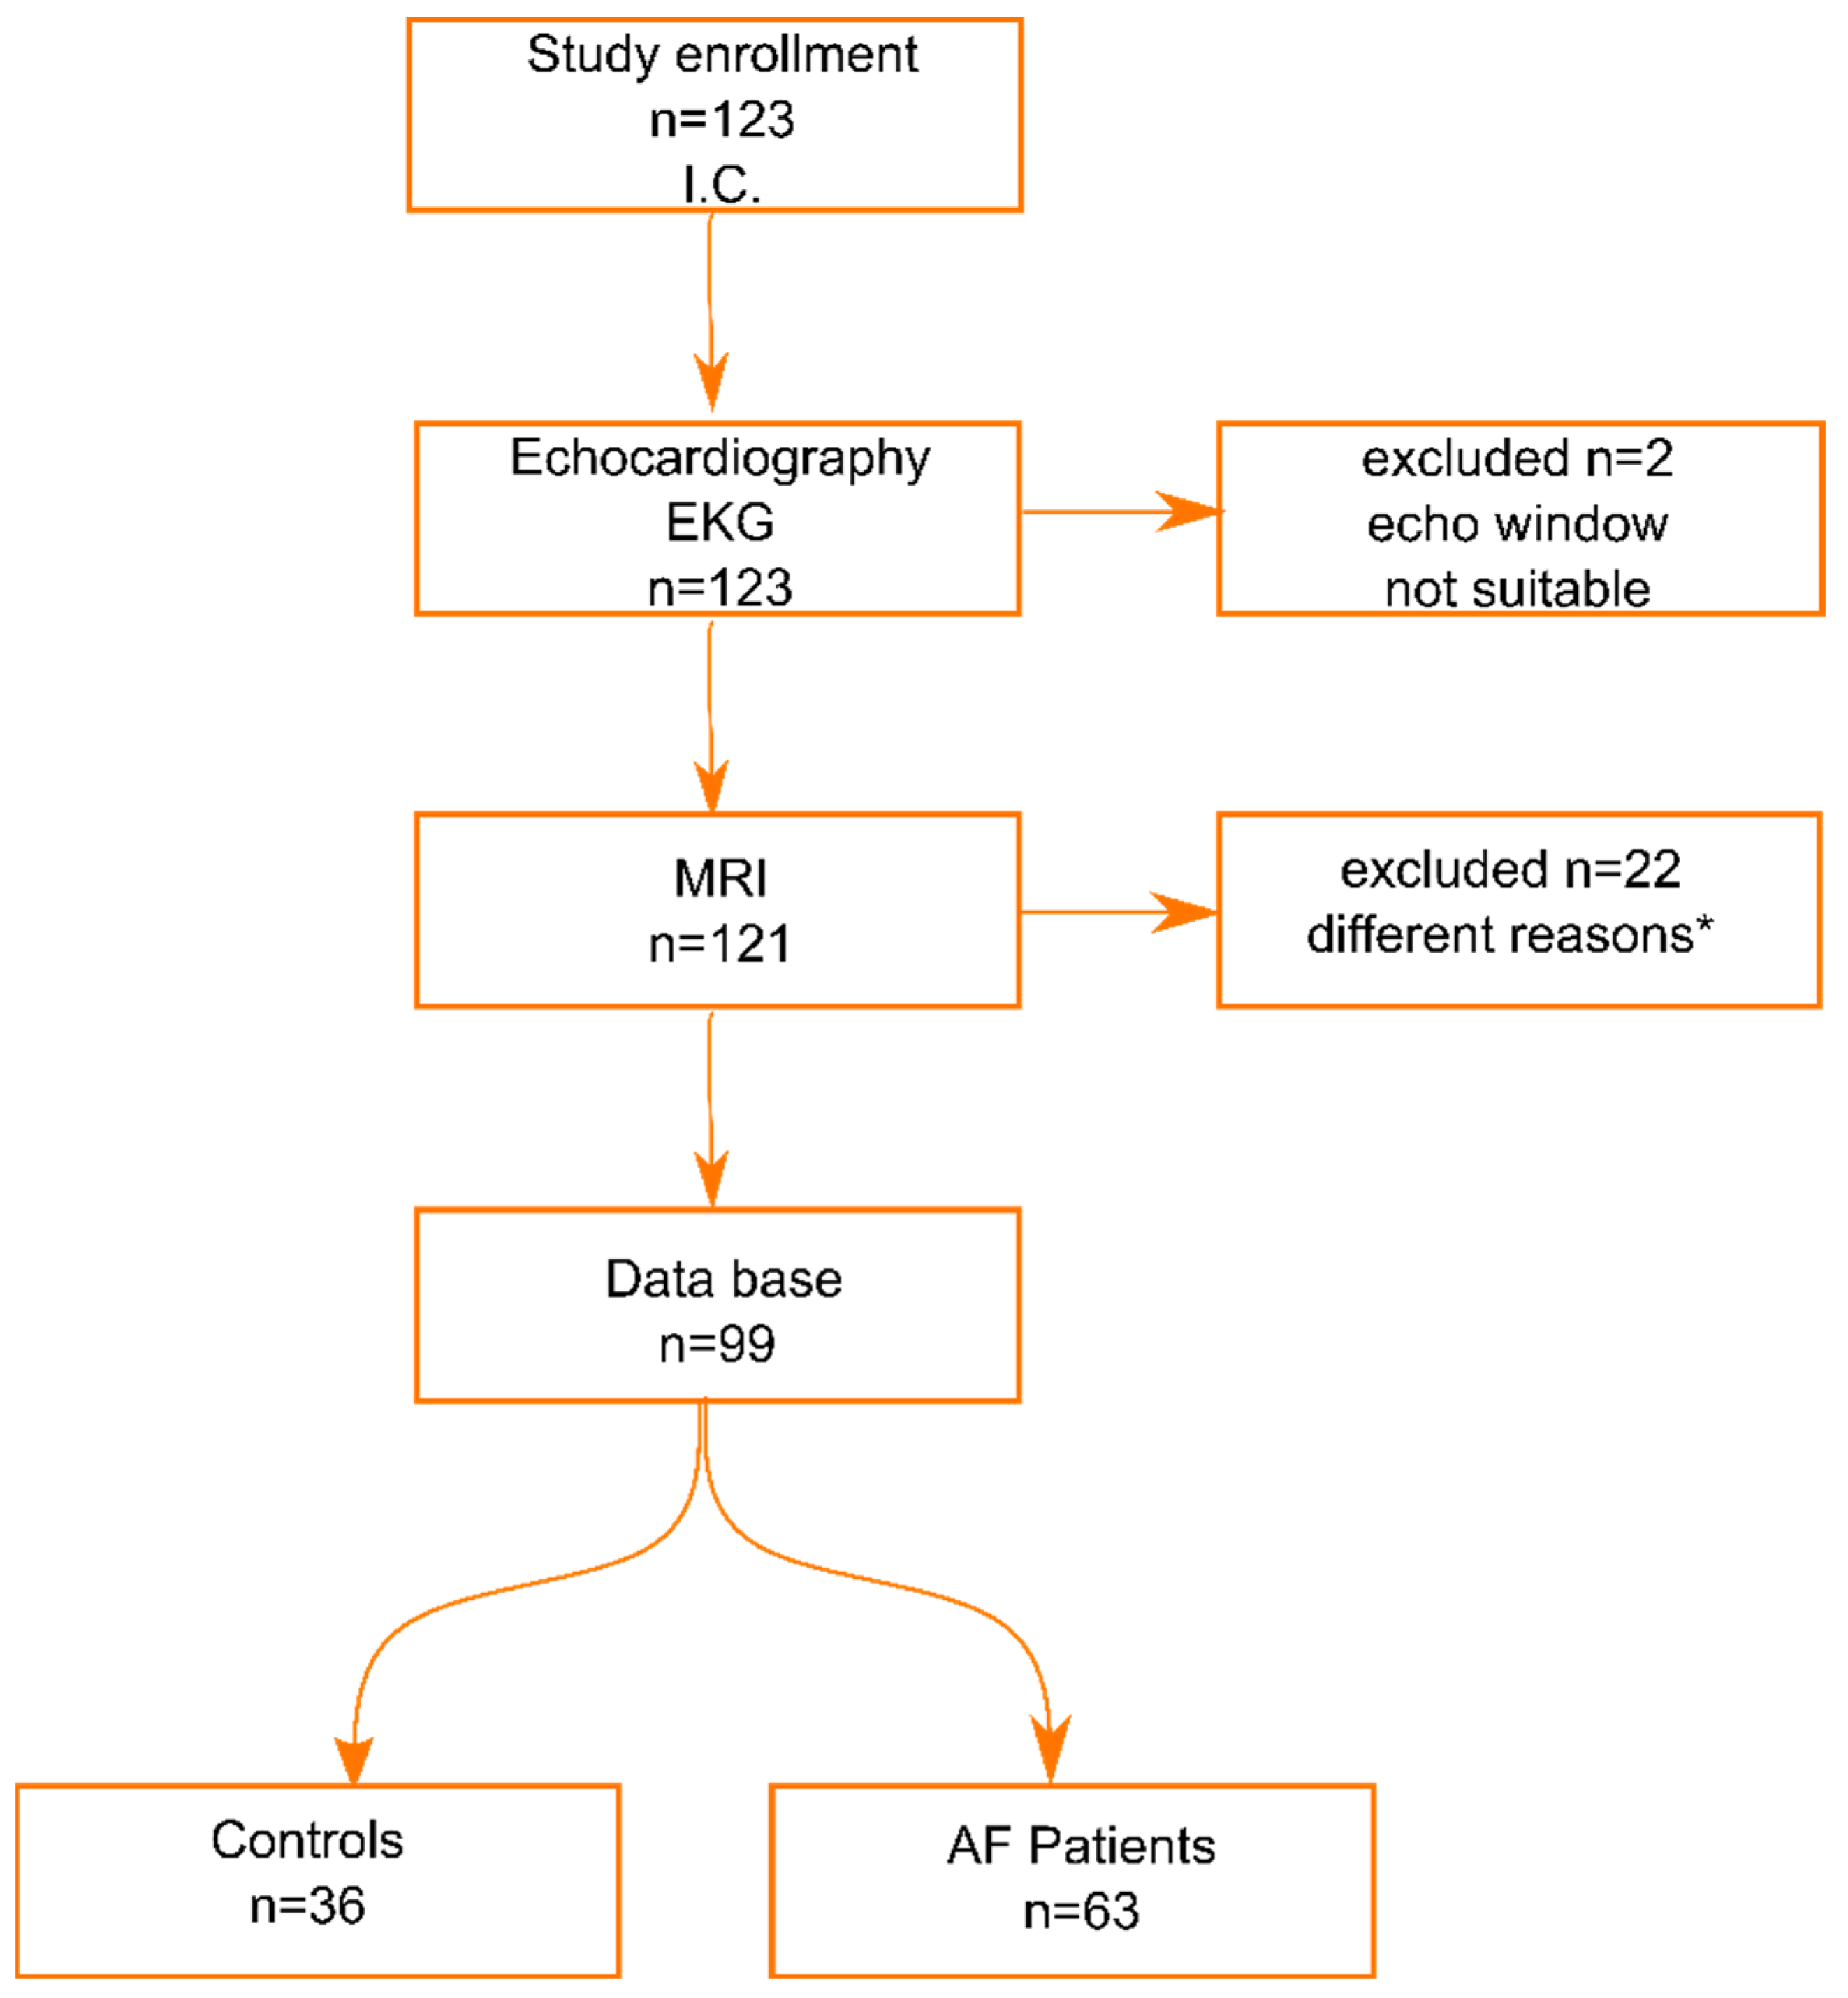
| No. | 36 | 63 | |
| Women/Men | 26/10 | 41/22 | 0.51 |
| Age | 50 ± 8 (33–73) | 63 ± 9 (38–78) | <0.0001 |
| BSA | 1.97 ± 0.25 (1.45–2.81) | 1.98 ± 0.21 (1.39–2.56) | 0.68 |
| N = 81 Cohort for Left Ventricle Measurements | Healthy Controls | AF Patients | p Value |
|---|---|---|---|
| No. | 30 | 51 | |
| Women/Men | 21/9 | 35/16 | 0.99 |
| Age | 50 ± 8 (33–73) | 63 ± 10 (38–78) | <0.0001 |
| BSA | 1.99 ± 0.25 (1.59–2.81) | 1.98 ± 0.22 (1.39–2.56) | 0.72 |
| Cardiac MRI | Echocardiography | p Value | |
|---|---|---|---|
| LA Vol (mL) | |||
| All | 86.8 (64.75–110.0) | 85.3 (62.4–113.8) | 0.54 |
| Controls | 64.3 (52.0–75.63) | 57.5 (46.7–68.8) | 0.085 |
| AF patients | 99.9 (81.05–124.6) | 104.8 (83.8–132.0) | 0.81 |
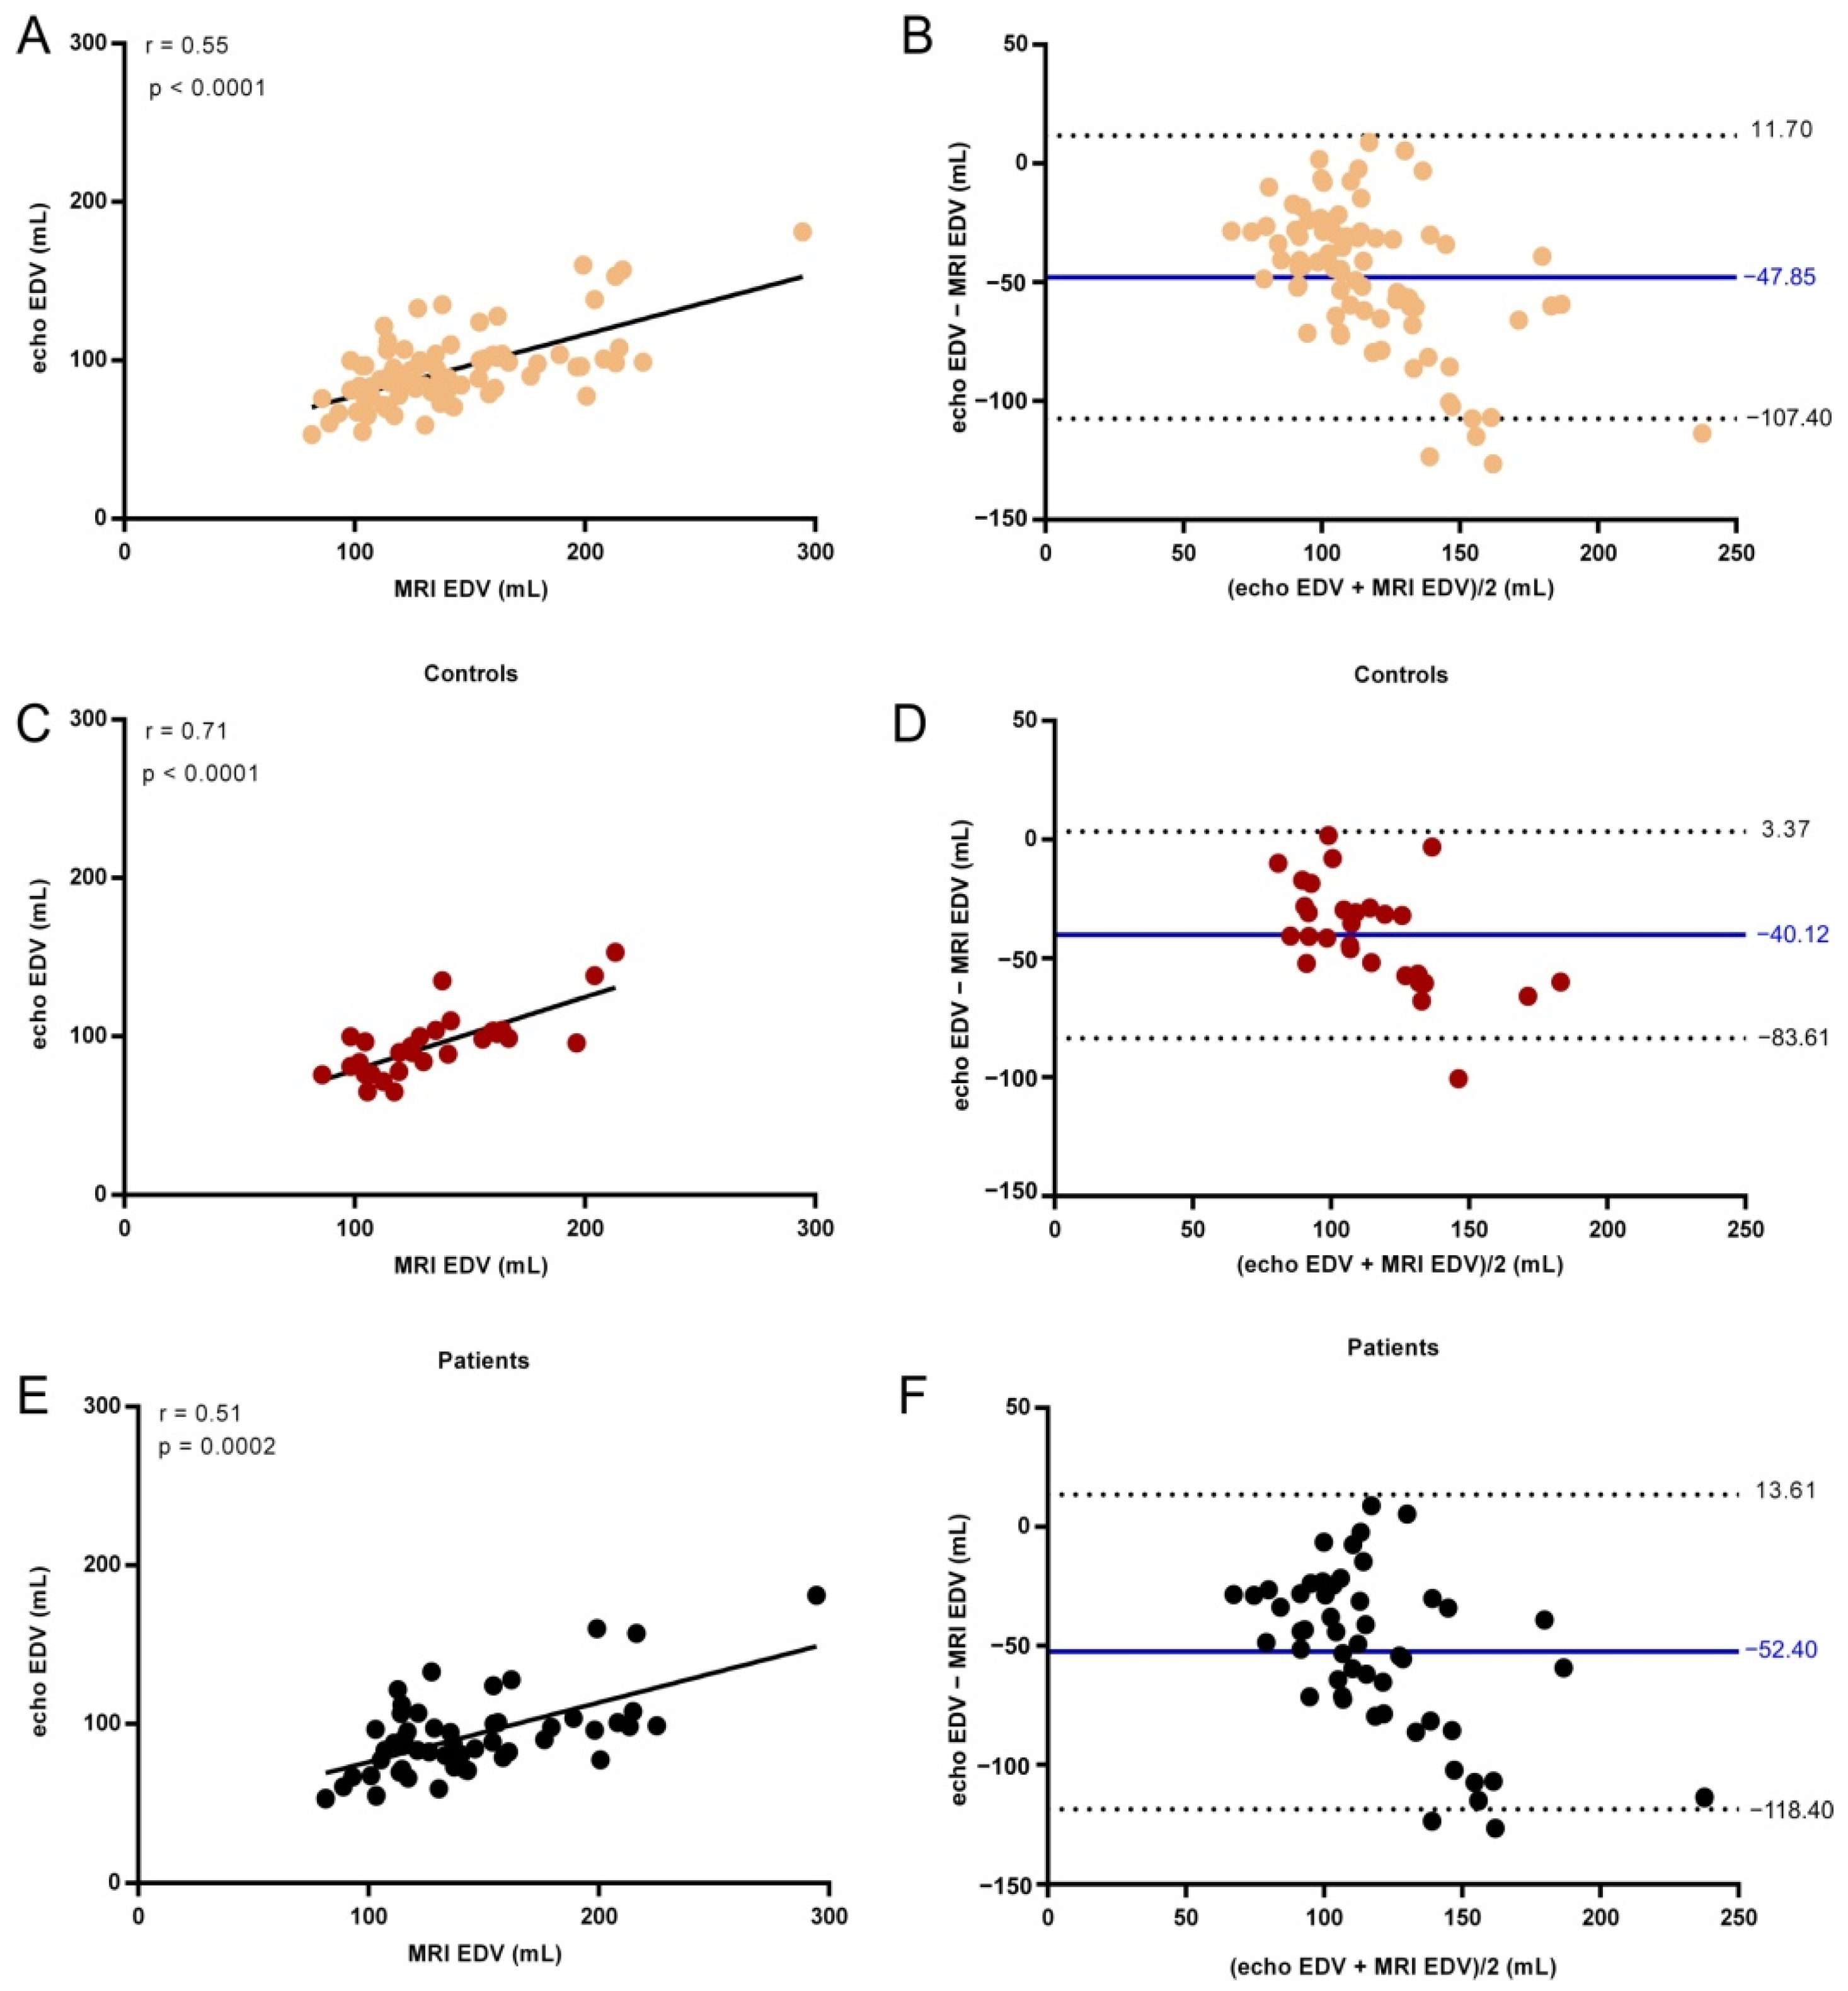
| EDV (mL) | |||
| All | 130.5 (113.9–160.6) | 90.1 (77.65–102.5) | <0.0001 |
| Controls | 128.8 (106.8–159.9) | 94.75 (80.3–103.2) | <0.0001 |
| AF patients | 135.6 (114.4–162.1) | 88.6(77.4–100.9) | <0.0001 |
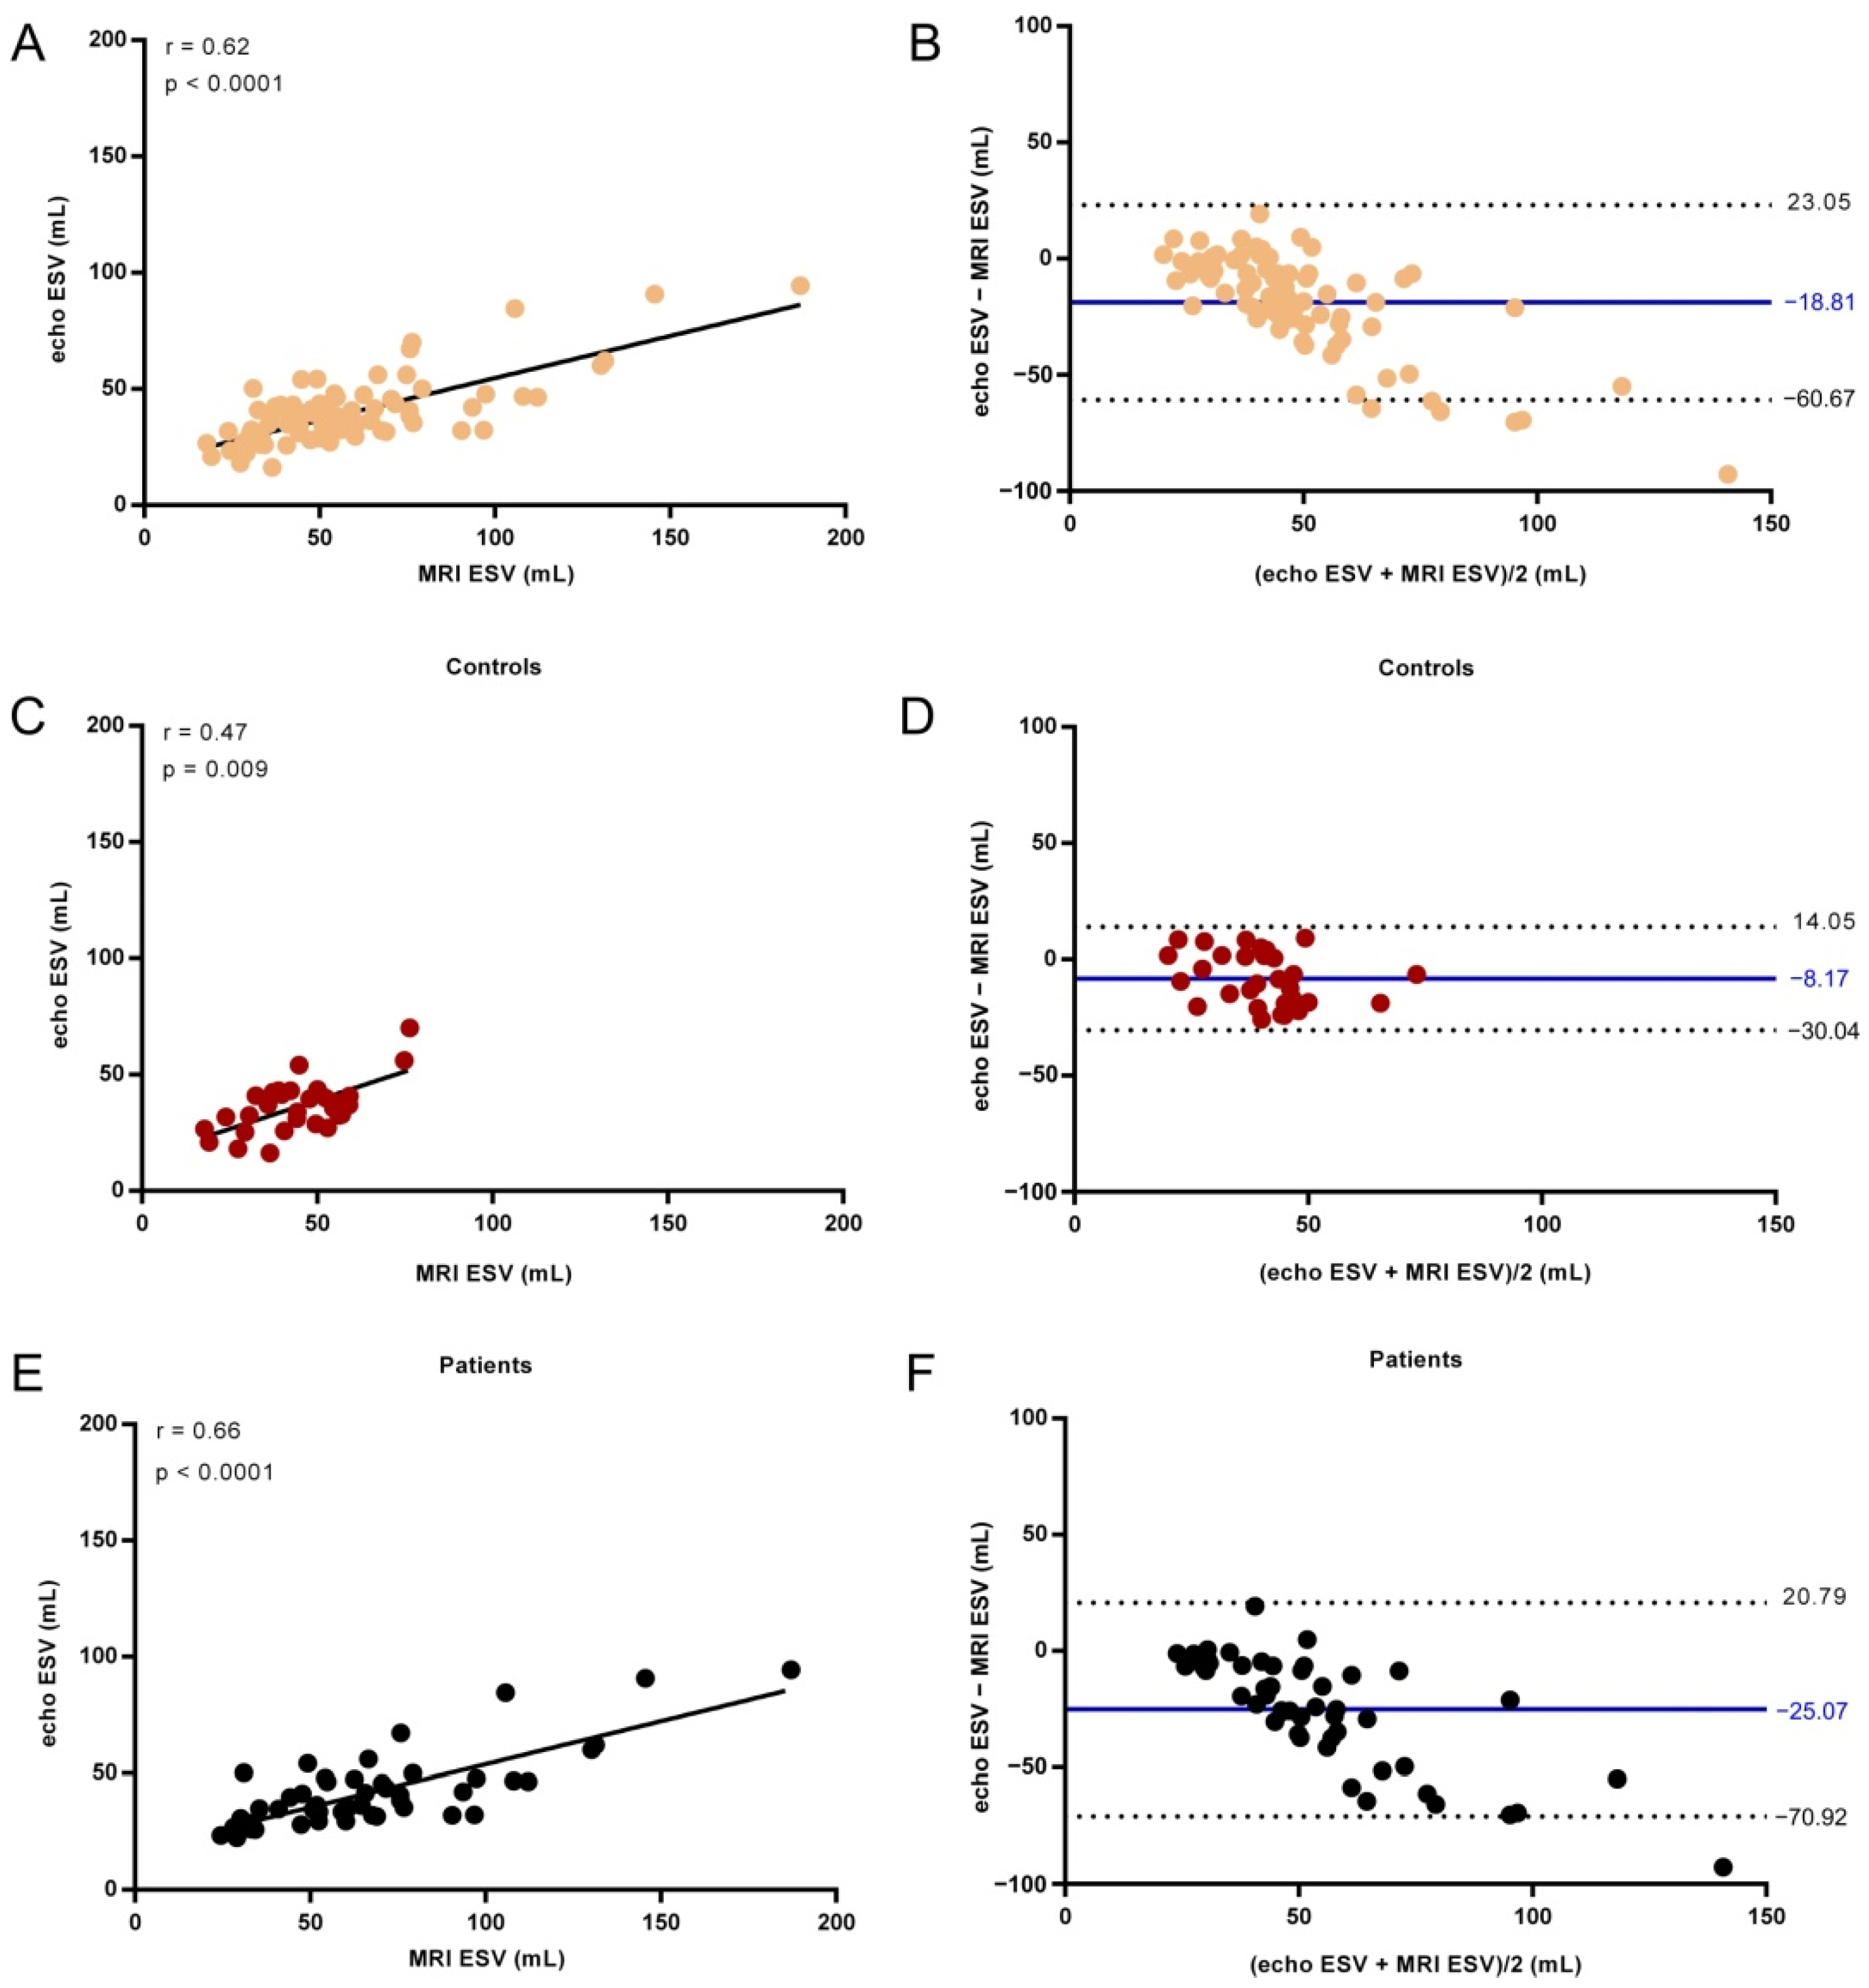
| ESV (mL) | |||
| All | 52.4 (36.9–69.7) | 39.3 (30.95–44.55) | <0.0001 |
| Controls | 44.2 (35.1–54.7) | 36.25 (28.4–41.65) | 0.0015 |
| AF patients | 60.1 (44.31–76.7) | 36.3 (31.6–47.4) | <0.0001 |
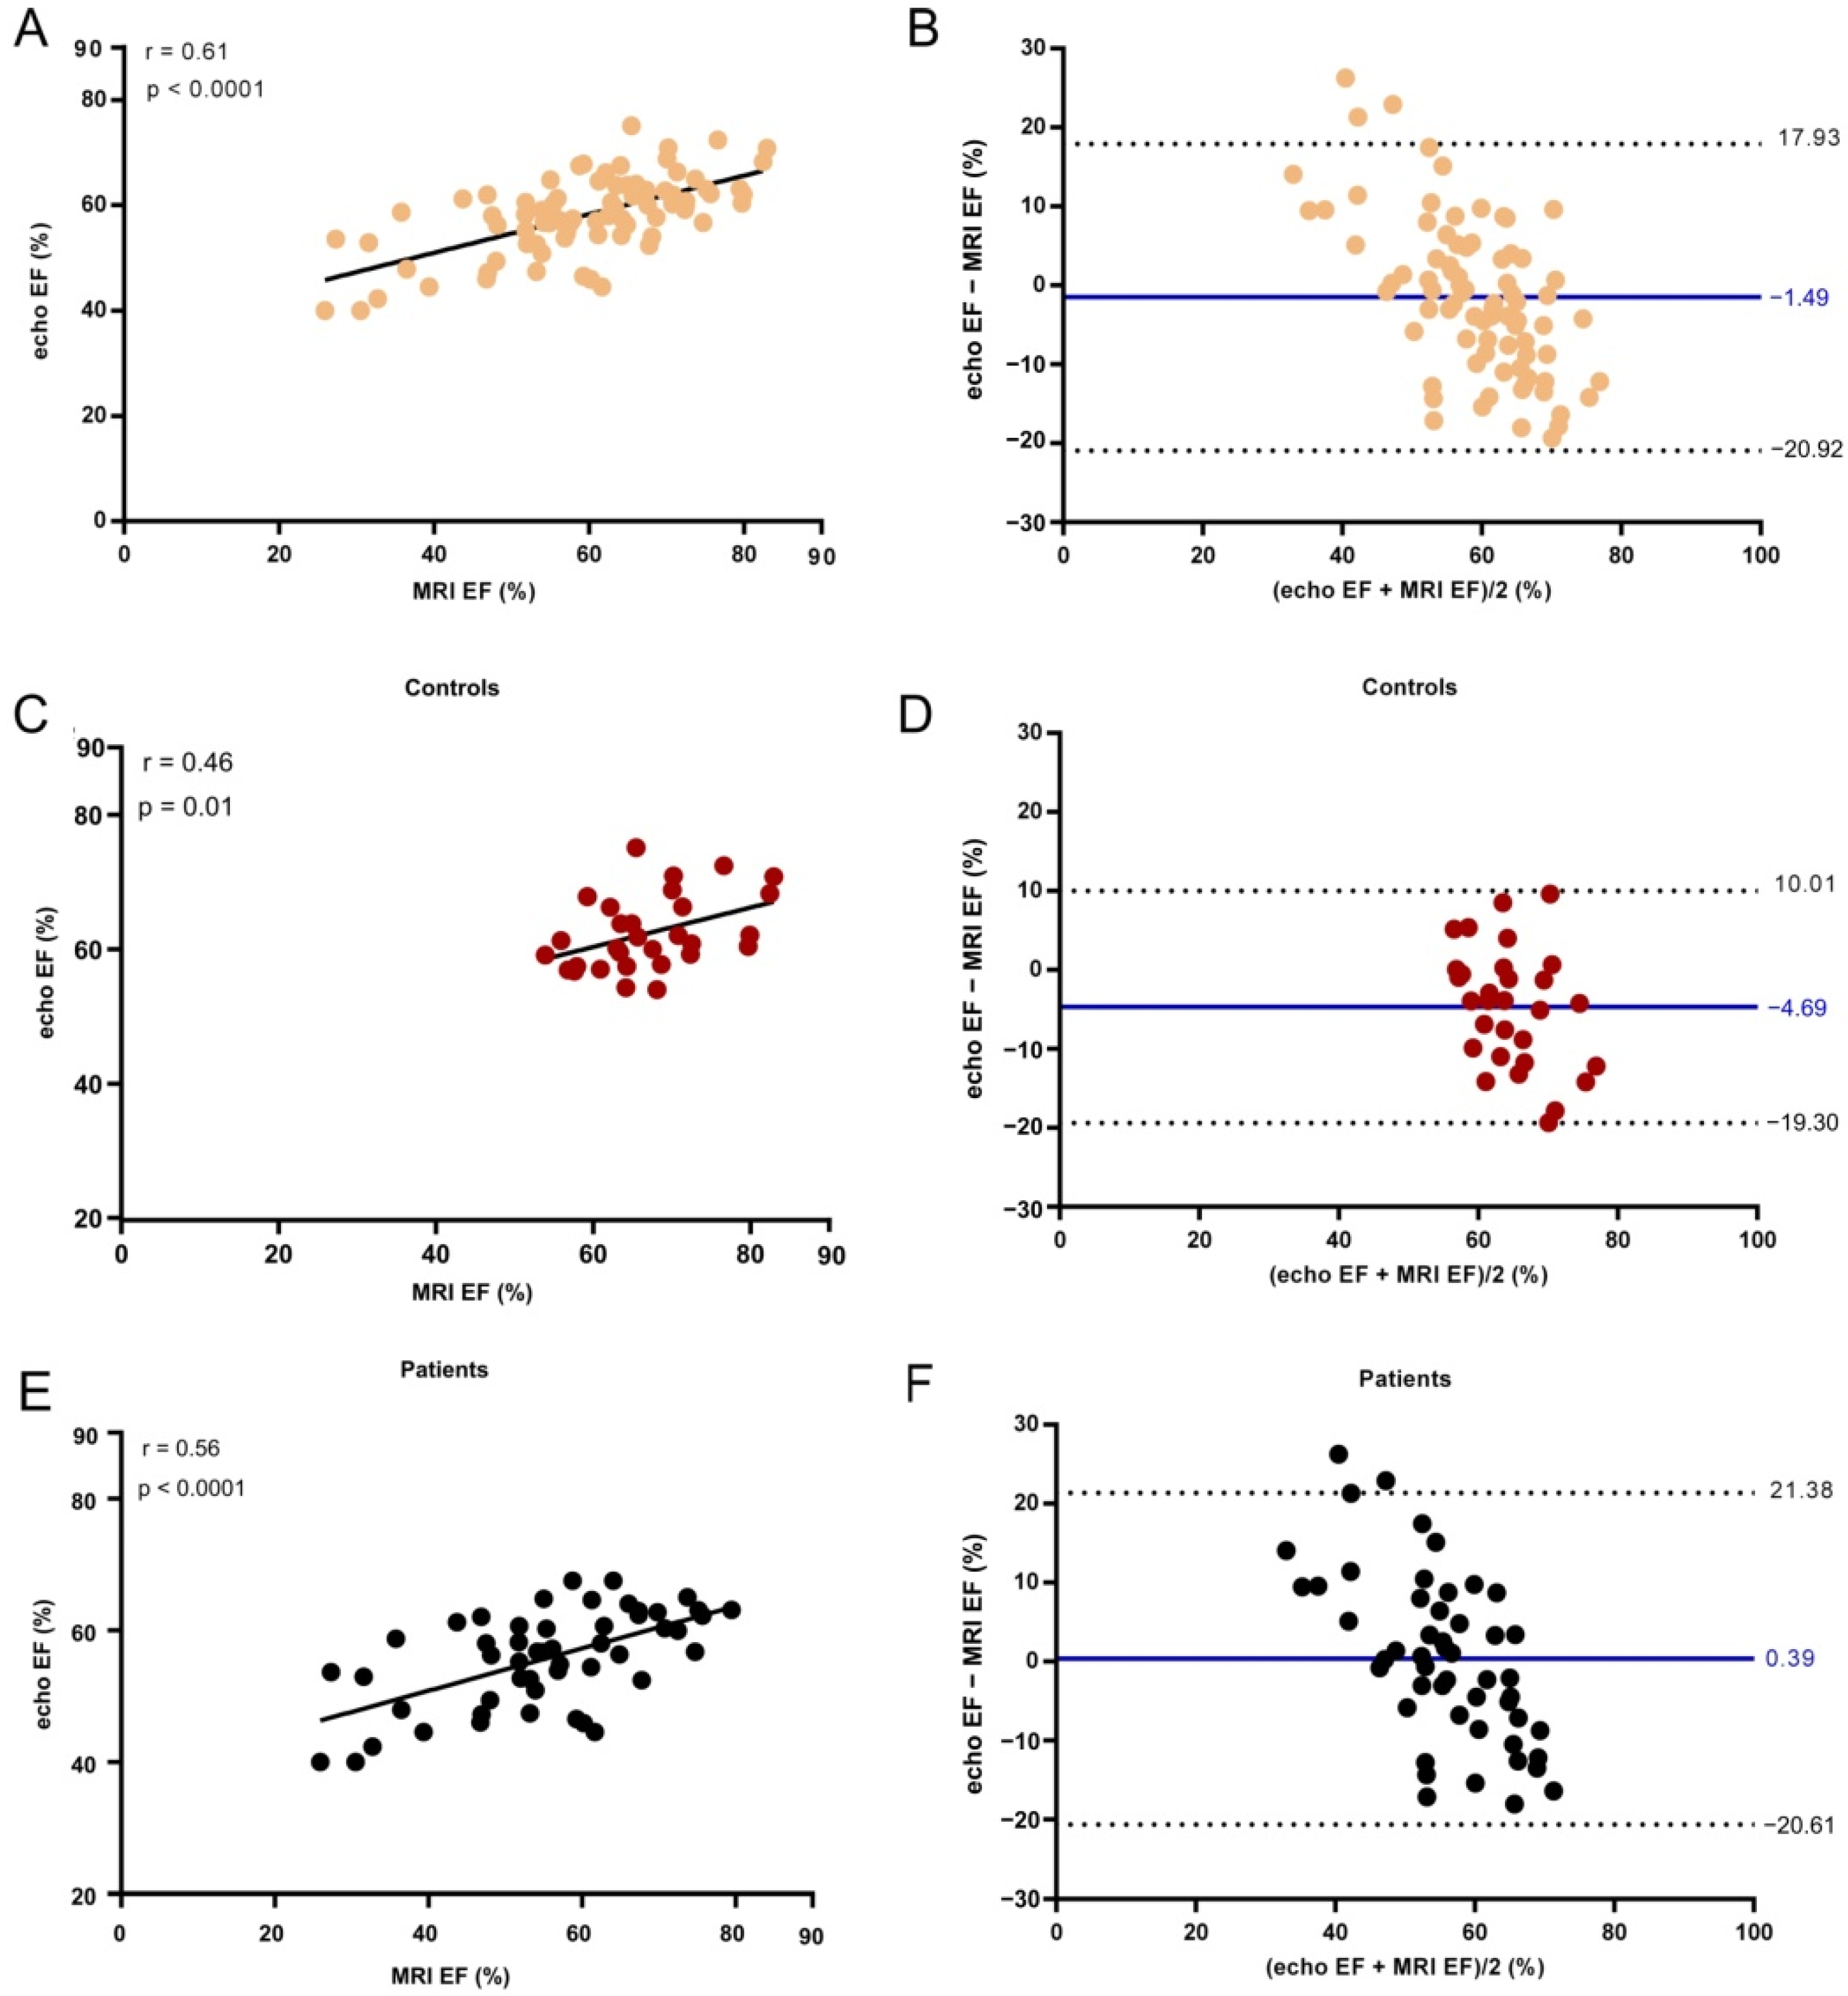
| EF (%) | |||
| All | 61.3 (53.2–68.4) | 59.1 (54.15–62.8) | 0.10 |
| Controls | 65.6 (61.9–71.6) | 61.05 (57.63–66.7) | 0.003 |
| AF patients | 55.4 (47.5–64.85) | 56.7 (50.9–62.0) | 0.93 |
| Spearman r | p Value | |
|---|---|---|
| LA Vol | ||
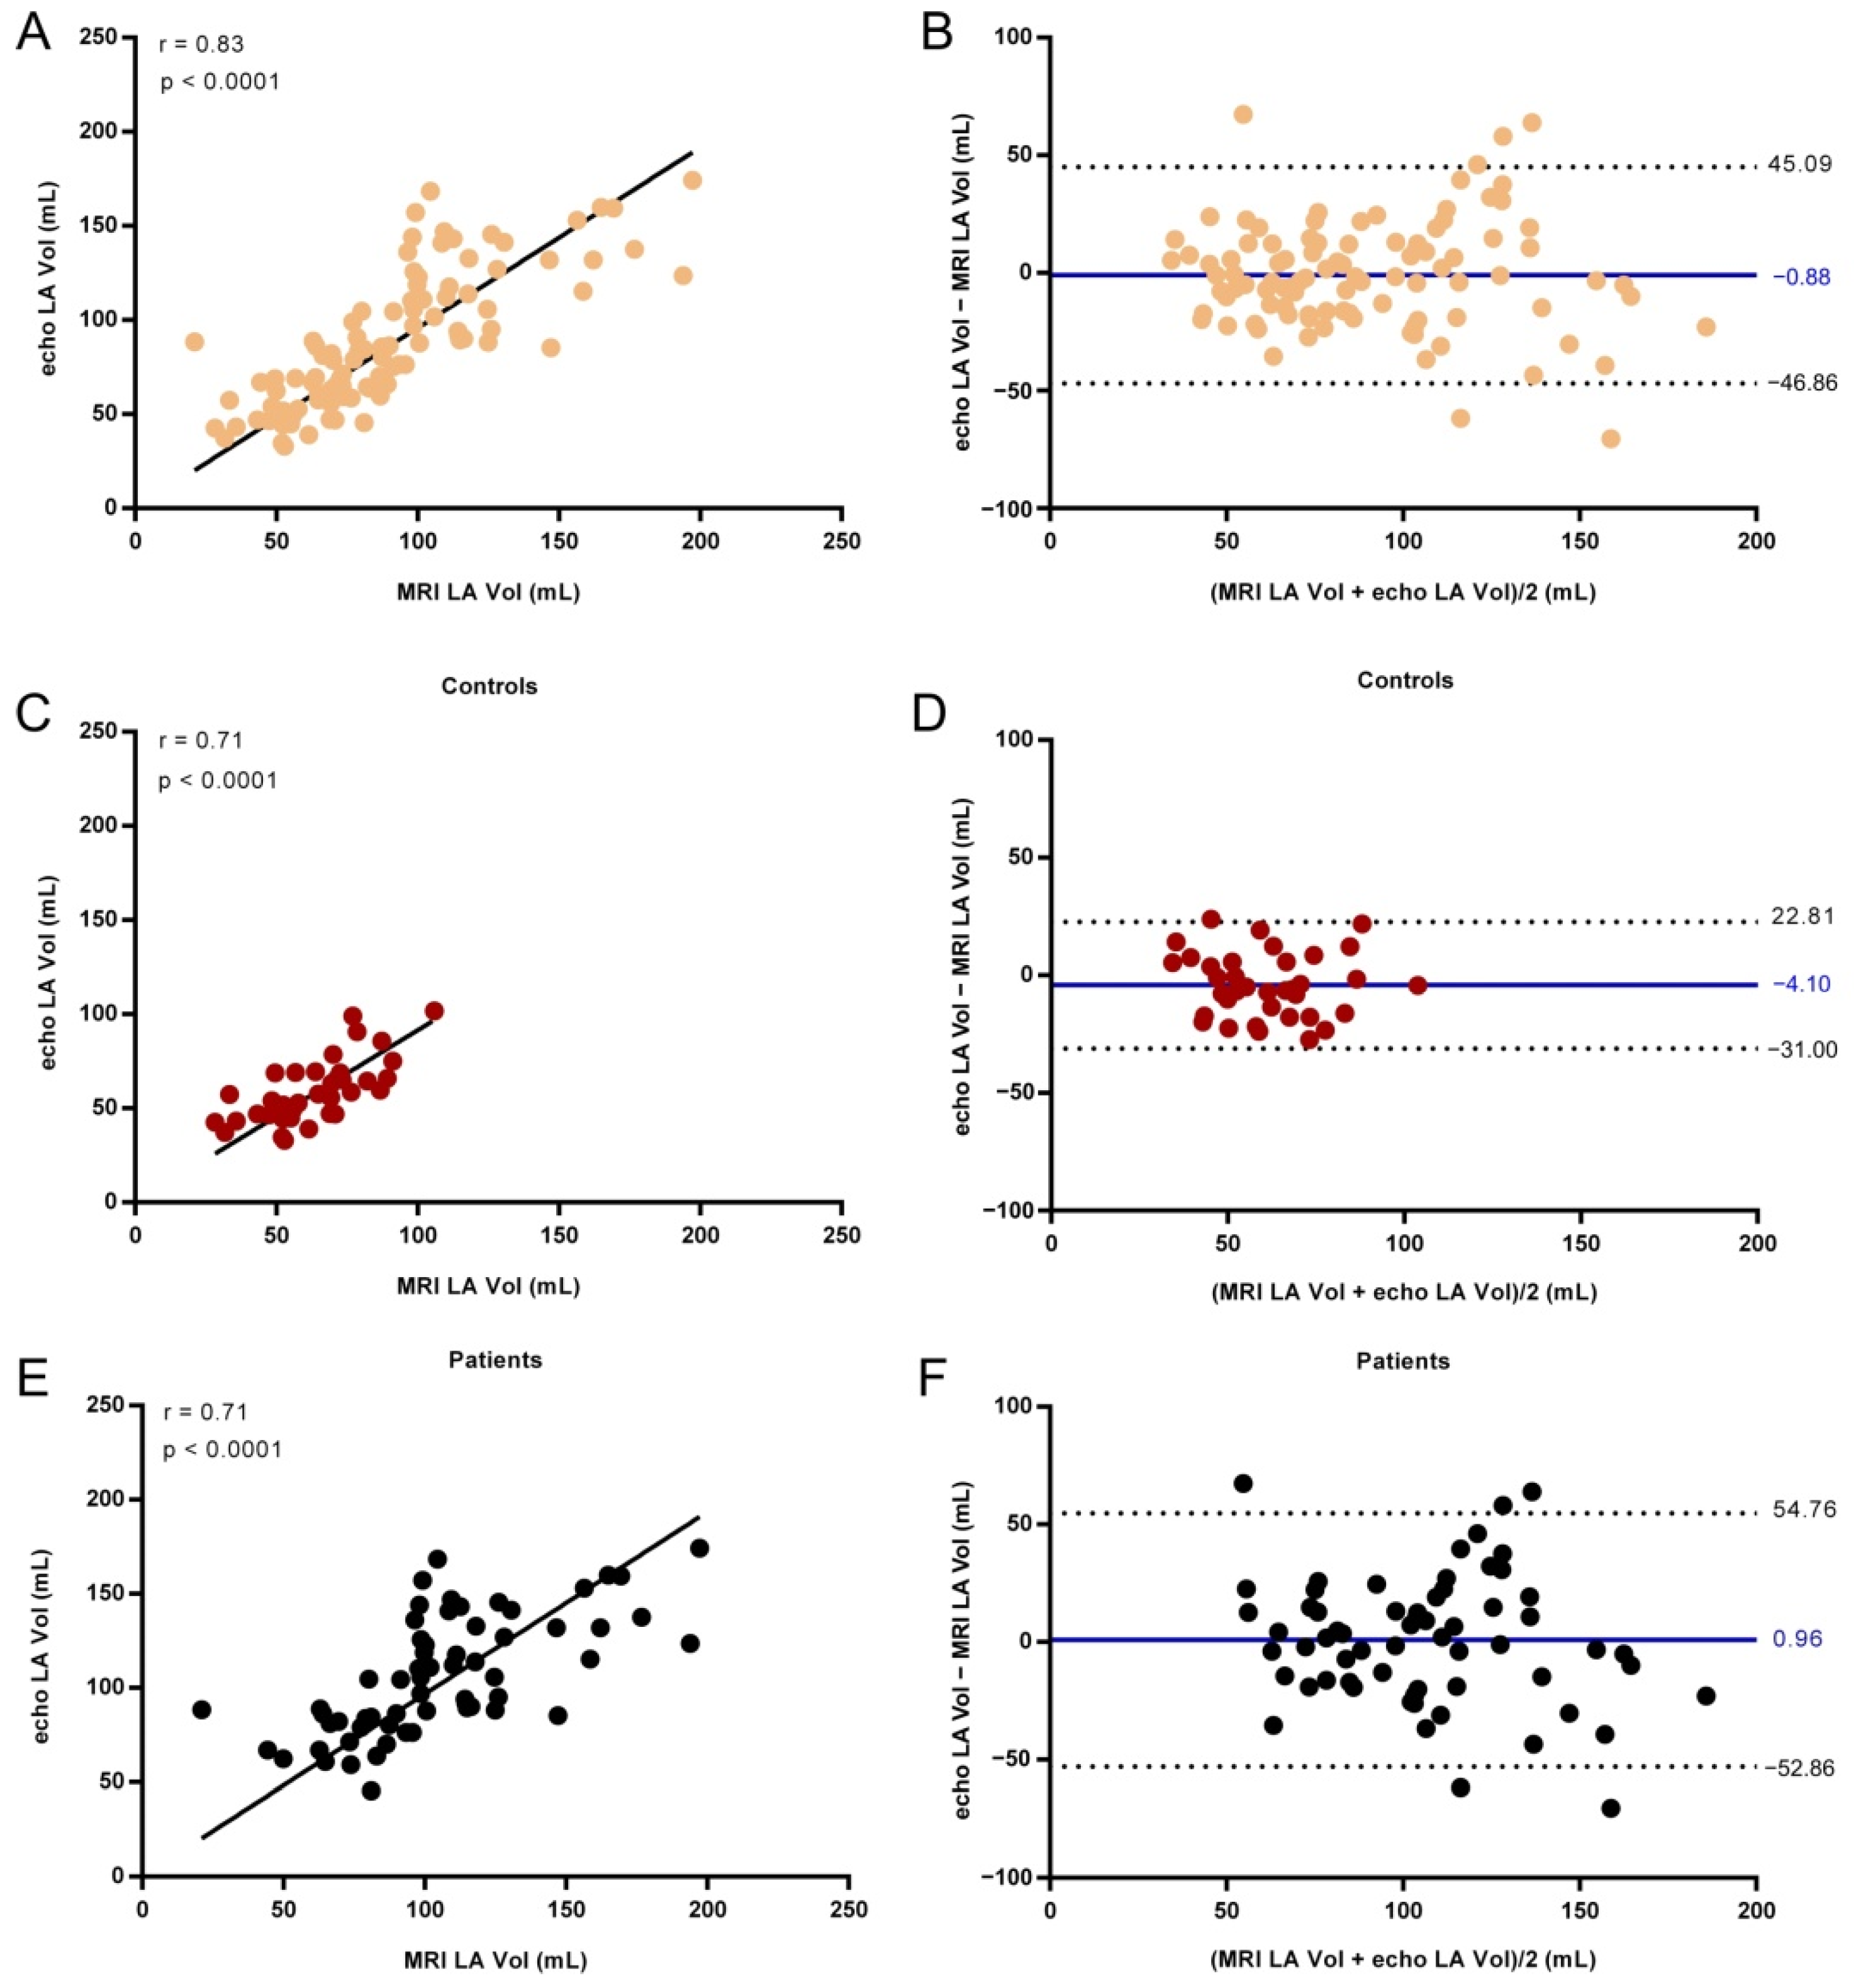
| All | 0.83 | <0.0001 |
| Controls | 0.71 | <0.0001 |
| AF patients | 0.71 | <0.0001 |
| EDV | ||
| All | 0.55 | <0.0001 |
| Controls | 0.71 | <0.0001 |
| AF patients | 0.51 | 0.0002 |
| ESV | ||
| All | 0.62 | <0.0001 |
| Controls | 0.47 | 0.009 |
| AF patients | 0.66 | <0.0001 |
| EF | ||
| All | 0.61 | <0.0001 |
| Controls | 0.46 | 0.01 |
| AF patients | 0.56 | <0.0001 |
Publisher’s Note: MDPI stays neutral with regard to jurisdictional claims in published maps and institutional affiliations. |
© 2021 by the authors. Licensee MDPI, Basel, Switzerland. This article is an open access article distributed under the terms and conditions of the Creative Commons Attribution (CC BY) license (https://creativecommons.org/licenses/by/4.0/).
Share and Cite
Manole, S.; Budurea, C.; Pop, S.; Iliescu, A.M.; Ciortea, C.A.; Iancu, S.D.; Popa, L.; Coman, M.; Szabó, L.; Coman, V.; et al. Correlation between Volumes Determined by Echocardiography and Cardiac MRI in Controls and Atrial Fibrillation Patients. Life 2021, 11, 1362. https://doi.org/10.3390/life11121362
Manole S, Budurea C, Pop S, Iliescu AM, Ciortea CA, Iancu SD, Popa L, Coman M, Szabó L, Coman V, et al. Correlation between Volumes Determined by Echocardiography and Cardiac MRI in Controls and Atrial Fibrillation Patients. Life. 2021; 11(12):1362. https://doi.org/10.3390/life11121362
Chicago/Turabian StyleManole, Simona, Claudia Budurea, Sorin Pop, Alin M. Iliescu, Cristiana A. Ciortea, Stefania D. Iancu, Loredana Popa, Mihaela Coman, László Szabó, Vasile Coman, and et al. 2021. "Correlation between Volumes Determined by Echocardiography and Cardiac MRI in Controls and Atrial Fibrillation Patients" Life 11, no. 12: 1362. https://doi.org/10.3390/life11121362
APA StyleManole, S., Budurea, C., Pop, S., Iliescu, A. M., Ciortea, C. A., Iancu, S. D., Popa, L., Coman, M., Szabó, L., Coman, V., & Bálint, Z. (2021). Correlation between Volumes Determined by Echocardiography and Cardiac MRI in Controls and Atrial Fibrillation Patients. Life, 11(12), 1362. https://doi.org/10.3390/life11121362