
Gene Expression Profiles in Two Razor Clam Populations: Discerning Drivers of Population Status

 ,
,
Abstract
:1. Introduction
2. Materials and Methods
2.1. Study Organisms
2.2. Tissue Collection and RNA Extraction
2.3. cDNA Synthesis
2.4. Primer Design
2.5. Real-Time PCR
2.6. Calculation
3. Results
4. Discussion
5. Conclusions
Author Contributions
Funding
Institutional Review Board Statement
Informed Consent Statement
Data Availability Statement
Acknowledgments
Conflicts of Interest
References
- Bishop, M.; Powers, S. Restoration of Razor Clam (Siliqua patula) Populations in Southeastern Prince William Sound, Alaska: Integrating Science, Management and Traditional Knowledge in the Development of a Restoration Strategy; Final Report; Alaska Department of Fish and Game: Anchorage, AK, USA, 2003.
- MacKenzie, C.L., Jr.; Burrell, V.G., Jr. Trends and status of molluscan fisheries in North and Central America and Europe—A synopsis. In The History, Present Condition, and Future of the Molluscan Fisheries of North and Central America and Europe; MacKenzie, C.L., Jr., Burrell, V.G., Jr., Rosenfield, A., Hobart, W.L., Eds.; Tech Rep. 127; U.S. Department of Commerce, NOAA: Washington, DC, USA, 1997; pp. 1–15. [Google Scholar]
- Booz, M.D.; Schuster, M.; Dickson, H.I.; Kerkvliet, C.M. Sport Fisheries in the Lower Cook Inlet Management Area, 2017–2018, with Updates for 2016; Fishery Management Report No. 19-20; Alaska Department of Fish and Game: Anchorage, AK, USA, 2019.
- Shields, P.; Dupuis, A. Upper Cook Inlet Commercial Fisheries Annual Management Report, 2013; Fishery Management Report No. 13-49; Alaska Department of Fish and Game: Anchorage, AK, USA, 2013.
- Dyson, K.; Huppert, D.D. Regional economic impacts of razor clam beach closures due to harmful algal blooms (HABs) on the Pacific Coast of Washington. Harmful Algae 2010, 9, 264–271. [Google Scholar] [CrossRef]
- Szarzi, N.J.; Kerkvliet, C.M.; Failor, B.J.; Booz, M.D. Recreational Fisheries in the Lower Cook Inlet Management Area, 2008–2010, with Updates for 2007; Fishery Management Report No. 10-38; Alaska Department of Fish and Game: Anchorage, AK, USA, 2010.
- ADF&G. Personal Use Fishing Emergency Order: 2-RCL-7-10-14; Alaska Department of Fish and Game: Anchorage, AK, USA, 2015.
- Kerkvliet, C.M.; Booz, M.D.; Blackmon, T.J.; Hansen, P.A. Eastside Cook Inlet Razor Clam Stock Assessment, 2009–2015; Alaska Department of Fish and Game, Fishery Data Series No. 21-04; Alaska Department of Fish and Game: Anchorage, AK, USA, 2021.
- Szarzi, N.J.; Hansen, P.A. Harvest, Abundance, Age and Length Characteristics of Razor Clams from Eastern Cook Inlet Beaches 2004–2008; Fishery Data Series No. 09-03; Alaska Department of Fish and Game: Anchorage, AK, USA, 2009.
- Kerkvliet, C.M.; Booz, M.D. Cook Inlet Razor Clam Study, 2014; Regional Operational Plan ROP.SF.2A.2014; Alaska Department of Fish and Game: Anchorage, AK, USA, 2015.
- ADF&G. Personal Use Emergency Order No. 2-RCL-7-04-21; Alaska Department of Fish and Game: Anchorage, AK, USA, 2020.
- Kerkvliet, C.M.; Booz, M.D. Operational Plan: Cook Inlet Razor Clam Study, 2015; Alaska Department of Fish and Game, Regional Operational Plan ROP.SF.2A.2016.02; Alaska Department of Fish and Game: Anchorage, AK, USA, 2016.
- Blackmon, T.J. Growth of Pacific Razor Clams in Cook Inlet, Alaska. Master’s Thesis, Alaska Pacific University, Anchorage, AK, USA, 2020. [Google Scholar]
- Jones, T.; Saupe, S.; Iken, K.; Konar, B.; Venator, S.; Lindeberg, M.; Coletti, H.; Pister, B.; Reynolds, J.; Haven, K. Assessment of Nearshore Communities and Habitats: Lower Cook Inlet Nearshore Ecosystem 2015–2018; OCS Study BOEM 2019-075; US Department of the Interior, Bureau of Ocean Energy Management: Anchorage, AK, USA, 2019; p. 221.
- Harper, J.R.; Morris, M.C. ShoreZone Mapping Protocol for the Gulf of Alaska (Ver 1.0); CORI Project: 02-33 EVOS Project: 030641; Exxon Valdez Trustee Council: Anchorage, AK, USA, 2004. [Google Scholar]
- Okkonen, S.; Pegau, S.; Saupe, S. Seasonality of Boundary Conditions for Cook Inlet, Alaska; Coastal Marine Institute, University of Alaska, Minerals Management Service, Department of the Interior, and the School of Fisheries & Ocean Sciences: Fairbanks, AK, USA, 2009. [Google Scholar]
- Vandersea, M.W.; Kibler, S.R.; Tester, P.A.; Holderied, K.; Hondolero, D.E.; Powell, K.; Baird, S.; Doroff, A.; Dugan, D.; Litaker, R.W. Environmental Factors Influencing the Distribution and Abundance of Alexandrium Catenella in Kachemak Bay and Lower Cook Inlet, Alaska. Harmful Algae 2018, 77, 81–92. [Google Scholar] [CrossRef]
- Matozzo, V.; Marin, M.G. Bivalve immune responses and climate changes: Is there a relationship? ISJ Invert. Surviv. J. 2011, 8, 70–77. [Google Scholar]
- Soudant, P.; Chu, F.L.; Volety, A. Host–parasite interactions: Marine bivalve molluscs and protozoan parasites, Perkinsus species. J. Invertebr. Pathol. 2013, 114, 196–216. [Google Scholar] [CrossRef] [PubMed]
- Siegert, D. Trophic Structure of Rocky Intertidal Communities in Contrasting High-Latitude Environments. Master’s Thesis, University of Alaska, Fairbanks, AK, USA, 2020. [Google Scholar]
- Smith, T.; Partridge, S. Dynamics of intertidal foraging by coastal brown bears in southwestern Alaska. J. Wildl. Manag. 2004, 68, 233–240. [Google Scholar] [CrossRef]
- Hale, J.R.; Laidre, K.L.; Tinker, M.T.; Jameson, R.J.; Jeffries, S.J.; Larson, S.E.; Bodkin, J.L. Influence of occupation history and habitat on Washington sea otter diet. Mar. Mammal. Sci. 2019, 35, 1369–1395. [Google Scholar] [CrossRef]
- Garlich-Miller, J.L.; Esslinger, G.G.; Weitzman, B.P. Aerial Surveys of Sea Otters (Enhydra lutris) in Lower Cook Inlet, Alaska, May 2017; Marine Mammals Management Technical Report: MMM 2018-01; U.S. Fish and Wildlife Service: Anchorage, AK, USA, 2018.
- Harper, P.; McCarthy, L.A. (Eds.) Brown Bear Management Report of Survey and Inventory Activities 1 July 2012–30 June 2014; Management Report ADF&G/DWC/SMR-2015-1; Alaska Department of Fish and Game, Species: Juneau, AK, USA, 2015.
- Evans, T.G.; Hofmann, G.E. Defining the Limits of Physiological Plasticity: How Gene Expression Can Assess and Predict the Consequences of Ocean Change. Phil. Trans. R. Soc. B 2012, 367, 1733–1745. [Google Scholar] [CrossRef] [Green Version]
- Bourlat, S.J.; Borja, A.; Gilbert, J.; Taylor, M.I.; Davies, N.; Weisberg, S.B.; Griffith, J.F.; Lettieri, T.; Field, D.; Benzie, J.; et al. Genomics in Marine Monitoring: New Opportunities for Assessing Marine Health Status. Mar. Pollut. Bull. 2013, 74, 19–31. [Google Scholar] [CrossRef]
- Strader, M.E.; Wong, J.M.; Hofmann, G.E. Ocean acidification promotes broad transcriptomic responses in marine metazoans: A literature survey. Front. Zool. 2020, 17, 7. [Google Scholar] [CrossRef] [PubMed] [Green Version]
- Suárez-Ulloa, V.; Fernández-Tajes, J.; Manfrin, C.; Gerdol, M.; Venier, P.; Eirín-López, J.M. Bivalve Omics: State of the Art and Potential Applications for the Biomonitoring of Harmful Marine Compounds. Mar. Drugs 2013, 11, 4370–4389. [Google Scholar] [CrossRef] [PubMed] [Green Version]
- Lockwood, B.L.; Connor, K.M.; Gracey, A.Y.; Podrabsky, J.E.; Stillman, J.H.; Tomanek, L. The environmentally tuned transcriptomes of Mytilus mussels. J. Exp. Biol. 2015, 218, 1822–1833. [Google Scholar] [CrossRef] [Green Version]
- Reid, N.M.; Whitehead, A. Functional genomics to assess biological responses to marine pollution at physiological and evolutionary timescales: Toward a vision of predictive ecotoxicology. Brief. Funct. Genom. 2015, 15, 358–364. [Google Scholar] [CrossRef]
- Mancia, A. Chapter 11—New Technologies for Monitoring Marine Mammal Health. In Marine Mammal Ecotoxicology; Fossi, M.C., Panti, C., Eds.; Academic Press: Cambridge, MA, USA, 2018; pp. 291–320. [Google Scholar] [CrossRef]
- Jax, E.; Wink, M.; Kraus, R.H.S. Avian transcriptomics: Opportunities and challenges. J. Ornithol. 2018, 159, 599–629. [Google Scholar] [CrossRef] [Green Version]
- Gleason, L.U. Applications and Future Directions for Population Transcriptomics in Marine Invertebrates. Curr. Mol. Biol. Rep. 2018, 5, 116–127. [Google Scholar] [CrossRef]
- Acevedo-Whitehouse, K.; Duffus, A.L.J. Effects of Environmental Change on Wildlife Health. Phil. Trans. R. Soc. B 2009, 364, 3429–3438. [Google Scholar] [CrossRef] [Green Version]
- McLoughlin, K.; Turteltaub, K.; Bankaitis-Davis, D.; Gerren, R.; Siconolfi, L.; Storm, K.; Cheronis, J.; Trollinger, D.; Macejak, D.; Tryon, V.; et al. Limited dynamic range of immune response gene expression observed in healthy blood donors using RT-PCR. Mol. Med. 2006, 12, 185–195. [Google Scholar] [CrossRef] [PubMed]
- Poynton, H.C.; Vulpe, C.D. Ecotoxicogenomics: Emerging Technologies for Emerging Contaminants. J. Am. Water Resour. Assoc. 2009, 45, 83–96. [Google Scholar] [CrossRef]
- Bowen, L.; Counihan, K.L.; Ballachey, B.; Coletti, H.; Hollmen, T.; Pister, B.; Wilson, T.L. Monitoring nearshore ecosystem health using Pacific razor clams (Siliqua patula) as an indicator species. PeerJ 2020, 8, e8761. [Google Scholar] [CrossRef]
- Chen, Z.F.; Wang, H.; Matsumura, K.; Qian, P.Y. Expression of calmodulin and myosin light chain kinase during larval settlement of the barnacle Balanus amphitrite. PLoS ONE 2012, 7, e31337. [Google Scholar] [CrossRef] [PubMed] [Green Version]
- Leite, R.B.; Milan, M.; Coppe, A.; Bortoluzzi, S.; dos Anjos, A.; Reinhardt, R.; Saavedra, C.; Patarnello, T.; Cancela, M.; Bargelloni, L. MRNA-Seq and Microarray Development for the Grooved Carpet Shell Clam, Ruditapes decussatus: A Functional Approach to Unravel Host -Parasite Interaction. BMC Genom. 2013, 14, 741. [Google Scholar] [CrossRef] [Green Version]
- Li, C.; Li, H.; Su, X. Identification and characterization of a clam ferritin from Sinonovacula constricta. Fish Shellfish Immun. 2011, 30, 1147–1151. [Google Scholar] [CrossRef]
- Perrigault, M.; Tanguy, A.; Allam, B. Identification and Expression of Differentially Expressed Genes in the Hard Clam, Mercenaria, in Response to Quahog Parasite Unknown (QPX). BMC Genom. 2009, 10, 377. [Google Scholar] [CrossRef] [Green Version]
- Wang, M.; Zhang, D.; Wang, L.; Gai, Y.; Zhou, Z.; Zhang, H.; Song, L. The Molecular Characterization of a Cyclophilin A from Chinese Mitten Crab Eriocheir Sinensis and the Antifungal Activity of Its Recombinant Protein. Electron. J. Biotechnol. 2013, 16. [Google Scholar] [CrossRef]
- Cellura, C.; Toubiana, M.; Parrinello, N.; Roch, P. Specific Expression of Antimicrobial Peptide and HSP70 Genes in Response to Heat-Shock and Several Bacterial Challenges in Mussels. Fish Shellfish Immun. 2007, 22, 340–350. [Google Scholar] [CrossRef]
- Choi, C.Y.; Min, B.H.; Kim, N.N.; Cho, S.H.; Chang, Y.J. Expression of HSP90, HSP70 mRNA and change of plasma cortisol and glucose during water temperature rising in freshwater adapted black porgy, Acanthopagrus schlegeli. J. Aquacult. 2006, 19, 315–322. [Google Scholar]
- Choi, Y.K.; Jo, P.G.; Choi, C.Y. Cadmium Affects the Expression of Heat Shock Protein 90 and Metallothionein MRNA in the Pacific Oyster, Crassostrea Gigas. Comp. Biochem. Phys. C 2008, 147, 286–292. [Google Scholar] [CrossRef]
- Gao, Q.; Song, L.; Ni, D.; Wu, L.; Zhang, H.; Chang, Y. cDNA cloning and mRNA expression of heat shock protein 90 gene in the haemocytes of Zhikong scallop Chlamys farreri. Comp. Biochem. Phys. B 2007, 147, 704–715. [Google Scholar] [CrossRef]
- Richards, M.; Xu, W.; Mallozzi, A.; Errera, R.M.; Supan, J. Production of Calcium-Binding Proteins in Crassostrea virginica in Response to Increased Environmental CO2 Concentration. Front. Mar. Sci. 2018, 5, 203. [Google Scholar] [CrossRef]
- Leprêtre, M.; Almunia, C.; Armengaud, J.; Le Guernic, A.; Salvador, A.; Geffard, A.; Palos-Ladeiro, M. Identification of Immune-Related Proteins of Dreissena Polymorpha Hemocytes and Plasma Involved in Host-Microbe Interactions by Differential Proteomics. Sci. Rep. 2020, 10, 6226. [Google Scholar] [CrossRef] [PubMed]
- Zhang, W.Y.; Storey, K.B.; Dong, Y.W. Adaptations to the mudflat: Insights from physiological and transcriptional responses to thermal stress in a burrowing bivalve Sinonovacula constricta. Sci. Total Environ. 2020, 710, 136280. [Google Scholar] [CrossRef] [PubMed]
- Lin, X.; Wu, X.; Liu, X. Temperature stress response of heat shock protein 90 (Hsp90) in the clam Paphia undulata. Aquacult. Fish. 2018, 3, 106–114. [Google Scholar] [CrossRef]
- Kumar, G.; Ertl, R.; Bartholomew, J.L.; El-Matbouli, M. Transcriptome Analysis Elucidates the Key Responses of Bryozoan Fredericella sultana during the Development of Tetracapsuloides bryosalmonae (Myxozoa). Int. J. Mol. Sci. 2020, 21, 5910. [Google Scholar] [CrossRef]
- Niu, D.; Xie, S.; Bai, Z.; Wang, L.; Jin, K.; Li, J. Identification, expression, and responses to bacterial challenge of the cathepsin C gene from the razor clam Sinonovacula constricta. Dev. Comp. Immunol. 2014, 46, 241–245. [Google Scholar] [CrossRef] [PubMed]
- Moreira, R.; Balseiro, P.; Romero, A.; Dios, S.; Posada, D.; Novoa, B.; Figueras, A. Gene expression analysis of clams Ruditapes philippinarum and Ruditapes decussatus following bacterial infection yields molecular insights into pathogen resistance and immunity. Dev. Comp. Immunol. 2012, 36, 140–149. [Google Scholar] [CrossRef] [PubMed] [Green Version]
- Xie, S.; Niu, D.; Du, Y.; Wei, K.; Nguyen, H.D.; Li, J. Expression and characterization of insulin-like growth factor II mRNA binding protein in the razor clam Sinonovacula constricta. Aquacult. Fish. 2017, 2, 247–255. [Google Scholar] [CrossRef]
- Araya, M.T.; Siah, A.; Mateo, D.; Markham, F.; McKenna, P.; Johnson, G.; Berthe, F.C.J. Selection and evaluation of housekeeping genes for haemocytes of soft-shell clams (Mya arenaria) challenged with Vibrio splendidus. J. Invtebrar. Pathol. 2008, 99, 326–331. [Google Scholar] [CrossRef]
- Mateo, D.R.; Greenwood, S.J.; Araya, M.T.; Berthe, F.C.J.; Johnson, G.R.; Siah, A. Differential gene expression of y-actin, Toll-like receptor 2 (TLR-2) and interleukin-1 receptor-associated kinase 4 (IRAK-4) in Mya arenaria haemocytes induced by In Vivo infections with two Vibrio splendidus strains. Dev. Comp. Immunol. 2010, 34, 710–714. [Google Scholar] [CrossRef]
- Chen, I.H.; Chou, L.S.; Chou, S.J.; Wang, J.H.; Stott, J.; Blanchard, M.; Jen, I.F.; Yang, W.C. Selection of suitable reference genes for normalization of quantitative RT-PCR in peripheral blood samples of bottlenose dolphins (Tursiops truncatus). Sci. Rep. 2015, 5, 15425. [Google Scholar] [CrossRef] [Green Version]
- Brulle, F.; Morgan, A.J.; Coquerelle, C.; Vandenbulcke, F. Transcriptomic underpinning of toxicant-mediated physiological function alterations in three terrestrial invertebrate taxa: A review. Environ. Pollut. 2010, 158, 2793–2808. [Google Scholar] [CrossRef] [PubMed]
- Coletti, H.A.; Bodkin, J.L.; Monson, D.H.; Ballachey, B.E.; Dean, T.A. Detecting and Inferring Cause of Change in an Alaska Nearshore Marine Ecosystem. Ecosphere 2016, 7, e01489. [Google Scholar] [CrossRef]
- Kennish, M.J.; Brush, M.J.; Moore, K.A. Drivers of change in shallow coastal photic systems: An introduction to a special issue. Estuar. Coast. 2014, 37, S3–S19. [Google Scholar] [CrossRef]
- Ford, S.E.; Smolowitz, R. Infection dynamics of an oyster parasite in its newly expanded range. Mar. Biol. 2007, 151, 119–133. [Google Scholar] [CrossRef]
- Meyers, T.; Burton, T. Diseases of Wild and Cultured Shellfish in Alaska; Fish Pathology Laboratories, Alaska Department of Fish and Game: Anchorage, AK, USA, 2009.
- McKellar, J.M. Growth and Maturity of the Pacific Razor Clam in Eastern Cook Inlet, Alaska. Master’s Thesis, University of Alaska, Fairbanks, AK, USA, 2014. Available online: http://hdl.handle.net/11122/4811 (accessed on 22 October 2020).
- Elston, R.A. An intranuclear pathogen [nuclear inclusion X (NIX)] associated with massive mortalities of the Pacific razor clam, Siliqua patula. J. Inver. Path. 1986, 47, 93–104. [Google Scholar] [CrossRef]
- Travis, B.A.; Batts, W.N.; Groner, M.L.; Hershberger, P.K.; Fradkin, S.C.; Conway, C.M.; Park, L.; Purcell, M.K. Novel diagnostic tests for the putative agent of bacterial gill disease in Pacific razor clams (Siliqua patula). J. Invertebr. Pathol. 2021, 178, 107519. [Google Scholar] [CrossRef] [PubMed]
- Johnston, E.L.; Mayer-Pinto, M.; Crowe, T.P. Review: Chemical contaminant effects on marine ecosystem functioning. J. Appl. Ecol. 2015, 52, 140–149. [Google Scholar] [CrossRef] [Green Version]
- Rider, M.; Apeti, D.A.; Jacob, A.; Kimbrough, K.; Davenport, E.; Bower, M.; Coletti, H.; Esler, D. A Synthesis of Ten Years of Chemical Contaminants Monitoring in National Park Service—Southeast and Southwest Alaska Networks; NOAA Technical Memorandum NOS NCCOS 277; NOAA: Washington, DC, USA, 2020; p. 110. [CrossRef]
- Larrance, J.D.; Chester, A.J. Source, Composition, and Flux of Organic Detritus in Lower Cook Inlet; OCSEAP Final Report; U.S. Department of Commerce, NOAA: Washington, DC, USA, 1979; pp. 1–71.
- Coyle, K.O.; Hermann, A.J.; Hopcroft, R.R. Modeled spatial-temporal distribution of productivity, chlorophyll, iron and nitrate on the northern Gulf of Alaska shelf relative to field observations. Deep-Sea Res. Pt. II 2019, 165, 163–191. [Google Scholar] [CrossRef]
- Swan, E.F. The growth of the clam Mya arenaria as affected by the substratum. Ecology 1952, 33, 530. [Google Scholar] [CrossRef]
- Richardson, C.A. Molluscs as archives of environmental change. Oceanogr. Mar. Biol. 2001, 39, 103–164. [Google Scholar]
- Newell, C.R.; Hidu, H. The effects of sediment type on growth rate and shell allometry in the Soft-shelled Clam, Mya arenaria. J. Exp. Mar. Biol. Ecol. 1982, 65, 285–295. [Google Scholar] [CrossRef]
- Lomovasky, B.J.; Lasta, M.; Valiñas, M.; Bruschetti, M.; Ribeiro, P.; Campodónico, S.; Iribarne, O. Differences in shell morphology and internal growth pattern of the Patagonian scallop Zygochlamys patagonica in the four main beds across their SW Atlantic distribution range. Fish. Res. 2008, 89, 266–275. [Google Scholar] [CrossRef]
- Hernández-Otero, A.; Gaspar, M.B.; Macho, G.; Vázquez, E. Age and growth of the sword razor clam Ensis arcuatus in the Ria de Pontevedra (NW Spain): Influence of environmental parameters. J. Sea Res. 2014, 85, 59–72. [Google Scholar] [CrossRef]
- Addino, M.S.; Alvarez, M.F.; Brey, T.; Iribarne, O.; Lomovasky, B.J. Growth changes of the stout razor clam Tagelus plebeius (Lightfoot, 1786) under different salinities in SW Atlantic estuaries. J. Sea. Res. 2019, 146, 14–23. [Google Scholar] [CrossRef] [Green Version]
- Walsh, J.E.; Thoman, R.L.; Bhatt, U.S.; Bieniek, P.A.; Brettschneider, B.; Brubaker, M.; Danielson, S.; Lader, R.; Fetterer, F.; Holderied, K.; et al. The high latitude marine heat wave of 2016 and its impacts on Alaska. Bull. Am. Meteorol. Soc. 2018, 99, S39–S43. [Google Scholar] [CrossRef]
- Holbrook, N.J.; Scannell, H.A.; Gupta, A.S.; Benthuysen, J.A.; Feng, M.; Oliver, E.C.; Alexander, L.V.; Burrows, M.T.; Donat, M.G.; Hobday, A.J.; et al. A global assessment of marine heatwaves and their drivers. Nat. Commun. 2019, 10, 2624. [Google Scholar] [CrossRef] [PubMed]
- Weitzman, B.; Konar, B.; Iken, K.; Coletti, H.; Monson, D.; Suryan, R.; Dean, T.; Hondolero, D.; Lindeberg, M. Changes in Rocky Intertidal Community Structure During a Marine Heatwave in the Northern Gulf of Alaska. Front. Mar. Sci. 2021, 8, 556820. [Google Scholar] [CrossRef]
- Counihan, K.; Bowen, L.; Ballachey, B.; Coletti, H.; Hollmen, T.; Pister, B.; Wilson, T.L. Physiological and gene transcription assays in combination: A new paradigm for marine intertidal assessment. PeerJ 2019, 7, e7800. [Google Scholar] [CrossRef] [Green Version]
- Bowen, L.; Miles, A.K.; Ballachey, B.; Waters, S.; Bodkin, J. Gene Transcript Profiling in Sea Otters Post-Exxon Valdez Oil Spill: A Tool for Marine Ecosystem Health Assessment. J. Mar. Sci. Eng. 2016, 4, 39. [Google Scholar] [CrossRef] [Green Version]
- Tinker, T.M.; Bodkin, J.L.; Bowen, L.; Ballachey, B.; Bentall, G.; Burdin, A.; Coletti, H.; Esslinger, G.; Hatfield, B.B.; Kenner, M.C.; et al. Sea otter population collapse in southwest Alaska: Assessing ecological covariates, consequences, and causal factors. Ecol. Monogr. 2021, 91, e01472. [Google Scholar] [CrossRef]
- Konar, B.; Mitchell, T.J.; Iken, K.; Coletti, H.; Dean, T.; Esler, D.; Lindberg, M.; Pister, B.; Weitzman, B. Wasting disease and environmental variables drive sea star assemblages in the northern Gulf of Alaska. J. Exp. Mar. Biol. Ecol. 2019, 520, 151209. [Google Scholar] [CrossRef]
- Weitzman, B.P. Sea Urchin Ecology: Effects of Food-Web Modification, Climate Change and Community Structure. Ph.D. Thesis, University of Alaska, Fairbanks, AK, USA, 2020. [Google Scholar]
- Erlenbach, J.A. Nutritional and Landscape Ecology of Brown Bears (Ursus arctos). Ph.D. Thesis, Washington State University, Pullman, WA, USA, 2020. [Google Scholar]
- Estes, J.A.; Palmisano, J.F. Sea otters: Their role in structuring nearshore communities. Science 1974, 185, 1058–1060. [Google Scholar] [CrossRef] [PubMed]
- Garshelis, D.L.; Garshelis, J.A.; Kimker, A.T. Sea Otter Time Budgets and Prey Relationships in Alaska. J. Wildl. Manag. 1986, 50, 637–647. Available online: https://www.jstor.org/stable/3800974 (accessed on 16 August 2020). [CrossRef]
- Riedman, M.; Estes, J.A. The Sea Otter (Enhydra Lutris): Behavior, Ecology, and Natural History; U.S. Fish and Wildlife Service, Biological Report; U.S. Fish and Wildlife Service: Washington, DC, USA, 1990; Volume 90, pp. 1–126.
- Kvitek, R.G.; Oliver, J.S.; DeGange, A.R.; Anderson, B.S. Changes in Alaskan soft-bottom prey communities along a gradient in sea otter predation. Ecology 1992, 73, 413–428. [Google Scholar] [CrossRef]
- Estes, J.A.; Duggins, D.O. Sea Otters and Kelp Forests in Alaska: Generality and Variation in a Community Ecological Paradigm. Ecol. Monogr. 1995, 65, 75–100. [Google Scholar] [CrossRef] [Green Version]
- Hughes, B.B.; Eby, R.; Van Dyke, E.; Tinker, M.T.; Marks, C.I.; Johnson, K.S.; Wasson, K. Recovery of a top predator mediates negative eutrophic effects on seagrass. Proc. Natl. Acad. Sci. USA 2013, 110, 15313–15318. [Google Scholar] [CrossRef] [Green Version]
- Kenyon, K.W. The Sea Otter in the Eastern Pacific Ocean. North Am. Fauna 1969, 68, 1–352. [Google Scholar] [CrossRef] [Green Version]
- Bodkin, J.L. Historic and contemporary status of sea otters in the North Pacific. In Sea Otter Conservation; Larson, S.E., Bodkin, J.L., VanBlaricom, G.R., Eds.; Elsevier: Amsterdam, The Netherlands, 2015; pp. 46–61. [Google Scholar]
- Wendell, F. Relationship between sea otter range expansion and red abalone abundance and size distribution in central California. Calif. Fish Game 1994, 80, 45–56. [Google Scholar]
- Wendell, F.E.; Hardy, R.A.; Ames, J.A.; Burge, R.T. Temporal and spatial patterns in sea otter (Enhydra lutris) range expansion and in the loss of the Pismo clam fisheries. Calif. Fish. Game 1986, 72, 197–212. [Google Scholar]
- Watson, J.C.; Smith, T.G. The effect of sea otters on shellfisheries in British Columbia. In Invertebrate Working Papers; Hand, C.M., Waddell, B.J., Eds.; Reviewed by the Pacific Assessment Review Committee (PSARC) in 1993 and 1994; No. 2089; Canadian Technical Report of Fisheries and Aquatic Sciences: Ottawa, ON, Canada, 1996; pp. 262–303. [Google Scholar]
- Estes, J.A.; VanBlaricom, G.R. Sea-otters and shellfisheries. In Marine Mammals and Fisheries; Beddington, R., Beverton, R.J.H., Lavigne, D.M., Eds.; George Allen & Unwin: Crows Nest, Australia, 1985; pp. 187–235. [Google Scholar]
- Larson, S.D.; Hoyt, Z.N.; Eckert, G.L.; Gill, V.A. Impacts of sea otter (Enhydra lutris) predation on commercially important sea cucumbers (Parastichopus californicus) in southeast Alaska. Can. J. Fish. Aquat. Sci. 2013, 70, 1498–1507. [Google Scholar] [CrossRef]
- Hoyt, Z.N. Resource Competition, Space Use and Forage Ecology of Sea Otters, Enhydra lutris, in Southern Southeast Alaska. Ph.D. Thesis, University of Alaska, Fairbanks, AK, USA, 2015. [Google Scholar]
- Doroff, A.M.; DeGange, A.R. Sea otter, Enhydra lutris, prey composition and foraging success in the northern Kodiak Archipelago. Fish. Bull. 1994, 92, 704–710. [Google Scholar]
- Dean, T.A.; Bodkin, J.L.; Fukuyama, A.K.; Jewett, S.C.; Monson, D.H.; O’Clair, C.E.; VanBlaricom, G.R. Food limitation and the recovery of sea otters in Prince William Sound. Mar. Ecol. Prog. Ser. 2002, 241, 255–270. [Google Scholar] [CrossRef] [Green Version]
- Bodkin, J.L.; Monson, D.H.; Esslinger, G.G. Results of the 2002 Kenai Peninsula and Lower Cook Inlet Aerial Sea Otter Survey; Alaska Science Center Report; U.S. Geological Survey: Reston, VA, USA, 2003.
- Mangipane, B. Sea Otter Aerial Distribution Surveys along the Lake Clark Coast; NPS: Anchorage, AK, USA, 2018; Unpublished materials intended for publication. [Google Scholar]


| Gene | Function |
|---|---|
| Calmodulin (CaM) | Shell formation—indication of ocean acidification; metabolism, immune response ([38]—Barnacle Balanus amphitrite; [39]—Grooved carpet shell clam, Ruditapes decussatus; [47]—Eastern oyster, Crassostrea virginica) |
| Ferritin (Ferr) | Increased in response to pathogens, metabolizing iron ([40]—Chinese razor clam Sinonovacula constricta; [41]—hard clam Mercenaria; [48]—zebra mussel Dreissena polymorpha) |
| Heat Shock Protein 70 (HSP70) | General stress, temperature, pathogen exposure, provides cellular protection ([43]—Mussels Mytilus spp.; [49]—Chinese razor clam Sinonovacula contricta) |
| Heat Shock Protein 90 (HSP90) | General stress, contaminants, temperature, salinity change, metabolism; provides cellular protection ([44]—black porgy Acanthopagrus schlegeli; [45]—Pacific oyster Crassostrea gigas; [46]—Zhikong scallop Chlamys farreri; [50]—short-necked clam Paphia undulata) |
| Peptidylprolyl isomerase A (PPIA) | Proinflammatory, increased in response to pathogen stimulus ([42]—Chinese mitten crab Eriocheir sinensis; [51]—moss animal Fredericella sultana) |
| 18S | Reference ([52]—Chinese razor clam Sinonovacula constricta; [53]—Manilla clam Ruditapes philippinarum and grooved carpet clam Ruditapes desussatus; [54]—Chinese razor clam Sinonovacula constricta) |
| Elongation Factor Alpha-1 (EF1a) | Reference ([55]—soft-shell clams Mya arenaria; [56]—soft-shell clams Mya arenaria) |
| Region | Site | CaM | Ferr | HSP70 | HSP90 | PPIA |
|---|---|---|---|---|---|---|
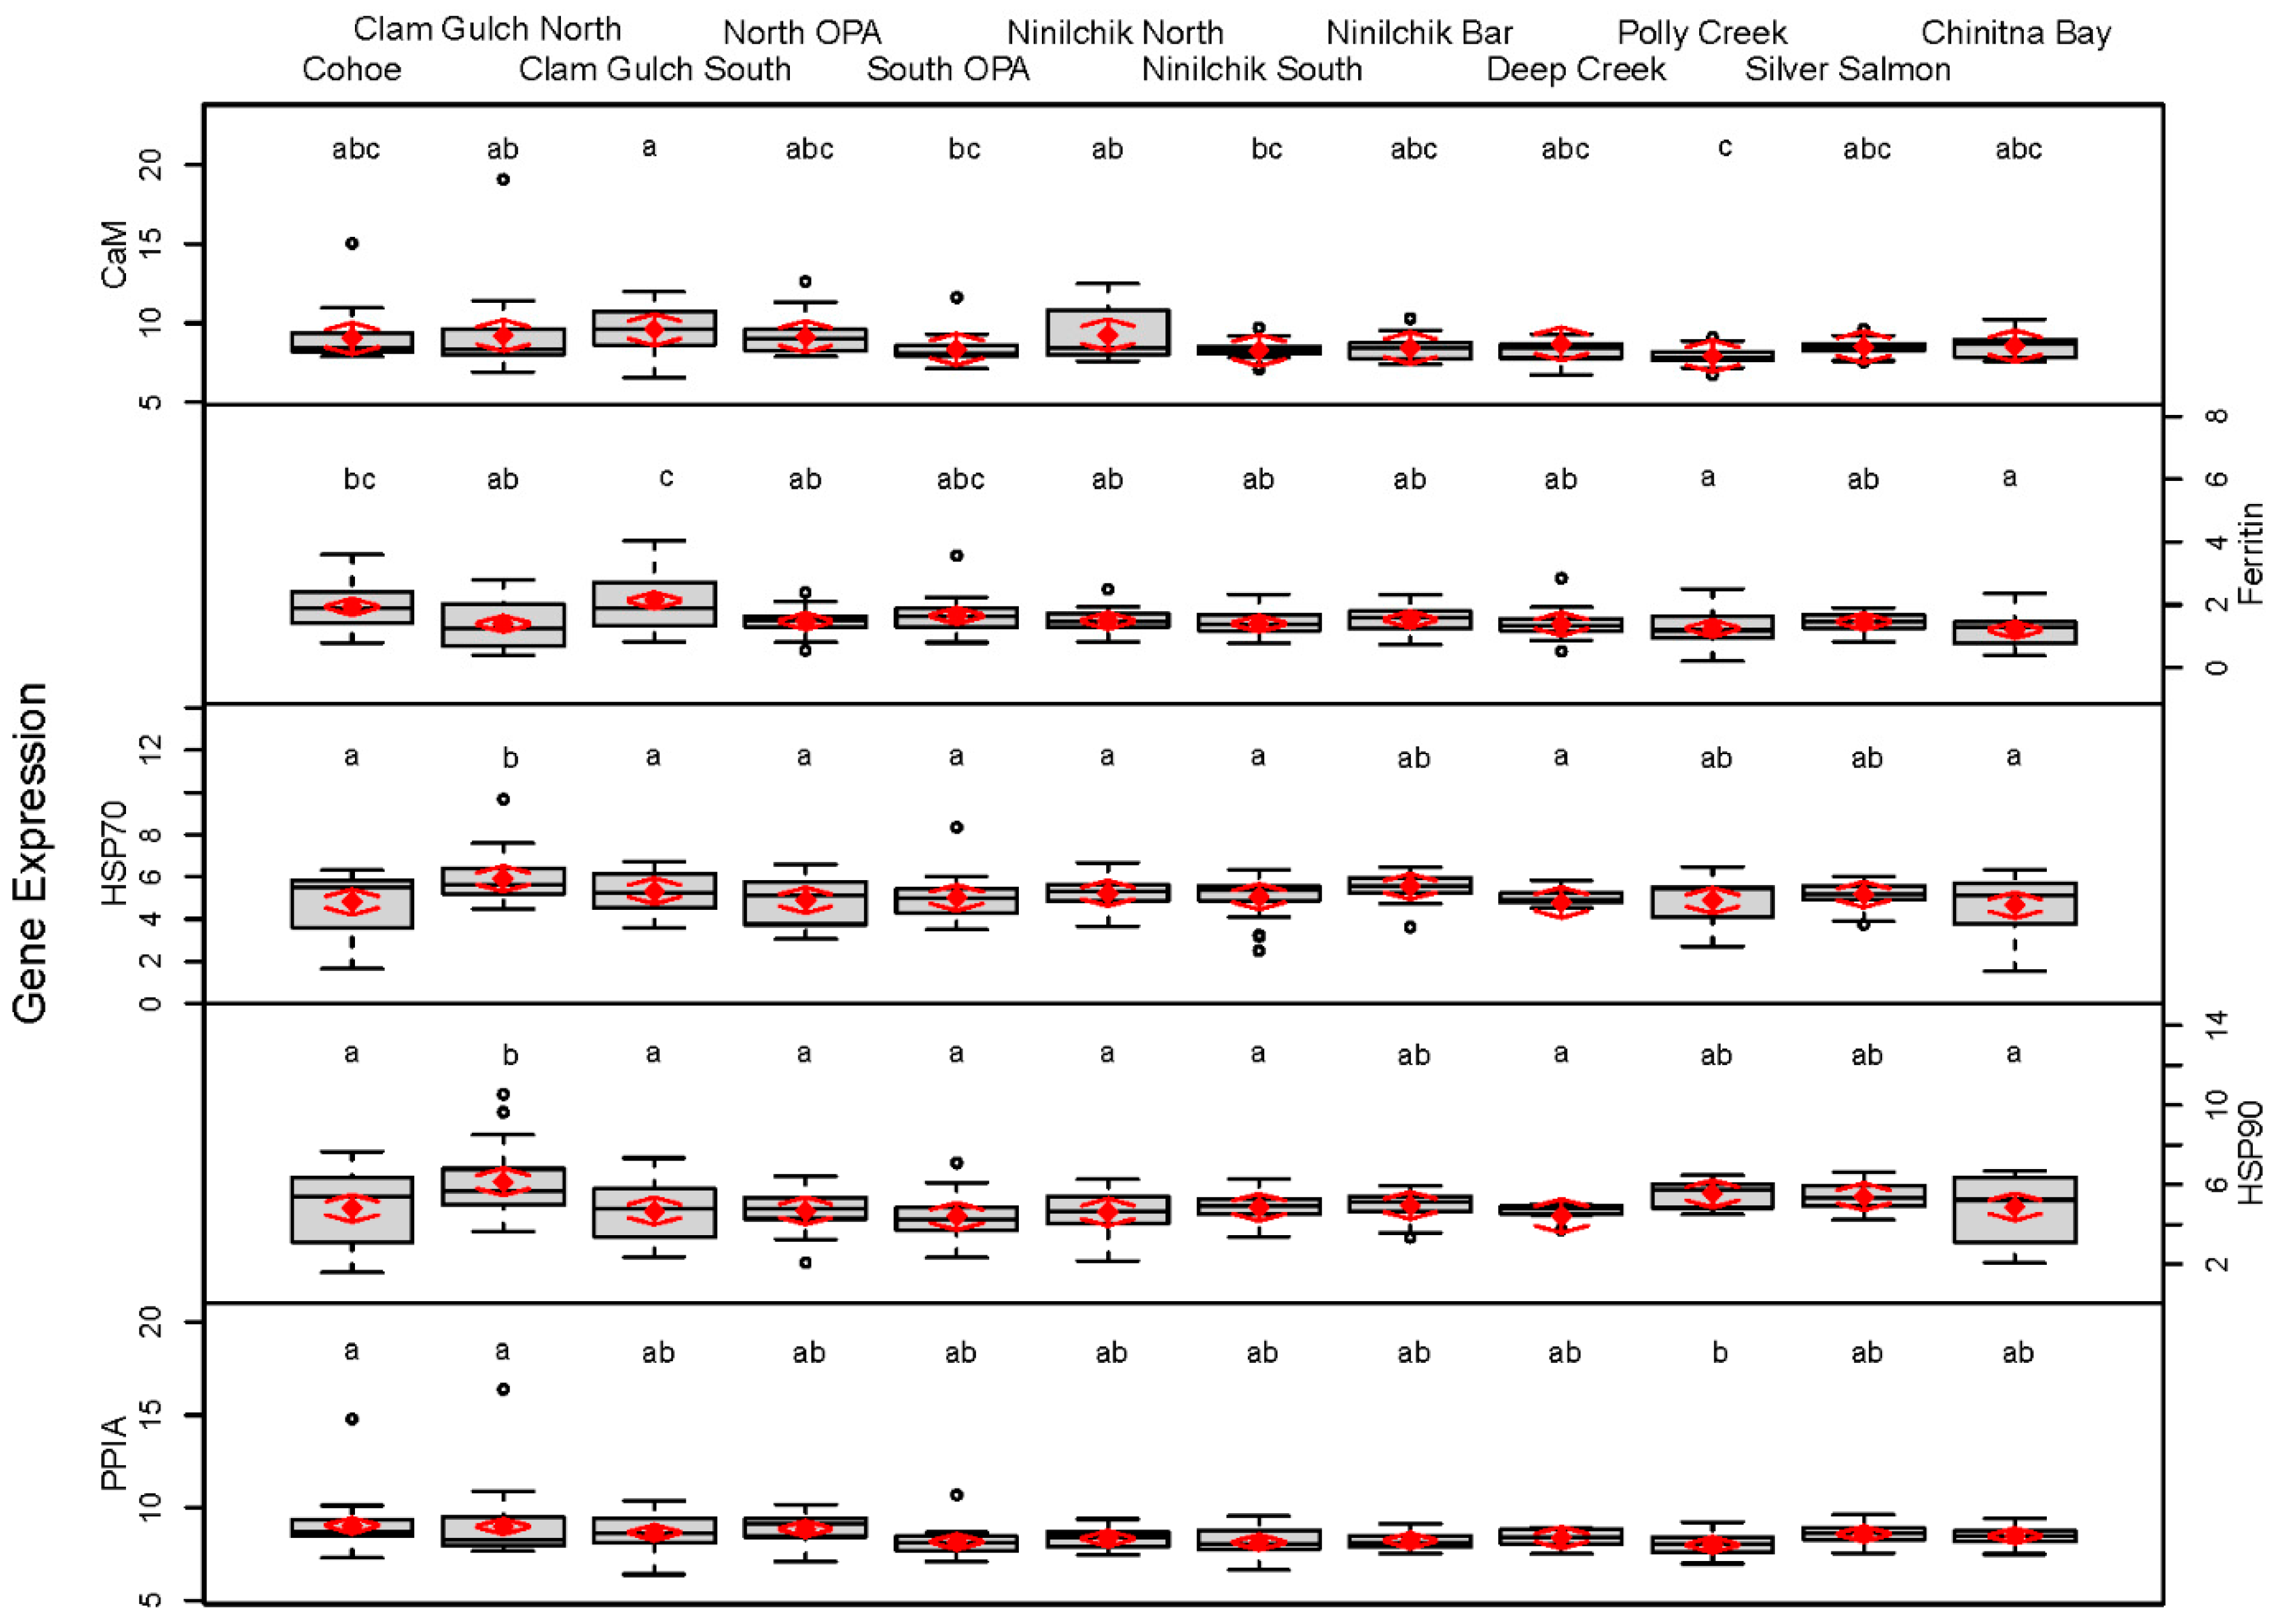
| ECI | Cohoe | 9.03 (8.03, 10.02) abc | 1.93 (1.67, 2.20) bc | 4.81 (4.20, 5.42) a | 4.81 (4.12, 5.49) a | 9.04 (8.62, 9.46) a |
| Clam Gulch North | 9.21 (8.22, 10.20) ab | 1.39 (1.13, 1.65) ab | 5.91 (5.30, 6.52) b | 6.13 (5.45, 6.82) b | 8.98 (8.56, 9.40) a | |
| Clam Gulch South | 9.58 (8.58, 10.57) a | 2.14 (1.87, 2.40) c | 5.33 (4.72, 5.94) ab | 4.67 (3.99, 5.35) a | 8.65 (8.24, 9.07) ab | |
| North Oil Pad Access | 9.14 (8.14, 10.13) abc | 1.48 (1.21, 1.74) ab | 4.89 (4.28, 5.50) a | 4.68 (3.99, 5.36) a | 8.86 (8.44, 9.28) ab | |
| South Oil Pad Access | 8.34 (7.35, 9.34) bc | 1.64 (1.38, 1.91) abc | 5.01 (4.40, 5.62) ab | 4.40 (3.72, 5.09) a | 8.16 (7.74, 8.58) ab | |
| Ninilchik North | 9.25 (8.26, 10.25) ab | 1.49 (1.23, 1.75) ab | 5.23 (4.62, 5.83) ab | 4.61 (3.92, 5.29) a | 8.33 (7.91, 8.75) ab | |
| Ninilchik South | 8.28 (7.28, 9.27) bc | 1.40 (1.14, 1.66) ab | 5.07 (4.46, 5.68) ab | 4.85 (4.17, 5.54) a | 8.13 (7.71, 8.55) ab | |
| Ninilchik Bar | 8.43 (7.43, 9.42) abc | 1.53 (1.27, 1.79) ab | 5.54 (4.93, 6.15) ab | 4.95 (4.27, 5.64) ab | 8.22 (7.81, 8.64) ab | |
| Deep Creek | 8.68 (7.63, 9.74) abc | 1.38 (1.02, 1.75) ab | 4.78 (4.06, 5.51) ab | 4.42 (3.57, 5.27) a | 8.38 (7.79, 8.97) ab | |
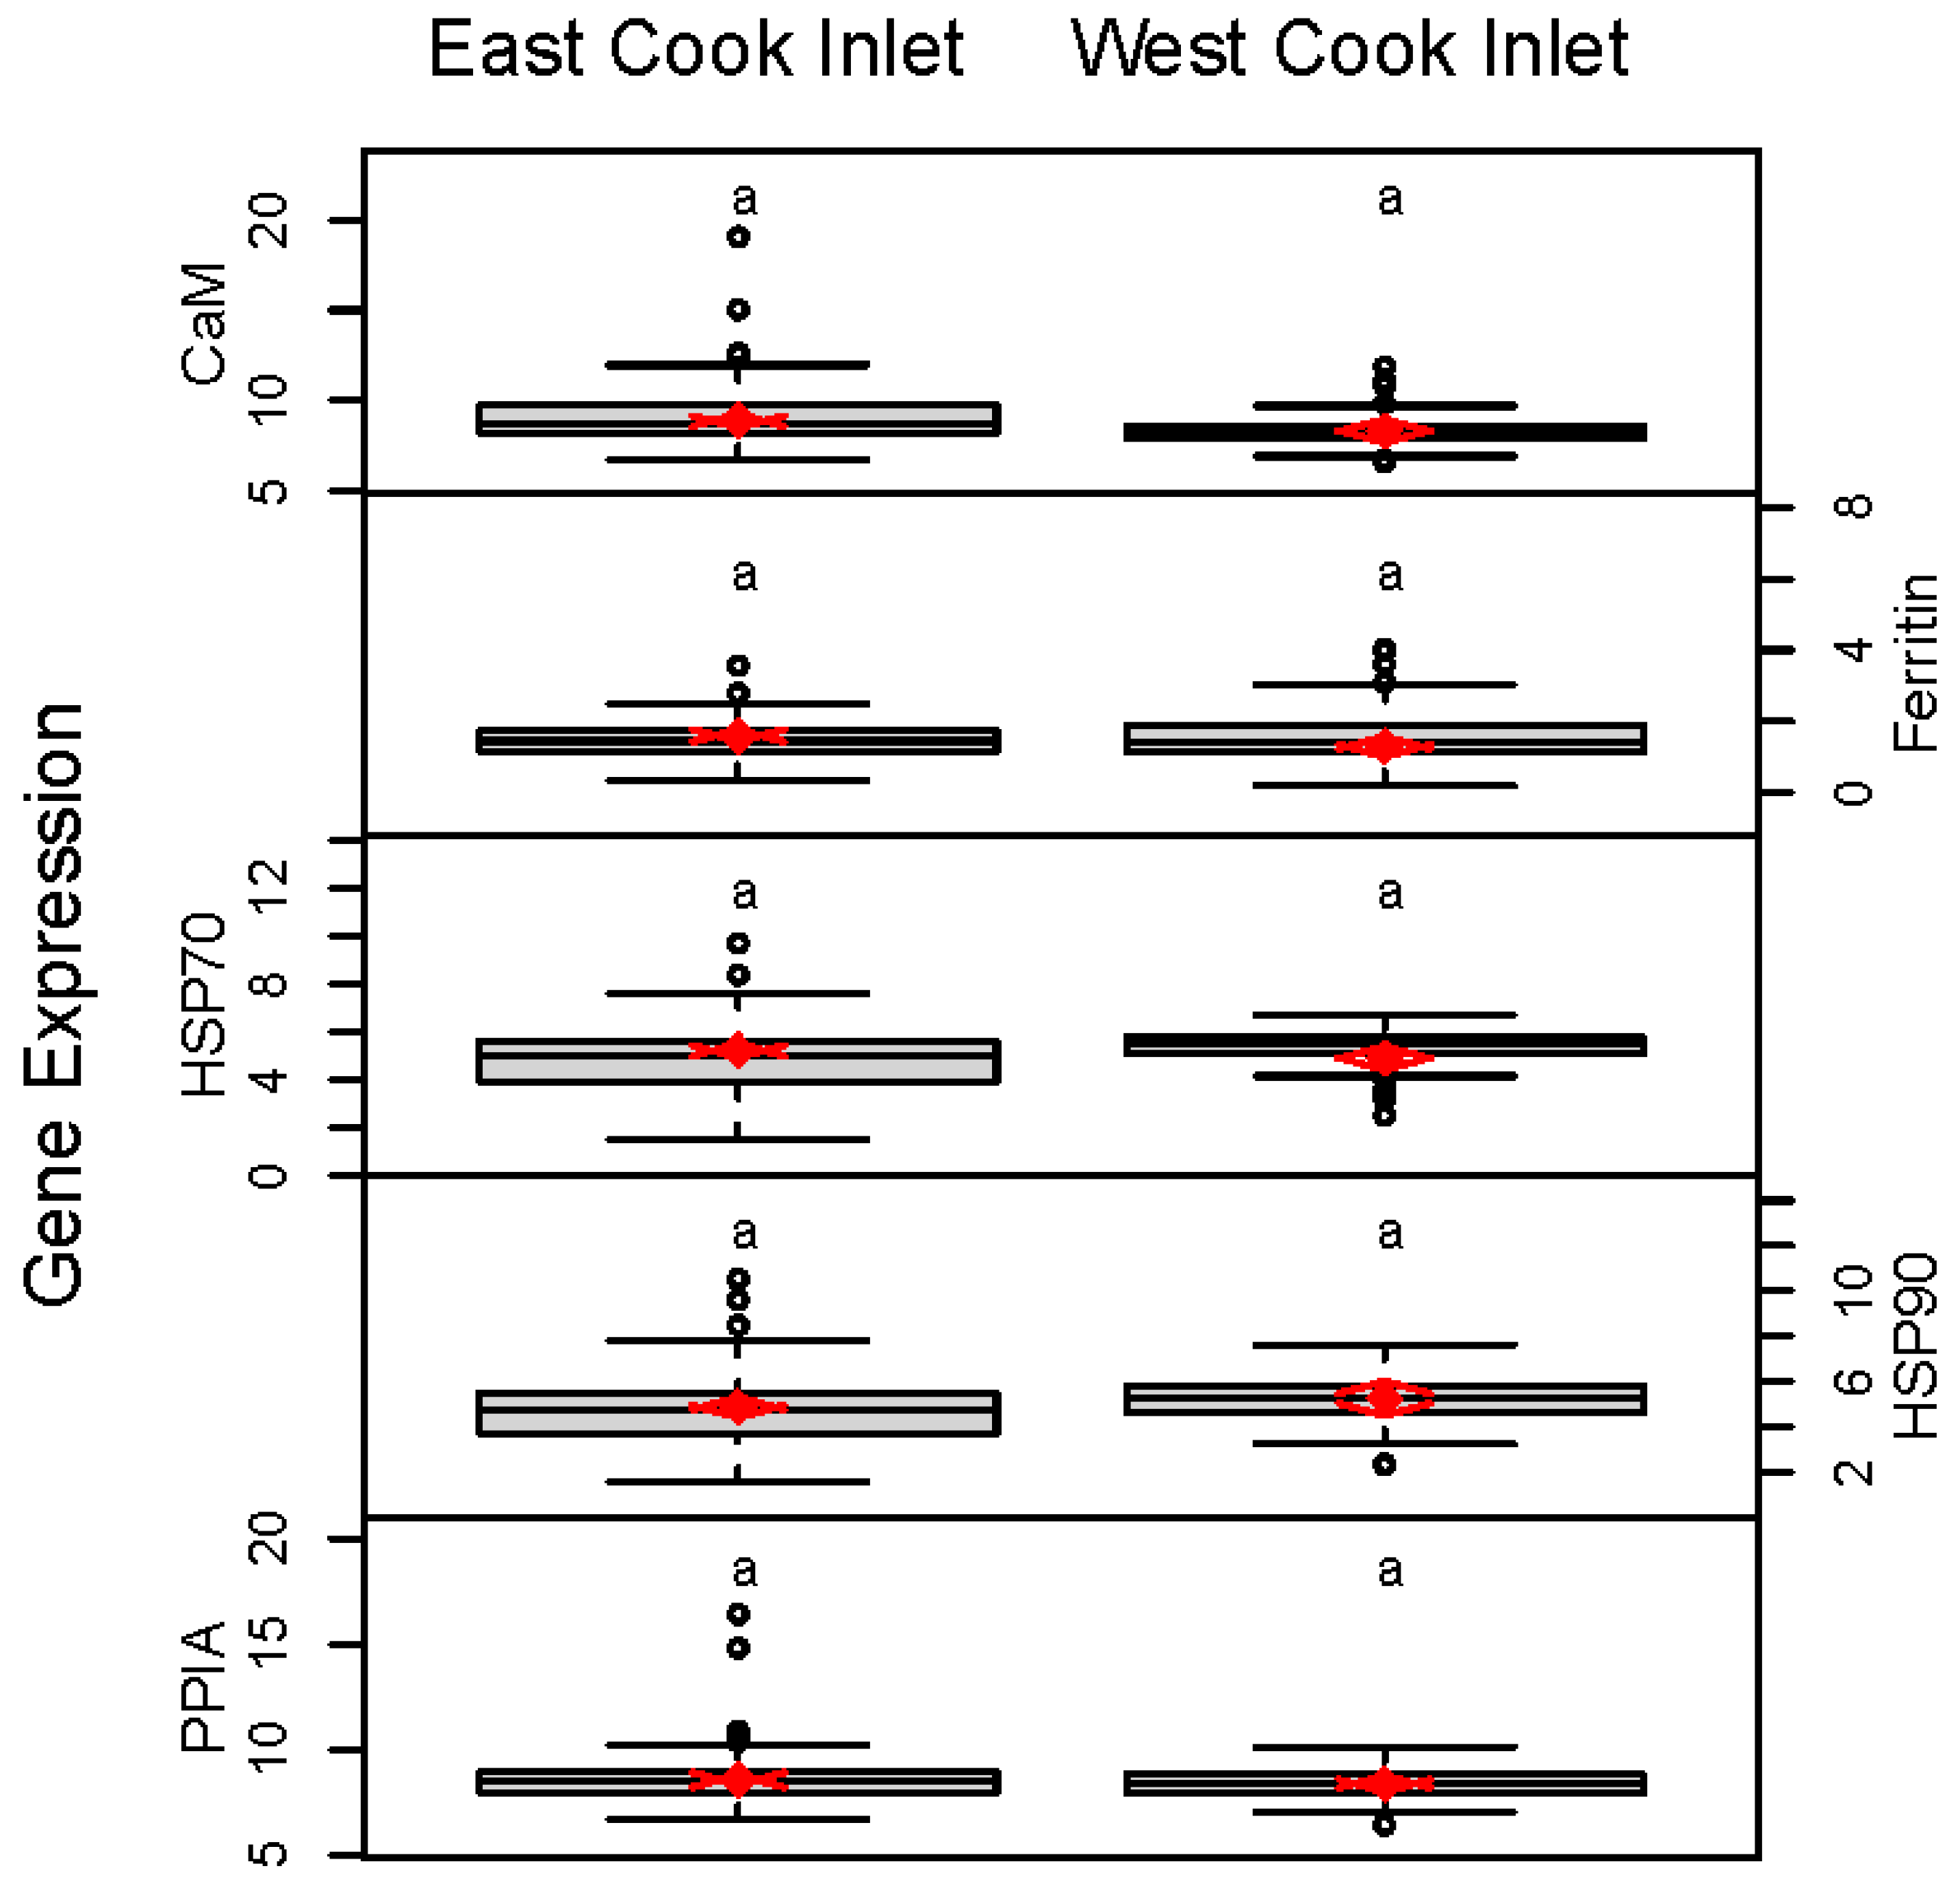
| All ECI | 8.87 (8.64, 9.10) | 1.61, (1.51, 1.71) | 5.21 (5.05, 5.37) | 4.87 (4.67, 5.07) | 8.54 (8.37, 8.70) | |
| WCI | Polly Creek | 7.92 (6.92, 8.91) c | 1.25 (0.98, 1.51) a | 4.87 (4.26, 5.48) a | 5.54 (4.85, 6.22) ab | 8.00 (7.58, 8.42) b |
| Silver Salmon | 8.49 (7.50, 9.49) abc | 1.46 (1.20, 1.72) ab | 5.17 (4.56, 5.78) ab | 5.39 (4.70, 6.07) ab | 8.58 (8.16, 9.00) ab | |
| Chinitna Bay | 8.55 (7.56, 9.55) abc | 1.20 (0.93, 1.46) a | 4.66 (4.05, 5.27) a | 4.88 (4.19, 5.56) a | 8.48 (8.06, 8.90) ab | |
| All WCI | 8.32 (8.15, 8.49) | 1.30 (1.17, 1.43) | 4.90 (4.63, 5.17) | 5.27 (4.98, 5.56) | 8.35 (8.20, 8.50) |
Publisher’s Note: MDPI stays neutral with regard to jurisdictional claims in published maps and institutional affiliations. |
© 2021 by the authors. Licensee MDPI, Basel, Switzerland. This article is an open access article distributed under the terms and conditions of the Creative Commons Attribution (CC BY) license (https://creativecommons.org/licenses/by/4.0/).
Share and Cite
Coletti, H.A.; Bowen, L.; Ballachey, B.E.; Wilson, T.L.; Waters, S.; Booz, M.; Counihan, K.L.; Hollmen, T.E.; Pister, B. Gene Expression Profiles in Two Razor Clam Populations: Discerning Drivers of Population Status. Life 2021, 11, 1288. https://doi.org/10.3390/life11121288
Coletti HA, Bowen L, Ballachey BE, Wilson TL, Waters S, Booz M, Counihan KL, Hollmen TE, Pister B. Gene Expression Profiles in Two Razor Clam Populations: Discerning Drivers of Population Status. Life. 2021; 11(12):1288. https://doi.org/10.3390/life11121288
Chicago/Turabian StyleColetti, Heather A., Lizabeth Bowen, Brenda E. Ballachey, Tammy L. Wilson, Shannon Waters, Michael Booz, Katrina L. Counihan, Tuula E. Hollmen, and Benjamin Pister. 2021. "Gene Expression Profiles in Two Razor Clam Populations: Discerning Drivers of Population Status" Life 11, no. 12: 1288. https://doi.org/10.3390/life11121288
APA StyleColetti, H. A., Bowen, L., Ballachey, B. E., Wilson, T. L., Waters, S., Booz, M., Counihan, K. L., Hollmen, T. E., & Pister, B. (2021). Gene Expression Profiles in Two Razor Clam Populations: Discerning Drivers of Population Status. Life, 11(12), 1288. https://doi.org/10.3390/life11121288