
Short-Term Skin Temperature Responses to Endurance Exercise: A Systematic Review of Methods and Future Challenges in the Use of Infrared Thermography

 ,
,  , ,
, ,  , ,
, , 
Abstract
:1. Introduction
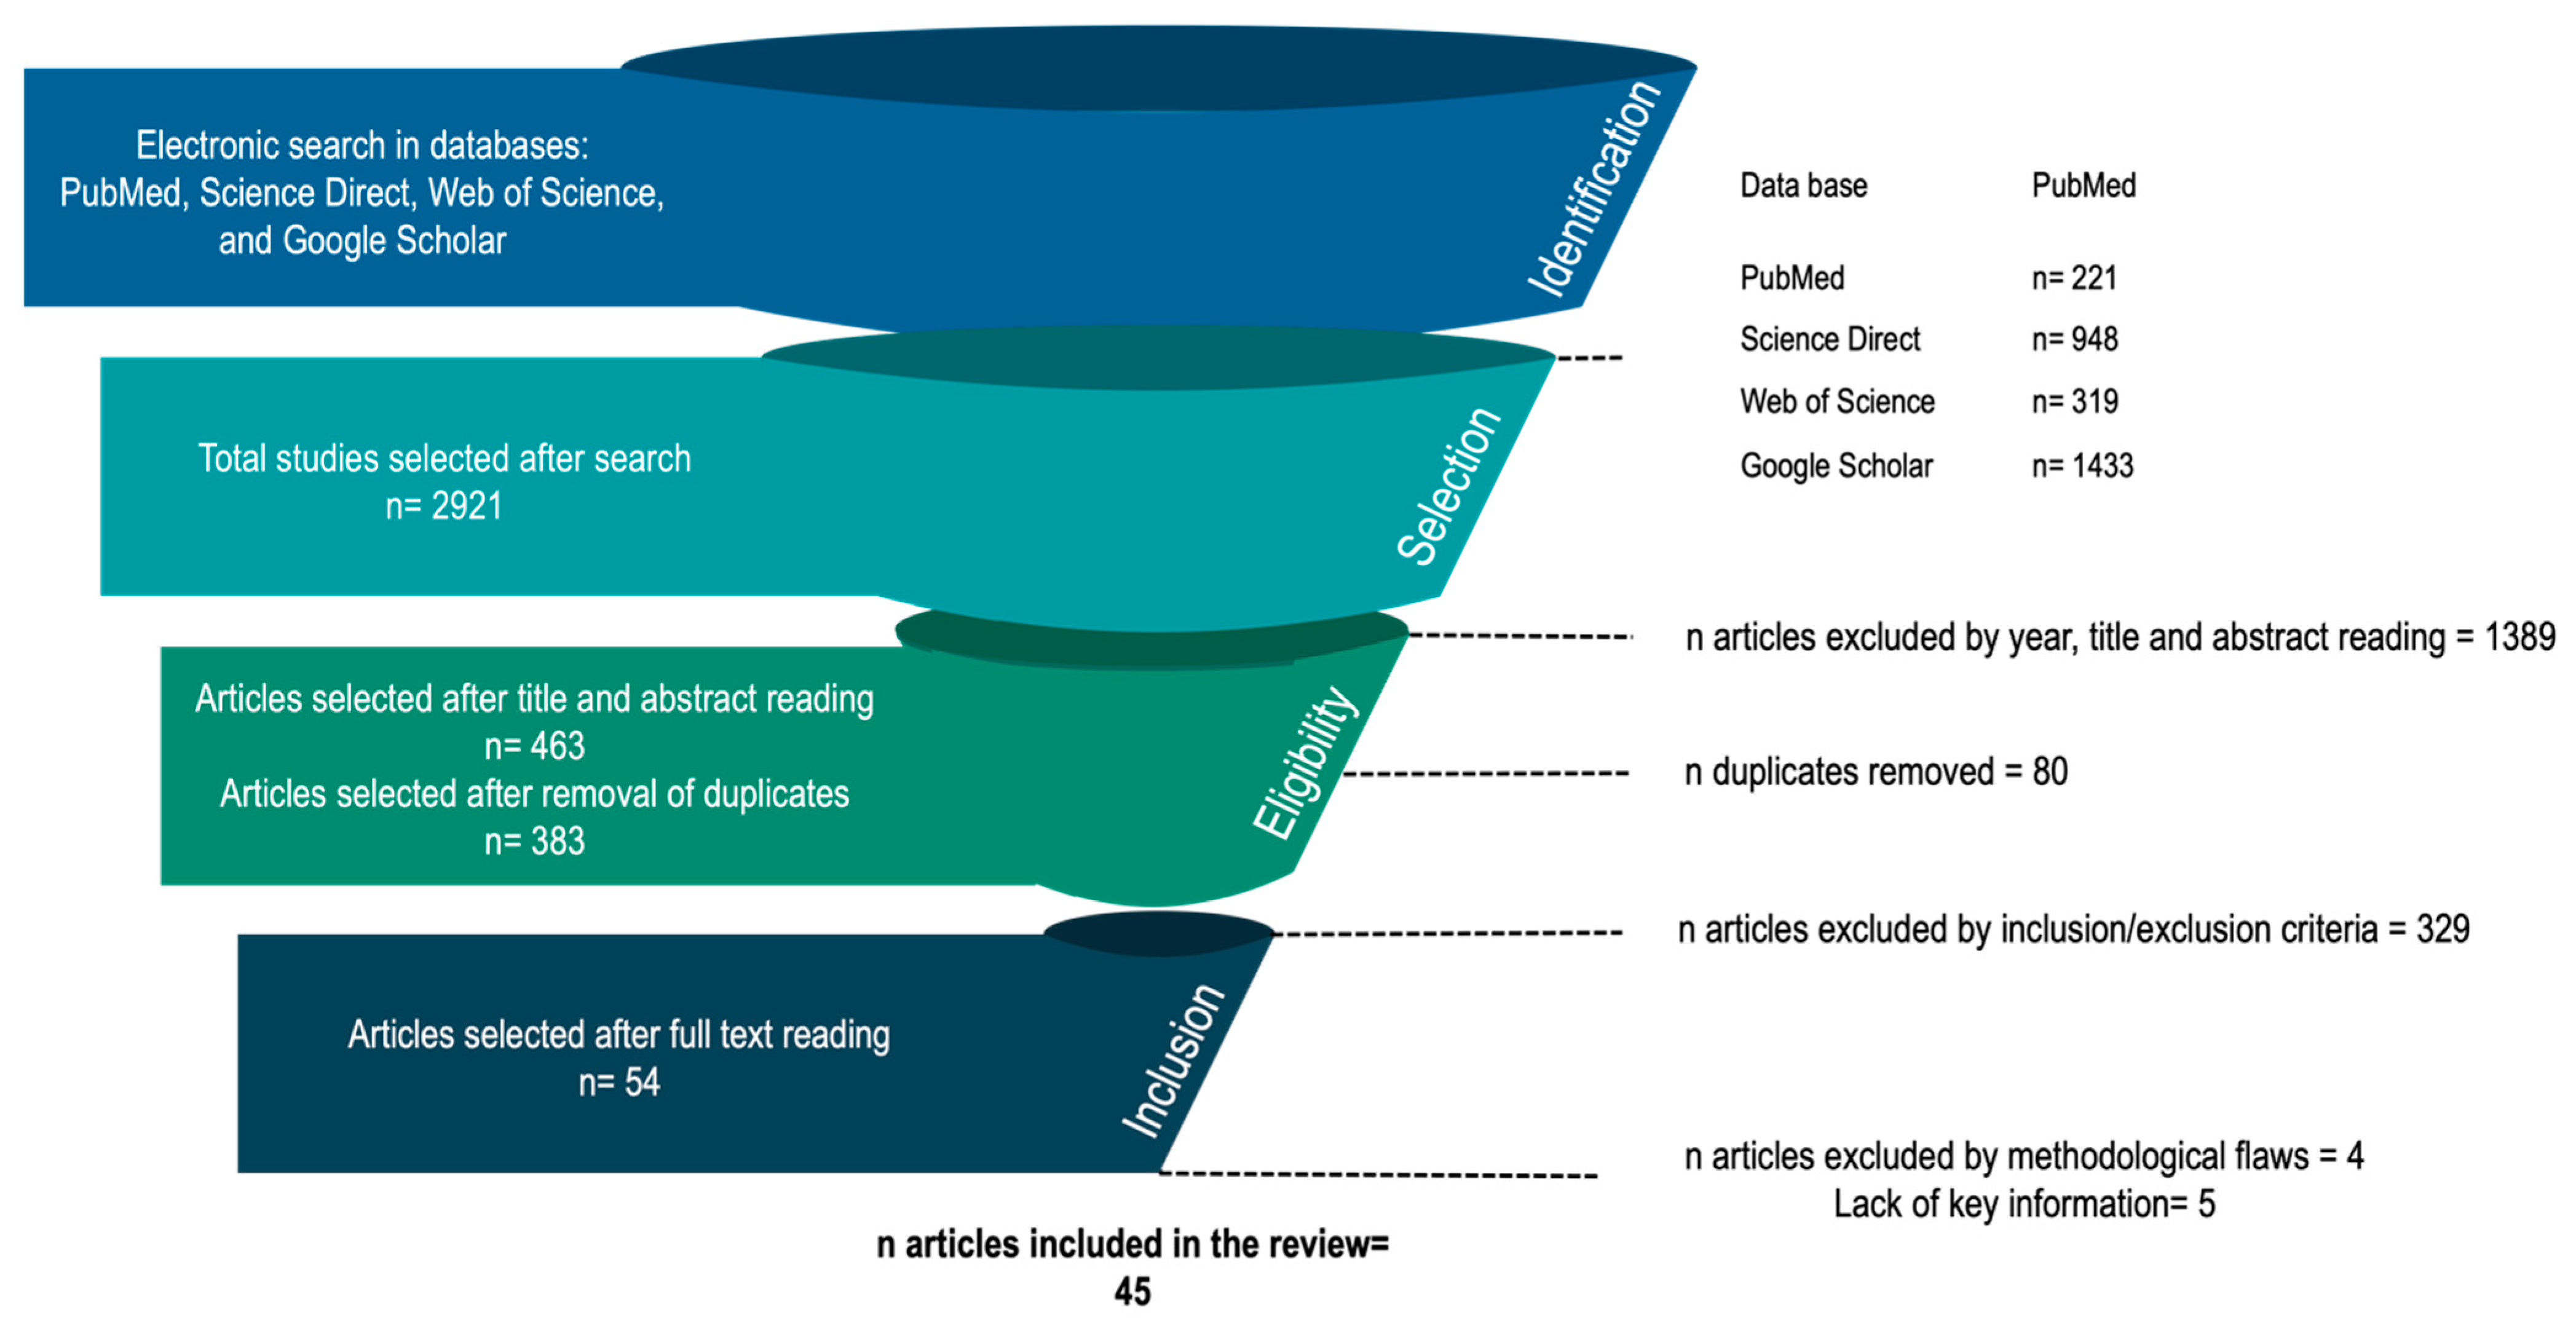
2. Materials and Methods
2.1. Data Sources
2.2. Data Selection
2.3. Data Collection and Extraction
3. Results
3.1. Study’s Protocols, Analysis, and Main Outcomes
3.2. Participant and Environmental Characteristics
3.3. Camera Settings and Setup
4. Discussion
4.1. Methodological Considerations to Assess Tsk
4.2. Challenges in the Use of IRT in Endurance Sports
4.3. Limitations
5. Conclusions
Author Contributions
Funding
Institutional Review Board Statement
Informed Consent Statement
Acknowledgments
Conflicts of Interest
References
- Scheer, V. Participation Trends of Ultra Endurance Events. Sports Med. Arthrosc. Rev. 2019, 27, 3–7. [Google Scholar] [CrossRef] [PubMed]
- Seshadri, D.R.; Drummond, C.; Craker, J.; Rowbottom, J.R.; Voos, J.E. Wearable Devices for Sports: New Integrated Technologies Allow Coaches, Physicians, and Trainers to Better Understand the Physical Demands of Athletes in Real Time. IEEE Pulse 2017, 8, 38–43. [Google Scholar] [CrossRef] [PubMed]
- Rojas-Valverde, D.; Sánchez-Ureña, B.; Gómez Carmona, C.; Ugalde-Ramírez, J.; Trejos-Montaya, A.; Pino-Ortega, J.; Gutiérrez-Vargas, R. Detection of Neuromechanical Acute Fatigue-Related Responses during a Duathlon Simulation: Is Tensiomyography Sensitive Enough? Proc. Inst. Mech. Eng. Pt. P J. Sports Eng. Technol. 2021, 235, 53–61. [Google Scholar] [CrossRef]
- Rojas-Valverde, D.; Sánchez-Ureña, B.; Pino-Ortega, J.; Gómez-Carmona, C.; Gutiérrez-Vargas, R.; Timón, R.; Olcina, G. External Workload Indicators of Muscle and Kidney Mechanical Injury in Endurance Trail Running. Int. J. Environ. Res. Public Health 2019, 16, 3909. [Google Scholar] [CrossRef] [PubMed] [Green Version]
- Gutiérrez-Vargas, R.; Martín-Rodríguez, S.; Sánchez-Ureña, B.; Rodríguez-Montero, A.; Salas-Cabrera, J.; Gutiérrez-Vargas, J.C.; Simunic, B.; Rojas-Valverde, D. Biochemical and Muscle Mechanical Postmarathon Changes in Hot and Humid Conditions. J. Strength Cond. Res. 2020, 34, 847–856. [Google Scholar] [CrossRef] [PubMed]
- Balsalobre-Fernández, C.; Marchante, D.; Baz-Valle, E.; Alonso-Molero, I.; Jiménez, S.L.; Muñóz-López, M. Analysis of Wearable and Smartphone-Based Technologies for the Measurement of Barbell Velocity in Different Resistance Training Exercises. Front. Physiol. 2017, 8, 649. [Google Scholar] [CrossRef] [Green Version]
- Oueslati, F.; Boone, J.; Ahmaidi, S. Respiratory Muscle Endurance, Oxygen Saturation Index in Vastus Lateralis and Performance during Heavy Exercise. Respir. Physiol. Neurobiol. 2016, 227, 41–47. [Google Scholar] [CrossRef]
- Canário-Lemos, R.; Vilaça-Alves, J.; Moreira, T.; Peixoto, R.; Garrido, N.; Goss, F.; Furtado, H.; Machado Reis, V. Are Heart Rate and Rating of Perceived Exertion Effective to Control Indoor Cycling Intensity? Int. J. Environ. Res. Public Health 2020, 17, 4824. [Google Scholar] [CrossRef] [PubMed]
- Lahiri, B.B.; Bagavathiappan, S.; Jayakumar, T.; Philip, J. Medical Applications of Infrared Thermography: A Review. Infrared Phys. Technol. 2012, 55, 221–235. [Google Scholar] [CrossRef]
- Hildebrandt, C.; Zeilberger, K.; Ring, E.F.J.; Raschner, C. The Application of Medical Infrared Thermography in Sports Medicine; An International Perspective on Topics in Sports Medicine and Sports Injury; InechOpen: London, UK, 2012. [Google Scholar] [CrossRef] [Green Version]
- Priego Quesada, J.I.; Kunzler, M.R.; Carpes, F.P. Methodological Aspects of Infrared Thermography in Human Assessment. In Application of Infrared Thermography in Sports Science; Biological and Medical Physics, Biomedical Engineering; Priego Quesada, J.I., Ed.; Springer International Publishing: Cham, Germany, 2017; pp. 49–79. ISBN 978-3-319-47410-6. [Google Scholar]
- Rojas-Valverde, D.; Sánchez-Ureña, B.; Crowe, J.; Timón, R.; Olcina, G.J. Exertional Rhabdomyolysis and Acute Kidney Injury in Endurance Sports: A Systematic Review. Eur. J. Sport Sci. 2021, 21, 261–274. [Google Scholar] [CrossRef]
- Scheer, V.; Rojas-Valverde, D. Long-Term Health Issues in Ultraendurance Runners: Should We Be Concerned? BMJ Open Sport. Exerc. Med. 2021, 7, e001131. [Google Scholar] [CrossRef] [PubMed]
- Scheer, V.; Tiller, N.B.; Doutreleau, S.; Khodaee, M.; Knechtle, B.; Pasternak, A.; Rojas-Valverde, D. Potential Long-Term Health Problems Associated with Ultra-Endurance Running: A Narrative Review. Sports Med. 2021, 1–16. [Google Scholar] [CrossRef]
- Rojas-Valverde, D.; Martínez-Guardado, I.; Sánchez-Ureña, B.; Timón, R.; Scheer, V.; Pino-Ortega, J.; Olcina, G. Outpatient Assessment of Mechanical Load, Heat Strain and Dehydration as Causes of Transitional Acute Kidney Injury in Endurance Trail Runners. Int. J. Environ. Res. Public Health 2021, 18, 10217. [Google Scholar] [CrossRef]
- Bouscaren, N.; Millet, G.Y.; Racinais, S. Heat Stress Challenges in Marathon vs. Ultra-Endurance Running. Front. Sports Act. Living 2019, 1, 59. [Google Scholar] [CrossRef] [PubMed] [Green Version]
- Brocherie, F.; Girard, O.; Millet, G.P. Emerging Environmental and Weather Challenges in Outdoor Sports. Climate 2015, 3, 492–521. [Google Scholar] [CrossRef]
- Kakamu, T.; Wada, K.; Smith, D.R.; Endo, S.; Fukushima, T. Preventing Heat Illness in the Anticipated Hot Climate of the Tokyo 2020 Summer Olympic Games. Environ. Health Prev. Med. 2017, 22, 68. [Google Scholar] [CrossRef] [PubMed] [Green Version]
- Lei, T.-H.; Wang, F. Looking Ahead of 2021 Tokyo Summer Olympic Games: How Does Humid Heat Affect Endurance Performance? Insight into Physiological Mechanism and Heat-Related Illness Prevention Strategies. J. Therm. Biol. 2021, 99, 102975. [Google Scholar] [CrossRef] [PubMed]
- Mo, S.; Lau, F.O.Y.; Lok, A.K.Y.; Chan, Z.Y.S.; Zhang, J.H.; Shum, G.; Cheung, R.T.H. Bilateral Asymmetry of Running Gait in Competitive, Recreational and Novice Runners at Different Speeds. Hum. Mov. Sci. 2020, 71, 102600. [Google Scholar] [CrossRef] [PubMed]
- Tanda, G. Skin Temperature Measurements by Infrared Thermography during Running Exercise. Exp. Therm. Fluid Sci. 2016, 71, 103–113. [Google Scholar] [CrossRef]
- Hadžić, V.; Širok, B.; Malneršič, A.; Čoh, M. Can Infrared Thermography Be Used to Monitor Fatigue during Exercise? A Case Study. J. Sport Health Sci. 2019, 8, 89–92. [Google Scholar] [CrossRef]
- Côrte, A.C.; Pedrinelli, A.; Marttos, A.; Souza, I.F.G.; Grava, J.; Hernandez, A.J. Infrared Thermography Study as a Complementary Method of Screening and Prevention of Muscle Injuries: Pilot Study. BMJ Open Sport Exerc. Med. 2019, 5, e000431. [Google Scholar] [CrossRef] [PubMed] [Green Version]
- Moher, D.; Shamseer, L.; Clarke, M.; Ghersi, D.; Liberati, A.; Petticrew, M.; Shekelle, P.; Stewart, L. PRISMA-P Group Preferred Reporting Items for Systematic Review and Meta-Analysis Protocols (PRISMA-P) 2015 Statement|Systematic Reviews|Full Text. Available online: https://systematicreviewsjournal.biomedcentral.com/articles/10.1186/2046-4053-4-1 (accessed on 24 September 2019).
- Moher, D.; Liberati, A.; Tetzlaff, J.; Altman, D.G.; Group, T.P. Preferred Reporting Items for Systematic Reviews and Meta-Analyses: The PRISMA Statement. PLoS Med. 2009, 6, e1000097. [Google Scholar] [CrossRef] [Green Version]
- OHAT. Handbook for Conducting a Literature-Based Health Assessment Using OHAT Approach for Systematic Review and Evidence Integration; OHAT: Research Triangle Park, NC, USA, 2015; p. 98. [Google Scholar]
- Khan, K.S.; Kunz, R.; Kleijnen, J.; Antes, G. Five Steps to Conducting a Systematic Review. J. R. Soc. Med. 2003, 96, 118–121. [Google Scholar] [CrossRef] [PubMed]
- Moreira, D.G.; Costello, J.T.; Brito, C.J.; Adamczyk, J.G.; Ammer, K.; Bach, A.J.E.; Costa, C.M.A.; Eglin, C.; Fernandes, A.A.; Fernández-Cuevas, I.; et al. Thermographic Imaging in Sports and Exercise Medicine: A Delphi Study and Consensus Statement on the Measurement of Human Skin Temperature. J. Therm. Biol. 2017, 69, 155–162. [Google Scholar] [CrossRef]
- Tumilty, S.; Adhia, D.B.; Smoliga, J.M.; Gisselman, A.S. Thermal Profiles over the Achilles Tendon in a Cohort of Non-Injured Collegiate Athletes over the Course of a Cross Country Season. Phys. Ther. Sport 2019, 36, 110–115. [Google Scholar] [CrossRef] [PubMed]
- Gil-Calvo, M.; Herrero-Marco, J.; de Jesús González-Peña, R.; Perez-Soriano, P.; Priego-Quesada, J.I. Acute Effect of Induced Asymmetrical Running Technique on Foot Skin Temperature. J. Therm. Biol. 2020, 91, 102613. [Google Scholar] [CrossRef]
- Gutiérrez-Vargas, R.; Ugalde-Ramírez, J.A.; Rojas-Valverde, D.; Salas-Cabrera, J.; Rodríguez-Montero, A.; Gutiérrez-Vargas, J.C. La termografía infrarroja como herramienta efectiva para detectar áreas músculares dañadas después de correr una maratón. Rev. Fac. Med. 2017, 65, 601–607. [Google Scholar] [CrossRef]
- Fournet, D.; Ross, L.; Voelcker, T.; Redortier, B.; Havenith, G. Body Mapping of Thermoregulatory and Perceptual Responses of Males and Females Running in the Cold. J. Therm. Biol. 2013, 38, 339–344. [Google Scholar] [CrossRef] [Green Version]
- Priego Quesada, J.I.; Martínez, N.; Salvador Palmer, R.; Psikuta, A.; Annaheim, S.; Rossi, R.M.; Corberán, J.M.; de Anda, R.M.C.O.; Pérez-Soriano, P. Effects of the Cycling Workload on Core and Local Skin Temperatures. Exp. Therm. Fluid Sci. 2016, 77, 91–99. [Google Scholar] [CrossRef]
- Priego Quesada, J.I.; Lucas-Cuevas, A.G.; Gil-Calvo, M.; Giménez, J.V.; Aparicio, I.; de Anda, R.M.C.O.; Salvador Palmer, R.; Llana-Belloch, S.; Pérez-Soriano, P. Effects of Graduated Compression Stockings on Skin Temperature after Running. J. Therm. Biol. 2015, 52, 130–136. [Google Scholar] [CrossRef]
- Priego Quesada, J.I.; Lucas-Cuevas, A.G.; Salvador Palmer, R.; Pérez-Soriano, P.; de Anda, R.M.C.O. Definition of the Thermographic Regions of Interest in Cycling by Using a Factor Analysis. Infrared Phys. Technol. 2016, 75, 180–186. [Google Scholar] [CrossRef]
- Priego Quesada, J.I.; Carpes, F.P.; Bini, R.R.; Salvador Palmer, R.; Pérez-Soriano, P.; de Anda, R.M.C.O. Relationship between Skin Temperature and Muscle Activation during Incremental Cycle Exercise. J. Therm. Biol. 2015, 48, 28–35. [Google Scholar] [CrossRef] [PubMed]
- Priego-Quesada, J.I.; Oficial-Casado, F.; Gandia-Soriano, A.; Carpes, F.P. A Preliminary Investigation about the Observation of Regional Skin Temperatures Following Cumulative Training Loads in Triathletes during Training Camp. J. Therm. Biol. 2019, 84, 431–438. [Google Scholar] [CrossRef] [PubMed]
- Fernandes, A.A.; Moreira, D.G.; Brito, C.J.; da Silva, C.D.; Sillero-Quintana, M.; Pimenta, E.M.; Bach, A.J.E.; Garcia, E.S.; Bouzas Marins, J.C. Validity of Inner Canthus Temperature Recorded by Infrared Thermography as a Non-Invasive Surrogate Measure for Core Temperature at Rest, during Exercise and Recovery. J. Therm. Biol. 2016, 62, 50–55. [Google Scholar] [CrossRef]
- Rodriguez-Sanz, D.; Losa-Iglesias, M.E.; Becerro-de-Bengoa-Vallejo, R.; Dorgham, H.A.A.; Benito-de-Pedro, M.; San-Antolín, M.; Mazoteras-Pardo, V.; Calvo-Lobo, C. Thermography Related to Electromyography in Runners with Functional Equinus Condition after Running. Phys. Ther. Sport 2019, 40, 193–196. [Google Scholar] [CrossRef] [PubMed]
- Priego-Quesada, J.I.; Machado, A.S.; Gil-Calvo, M.; Jimenez-Perez, I.; Cibrian Ortiz de Anda, R.M.; Salvador Palmer, R.; Perez-Soriano, P. A Methodology to Assess the Effect of Sweat on Infrared Thermography Data after Running: Preliminary Study. Infrared Phys. Technol. 2020, 109, 103382. [Google Scholar] [CrossRef]
- Merla, A.; Mattei, P.A.; di Donato, L.; Romani, G.L. Thermal Imaging of Cutaneous Temperature Modifications in Runners during Graded Exercise. Ann. Biomed. Eng. 2010, 38, 158–163. [Google Scholar] [CrossRef]
- Luo, Y.; Tong, Y.; Hu, Y. Thermal Increasing Information for Foot Surface during Jogging. J. Biomim. Biomater. Biomed. Eng. 2015, 24, 70–76. [Google Scholar] [CrossRef]
- Rynkiewicz, M.; Korman, P.; Zurek, P.; Rynkiewicz, T. Application of Thermovisual Body Image Analysis in the Evaluation of Paddling Effects on a Kayak Ergometer. Med. Sport 2015, 68, 31–42. [Google Scholar]
- Dorado, V.R. Variaciones termométricas en la planta del pie y piernas valorada en corredores antes y después de correr 30 km. Rev. Int. Cienc. Podol. 2016, 10, 31–40. [Google Scholar]
- Sanz-Lopez, F.; Martinez-Amat, A.; Hita-Contreras, F.; Valero-Campo, C.; Berzosa, C. Thermographic Assessment of Eccentric Overload Training Within Three Days of a Running Session. J. Strength Cond. Res. 2016, 30, 504–511. [Google Scholar] [CrossRef]
- Priego Quesada, J.I.; Carpes, F.P.; Salvador Palmer, R.; Perez-Soriano, P.; Cibrian Ortiz de Anda, R.M. Effect of Saddle Height on Skin Temperature Measured in Different Days of Cycling. SpringerPlus 2016, 5, 205. [Google Scholar] [CrossRef] [PubMed] [Green Version]
- Ludwig, N.; Trecroci, A.; Gargano, M.; Formenti, D.; Bosio, A.; Rampinini, E.; Alberti, G. Thermography for Skin Temperature Evaluation during Dynamic Exercise: A Case Study on an Incremental Maximal Test in Elite Male Cyclists. Appl. Optics 2016, 55, D126–D130. [Google Scholar] [CrossRef] [PubMed]
- Priego Quesada, J.I.; Tavares Sampaio, L.; Bini, R.R.; Rossato, M.; Cavalcanti, V. Multifactorial Cycling Performance of Cyclists and Non-Cyclists and Their Effect on Skin Temperature. J. Therm. Anal. Calorim. 2017, 127, 1479–1489. [Google Scholar] [CrossRef]
- Priego Quesada, J.I.; Gil-Calvo, M.; Jimenez-Perez, I.; Lucas-Cuevas, Á.G.; Pérez-Soriano, P. Relationship between Foot Eversion and Thermographic Foot Skin Temperature after Running. Appl. Opt. 2017, 56, 5559–5565. [Google Scholar] [CrossRef] [PubMed]
- Jimenez-Perez, I.; Gil-Calvo, M.; Priego-Quesada, J.I.; Aparicio, I.; Pérez-Soriano, P.; Ortiz de Anda, R.M.C. Effect of Prefabricated Thermoformable Foot Orthoses on Plantar Surface Temperature after Running: A Gender Comparison. J. Therm. Biol. 2020, 91, 102612. [Google Scholar] [CrossRef]
- Mendonca Barboza, J.A.; Soares Souza, L.I.; Cerqueira, M.S.; de Andrade, P.R.; dos Santos, H.H.; de Almeida Ferreira, J.J. Skin Temperature of Middle Distance Runners after a Maximum Effort Test. Acta Sci.-Health Sci. 2020, 42, e48114. [Google Scholar] [CrossRef]
- Duygu, S.C.; Pekyavas, N.O.; Uzun, A.; Medeni, O.C.; Baltaci, G.; Er, F.; Suveren, C.; Colakoglu, F.F. Muscle Skin Temperature Responses for Hamstring and Quadriceps to Aerobic and Anaerobic Test Conditions in Turkish Olympic Sailing Athletes. J. Therm. Anal. Calorim. 2019, 136, 2125–2130. [Google Scholar] [CrossRef]
- Pérez-Guarner, A.; Priego-Quesada, J.I.; Oficial-Casado, F.; de Anda, R.M.C.O.; Carpes, F.P.; Palmer, R.S. Association between Physiological Stress and Skin Temperature Response after a Half Marathon. Physiol. Meas. 2019, 40, 034009. [Google Scholar] [CrossRef] [Green Version]
- Drzazga, Z.; Binek, M.; Pokora, I.; Sadowska-Krepa, E. A Preliminary Study on Infrared Thermal Imaging of Cross-Country Skiers and Swimmers Subjected to Endurance Exercise. J. Therm. Anal. Calorim. 2018, 134, 701–710. [Google Scholar] [CrossRef] [Green Version]
- Trecroci, A.; Formenti, D.; Ludwig, N.; Gargano, M.; Bosio, A.; Rampinini, E.; Alberti, G. Bilateral Asymmetry of Skin Temperature Is Not Related to Bilateral Asymmetry of Crank Torque during an Incremental Cycling Exercise to Exhaustion. PeerJ 2018, 6, e4438. [Google Scholar] [CrossRef] [Green Version]
- Novotny, J.; Rybarova, S.; Zacha, D.; Novotny, J.J.; Bernacikova, M.; Ramadan, W. Thermographic Evaluation of Muscle Activity after Front Crawl Swimming in Young Men. Acta Bioeng. Biomech. 2017, 19, 109–116. [Google Scholar]
- Novotny, J.; Rybarova, S.; Zacha, D.; Bernacikova, M.; Ramadan, W.A. The Influence of Breaststroke Swimming on the Muscle Activity of Young Men in Thermographic Imaging. Acta Bioeng. Biomech. 2015, 17, 121–129. [Google Scholar]
- Priego-Quesada, J.I.; Pérez-Guarner, A.; Gandia-Soriano, A.; Oficial-Casado, F.; Galindo, C.; de Anda, R.M.C.O.; Piñeiro-Ramos, J.D.; Sánchez-Illana, Á.; Kuligowski, J.; Gomes Barbosa, M.A.; et al. Effect of a Marathon on Skin Temperature Response After a Cold-Stress Test and Its Relationship With Perceptive, Performance, and Oxidative-Stress Biomarkers. Int. J. Sports Physiol. Perform. 2020, 15, 1–9. [Google Scholar] [CrossRef]
- Requena-Bueno, L.; Priego-Quesada, J.I.; Jimenez-Perez, I.; Gil-Calvo, M.; Pérez-Soriano, P. Validation of ThermoHuman Automatic Thermographic Software for Assessing Foot Temperature before and after Running. J. Therm. Biol. 2020, 92, 102639. [Google Scholar] [CrossRef] [PubMed]
- Bertucci, W.; Arfaoui, A.; Janson, L.; Polidori, G. Relationship between the Gross Efficiency and Muscular Skin Temperature of Lower Limb in Cycling: A Preliminary Study. Comput. Methods Biomech. Biomed. Eng. 2013, 16 (Suppl. 1), 114–115. [Google Scholar] [CrossRef]
- Ferreira-Oliveira, S. Measuring of Skin Temperature via Infrared Thermography after an Upper Body Progressive Aerobic Exercise. J. Phys. Educ. Sport 2018, 18, 184–192. [Google Scholar] [CrossRef]
- De Andrade Fernandes, A.; dos Santos Amorim, P.R.; Brito, C.J.; Sillero-Quintana, M.; Bouzas Marins, J.C. Regional Skin Temperature Response to Moderate Aerobic Exercise Measured by Infrared Thermography. Asian J. Sports Med. 2016, 7, e29243. [Google Scholar] [CrossRef] [Green Version]
- Akimov, E.B.; Son’kin, V.D. Skin Temperature and Lactate Threshold during Muscle Work in Athletes. Hum. Physiol. 2011, 37, 621. [Google Scholar] [CrossRef]
- Cholewka, A.; Kasprzyk, T.; Stanek, A.; Sieroń-Stołtny, K.; Drzazga, Z. May Thermal Imaging Be Useful in Cyclist Endurance Tests? J. Therm. Anal. Calorim. 2016, 123, 1973–1979. [Google Scholar] [CrossRef] [Green Version]
- Tanda, G. Total Body Skin Temperature of Runners during Treadmill Exercise. J. Therm. Anal. Calorim. 2018, 131, 1967–1977. [Google Scholar] [CrossRef]
- Crenna, F.; Tanda, G. Design of an Experiment for the Biomechanical and Thermal Analysis of Athletes during Prolonged Running Exercise. J. Hum. Sport Exerc. 2020, 16, 773–794. [Google Scholar] [CrossRef]
- Rojas-Valverde, D.; Gutiérrez-Vargas, R.; Sánchez-Ureña, B.; Gutiérrez-Vargas, J.C.; Priego Quesada, J.I. Relationship between Skin Temperature Variation and Muscle Damage Markers after a Marathon Performed in a Hot Environmental Condition. Life 2021, 11, 725. [Google Scholar] [CrossRef] [PubMed]
- Fernández-Cuevas, I.; Sillero-Quintana, M.; García-Concepción, M.; Ribot-Serrano, J.; Gómez-Carmona, P.; Marins, J. Monitoring Skin Thermal Response to Training with Infrared Thermography. New Stud. Athl. 2014, 29, 57–71. [Google Scholar]
- Racinais, S.; Ihsan, M.; Taylor, L.; Cardinale, M.; Adami, P.E.; Alonso, J.M.; Bouscaren, N.; Buitrago, S.; Esh, C.J.; Gomez-Ezeiza, J.; et al. Hydration and Cooling in Elite Athletes: Relationship with Performance, Body Mass Loss and Body Temperatures during the Doha 2019 IAAF World Athletics Championships. Br. J. Sports Med. 2021, 55, bjsports-2020-103613. [Google Scholar] [CrossRef] [PubMed]
- Machado, Á.S.; Priego-Quesada, J.I.; Jimenez-Perez, I.; Gil-Calvo, M.; Carpes, F.P.; Perez-Soriano, P. Influence of Infrared Camera Model and Evaluator Reproducibility in the Assessment of Skin Temperature Responses to Physical Exercise. J. Therm. Biol. 2021, 98, 102913. [Google Scholar] [CrossRef]
- Binek, M.; Drzazga, Z.; Socha, T.; Pokora, I. Do Exist Gender Differences in Skin Temperature of Lower Limbs Following Exercise Test in Male and Female Cross-Country Skiers? J. Therm. Anal. Calorim. 2021, 1–11. [Google Scholar] [CrossRef]
- Jones, T.W.; Shillabeer, B.C.; Cardinale, M. Skin Temperature, Training Load, and Subjective Muscle Soreness in Junior Endurance Athletes: A Case Study. Int. J. Sports Physiol. Perform. 2020, 15, 1349–1352. [Google Scholar] [CrossRef]
- Fernández-Cuevas, I.; Bouzas Marins, J.C.; Arnáiz Lastras, J.; Gómez Carmona, P.M.; Piñonosa Cano, S.; García-Concepción, M.Á.; Sillero-Quintana, M. Classification of Factors Influencing the Use of Infrared Thermography in Humans: A Review. Infrared Phys. Technol. 2015, 71, 28–55. [Google Scholar] [CrossRef]
- DUV DUV Ultra Marathon Statistics. Available online: www.ultra-marathon.org (accessed on 29 November 2017).
- National Center for Chronic Disease Prevention and Health Promotion (NCCDPHP) About Chronic Diseases. Available online: https://www.cdc.gov/chronicdisease/about/index.htm (accessed on 22 December 2020).
- Tanda, G. A Simplified Approach to Describe the Mean Skin Temperature Variations during Prolonged Running Exercise. J. Therm. Biol. 2021, 99, 103005. [Google Scholar] [CrossRef]
- Hillen, B.; Pfirrmann, D.; Nägele, M.; Simon, P. Infrared Thermography in Exercise Physiology: The Dawning of Exercise Radiomics. Sports Med. 2020, 50, 263–282. [Google Scholar] [CrossRef] [PubMed]
- Katić, K.; Li, R.; Zeiler, W. Thermophysiological Models and Their Applications: A Review. Build. Environ. 2016, 106, 286–300. [Google Scholar] [CrossRef] [Green Version]
- Jutte, L.S.; Merrick, M.A.; Ingersoll, C.D.; Edwards, J.E. The Relationship between Intramuscular Temperature, Skin Temperature, and Adipose Thickness during Cryotherapy and Rewarming. Arch. Phys. Med. Rehabil. 2001, 82, 845–850. [Google Scholar] [CrossRef]
- Aylwin, P.E.; Racinais, S.; Bermon, S.; Lloyd, A.; Hodder, S.; Havenith, G. The Use of Infrared Thermography for the Dynamic Measurement of Skin Temperature of Moving Athletes during Competition; Methodological Issues. Physiol. Meas. 2021, 42, 084004. [Google Scholar] [CrossRef] [PubMed]

| # | Author/Year of Publication | Task/Design | Body Region | ROIs Selection | Data Analysis | Outcomes |
|---|---|---|---|---|---|---|
| 1 | Tumilty et al., 2019 [29] | 1 × 9 weeks Thermograms: once/day | Bilateral Achilles | Rectangle 10 × 40 pixels from the superior border of the calcaneus | Laterality * weeks | No bilateral or between weeks variations (0.50 ± 0.43 °C) in Achilles Tsk. |
| 2 | Gil-Calvo et al., 2020 [30] | 2 × 15 min run (control vs. provoked asymmetry (1.5 kg ankle weight)) Thermogram: pre and immediately post run | Bilateral foot | 6 ROIs feet (complete soles, forefoot, midfoot, rearfoot (100%, 50%, 19%, and 31% of foot sole length feet, respectively), hallux, and toes. | Condition * time-points * Laterality | No bilateral differences despite group. Asymmetrical running provoked higher Tsk. |
| 3 | Gutiérrez-Vargas et al., 2017 [31] | 1 × marathon Thermogram: 3 days pre, immediately post and 24 h post | Bilateral lower limbs | 14 ROIs (8 anterior and 6 posterior) | Time-points * Laterality | No bilateral difference. Time-points differences in almost all ROIs, >1 °C in the knee, vastus medialis, vastus lateralis, rectus femoris, adductor. |
| 4 | Fournet et al., 2013 [32] | 1 × 40 min run 70% VO2max in 10 °C and 54.76% relative humidity Thermogram: pre (rest), post run (10 min), post run 2 (40 min), post | Bilateral anterior and posterior, upper and lower body | 11 morphed ROIs | Time-points * sex | Females lower Tsk than males, no skinfold thickness influence. |
| 5 | Priego-Quesada et al., 2016 [33] | 2 × 45 min cycling (35% and 50% of peak power output and cadence 95 rpm). Thermograms: Pre, immediately post, and 10 min post | Unilateral anterior and posterior | 17 ROIs (deltoid, chest, abdomen, upper back, lower back, vastus lateralis, rectus femoris, abductor, vastus medialis, biceps femoris, semitendinosus, knee, popliteal, tibialis anterior, gastrocnemius, ankle anterior, and Achilles) | Time-points * cycling workout * ROI | Increase in Tsk post cycling in knee extensors and decrease in trunk. After 10 min post posterior, Tsk of lower limb and trunk increased. Inverse relationships were observed between core and Tsks. |
| 6 | Priego-Quesada et al., 2015 [34] | 2 × 30 min run at 75% of maximal aerobic speed (control and compression stockings) Thermograms: pre and immediately post and 10 min post | Unilateral lower limb | 12 ROIs (tibialis anterior, ankle anterior, and gastrocnemius and vastus lateralis, abductor. and semitendinosus) | Time-points * condition * ROI | Compression stockings increase Tsk in the regions in contact and not in contact with the garment. |
| 7 | Priego-Quesada et al., 2016 [35] | 45 min cycling at 50% of peak power at 90 rpm of cadence (control and fitted position) Thermogram: Pre, immediately post, and 10 min post | Bilateral anterior and posterior, upper and lower body | 16 ROIs (chest, abdomen, upper back, lower back, vastus lateralis, rectus femoris, abductor, vastus medialis, biceps femoris, semitendinosus, knee, popliteus, tibialis anterior, gastrocnemius, anterior ankle, and Achilles. | Principal component analysis. Condition * time-points | Factor analysis is a useful method to determine a lower number of ROIs. Differences between groups of ROIs were related to tissue composition, muscular activity, and capacity for sweating. |
| 8 | Priego-Quesada et al., 2015 [36] | 1 × cycling test to exhaustion. Thermograms: pre and immediately post, and 10 min post | Unilateral Lower limbs | 4 ROIs, (gastrocnemius, rectus femoris, 2 × biceps femoris). | Correlation with EMG and time-points differences. | Tsk of knee extensors increases after cycling. Vastus lateralis overall activation was inversely related to Tsk. |
| 9 | Priego-Quesada et al., 2019 [37] | 3 days of training cycling and swimming. Thermograms: pre, 2nd day, 3rd day | Bilateral upper and lower limbs | 8 ROIs (arms, anterior and posterior lower limbs) | Time-points * laterality | Tsk increased after training for most of the body regions. Tsk variation was related to muscle mass and weekly training volume. |
| 10 | Hadžić, et al., 2019 [22] | 1 × 6 min cycling (100 W) + stretching and hamstrings isokinetic exercise (exercising vs no exercising limb) Thermograms: Each 30 s of video | Bilateral | Quadriceps (vastus medialis) | Correlation Tsk and power. Condition difference. | Negative correlation between Tsk change and muscle power output. |
| 11 | Fernandes et al., 2016 [38] | 1 × 60 min of at 60% VO2max Thermograms: 12 measurements every 5 min | Unilateral | Inner canthus | Time-points differences | Poor agreement between core temperature and inner canthus temperature. |
| 12 | Rodriguez-Sanz et al., 2019 [39] | 1 × Running 15 min on a treadmill at a speed of 8 km/h Thermograms: Pre and post | Bilateral | Gastrocnemius | Time-points differences | Runners with functional equinus condition presented a higher Tsk of gastrocnemius after a light running activity. |
| 13 | Priego-Quesada et al., 2020 [40] | 1 × 30 min treadmill run (8 km/h increasing 1 km/h every 30 s) at 1% slope at 12/20 Borg Thermograms: pre and post | Bilateral | Anterior and posterior thighs | Time-points * laterality | Attaching one thermal contact sensor throughout the protocol and another only a while before each data acquisition is a good option for studying the effect of sweat accumulation on Tsk measurement. |
| 14 | Merla et al., 2010 [41] | 1 × treadmill running until reaching individual maximum heart rate or voluntary interruption Thermograms: pre and post | Unilateral | 6 ROIs: forearm, pectoral, mammary, sternal, abdominal, and thigh. | Time-points differences | The Tsk decreased during exercise and increased in recovery phase. |
| 15 | Luo et al., 2015 [42] | 1 × 30 min running at 8 km/h Thermograms: pre and post | Unilateral | 10 ROIs: Medial foot: medial forefoot, medial mid-foot, medial hind-foot, and medial ankle. Instep: fore instep, hind instep. Lateral foot: lateral forefoot, lateral mid-foot, lateral hind-foot, and lateral ankle | Time-points differences | Foot temperature increased exponentially until 15 min of exercise when the increasing rate slowed down. |
| 16 | Rynkiewicz et al., 2015 [43] | 1 × 1000 m all-out paddling in kayak ergometer Thermograms: pre and post | Bilateral | 3 ROIs: anterior trunk, shoulders; and posterior shoulders. | Time-points differences | Decrease in superficial temperature. Advanced kayakers presented greater differences. |
| 17 | Robles-Dorado 2016 [44] | 1 × 30 km running Thermograms: pre and post | Bilateral | ROIs: foot sole, tibialis anterior, quadriceps, calf, and hamstrings. | Time-points differences | Increased temperature in foot sole, quadriceps, and Achilles, no variations in Tsk of semitendinosus, semimembranosus and tibialis anterior. |
| 18 | Sanz-López et al., 2016 [45] | 2 d/week during 6 week eccentric training Thermograms: pre–post an hour running at 1 h at 80% of maximal heart rate | Bilateral | Achilles and patellar tendons | Group * time-points | Eccentric overload training causes particular adaptations in tendon tissues. |
| 19 | Priego-Quesada et al., 2016 [46] | 3 (different saddle height) × 45 min cycling at individual 50% peak power output at 90 rpm of cadence | Unilateral | 16 ROIs in trunk and lower limbs | Group * time-points | Different postures assumed by the cyclist due to different saddle height did not influence temperature measurements. |
| 20 | Ludwig et al., 2016 [47] | 1 × incremental cycling test until exhaustion (100 W, 1 min increases of 25 W, 80–90 rpm of cadence). | Bilateral | Left and right thigh | Time-points differences | Tsk dynamic of quadriceps showed an explicit decrease during an incremental maximal exercise and a subsequent rapid recovery immediately after exhaustion. |
| 21 | Priego-Quesada et al., 2017 [48] | 1 × Incremental cycling test to exhaustion (105 W, increases of 35 W each 3 min, 55 rpm of cadence). Thermograms: pre, after 10 min, post | Bilateral | 4 ROIs: Vastus Lateralis, Rectus Femoris, Biceps Femoris, and Gastrocnemius Medialis | Group * time-points | Tsk was positively correlated with peak power output and heat production. At higher physical fitness, higher heat production and higher Tsk. |
| 22 | Priego-Quesada et al., 2017 [49] | 1 × 30 min running (10 min at 60% of maximal aerobic speed and 20 min at 80%). Thermograms: pre–post | Bilateral | 4 ROIs in foot sole. | Medio-lateral differences | Tsk is not related to foot eversion. |
| 23 | Jiménez-Pérez et al., 2020 [50] | 2 × 30-min running at 75% of VO2max Thermogram: pre–post | Unilateral | 10 ROIs: Plantar surface of dominant sole of the foot | Gender differences | Foot orthoses do not modify plantar surface temperature after running in healthy runners of either gender. |
| 24 | Mendonca-Barboza et al., 2020 [51] | 1 × Cooper’s 12-min run test Thermograms: pre–post | Bilateral | 4 ROIs: anterior and posterior views of the trunk and upper limbs, and anterior and posterior views of the lower limbs | Laterality * time-points | Tsk change of middle-distance runners was symmetrical between sides, decreasing in upper limbs and trunk and increasing in lower limbs after a short-term maximum effort test. |
| 25 | Duygu et al., 2019 [52] | 1 × ergometer running test until exhaustion (11.3 km/h, increases of 2 ° every min) Thermograms: pre–post | Bilateral | Quadriceps and hamstrings | Group * time-points | Temperature change after anaerobic performance was not significant. |
| 26 | Pérez-Guarner 2019 [53] | 1 × Half-Marathon competition at world championship Thermograms: pre (48 h), pre (24 h), post (24 h), and post (48 h). | Bilateral | ROIs upper and lower limbs | Time-points differences | Tsk responses to a half-marathon were not able to predict physiological stress markers. |
| 27 | Drzazga et al., 2018 [54] | 1 × an hour running (individual lactate threshold intensity) Thermograms: pre–post | Bilateral | 22 ROIs: upper body and lower limbs | Group * Time-points | Significant decrease in upper body temperature in skiers and increase in lower limb temperature in swimmers. |
| 28 | Trecroci et al., 2018 [55] | 1 × maximal incremental cycling test (100 W, increases of 25 W/min until exhaustion, 90 rpm cadence) Thermograms: pre and immediately post | Bilateral | Thighs | Laterality * Time-points | Bilateral Tsk did not show any differences. No relation between asymmetry of Tsk with muscle effort. |
| 29 | Novotny et al., 2017 [56] | 1 × 1000 m all-out crawl swimming Thermograms: pre–psot | Bilateral | 20 ROIs: deltoids anterior, posterior and lateralis, rhomboids major and minor, pectoralis major and minor, erector spinae, latissimus, trapezius, triceps brachii, and biceps brachii | Laterality * time-points | Significant increase in triceps brachii, deltoids temperature. |
| 30 | Novotny et al., 2015 [57] | Breaststroke swimming 1000 m as fast as possible Thermograms: | Bilateral | 20 ROIs: deltoids anterior, posterior and lateralis, rhomboids major and minor, pectoralis major and minor, erector spinae, latissimus, trapezius, triceps brachii, and biceps brachii | Laterality * time-points | Significant increase in Tsk of deltoideus and triceps. Right–left difference in temperatures was not significant. |
| 31 | Priego-Quesada et al., 2020 [58] | 1 × marathon Thermograms: pre (48 h), pre (24 h), post (24 h), and post (48 h). | Bilateral | Lower limbs | Time-points differences | Baseline Tsk was not altered 24 or 48 h after a marathon. |
| 32 | Requena-Bueno et al., 2020 [59] | 1 × 30 min running (80% maximum aerobic speed on a treadmill with a 1% slope) Thermograms: pre–post | Bilateral | 9 ROIs: hallux, toes, medial metatarsal, central metatarsal, lateral metatarsal, medial midfoot, lateral midfoot, medial heel, and lateral heel | Time-points * laterality * analysis procedure | Analysis using ThermoHuman resulted in a reduction of 86% in the time required to process the thermograms. |
| 33 | Bertucci et al., 2013 [60] | 1 × Incremental cycling test (4 min at 100 W, increases every 4 min by 40 W until exhaustion) Thermograms: pre–post | Bilateral | Lower limbs (thigh) | Time-points differences | Relation between increase in gross efficiency and Tsk. |
| 34 | Ferreira-Oliveira et al., 2018 [61] | 1 × progressive cycling test (up to 85% of Hrmax, 50 to 60 rpm of cadence at 20 W, 15 W increases every 2 min until voluntary exhaustion) Thermograms: 15 min during and 60 min recovery (after) | Bilateral | ROIs: thighs, legs, arms, forearms, upper back, lower back, chest, and abdomen | Time-points differences | Decrease in temperature in chest, abdomen, upper back, lumbar region, anterior and posterior thigh, anterior and posterior leg. Temperature increased after 15 min recovery. |
| 35 | Andrade-Fernandes et al., 2016 [62] | 1 × 1 h of treadmill running at 60% of the VO2max. Thermograms: every 5 min (12 times) | 28 ROIs: forehead, face, chest, abdomen, back, lumbar, anterior and posterior neck, and posterior and anterior views of the right and left hands, forearms, upper arms, thighs, and legs | Time-points differences | Significant changes in Tsk due to running. | |
| 36 | Akimov & Son’kin 2011 [63] | 1 × stepwise ergometer test (60 W with increases of 60 W each 2 min, constant cadence: 60 rpm) (endurance and multisports) Thermograms: video every 30 s | Single area | Forehead | Conditions * group | Endurance and multisports group’s Tsk decreased until exhaustion. |
| 37 | Cholewka et al., 2016 [64] | 1 × incremental test (50 W with increases of 30 W each 3 min) Thermograms: video every 180 s | Unilateral | 5 ROIs (face, chest, arms, back, calf) | Time-points differences | Decrease in Tsk over time during exercise. |
| 38 | Tanda 2018 [65] | 2 × 30 min treadmill runs (constant (6 km/h) vs. graded load (1.5 km/h increases every 5 min until 13.5 km/h was reached)) Thermograms: each 5 min | Bilateral | 18 ROIs (upper and lower limbs, chest, back, face) | Time-points * condition | Variations over time in Tsk in both conditions. Tsk was reduced the first 10 min of exercise. |
| 39 | Crenna & Tanda 2020 [66] | 1 × 60–90 min treadmill run at 10.2–14 km/h (90–95% of max) Thermograms: each 5 min | Bilateral | 14 ROIs (chest, abdomen, lower limbs, upper limbs, back) | Time-points difference | Large heterogeneity depending on the ROI during exercise. |
| 40 | Rojas-Valverde et al., 2021 [67] | Prolonged running (marathon) Thermograms: pre (15 d and 45 min), post (24 h and 6 d) | Bilateral Anterior–posterior | 13 ROIs (lower limbs) | Time-points differences Correlation with muscle damage markers | Tsk increased the day after the marathon and no relationships observed between muscle damage markers and Tsk. |
| 41 | Fernández-Cuevas et al., 2014 [68] | 1 × 45 min treadmill run at 60–75% heart rate max Thermograms: pre, immediately post, and 60 min post | Bilateral upper and lower limbs | 71 ROIs | Time-points differences | Tsk decreases and increases immediately post exercise depending of the ROI but, during recovery, Tsk usually increases. |
| 42 | Racinais et al., 2021 [69] | Marathon and race-walk (20–50 km) Thermograms: pre, immediately post | Bilateral upper and lower limbs | 18 ROIs (neck, chest, shoulder arms and legs) | Time-points differences | Lower pre-race Tsk correlated with faster finished times. DNF athletes presented higher pre-race Tsk. |
| 43 | Machado et al., 2021 [70] | 30 min run, 1% slope self-selected speed Thermograms: pre, immediately post | Bilateral | 7 ROIs (sole and lower limbs) | Time-points * between devices difference | C2 and Flir-One pro presented lower mean and maximum Tsk than E60Bx. High data variability between cameras. |
| 44 | Binek et al., 2021 [71] | 60 min running on treadmill with 80% of VO2max Thermograms: pre, imediately post, and 10 min recovery | Bilateral | 4 ROIs (lower limbs) | Time-points * sex | Tsk of females is lower than males, Tsk changes due to exercise were greater in women. |
| 45 | Jones et al., 2021 [72] | Two middle distance runners Thermograms: 42 days observations | Bilateral | 4 ROIs (lower limbs) | Time-points differences | No changes in daily Tsk. |
| # | Reference | Participants Data | Previous Instructions | Extrinsic Factors | Environmental Conditions | Environmental Setup | Equipment | Image Background | Thermal Adaptation |
|---|---|---|---|---|---|---|---|---|---|
| 1 | Tumilty et al. [29] | 10♂ and 7♀ (18–25 years), competitive cross-country runners (training: 25 miles/w) | No alcohol, caffeine, smoking, or exercise | NR | T°: 21.8 ± 0.5 °C %RH: 47.3 ± 8.1% | Minimized airflow | FLIR T450SC Accuracy: 1% Sensitivity: ≤0.05 °C | Non-reflective surfaces | 15 min (seated) |
| 2 | Gil-Calvo et al. [30] | 17♂ (27.0 ± 8.0 years), recreational runners (training: 4.0 ± 2.0 sessions/w) | No alcohol, caffeine, smoking, tea, drugs, heavy meals | NR | Assessed, no data | Reflected temperature measured. No electronic devices, light, or airflow in the room | FLIR E60bx Accuracy: 2% Sensitivity: <0.05 °C | Black panel | 10 min (seated, extended knees) |
| 3 | Gutiérrez-Vargas et al. [31] | 10♂ and 7♀ (35.8 ± 7.0 years) recreational runners (training: 9.3 ± 6.6 years of experience) | NR | NR | T°: 22.3 ± 0.9 °C %RH: 64.7 ± 8.3% | NR | FLIR T440 Accuracy: 2% Sensitivity: ≤0.2 °C | NR | 10 min (biped) |
| 4 | Fournet et al. [32] | 9♂ and 9♀ (18–25 years), physically active Caucasians | NR | NR | T°: 22 °C | NR | FLIR Thermacam B2 Accuracy: ±2% Sensitivity: ±0.1 °C | NR | 10 min |
| 5 | Priego-Quesada et al. [33] | 14♂ (29.9 ± 8.3 years), cyclists (training: 162 ± 77 km/w) | No alcohol, caffeine, smoking, sunbathing, UV ray exposure, heavy meals, or exercise | NR | Controlled not specified | No electronic equipment or persons | FLIR E-60 Accuracy: 2% Sensitivity: ≤0.05 °C | Anti-reflective panel | 10–15 min |
| 6 | Priego-Quesada et al. [34] | 10♂ and 14 ♀ (29.3 ± 5.8 years), runners (training: 38.5 ± 16.3 km/w) | No alcohol, caffeine, smoking, sunbathing, creams or body lotions, heavy meals, or exercise | Compression stocking | Controlled, not specified | No electronic equipment or persons | FLIR E-60 Accuracy: 2% Sensitivity: ≤0.05 °C | Anti-reflective panel | 1 min |
| 7 | Priego-Quesada et al. [35] | 19♂ (29.5 ± 9.8 years), runners (training: 229 ± 150 km/w) | No alcohol, caffeine, smoking, sunbathing, creams or body lotions, heavy meals, or exercise | NR | Controlled, not specified | No electronic equipment or persons, lights off | FLIR E-60 Sensitivity: ≤0.05 °C | Anti-reflective panel | 1 min |
| 8 | Priego-Quesada et al. [36] | 10♂ (25.0 ± 4.0 years), physically active cyclists | No alcohol, caffeine, smoking, sunbathing, creams or body lotion, heavy meals | NR | T°:19.5 ± 1.3 °C %RH:62.9 ± 3.2% | No electronic equipment or persons, lights and temperature controlled | FLIR E-60 Accuracy: 2% Sensitivity: ≤0.05 °C | Anti-reflective panel | 10 min |
| 9 | Priego-Quesada et al. [37] | 10♂ (40.0 ± 6.0 years), recreational triathletes (training: 7.0 ± 3.0 years of experience) | No alcohol, caffeine, smoking, sunbathing, creams or body lotion, heavy meals | No recovery protocols between training | T°:18 °C %RH:44–63% | No electronic equipment or persons, lights and temperature controlled | FLIR E-60 Accuracy: 2% Sensitivity: ≤0.05 °C | Anti-reflective panel | 10 min (biped) |
| 10 | Hadžić, et al. [22] | 1♂ (25 years), middle-distance runner (training: 12 years of experience) | NR | NR | T°: 23.5 ± 2 °C | NR | FLIR T425 Accuracy: 1% | NR | 15 min |
| 11 | Fernandes et al. [38] | 12♂ (22.4 ± 3.3 years), physically active (training: >3 times/w) | Controlled food intake. Avoid thermal stress, exercise. | NR | T°: 24.9 ± 0.6 °C %RH: 62.3 ± 5.7% | Artificial light | T420 Accuracy: 2% Sensitivity: ≤0.05 °C | NR | 1 h |
| 12 | Rodriguez-Sanz et al. [39] | 57♂ (42.8 ± 7.0 years), runners with functional equinus (training: 6 h/week) | No drugs or physical activity, heavy meals, or caffeine. | NR | T°: 24.1 ± 1.0 °C %RH: 45 ± 10% | Minimized airflow | FLIR SC3000 | NR | NR |
| 13 | Priego-Quesada et al. [40] | 9♂ (26 ± 10 years), recreational runners (training: (30.8 ± 28.9 km/w) | NR | NR | T°:23.2 ± 0.9 °C %HR: 27.9 ± 5.1% | NR | FLIR E60bx Accuracy: 2% Sensitivity: ≤0.05 °C | NR | 5–10 min |
| 14 | Merla et al. [41] | 15♂ (25.2 ± 3.1 years), well-trained runners | Shaved, no creams or lotions, no smoking, alcohol, or caffeine intake | NR | T°: 23–24 °C %HR: 50 ± 5%. | NR | FLIR SC3000 | NR | 20 min |
| 15 | Luo et al. [42] | 19♂ (26.2 ± 1.2 years) runners | No exercise 24 h before | NR | T°: 26 °C %HR: 60–70% | NR | DaLi DL700 | NR | NR |
| 16 | Rynkiewicz et al. [43] | 14♂ and 5♀ (15.4 ± 1 years), kayakers (training experience: 4 years) | NR | NR | T°: 22 ± 0.5 °C %HR 40 ± 2%. | NR | ThermaCAM SC 640 | NR | 15 min |
| 17 | Robles-Dorado [44] | 28♂ and 4 ♀ (38.8 ± 6.4 years), runners (training experience: 8.5 years) | NR | Same socks | NR | NR | PCE-TC 3 Accuracy: 2% Sensitivity: ≤2 °C | NR | NR |
| 18 | Sanz-López et al. [45] | 20♂ (22.8 ± 4.2 years), active (training experience: 3 d/week) | No exercise | NR | T°: 21 °C %RH: 60% | NR | FLIR E60 | NR | 10 min |
| 19 | Priego-Quesada et al. [46] | 16♂ (20 ± 10 years), club level cyclists | No alcohol, caffeine, smoking, sunbathing or UV rays, creams or body lotion, heavy meals, no exhaustive exercise | NR | T°: 23.4–24 °C %RH: 40.7–50.8% | No electronic equipment or persons, lights and temperature controlled | FLIR E60bx Accuracy: 2% Sensitivity: ≤0.05 °C | Anti-reflective panel | 10 min |
| 20 | Ludwig et al. [47] | 7♂ (20 ± 10 years), elite cyclists (training level: 66.89 VO2max = mL/kg/min) | No strenuous exercise | NR | T°: 22–23 °C %RH: 50% | No direct airflow, controlled light. | AVIO TVS700 | NR | 10 min |
| 21 | Priego-Quesada et al. [48] | 11♂ (31 ± 7.4 years) cyclist (training: 264.5 km/week) and 11♂ (27.2 ± 6.6 years) non- cyclists | No alcohol, caffeine, smoking, sunbathing or UV rays, creams or body lotion, heavy meals, no exhaustive exercise | NR | T°: 23.5 ± 1.2 °C %RH: 49.9 ± 3.9% | No direct airflow, no electronic equipment near, controlled light. | FLIR T420 Sensitivity: <0.045 °C | Anti-reflective panel | 10 min |
| 22 | Priego-Quesada et al. [49] | 17♂ and 5♀ (34 ± 5 years) endurance runners (training: 36.6 ± 12.9 km∕week) | No alcohol, caffeine, smoking, sunbathing or UV rays, creams or body lotion, heavy meals, no exhaustive exercise | NR | T°: 22.9 ± 1.3 °C %RH: 44.4 ± 12.1% | No direct airflow, no electronic equipment near, controlled light. | FLIR E60 Accuracy: 2% Sensitivity: ≤0.05 °C | Anti-reflective panel | 10 min |
| 23 | Jiménez-Pérez et al. [50] | 15♂ (28 ± 7 years) and 15♀ (35 ± 7 years) recreational runners (training: 20 km/week) | No alcohol, caffeine, smoking, sunbathing or UV rays, creams or body lotion, heavy meals, no exhaustive exercise | NR | T°: 20.9 ± 1 °C %RH: 39.4 ± 6.4% | No direct airflow, no electronic equipment near, controlled light. | FLIR E60bx | Anti-reflective panel | 10 min |
| 24 | Mendonca-Barboza et al. [51] | 10♂ (23.5 ± 5.1 years) middle- distance elite runners (training: 2–3 h/d, 5 d/week) | No alcohol, smoking, drugs, or exercise was allowed | NR | T°: 22–24 °C %RH: 50% | NR | FLIR T360 | NR | 15 min |
| 25 | Duygu et al. [52] | 18♂ sailing athletes | NR | NR | T°: 21 °C | NR | FLIR E5 | NR | 10–20 min |
| 26 | Pérez-Guarner et al. [53] | 11♂ and 6♀ (41 ± 6 years) runners (training 5.9 ± 1.9 sessions/week) | No alcohol, caffeine, smoking, sunbathing or UV rays, creams or body lotion, heavy meals, no exhaustive exercise | NR | T°: 23.2 ± 0.1 °C %RH: 20 ± 1% | No direct airflow, no electronic equipment near, controlled light. | FLIR E60 Accuracy: 2% Sensitivity: ≤0.05 °C | Anti-reflective panel | 10 min |
| 27 | Drzazga et al. [54] | 6♂ cross-country skiers (23 ± 2.7 years) and 4♂ (21.5 ± 2.1 years) elite swimmers | NR | NR | T°: 19 ± 0.5 C %RH: 56 ± 3% | NR | FLIR E60 Sensitivity: 0.05 K | NR | 1–2 min |
| 28 | Trecroci et al. [55] | 10♂ (21.4 ± 2.6 years) elite cyclists | No strenuous exercise, no medication, drugs, cosmetic products, or caffeine intake. | NR | T°: 22–23 °C %RH: 50 ± 5% | Constant natural and fluorescent lighting and no direct ventilation | AVIO TVS-700 | Constant temperature panel | 10 min |
| 29 | Novotny et al. [56] | 13 active students | No exercise | NR | T°: 27.9–28.1 °C %RH: 52.3–52.8% | NR | FLUKE TiR | NR | 15 min |
| 30 | Novotny et al. [57] | 25♂ (20.6 ± 1.61) active students | NR | NR | T°: 27.9–28.1 °C %RH: 52.3–52.8% | NR | FLUKE TiR Sensitivity: 0.1° | NR | 15 min |
| 31 | Priego-Quesada et al. [58] | 16♂ endurance runners | No alcohol, caffeine, smoking, sunbathing or UV rays, creams or body lotion, heavy meals, no exhaustive exercise | NR | T°: 27.9–28.1 °C %RH: 52.3–52.8% | No direct airflow, no electronic equipment near, controlled light. | FLIR E60bx Accuracy: 2% Sensitivity: ≤0.05 °C | Anti-reflective panel | 10 min |
| 32 | Requena-Bueno et al. [59] | 20♂ and 10♀ (34 ± 10 years) runners (training 34.6 ± 19.5 km/week) | No alcohol, caffeine, smoking, sunbathing or UV rays, creams or body lotion, heavy meals, no exhaustive exercise | NR | T°: 21.4 ± 2.0 °C %RH: 40.6 ± 10.1% | No direct airflow, no electronic equipment near, controlled light. | FLIR E60bx Accuracy: 2% Sensitivity: ≤0.05 °C | Anti-reflective panel | 10 min |
| 33 | Bertucci et al. [60] | 2♂ (16 years) competitive cyclists | NR | NR | NR | NR | Cedip Titanium HD560M | NR | NR |
| 34 | Ferreira-Oliveira et al. [61] | 16♂ (22.5 ± 2.1) young active men | No diuretics, smoking, alcohol, or drugs consumption, dermatological treatments, or lotions | No skin burns, kidney problems, symptoms of pain, osteomioarticular injury | T°: 19.7 ± 1.5 °C %RH: 56.9 ± 5% | NR | Fluke ITR-25 | NR | 10 min |
| 35 | Andrade-Fernandes et al. [62] | 12♂ (22.4 ± 3.3 years) active males (training: +3 times/week) | No diuretics, smoking, alcohol, or drugs consumption, dermatological treatments, or lotions | No skin burns, kidney problems, symptoms of pain, osteomioarticular injury | T°: 24.9 ± 0.6 °C %RH: 62.3 ± 5.7% | NR | FLIR T420 | NR | 30 min |
| 36 | Akimov & Son’kin [63] | 20♂ (23.3 ± 4.8 years), athletes | NR | NR | T°: 21–22 °C %RH: 40% | NR | NEC TH9100 | NR | 10 min |
| 37 | Cholewka et al. [64] | 12♂ (23.3 ± 4.8 years), cyclist | NR | NR | T°: 21.8 ± 1 °C | NR | FLIR E60 Sensitivity: 0.05 K | NR | 30–40 min |
| 38 | Tanda [65] | 6♂ and 1♀ (18–59 years), middle-long distance runners (training: 3–5 sessions/w) | NR | NR | T°: 22 °C %RH: 4% | Heating/cooling air conditioning system | FLIR T335 | NR | 10 min |
| 39 | Crenna & Tanda [66] | 6♂ | NR | NR | T°: 23–27 °C %RH: 60–70% | NR | FLIR T335 | NR | 10 min |
| 40 | Rojas-Valverde et al. [67] | 9♂ and 7♀ (36 ± 7 years), distance runners (training: 10 ± 7 years of experience) | No drugs, alcohol, caffeine, smoking, exercise, lotions, or creams. | No neuromuscular injury or pathological or metabolic disease | T°: 23.0 ± 0.5 °C %RH: 58.0 ± 6% | Heating/cooling air conditioning system and radiation avoided | FLIR T440 Accuracy: 2% Sensitivity: 0.04 °C | Anti-reflective panel | 15 min |
| 41 | Fernández-Cuevas et al. [68] | 15♂ (21.4 ± 2.6 years), physically active college students | No drugs, alcohol, smoking, exercise. | NR | T°: 20.6 ± 0.7 °C %RH: 44.0 ± 3.2% | NR | FLIR T335 | NR | 15 min |
| 42 | Racinais et al. [69] | 47♂ and 36 ♀(only 49 in Tsk), elite athletes | NR | NR | T°: 29.3 ± 0.5–32.7 ± 0.2 °C %RH: 46.3 ± 1.0–80.6 ± 1.1% | Skin was towel dried | FLIR T600 | NR | NR |
| 43 | Machado et al. [70] | 12♂ (25 ± 8 years), active males (training: 43.4 ± 44.2 km/week) | NR | NR | T°: 3.1 ± 0.9 °C %RH: 28.1 ± 5.1% | No electronic equipment or persons, lights and temperature controlled | FLIR E60bx, C2 and Flir-One-Pro LT | Anti-reflective panel | 10 min |
| 44 | Binek et al. [71] | 10♂ and 6 ♀(22 ± 3.23 and 23.7 ± 3.15 years), cross-country skiers | NR | NR | T°: 20 ± 1 %RH: 56 ± 3% | NR | FlirE60 | NR | NR |
| 45 | Jones et al. [72] | Two♂ (16 and 18 years) middle-distance runners | NR | NR | T°: 28.2 ± 2.8 °C %RH: 43.0 ± 11.4% | NR | Flir T600 | NR |
| # | Reference | Camera Preparation | Image Recording | Camera Position | Emissivity | Assessment Time | Body Position | Method of Drying the Skin | Image Evaluation |
|---|---|---|---|---|---|---|---|---|---|
| 1 | Tumilty et al. [29] | NR | NR | Perpendicular | 95% | Same time (as close as waking) | Biped | NR | AVG Tsk |
| 2 | Gil-Calvo et al. [30] | Turned up 10 min before | Distance: 1 m | Perpendicular | 0.98 | NR | Prone | NR | AVG Tsk |
| 3 | Gutiérrez-Vargas et al. [31] | NR | Distance: 3 m Height: 45 cm | Perpendicular | 0.98 | 9 a.m. | Biped | NR | AVG Tsk |
| 4 | Fournet et al. [32] | NR | Distance: 1.9 m | NR | 0.98 | NR | Biped | NR | AVG Tsk |
| 5 | Priego-Quesada et al. [33] | Calibration | Distance: 1 m | Perpendicular | 0.98 | NR | Biped | NR | AVG Tsk |
| 6 | Priego-Quesada et al. [34] | Calibration | Distance: 1 m | Perpendicular | 0.98 | Same time (not specified) | Biped | NR | AVG Tsk |
| 7 | Priego-Quesada et al. [35] | Calibration Turned up 10 min before | Distance: 1 m | Perpendicular | 0.98 | Same time (not specified) | Biped | NR | AVG Tsk |
| 8 | Priego-Quesada et al. [36] | Calibration Turned up 10 min before | Distance: 1 m | Perpendicular | 0.98 | NR | Biped | NR | AVG Tsk |
| 9 | Priego-Quesada et al. [37] | Calibration Turned up 10 min before | Distance: 1 m | Perpendicular | 0.98 | 7:45 a.m. | Biped | NR | AVG and MAX Tsk |
| 10 | Hadžić et al. [22] | Calibration | Distance: 1 m | NR | 0.98 | NR | Cycling | NR | AVG Tsk |
| 11 | Fernandes et al. [38] | NR | Distance: 1 m | NR | 0.98 | 2 p.m. | Biped | NR | Median Tsk |
| 12 | Rodriguez-Sanz et al. [39] | NR | NR | Perpendicular | NR | NR | Biped | NR | AVG, MIN, MAX Tsk |
| 13 | Priego-Quesada et al. [40] | Calibration | Distance: 1.5 m | Perpendicular | 0.98 | NR | Biped | NR | AVG Tsk |
| 14 | Merla et al. [41] | NR | Distance: 4 m | NR | NR | Same time (late morning) | NR | NR | AVG Tsk |
| 15 | Luo et al. [42] | NR | NR | NR | NR | NR | Biped | NR | AVG, MIN, MAX Tsk |
| 16 | Rynkiewicz et al. [43] | NR | Distance: 6 m | Perpendicular | NR | NR | Biped | NR | AVG Tsk |
| 17 | Robles-Dorado [44] | NR | NR | Perpendicular | NR | NR | Biped/supine | NR | AVG Tsk |
| 18 | Sanz-López et al. [45] | NR | Distance: 2.5 m | NR | NR | NR | Biped | NR | AVG Tsk |
| 19 | Priego-Quesada et al. [46] | NR | Distance: 1 m | Perpendicular | NR | Same Time (not specified) | Biped | Sweat removed (not specified) | AVG Tsk |
| 20 | Ludwig et al. [47] | Fixed in a tripod | NR | Perpendicular | 0.98 | NR | Biped | NR | AVG, MAX Tsk |
| 21 | Priego-Quesada et al. [48] | NR | Distance: 1 m | Perpendicular | NR | NR | Biped | NR | AVG Tsk |
| 22 | Priego-Quesada et al. [49] | Calibration | Distance: 1 m | Perpendicular | NR | NR | Biped | NR | AVG Tsk |
| 23 | Jiménez-Pérez et al. [50] | Calibration | Distance: 1 m | Perpendicular | NR | NR | Supine | NR | AVG Tsk |
| 24 | Mendonca-Barboza et al. [51] | Fixed in a tripod | Distance: 3.5 | Perpendicular | NR | Same time (afternoon) | Biped | NR | AVG Tsk |
| 25 | Duygu et al. [52] | NR | Distance: 1 m | NR | NR | NR | Biped | NR | MAX Tsk |
| 26 | Pérez-Guarner et al. [53] | Calibration | Distance: 1.5 m | Perpendicular | NR | Same time (afternoon) | Biped | NR | AVG, MAX Tsk |
| 27 | Drzazga et al. [54] | NR | NR | NR | NR | NR | NR | NR | AVG Tsk |
| 28 | Trecroci et al. [55] | NR | NR | NR | 0.98 | Same time (morming) | Biped | NR | MAX Tsk |
| 29 | Novotny et al. [56] | NR | NR | NR | 0.98 | NR | Biped | NR | AVG Tsk |
| 30 | Novotny et al. [57] | NR | NR | NR | 0.98 | NR | Biped | NR | AVG Tsk |
| 31 | Priego-Quesada et al. [58] | NR | Distance: 1 m | Perpendicular | 0.98 | NR | Biped | NR | AVG Tsk |
| 32 | Requena-Bueno et al. [59] | Stabilisation | Distance: 1 m | Perpendicular | 0.98 | NR | Supine | NR | AVG Tsk |
| 33 | Bertucci et al. [60] | NR | NR | NR | NR | NR | NR | NR | NR |
| 34 | Ferreira-Oliveira et al. [61] | NR | NR | NR | NR | NR | Biped | NR | AVG Tsk |
| 35 | Andrade-Fernandes et al. [62] | NR | Distance 3 m | NR | 0.98 | Same time (afternoon) | Running/Biped | NR | AVG Tsk |
| 36 | Akimov & Son’kin [63] | NR | NR | NR | NR | NR | Cycling | NR | AVG Tsk |
| 37 | Cholewka et al. [64] | NR | NR | NR | NR | NR | Cycling | NR | Curve Tsk |
| 38 | Tanda [65] | Calibration | NR | NR | 0.98 | Same time (late morning) | Running | NR | AVG Tsk |
| 39 | Crenna & Tanda [66] | Calibration | Distance: 3 m | NR | NR | Same time (late morning) | Running | NR | AVG Tsk |
| 40 | Rojas-Valverde et al. [67] | Camera turned on 30 min before each test | Distance: 3 m Height 60 cm, 5° angle | Perpendicular | 0.98 | Same time (7:00–7:30 a.m.) | Biped | Clean with water and then dried | AVG Tsk |
| 41 | Fernández-Cuevas et al. [68] | NR | NR | NR | NR | 8:30–11:30 a.m. | Biped | NR | AVG Tsk |
| 42 | Racinais et al. 2021 [69] | Accuracy checked using 20 × 20 cm reference plates | Distance: 4 m | NR | 0.98 | NR | Biped | Towel dried | AVG Tsk |
| 43 | Machado et al. [70] | Calibration | Distance: 3 m | NR | 0.98 | NR | Seated, biped | NR | MAX and AVG Tsk |
| 44 | Binek et al. [71] | Calibration | NR | NR | 0.98 | NR | Biped | NR | AVG Tsk |
| 45 | Jones et al. [72] | NR | 1.5 m | NR | NR | NR | Biped | NR | AVG Tsk |
Publisher’s Note: MDPI stays neutral with regard to jurisdictional claims in published maps and institutional affiliations. |
© 2021 by the authors. Licensee MDPI, Basel, Switzerland. This article is an open access article distributed under the terms and conditions of the Creative Commons Attribution (CC BY) license (https://creativecommons.org/licenses/by/4.0/).
Share and Cite
Rojas-Valverde, D.; Tomás-Carús, P.; Timón, R.; Batalha, N.; Sánchez-Ureña, B.; Gutiérrez-Vargas, R.; Olcina, G. Short-Term Skin Temperature Responses to Endurance Exercise: A Systematic Review of Methods and Future Challenges in the Use of Infrared Thermography. Life 2021, 11, 1286. https://doi.org/10.3390/life11121286
Rojas-Valverde D, Tomás-Carús P, Timón R, Batalha N, Sánchez-Ureña B, Gutiérrez-Vargas R, Olcina G. Short-Term Skin Temperature Responses to Endurance Exercise: A Systematic Review of Methods and Future Challenges in the Use of Infrared Thermography. Life. 2021; 11(12):1286. https://doi.org/10.3390/life11121286
Chicago/Turabian StyleRojas-Valverde, Daniel, Pablo Tomás-Carús, Rafael Timón, Nuno Batalha, Braulio Sánchez-Ureña, Randall Gutiérrez-Vargas, and Guillermo Olcina. 2021. "Short-Term Skin Temperature Responses to Endurance Exercise: A Systematic Review of Methods and Future Challenges in the Use of Infrared Thermography" Life 11, no. 12: 1286. https://doi.org/10.3390/life11121286
APA StyleRojas-Valverde, D., Tomás-Carús, P., Timón, R., Batalha, N., Sánchez-Ureña, B., Gutiérrez-Vargas, R., & Olcina, G. (2021). Short-Term Skin Temperature Responses to Endurance Exercise: A Systematic Review of Methods and Future Challenges in the Use of Infrared Thermography. Life, 11(12), 1286. https://doi.org/10.3390/life11121286