Article

DnaK3 Is Involved in Biogenesis and/or Maintenance of Thylakoid Membrane Protein Complexes in the Cyanobacterium Synechocystis sp. PCC 6803

1
Department of Chemistry, Biochemistry, Johannes Gutenberg University Mainz, 55128 Mainz, Germany
2
Institute of Molecular Biosciences, Goethe University Frankfurt, Max-von-Laue Straße 9, 60438 Frankfurt, Germany
3
Department of Molecular Cell Biology, Bielefeld University, 33615 Bielefeld, Germany
*
Author to whom correspondence should be addressed.
These authors contributed equally.
Life 2020, 10(5), 55; https://doi.org/10.3390/life10050055
Submission received: 8 April 2020 / Revised: 27 April 2020 / Accepted: 28 April 2020 / Published: 30 April 2020
(This article belongs to the Special Issue Cellular and Molecular Strategies in Cyanobacterial Survival)

Abstract

:
DnaK3, a highly conserved cyanobacterial chaperone of the Hsp70 family, binds to cyanobacterial thylakoid membranes, and an involvement of DnaK3 in the biogenesis of thylakoid membranes has been suggested. As shown here, light triggers synthesis of DnaK3 in the cyanobacterium Synechocystis sp. PCC 6803, which links DnaK3 to the biogenesis of thylakoid membranes and to photosynthetic processes. In a DnaK3 depleted strain, the photosystem content is reduced and the photosystem II activity is impaired, whereas photosystem I is regular active. An impact of DnaK3 on the activity of other thylakoid membrane complexes involved in electron transfer is indicated. In conclusion, DnaK3 is a versatile chaperone required for biogenesis and/or maintenance of thylakoid membrane-localized protein complexes involved in electron transfer reactions. As mentioned above, Hsp70 proteins are involved in photoprotection and repair of PS II in chloroplasts.

1. Introduction

In plants and cyanobacteria, the biogenesis and dynamics of thylakoid membranes (TMs) is light-controlled [1,2]. In plants, proplastids develop into chloroplasts, involving the de novo formation of an internal TM network [3], and a developed TM network dynamically reorganizes in the light [4]. When the cyanobacterium Synechocystis sp. PCC 6803 (from here on: Synechocystis) is grown in the dark under light-activated heterotrophic growth (LAHG) conditions, where glucose is the only available energy source, Synechocystis cells exhibit reduced or even just rudimentary TMs [5,6]. However, after shifting dark-adapted cells into the light, the Synechocystis cells quickly rebuild a TM network and recover photosynthetic activity [5,7]. While dark-adapted Synechocystis cells do not harbor active photosystem II (PS II) complexes, complete photosynthetic activity is regained within 24 h after transferring dark-adapted cells into the light, and reappearance of photosynthetic electron transfer processes is coupled to the formation of internal TMs [7]. However, it is still enigmatic how the formation of internal TMs is controlled, both in chloroplasts and cyanobacteria, although some proteins that might be involved in this process have already been described previously [8]. These proteins include the inner membrane-associated protein of 30 kDa (IM30, also known as Vipp1: The vesicle-inducing protein in plastids 1), Hsp70 (Heat shock protein 70) chaperones, dynamin-like proteins, a prohibitin-like protein, as well as YidC, a membrane protein integrase [9,10,11,12,13,14,15,16]. Nevertheless, while some proteins are probably more directly involved in TM formation, the structure and stability of TMs are also affected more indirectly by pathways, which control the biogenesis of lipids and/or cofactors, and, e.g., mutants defective in synthesis of chlorophyll or of the membrane lipid phosphatidylglycerol (PG) have severely reduced TM systems [17,18,19,20].
Molecular chaperones of the Hsp70 family are involved in multiple cellular processes, such as folding of newly synthesized proteins, protein disaggregation, prevention of protein misfolding, protein transport, or the control of regulatory protein functions [21]. The thus far best characterized Hsp70 chaperone is the DnaK protein of the bacterium Escherichia coli [22]. In cyanobacteria, at least two DnaK proteins, DnaK2 and DnaK3, are highly conserved, and most cyanobacteria contain an additional DnaK1 protein as well as further DnaK-like proteins [15,23,24]. While cyanobacterial genomes typically encode several DnaK chaperones together with multiple DnaJ (Hsp40) proteins, which serve as DnaK co-chaperones, the physiological function of this DnaK-DnaJ network in cyanobacteria is essentially not understood. In recent years, the physiological roles of individual DnaK and DnaJ proteins have been analyzed to some extent in the cyanobacteria Synechococcus sp. PCC 7942 and Synechocystis [16,24,25,26]. In Synechocystis, three DnaK proteins are expressed together with at least seven DnaJ proteins [15,25]. The two dnaK genes dnaK2 and dnaK3 are essential in Synechocystis, but not dnaK1 [15]. The DnaK2 protein has been classified as the canonical DnaK protein involved in cellular stress responses, and DnaK2 most likely functions together with Sll0897, the only type I DnaJ protein expressed in Synechocystis [24,25]. In line with this, deletion of the sll0897 gene resulted in a heat-sensitive phenotype [25]. However, interactions with other DnaJ proteins cannot be excluded, and in fact, the DnaK2 protein interacts and cooperates with the type II J protein DnaJ2 in Synechococcus sp. PCC 7942 [27].
In contrast to the remaining dnaJ genes, the dnaJ gene sll1933 (dnaJ3) could not be deleted in Synechocystis, indicating that the encoded DnaJ3 protein is essential [25]. The dnaK3 and dnaJ3 genes are organized in a conserved gene cluster in cyanobacteria, and a functional interaction of DnaK3 with DnaJ3 is assumed [28] DnaK3- and DnaJ3-homologs are encoded in essentially all cyanobacterial genomes, except in Gloeobacter violaceus PCC 4721, a cyanobacterium that lacks TMs [29,30]. Based on this observation it has been suggested that the physiological function of both proteins might be linked to TMs, and consequently, DnaK3 and DnaJ3 were suggested to be involved in the biogenesis and/or maintenance of TMs [16,25,31]. The DnaK3s of both Synechococcus and Synechocystis co-purify with membranes, and the unique DnaK3 C-terminus has been implicated to mediate tight membrane binding of DnaK3 in Synechocystis [15,31]. However, what might be the function of DnaK3 at TMs?
The function of a cyanobacterial DnaK3 has recently been linked to the PS II reaction center protein D1 [16], the main target of stress-induced damage in the photosynthetic electron transport chain, which is constantly degraded and replaced by newly synthesized proteins in a PS II repair cycle [32,33]. Furthermore, a Hsp70 chaperone is involved in the biogenesis, protection and/or repair of PS II complexes in chloroplasts [34,35]. Based on these observations we hypothesized that the physiological functions of DnaK proteins might have diverged in cyanobacteria, and DnaK3 potentially is specifically involved in biosynthesis/maintenance of TM complexes involved in photosynthesis.
In the present study, we have analyzed the role of the Hsp70 protein DnaK3 in TM maintenance in the cyanobacterium Synechocystis sp. PCC 6803. Expression of DnaK3 is light-regulated. Reduction of the cellular DnaK3 content resulted in decreased PS and phycobilisome (PBS) contents, a lowered PS I-to-PS II ratio, a generally reduced photosynthetic activity as well as disturbed PS II activity at elevated light conditions. The observation that the PS II activity is affected after photoinhibition in a mutant strain, where the cellular DnaK3 content is reduced, and the comparison of the mutant strain with Synechocystis wt suggests a specific function of DnaK3 in PS II protection and/or repair. However, based on the here presented data its activity must be wider. Thus, our findings support the assumption that DnaK3 is involved in biogenesis and/or maintenance of TM-localized electron transfer complexes in cyanobacteria.

2. Materials and Methods

2.1. Growth Conditions

A glucose-tolerant Synechocystis sp. PCC 6803 wild type (wt) and the merodiploid dnaK3 (sll1932) knock-down (KD) strain [15] were cultivated photomixotrophically at 30 °C in liquid BG11 medium [36] supplemented with 5 mM glucose. Kanamycin (80 µg/mL) was added in case of the dnaK3KD strain. The cultures were aerated with air enriched with 2% CO2 and grown under fluorescent white light at a light intensity of 20 (LL, low light) or 120 (HL, high light) µmol/m2 s, respectively. To determine growth rates, the strains were initially adjusted to an OD750 of 0.05 in BG11 medium, containing 5 mM glucose, and growth was followed by monitoring OD750. For LAHG cultures, Synechocystis cells were grown in a dark cabinet for at least two weeks, during which the cultures were diluted at least five times in fresh medium, as described previously (Barthel et al., 2013).

2.2. SDS-PAGE and Immunoblot Analysis

Synechocystis cells were harvested in the exponential growth phase at an OD750 below 2.0. Cell pellets were resuspended in buffer (50 mM HEPES, pH 7.0, 25 mM CaCl2, 5 mM MgCl2, 10% (v/v) glycerol) and a proteinase inhibitor mix (Sigma Aldrich) was added at a 1:1000 dilution. Cells were broken with glass beads (0.25–0.5 mm diameter) in a beadbeater. Unbroken cells and glass beads were removed by centrifugation at 1600 g and the respective protein concentrations were determined by three independent Bradford assays. After addition of SDS sample buffer and heating at 65 °C for 15 min, cell extracts were loaded on an 8% polyacrylamide gel and proteins were separated by SDS gel electrophoresis. Subsequently, proteins were transferred to a polyvinylidene difluoride membrane, using a wet electroblotting system from Bio-Rad. The rabbit primary antibodies were used at 1:2000 (anti-L23 directed against the large ribosomal subunit protein L23 encoded by sll1801, Gramsch laboratories, Schwabhausen, Germany), 1:1000 (anti-DnaK1, anti-DnaK2 and anti-DnaK3 [15], anti-PsaA/PsaB [37]) or 1:100 (anti-PsbA [38]) dilutions, respectively, whereas the goat anti-rabbit secondary antibody (Sigma Aldrich) was diluted 1:10,000. PsbA/D1-HRP antibodies were obtained from Agrisera and used in 1:15,000 dilution. To visualize the protein bands, membranes were incubated with the enhanced chemiluminescence kit from Pierce. Each immunoblot analysis has been repeated at least three times.

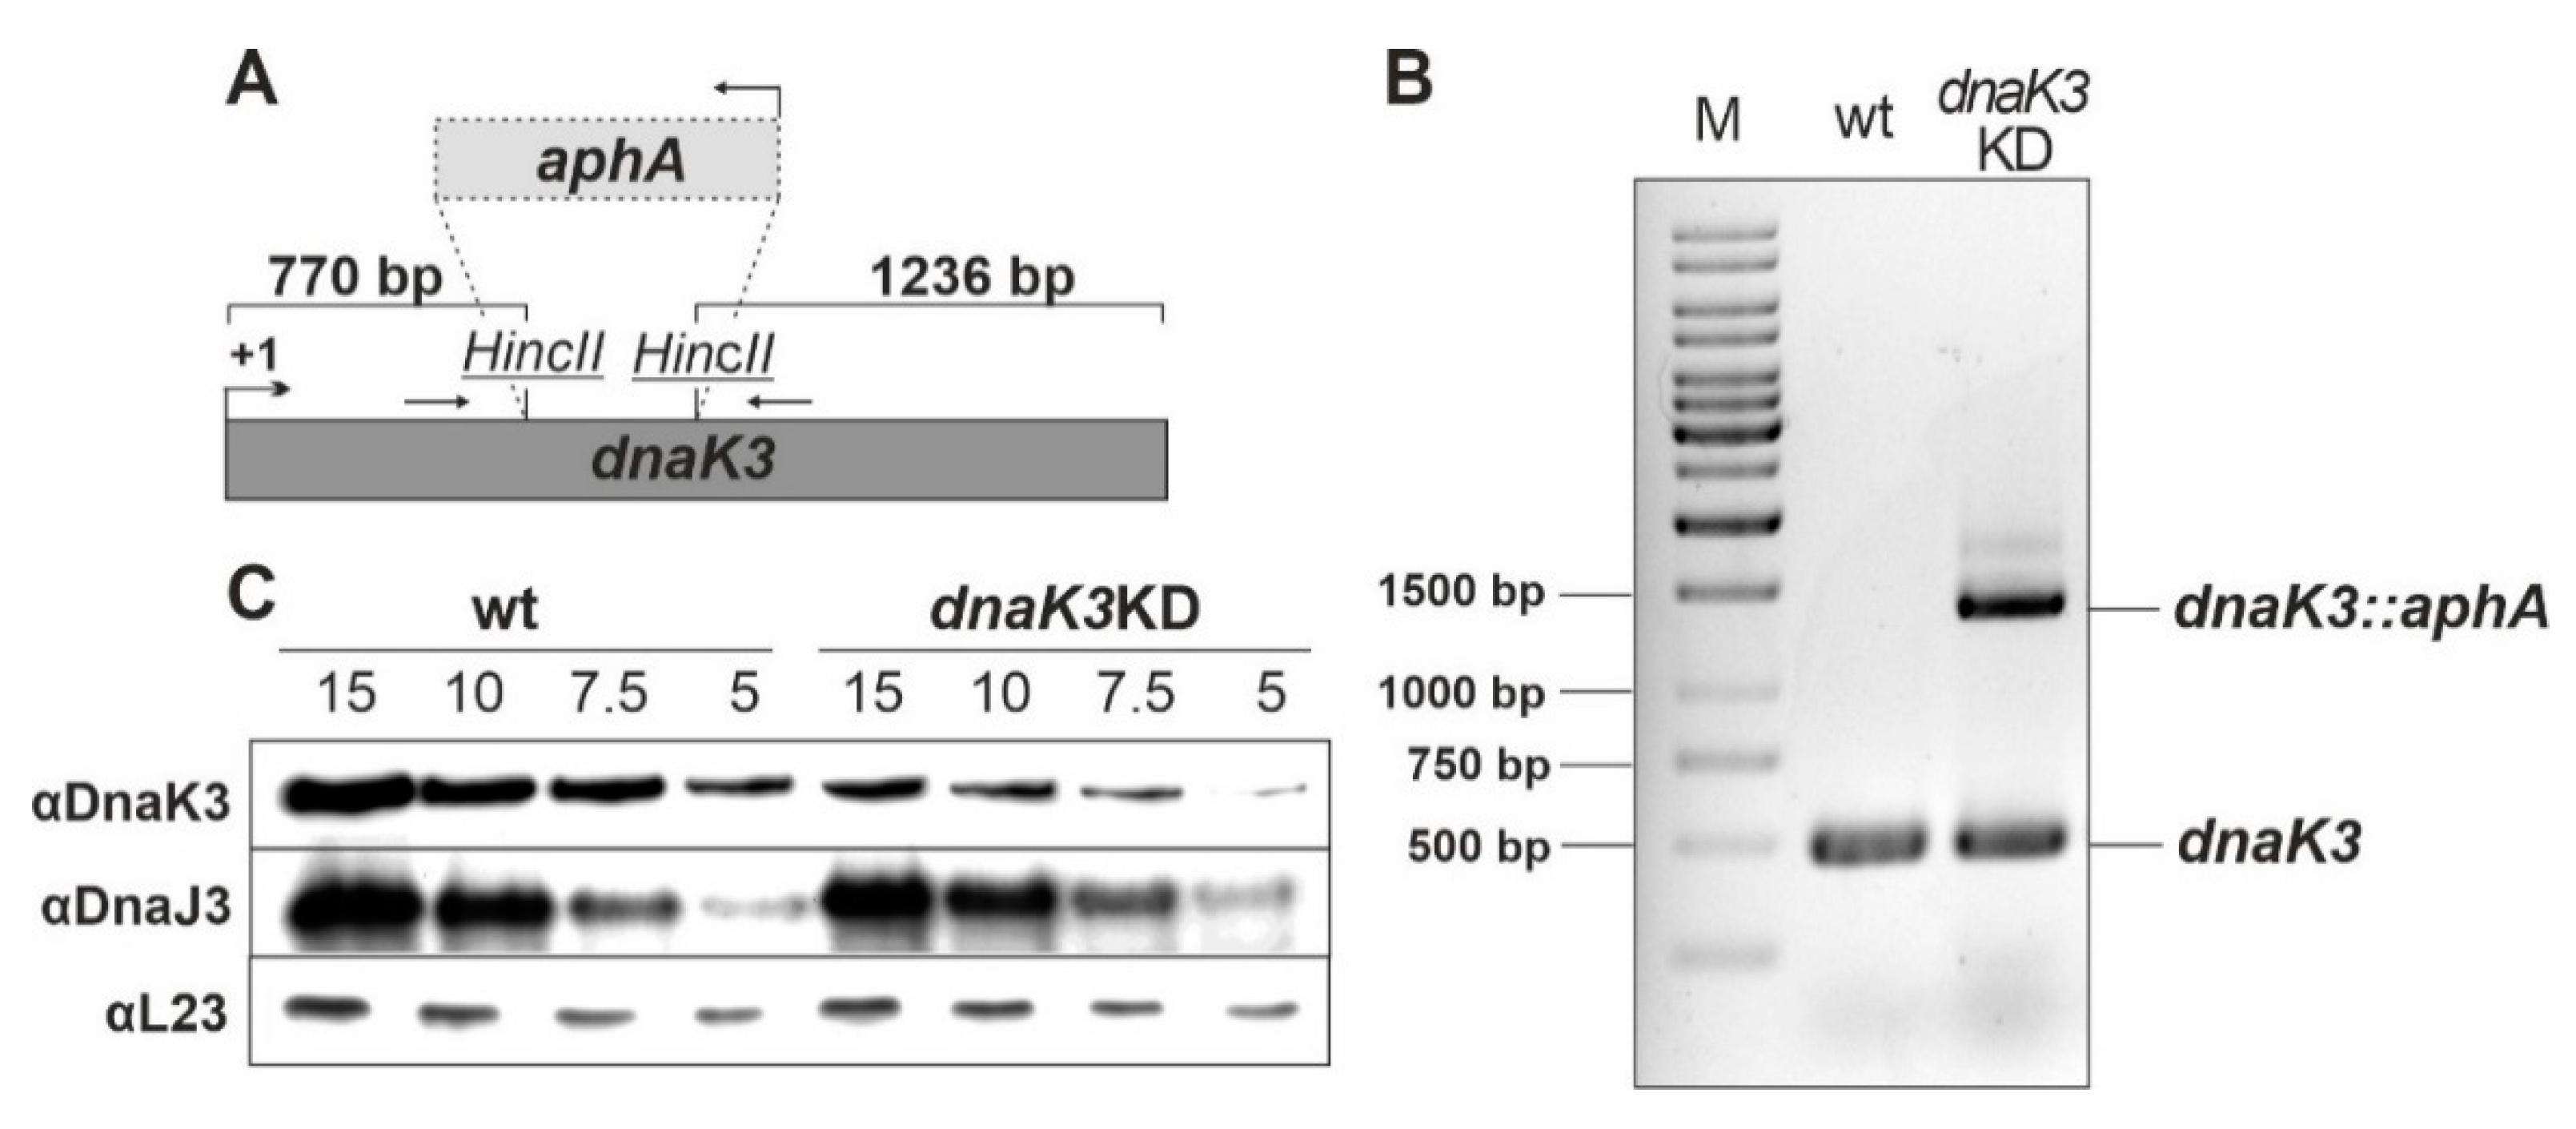
2.3. Complete Deletion of DnaK3 in Synechocystis Cells Grown under LAHG Conditions

To test whether DnaK3 is dispensable in the dark, the dnaK3KD strain [15] was cultivated in liquid BG11 medium under LAHG conditions and diluted if necessary. During each dilution step, the concentration of kanamycin was enhanced in the growth medium from 80 to 275 µg mL−1. To check whether the strain was completely segregated, genomic DNA was isolated and analyzed by PCR using the primers NtdnaK3check (5’-gtttttagaagcggagaaagtgg-3´) and CtdnaK3check (5´-cctttgggttggaaaccattgg-3´).

2.4. Cell Number and Chlorophyll Concentration Determination

Cell numbers were counted with a light microscope using a Thoma counting chamber. Chlorophyll concentrations were determined photometrically after methanol extraction [39].

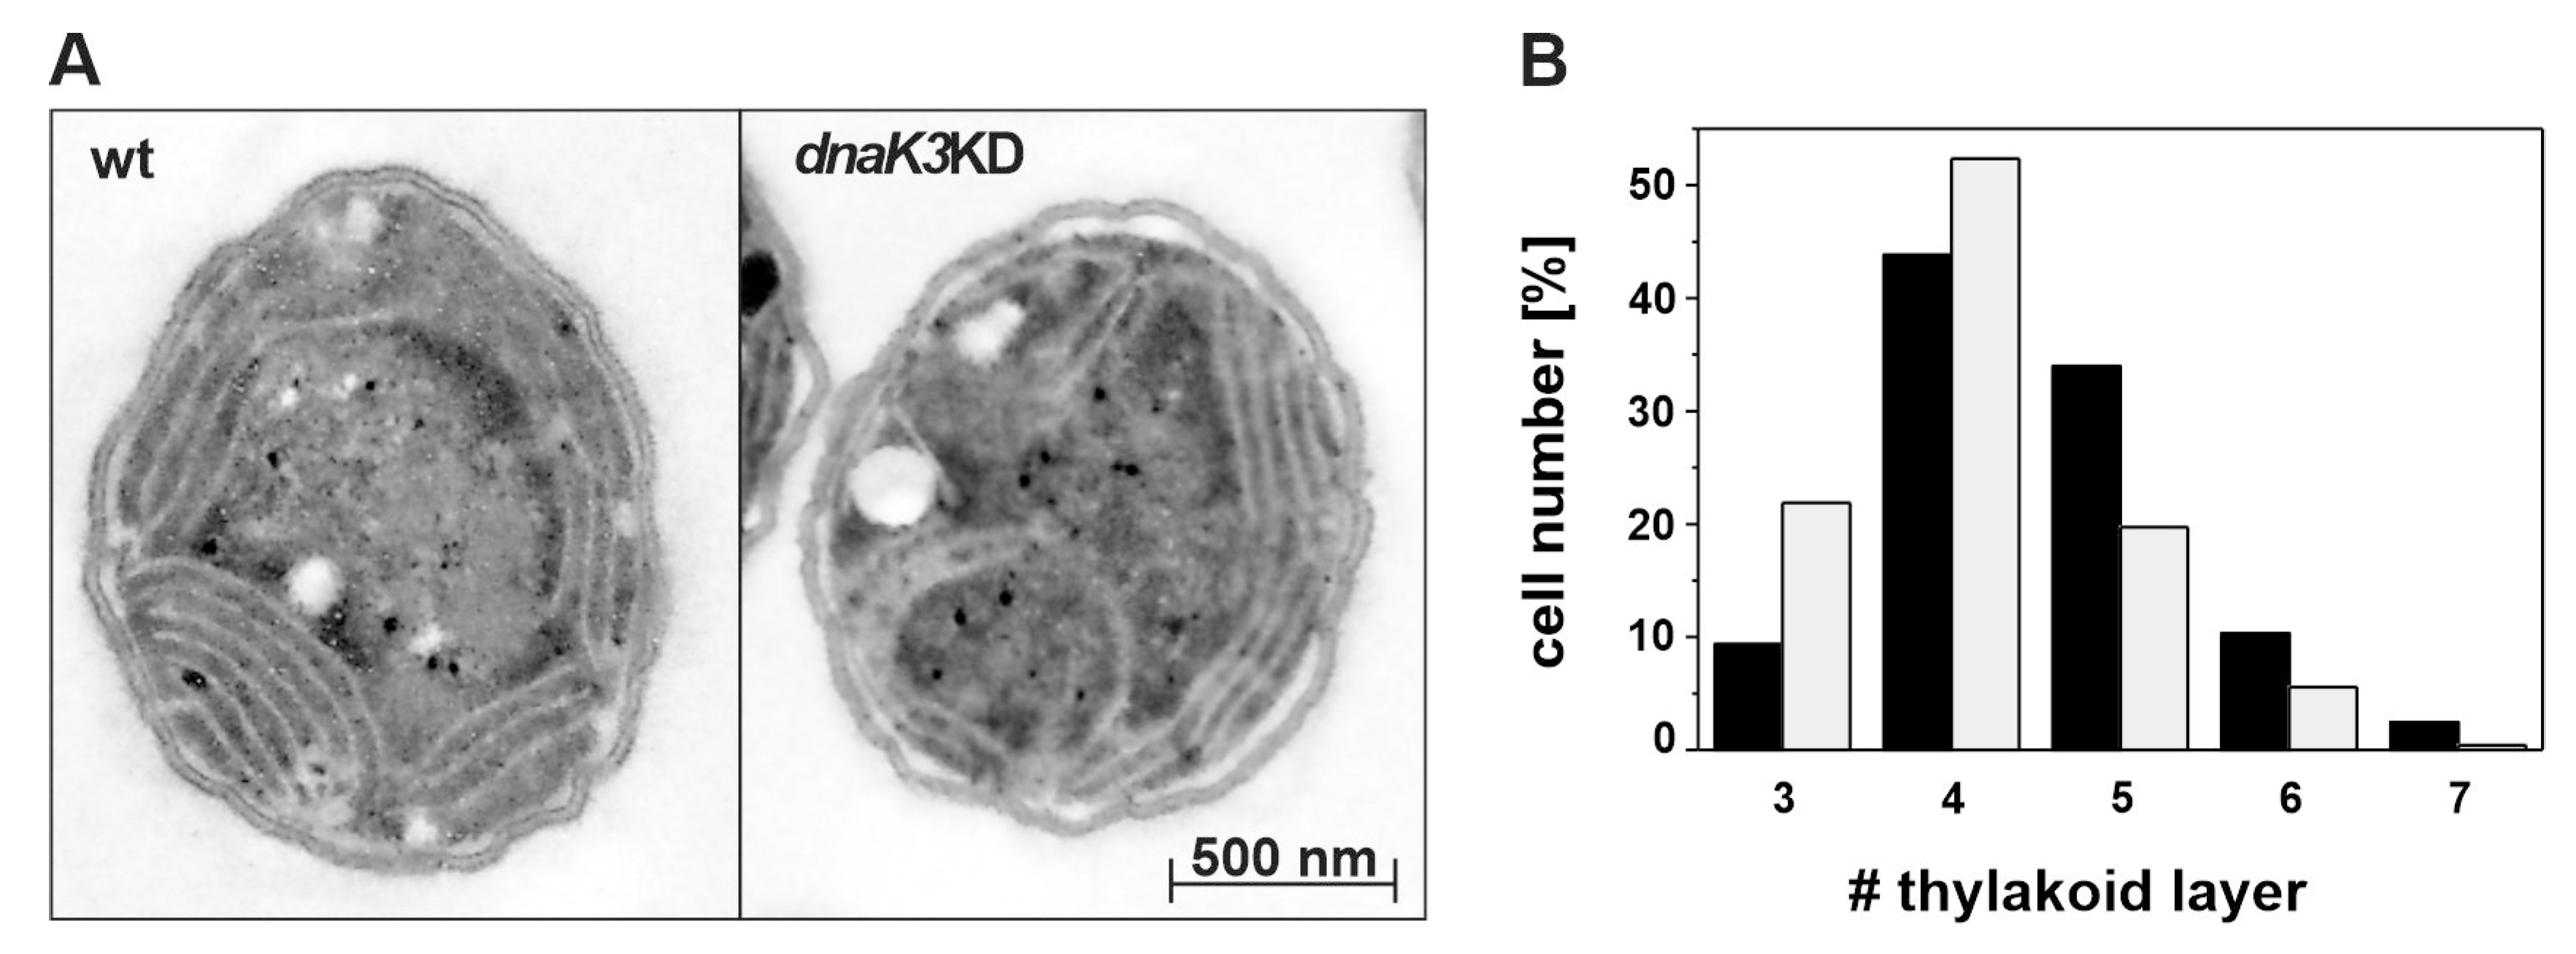
2.5. Electron Microscopy

To study the cell morphology of the different Synechocystis strains, cell pellets obtained from a 10 mL cell suspension were washed and resuspended in buffer (50 mM KH2PO4, pH 7). Ultrastructural investigations were performed as described previously [37]. The number of thylakoid layers per cell was determined, evaluating more than 200 individual cells of wt and the DnaK3 depleted Synechocystis strain, respectively.

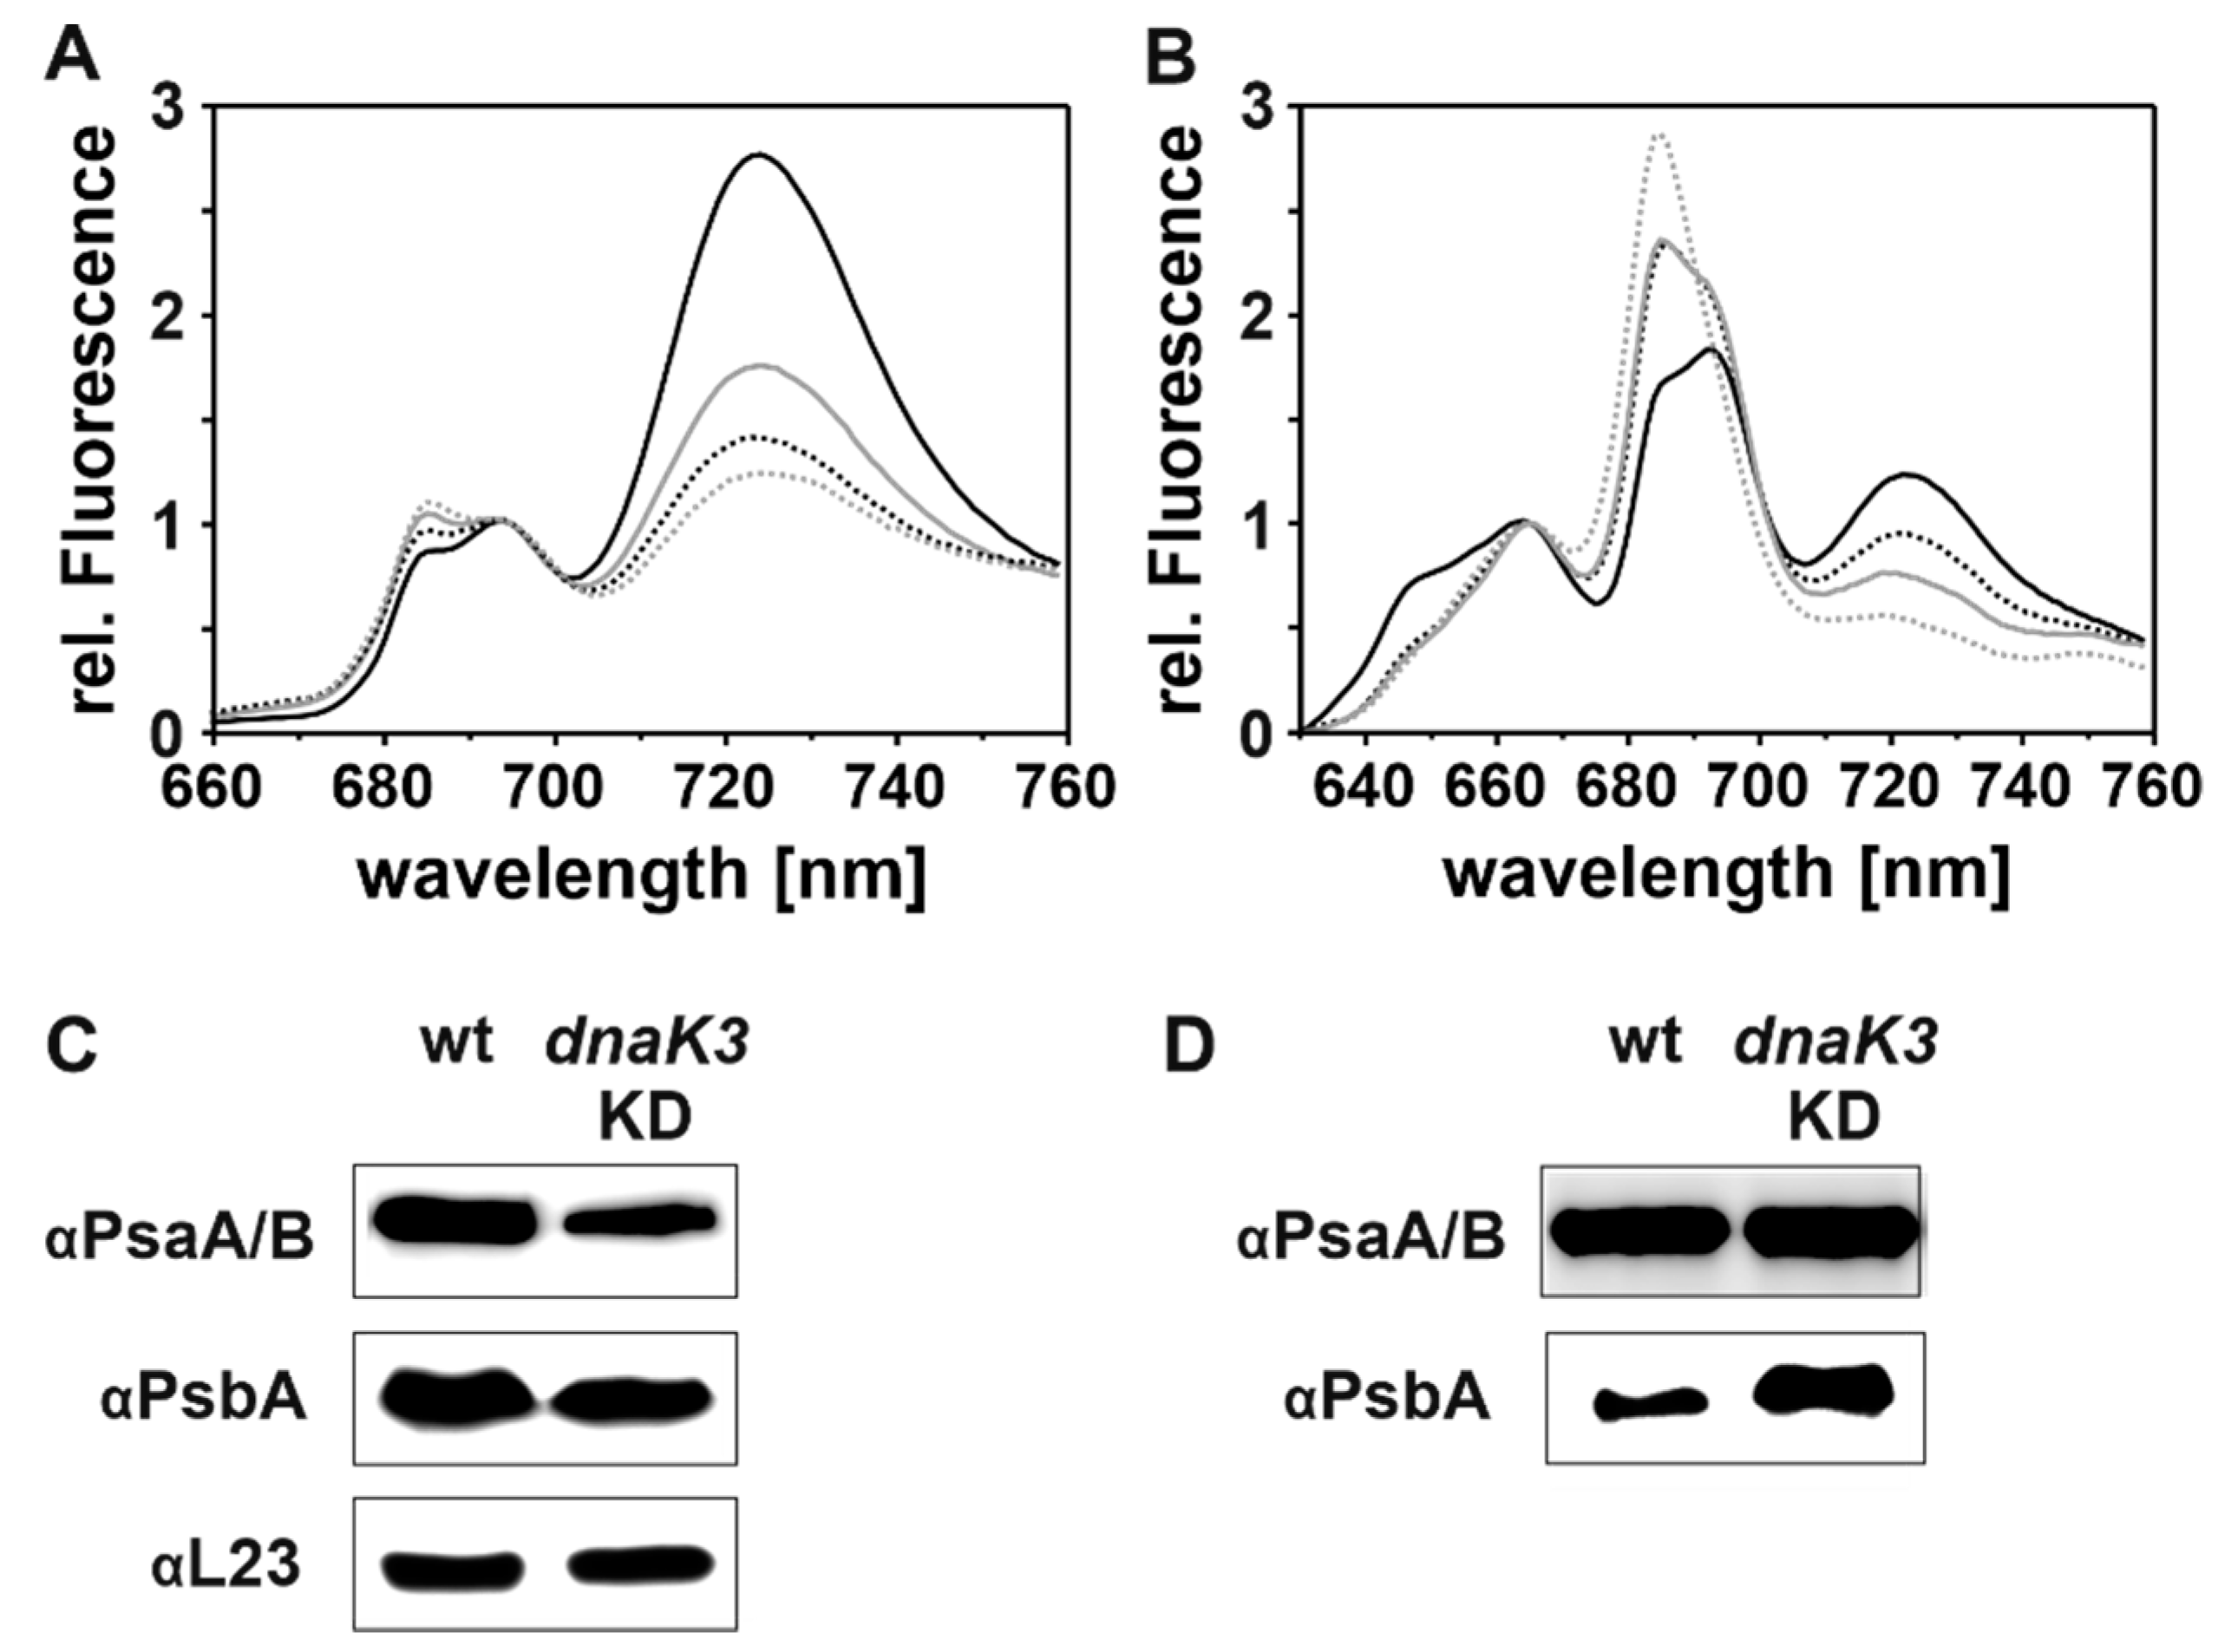
2.6. Absorbance and Low Temperature (77K) Fluorescence Spectra

Absorbance spectra of whole cells were recorded using a Perkin-Elmer Lambda 25 spectrophotometer equipped with an integrating sphere. Cell suspensions were adjusted to a constant value of 300,000 cells mL−1. Ratios of cyanobacterial chromophores were determined using the absorption ratio at 625/680 (phycocyanin/chlorophyll) or at 490/440 (carotenoids/chlorophyll).
Low-temperature (77 K) fluorescence emission spectra were recorded using an Aminco Bowman Series 2 spectrofluorimeter. Cultures were adjusted to a chlorophyll concentration of 3 µg·mL−1 in BG11 medium and frozen in liquid nitrogen. Chlorophylls were excited at 435 nm and phycobilisomes (PBs) at 580 nm. Fluorescence emission was recorded from 630 to 760 nm.

2.7. Oxygen Evolution

Oxygen production of the cell suspensions was determined in the presence of 500 µM phenyl-p-benzoquinone (PPBQ) using a fiber-optic oxygen meter (PreSens) under actinic light (600 µmol photons m−2·s−1). Prior to the measurement, the cultures were adjusted to a chlorophyll concentration of 3 µg·mL−1 in BG11 medium. For experiments in presence of a protein synthesis inhibitor, 100 µg·mL−1 lincomycin was added prior to illumination (1500 µmol photons m−2·s−1).

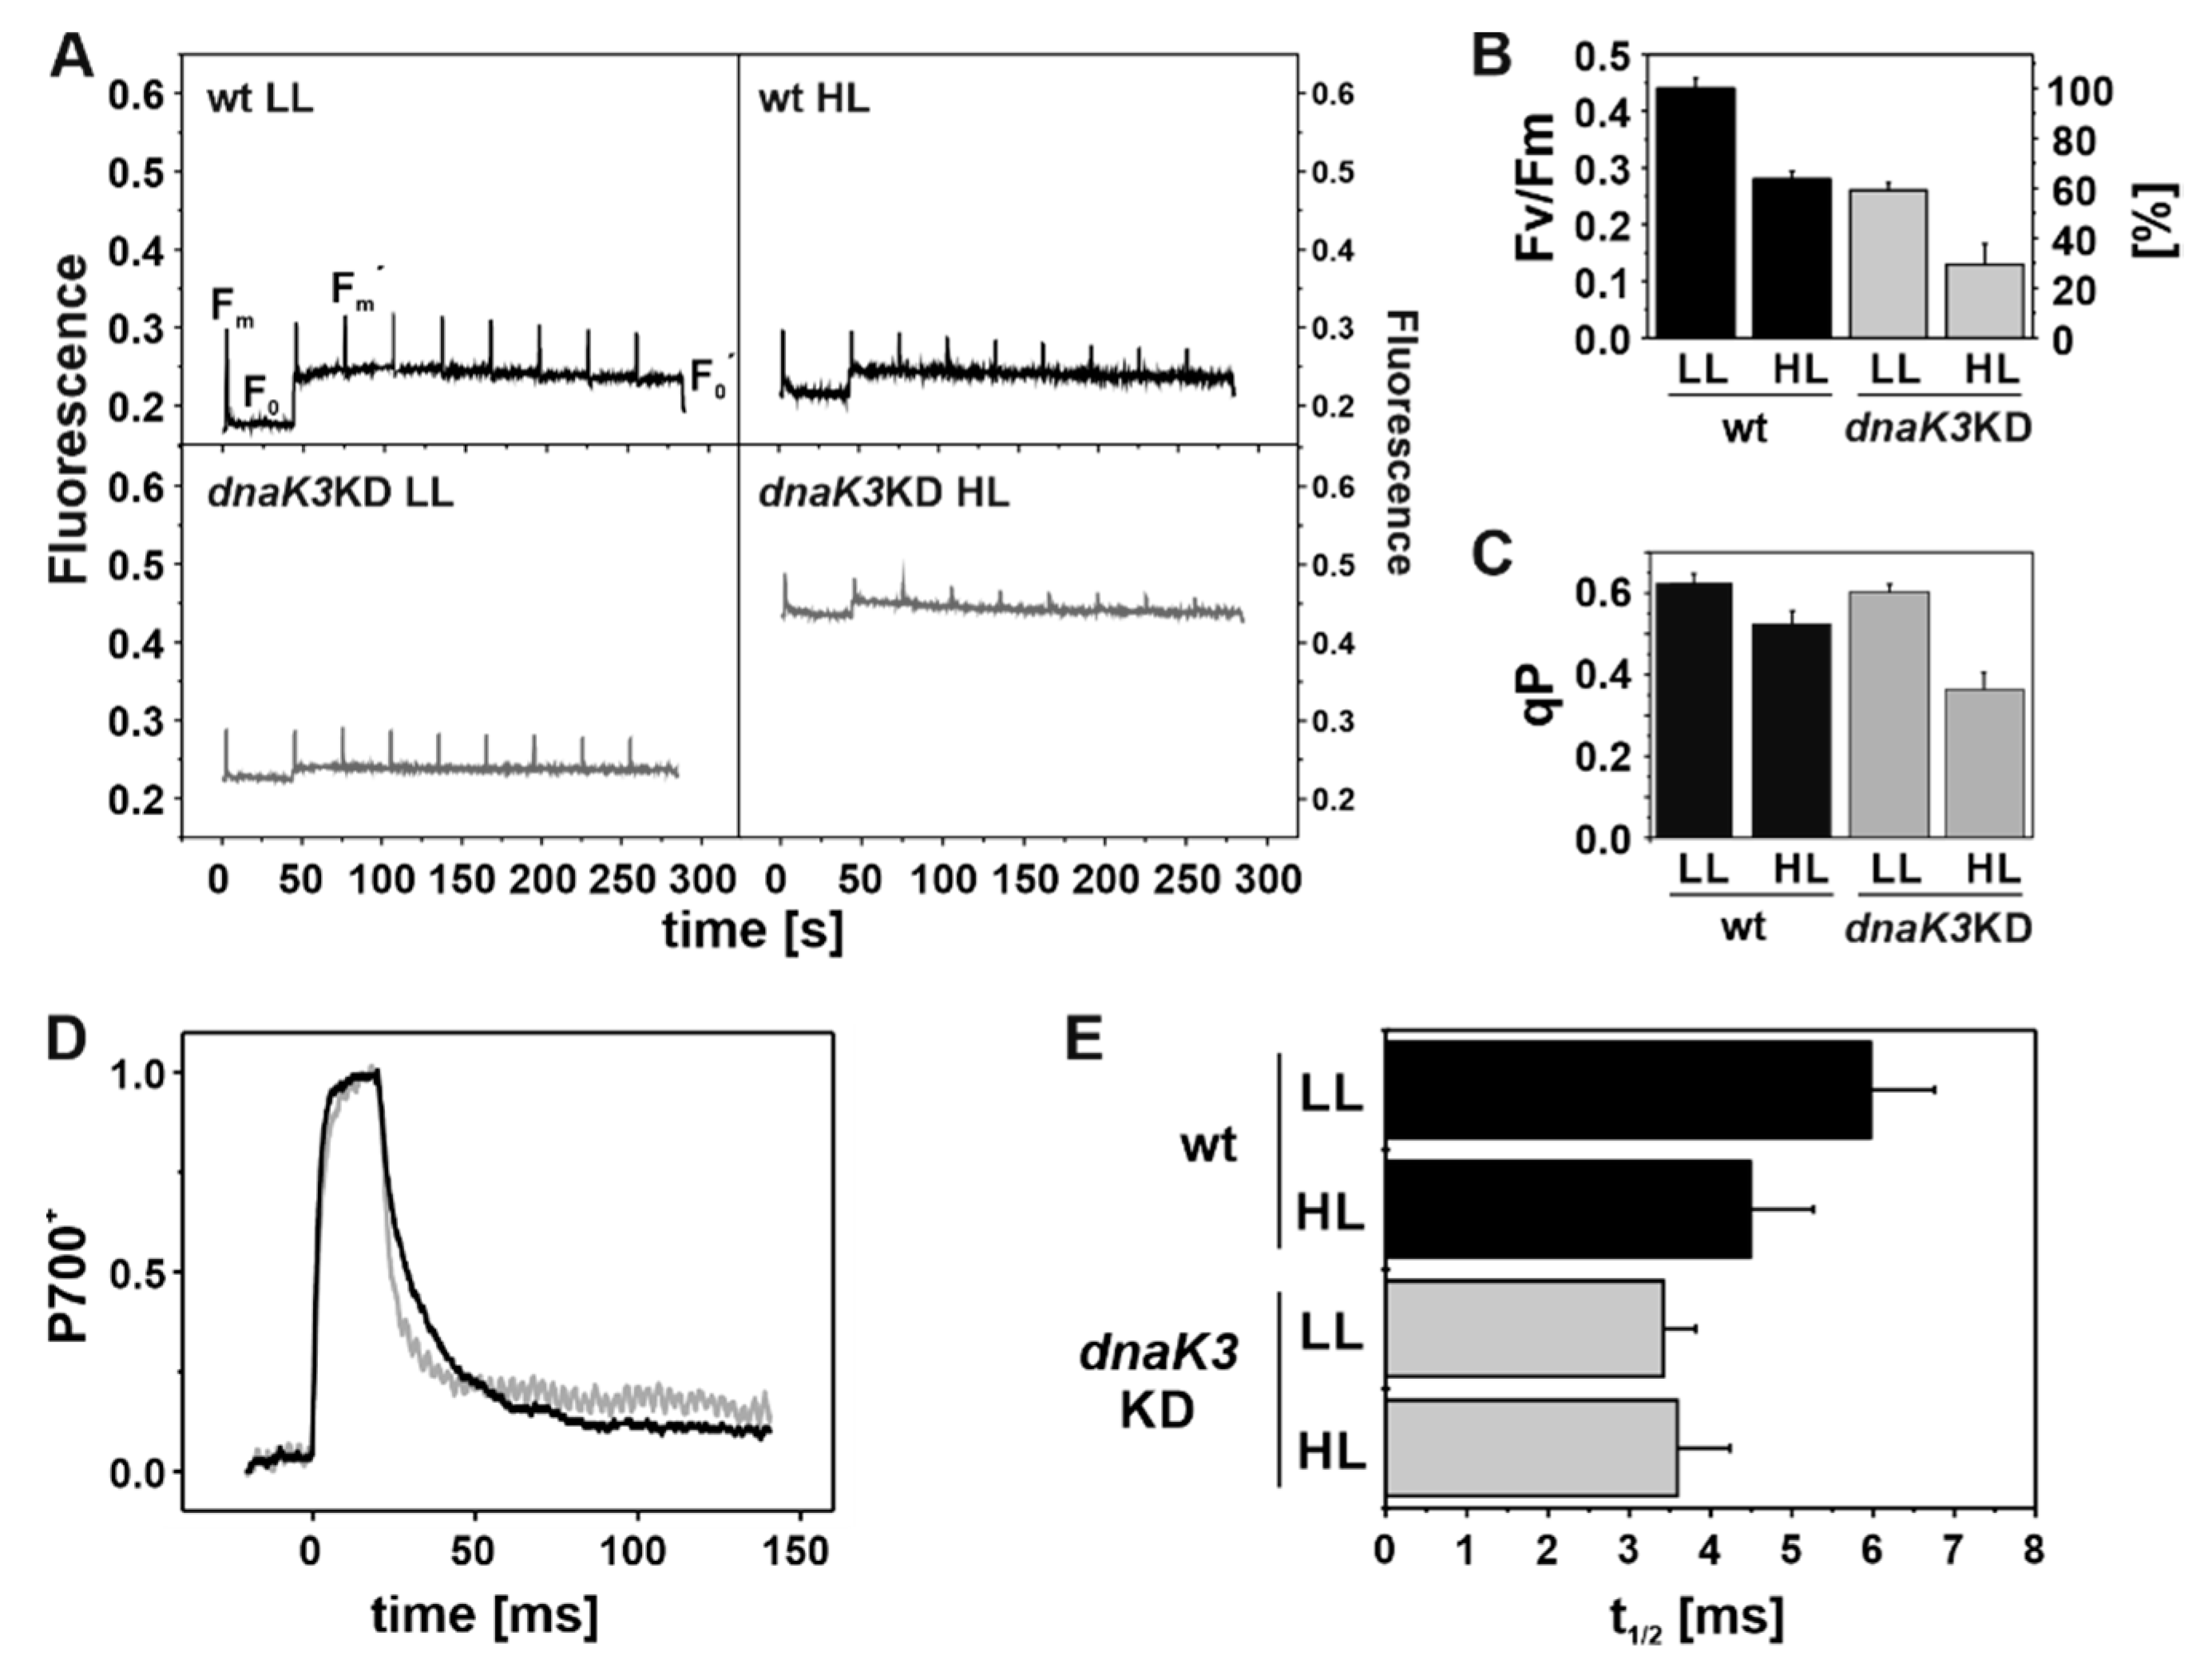
2.8. Chlorophyll Fluorescence Induction Curves

Cultures were adjusted to a chlorophyll concentration of 3 µg·mL−1 in BG11 medium, and subsequently fluorescence induction curves were recorded at room temperature, using a Dual-PAM-100 measuring system equipped with Dual-E and DUAL-DR modules (Heinz Walz GmbH). During the initial dark phase, background fluorescence was probed by weak measuring light (0.024 µmol photons m–2·s–1) and after 40 s fluorescence was induced by switching on red actinic light (95 µmol photons m–2·s–1). Saturating pulses (600 ms, 10.000 µmol photons m–2·s–1) were applied once during the dark phase and at 30 s intervals during the light phase, to obtain minimal (F0) and maximal (Fm and F) fluorescence values [40,41]. The coefficient of photochemical quenching of the PS II Chl fluorescence (qP) was calculated using the software routine for light induction measurements (qP = (Fm-Fm’)/(Fm-Fo’)) after 250 s illumination with red actinic light.

2.9. P700 Re-Reduction Kinetics

Re-reduction kinetics were recorded using a Dual-PAM-100 measuring system. P700 was first reduced by 10 sec far-red and then oxidized by a 20 ms saturation light pulse (10.000 µmol photons m–2·s–1). 15 individual re-reduction curves were recorded, averaged, and fitted with single exponential functions to determine decay halftimes (t1/2). Prior to the measurement, the different cultures were adjusted to a chlorophyll concentration of 3 µg·mL−1 in BG11 medium.

3. Results

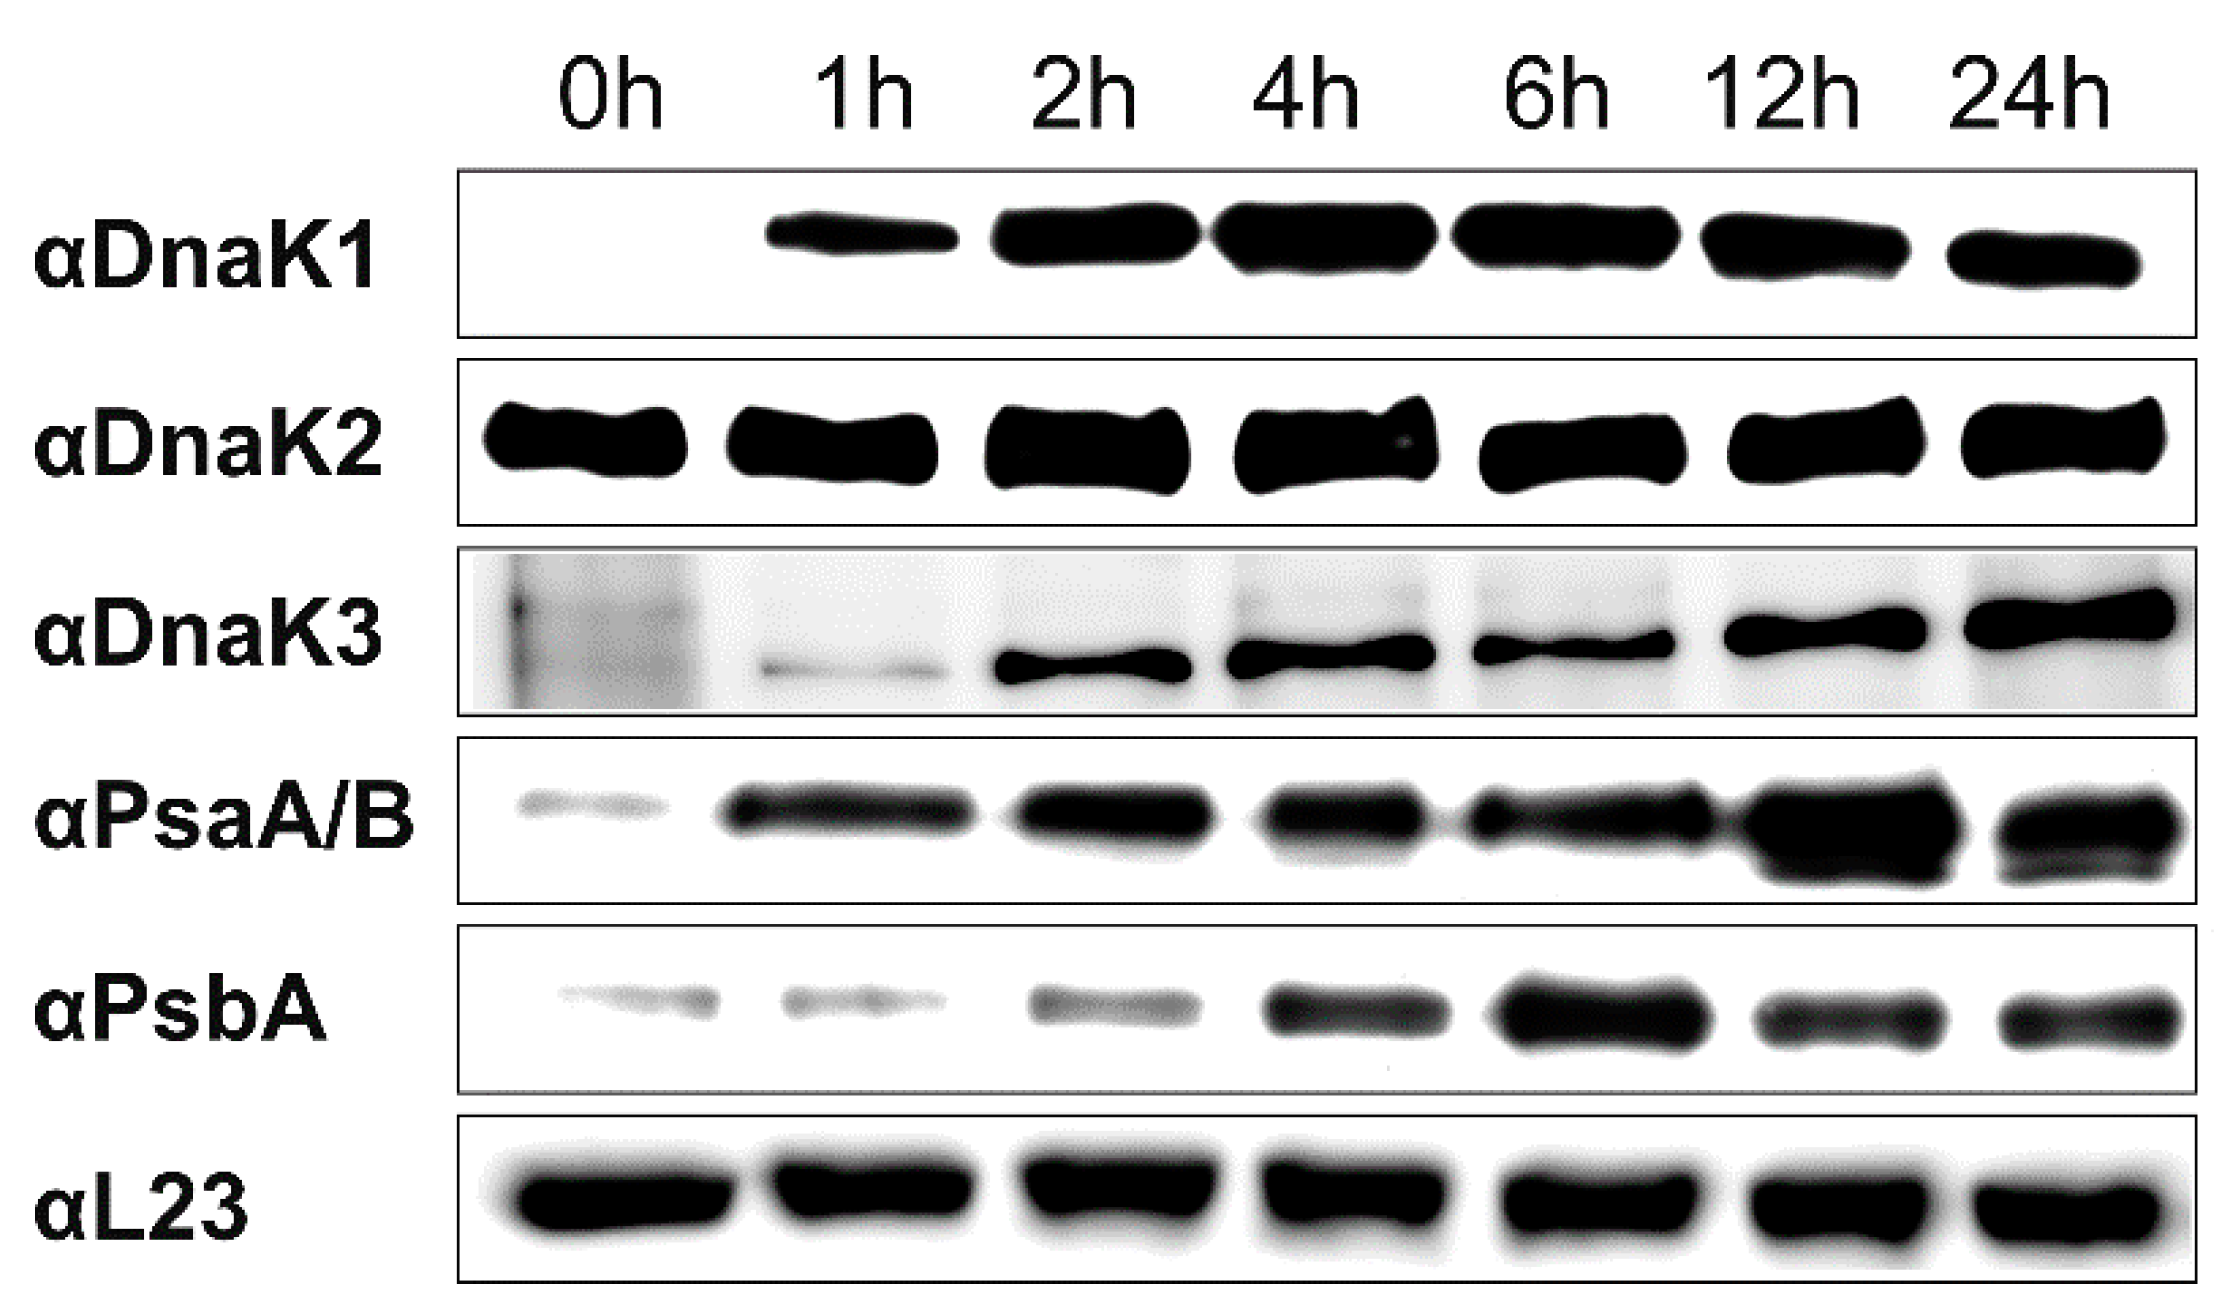
3.1. DnaK3 Synthesis is Light-Induced and Essential in the Dark

The Synechocystis dnaK2 and dnaK3 genes are essential in the light [15], and the DnaK1-3 proteins were detected by Western blot analyses in Synechocystis cells grown under constant illumination [15]. However, when Synechocystis cells were grown in the dark under LAHG conditions, the DnaK2 protein, but not DnaK1 and DnaK3, were detectable (Figure 1, 0 h). Yet, when dark-adapted cells were shifted into the light, the DnaK2 level did not substantially alter, whereas the DnaK1 level quickly increased until two hours after shifting the cells into the light. DnaK3 was detectable already after one hour, and its cellular content increased steadily. Thus, the synthesis of DnaK1 and DnaK3 clearly is triggered by light in Synechocystis.
Since DnaK1 is not essential for the viability of Synechocystis cells [15], we focused our subsequent analyses on DnaK3.
As DnaK3 is essential in the light [15], the observation of a light-induced DnaK3 synthesis indicated that DnaK3 might be dispensable in the dark. Therefore, we next attempted to completely delete the Synechocystis dnaK3 gene in cells grown in the dark under LAHG conditions. Yet, even after more than half a year of cultivation under LAHG conditions and increasing the kanamycin concentration in the growth medium up to 275 µg·mL−1, a fragment corresponding in size to the wild type (wt) dnaK3 gene was always detected via PCR in the dnaK3 knock-down (KD) strain in addition to the dnaK3 gene disrupted by the kanamycin resistance (aphA) cassette (Figure 2A,B). As Synechocystis contains multiple identical genome copies, this result indicates that some, but not all, of the genomic dnaK3 copies were deleted in the mutant strain. Thus, DnaK3 likely is essential not only in the light but also in the dark under LAHG conditions.
Yet, we recently showed that expression of dnaJ3 [25], which is organized in a gene cluster together with dnaK3, is essential in Synechocystis, and thus deletion of dnaK3 might have affected the expression of dnaJ3. To assess this potential polar effect, we also quantified the amount of the DnaJ3 protein in the dnaK3KD strain (Figure 2A). Since the DnaJ3 level was not decreased compared to the wt, we concluded that insertion of the aphA cassette into the dnaK3 gene locus did not dramatically affect the expression of dnaJ3. Nevertheless, a polar effect on expression of dnaJ3 cannot be completely excluded.
To quantify the relative cellular DnaK3 content in the dnaK3KD strain, total cellular extracts of the wt and the KD strain were analyzed via Western blots (Figure 2C). The intensity of each band was quantified using the Image J software and divided by the quantity of cellular extract loaded. Based on this analysis, the DnaK3 content was decreased by about 60% ± 10% in the dnaK3KD strain compared to the wt.

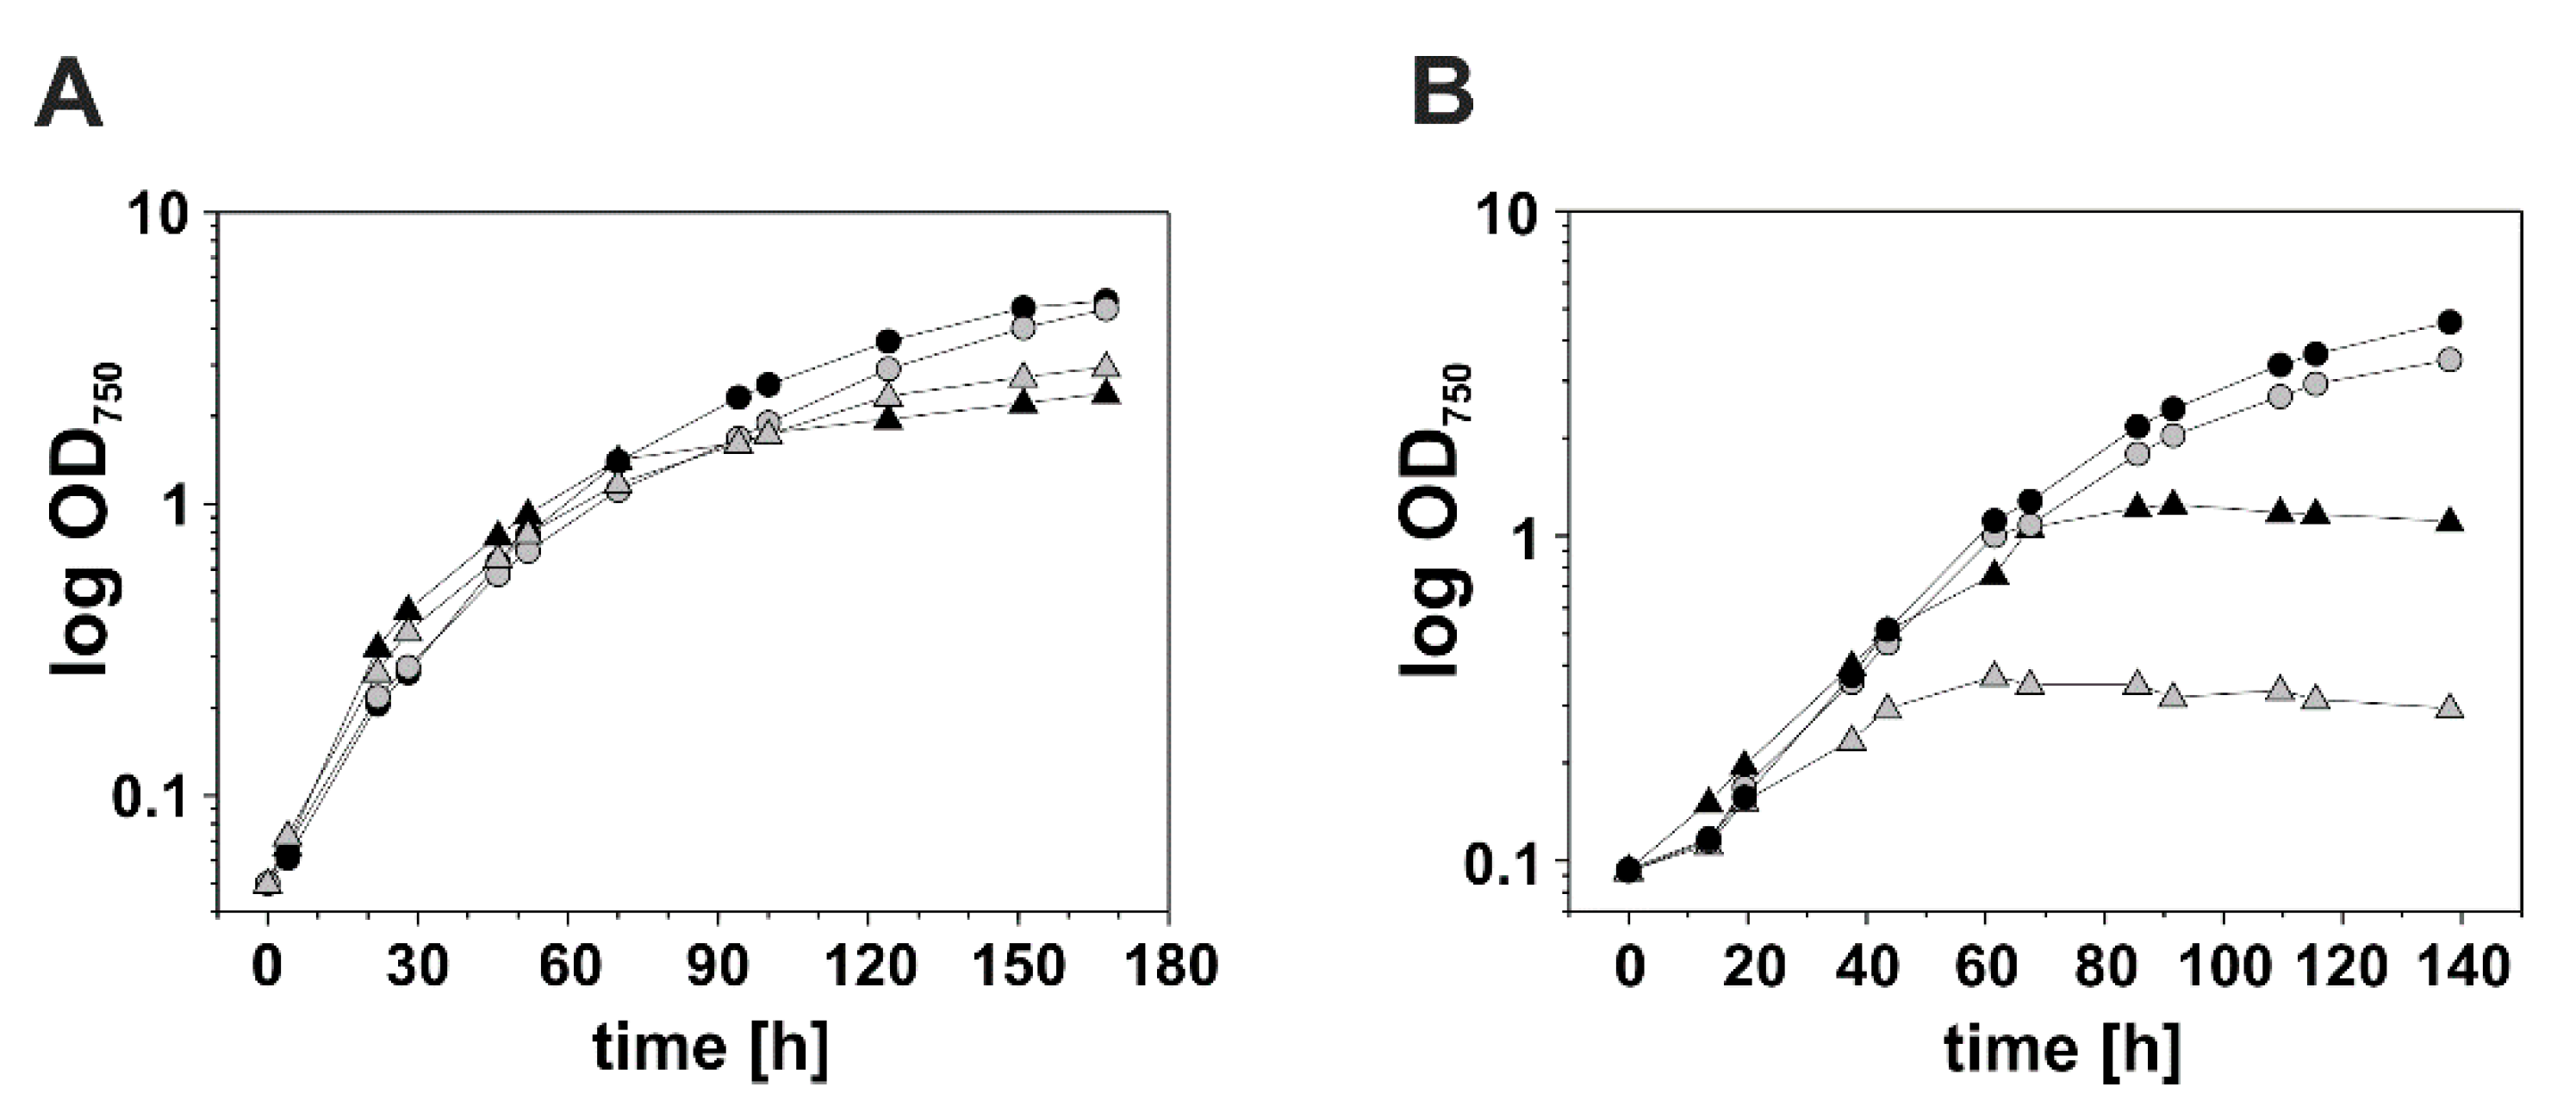
3.2. Reducing the DnaK3 Content Affects Cell Growth under Heat Stress Conditions

Next, we tested whether reducing the DnaK3 content affects growth of the mutant strain under low (LL) or high light (HL) growth conditions, respectively (Figure 3A). The dnaK3KD and the wt cells had comparable doubling times of 11.2 h ± 0.1 (wt) and 11.1 h ± 0.2 (dnaK3KD), and of 8.1 h ± 0.5 (wt) and 9.4 ± 1.2 (dnaK3KD) under LL and HL growth conditions, respectively. Thus, reducing the cellular DnaK3 content does not severely affect the growth of Synechocystis cells, at least not under standard laboratory growth conditions. Subsequently, growth of the dnaK3KD strain was tested under various stress conditions (involving low pH, low temperature, oxidative and osmotic stress; data not shown), but solely increasing the temperature to 42 °C resulted in an obvious growth defect of the mutant strain, with doubling times of 26.4 ± 3.5 h (dnaK3KD) and 17.9 ± 0.4 h (wt) (Figure 3B). This observation classifies DnaK3 as a traditional Hsp70 involved in heat-stress responses.

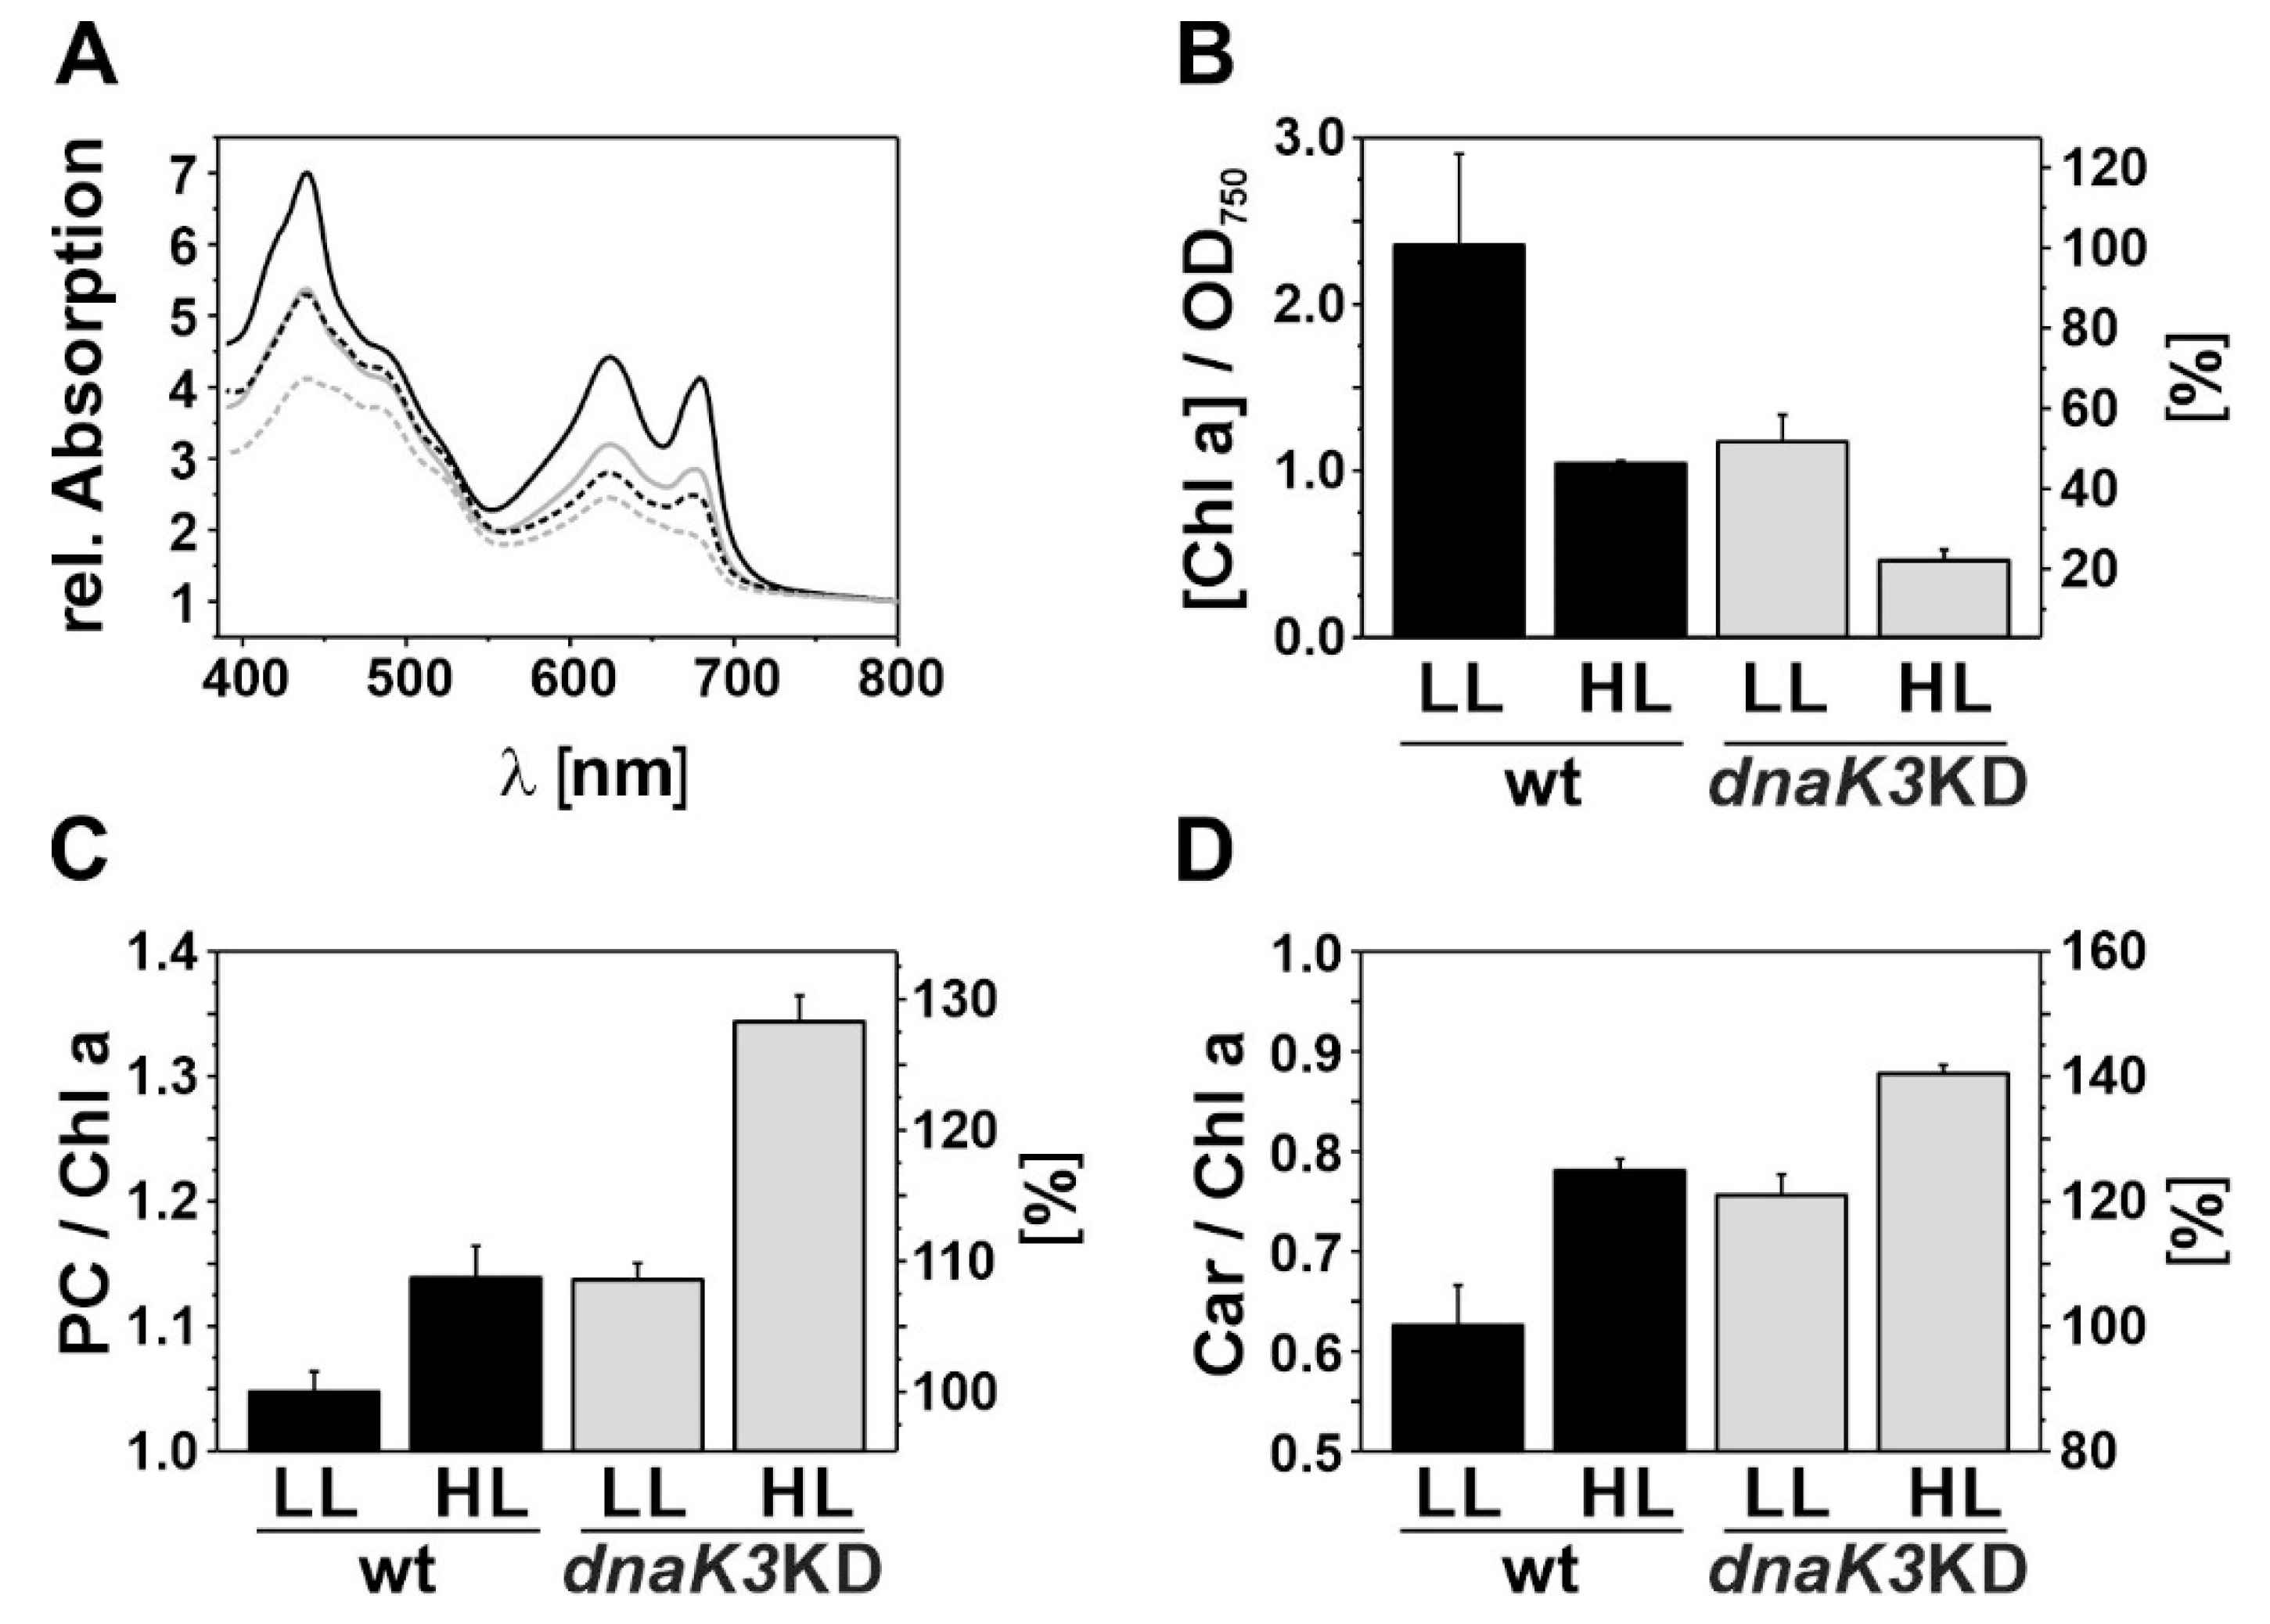
3.3. The dnaK3KD Strain Has a Reduced Pigment Content

Photosynthesis is one of the most temperature-sensitive processes in phototrophic organisms and the photosynthetic activity is further impaired when heat-stress is combined with HL [42,43]. Thus, it was well possible that reducing the DnaK3 content affects photosynthetic processes in Synechocystis.
As expression of dnaK3 is light-controlled (Figure 1), we subsequently analyzed the pigment content of the wt and dnaK3KD strains after cultivation under LL and HL conditions, respectively. Adaptation of Synechocystis cells to HL conditions is typically accompanied by a reduction in the cellular amount of the two PSs, a decreased PS I-to-PS II ratio and a reduced chlorophyll (Chl) content per cell [44,45].
An overall reduction of the pigment content was observed under HL growth conditions when equal amounts of cells were analyzed (Figure 4A). The Chl content was reduced to about half (Figure 4B) and the relative content of plastocyanine (PC) (Figure 4C) and carotenoids (Car) (Figure 4D) were both increased. It has to be noted that while the contents of Chl, PC and Car were decreased under HL growth conditions (Figure 4A), the PC/Chl as well as the Car/Chl ratios were increased in the wt strain, due to the more severely decreased Chl content (Figure 4A,B). Even though light scattering could have contributed to some extent to the determined (absolute) absorbance values used in these analyses, these data clearly show the ability of the wt to reduce the overall pigment content and to adapt it to HL conditions.
Similarly, the dnaK3KD strain adapted to changing light conditions and reduced its pigment content as expected when grown under HL conditions. However, the dnaK3KD strain exhibited a severely reduced pigment content already when grown under LL conditions, and the Chl content as well as the pigment ratios were very similar to the ones observed when the wt was grown under HL conditions (Figure 4).
Besides the obvious differences in pigmentation, the TM structure was mostly unaffected, and we only observed a slightly reduced number of TM pairs in the mutant strain when the ultrastructure of Synechocystis grown under LL growth conditions was analyzed via electron microscopy (Figure 5).

3.4. Reducing the DnaK3 Content Results in an Altered PS I-to-PS II Ratio

Next, the relative amounts of PS II and PS I in the DnaK3 reduced strain were determined via 77 K fluorescence spectroscopy (Figure 6A). Upon chlorophyll excitation at 435 nm, characteristic fluorescence emission maxima were detected at 721 nm (PS I), at 684 nm (CP43, PS II) and 693 nm (CP47, PS II).
Synechocystis wt cells grown under HL conditions showed a decreased PS I-to-PS II ratio compared to LL-adapted cells (Figure 6A), which is a well-documented long-term adaptation to HL [44,46,47]. In contrast, dnaK3KD cells had a considerably decreased PS I-to-PS II ratio already under LL growth conditions. This finding is also supported by a Western blot analysis. When an identical quantity of protein was loaded, the Western blot shows that PS core subunits PsaA/B (PS I) and PsbA (PS II) are less abundant in the dnak3KD strain (Figure 6C). When the cell extracts were normalized based on the Chl concentration (Figure 6D), no difference in the band intensity was observed in case of PsaA/B, since in Synechocystis about 85% of the Chl is bound to PS I (assuming a PS I/PS II ratio of 2.5 [48], 96 chlorophylls per PS I [49], and 35 chl per PS II [50]). However, the PsbA band was more pronounced in the mutant strain when compared to the wt, which further supports the decreased PS I-to-PS II ratio in this strain. The decreased PS I-to-PS II ratio decreases even further when cells were shifted into HL (Figure 6A).
However, at LL as well as at HL conditions, an increased relative fluorescence emission was observed at 684 nm (λex = 435nm) in the mutant strain (Figure 6A). This fluorescence emission maximum originates from PS II as well as from the PBSs terminal emitter LCM [51], and thus indicates an increased relative phycobiliprotein content, as already observed in the absorbance measurements (Figure 4A,C). Yet, the increased PBSs fluorescence emission at 684 nm is solely observed when PBSs are uncoupled and do not transfer the harvested light energy to the PSs [51,52]. Thus, to next assess energy transfer from PBSs to PS II, phycobiliproteins were excited at 580 nm and energy transfer to PS II was followed. When PBSs are coupled to PS II, light energy harvested by the PBS is transferred to PS II, resulting in quenching of the PBS fluorescence [53,54]. As can be seen in Figure 6B, upon PBS excitation an increased fluorescence emission at 684 nm (PBSs plus PS II) was observed but not at 693 nm (PS II) (Figure 6B). Thus, the dnaK3KD strain indeed contains an increased amount of uncoupled PBSs compared to the wt.
The decreased fluorescence emission at 721 nm results from the decreased PS I content (Figure 6A) and most likely not from light-dependent energy distribution via state transitions, which is supposed to be physiologically important solely under LL growth conditions [55,56].
Taken together, the fluorescence spectra and the Western blot analyses reveal that the mutant has a generally decreased PS content, with a decreased PS I-to-PS II ratio and an increased amount of uncoupled phycobiliproteins. However, the mutant strain still adjusts the PS I-to-PS II ratio to changing light conditions, as observed for the wt strain.

3.5. The Photosynthetic Activity is Impaired in the DnaK3 Depleted Strain

Next, the photosynthetic activity of the mutant strain with a reduced DnaK3 content was studied in greater detail. By measuring oxygen evolution rates in presence of PPBQ, the activity of PS II can be specifically determined (Figure 7A,B). When adapted to HL growth conditions, the O2 evolution rate per cell (OD750) was reduced in the wt strain compared to LL growth conditions (Figure 7A), in line with the observation that the light-harvesting capacity is generally reduced in cyanobacterial cells under HL conditions [57]. In contrast to wt cells, the dnaK3KD strain showed a dramatically decreased O2 evolution rate already under LL conditions, when compared to the wt, and the activity decreased even further under HL conditions (Figure 7A). However, when the O2 evolution rates were normalized to the Chl content, the O2 evolution rate remained essentially stable in the wt, regardless of the light conditions (Figure 7B). In contrast, the O2 evolution rate was only marginally lower for the mutant strain under LL growth conditions than for the wt, but dramatically decreased under HL growth conditions. Thus, in contrast to the wt, the decreased O2 evolution in the mutant strain is not only a consequence of the decreased cellular Chl content (Figure 4B), since the O2 evolution rate was also drastically decreased when the measurements were normalized to the Chl content (Figure 7B).
To test whether reducing the DnaK3 content somehow impairs PS II repair, we next determined O2 evolution rates under extreme HL conditions (1500 µmol photons m−2·s−1) in presence or absence of lincomycin, a protein synthesis inhibitor that has already been successfully used to block the PS II repair cycle in Synechocystis [58,59]. In absence of lincomycin, the wt strain did not show any changes in the PS II activity under constant extreme HL illumination, i.e., the wt cells harbor an effective PS II repair cycle (Figure 7C). However, in presence of lincomycin, the PS II activity constantly decreased when cells were illuminated with extreme HL (Figure 7D). The decreasing PS II activity, i.e., an impaired PS II protection and/or repair, can be observed for both the wt and the dnaK3KD strain in presence of lincomycin (Figure 7D). However, in absence of lincomycin, the PS II activity was already lower in the dnaK3KD than in the wt strain after 10 min of illumination and constantly decreased further to about 50% after 1 h of illumination, whereas the wt activity remained about constant (Figure 7C). Thus, PS II repair clearly is severely impaired in dnaK3KD cells, albeit the amount of expressed D1 protein did not alter (inlet in Figure 7C). Thus, PS II protection and/or repair is affected especially under light-stress conditions.
The photochemical efficiency of PS II can be specifically assessed using pulse amplitude modulated (PAM) fluorescence measurements. Therefore, dark/light induction curves were recorded (Figure 8A). A minimal fluorescence (F0) is visible due to the measuring light, which, however, is not strong enough to stimulate photosynthetic electron transfer. Subsequently, a pulse of intense white light is given to reduce all PS II reaction centers, resulting in maximal fluorescence (Fm). The parameter Fv/Fm (Fv = Fm − Fo) is used to describe the maximal photochemical efficiency (Figure 8B) [60].
After switching on actinic light, an increased background fluorescence was detected, and PS II centers became photosynthetically active (Figure 8A). Saturating light pulses resulted in a lowered Fm´ compared to the maximal fluorescence Fm measured in the dark, due to non-photochemical quenching processes [61]. An apparent increase of the absolute F0 background fluorescence was measured for wt cells grown under HL conditions compared to LL and for the dnaK3KD cells (grown under either condition), indicating a more reduced plastoquinone (PQ) pool (Figure 8A). However, determining F0 and F0´ is somewhat problematic in cyanobacteria, as the PBS fluorescence can in part also contribute to the determined F0 fluorescence value [62], and thus discussion of solely F0 values is difficult. Hence, we also present the normalized coefficient of photochemical quenching of PS II Chl fluorescence (qP), which is not significantly biased by PBSs fluorescence [63]. qP is defined as 1 in the dark-adapted state and may decrease to 0 when all PS II centers are closed. In line with Figure 7B, in the wt strain slightly less PS II centers are open under HL conditions compared to LL. In the mutant strain, qP is similar to the wt under LL conditions, yet the value was dramatically decreased when dnaK3KD cells were grown under HL conditions, indicating an increased amount of closed PS II centers. Thus, the dnaK3KD strain can hardly cope with high light treatment. This observation is in excellent agreement with the determined O2 evolution rates (Figure 7), showing an impaired PS II protection and/or repair cycle.
P700+ re-reduction measurements allow determining the time needed to re-reduce the oxidized PS I reaction center P700+, which is not only affected by the PS I activity but also by the redox state of the electron transport chain (Figure 8D,E). The P700+ absorbance signal increased when a saturating light pulse, which completely oxidized P700, was given and subsequently decreased due to P700+ reduction by PC (Figure 8D). The halftime of the re-reduction kinetic was determined by fitting the changes in the absorbance signal with a single exponential function (Figure 8E). A faster re-reduction rate was observed for wt cells when cells were grown under HL compared to LL conditions, which likely originates from the reduced PS I content and the decreased PS I-to-PS II ratio (Figure 6 and Figure 8). In contrast, the dnaK3KD mutant strain had reduced re-reduction halftimes under both tested light conditions, and the halftimes were identical, regardless of the light condition (Figure 8E). The reduced re-reduction halftimes can be explained by a more reduced PQ-pool and thus nicely support the conclusions drawn from the results shown in Figure 6 and Figure 8. Together, these results demonstrate that the activity of PS II, but not of PS I, is impaired in the dnaK3KD mutant strain.

4. Discussion

Three different DnaK proteins are expressed in the cyanobacterium Synechocystis sp. PCC 6803. While two of the cyanobacterial DnaK proteins, DnaK2 and DnaK3, are essential, solely DnaK2 can be classified as a canonical Hsp70 protein, expression of which can largely alter under various stress conditions [24,64,65]. In contrast, the DnaK3 chaperone of Synechocystis has been suggested to be specifically involved in biogenesis and/or maintenance of TMs [16,25]. However, thus far this assumption was essentially exclusively based on the observations that (i) DnaK3 is attached to TMs and (ii) DnaK3 is encoded in all cyanobacterial genomes, except in Gloeobacter violaceus, the only cyanobacterium that does not contain an internal TM system [15,29].
Albeit the cellular DnaK3 content clearly is light-regulated (Figure 1), a basal DnaK3 level appears to be required for survival of Synechocystis cells not only in the light but also under LAHG conditions (Figure 2), where cells still have rudimentary TMs. Based on the CyanoExpress database the dnaK3 transcript level does not appear to adjust to changing light conditions in Synechocystis [66] or in Synechococcus sp. PCC 7942 [16]. Thus, (light-dependent) DnaK3 synthesis likely is post-transcriptionally regulated, as common in cyanobacteria [67,68].
A general decrease in the PS and PBS content per cell as well as a selective down-regulation of PS I is crucially involved in the adaptation of Synechocystis cells to HL conditions [46,67]. All these (expected) adjustments were observed when the Synechocystis wt strain was shifted from LL to HL growth conditions (Figure 6 and Figure 7). Also, in case of the mutant strain, typical HL-adaptation processes were observed, although the light-induced changes were far less pronounced, since the mutant strain already exhibited characteristics of an HL-stressed strain under LL growth conditions. While in the dnaK3KD strain the relative PS I content was reduced and the PS I-to-PS II ratio per cell was lower than in the wt (Figure 6), PS I appears to function normally when DnaK3 was depleted, because re-reduction of PS I was even faster in the mutant strain (Figure 8E), most likely due to the more reduced PQ-pool, which also results in a significant amount of the PBSs being detached from PS II (Figure 6B).
Yet, the activity of PS II was clearly reduced in the mutant strain (Figure 7 and Figure 8). A significant amount of PS II was inactive, potentially due to increased photodamage and/or impaired repair (Figure 7 and Figure 8). Thus, DnaK3 likely is involved in PS II biogenesis and/or repair. In line with this assumption, expression of the Synechocystis dnaK3 gene was found being enhanced under UV-B stress [68]. Furthermore, the PS II core subunit D1 was proposed to be a substrate for DnaK3, which potentially guides the nascent polypeptide at the ribosome to the TM, where translation is completed [16]. The D1 protein is known to be especially susceptible to photodamage, and photodamaged D1 is rapidly degraded and replaced by newly synthesized protein to maintain a certain level of active PS II centers in cyanobacteria [33]. Thus, the here presented results clearly indicate that biogenesis and/or repair of PS II is impaired when the cellular DnaK3 content is reduced.
However, the observation that DnaK3 appears to be vital also in the dark (Figure 2), where PS II is inactive [7] and the finding that D1 is not essential for survival of Synechocystis under photoheterotrophic conditions [69] indicates that DnaK3 likely has additional physiological functions beyond PS II protection and/or repair. In cyanobacteria, TMs also contain the complexes of the respiratory e-transfer chain [70], and the indications of an over-reduced PQ pool (Figure 6 and Figure 8) suggests that other proteins and protein complexes are also affected when the DnaK3 content is reduced. A broader implication of DnaK3 in TM biogenesis and maintenance, involving biogenesis and/or repair of multiple TM complexes would be a convincing explanation.

Author Contributions

A.T., D.S., R.J. and T.S. designed the research, A.T., R.J., T.S., and U.K. performed the experiments, A.T., D.S., and T.S. wrote the manuscript. All authors have read and agreed to the published version of the manuscript.

Funding

This research was funded by the Deutsche Forschungsgemeinschaft and a grant from the Ernst & Margarete Wagemann Foundation.

Acknowledgments

We thank R. Genswein for excellent technical assistance and Hildegard Pearson as well as Rebecca Keller for critically reading the manuscript. We also thank M. Rögner (Ruhr-University Bochum) for the kind gift of antibodies.

Conflicts of Interest

The authors declare no conflict of interest.

References

  1. Rast, A.; Heinz, S.; Nickelsen, J. Biogenesis of thylakoid membranes. Biochim. Biophys. Acta Bioenerg. 2015, 1847, 821–830. [Google Scholar] [CrossRef] [PubMed] [Green Version]
  2. Vothknecht, U.C.; Westhoff, P. Biogenesis and origin of thylakoid membranes. Biochim. Biophys. Acta 2001, 1541, 91–101. [Google Scholar] [CrossRef] [Green Version]
  3. Jarvis, P.; López-Juez, E. Biogenesis and homeostasis of chloroplasts and other plastids. Nat. Rev. Mol. Cell Biol. 2013, 14, 787–802. [Google Scholar] [CrossRef] [PubMed]
  4. Dubreuil, C.; Jin, X.; Barajas-López, J.d.D.; Hewitt, T.C.; Tanz, S.K.; Dobrenel, T.; Schröder, W.P.; Hanson, J.; Pesquet, E.; Grönlund, A.; et al. Establishment of Photosynthesis through Chloroplast Development Is Controlled by Two Distinct Regulatory Phases. Plant Physiol. 2018, 176, 1199–1214. [Google Scholar] [CrossRef]
  5. Vernotte, C.; Picaud, M.; Kirilovsky, D.; Olive, J.; Ajlani, G.; Astier, C. Changes in the Photosynthetic Apparatus in the Cyanobacterium Synechocystis sp Pcc-6714 Following Light-to-Dark and Dark-to-Light Transitions. Photosyn. Res. 1992, 32, 45–57. [Google Scholar] [CrossRef]
  6. Anderson, S.L.; Mcintosh, L. Light-activated heterotrophic growth of the cyanobacterium Synechocystis sp. strain PCC 6803: A blue-light-requiring process. J. Bacteriol. 1991, 173, 2761–2767. [Google Scholar] [CrossRef] [Green Version]
  7. Barthel, S.; Bernat, G.; Seidel, T.; Rupprecht, E.; Kahmann, U.; Schneider, D. Thylakoid Membrane Maturation and PSII Activation Are Linked in Greening Synechocystis sp PCC 6803 Cells. Plant Physiol 2013, 163, 1037–1046. [Google Scholar] [CrossRef] [Green Version]
  8. Mechela, A.; Schwenkert, S.; Soll, J. A brief history of thylakoid biogenesis. Open Biol. 2019, 9, 180237. [Google Scholar] [CrossRef] [Green Version]
  9. Spence, E.; Bailey, S.; Nenninger, A.; Moller, S.G.; Robinson, C. A homolog of Albino3/OxaI is essential for thylakoid biogenesis in the cyanobacterium Synechocystis sp PCC6803. J. Biol. Chem. 2004, 279, 55792–55800. [Google Scholar] [CrossRef] [Green Version]
  10. Thurotte, A.; Brüser, T.; Mascher, T.; Schneider, D.; Brueser, T. Membrane chaperoning by members of the PspA/IM30 protein family. Commun. Integr. Biol. 2017, 10, e1264546. [Google Scholar] [CrossRef]
  11. Heidrich, J.; Thurotte, A.; Schneider, D. Specific interaction of IM30/Vipp1 with cyanobacterial and chloroplast membranes results in membrane remodeling and eventually in membrane fusion. Biochim. Biophys. Acta Biomembr. 2017, 1859, 537–549. [Google Scholar] [CrossRef] [PubMed]
  12. Siebenaller, C.; Junglas, B.; Schneider, D. Functional Implications of Multiple IM30 Oligomeric States. Front. Plant Sci. 2019, 10, 1500. [Google Scholar] [CrossRef] [PubMed] [Green Version]
  13. Jilly, R.; Khan, N.Z.; Aronsson, H.; Schneider, D. Dynamin-Like Proteins Are Potentially Involved in Membrane Dynamics within Chloroplasts and Cyanobacteria. Front. Plant Sci. 2018, 9, 206. [Google Scholar] [CrossRef] [PubMed] [Green Version]
  14. Bryan, S.J.; Burroughs, N.J.; Evered, C.; Sacharz, J.; Nenninger, A.; Mullineaux, C.W.; Spence, E.M. Loss of the SPHF Homologue Slr1768 Leads to a Catastrophic Failure in the Maintenance of Thylakoid Membranes in Synechocystis sp PCC 6803. PLoS ONE 2011, 6, e19625. [Google Scholar] [CrossRef] [Green Version]
  15. Rupprecht, E.; Gathmann, S.; Fuhrmann, E.; Schneider, D. Three different DnaK proteins are functionally expressed in the cyanobacterium Synechocystis sp. PCC 6803. Microbiology 2007, 153, 1828–1841. [Google Scholar] [CrossRef] [Green Version]
  16. Katano, Y.; Nimura-Matsune, K.; Yoshikawa, H. Involvement of DnaK3, one of the three DnaK proteins of cyanobacterium Synechococcus sp PCC7942, in translational process on the surface of the thylakoid membrane. Biosci. Biotechnol. Biochem. 2006, 70, 1592–1598. [Google Scholar] [CrossRef] [Green Version]
  17. Frick, G.; Su, Q.X.; Apel, K.; Armstrong, G.A. An Arabidopsis porB porC double mutant lacking light-dependent NADPH: protochlorophyllide oxidoreductases B and C is highly chlorophyll-deficient and developmentally arrested. Plant J. 2003, 35, 141–153. [Google Scholar] [CrossRef]
  18. Hagio, M.; Sakurai, I.; Sato, S.; Kato, T.; Tabata, S.; Wada, H. Phosphatidylglycerol is essential for the development of thylakoid membranes in Arabidopsis thaliana. Plant Cell Physiol. 2002, 43, 1456–1464. [Google Scholar] [CrossRef] [Green Version]
  19. Paddock, T.N.; Mason, M.E.; Lima, D.F.; Armstrong, G.A. Arabidopsis protochlorophyllide oxidoreductase A (PORA) restores bulk chlorophyll synthesis and normal development to a porB porC double mutant. Plant Mol. Biol. 2010, 72, 445–457. [Google Scholar] [CrossRef]
  20. Sato, N.; Hagio, M.; Wada, H.; Tsuzuki, M. Requirement of phosphatidylglycerol for photosynthetic function in thylakoid membranes. Proc. Natl. Acad. Sci. USA 2000, 97, 10655–10660. [Google Scholar] [CrossRef] [Green Version]
  21. Mayer, M.P.; Bukau, B. Hsp70 chaperones: Cellular functions and molecular mechanism. Cell. Mol. Life Sci. 2005, 62, 670–684. [Google Scholar] [CrossRef] [PubMed] [Green Version]
  22. Genevaux, P.; Georgopoulos, C.; Kelley, W.L. The Hsp70 chaperone machines of Escherichia coli: A paradigm for the repartition of chaperone functions. Mol. Microbiol. 2007, 66, 840–857. [Google Scholar] [CrossRef] [PubMed]
  23. Rajaram, H.; Chaurasia, A.K.; Apte, S.K. Cyanobacterial heat-shock response: Role and regulation of molecular chaperones. Microbiology 2014, 160, 647–658. [Google Scholar] [CrossRef] [PubMed]
  24. Rupprecht, E.; Düppre, E.; Schneider, D. Similarities and Singularities of Three DnaK Proteins from the Cyanobacterium Synechocystis sp. PCC 6803. Plant Cell Physiol. 2010, 51, 1210–1218. [Google Scholar] [CrossRef] [Green Version]
  25. Düppre, E.; Rupprecht, E.; Schneider, D. Specific and promiscuous functions of multiple DnaJ proteins in Synechocystis sp PCC 6803. Microbiology 2011, 157, 1269–1278. [Google Scholar] [CrossRef] [Green Version]
  26. Nimura, K.; Takahashi, H.; Yoshikawa, H. Characterization of the dnaK multigene family in the cyanobacterium Synechococcus sp strain PCC7942. J. Bacteriol. 2001, 183, 1320–1328. [Google Scholar] [CrossRef] [Green Version]
  27. Nakamoto, H.; Fujita, K.; Ohtaki, A.; Watanabe, S.; Narumi, S.; Maruyama, T.; Suenaga, E.; Misono, T.S.; Kumar, P.K.R.; Goloubinoff, P.; et al. Physical interaction between bacterial heat shock protein (Hsp) 90 and Hsp70 chaperones mediates their cooperative action to refold denatured proteins. J. Biol. Chem. 2014, 289, 6110–6119. [Google Scholar] [CrossRef] [Green Version]
  28. Oguchi, K.; Nimura, K.; Yoshikawa, H.; Takahashi, H. Sequence and analysis of a dnaJ homologue gene in cyanobacterium Synechococcus sp. PCC7942. Biochem. Biophys. Res. Commun. 1997, 236, 461–466. [Google Scholar] [CrossRef]
  29. Nakamura, Y.; Kaneko, T.; Sato, S.; Mimuro, M.; Miyashita, H.; Tsuchiya, T.; Sasamoto, S.; Watanabe, A.; Kawashima, K.; Kishida, Y.; et al. Complete genome structure of Gloeobacter violaceus PCC 7421, a cyanobacterium that lacks thylakoids. DNA Research 2003, 10, 137–145. [Google Scholar] [CrossRef]
  30. Rippka, R.; Waterbury, J.; Cohenbazire, G. Cyanobacterium Which Lacks Thylakoids. Arch. Microbiol. 1974, 100, 419–436. [Google Scholar] [CrossRef]
  31. Nimura, K.; Yoshikawa, H.; Takahashi, H. DnaK3, one of the three DnaK proteins of cyanobacterium Synechococcus sp. PCC7942, is quantitatively detected in the thylakoid membrane. Biochem. Biophys. Res. Commun. 1996, 229, 334–340. [Google Scholar] [CrossRef] [PubMed]
  32. Aro, E.M.; Virgin, I.; Andersson, B. Photoinhibition of Photosystem II. Inactivation, protein damage and turnover. Biochim. Biophys. Acta 1993, 1143, 113–134. [Google Scholar] [CrossRef]
  33. Mulo, P.; Sakurai, I.; Aro, E.M. Strategies for psbA gene expression in cyanobacteria, green algae and higher plants: From transcription to PSII repair. Biochim. Biophys. Acta Bioenerg. 2012, 1817, 247–257. [Google Scholar] [CrossRef] [PubMed] [Green Version]
  34. Schroda, M.; Vallon, O.; Wollman, F.A.; Beck, C.F. A chloroplast-targeted heat shock protein 70 (HSP70) contributes to the photoprotection and repair of photosystem II during and after photoinhibition. Plant Cell 1999, 11, 1165–1178. [Google Scholar] [CrossRef] [PubMed] [Green Version]
  35. Yokthongwattana, K.; Chrost, B.; Behrman, S.; Casper-Lindley, C.; Melis, A. Photosystem II damage and repair cycle in the green alga Dunaliella salina: Involvement of a chloroplast-localized HSP70. Plant Cell Physiol. 2001, 42, 1389–1397. [Google Scholar] [CrossRef] [PubMed] [Green Version]
  36. Rippka, R.; Deruelles, J.; Waterbury, J.B.; Herdman, M.; Stanier, R.Y. Generic Assignments, Strain Histories and Properties of Pure Cultures of Cyanobacteria. Microbiology 1979, 111, 1–61. [Google Scholar] [CrossRef] [Green Version]
  37. Fuhrmann, E.; Gathmann, S.; Rupprecht, E.; Golecki, J.; Schneider, D. Thylakoid Membrane Reduction Affects the Photosystem Stoichiometry in the Cyanobacterium Synechocystis sp PCC 6803. Plant Physiol. 2009, 149, 735–744. [Google Scholar] [CrossRef] [Green Version]
  38. Fuhrmann, E.; Bultema, J.B.; Kahmann, U.; Rupprecht, E.; Boekema, E.J.; Schneider, D. The Vesicle-inducing Protein 1 from Synechocystis sp PCC 6803 Organizes into Diverse Higher-Ordered Ring Structures. Mol. Biol. Cell 2009, 20, 4620–4628. [Google Scholar] [CrossRef] [Green Version]
  39. Porra, R.J.; Thompson, W.A.; Kriedemann, P.E. Determination of Accurate Extinction Coefficients and Simultaneous-Equations for Assaying Chlorophyll-a and Chlorophyll-B Extracted with 4 Different Solvents—Verification of the Concentration of Chlorophyll Standards by Atomic-Absorption Spectroscopy. Biochim. Biophys. Acta 1989, 975, 384–394. [Google Scholar] [CrossRef]
  40. Murchie, E.H.; Lawson, T. Chlorophyll fluorescence analysis: A guide to good practice and understanding some new applications. J. Exp. Bot. 2013, 64, 3983–3998. [Google Scholar] [CrossRef] [Green Version]
  41. van Kooten, O.; Snel, J.F. The use of chlorophyll fluorescence nomenclature in plant stress physiology. Photosyn. Res. 1990, 25, 147–150. [Google Scholar] [CrossRef] [PubMed]
  42. Salvucci, M.E.; Crafts-Brandner, S.J. Relationship between the heat tolerance of photosynthesis and the thermal stability of rubisco activase in plants from contrasting thermal environments. Plant Physiol. 2004, 134, 1460–1470. [Google Scholar] [CrossRef] [PubMed] [Green Version]
  43. Asadulghani, M.; Suzuki, Y.; Nakamoto, H. Light plays a key role in the modulation of heat shock response in the cyanobacterium Synechocystis sp PCC 6803. Biochem. Biophys. Res. Commun. 2003, 306, 872–879. [Google Scholar] [CrossRef]
  44. Murakami, A.; Fujita, Y. Regulation of Stoichiometry between PsI and PsII in Response to Light Regime for Photosynthesis Observed with Synechocystis Pcc-6714-Relationship between Redox State of Cyt B6-F Complex and Regulation of Psi Formation. Plant Cell Physiol. 1993, 34, 1175–1180. [Google Scholar]
  45. Muramatsu, M.; Hihara, Y. Transcriptional regulation of genes encoding subunits of photosystem I during acclimation to high-light conditions in Synechocystis sp. PCC 6803. Planta 2003, 216, 446–453. [Google Scholar] [CrossRef]
  46. Hihara, Y.; Sonoike, K.; Ikeuchi, M. A novel gene, pmgA, specifically regulates photosystem stoichiometry in the cyanobacterium Synechocystis species PCC 6803 in response to high light. Plant Physiol 1998, 117, 1205–1216. [Google Scholar] [CrossRef] [Green Version]
  47. Muramatsu, M.; Hihara, Y. Acclimation to high-light conditions in cyanobacteria: From gene expression to physiological responses. J. Plant Res. 2012, 125, 11–39. [Google Scholar] [CrossRef]
  48. Fraser, J.M.; Tulk, S.E.; Jeans, J.A.; Campbell, D.A.; Bibby, T.S.; Cockshutt, A.M. Photophysiological and photosynthetic complex changes during iron starvation in Synechocystis sp. PCC 6803 and Synechococcus elongatus PCC 7942. PLoS ONE 2013, 8, e59861. [Google Scholar] [CrossRef] [Green Version]
  49. Jordan, P.; Fromme, P.; Witt, H.T.; Klukas, O.; Saenger, W.; Krauss, N. Three-dimensional structure of cyanobacterial photosystem I at 2.5 angstrom resolution. Nature 2001, 411, 909–917. [Google Scholar] [CrossRef]
  50. Guskov, A.; Kern, J.; Gabdulkhakov, A.; Broser, M.; Zouni, A.; Saenger, W. Cyanobacterial photosystem II at 2.9-A resolution and the role of quinones, lipids, channels and chloride. Nat. Struct. Mol. Biol. 2009, 16, 334–342. [Google Scholar] [CrossRef]
  51. Rakhimberdieva, M.G.; Vavilin, D.V.; Vermaas, W.F.J.; Elanskaya, I.V.; Karapetyan, N.V. Phycobilin/chlorophyll excitation equilibration upon carotenoid-induced non-photochemical fluorescence quenching in phycobilisomes of the Synechocystis sp PCC 6803. Biochim. Biophys. Acta 2007, 1767, 757–765. [Google Scholar] [CrossRef] [PubMed] [Green Version]
  52. Tamary, E.; Kiss, V.; Nevo, R.; Adam, Z.; Bernat, G.; Rexroth, S.; Rogner, M.; Reich, Z. Structural and functional alterations of cyanobacterial phycobilisomes induced by high-light stress. Biochim. Biophys. Acta Bioenerg. 2012, 1817, 319–327. [Google Scholar] [CrossRef] [PubMed]
  53. Biggins, J.; Bruce, D. Regulation of Excitation-Energy Transfer in Organisms Containing Phycobilins. Photosyn. Res. 1989, 20, 1–34. [Google Scholar] [CrossRef] [PubMed]
  54. Chang, L.; Liu, X.; Li, Y.; Liu, C.-C.; Yang, F.; Zhao, J.; Sui, S.-F. Structural organization of an intact phycobilisome and its association with photosystem II. Cell Research 2015, 25, 726–737. [Google Scholar] [CrossRef] [Green Version]
  55. Emlyn-Jones, D.; Ashby, M.K.; Mullineaux, C.W. A gene required for the regulation of photosynthetic light harvesting in the cyanobacterium Synechocystis 6803. Mol. Microbiol. 1999, 33, 1050–1058. [Google Scholar] [CrossRef]
  56. Mullineaux, C.W.; Emlyn-Jones, D. State transitions: An example of acclimation to low-light stress. J. Exp. Bot. 2005, 56, 389–393. [Google Scholar] [CrossRef]
  57. Kopecna, J.; Komenda, J.; Bucinska, L.; Sobotka, R. Long-term acclimation of the cyanobacterium Synechocystis sp. PCC 6803 to high light is accompanied by an enhanced production of chlorophyll that is preferentially channeled to trimeric photosystem I. Plant Physiol. 2012, 160, 2239–2250. [Google Scholar] [CrossRef] [Green Version]
  58. Komenda, J.; Tichy, M.; Prasil, O.; Knoppova, J.; Kuvikova, S.; de Vries, R.; Nixon, P.J. The exposed N-terminal tail of the D1 subunit is required for rapid D1 degradation during photosystem II repair in Synechocystis sp PCC 6803. Plant Cell 2007, 19, 2839–2854. [Google Scholar] [CrossRef] [Green Version]
  59. Silva, P.; Thompson, E.; Bailey, S.; Kruse, O.; Mullineaux, C.W.; Robinson, C.; Mann, N.H.; Nixon, P.J. FtsH is involved in the early stages of repair of photosystem II in Synechocystis sp PCC 6803. Plant Cell 2003, 15, 2152–2164. [Google Scholar] [CrossRef] [Green Version]
  60. Baker, N.R. Chlorophyll fluorescence: A probe of photosynthesis in vivo. Annu. Rev. Plant Biol 2008, 59, 89–113. [Google Scholar] [CrossRef] [Green Version]
  61. Niyogi, K.K.; Truong, T.B. Evolution of flexible non-photochemical quenching mechanisms that regulate light harvesting in oxygenic photosynthesis. Curr. Opin. Plant Biol. 2013, 16, 307–314. [Google Scholar] [CrossRef]
  62. Campbell, D.; Bruce, D.; Carpenter, C.; Gustafsson, P.; Oquist, G. Two forms of the photosystem II D1 protein alter energy dissipation and state transitions in the cyanobacterium Synechococcus sp PCC 7942. Photosyn. Res. 1996, 47, 131–144. [Google Scholar] [CrossRef] [PubMed]
  63. Santabarbara, S.; Villafiorita Monteleone, F.; Remelli, W.; Rizzo, F.; Menin, B.; Casazza, A.P. Comparative excitation-emission dependence of the FV/FM ratio in model green algae and cyanobacterial strains. Physiol. Plant 2019, 166, 351–364. [Google Scholar] [CrossRef] [PubMed]
  64. Fulda, S.; Mikkat, S.; Huang, F.; Huckauf, J.; Marin, K.; Norling, B.; Hagemann, M. Proteome analysis of salt stress response in the cyanobacterium Synechocystis sp. strain PCC 6803. Proteomics 2006, 6, 2733–2745. [Google Scholar] [CrossRef] [PubMed]
  65. Mary, I.; Tu, C.J.; Grossman, A.; Vaulot, D. Effects of high light on transcripts of stress-associated genes for the cyanobacteria Synechocystis sp PCC 6803 and Prochlorococcus MED4 and MIT9313. Microbiology 2004, 150, 1271–1281. [Google Scholar] [CrossRef] [Green Version]
  66. Hernandez-Prieto, M.A.; Futschik, M.E. CyanoEXpress: A web database for exploration and visualisation of the integrated transcriptome of cyanobacterium Synechocystis sp. PCC6803. Bioinformation 2012, 8, 634–638. [Google Scholar] [CrossRef] [Green Version]
  67. Sonoike, K.; Hihara, Y.; Ikeuchi, M. Physiological significance of the regulation of photosystem stoichiometry upon high light acclimation of Synechocystis sp PCC 6803. Plant Cell Physiol. 2001, 42, 379–384. [Google Scholar] [CrossRef] [Green Version]
  68. Huang, F.; Parmryd, I.; Nilsson, F.; Persson, A.L.; Pakrasi, H.B.; Andersson, B.; Norling, B. Proteomics of Synechocystis sp. strain PCC 6803: Identification of plasma membrane proteins. Mol. Cell Proteomics 2002, 1, 956–966. [Google Scholar] [CrossRef] [Green Version]
  69. Jansson, C.; Debus, R.J.; Osiewacz, H.D.; Gurevitz, M.; Mcintosh, L. Construction of an Obligate Photoheterotrophic Mutant of the Cyanobacterium Synechocystis 6803: Inactivation of the psbA Gene Family. Plant Physiol 1987, 85, 1021–1025. [Google Scholar] [CrossRef] [Green Version]
  70. Mullineaux, C.W. Electron transport and light-harvesting switches in cyanobacteria. Front. Plant Sci. 2014, 5, 7. [Google Scholar] [CrossRef]
Figure 1. Light-dependent accumulation of DnaK1, 2, and 3. Dark-adapted Synechocystis cultures were shifted into the light (0–24 h). Cell extracts (20 µg protein) were analyzed at different time points via immunodetection, using anti-DnaK1, 2, or 3 antibodies as well as antibodies directed against PS I (PsaA/B) and PS II (PsbA) core subunits or the ribosomal protein L23 (loading control).
Life 10 00055 g001
Figure 2. Deletion of dnaK3 in the dark and the DnaK3 content in the Synechocystis dnaK3KD strain. (A) In the Synechocystis dnaK3KD strain [15], the dnaK3 gene was disrupted by insertion of a kanamycin resistance cassette (aphA gene). (B) The dnaK3 gene locus of wt and dnaK3KD cells grown in the dark was analyzed via PCR using genomic DNA as a template, and the PCR products were loaded on a 1.5% agarose gel together with a molecular size marker (M). Fragments of about 500 bp and 1500 bp represent the wt and the dnaK3 gene interrupted by a kanamycin resistance cassette (aphA), respectively. (C) The relative DnaK3 content in the dnaK3KD strain was determined by immunoblot analysis. Cell extracts prepared from the wt and dnaK3KD strains, respectively, were loaded on a SDS-polyacrylamide gel in descending protein concentrations (15 µg to 5 µg) followed by a Western blot analysis using α-DnaK3, α-DnaJ3 and α-L23 (loading control) antibodies.
Life 10 00055 g002
Figure 3. Growth of Synechocystis wt and the dnaK3KD mutant strain at different growth conditions. Synechocystis wt (black) and dnaK3KD mutant (gray) cells were grown at (A) moderate temperature (30 °C) or (B) elevated temperature (42 °C) under low light (circle) or high light (triangle) conditions. Cells were adjusted to OD750 = 0.05 in BG11 medium containing 5 mM glucose and cell growth was followed over time by measuring the OD750.
Life 10 00055 g003
Figure 4. Pigment content and pigment ratios. (A) Absorbance spectra of Synechocystis wt (black) and dnaK3KD (gray) cells (300,000 cells) grown under LL (solid line) or HL (dashed line) conditions. (B) The chlorophyll content per OD750 was determined as described in “Material and Methods”. (C) The ratio of PC to Chl was determined as the ratio of the absorptions at 625 and 680 nm. (D) The ratio of Car to Chl was determined as the ratio of the absorption at 490 and 440 nm. Error bars represent standard deviation from three independent experiments.
Life 10 00055 g004
Figure 5. Reducing the cellular DnaK3 content results in fewer thylakoid layers. (A) Representative electron micrographs of Synechocystis wt and dnaK3KD mutant cells cultivated under LL (low light) conditions. (B) Cells of the dnaK3KD mutant strain (gray) had four thylakoid layers on average, whereas wt cells (black) showed four to five layers and a higher appearance of six and seven layers of TM pairs. Per strain, at least 200 individual cells were counted.
Life 10 00055 g005
Figure 6. Reduction of the cellular DnaK3 content results in a decreased PS content and a lowered PS I-to-PS II ratio. (A) 77 K fluorescence emission spectra of wt (black) and dnaK3KD (gray) cultures grown under LL (solid line) and HL (high light) (dashed line) conditions. The spectra were normalized at 695 nm. λEx = 435 nm (B) 77 K fluorescence emission spectra of wt (black) and dnaK3KD (gray) cultures cultivated under LL (solid line) and HL (dashed line) conditions. The spectra were normalized at 665 nm. λEx = 580 nm. (C,D) Immunoblot analysis of the content of PS I and PS II core subunits (PS I: PsaA/B; PS II: PsbA) in wt and dnaK3KD cells grown under LL conditions. Samples were normalized to (C) protein (25 µg) or (D) chlorophyll (0.6 µg). L23 is the loading control.
Life 10 00055 g006
Figure 7. Oxygen evolution rates and relative PS II content of wt and dnaK3KD Synechocystis cells. (A,B) wt and dnaK3KD cells were grown under LL and HL conditions, respectively, and oxygen evolution rates were determined per OD750 (A) or Chl (B). (C,D) wt (square) and dnaK3KD (circle) cells were exposed to extreme high light (eHL) conditions (1500 µmol photons m−2·s−1) either in absence (C) or presence (D) of lincomycin (100 µg·mL−1) and thereafter cultured under LL conditions for recovery. Oxygen evolution was measured using 500 µM phenyl-p-benzoquinone (PPBQ) as an electron acceptor at PS II. The recovery rate is given by the slope of a linear regression under LL conditions. Noteworthy, no other antibiotics were present in these experiments. Inlet in (C): Immunoblot analysis of the D1 content in the dnaK3KD strain after photoinhibition (time 0). Cell extracts with identical Chl contents (0.4 µg) were analyzed. (Error bars represent standard deviation from three independent experiments).
Life 10 00055 g007
Figure 8. PS II activity and P700 re-reduction kinetics. (A) Light/dark induction curves were recorded by measuring the pulse amplitude modulated (PAM) fluorescence of wt (black) and dnaK3KD cells (gray) grown under LL or HL conditions, respectively. After 40 s of measuring light, the actinic red light was switched on to determine minimal fluorescence values (F0, F0´). Pulses of saturating light were applied once during the dark phase and in 30 s intervals during the light phase, to obtain maximal (Fm and Fm´) fluorescence values. (B) Maximal PS II photosynthetic activity of the wt (black) and the dnaK3KD strain (gray). (C) The coefficient of photochemical quenching of PS II Chl fluorescence (qP) in wt (black) and dnaK3KD cells (gray). (B, C) Error bars represent standard deviation from at least four independent experiments. (D) P700+ re-reduction kinetics of wt (black) and dnaK3KD (gray) cells grown under LL conditions. A saturation pulse of 10,000 µmol photons was given for 20 ms to completely oxidize P700. The following fluorescence decrease illustrates re-reduction of P700+ in the dark. At least ten traces were averaged and normalized. 1 represents completely oxidized and 0 completely reduced P700. (E) Re-reduction halftimes were determined via fitting the decay curves of the wt (black) and the dnaK3KD mutant strain (gray) with single exponential functions. Error bars represent standard deviation from at least three independent experiments.
Life 10 00055 g008

