You are currently viewing a new version of our website. To view the old version click .
Machines
  • Article
  • Open Access

18 August 2021

Operator-Based Nonlinear Control of Calorimetric System Actuated by Peltier Device

and
Department of Electrical and Electronic Engineering, Graduate School of Engineering, Tokyo University of Agriculture and Technology, 2-24-16 Nakacho, Koganei-shi, Tokyo 184-8588, Japan
*
Author to whom correspondence should be addressed.
This article belongs to the Special Issue Design and Control of Advanced Mechatronics Systems

Abstract

Recently, the development of SiC and GaN high-performance semiconductor devices has led to higher efficiency in power conversion equipment. In order to perform thermal design of power conversion equipment and evaluation of the equipment, it is necessary to measure the power loss of the equipment with high accuracy. In a previous study, a system to measure the power loss from the amount of heat emitted from power conversion devices using a Peltier device was proposed. In this study, aiming to improve the measurement accuracy, the temperature dependence of the thermal conductivity of a Peltier device, which was treated as a constant value in the previous study, was considered. The control system considering the temperature dependence of the thermal conductivity was designed based on operator theory, which is a nonlinear control theory. The simulation and experimental results show that the measurement accuracy was improved when the power loss was 10 W and 15 W compared to the case without considering the temperature dependence. In addition, the measurement time was reduced by about 100 s by considering the temperature dependence. The effectiveness of the proposed system was shown when the power loss was 10 W and 15 W.

1. Introduction

In recent years, with the development of high-performance semiconductor devices such as SiC and GaN, power conversion devices have become more efficient, and low-loss devices with conversion efficiencies of over 99% have been developed []. For the thermal design and evaluation of such devices, it is important to measure the power loss of the device with high accuracy. Power loss is typically calculated by using a power meter to measure input and output power and calculating the difference between them [,]. However, due to the high efficiency of power conversion devices, the ratio of power loss to the measured power becomes very small, which increases the error in the measurement equipment and prevents highly accurate measurement results from being obtained.
This problem can be solved by using a calorimetric method to derive the power loss from the amount of heat released from the power conversion device []. This method measures the amount of heat emitted when the power conversion device (DUT: device under test) to be measured is driven inside a thermostatic chamber through a medium such as air or water. This reduces the error in the measurement equipment that occurs when power loss is measured using a power meter. However, the calorimetric method requires a heat exchanger and a flow meter, which makes the system configuration complex and expensive. In the calorimetry method, if there is a temperature difference between the internal and ambient temperatures of the thermostatic chamber, heat leakage from the inside of the chamber occurs, and the measurement accuracy decreases.
Therefore, a calorimetric measurement system using a Peltier device has been proposed in a previous study []. A Peltier device is a device that dissipates heat on one side and absorbs heat on the other side by passing current through it, and high-precision temperature control can be achieved by controlling the current flowing through the device. By using the Peltier device in the calorimetric measurement system, a heat exchanger and a flow meter are not necessary, and the system can be configured simply and inexpensively. In addition, the Peltier device can be used to control the internal temperature of the chamber to follow the ambient temperature, thereby reducing heat leakage from inside the chamber.
The Peltier-device-based system is a nonlinear control system, and it is difficult to apply classical control theory to it. In a previous study [], a control system with a robust right-collinear factorization based on operator theory was proposed to solve this problem. There are several control methods such as sliding mode control [] and adaptive control [,], but in this paper, the control system is designed based on operator theory as in the previous study. Operator theory [,,,,,,,,] restricts the space of input signals and the output space, so it can be applied not only to linear control systems but also to nonlinear control systems. There are three advantages of using operator theory: first, there is no need to use transfer functions; second, robust stability analysis can be performed even when nonlinear elements are included; and third, it can be extended to multiple input–output systems. The references [,,,,,,,,] are papers on this theory, in which a nonlinear control system is designed based on operator theory. However, the heat transfer inside the Peltier device was not taken into account in the calorimetric measurement system proposed in the previous research. Since the Peltier device has a high temperature on one side and a low temperature on the other side, there is heat transfer inside the device, which affects the temperature control. The thermal conductivity is a coefficient that represents this heat transfer. In the previous study, thermal conductivity was treated as a constant value regardless of the ambient conditions. However, the thermal conductivity is known to vary depending on the physical properties of the material and the temperature [,]. Therefore, in this article, a control system considering the temperature dependence of thermal conductivity is designed based on operator theory. The effectiveness of the proposed system is verified in terms of two aspects, measurement accuracy and measurement time, by comparing it with a previous study that did not consider the temperature dependence of thermal conductivity, through simulation and experiment.
The contents of this paper are as follows. Firstly, the structure and measurement principles of the calorimetric measurement system using the Peltier device are explained, and the modeling and control system design are shown in Section 2. Then, the simulation and experimental results are presented in Section 3. Finally, the conclusion is given in Section 4.

2. Presentation of the System and Control System Design

In this section, a heat measurement system considering the temperature dependence of the thermal conductivity in a Peltier device is described. Section 2.1 describes the Peltier device. Section 2.2 describes the heat measurement system using the Peltier device. Section 2.3 describes the modeling of the calorimetric system, Section 2.4 explains the temperature dependence of the thermal conductivity, and Section 2.5 shows the design of the nonlinear feedback control system based on operator theory. Finally, Section 2.6 describes the experimental system.

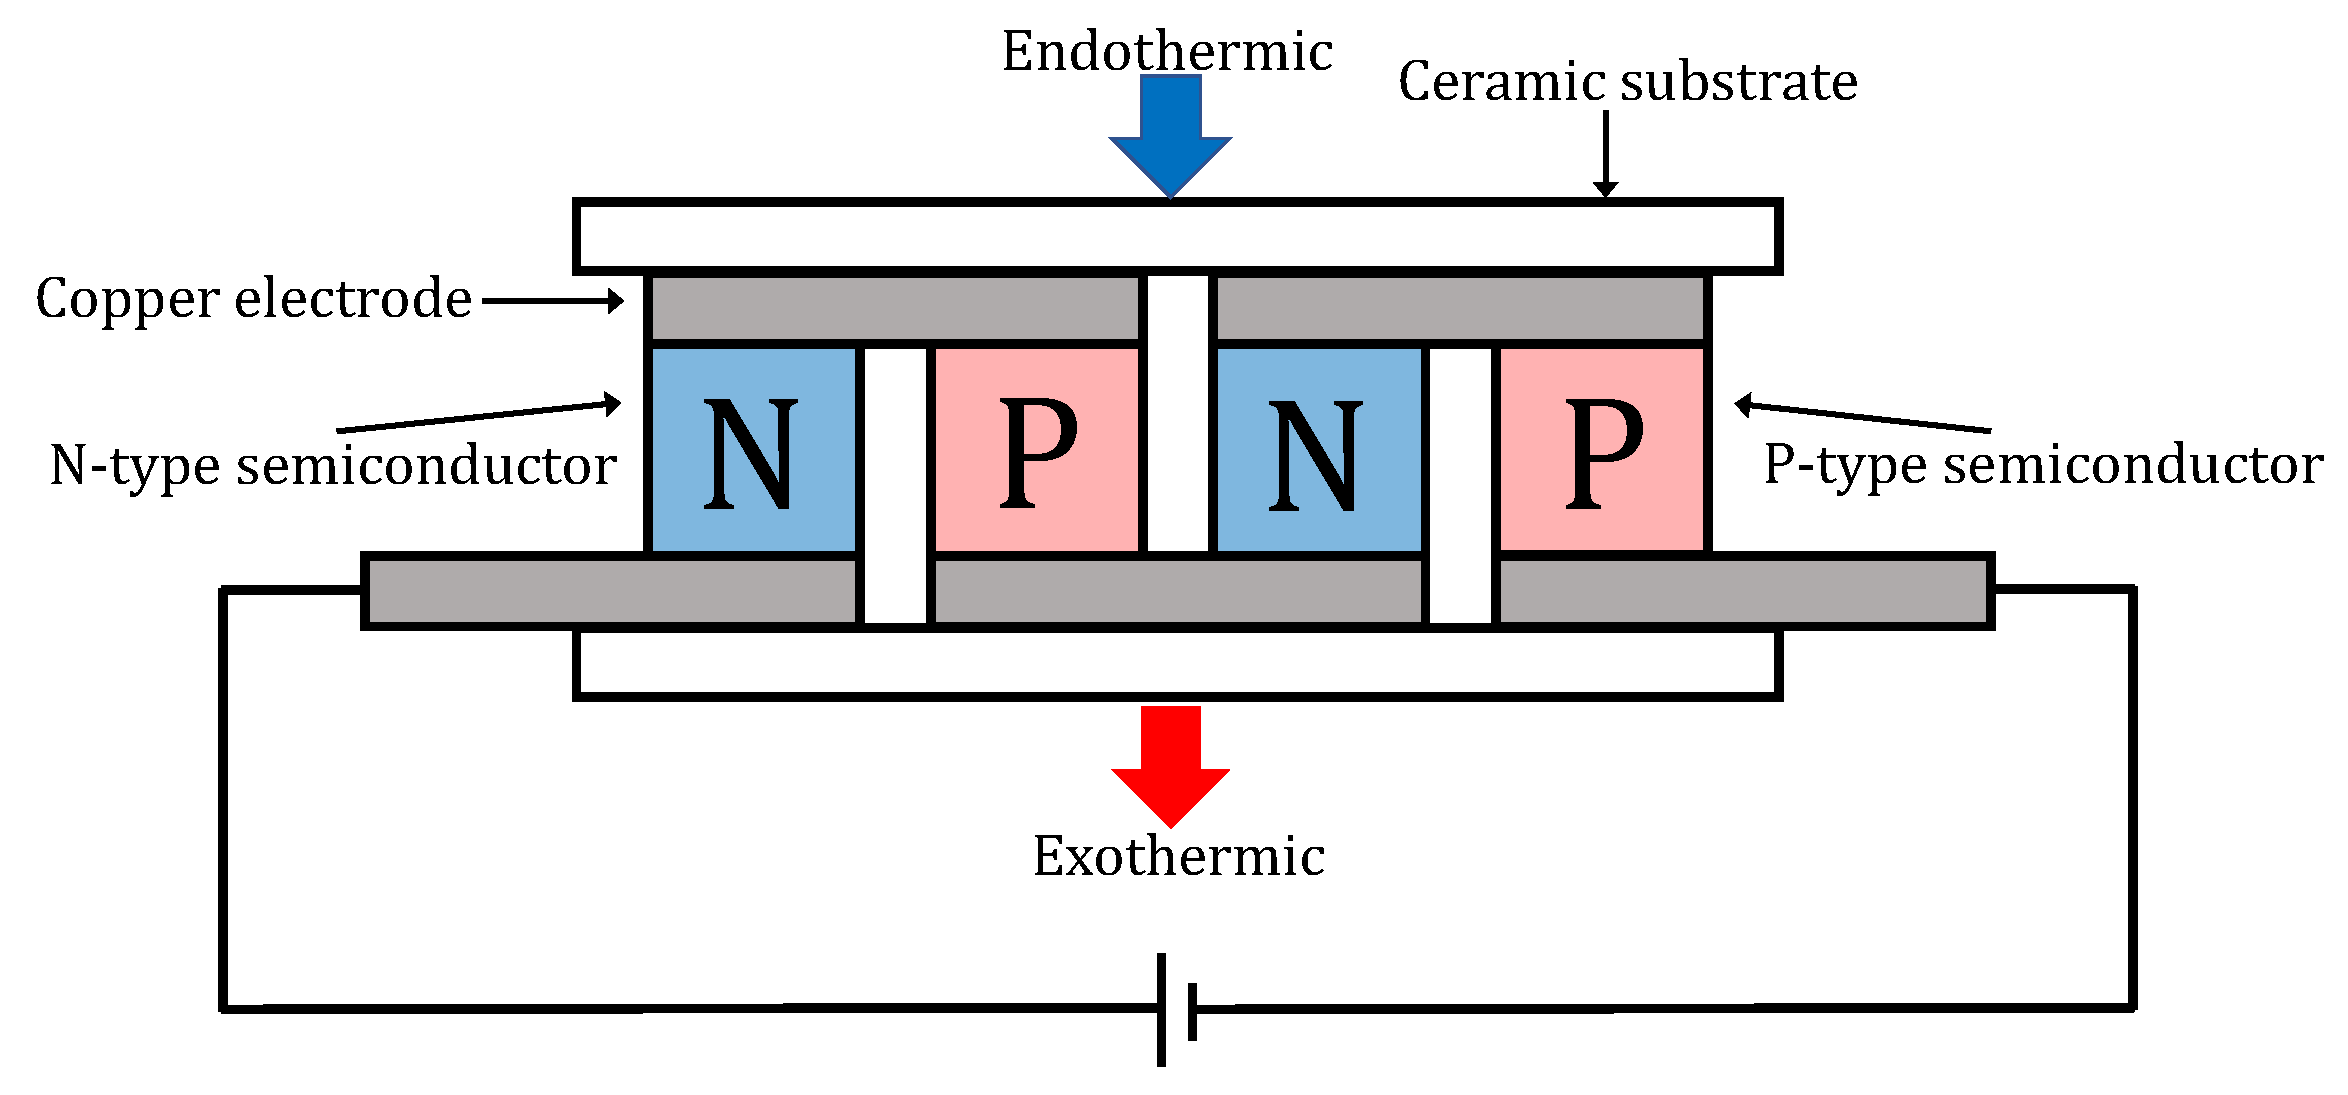
2.1. The Structure of the Peltier Device

The structure of the Peltier device is shown in Figure 1. Inside the Peltier device, N-type and P-type semiconductors are arranged alternately and connected in series by copper electrodes. When the current is applied to the device, a temperature difference is generated on both sides of the device, causing an endothermic reaction on the low temperature side and an exothermic reaction on the high temperature side. By changing the direction of the current flowing through the device, the heat-absorbing and heat-dissipating surfaces can be switched. When the heat generated on the heat-dissipating surface is not sufficiently exhausted, the heat on the heat-dissipating side conducts heat through the device to the heat-absorbing side, and the cooling capacity of the device is reduced. To prevent such a phenomenon, the heat on the heat-dissipating side must be cooled by forced air cooling using a heat sink and fan or by water cooling. The amount of endothermic energy of the Peltier device u c (W) is shown in Equation (1) and the amount of exothermic energy of the Peltier device u h (W) is shown in Equation (2) [].
u c = S p T c I λ A d ( T h T c ) 1 2 r p I 2
u h = S p T h I λ A d ( T h T c ) + 1 2 r p I 2
Figure 1. The structure of the Peltier device [].
The parameters used in Equations (1) and (2) are shown in Table 1.
Table 1. Parameters of the Peltier device.

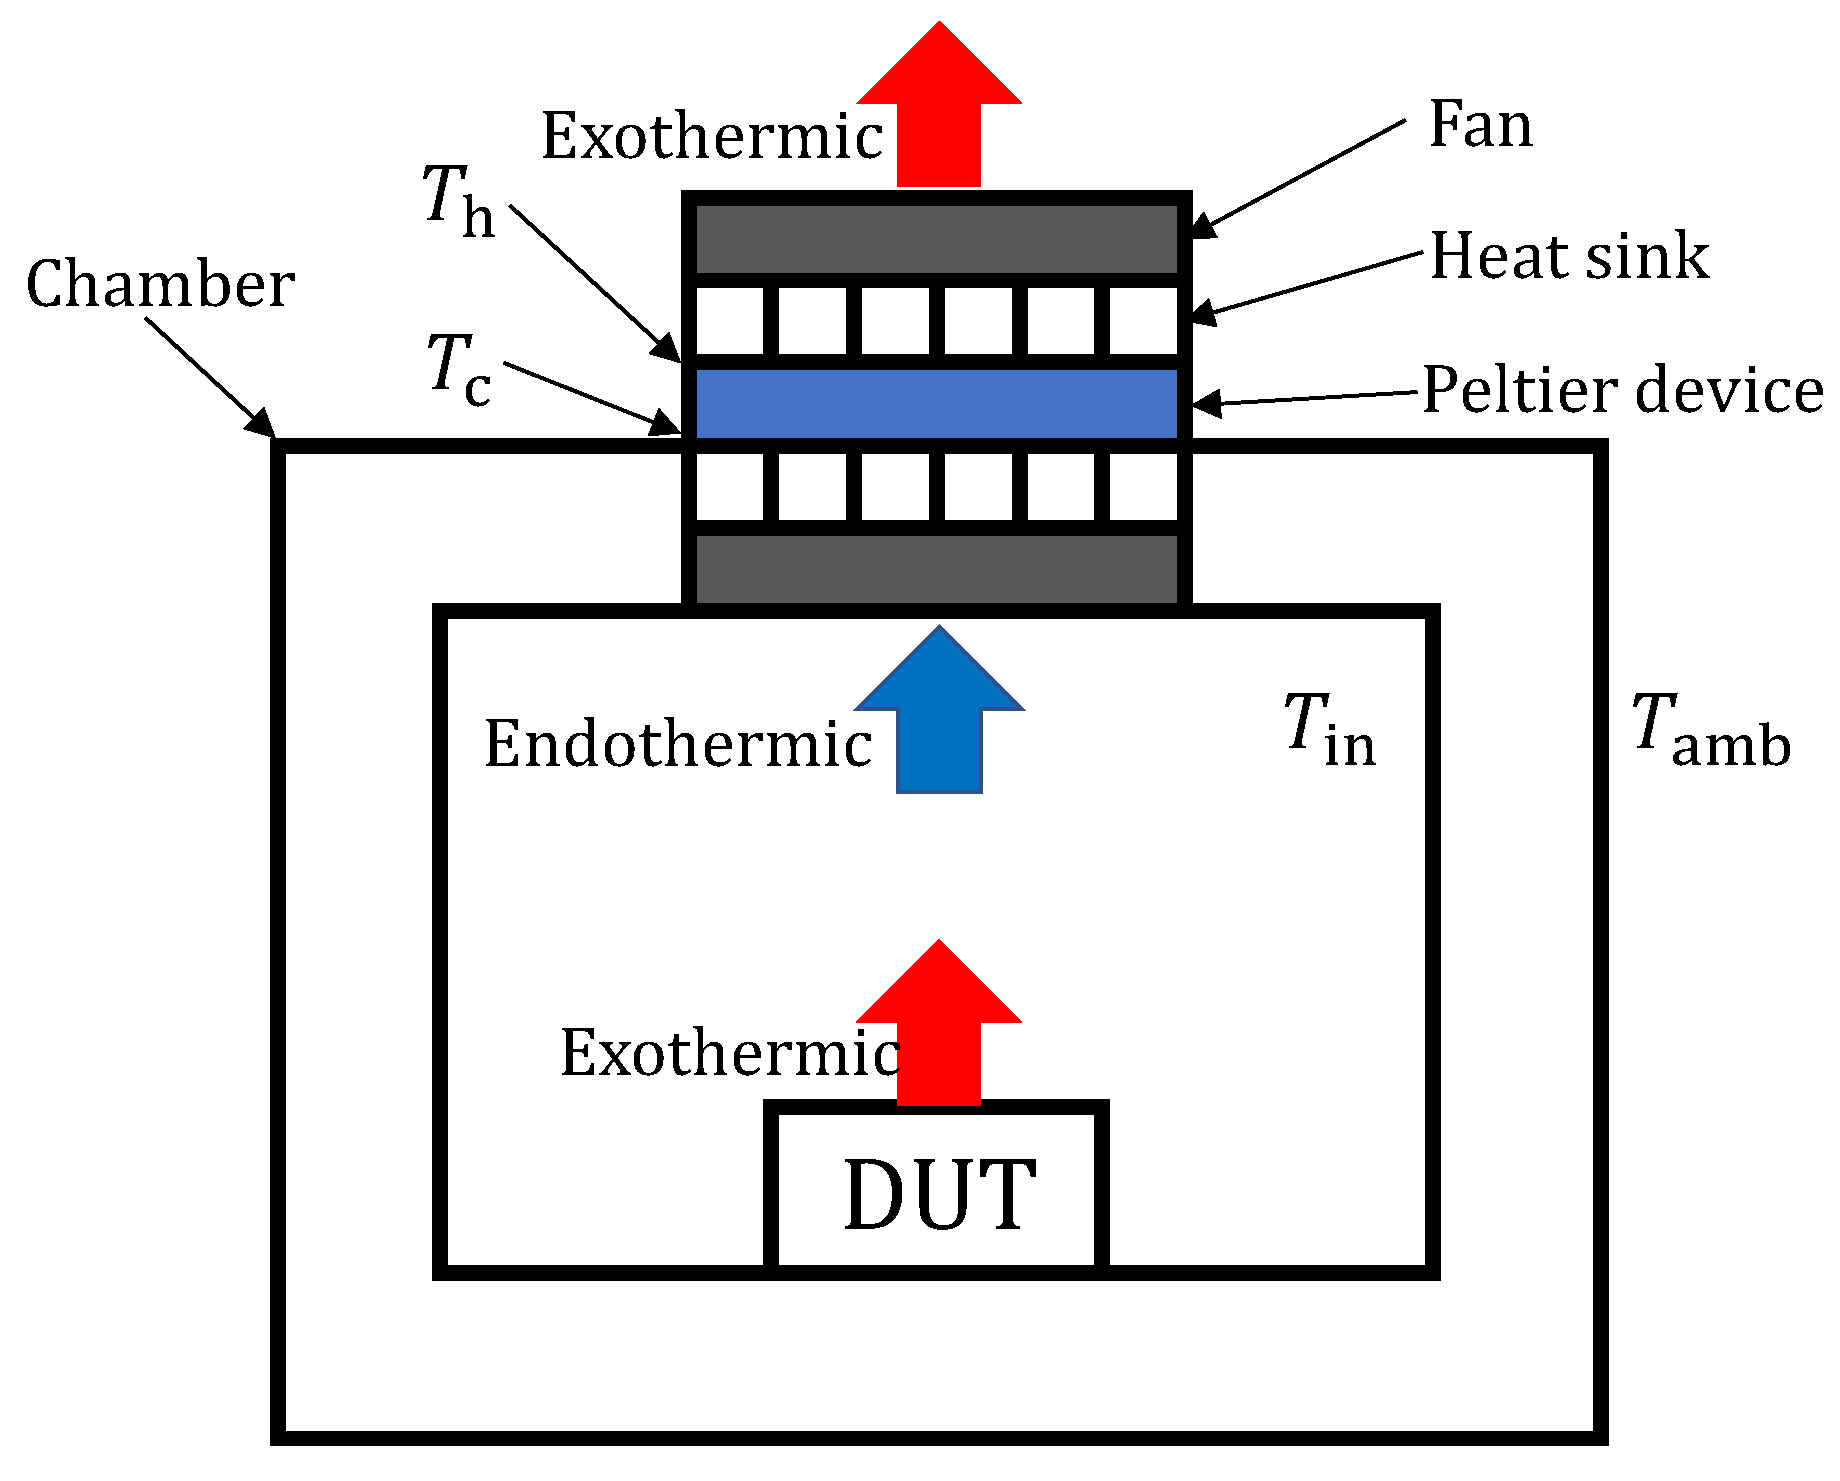
2.2. Principles of the Calorimetric System Using the Peltier Device

The structure of the calorimetric system using the Peltier device is shown in Figure 2. The entire system is made of styrofoam, with the Peltier device, temperature sensors, heat sinks, and fans installed. If there is a difference between the temperature inside the chamber T in and the ambient temperature T amb , the measurement accuracy will be degraded due to heat leakage P wall inside the chamber. P wall is shown as []
P wall = T in T amb R wall
where R wall is the thermal resistance of the chamber wall.
Figure 2. The structure of the calorimetric system using the Peltier device [].
When the DUT is driven, the temperature inside the container rises. This rise in temperature is absorbed by the Peltier device by passing a current through it. When T in and T amb become equal, all the heat released from the DUT is absorbed by the Peltier device. The power loss of the DUT, P loss , can be obtained from the heat absorption of the Peltier device Equation (1) as follows []:
P loss = S p T c I λ A d ( T h T c ) 1 2 r p I 2 Q F c
where Q F c is the power dissipation of the cold-side fan motor.

2.3. Modeling of the System

The system is modeled according to Newton’s cooling law and Fourier’s law. Newton’s cooling law is the heat transfer between a solid and a fluid and is given by Equation (5) []. Fourier’s law pertains to heat conduction in solids and is given by Equation (6) []. The parameters used in Equations (5) and (6) are shown in Table 2.
q = λ d T d x
q = α T T m
Table 2. Parameters of Newton’s cooling law and Fourier’s law.
In addition, thermal resistance and heat capacity are determined by a heat transfer phenomenon. The heat transfer phenomenon is divided into heat conduction, heat transfer, and radiation. Heat conduction is the propagation of thermal energy in a solid, and thermal resistance is given by Equation (7) using the heat transfer area A ( m 2 ) , length L (m), and thermal conductivity λ (W/mK) [].
R 1 = L A λ
Heat transfer is the heat transfer between the solid and the fluid, and the heat resistance is given by Equation (8) using the surface area S ( m 2 ) and the heat transfer coefficient h ( W / m 2 K ) .
R 2 = 1 S h
Radiation is the transfer of heat energy by electromagnetic waves. In the case of radiation from surface A with surface temperature T A (K) to surface B with surface temperature T B (K), the thermal resistance is given by Equation (9) using the Stefan–Boltzmann constant σ = 5.67 × 10 8 ( W / m 2 K 4 ) and surface emissivity f [].
R r = σ f ( T A 2 + T B 2 ) ( T A + T B )
The heat capacity C (J/K) is the amount of heat required to raise the temperature of an object by 1 (K). It is given by Equation (10) using the volume V ( m 3 ) , density ρ ( kg / m 3 ) , and specific heat c p ( J / kg · K ) of the object [].
C = ρ c p V
The differential equations for the heat conduction of the temperature T r of the DUT, the temperature T i n inside the system container, and the temperatures T c and T h of the cold side and hot side of the Peltier device are as follows []:
d T r d t = Q in C d T r T in C d R d
d T in d t = T c T in C in R c + T amb T in C in R w + T r T in C in R d + Q F c C in
d T c d t = S p I C c T c + r p I 2 2 C c + T h T c C c R p + T in T c C c R c
d T h d t = T amb T h C h R h S p I C h T h + r p I 2 2 C h + T c T h C h R p
where the direction of heating inside the chamber is defined as positive current. R p is the thermal resistance of the Peltier device and is given by the structure of the Peltier device as follows:
R p = 2 L a A p λ c + L s A p λ s
The parameters of the model are shown in Table 3.
Table 3. Simulation parameters.

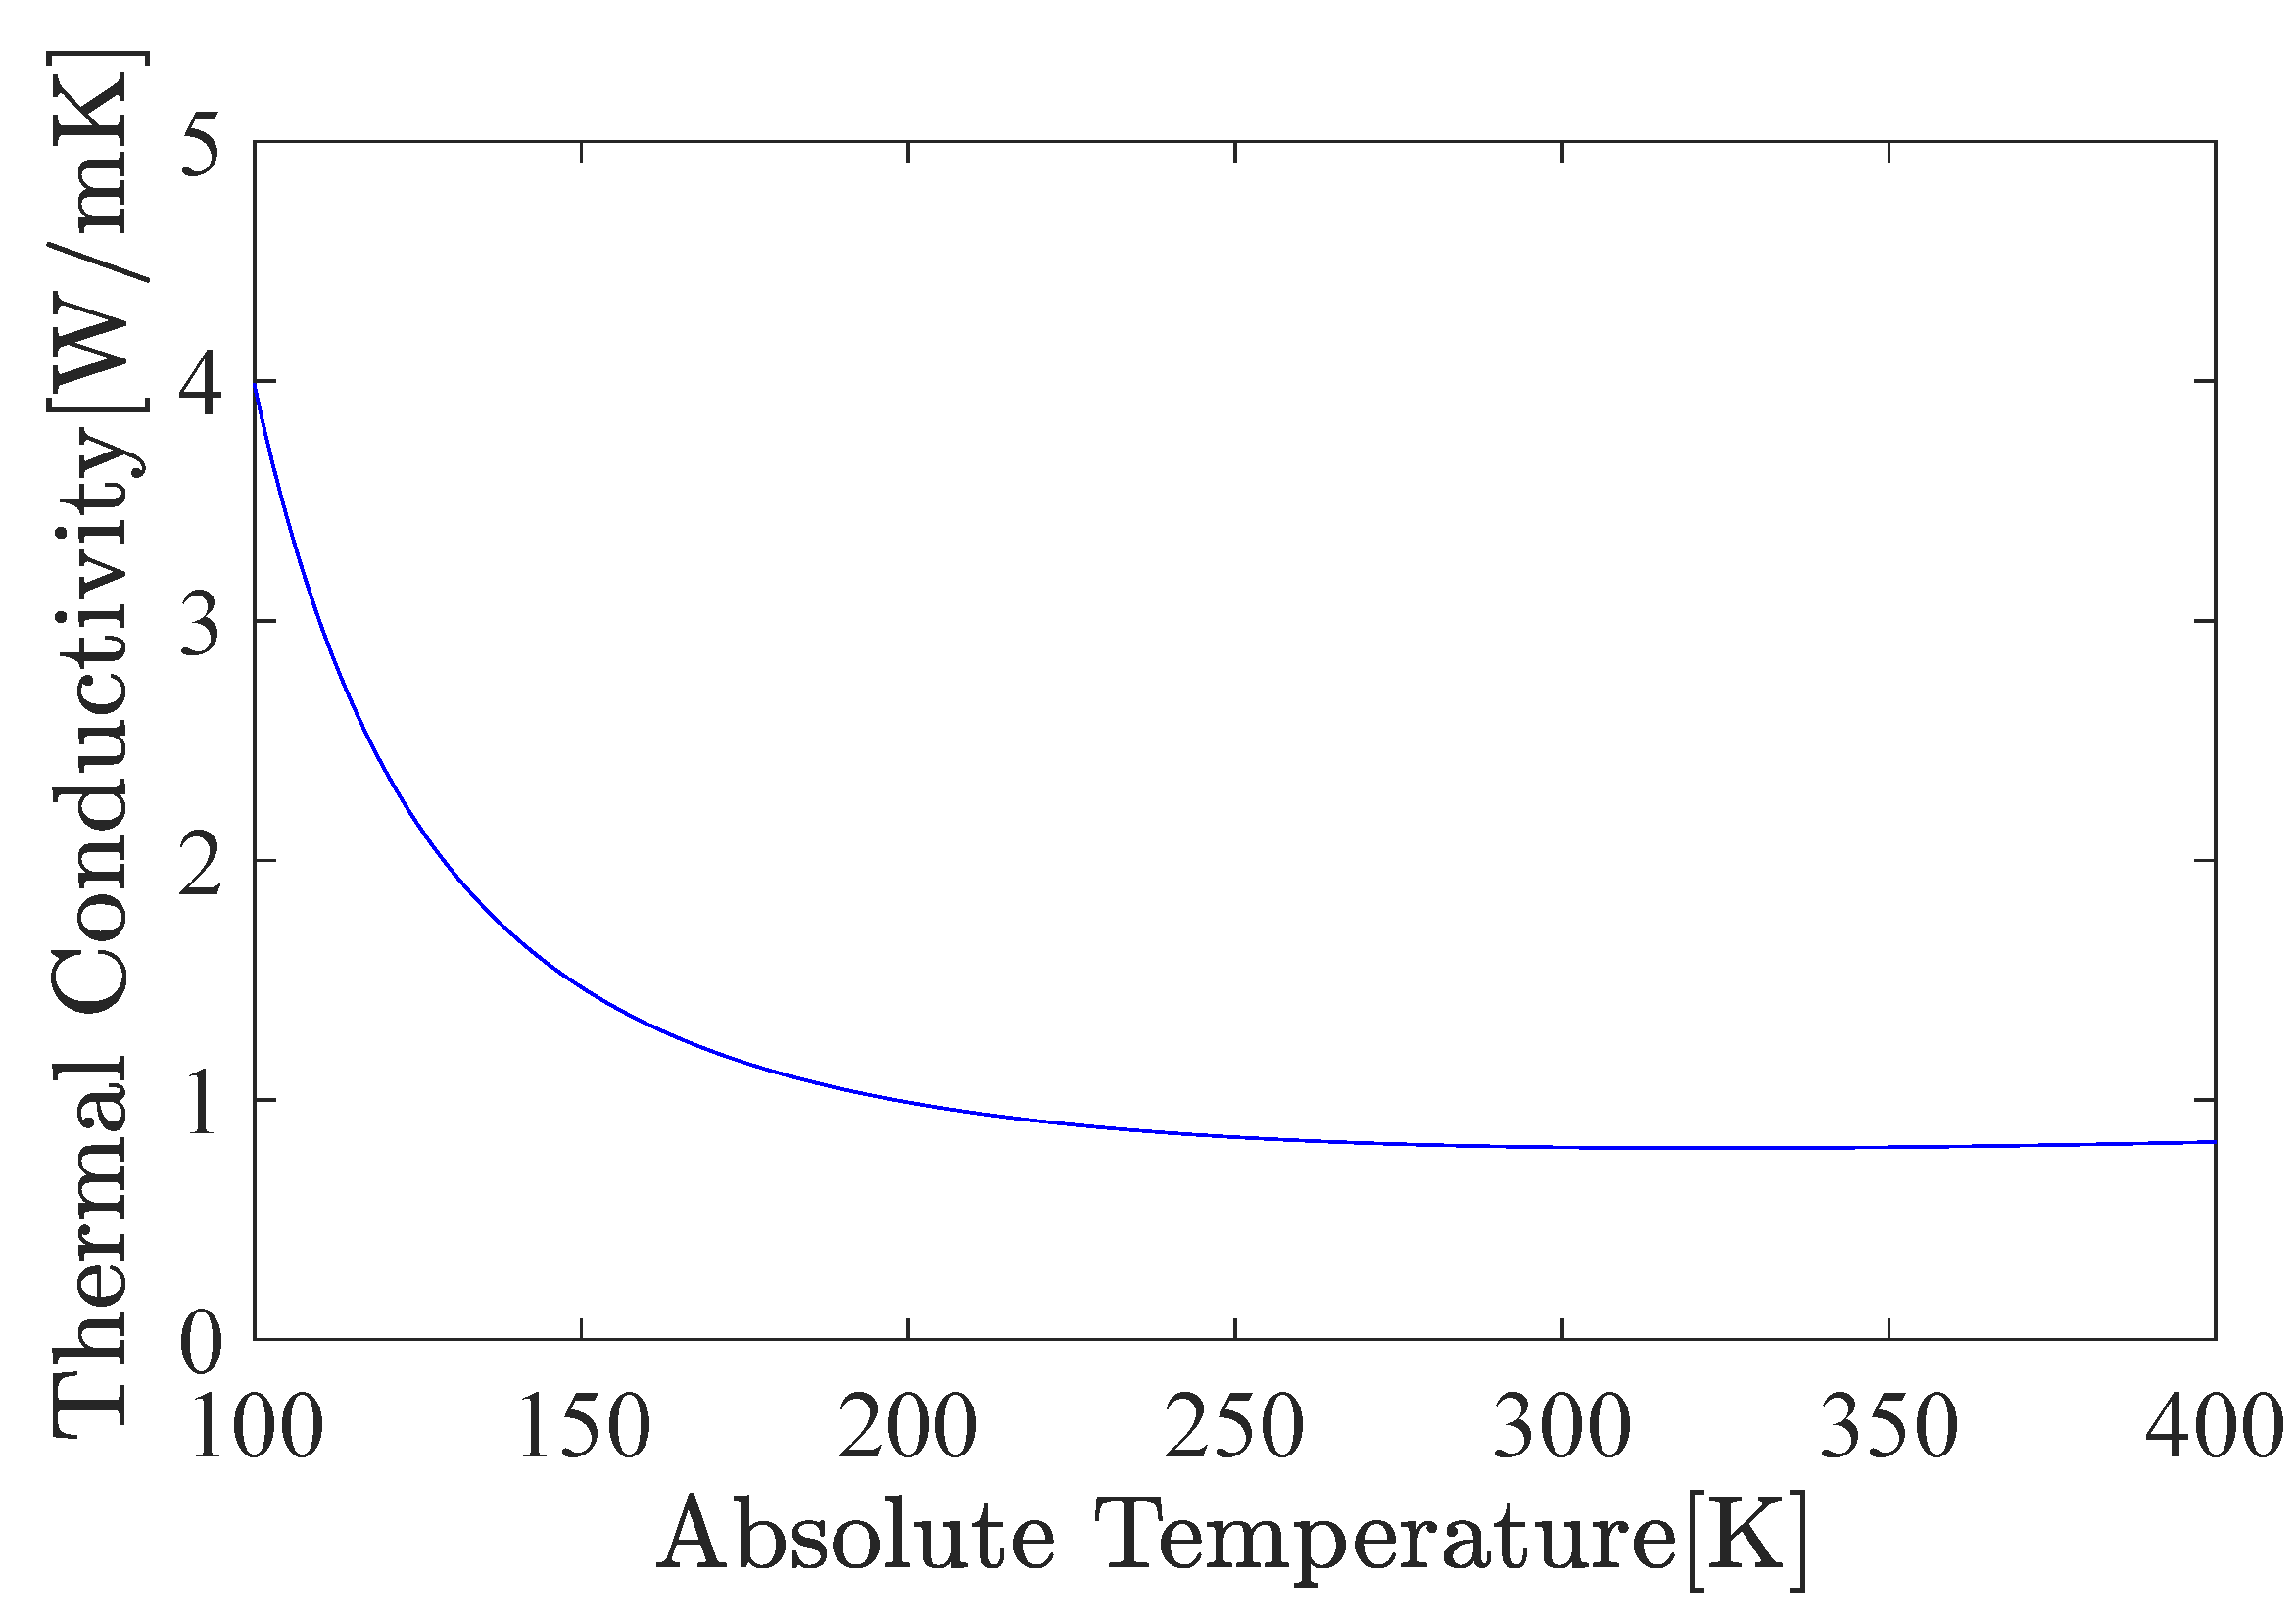
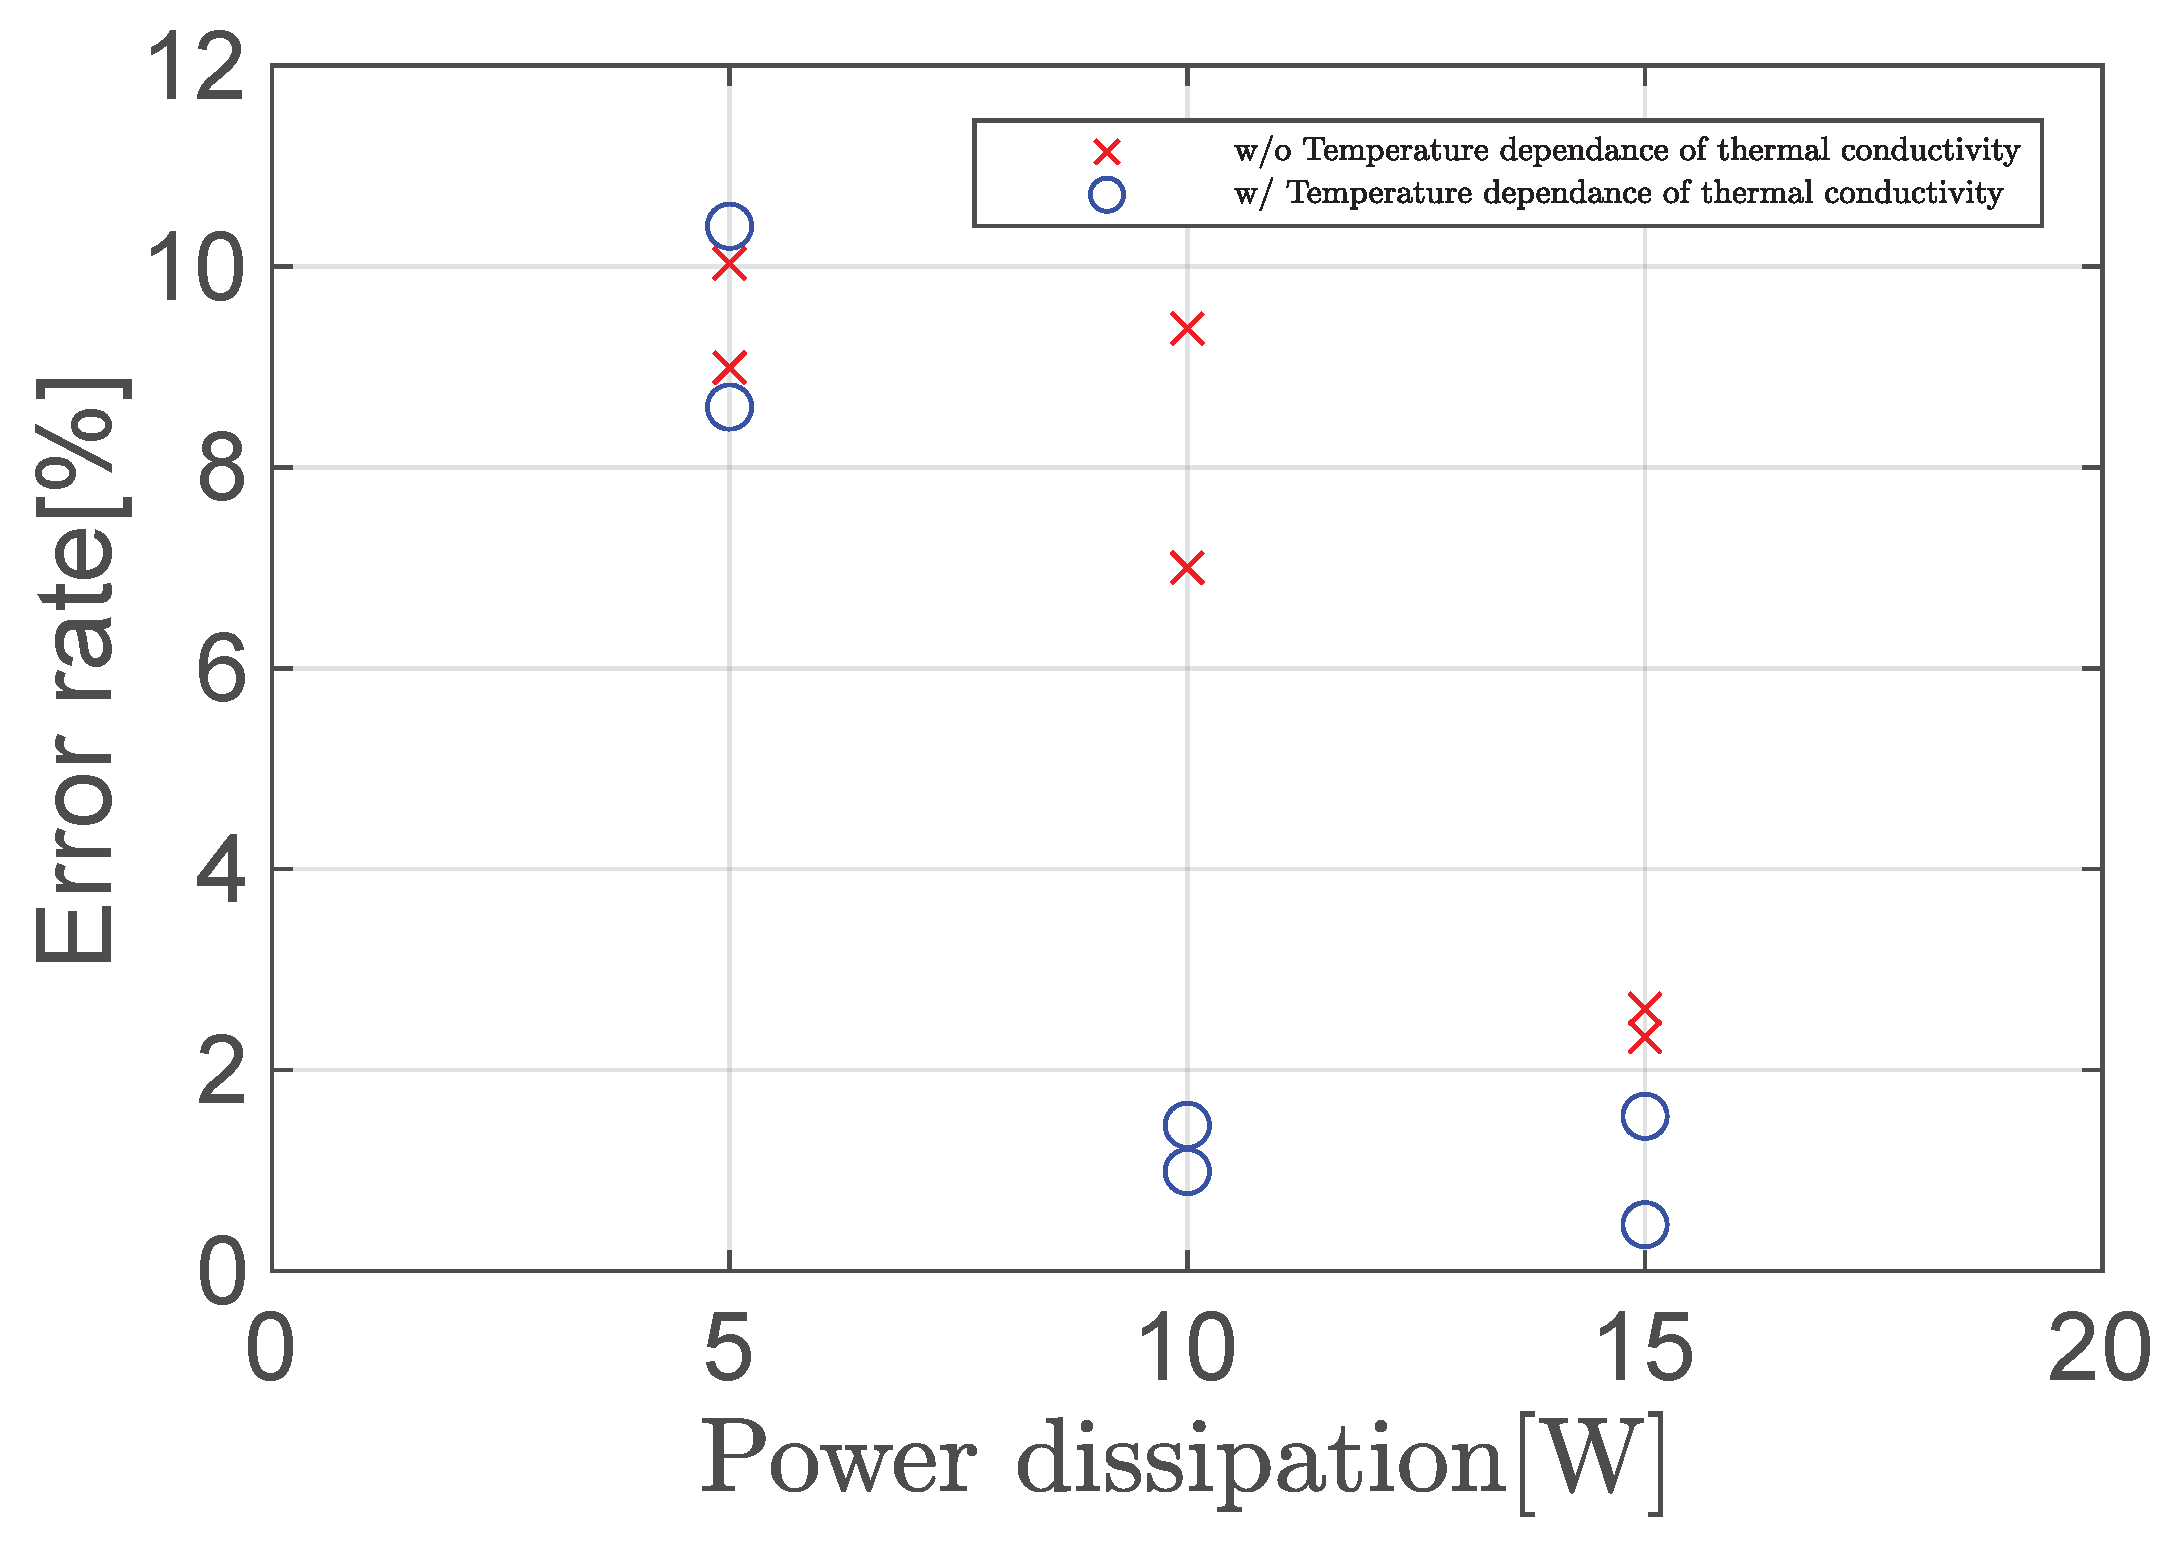
2.4. Temperature Dependence of Thermal Conductivity

Thermal conductivity can be divided into electronic thermal conductivity λ e and lattice thermal conductivity λ l , as shown in Equation (16) [].
λ = λ e + λ l
The electronic thermal conductivity λ e is the energy transfer based on conduction electrons and is expressed according to Wiedemann–Franz’s law as follows:
λ e = L o σ T
where L ( W Ω / K 2 ) is the Lorentz constant, σ ( 1 / Ω m ) is the electrical conductivity of the material, and T ( K ) is the absolute temperature. Because of the inclusion of absolute temperature in Equation (17), the electronic thermal conductivity varies with temperature.
Lattice heat conduction is the heat conduction caused by the lattice vibrations of atoms and molecules in a crystal. The atoms and molecules in a crystal undergo thermal vibrations as the temperature rises, and since these vibrations are complex and difficult to schematize, the concept of phonons is introduced. By introducing the concept of phonons, thermal conductivity can be expressed using the mean free path of phonons. The mean free path of a phonon is shown as
l l = a exp b θ D T
where T ( K ) is absolute temperature and θ D ( K ) is Debye temperature. Debye temperature is a physical property that converts Debye frequency into a temperature dimension, and Debye frequency is a physical property that contributes to the specific heat of a solid. Debye temperature θ D ( K ) and Debye frequency ω D (1/s) are given in Equations (19) and (20), respectively.
θ D = k B ω D
ω D = 6 π 2 N c m 2 V 3
The mean free path in Equation (18) is used to express the lattice thermal conductivity as follows:
λ l = 1 3 c v l l = 1 3 c v a exp b k B 6 π 2 N c m 2 V 3 1 T
Since Equation (21) includes absolute temperature, the lattice thermal conductivity varies with temperature.
From Equations (16), (17), and (21), the thermal conductivity can be expressed as follows:
λ = λ e + λ l = L o σ T + 1 3 c v a exp b k B 6 π 2 N c m 2 V 3 1 T
The values of each parameter in the Peltier device are shown in Table 4.
Table 4. Parameters of thermal conductivity.
The temperature dependence of the thermal conductivity in the Peltier device is shown in Figure 3.
Figure 3. Temperature dependence of thermal conductivity [].

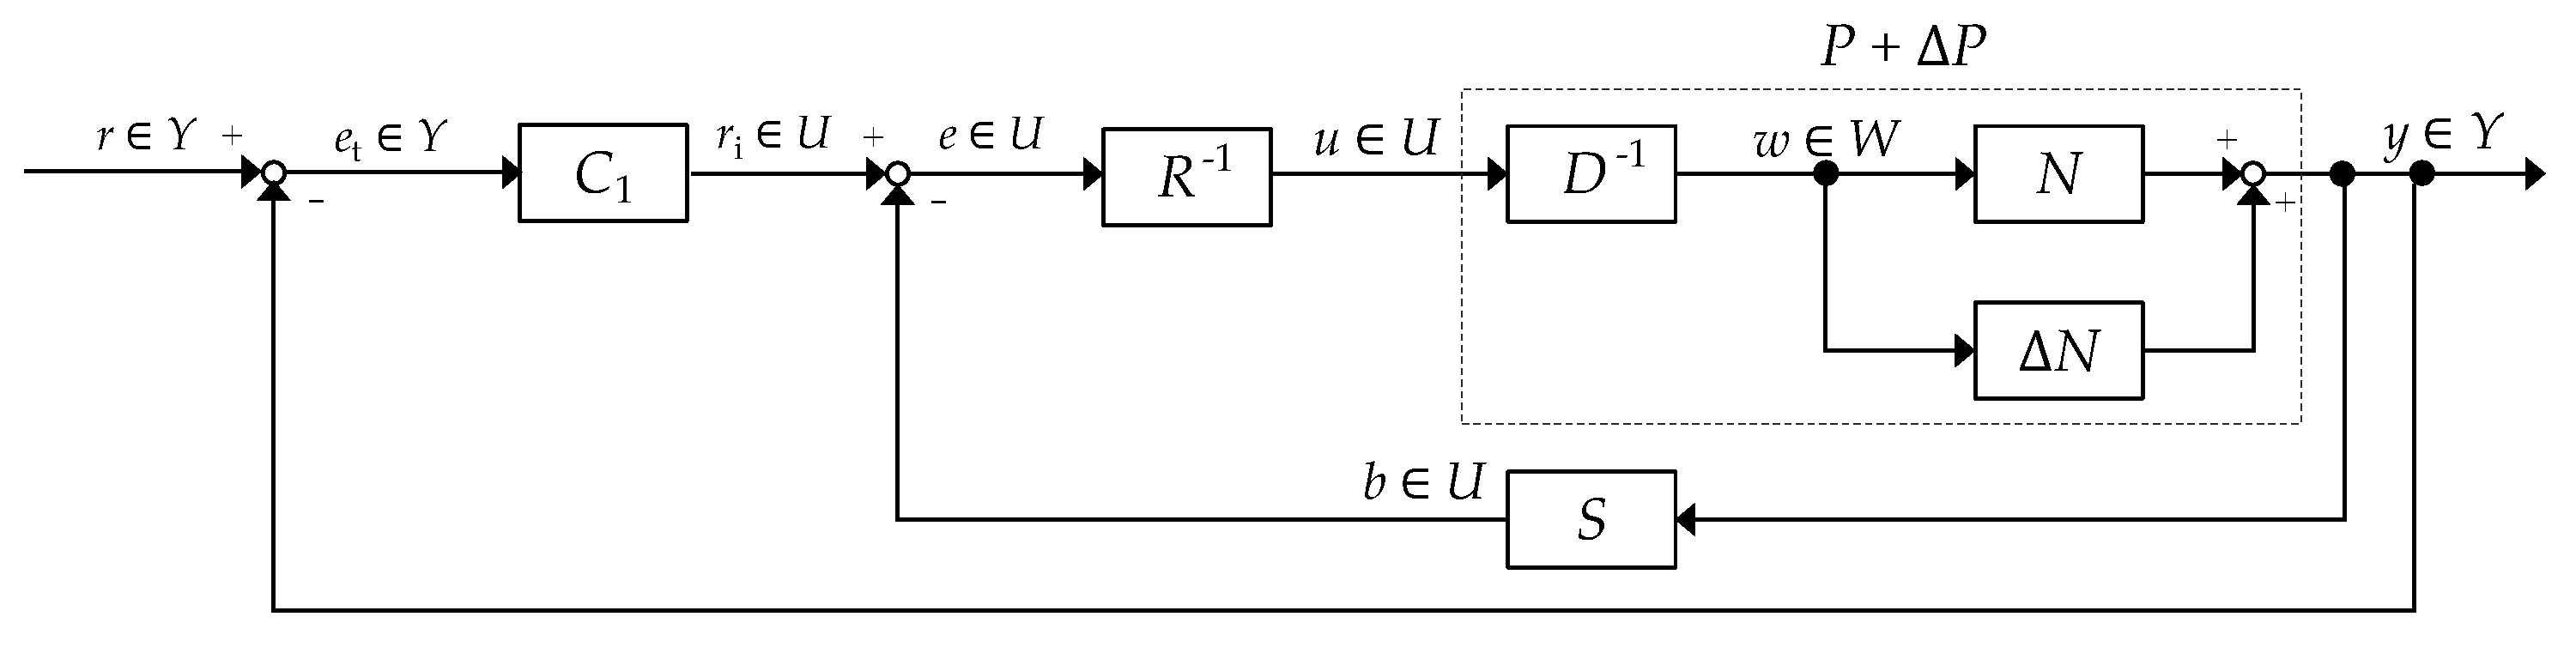
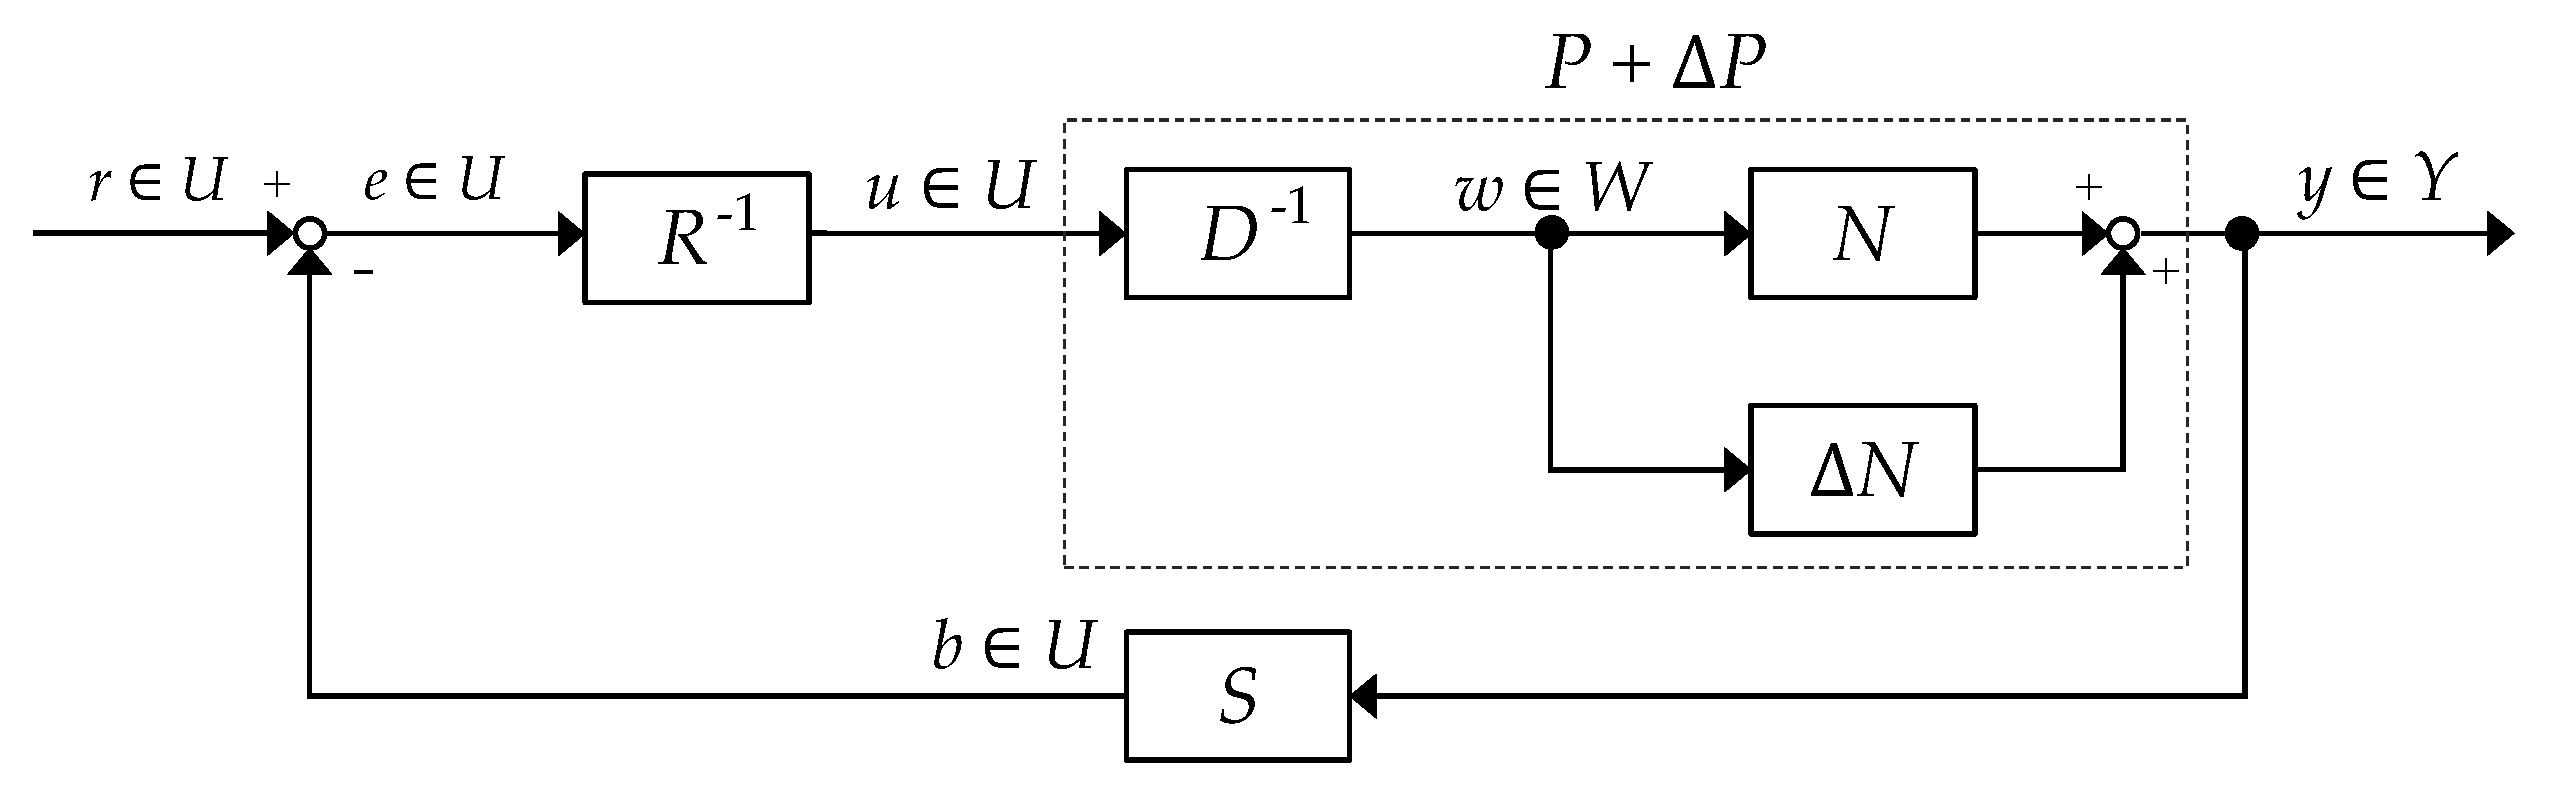
2.5. Operator-Based Nonlinear Control Feedback System Design

Figure 4 shows the proposed nonlinear feedback control system using robust right coprime factorization based on operator theory. The detailed information about operator theory is written in [,,,,,,,,].
Figure 4. The nonlinear feedback control system.
The given plant operator P : U Y is said to have a right factorization if there exist a linear space W and two stable operators D : W Y and N : W Y such that D is invertible from U to W and P = N D 1 on U. Such a factorization of P is denoted as ( N , D ) , and the space W is called a quasi-state space of P. In addition, P is said to be a right coprime factorization if there exist two stable operators S : Y U and R : U U that satisfy the Bezout identity
S N + R D = M for M U ( W , U ) ,
where R is invertible and M U ( W , U ) means M is unimodular.
The nominal plant P is shown as
P : C in R c d 2 T in d t 2 + 1 + R c R w + R c R d d T in d t 1 C c R c T in = S p T c C c u ( t ) + r p 2 C c u 2 ( t ) + T h T c C c R p T c C c R c y ( t ) = T in
where the input signal u ( t ) is the flowing current through the Peltier device and the output signal y ( t ) of the plant is the temperature T in in the system chamber.
The right factorization of the nominal plant is performed and N, D designed to satisfy P = N D 1 are shown as
N : C in R c d 2 T in d t 2 + 1 + R c R w + R c R d d T in d t 1 C c R c T in = w ( t ) + 1 C c R p ( T h T c ) 1 C c R c T c y ( t ) = T in
D 1 ( u ( t ) ) = S p T c C c u ( t ) + r p 2 C c u 2 ( t )
where N is stable and D is stable and invertible.
S and R are designed to satisfy the Bezout identity in Equation (23) as follows:
S ( y ( t ) ) = ( 1 B ) C in R c d 2 y ( t ) d t 2 + 1 + R c R w + R c R d d y ( t ) d t
1 C c R c y ( t ) T h T c C c R p + T c C c R c
R 1 ( e ( t ) ) = S p T c r p + S p T c r p 2 + 2 C c e ( t ) r p B
where S is stable and R is stable and invertible.
The unmodeled uncertainties and noise are regarded as bounded perturbation Δ P , and the overall plant P + Δ P can be described as
( P + Δ P ) : C in R c d 2 T in d t 2 + 1 + R c R w + R c R d d T in d t 1 C c R c T in = S p T c C c u ( t ) + r p 2 C c u 2 ( t ) + T h T c C c R p T c C c R c y ( t ) = ( 1 + Δ ) T in
Then, the right factorization of the overall plant P + Δ P can be redescribed by using Δ N , which is the numerator of the coprime factorization presentation of Δ P :
P + Δ P = N + Δ N D 1
The right factorization of P + Δ P is as follows:
( N + Δ N ) : C in R c d 2 T in d t 2 + 1 + R c R w + R c R d d T in d t 1 C c R c T in = w ( t ) + 1 C c R p ( T h T c ) 1 C c R c T c y ( t ) = ( 1 + Δ ) T in
D 1 ( u ( t ) ) = S p T c C c u ( t ) + r p 2 C c u 2 ( t )
where Δ N in respect of the uncertainties and noise is bounded and operators N + Δ N are stable.
When Equation (23) and
S N + Δ N S N I 1 Lip < 1
are satisfied, the robust stability of the plant with uncertainty P + Δ P can be guaranteed [,,,,,,,,].
The block diagram of the entire calorimetric system is shown in Figure 5. C 1 is a controller that compensates for the tracking of the target value of the temperature in the chamber, and the PI controller is used. The output of the controller is shown as
C ( e t ( t ) ) : r i ( t ) = K P T e t ( t ) + K I T 0 t e t ( t ) d τ
where K P T is the proportional gain and K I T is the integral gain.
Figure 5. Block diagram of calorimetric system.

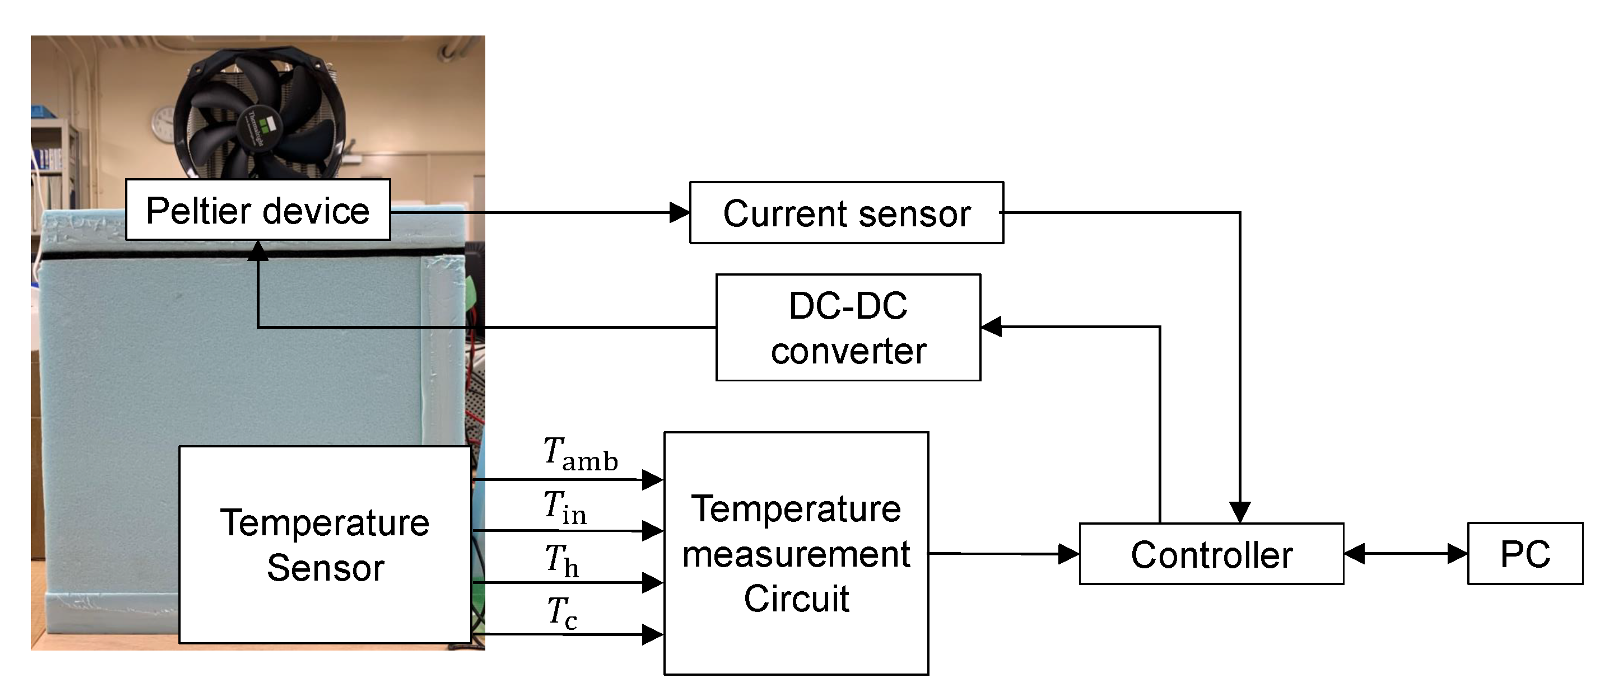
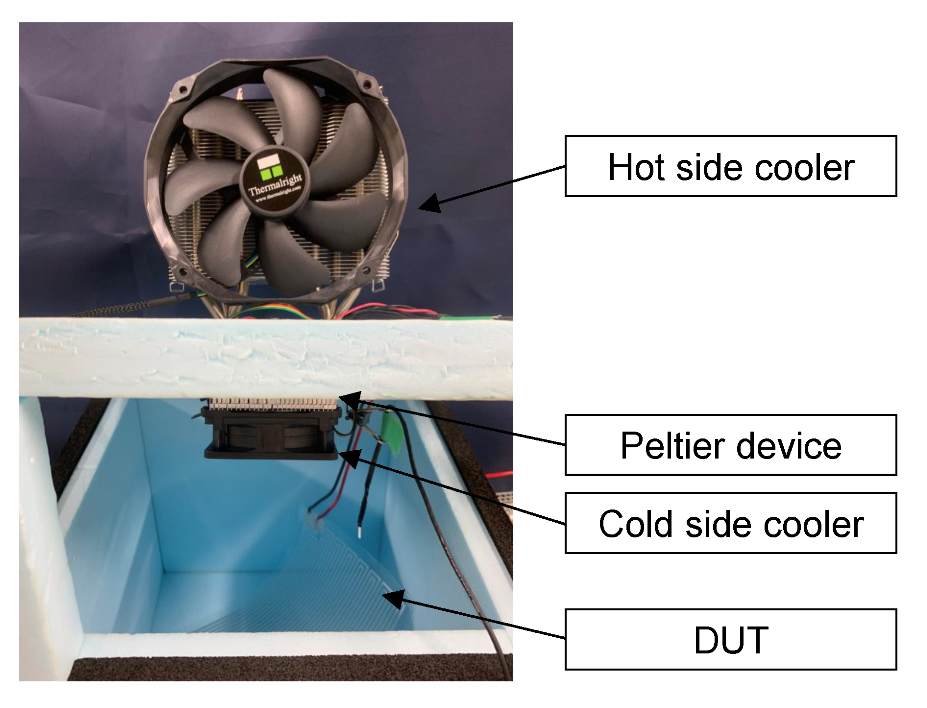
2.6. Experimental System

Figure 6 shows the experimental system and Figure 7 shows the inside of the chamber. The procedure of the experiment is to operate the aluminum resistor used as a substitute for the DUT to achieve the desired power consumption in the chamber. The power input to the aluminum resistor is supplied from the DC power supply, and the DC power supply is adjusted to match the desired power, such as 5, 10, and 15 (W). The temperature inside the chamber rises due to the amount of heat released from the aluminum resistance. At this time, a current is applied to the Peltier device to cool the chamber so that the temperature inside the chamber follows the ambient temperature. When the temperature inside the chamber matches the ambient temperature, the amount of heat generated by the aluminum resistor is calculated using Equation (4) from the temperature of both sides of the Peltier device and the current applied to the Peltier device.
Figure 6. Implementation of the experimental system [].
Figure 7. Realized experimental system [].
The materials used in the calorimetric system are shown in Table 5.
Table 5. Materials used for calorimetric system [].

3. Results and Discussion

This section shows and discusses the simulation results and the experimental results to verify the effectiveness of the proposed control system. The simulation results were obtained using MATLAB/Simulink, which is one of the effective software products for system engineering. The experiment was conducted with four conditions to compare the results. Section 3.1 and Section 3.2 show the simulation and experimental results of the proposed method, respectively.

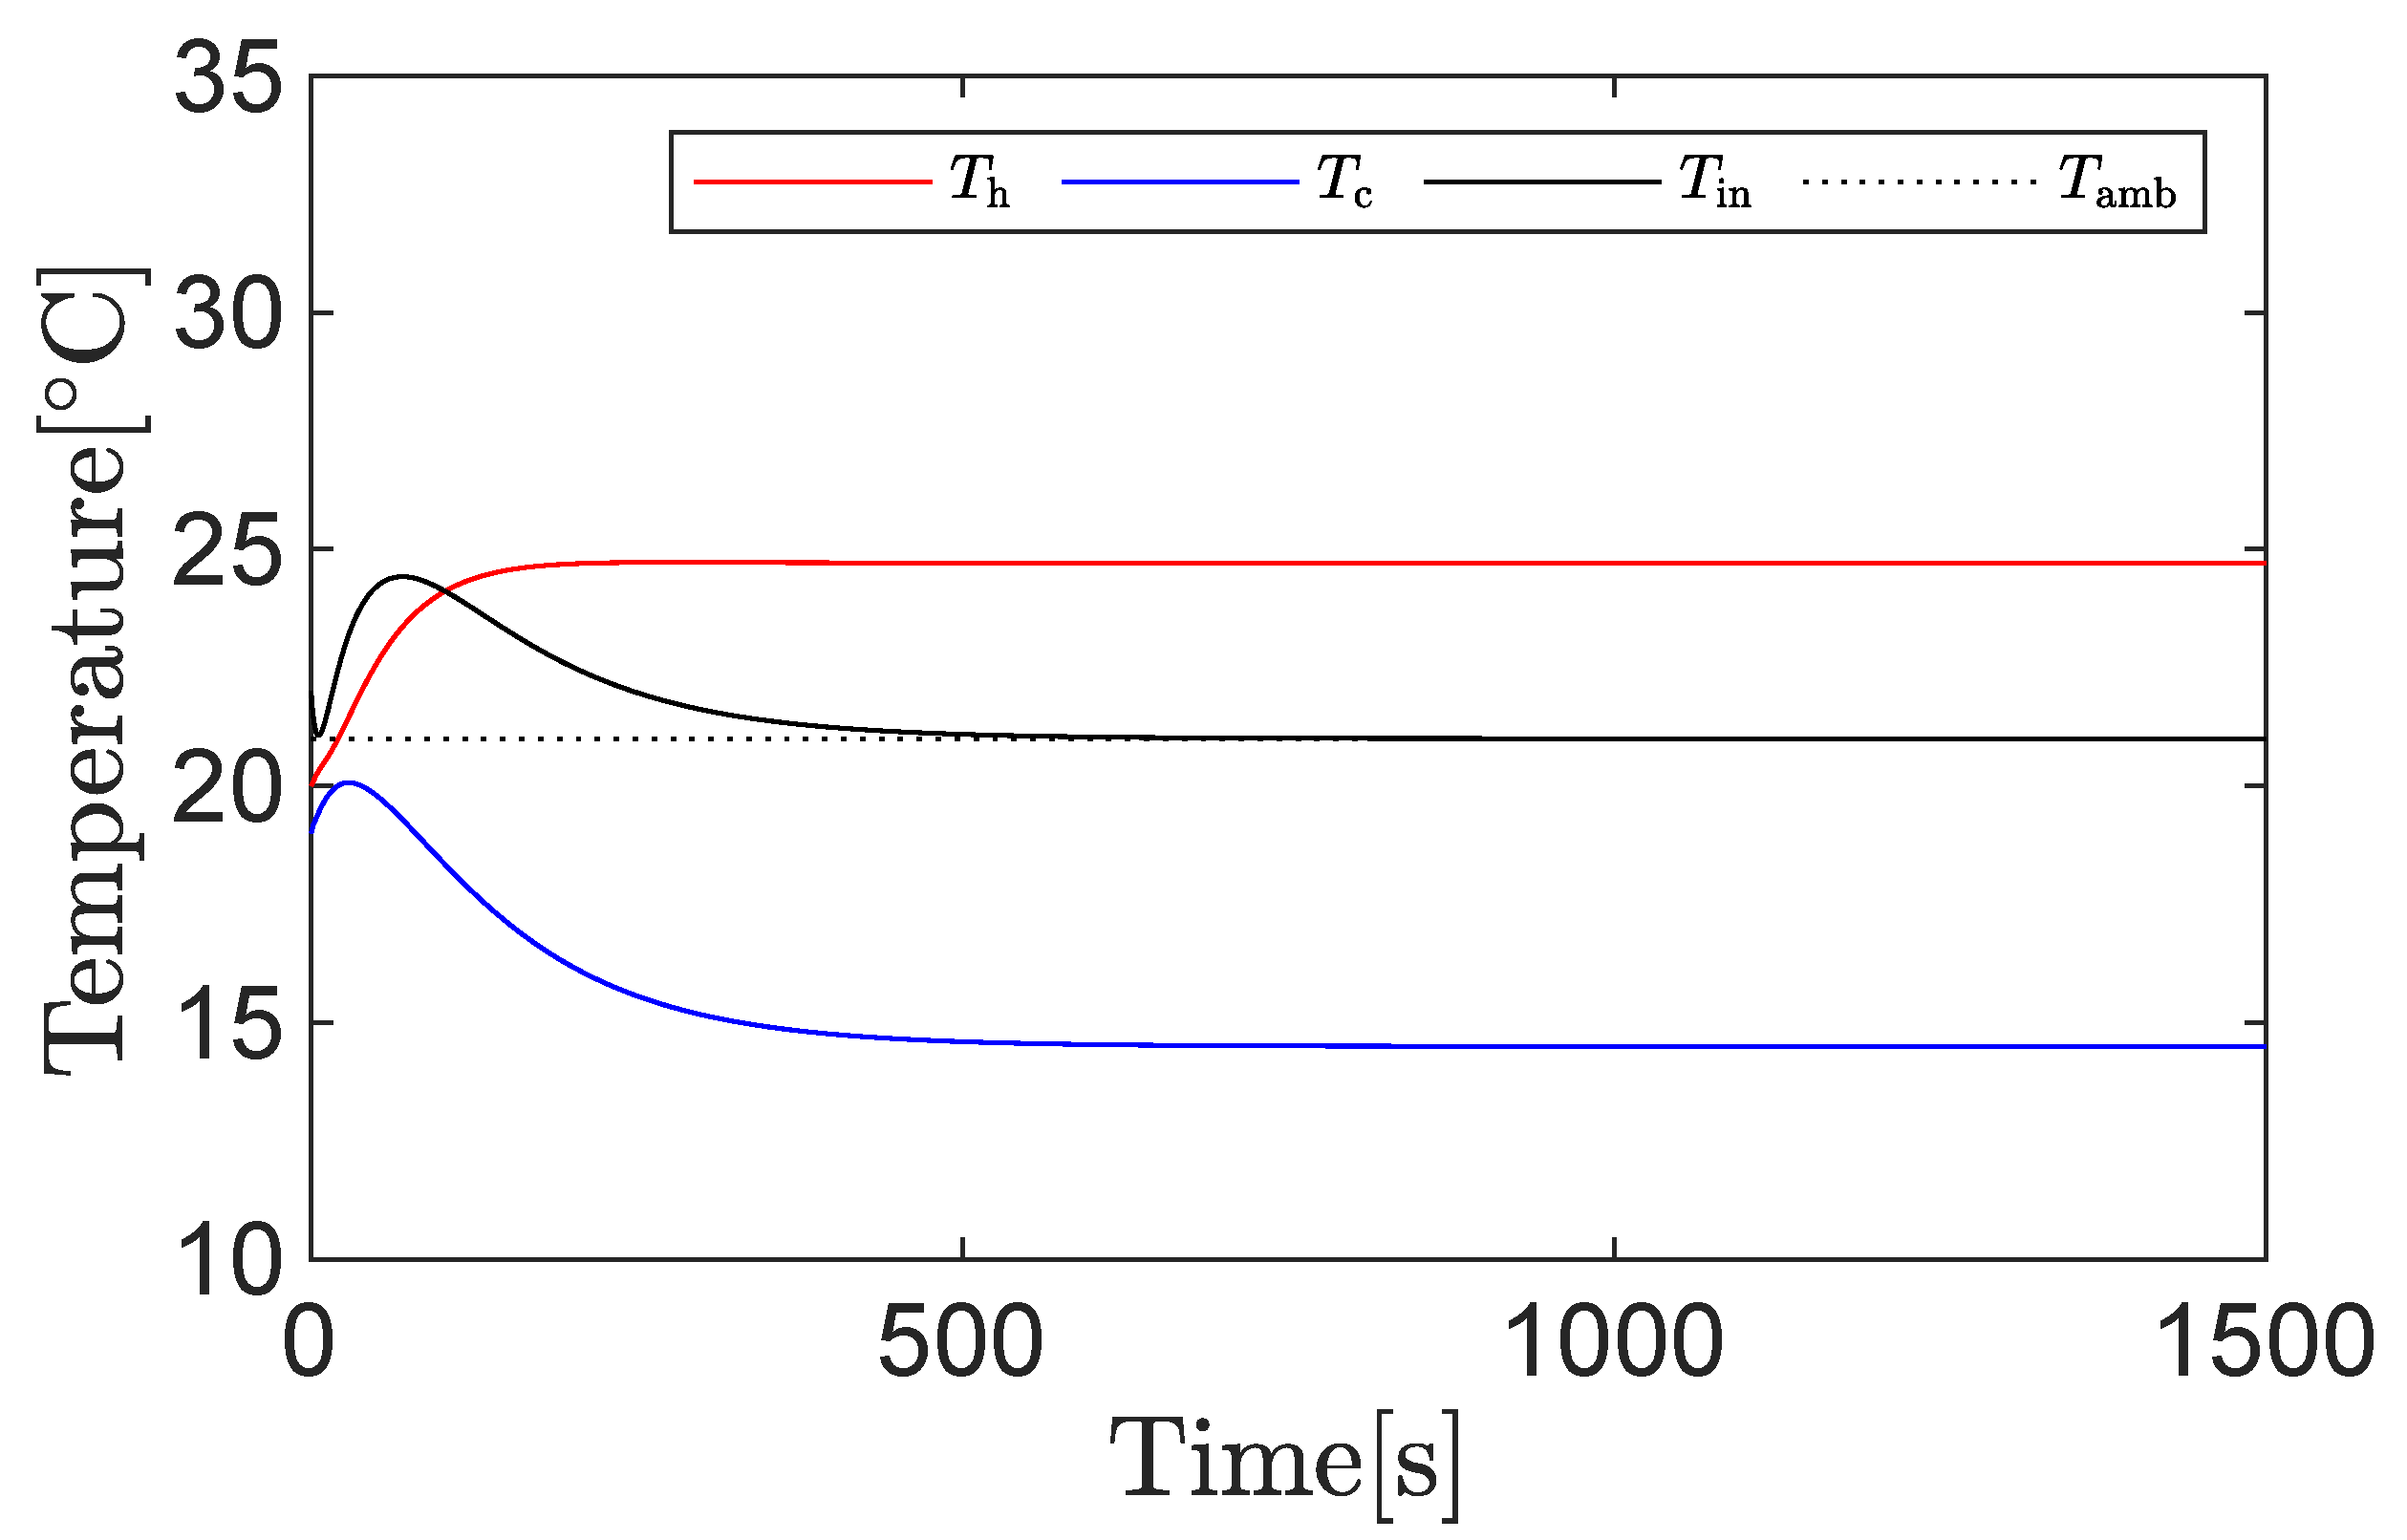
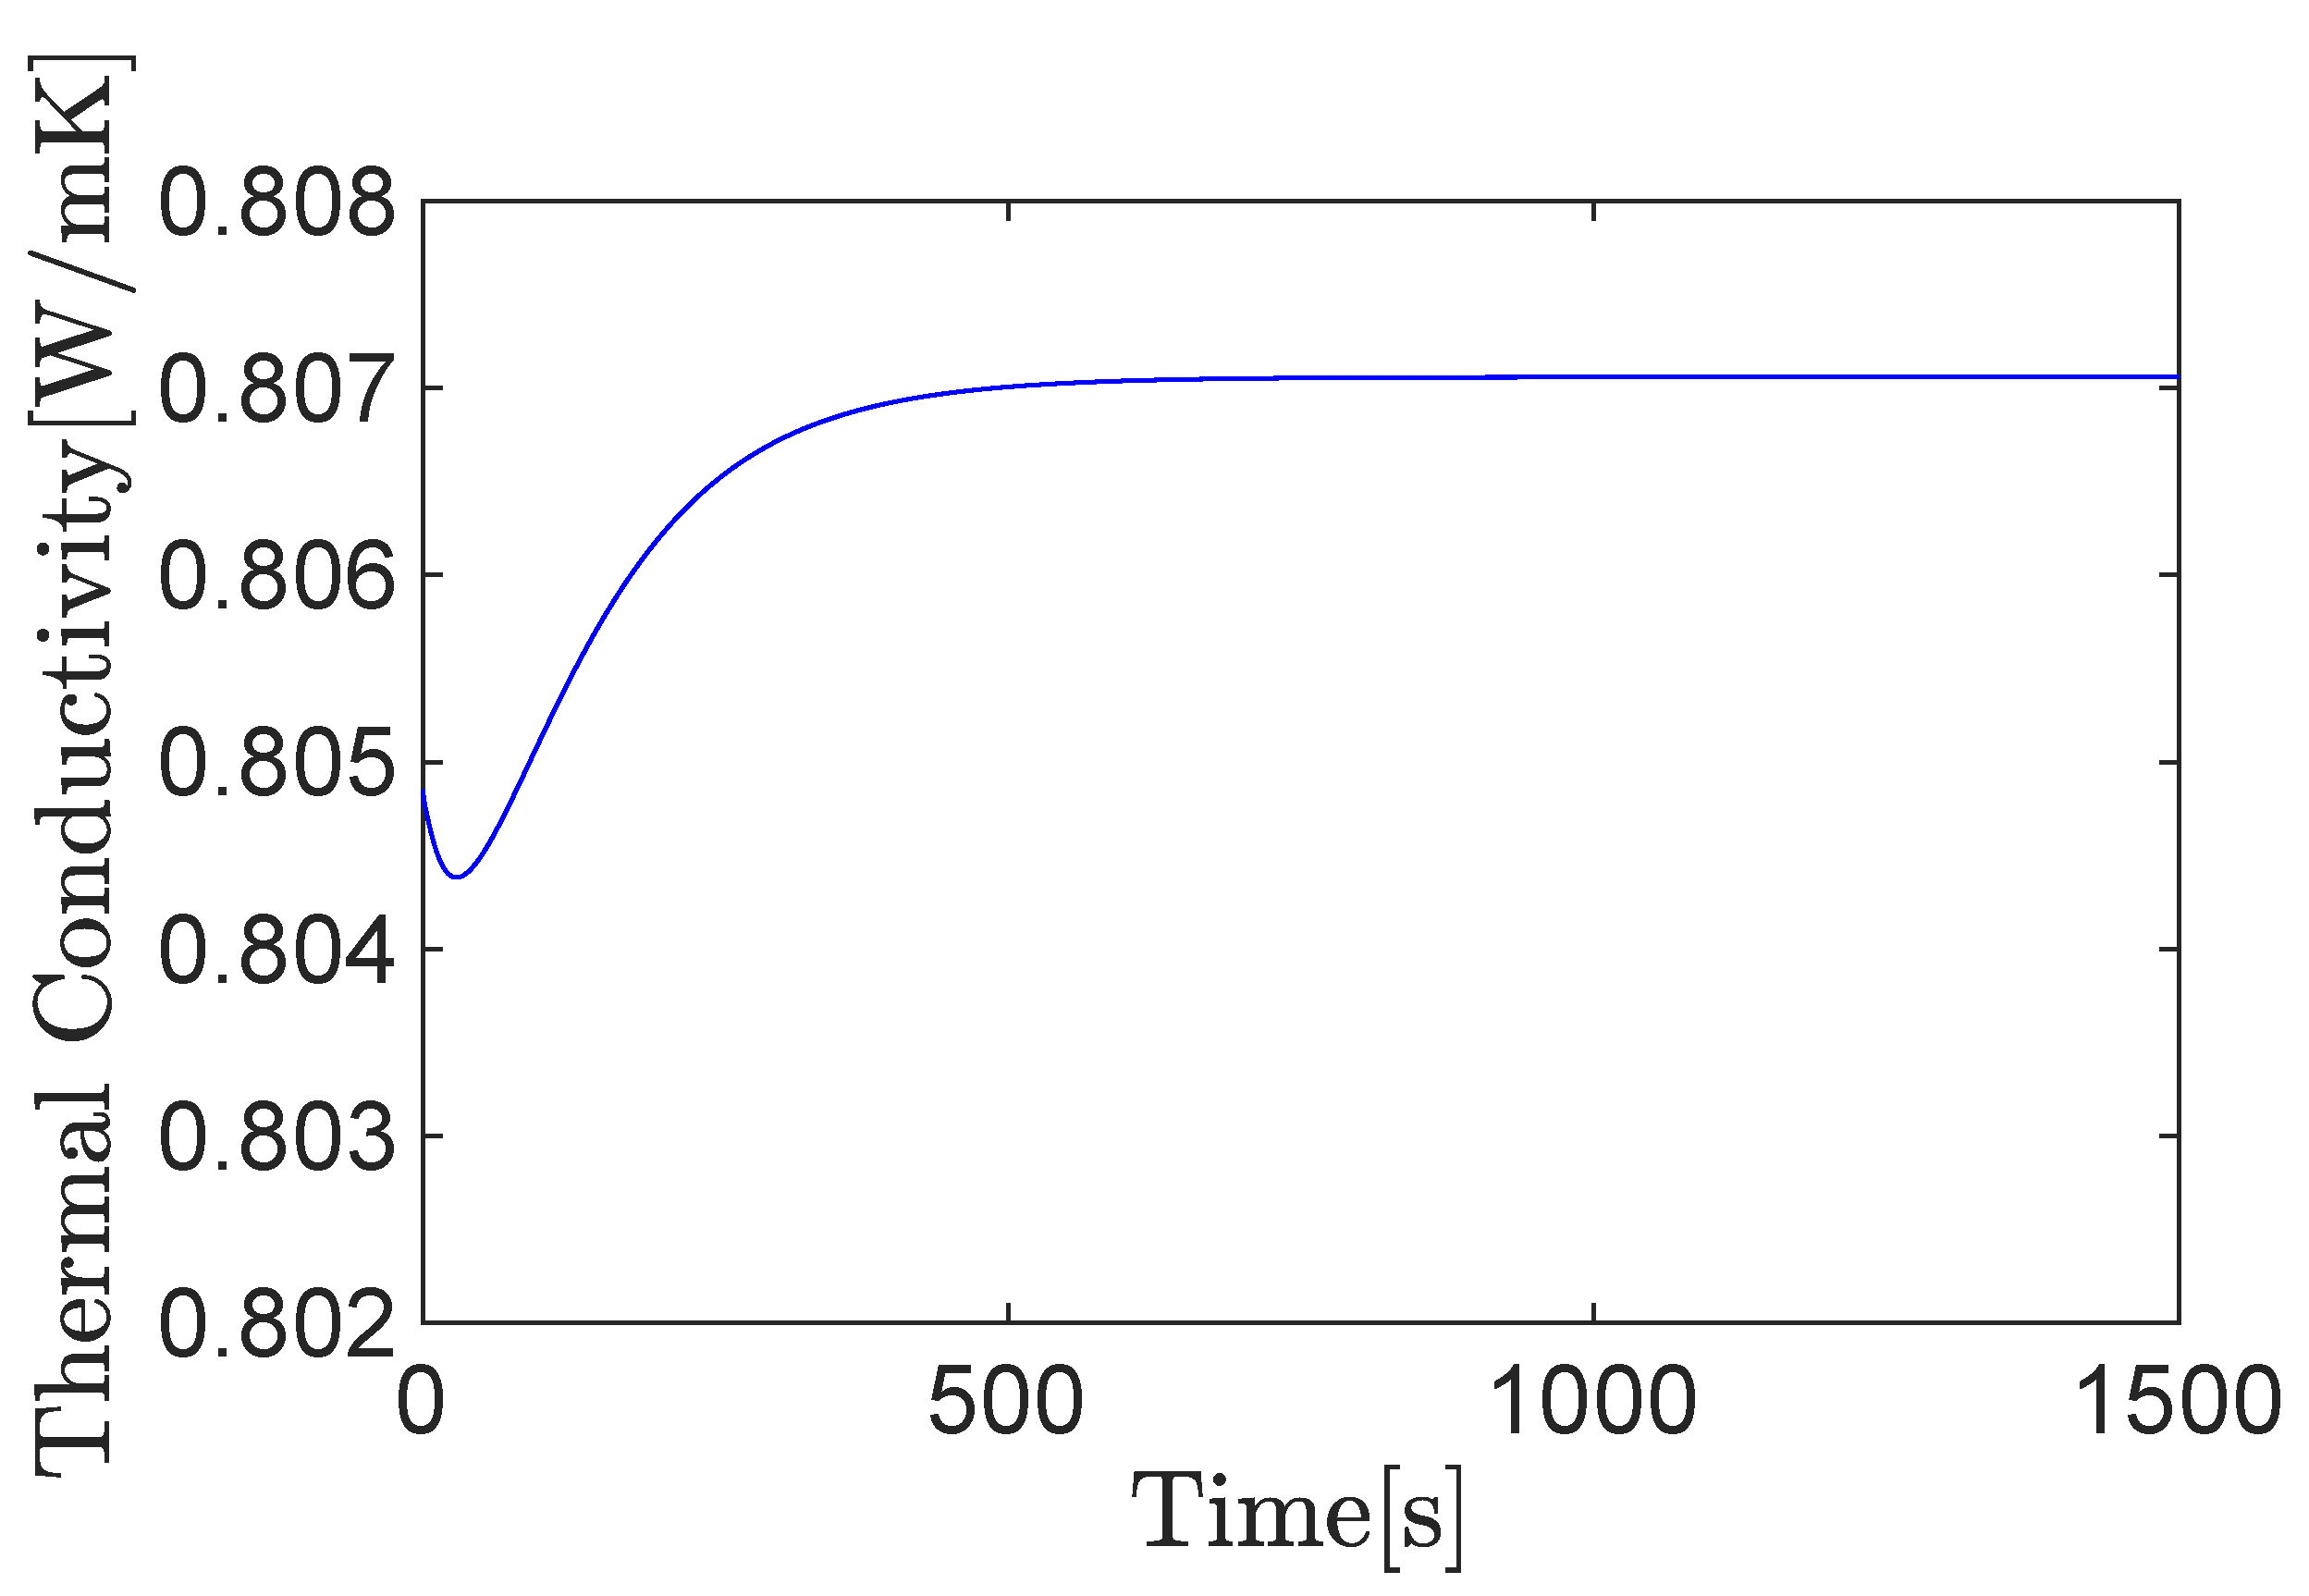
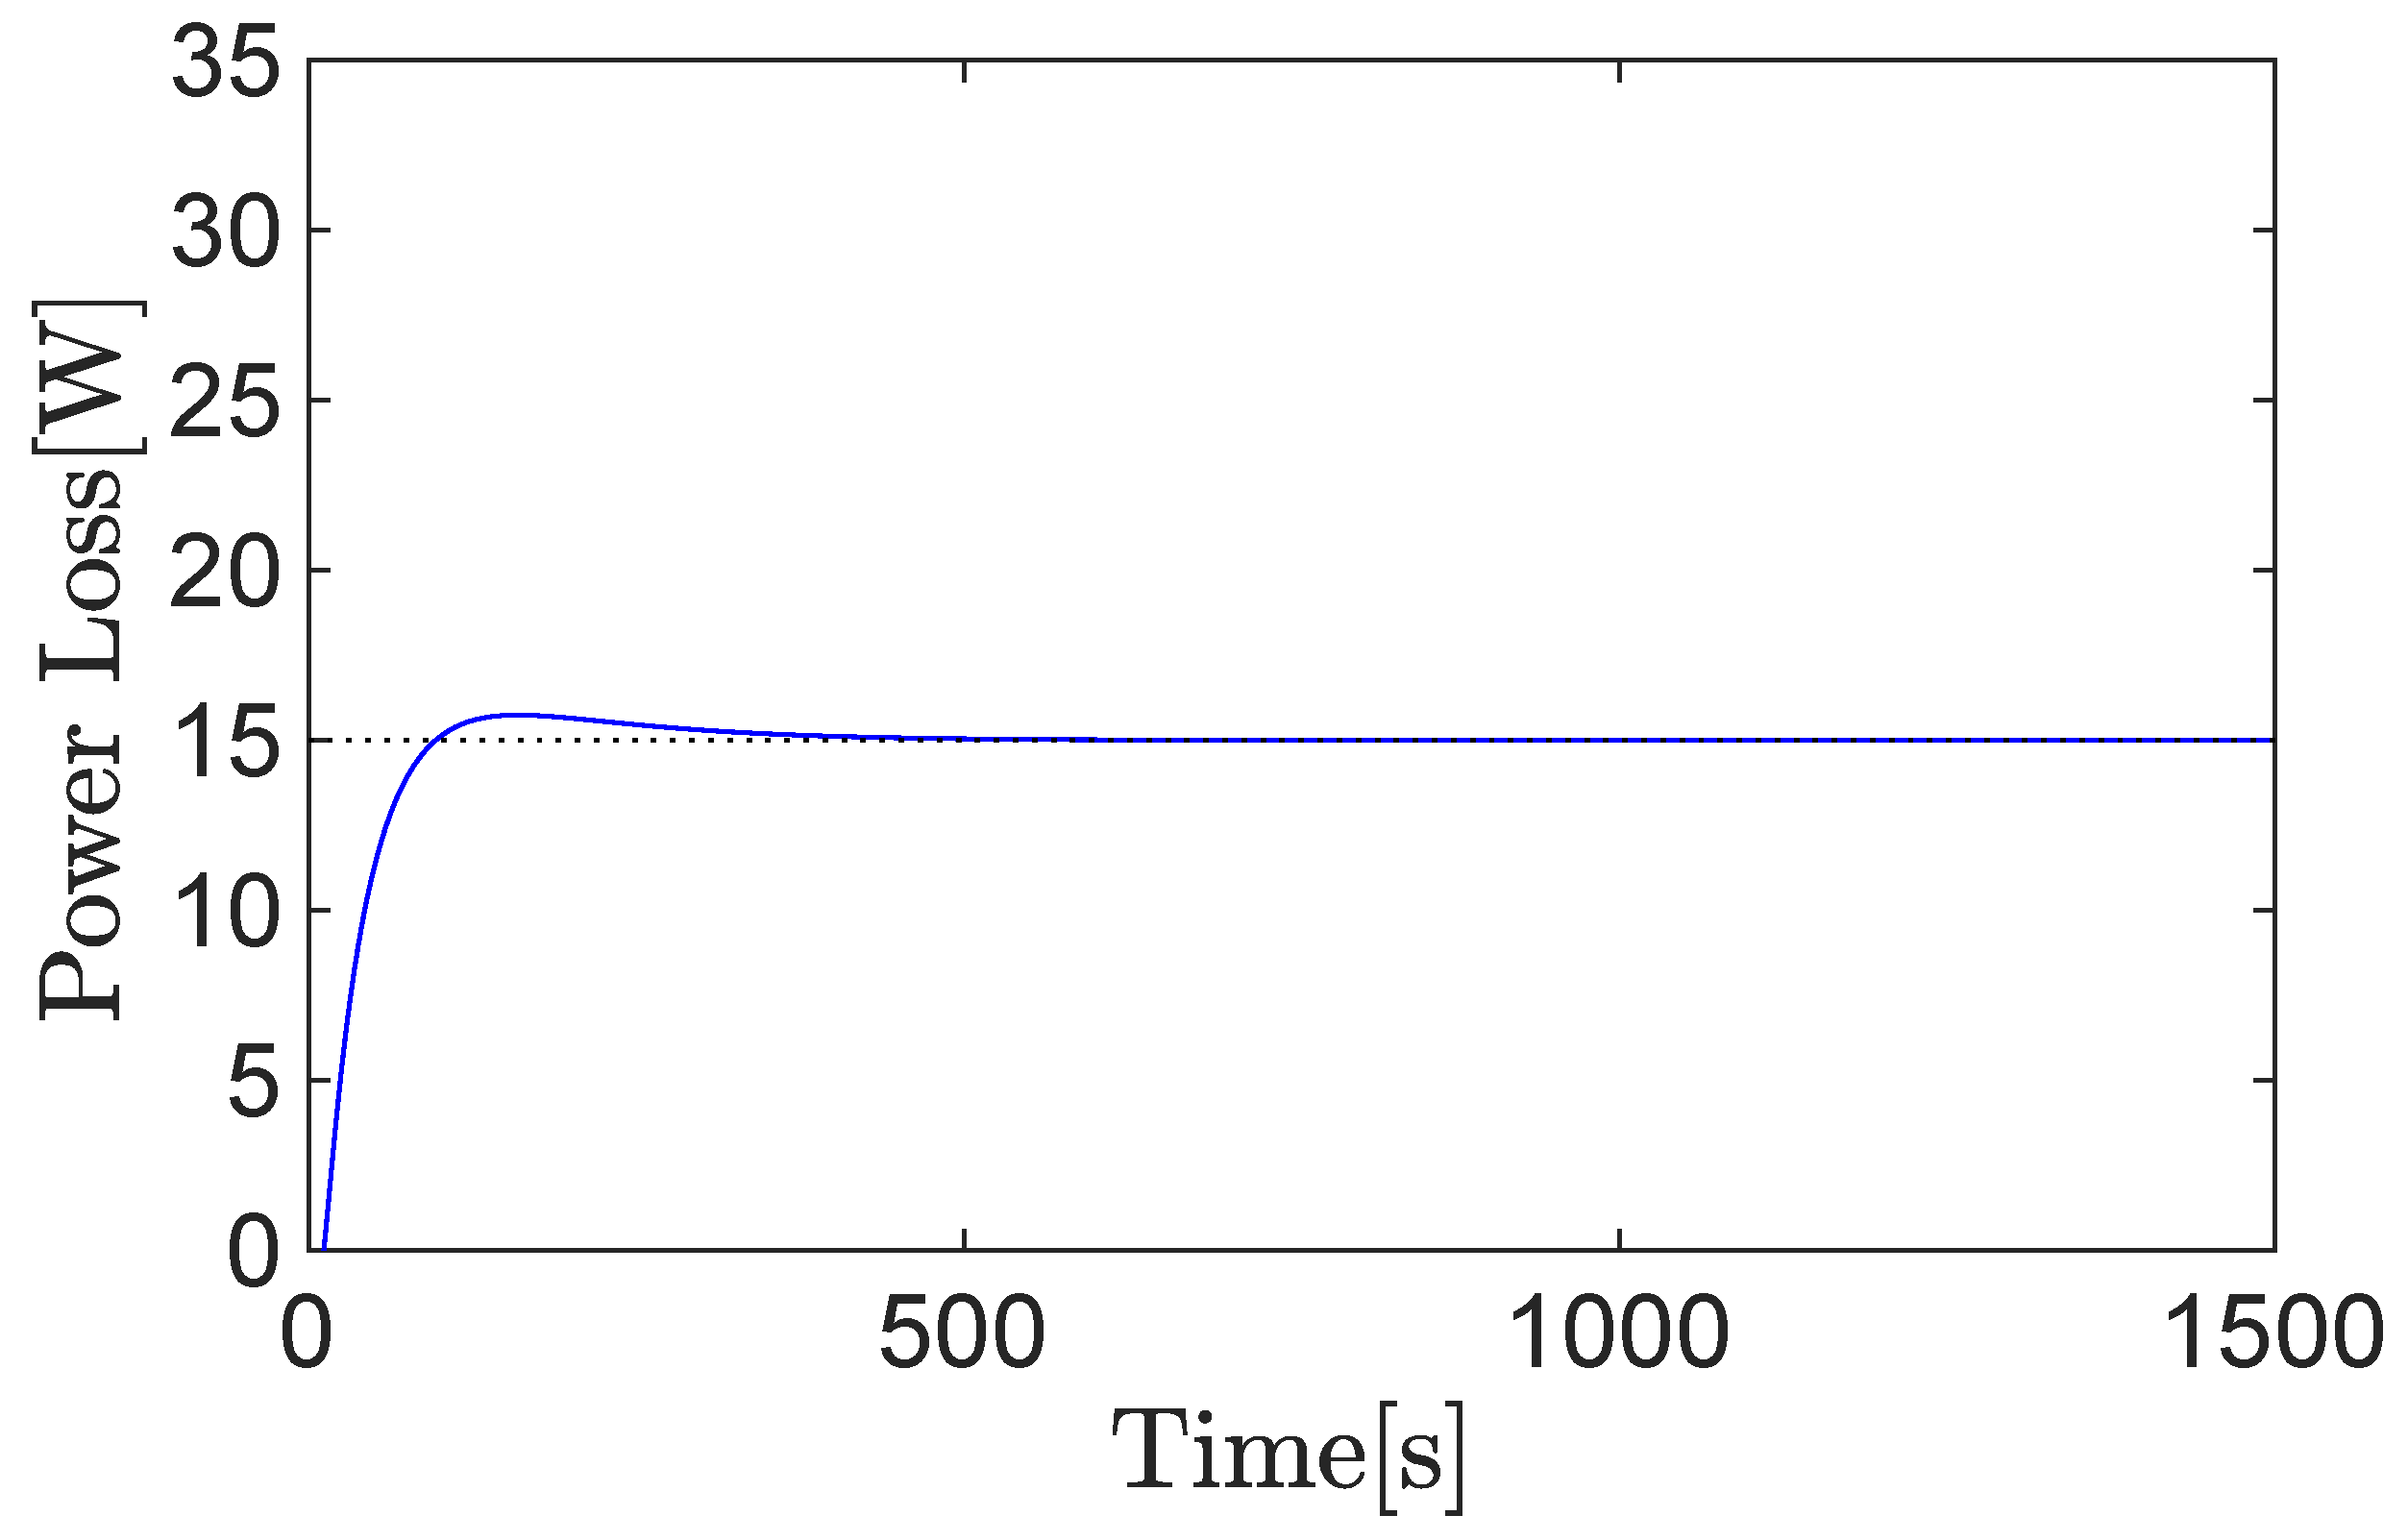
3.1. Simulation Results

Table 3 shows the simulation parameters.
Figure 8, Figure 9 and Figure 10 show the simulation results. From Figure 8, it can be confirmed that the temperature inside the chamber T in follows the ambient temperature T amb for about 500 s. After 500 s, when T in and T amb match, the estimated heat generation shown in Figure 10 follows 15 (W), which is equal to Q in , indicating the effectiveness of the proposed system. From Figure 8 and Figure 9, it can be seen that the thermal conductivity changes with time depending on the temperature Tc of the cold side of the Peltier device.
Figure 8. Temperature of T in , T amb , T h , T c .
Figure 9. Time variation of thermal conductivity.
Figure 10. Endothermic quantity of Peltier device u c .

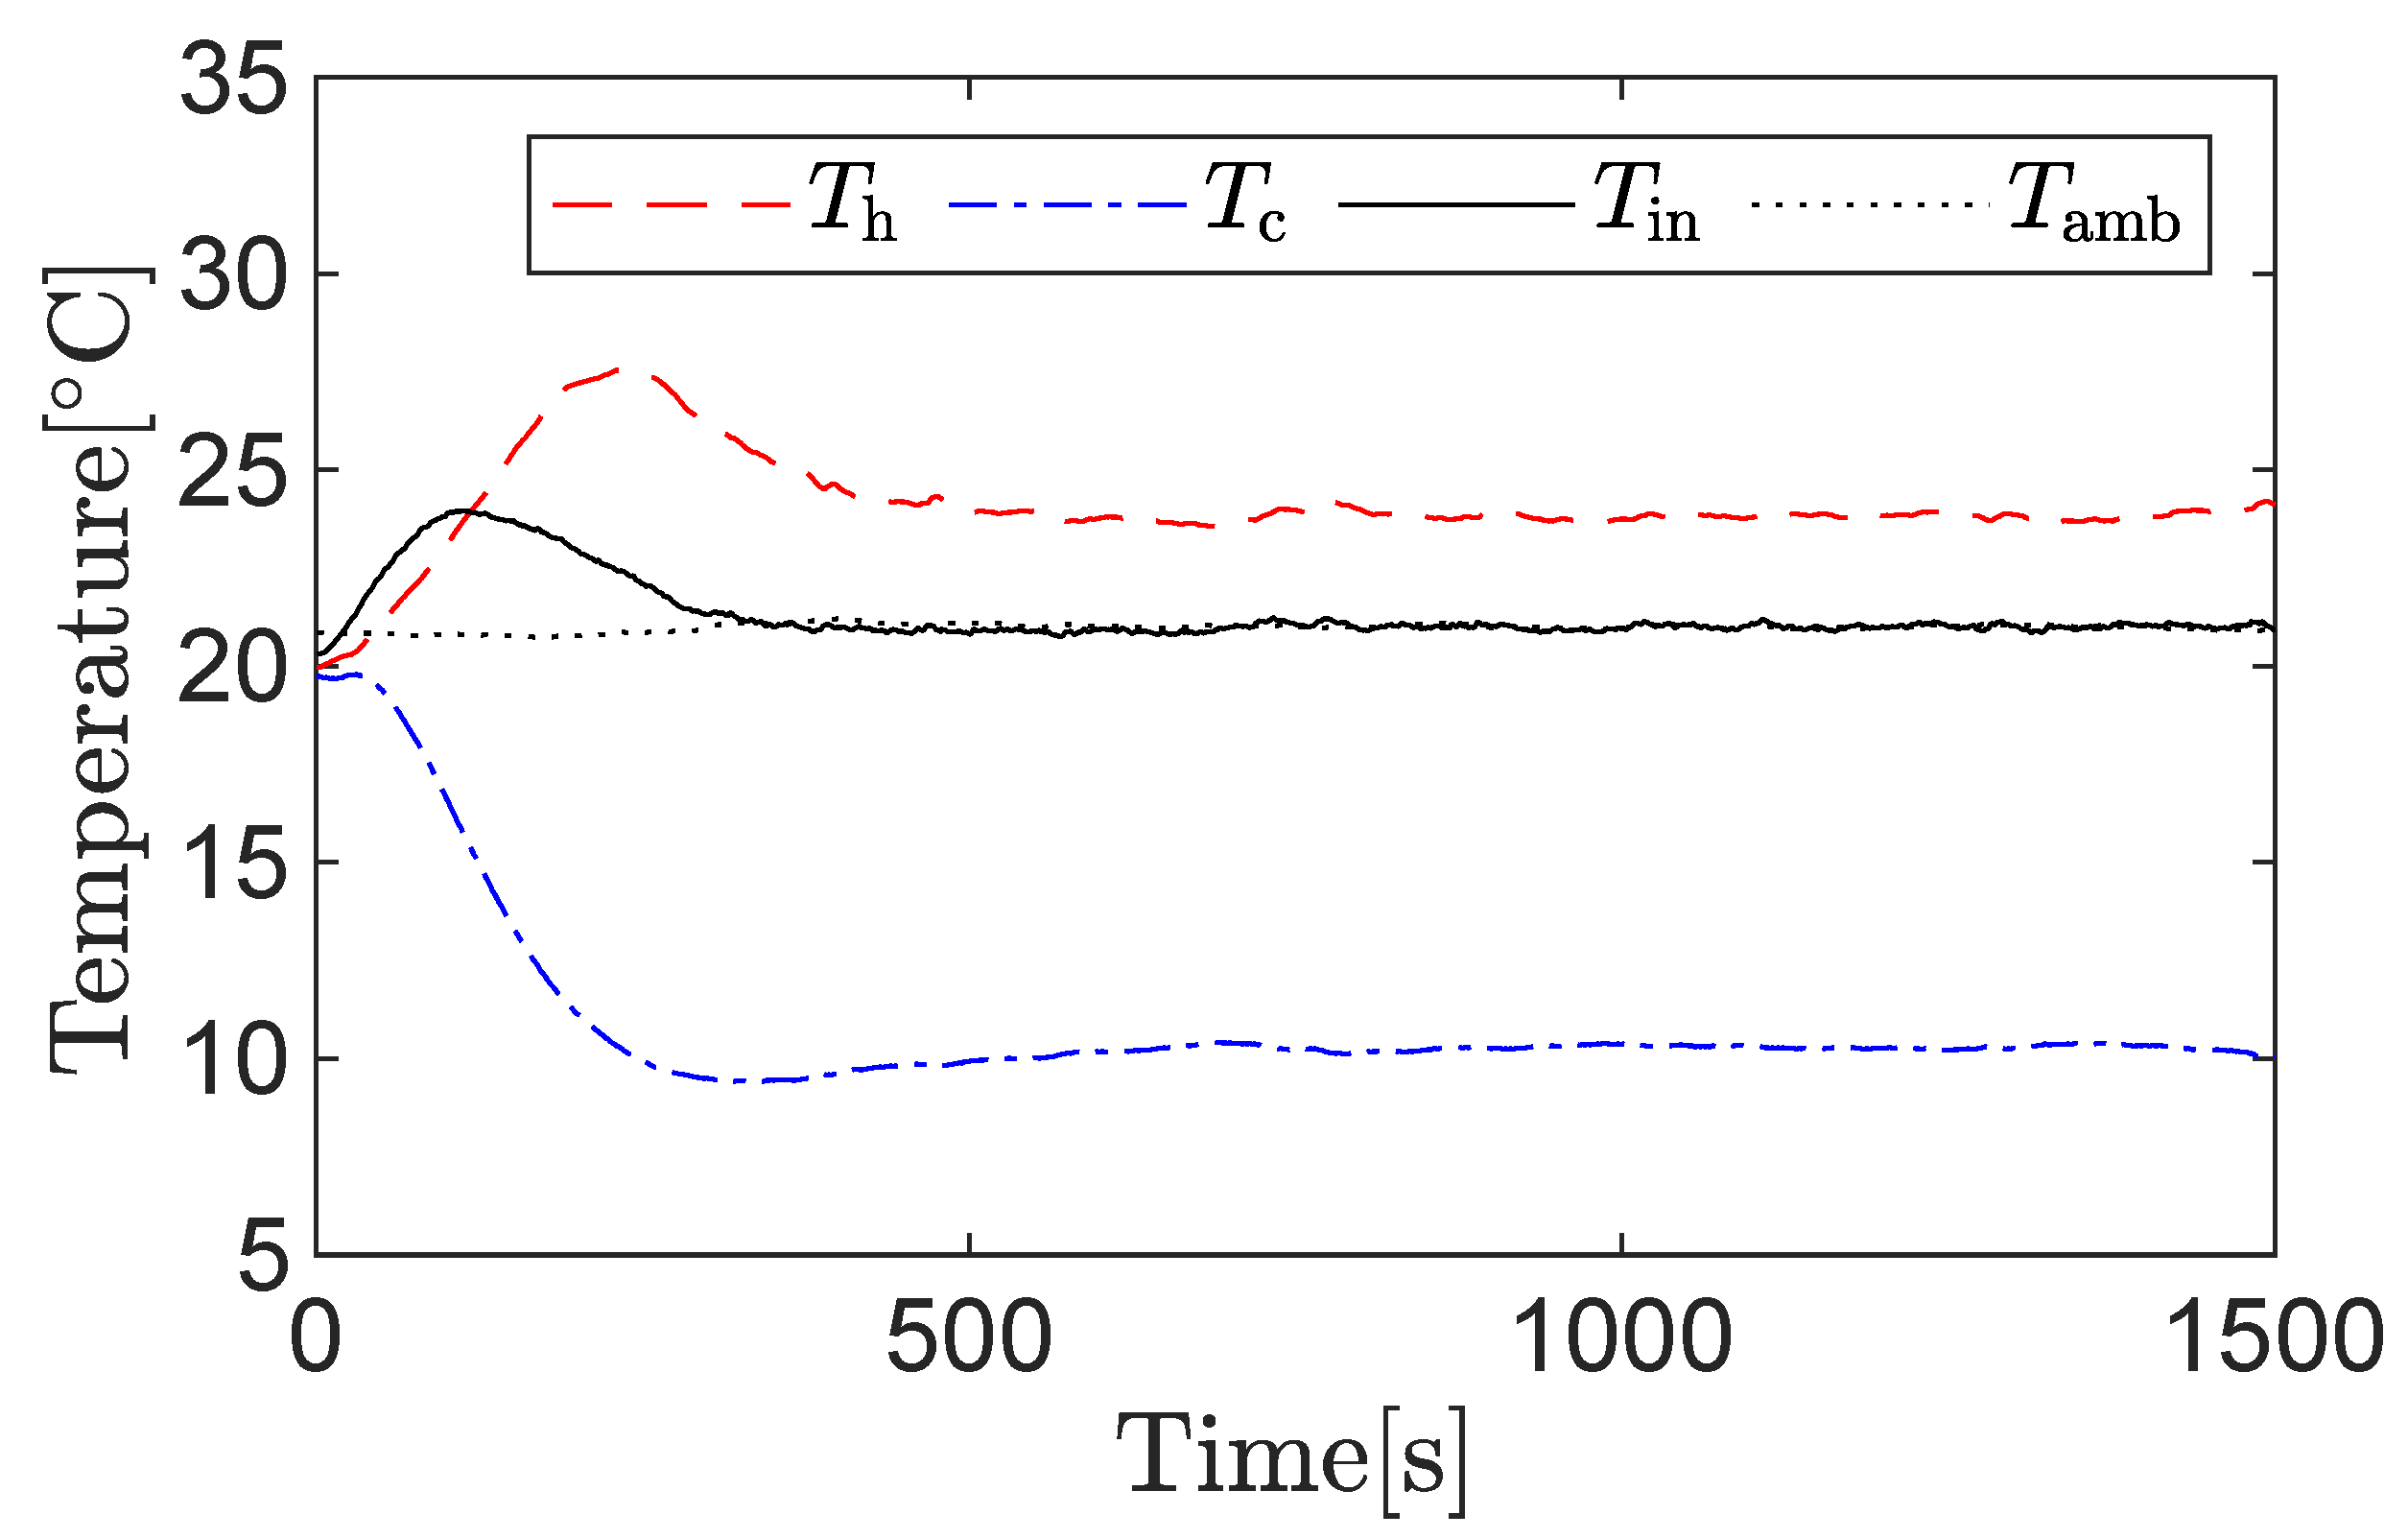
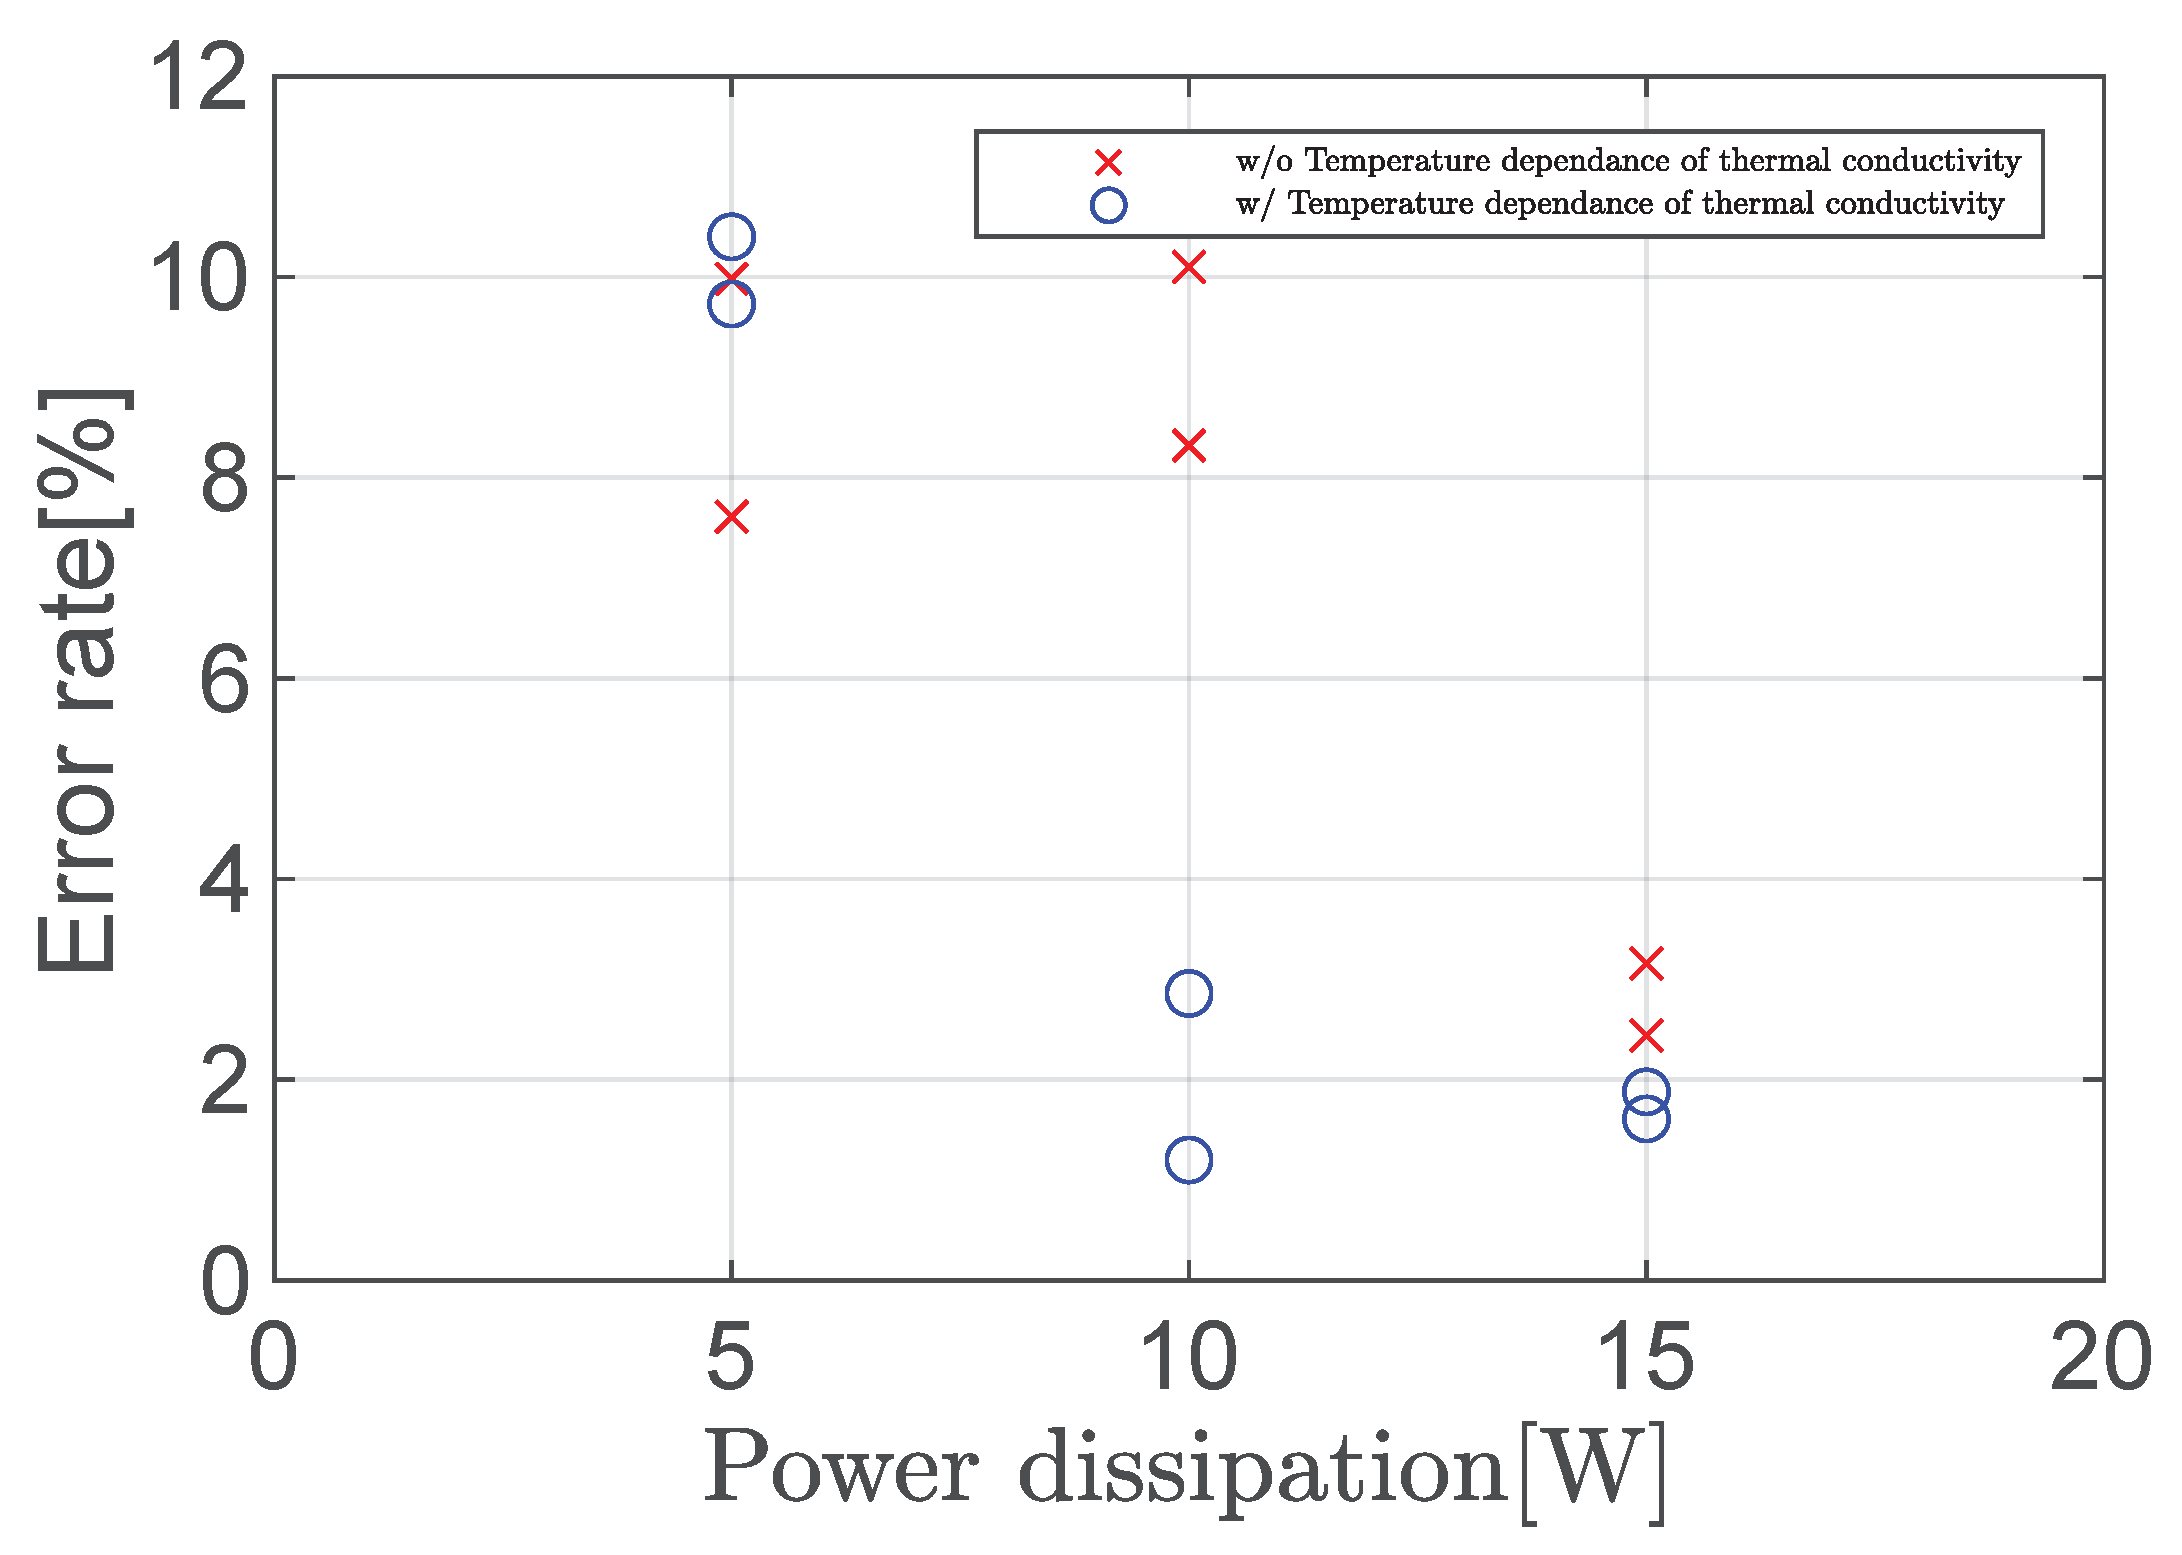
3.2. Experimental Results

For comparison of the experimental results, the results of experiments are shown under four conditions, with and without considering the temperature dependence of thermal conductivity, and with and without applying operator theory to the calorimetry system. Table 6 shows the experiment parameters.
Table 6. Experiment parameters.
Figure 11 and Figure 12 show T in , T amb , T h , and T c without and with the application of operator theory. When operator theory is not applied, T in is about 500 s, and when operator theory is applied, T in is about 400 s before T amb .
Figure 11. Temperature of T in , T amb , T h , T c (w/o operator theory).
Figure 12. Temperature of T in , T amb , T h , T c (w/ operator theory).
Figure 13 shows the time variation of the thermal conductivity. It can be seen that the thermal conductivity changes depending on the temperature T c of the cold side of the Peltier device.
Figure 13. Time variation of thermal conductivity.
Figure 14 and Figure 15 show the estimated heat generation of the DUT calculated from Equation (4). It can be seen that u c follows Q in = 15 (W) in all four conditions. Table 7 shows the time it takes for u c to follow Q in . The tracking is faster when operator theory is applied than when it is not, and the tracking is faster when the temperature dependence of thermal conductivity is considered than when it is not.
Figure 14. Endothermic quantity of Peltier device u c at 15 W (w/o operator theory).
Figure 15. Endothermic quantity of Peltier device u c at 15 W (w/ operator theory).
Table 7. Time until the u c follows the Q in .
Figure 16 and Figure 17 show the error rate of u c when Q in is varied with and without applying operator theory. The error rate was calculated from the following equation:
ε = u c Q in Q in
where u c is the average value between 1000 s and 1500 s after following Q in . The measurement accuracy can be improved by considering the temperature dependence of the thermal conductivity with or without applying operator theory.
Figure 16. Error rate (w/o operator theory).
Figure 17. Error rate (w/ operator theory).

4. Conclusions

In this paper, a non-linear control system for a calorimetric measurement system was proposed, taking into account the temperature dependence of the thermal conductivity in Peltier devices. The nonlinear control system was designed using robust right coprime factorization based on operator theory, and robust stability of the system is guaranteed. The experimental results show that the design of the control system considering the temperature dependence of the thermal conductivity using operator theory reduces the measurement time and improves the measurement accuracy when the power loss of the DUT is 10 (W) and 15 (W) compared to the previous study. In conclusion, the simulation and experimental results show the effectiveness of the proposed method when the power loss of the DUT is 10 (W) and 15 (W). Future work will aim to improve the measurement accuracy when the power loss becomes smaller and to shorten the measurement time when the heat capacity of the DUT becomes larger. Therefore, in the future, filtering and SVR [,,] will be applied to the calorimetric measurement system.

Author Contributions

R.C. proposed the operator-based nonlinear control of the calorimetric system considering the temperature dependence of thermal conductivity in a Peltier device and wrote this paper; M.D. suggested technical support and gave overall guidance on the paper. Both authors have read and agreed to the published version of the manuscript.

Funding

This research received no external funding.

Institutional Review Board Statement

Not applicable.

Data Availability Statement

Data is contained within the article.

Conflicts of Interest

The authors declare no conflict of interest.

Abbreviations

The following abbreviation is used in this manuscript:
DUTDevice under test

References

  1. Kamei, R.; Kawamura, A.; Kim, T. Discussion on highly accurate calorimetric for power loss measurement. In Proceedings of the Annual Conference of IEEE of Japan, Kyoto, Japan, 5–9 June 2011; pp. 363–366. [Google Scholar]
  2. Peretto, L.; Sasdelli, R.; Serra, G. Measurement of harmonic losses in transformers supplying nonsinusoidal load currents. IEEE Trans. Instrum. Meas. 2000, 49, 315–319. [Google Scholar] [CrossRef]
  3. Szabados, B.; Mihalcea, A. Design and implementation of a calorimetric measurement facility for determining losses in electrical machines. IEEE Trans. Instrum. Meas. 2002, 51, 902–907. [Google Scholar] [CrossRef]
  4. Xiao, C.; Chen, G.; Odendaal, W.G. Overview of power loss measurement techniques in power electronics systems. IEEE Trans. Ind. Appl. 2007, 43, 657–664. [Google Scholar] [CrossRef]
  5. Mitsugi, K.; Deng, M. Operator-based robustnonlinear control for calorimet-ric power loss measurement system using Peltier device. In Proceedings of the 2nd International Conference on Industrial Artificial Intelligence, Shenyang, China, 23–25 October 2020; pp. 1–6. [Google Scholar]
  6. Qian, D.; Liu, X.; Li, L. Adaptive hierarchical sliding mode control for ball-beam systems. Int. J. Adv. Mechatron. Syst. 2012, 4, 205–211. [Google Scholar] [CrossRef]
  7. Sato, T.; Fujita, K.; Kawaguchi, N.; Takagi, T.; Mizumoto, I. Null-space-based steady-state tracking error compensation of simple adaptive control with parallel feedforward compensator and its application to rotation control. Contr. Eng. Pract. 2012, 105, 104651. [Google Scholar] [CrossRef]
  8. Yu, J.; Bi, S.; Wen, S. Modelling and adaptive control of NAO robot arm. Int. J. Adv. Mechatron. Syst. 2021, 9, 102–108. [Google Scholar] [CrossRef]
  9. Deng, M.; Inoue, A.; Ishikawa, K. Operator-based nonlinear feedback control design using robust right coprime factorization. IEEE Trans. Autom. Contr. 2006, 51, 645–648. [Google Scholar] [CrossRef] [Green Version]
  10. Chen, G.; Han, Z. Robust right coprime factorization and robust stabilization of nonlinear feedback control systems. IEEE Trans. Autom. Contr. 1998, 43, 1505–1509. [Google Scholar] [CrossRef]
  11. Deng, M.; Kawashima, T. Adaptive nonlinear sensorless control for an uncertain miniature pneumatic curling rubber actuator using passivity and robust right coprime factorization. IEEE Trans. Control Syst. Technol. 2015, 24, 318–324. [Google Scholar] [CrossRef]
  12. Wandg, A.; Ma, Z.; Wen, S. Operator-Based Robust Nonlinear Control Design and Analysis of a Semiconductor Refrigeration Device. J. Robot. Mechatron. 2017, 29, 1065–1072. [Google Scholar] [CrossRef]
  13. Wen, S.; Yu, J.; Guo, G.; Bi, S.; Wang, A.; Wang, D. Fractional order based robust right coprime factorization control for an inverted pendulum. In Proceedings of the 2016 International Conference on Advanced Mechatronic Systems, Melbourne, VIC, Australia, 30 November–3 December 2016; pp. 159–163. [Google Scholar]
  14. Deng, M.; Wang, A. Robust non-linear control design to an ionic polymer metal composite with hysteresis using operator-based approach. IET Contr. Theory Appl. 2012, 6, 2667–2675. [Google Scholar] [CrossRef]
  15. Bi, S.; Han, C.; Wamg, L. Operator-based robust control for nonlinear system with input and output nonlinearities. In Proceedings of the 2016 International Conference on Advanced Mechatronic Systems, Melbourne, VIC, Australia, 30 November–3 December 2016; pp. 50–55. [Google Scholar]
  16. Bu, N.; Liu, H.; Li, W. Robust passive tracking control for an uncertain soft actuator using robust right coprime factorization. Int. J. Robust Nonlinear Contr. 2021. [Google Scholar] [CrossRef]
  17. Bu, N.; Chen, W.; Jin, L.; Zhao, Y. Robust control for uncertain nonlinear feedback system using operator-based right coprime factorization. IEEE/CAA J. Autom. Sin. 2019, 6, 824–829. [Google Scholar] [CrossRef]
  18. Hu, X.; Takazawa, H.; Nagase, K.; Ohta, M.; Yamamoto, A. Three-dimensionalnite-element simulation for a thermoelectric generator module. J. Electron. Mater. 2015, 44, 3637–3645. [Google Scholar] [CrossRef]
  19. Yamakita, A.; Deng, M. Nonlinear control considering temperature dependenceof thermal conductivity for a cooling and heating system based on the concept ofsliding mode. In Proceedings of the 2018 International Conference on Advanced Mechatronic Systems, Zhengzhou, China, 30 August–2 September 2018; pp. 162–165. [Google Scholar]
  20. Osawa, Y.; Katsura, S. Variable heat disturbance observer for control of Peltier device. IEEJ J. Ind. Appl. 2019, 8, 185–191. [Google Scholar] [CrossRef] [Green Version]
  21. Christen, D.; Badstuebner, U.; Biela, J.; Kolar, J.W. Calorimetric power loss measurement for highly efficient converters. In Proceedings of the Power Electronics Conference, 2010 International, Sapporo, Japan, 21–24 June 2010; pp. 1438–1445. [Google Scholar]
  22. Deng, M.; Saijo, N.; Gomi, H.; Inoue, A. A robust real time method for estimating human multijoint arm viscoelasticity. Int. J. Innov. Comput. Inf. Contr. 2006, 2, 705–721. [Google Scholar]
  23. Jiang, L.; Deng, M.; Inoue, A. Obstacle avoidance and motion control of a two wheeled mobile robot using SVR technique. Int. J. Innov. Comput. Inf. Contr. 2009, 5, 253–262. [Google Scholar]
  24. Zhang, K.; Cocquempot, V.; Jiang, B. Adjustable parameter-based multi-objective fault estimation observer design for continuous-time/discrete-time dynamic systems. Int. J. Contr. Autom. Syst. 2017, 15, 1077–1088. [Google Scholar] [CrossRef]
Publisher’s Note: MDPI stays neutral with regard to jurisdictional claims in published maps and institutional affiliations.

Article Metrics

Citations

Article Access Statistics

Multiple requests from the same IP address are counted as one view.