Article

An Offset Laser Measurement Method for the Deviation Analysis of Cylindrical Gears

School of Mechanical Engineering, Yangzhou University, Yangzhou 225127, China
*
Author to whom correspondence should be addressed.
Machines 2021, 9(6), 111; https://doi.org/10.3390/machines9060111
Submission received: 30 April 2021 / Revised: 20 May 2021 / Accepted: 26 May 2021 / Published: 28 May 2021
(This article belongs to the Special Issue Precision Measurement and Machines)

Abstract

:
Generally, in the laser measurement of gears, the laser beam passes through the center of the gear, and the laser displacement sensor reads the spatial distance from the gear involute tooth surface to the laser displacement sensor. However, in this method, the angle between the laser beam and the normal vector of the measured tooth surface is too large, which affects the accuracy of the measurement and the stability of the data. This paper proposes an offset laser measurement method. The laser beam is offset from the center of the gear by a certain distance to form a larger incident angle with the tooth surface, which can effectively address the problem and increase the measurement accuracy. Through a selection of the optimal offset distance, the range of optimal offset measurement positions was obtained and clarified by experiments. We solved the data conversion problem caused by the change in measuring position, and we measured the pitch deviation and helix angle of the gear to confirm the feasibility of this method. According to the theoretical calculation and experimental verification, it was found that this method has the advantages of better measurement accuracy and less fluctuation in measurement data. It is, thus, suitable for precision gear measurement.

1. Introduction

Gear measurements play an important role in the quality assessment of finished products, and they also represent a technical guarantee for quality control during processing. With the development of industrial technology and the increasing requirements for gears, comprehensive gear measurements are being widely used. Mainstream examples of gear measuring equipment include gear meshing testers, CNC gear measuring centers, online measuring and sorting machines for gears, and laser measuring instruments [1]. Gear meshing testers are used to mesh and rotate the measured gear as a function of an ideal and accurate measuring gear, and the recorded error curve can reflect the multiple errors of the gear. These testers can be divided into single-sided meshing and double-sided meshing comprehensive measuring instruments. Single-sided meshing comprehensive measuring instruments can be further characterized as mechanical type, grating type, magnetic index type, and inertial type, and their movement is close to the state of gear in use [2]. Gear measuring centers are similar in principle to polar coordinate measuring machines. The probe produces the required measurement motion relative to the workpiece, and the computer collects the indication value of the micrometer and the actual position of each coordinate axis to obtain the measurement result. This method has high precision but a large amount of data calculation and a long measurement time.
In recent years, many applications of laser displacement sensors have been revealed in the detection of gear geometric accuracy and transmission stability. Ma et al. [3] proposed an experimental device composed of a specially fabricated micro-displacement platform and a pair of laser displacement sensors to measure the vertical and horizontal displacement of the flexspline of harmonic drive gears to determine the radial displacement. Tian et al. [4] proposed using two opposing adjustable laser sensors to obtain tooth profile information through one scan and to reconstruct the key geometric model of the gear profile after compensation. Raghuwanshi et al. [5] presented a laser displacement sensor technique to measure the tooth deflection of spur gears to calculate the friction stiffness of cracked teeth, but the mechanism used by the experimental device for the determination of tooth surface friction was not very clear. Jiang et al. [6] used a laser displacement sensor to measure the bending deformation and stiffness of the output shaft to obtain the friction force. Qiu [7] proposed a non-contact gear measurement method to measure various geometric errors of gears by building a gear detection platform. However, as described in [8,9], if the laser beam passes through the center of the gear during measurement, the angle between the laser beam and the normal vector of the tooth surface is too large to form an irregular elliptical spot, which affects the detection accuracy. Pei et al. [10] optimized the installation angle and position of the laser displacement sensor to address this problem; however, during the measurement process, the previous tooth blocks the measuring laser beam of the target tooth across a large range, which leads to a decrease in the effectiveness of the measurement.
Therefore, this paper proposes an offset laser measurement method for the deviation analysis of cylindrical gears to address these problems and increase the accuracy of the measurement. Firstly, a mathematical model of the best offset selection was established to clarify the selection range of the offset, and the best measurement position was selected according to the offset value and the range of the laser displacement sensor. Then, an offset measurement control software was developed to control the three-coordinate translation device and the workpiece turntable, as well as record the values of the laser displacement sensor and the encoder on the turntable during the measurement process to obtain the measurement data of the tooth profile. Lastly, the various parameters and deviations of the gear were obtained through coordinate conversion and data analysis of the measurement data.

2. The Influence of Spot Shape on Laser Measurement

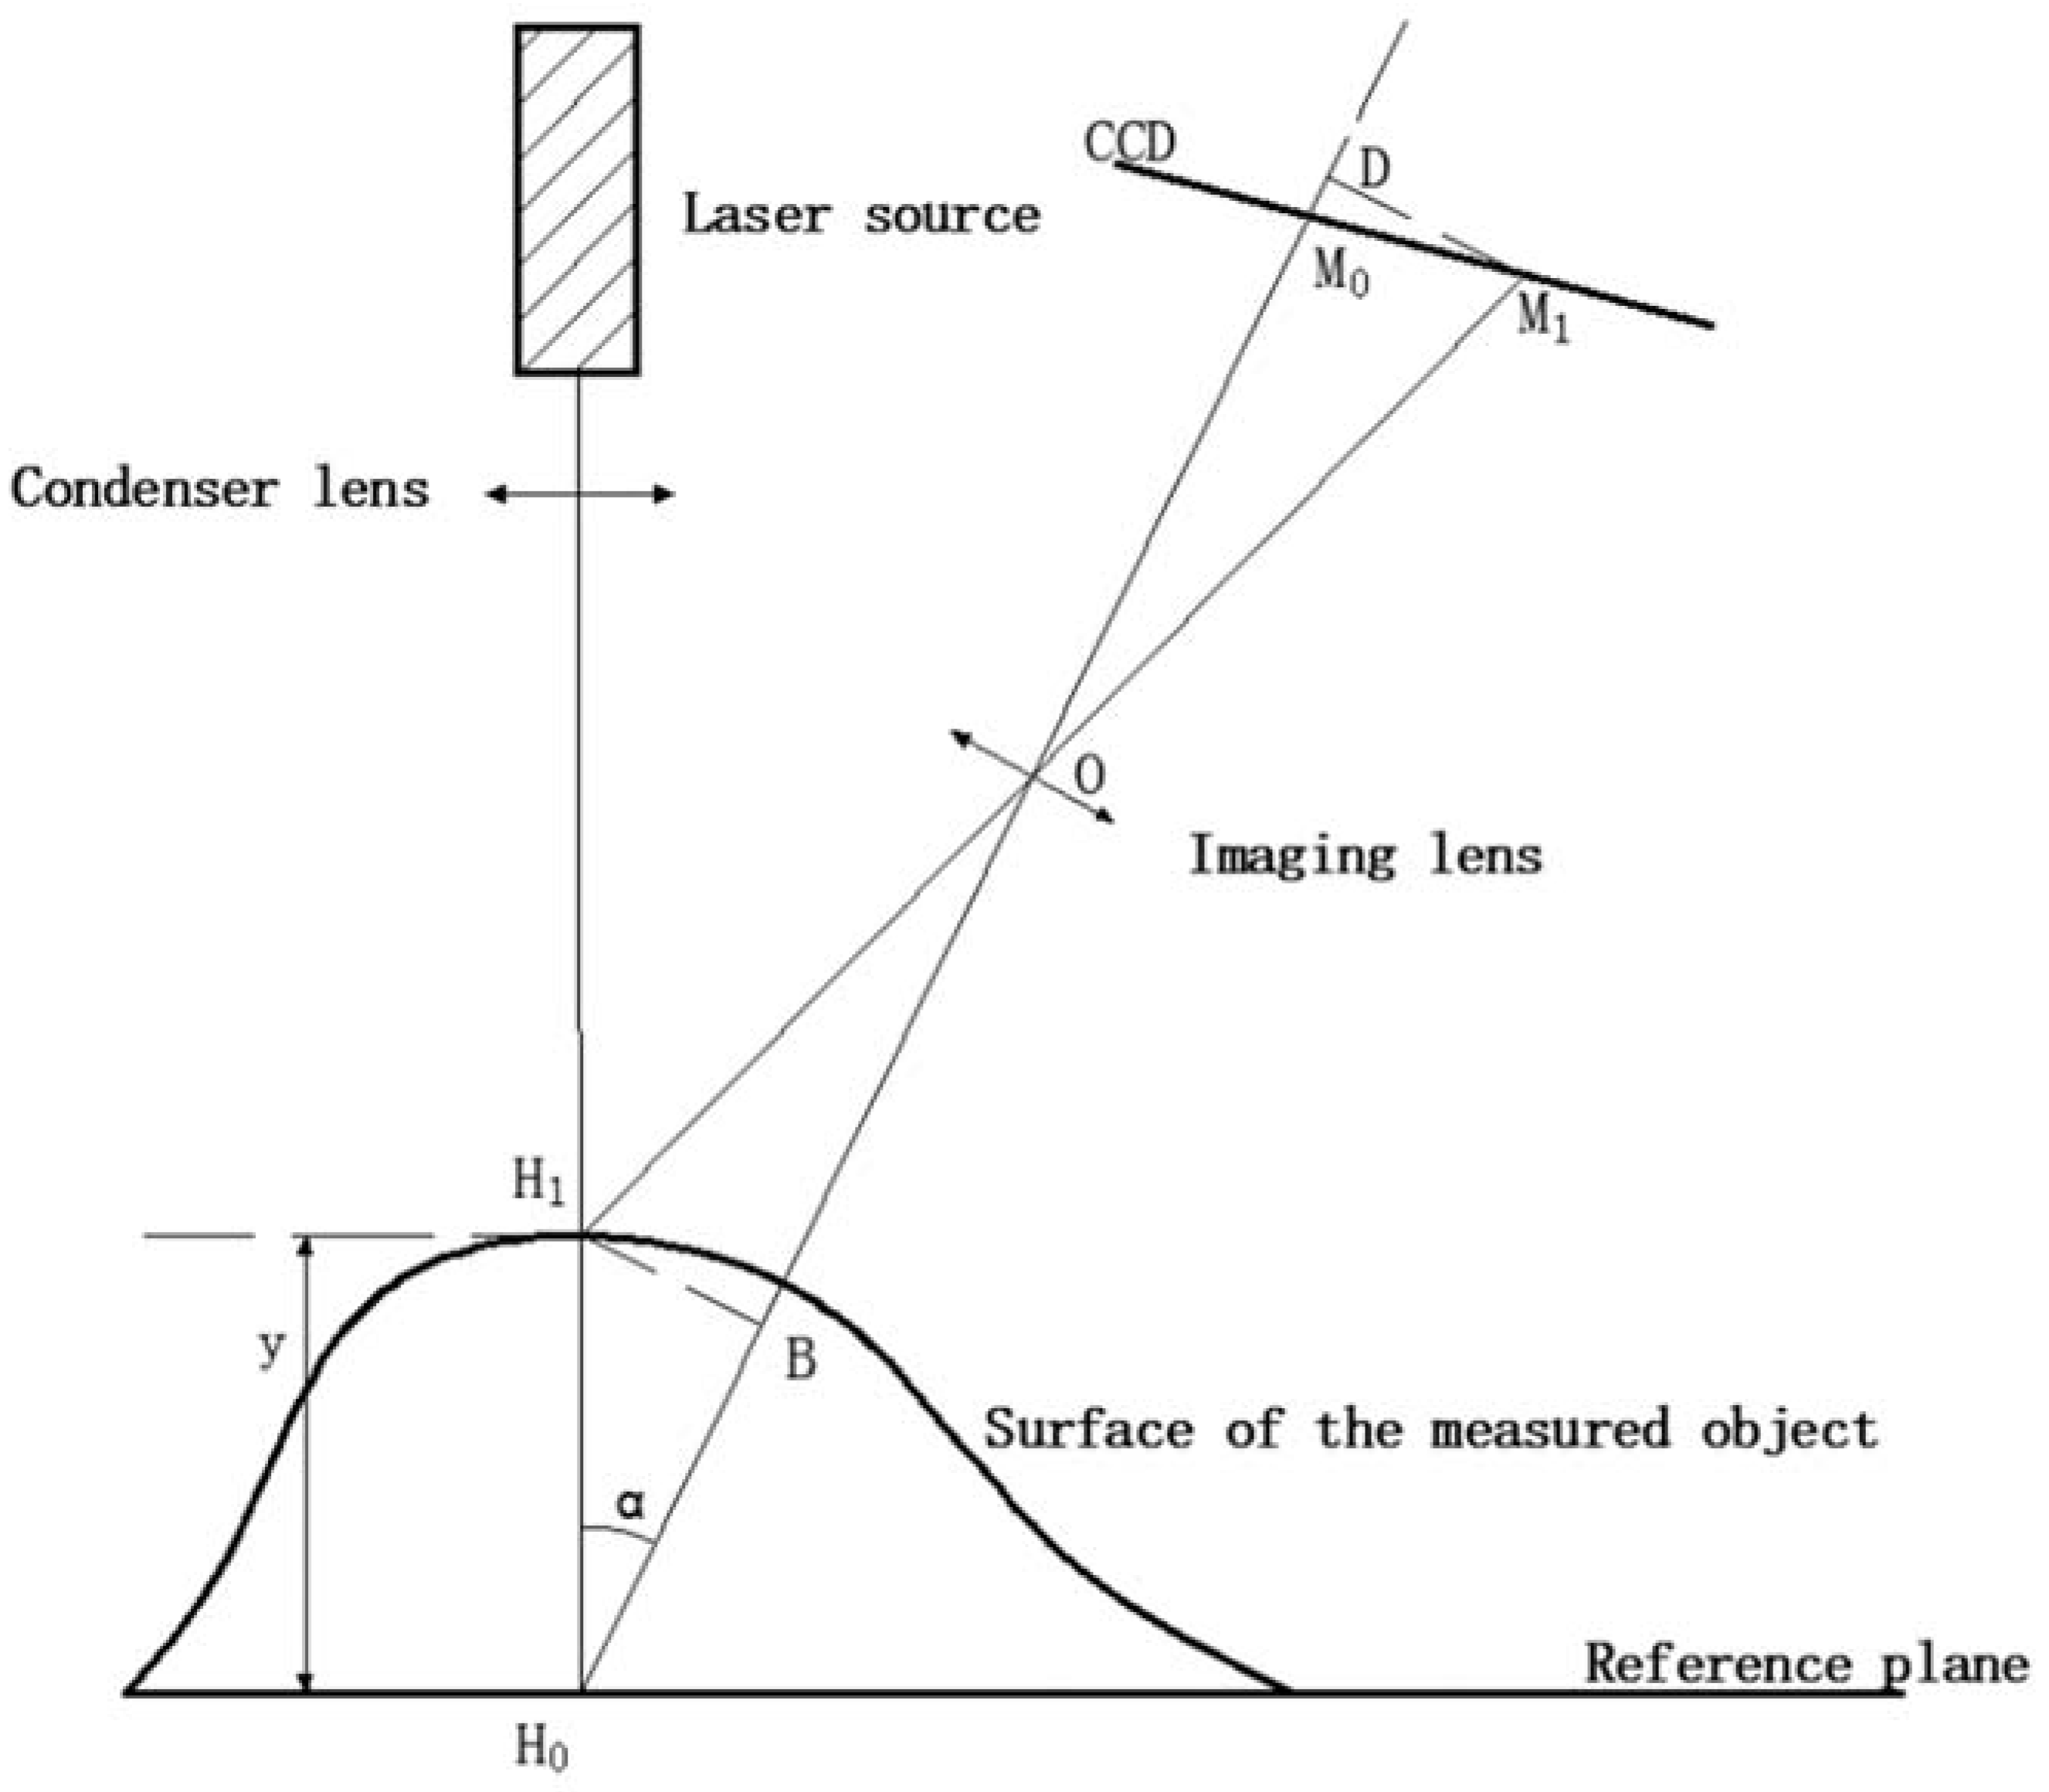
The laser displacement sensor used in gear measurement is based on triangulation. As shown in Figure 1, the laser beam emitted by the laser source hits H 1 on the surface of the object, while H 0 is a point on the reference plane, and the imaging of the two points on the CCD is denoted by M 1 and M 0 . A perpendicular can be drawn from H 1 and M 1 to H 0 and M 0 to obtain B and D , respectively. The triangle M 1 D O is, thus, similar to the triangle H 1 B O . The distance of B H 1 can be calculated according to the triangle similarity rule, and then the distance of y can be obtained.
According to the principle of triangulation, the calculation of length y is restricted by the accuracy of the two points M 0 and M 1 , while the accuracy of the two points is affected by the shape and size of the spot. The tooth surface is a complex space curve, and its curvature changes constantly, which easily leads to measurement fluctuations. Huang [11] proposed an object surface inclination error. It was obtained through experiments that, when the tilt angle is within 5°, the measurement error can be controlled at 0.12 mm, and, when the tilt angle is 30°, the maximum measured displacement error reaches 0.5 mm.
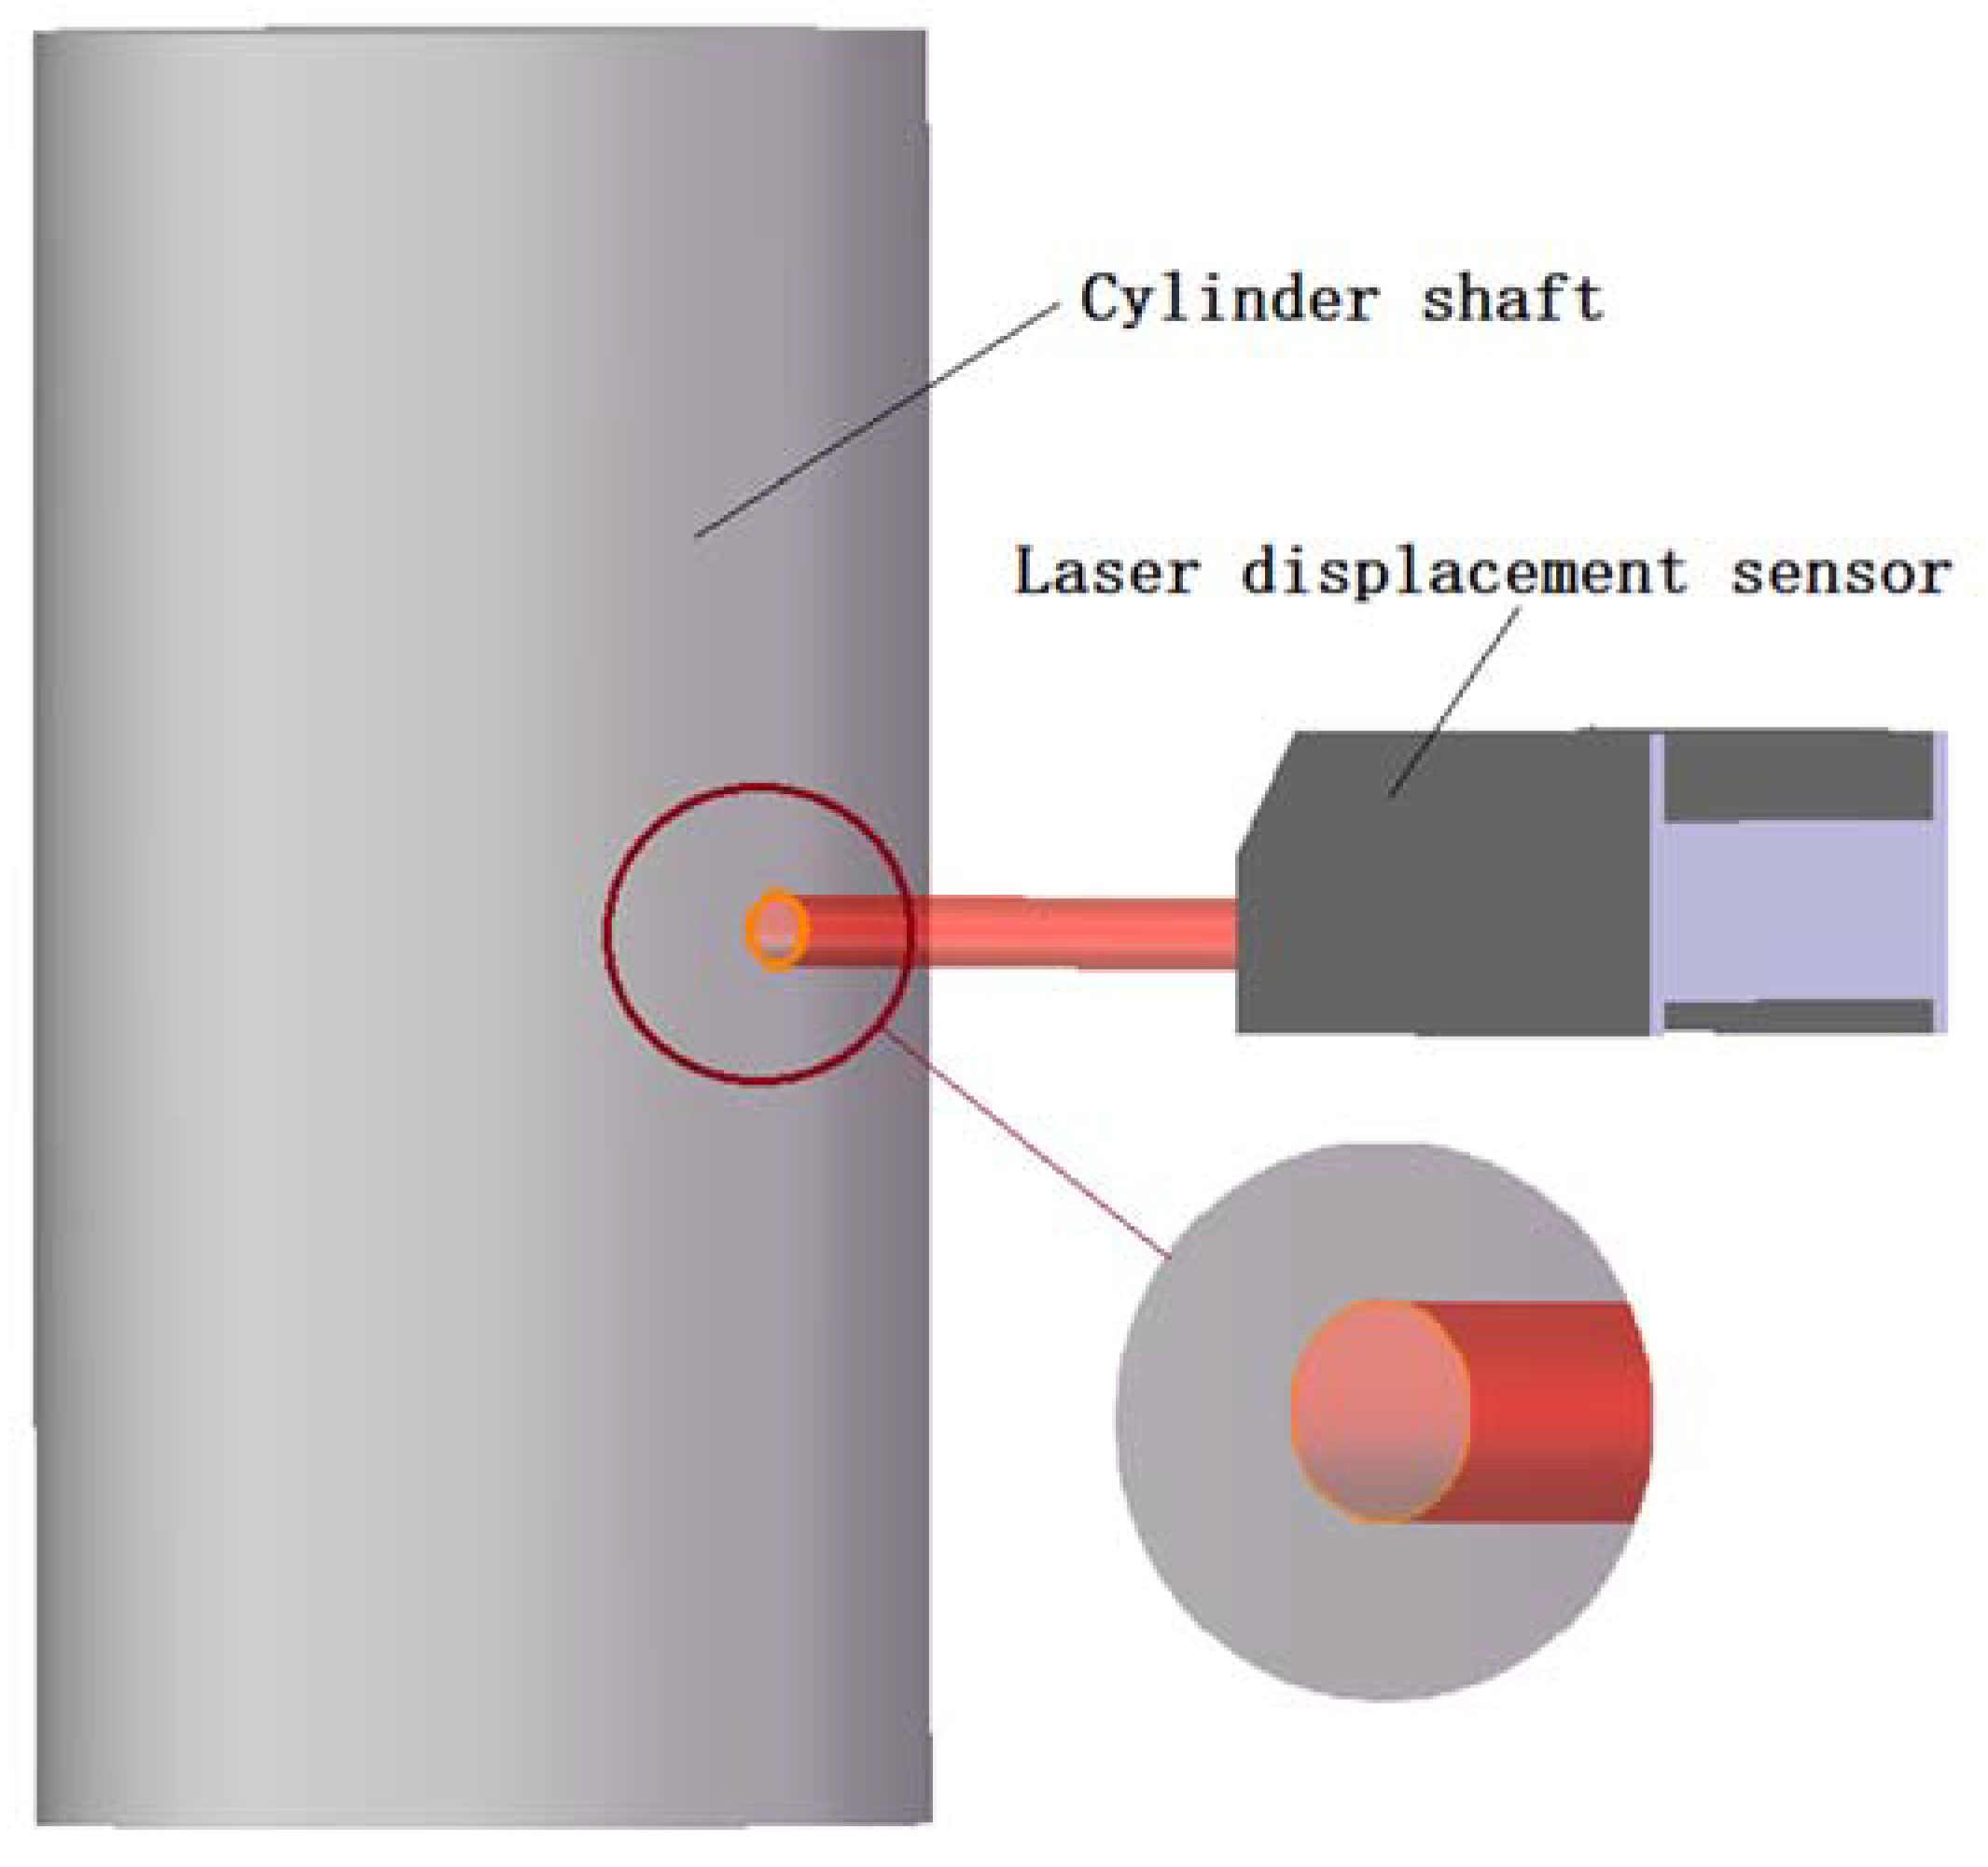
When the measured surface is close to a flat surface, the laser beam hits the surface with a uniform circular spot, which is common in the measurement of gear addenda and dedenda. At this time, the angle between the normal vector of the tooth profile and the laser beam is close to 0°, which is equivalent to the laser beam hitting the surface vertically. At this time, it has no effect on the accuracy of the laser beam. When the curvature of the surface changes continuously and there is a large height difference, the laser beam hits the surface with an uneven and approximate ellipse. At this time, the angle between the normal vector of the tooth profile and the laser beam is close to 90°, which is equivalent to the laser beam being tangent to the surface. The non-linear error in the measurement system increases, which is common in measurements of the tooth profile. Therefore, by improving the angle between the laser beam and tooth profile, placing the maximum angle within a reasonable range, the accuracy of tooth profile measurement can be greatly improved. Figure 2 and Figure 3 are schematic diagrams of the laser beam spots when the laser beam is at different positions on the cylinder shaft. Figure 2 shows the spot formed by the laser beam directly facing the center of the shaft. In this case, the spot is uniform and convergent. Figure 3 shows the spot formed by the laser beam on the steep surface of the cylinder shaft, which is uneven and has large scattering during practical application.
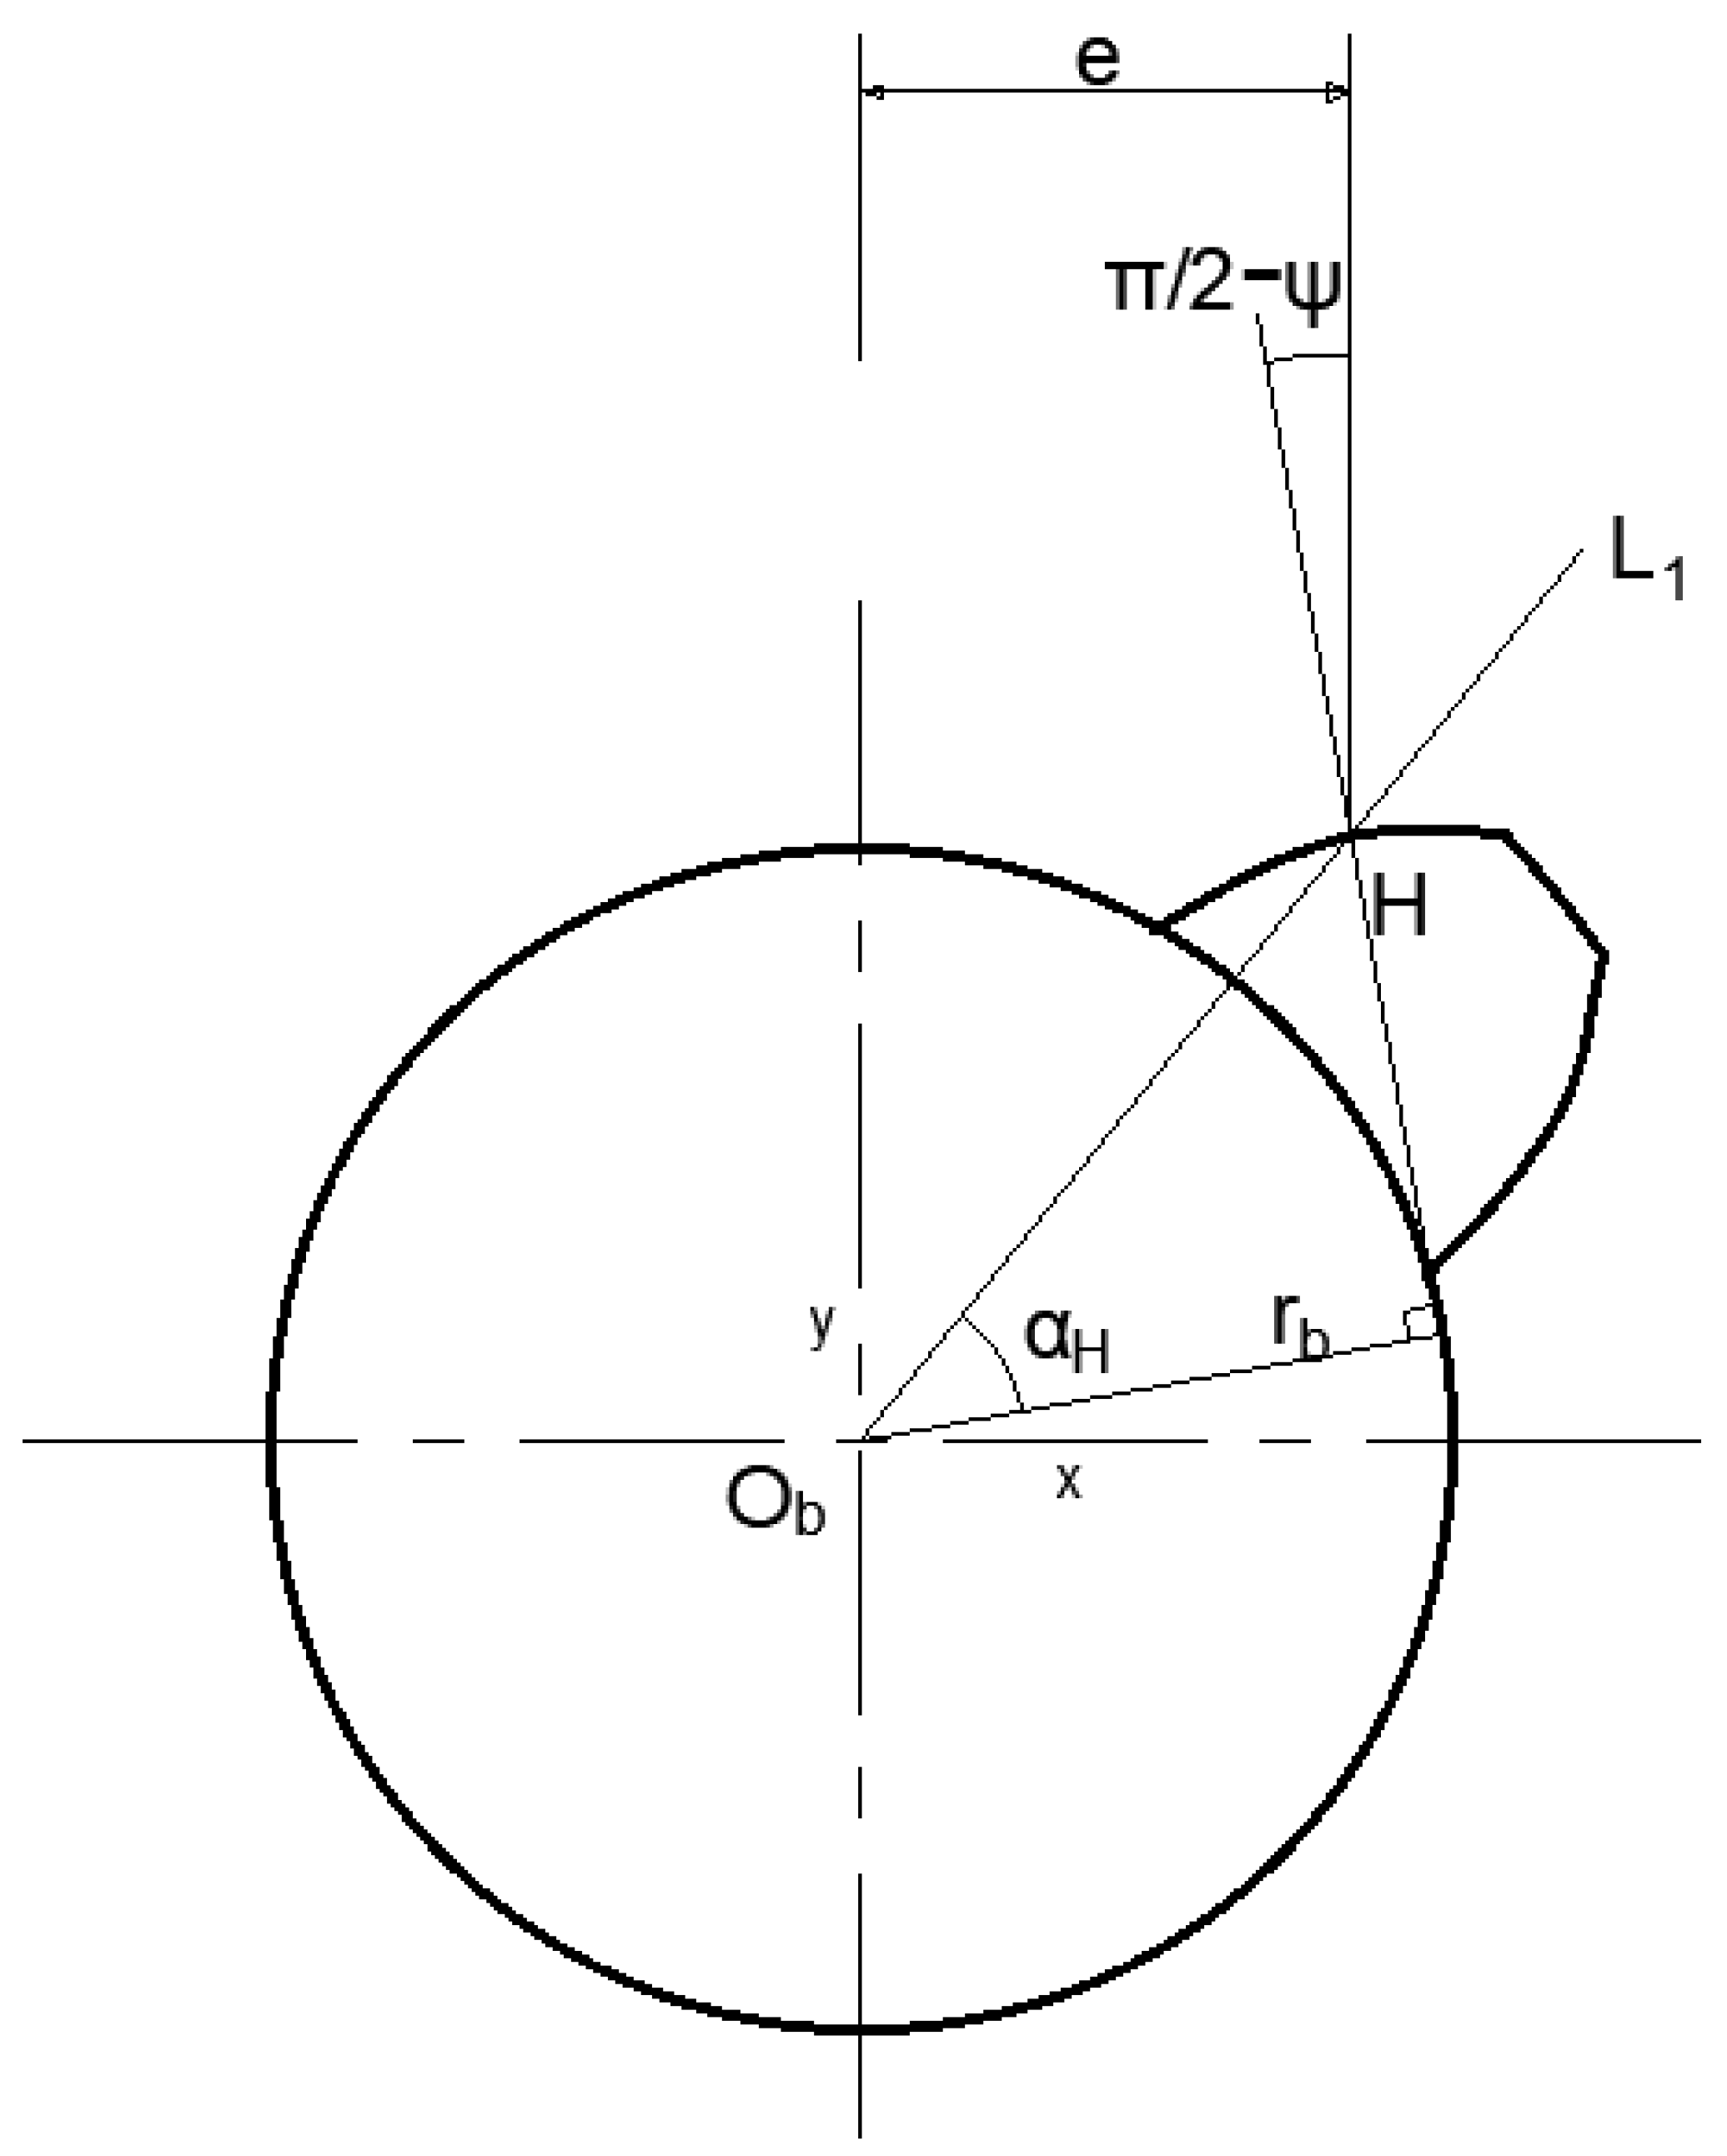
As shown in Figure 4, O b is the center of the base circle, H ( x H , y H ) is the measured point on the gear, L 1 is the line connecting the center of the base circle and point H , L 2 is the normal line of the involute at point H , and the radius of the base circle is r b . After the involute has turned at a certain angle, the center of the base circle is described as O b ( x 0 , y 0 ) , α H is the pressure angle at point H , and k is the slope of L 2 . The line L 2 within the normal vector of the tooth profile at point H can be expressed as:
{ y = k ( x x H ) + y H k = tan ( arctan ( y H + y 0 x H + x 0 ) + π 2 α H ) α H = r b O b H .
During offset measurement, the laser beam is offset by a distance e along the x-axis. If the angle between the normal of the tooth profile and the x-axis is φ , the angle between the normal of the tooth profile and the laser beam is π 2 φ . It can be seen that a larger k value leads to a larger φ value and a smaller π 2 φ angle, thereby increasing the stability of the measured value. By contrast, a smaller k value leads to a smaller φ value and a larger π 2 φ angle, thereby increasing the fluctuation of the measurement data.

3. Principle of Offset Laser Measurement Method

During measurement, the laser displacement sensor measures the distance from the laser emitting point to the tooth surface, and the encoder feeds back angle information. When the laser passes through the center of the gear, the sensor and the encoder reflect the position and angle data of the same point. In the offset laser measurement, the y-axes of the measurement coordinate system and the workpiece coordinate system are not collinear. The position and angle data actually correspond to the position data of the measured point and the gear rotation angle. The corresponding position and angle of the current point can be obtained through coordinate system conversion.
The schematic diagram of offset measurement data conversion is shown in Figure 5. The offset distance between the laser displacement sensor and the gear center is e , l d is the distance from the sensor to the measured point, the distance from the sensor to the x-axis is d , and the distance from the measured point to the x-axis is l = d l d . When taking any two points p m and p n on the gear, the measured data of the two points are p m ( l d m , θ m ) and p n ( l d n , θ n ) . When taking p m as the initial point, the angle between p m and the x-axis is arccos ( e / r m ) , the angle rotated by the gear from p m to p n is θ n θ m , and the angle between p n and the y-axis is arsin ( e / r n ) ; thus, the angle between p m and p n relative to the gear coordinate system can be expressed as:
θ = arccos ( e / r m ) + θ n θ m + arcsin ( e / r n ) π / 2 .
The measurement result can be transformed into polar coordinates as follows:
{ r = e 2 + l 2 = e 2 + ( d l d ) θ = arccos ( e / r m ) + θ n θ m + arcsin ( e / r n ) π / 2 .
Taking consecutive points for iterative calculation yields:
θ n = Δ θ + θ n 1 = arccos ( e / r n 1 ) + θ n + arcsin ( e / r n ) π / 2 .
Then, the conversion formula becomes:
{ r n = e 2 + l 2 = e 2 + ( d l d ) θ n = arccos ( e / r n 1 ) + θ n + arcsin ( e / r n ) π / 2 .

4. Basis for Offset Selection

Offset selection is affected by many factors. When using a small offset value, the problem of laser incident angle is not addressed, whereas a larger offset value leads to greater occlusion of the target tooth by the previous tooth, thereby reducing the effectiveness of the measurement, which cannot accurately reflect the gear error. Accordingly, the front tooth occlusion degree A M , the slope of the tooth profile normal line k, and the overall data efficiency D M were introduced to best select the range of the offset.
Here, the tooth number is z, the modulus is m , the addendum radius is r a , the dedendum radius is r f , the reference circle radius is r , the tooth thickness at the reference circle is s, and the pressure angle is α . Furthermore, α M is the angle occupied by the effective part of the measured point on the tooth profile, α o v e r a l l is the gear center angle occupied by the single-sided tooth line, s a = s r a r 2 r a ( i n v α a i n v α ) is the gear center angle occupied by the addendum, and s f = s r f r 2 r f ( i n v α f i n v α ) is the gear center angle occupied by the dedendum. The front tooth occlusion degree A M can be expressed as:
A M = α M α o v e r a l l
where α o v e r a l l = π z s a 2 s f 2 .
When considering the angle between the laser beam and the tooth profile normal, the angle can be judged according to the slope of the tooth profile normal line k. The center of the basic circle is O b ( 0 , 0 ) , and, after the involute has turned at a certain angle, it is recorded as O b ( x 0 , y 0 ) . Moreover, H ( x H , y H ) is the measured point, the basic circle radius is r b , and α H is the pressure angle at point H . Thus, the normal line of the tooth profile is:
{ y = k ( x x H ) + y H k = tan ( arctan ( y H + y 0 x H + x 0 ) + π 2 α H ) α k = r b O b H .  
As the value of k decreases, the angle between the normal of the tooth profile and the laser beam increases, and the fluctuation of the measurement data increases. In order to improve the angle during the measurement process, the angle should be close to parallel; in other words, the maximum k on the involute line should be kept at a large value under the offset. To reduce the angle to less than 30°, the absolute value of k should be larger than 3 .
The rationality of the offset value selection can be judged by the overall data efficiency. Accordingly, D is the number of valid data points in the measurement result data and D o v e r a l l constitutes all the data points of the measurement result. The overall data efficiency can be expressed as:
D M = D D o v e r a l l .
Combining the three factors, the best offset value can be described as M A X { A M K D M } , with the following boundary conditions:
{ A M 1 3 K o r K 3 .
For example, for an involute gear with 20 teeth, a modulus of 3, and a pressure angle of 20°, assuming no fluctuation in the measurement data, D = 1 . In this scenario, H ( x H , y H ) is a point on the reference circle, where { x H = e y H = 30 2 e 2 . Let 3 K or K 3 , such that π 3 < arctan ( y H + y 0 x H + x 0 ) + π 2 α H < 2 π 3 , and the solution is e 15 . Furthermore, A ( x a , y a ) is a point on the addendum; let the point of the addendum just cover the dedendum, whereby the angle between the addendum and the dedendum is θ = 2 π z s a , where { x a = e y a = 33 2 e 2 = r a cos α and α = arcsin ( r f r a 2 + r f 2 2 r a r f cos θ sin θ ) . Let A M 1 , such that solution is e 21.54 . The value of the offset is, thus, between 15 and 21.54.

5. Deviation Analysis Method

5.1. Pitch Deviation Analysis Method

After data conversion, the measurement data change from offset measurement data to gear center measurement data. The unfolding angle of any data point on the gear coordinate system is expressed as:
β i = ( Y i Y 1 ) α Y n Y 1 ,
where Y i is the number of pulses corresponding to any point, Y 1 is the number of pulses at the first point, and Y n is the number of pulses at the last point.
The data points are expanded according to the polar coordinates of the gear; then, the coordinates of the intersection point P i of the fitted tooth profile and the theoretical reference circle can be determined. When using the dichotomy iteration to find points near the reference circle, the pitch value of the interpolation curve of each tooth profile is expressed as:
P I 1 P i = r m 2 arcsin ( ( y i y i 1 ) 2 + ( x i x i 1 ) 2 2 r m ) ,
where r m is the reference circle radius, and ( x i , y i ) ( x i 1 , y i 1 ) are the coordinate data of the interpolation point after iteration.

5.2. Helix Angle Analysis Method

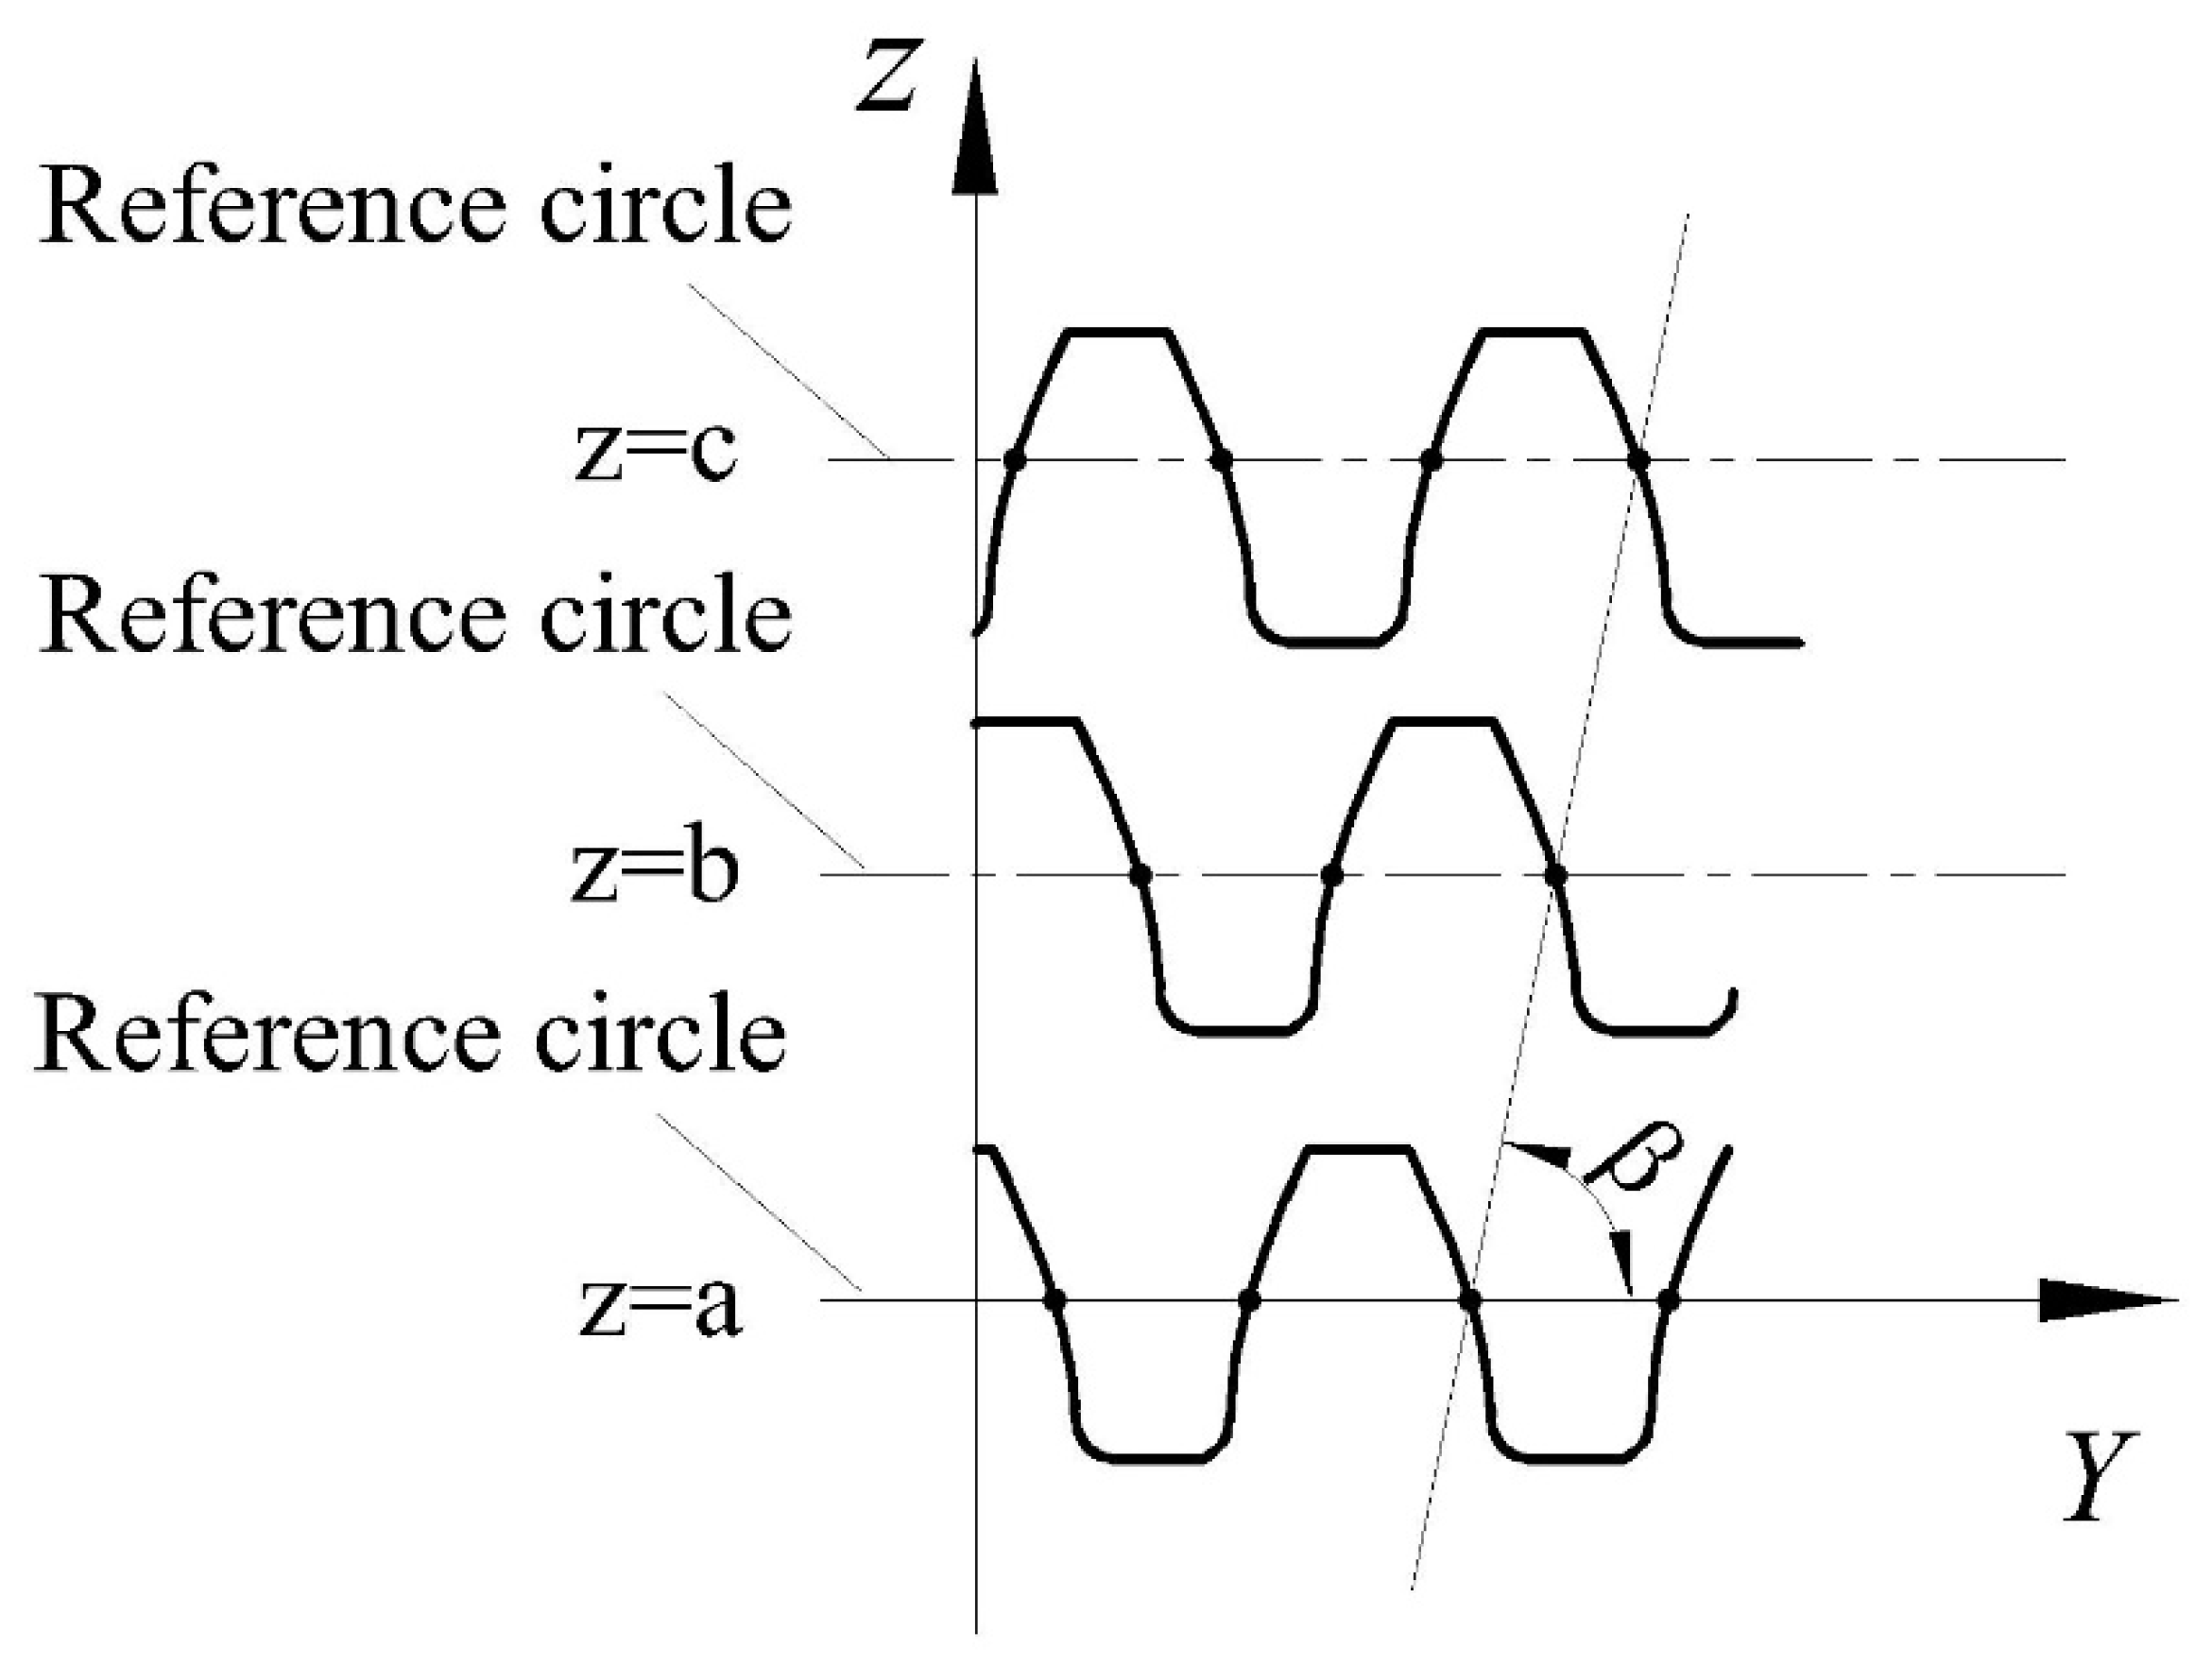
Figure 6 shows a schematic diagram of helix angle analysis. Suppose that the fitted line equation is z = b 0 + b 1 y ; thus, the sum of squared deviations from three points to the line is i = 1 3 δ i 2 = [ z i ( b 0 + b 1 y i ) ] 2 . Using the least square method, the derivative of b i can then be obtained as follows:
[ 3 i = 1 3 y i i = 1 3 y i i = 1 3 y i 2 ] [ b 0 b 1 ] = [ i = 1 3 z i i = 1 3 z i y i ] ,
where β = arctan b 1 .

6. Measuring Device and Software System

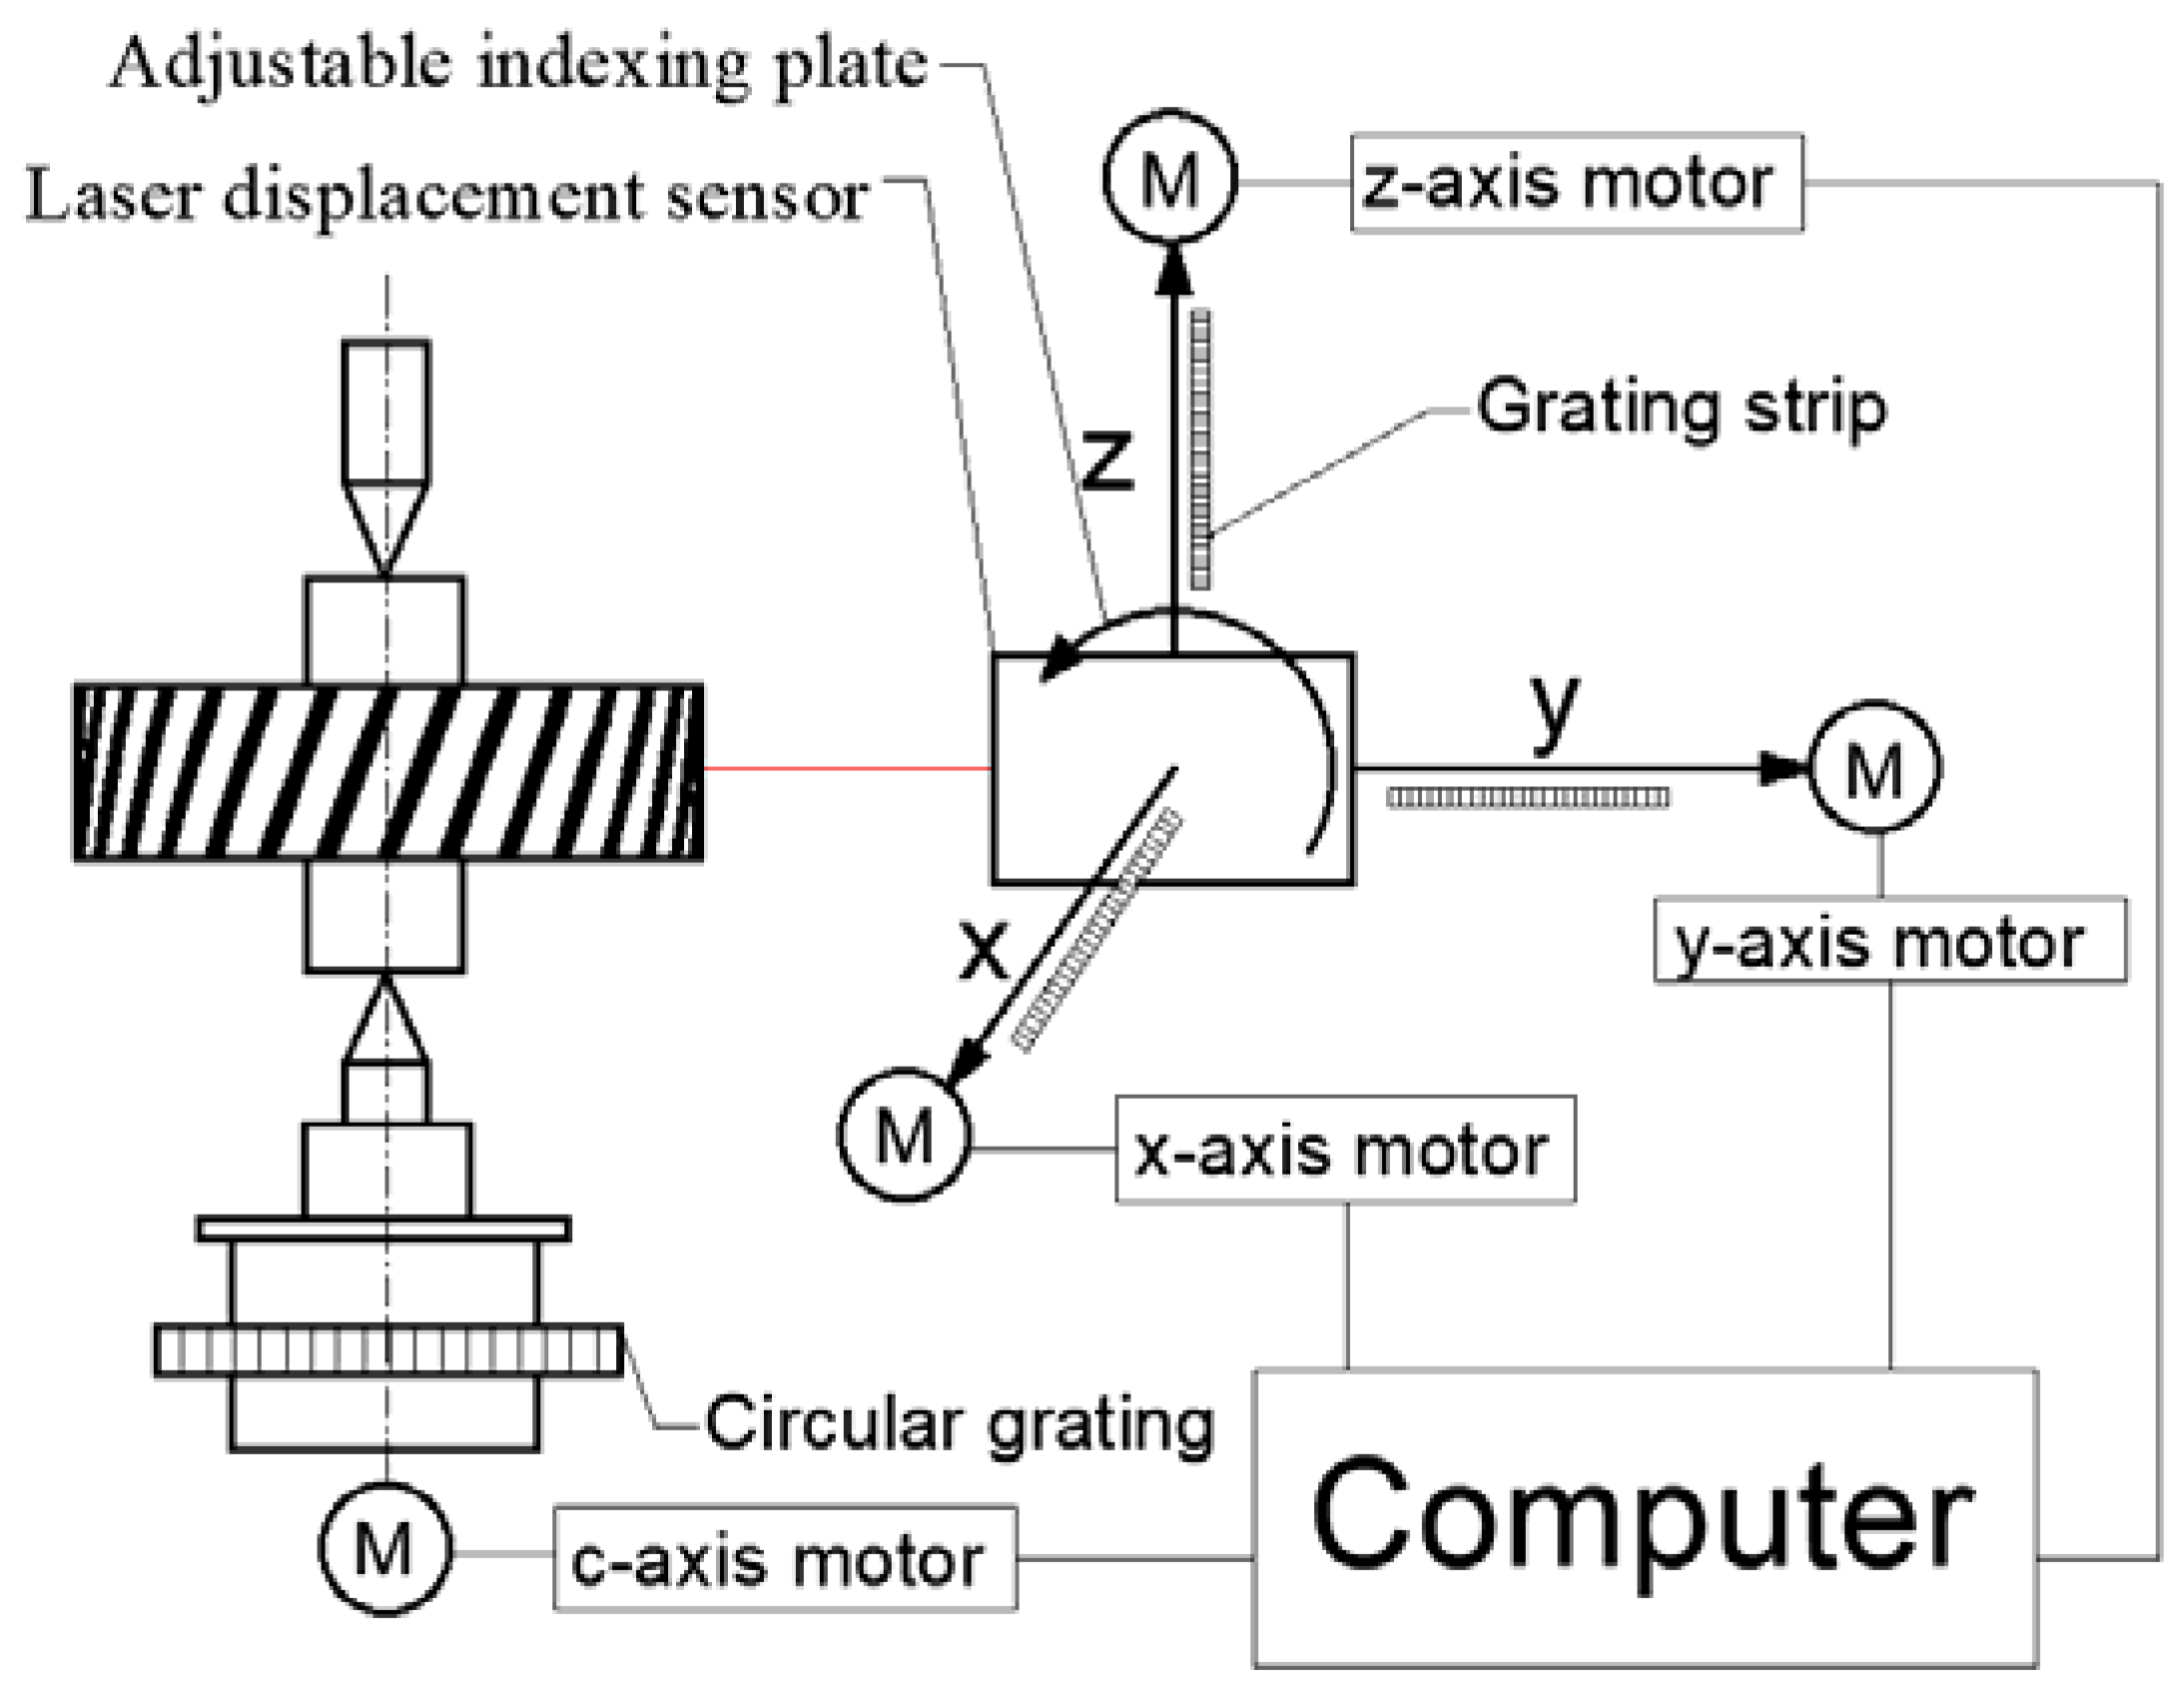
As shown in Figure 7, the designed measuring device is mainly composed of three parts: the computer control system, the servo system, and the grating feedback system. The position data are measured by the laser displacement sensor. The angle data are read by the encoder on the workpiece turntable. The spatial position and movement of the laser displacement sensor are fed back by the grating of the three coordinates.
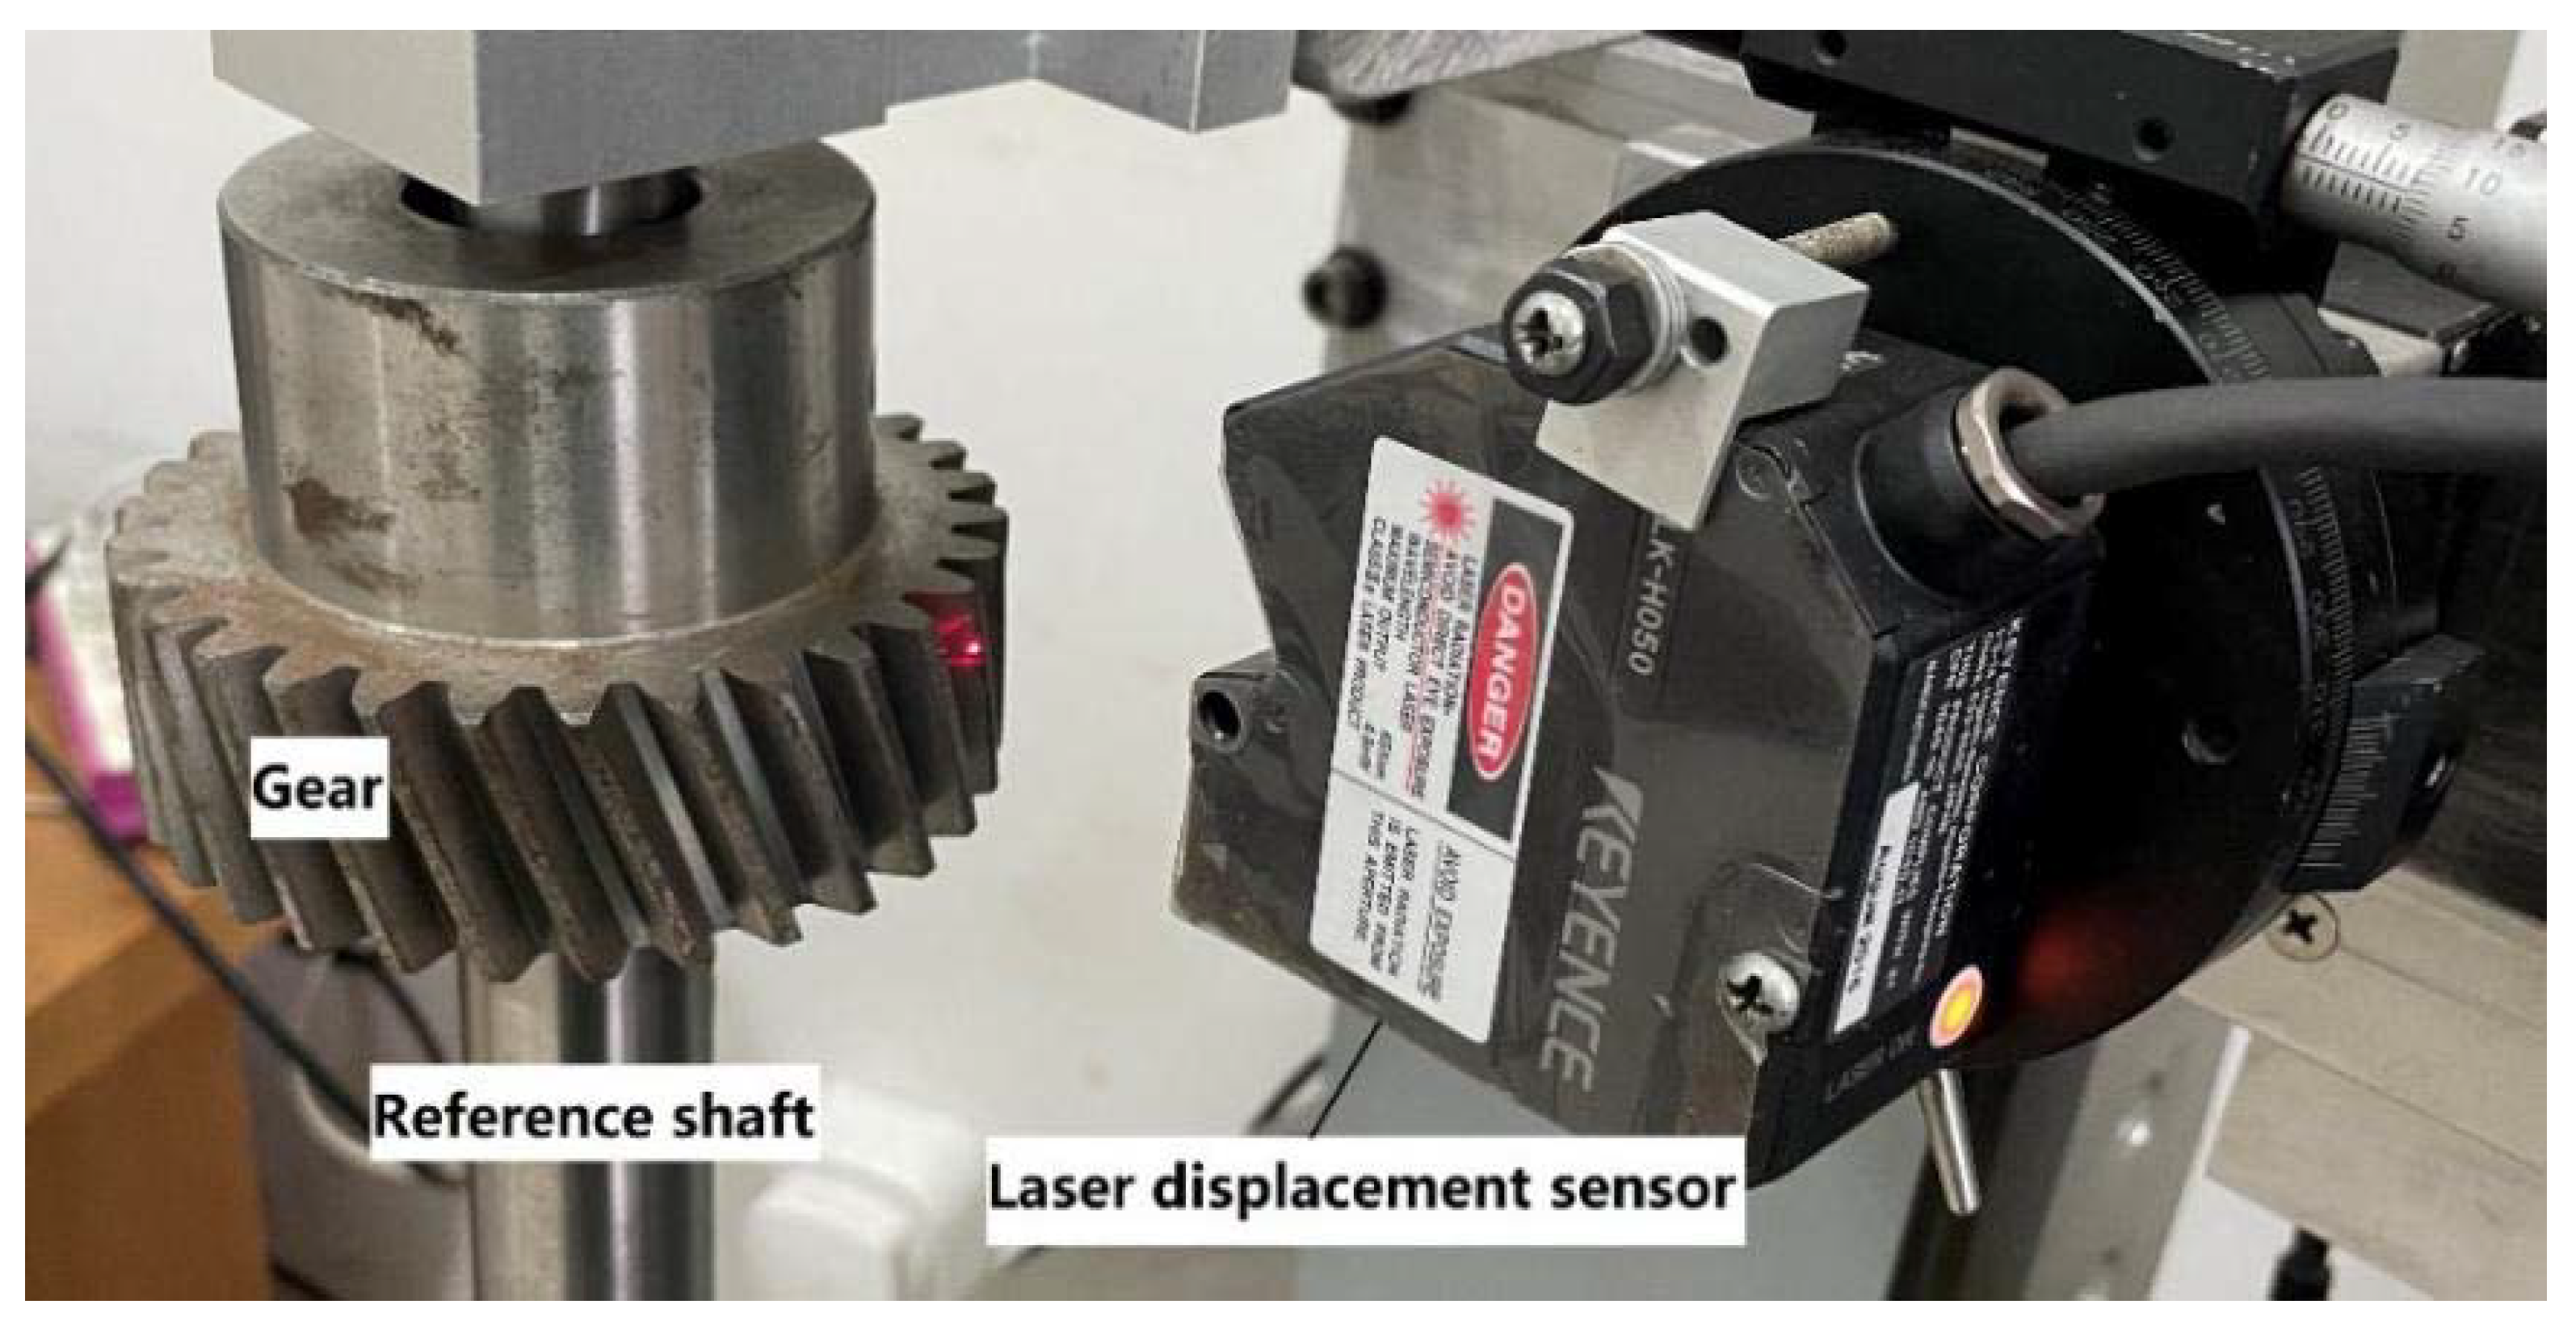
As shown in Figure 8, the device has a vertical structure. The three-coordinate displacement device is equipped with a laser displacement sensor, which can move linearly in the x-, y-, and z-directions. The laser displacement sensor and the guide rail are connected by an adjustable indexing plate, which can be adjusted on the YOZ plane. The workpiece turntable is driven by a motor with a built-in encoder. The spatial positions of the laser beam and gear are checked by the reference shaft. Parts with holes can be installed on the shaft for measurement. The laser displacement sensor used was an LK-H050 from KEYENCE, and the reference shaft used was a GCr15-SUS440C with five-level accuracy.
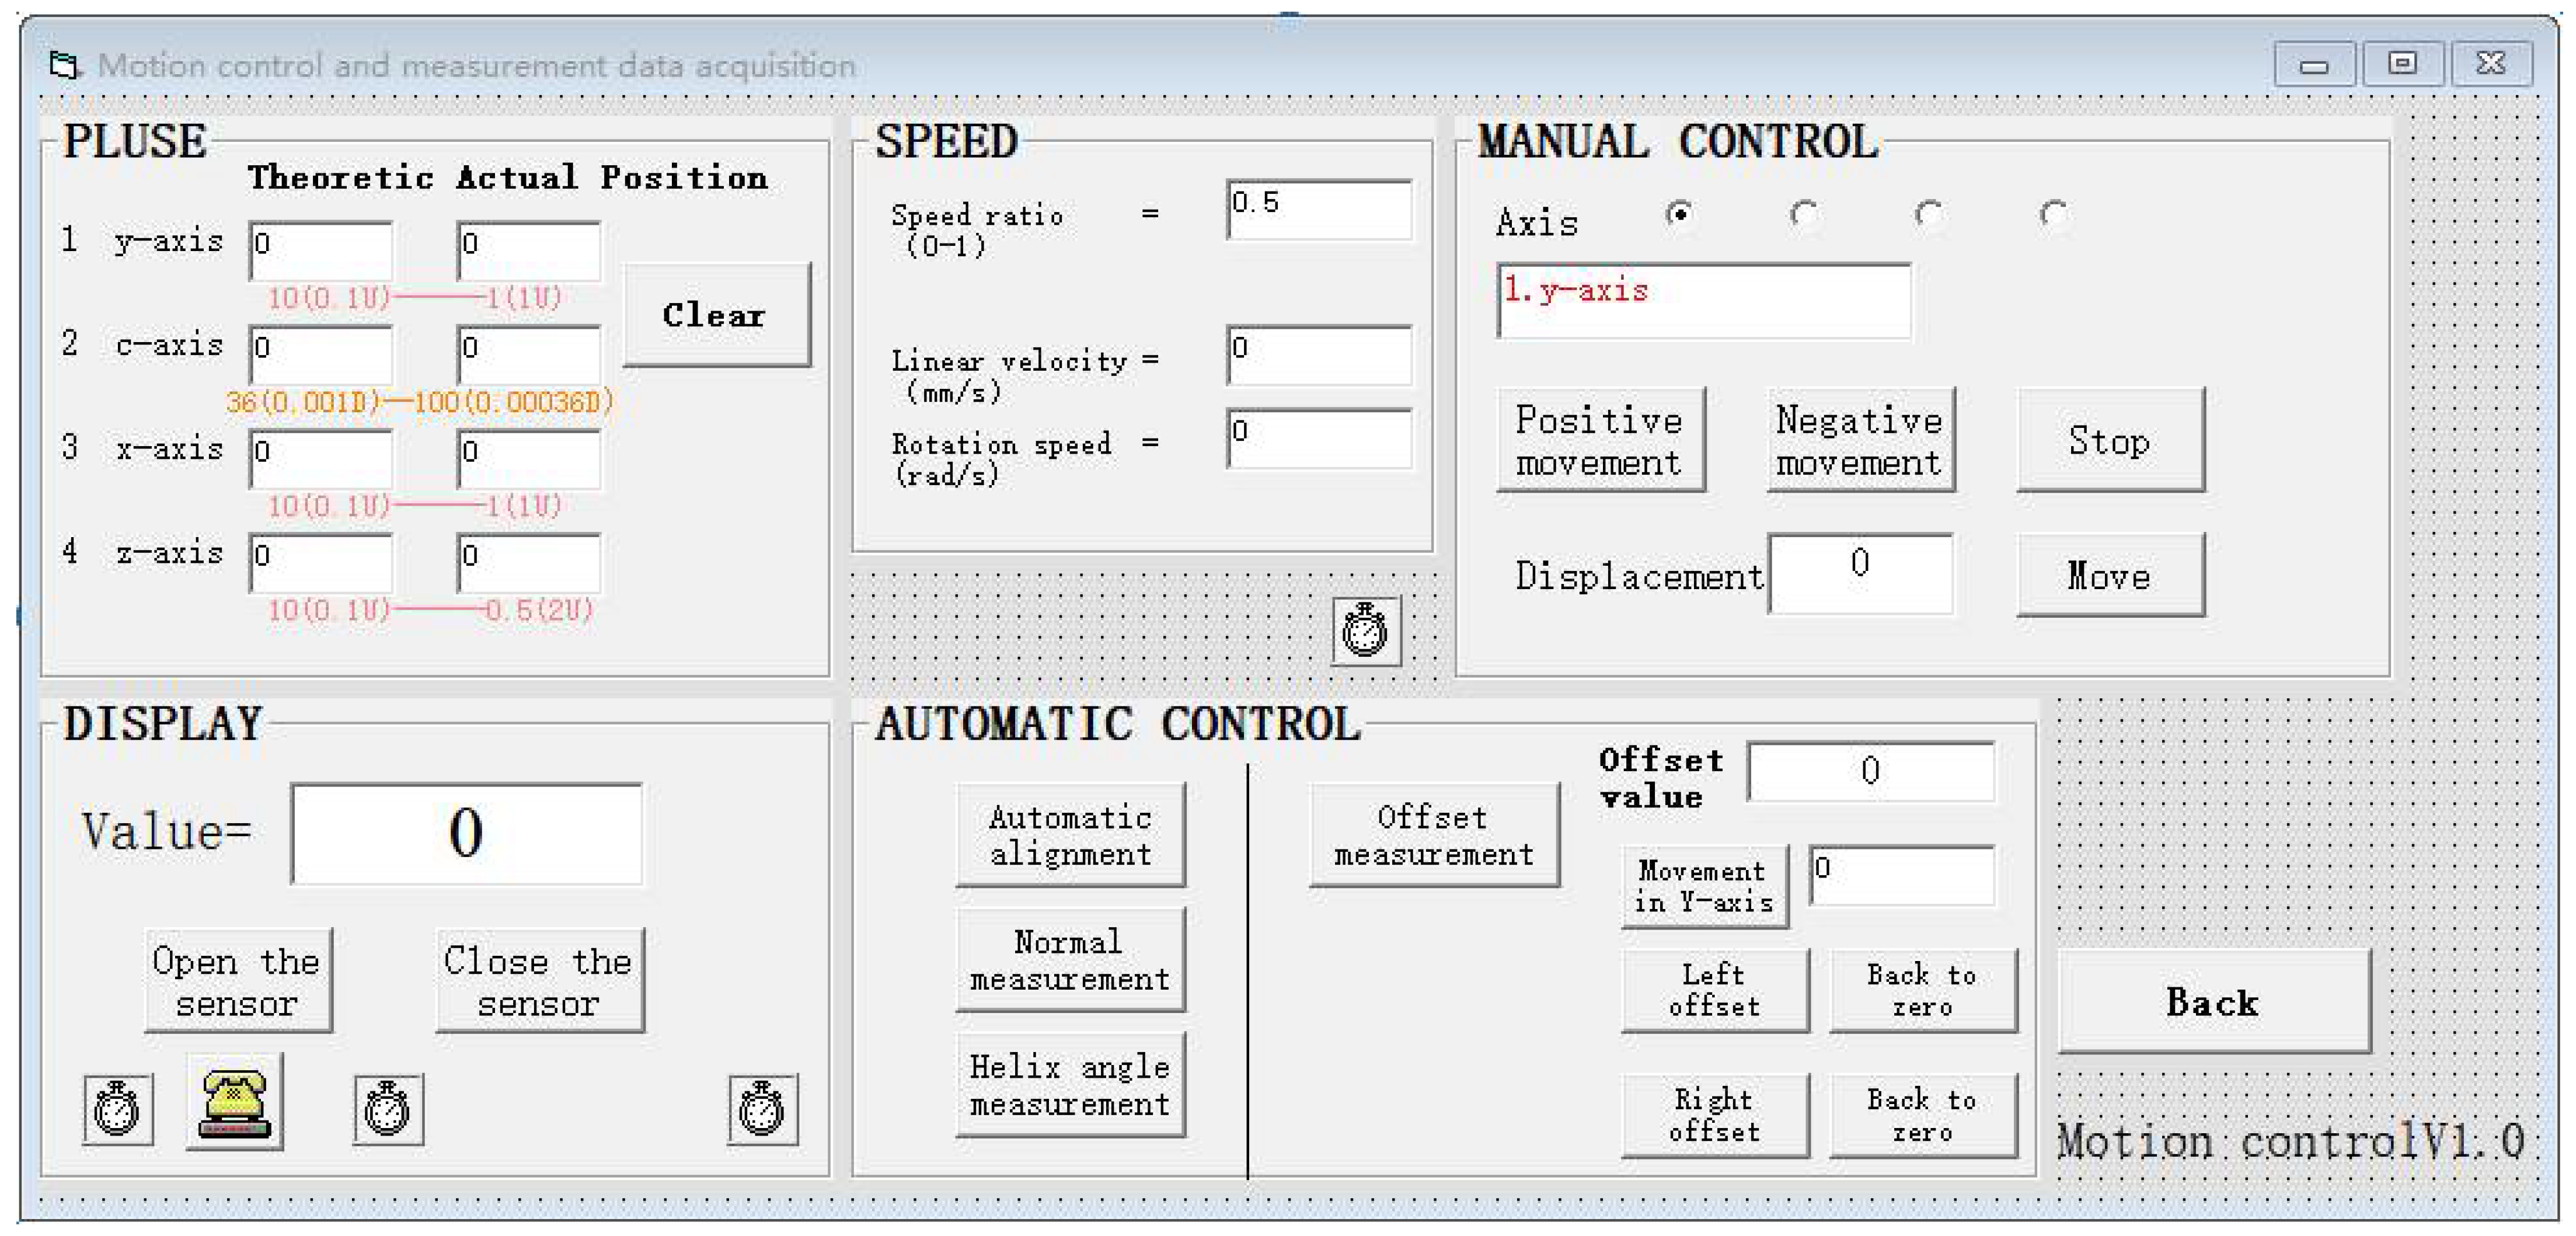
The software system is shown in Figure 9. The coordinate translation module is used to control the movement of the probe in the x-, y-, and z-directions and the rotation of the workpiece turntable along the C-axis. The speed control module is used to control the movement speed of the four axes, the grating feedback module feedback is used to control the theoretical displacement and actual displacement of each axis, the measured value display module displays the current laser displacement sensor readings, the automatic control module can realize automatic alignment of the shaft center, and the offset measurement module can realize automatic offset measurement. The spatial position of the laser probe or worktable can be adjusted manually or automatically, whereas the tooth profile measurement and offset measurement can be performed automatically.
7. Experiment

7.1. Experimental Device

In offset measurement, the relative spatial position of the laser beam and the gear is calibrated by the cylindrical shaft; in other words, the laser beam passes through the center of the workpiece coordinate system when the reading of the laser displacement sensor moving along the x-axis guide rail reaches the maximum value. Then, according to the offset value e and gear parameters, the laser displacement sensor can be moved along the x-axis rail to the offset position and along the y-axis rail to the measurement position, such that the gear reference circle is located within the range D of the sensor.
The offset measurement experiment is shown in Figure 10. The gear was installed on the shaft, and the sensor was offset by a certain distance from the gear center. During the measurement, the gear rotated at a constant speed ratio, and the encoder on the workpiece turntable recorded the angular pulse data of the measured point on the gear. At the same time, the laser displacement sensor collected the displacement data of the measured point relative to the laser source. The angular displacement data were output to the file through the measurement software.

7.2. Data Conversion

As an example, we considered the measurement result curve of a helical cylindrical gear with 30 teeth, a normal modulus of 3, and a helix angle of 20° for data conversion. The measured offset was 23. In Figure 11, the red line is the result of the measurement data, and the black line is the result of transforming the red line. The abscissa is the number of pulses of the measurement system, whereby the workpiece rotates 360° for one million pulses, and the ordinate is the distance from the measurement data point to the center of the gear. It can be seen from Figure 11 that the black line was skewed before transformation, and the proportion of measured pulses at the tooth profile involute was significantly higher than the normal proportion. After coordinate transformation, the deflection was eliminated, and the tooth profile conformed to the actual tooth profile.

7.3. Selection of the Best Offset Value

Using a seven-level accuracy helical cylindrical gear with 30 teeth, a normal modulus of 3, and a helix angle of 20° as an example, 14 sets of different offset control tests were carried out according to the gear parameters with values of 17–30. Figure 12 shows a graph of the measurement data obtained with different offsets. Figure 13 shows measurement graphs in the three cases where the offset was 17, 24, and 30. It can be seen that, when the offset was small, there were few effective measurement points of the involute tooth profile. When the offset was increased, the number of points of the involute tooth profile in the graph also increased, thus slowing the measurement graph at the involute, decreasing the number of points at the dedendum, and reducing their proportion in the measurement graph. Upon further increase, the occlusion of the back teeth by the front teeth increased during the measurement process, and the dedendum was gradually blocked until it could no longer be measured.
Among the offsets selected in the experiment, only the last set of tooth profiles was covered by the front teeth. The accuracy was judged on the basis of the number of valid data points. In the measurement data, the tooth profile was considered between the dedendum radius measurements +10% of the tooth height and the addendum radius measurements −10% of the tooth height. As shown in Table 1, the selection of offset values was positively correlated with the number of effective points of the tooth profile. Within a reasonable range of offset values, a larger offset value resulted in a greater number of valid data points of the tooth profile. However, when the offset value exceeded 29, the laser beam crossed the tooth tip and instead measured the back tooth from the dedendum, thereby increasing the data fluctuation. In this case, the distance between the measurement starting point and the side of the tooth was relatively short, which affected the measurement of the tooth profile and shortened the effective measurement range.
According to Figure 13 and Table 1, when the offset value was between 23 and 29, there were more effective data points and less data fluctuation. Specifically, when the offset value was 29, the angle between the laser beam and the tooth profile normal was the smallest, leading to the greatest number of effective data points, thereby meeting the conditions of the best offset value.

7.4. Error

A pitch deviation analysis and a helix angle analysis were performed on the measured data with an offset of 23. In addition to the offset measurement, two measurements were taken at different sections of the gear to measure the helix angle.
(a)
Pitch deviation analysis result
To analyze the tooth pitch deviation, the data points were connected by the spline curve after coordinate conversion. Dichotomy was used iteratively to identify the intersection point of the reference circle and spline curve. The distance between adjacent intersections was considered an individual pitch deviation, the difference between the individual pitch and the nominal pitch was considered a single pitch deviation, and the difference between the actual arc length and the nominal arc length of k pitches was considered the cumulative pitch deviation. Table 2 shows the individual pitch deviations and cumulative pitch deviations of some teeth. Figure 14 shows the individual pitch deviation graphs of all 30 teeth of the tested gear. Figure 15 shows the cumulative pitch deviation graphs. The maximum pitch deviation of this gear was 0.02 mm, the minimum pitch deviation was 0.003 mm, and the maximum cumulative pitch deviation was 0.03 mm.
(b)
Helical angle measurement result
After converting the measurement data from the different sections of the gear, the intersection point of each data point with the reference circle was calculated. Then, a straight-line equation was fitted using three points on the same tooth, before determining the slope k value of the straight-line equation using the least-squares method, thus obtaining the helix angle. Table 3 lists the calculated helix angles of some teeth, whereas the actual helix angle of the gear was 20.57°.
The above experiments show that this measurement method is suitable for a rapid and precise measurement of gears. It represents a novel idea for the laser measurement of gears, representing a notable contribution to the field of gear measurement.

8. Conclusions

(1)
This paper proposed an offset laser measurement method for the deviation analysis of cylindrical gears. By offsetting the laser beam and the gear within a certain range, the accuracy and stability problems caused by object surface inclination errors could be addressed. We provided a basis for offset selection by discussing an optimal offset model, and we proposed a coordinate conversion method to process the offset measurement data. The feasibility of the method was verified by experiments.
(2)
The selection of offset is affected by gear parameters, the front tooth occlusion degree, the slope of the tooth profile normal line, and the overall data efficiency. According to the gear parameters, the minimum offset determined by the slope of the tooth profile normal line and the maximum offset should be identified to ensure the efficiency of the data. The maximum value in the interval should be measured, where the angle between the laser beam and the tooth profile normal is smallest and the number of effective data points is greatest, thus meeting the conditions of the best offset value.
(3)
The offset laser measurement method proposed in this paper allows optimizing the angle of the laser beam and the normal vector of the tooth profile. Compared with laser measurement methods through the gear center, this approach allows collecting more data points of the tooth profile, as well as analyzing multiple errors. This leads to an improvement in the measurement accuracy and data stability, making this approach suitable for precision gear measurement. It can also be used to measure other types of gear or rotating bodies.

Author Contributions

Conceptualization, N.M.; methodology, N.M.; software, N.M.; validation, N.M.; formal analysis, N.M.; investigation, C.Y.; resources, C.Y.; data curation, N.M.; writing—original draft preparation, J.P.; writing—review and editing, A.S.; visualization, N.M.; supervision, A.S.; project administration, A.S.; funding acquisition, A.S. All authors have read and agreed to the published version of the manuscript.

Funding

This work was supported by the National Natural Science Foundation of China (grant number 51475409).

Institutional Review Board Statement

Not applicable.

Informed Consent Statement

Not applicable.

Data Availability Statement

The data presented in this study are available on request from the corresponding author. The data are not publicly available due to there are still follow-up studies that need to be completed.

Conflicts of Interest

The authors declare no conflict of interest.

References

  1. Zhang, Z.; Wen, C.; Zeng, J. Gear Detection Technology; China Machine Press: Beijing, China, 2012. [Google Scholar]
  2. Jin, J.; Li, W.; Duan, Z. Principle and Technology of Large Gear on Machine Measurement; China Machine Press: Beijing, China, 2016. [Google Scholar]
  3. Ma, D.; Wu, J.; Liu, T.; Yan, S. Deformation analysis of the flexspline of harmonic drive gears considering the driving speed effect using laser sensors. Sci. China Technol. Sci. 2017, 60, 1175–1187. [Google Scholar]
  4. Tian, H.; Wu, F.; Gong, Y. Gear Tooth Profile Reconstruction via Geometrically Compensated Laser Triangulation Measurements. Sensors 2019, 19, 1589. [Google Scholar] [CrossRef] [PubMed] [Green Version]
  5. Raghuwanshi, N.K.; Parey, A. Experimental Measurement of mesh stiffness by laser displacement sensor technique. Measurement 2018, 128, 63–70. [Google Scholar] [CrossRef]
  6. Jiang, H.; Sun, X.; Liu, F. Measurement method of tooth friction force for helical gears by laser displacement sensor. J. Braz. Soc. Mech. Sci. Eng. 2020, 42, 1–9. [Google Scholar] [CrossRef]
  7. Lin, Q. Research and Development of Gear Laser Precision Measuring Device and Software System. Master’s Thesis, Yangzhou University, Yangzhou, China, 2017. [Google Scholar]
  8. Sandak, J.; Tanaka, C.; Ohtani, T. Evaluation of surface smoothness by a laser displacement sensor II: Comparison of lateral effect photodiode and multielement array. J. Wood Sci. 2004, 50, 22–27. [Google Scholar] [CrossRef]
  9. Sun, B.; Li, B. A quantitative error compensation model of the inclination angle of the laser displacement sensor. Chin. J. Sci. Instrum. 2015, 36, 996–1004. [Google Scholar]
  10. Pei, Y.-C.; Xie, H.-L.; Tan, Q.-C. A non-contact high precision measuring method for the radial runout of cylindrical gear tooth profile. Mech. Syst. Signal Process. 2020, 138, 106543. [Google Scholar] [CrossRef]
  11. Huang, X. Accuracy Analysis and Uncertainty Evaluation of Laser Sensor Displacement Measurement. Master’s Thesis, Dalian University of Technology, Dalian, China, 2012. [Google Scholar]
Figure 1. The principle of triangulation.
Machines 09 00111 g001
Figure 2. The spot shape when the laser beam is facing the center of the shaft.
Machines 09 00111 g002
Figure 3. The spot shape when laser beam is off-center.
Machines 09 00111 g003
Figure 4. Schematic diagram of the normal of the tooth profile.
Machines 09 00111 g004
Figure 5. Schematic diagram of offset laser measurement method.
Machines 09 00111 g005
Figure 6. Schematic diagram of helix angle analysis.
Machines 09 00111 g006
Figure 7. Measurement system.
Machines 09 00111 g007
Figure 8. The measurement device.
Machines 09 00111 g008
Figure 9. The software system.
Machines 09 00111 g009
Figure 10. Gear offset measurement experiment.
Machines 09 00111 g010
Figure 11. Coordinate conversion result with an offset value of 23.
Machines 09 00111 g011
Figure 12. Measurement graphs for different offsets.
Machines 09 00111 g012
Figure 13. Measurement graphs at three different offsets.
Machines 09 00111 g013
Figure 14. Individual pitch deviation.
Machines 09 00111 g014
Figure 15. Cumulative pitch deviation.
Machines 09 00111 g015
Table 1. Average number of effective data points for a single tooth under different offsets.
Offset Value1718192021222324252627282930
Average number of valid data
points for a single tooth profile
8686878889909193959799101102104
Table 2. Pitch deviation with an offset value of 23.
NumberPitchIndividual Pitch DeviationCumulative Pitch Deviation
29.969280.020910.02091
39.93671−0.011670.00923
49.958960.010580.01982
59.960290.011910.03173
69.93681−0.011570.02016
Table 3. Analysis of helix angle with an offset value of 23.
Number15161718192021
Helix angle20.5589220.8693120.8557920.9552621.0631620.8679520.94725
Publisher’s Note: MDPI stays neutral with regard to jurisdictional claims in published maps and institutional affiliations.