Article

Numerical and Experimental Study of Hydraulic Performance and Wear Characteristics of a Slurry Pump

1
Research Center of Fluid Machinery Engineering and Technology, Jiangsu University, Zhenjiang 212013, China
2
Key Laboratory of Fluid Machinery and Engineering, Xihua University, Chengdu 610039, China
3
Shanghai Kaiquan Pump (Group) Co., Ltd., Shanghai 201804, China
*
Author to whom correspondence should be addressed.
Machines 2021, 9(12), 373; https://doi.org/10.3390/machines9120373
Submission received: 10 November 2021 / Revised: 3 December 2021 / Accepted: 17 December 2021 / Published: 20 December 2021
(This article belongs to the Special Issue Optimization and Flow Characteristics in Advanced Fluid Machinery)

Abstract

:
The slurry pump is widely used in ore mining, metal smelting, petrochemical, and other industries, mainly to transport fluid media containing large solid particles. Importantly, it is easy to damage the impeller of a slurry pump in the operation process, which greatly affects the performance of the pump. In this paper, a 25 MZ slurry pump was selected as the research object, and the Euler–Euler multiphase flow model was employed to analyze the internal flow characteristics of the slurry pump under the conditions of clear water and solid–liquid two-phase flow. Additionally, the flow characteristics of each part under different flow conditions were studied, and the effects of different particle volume concentrations, particle sizes, and pump speeds on the impeller’s wear characteristics and hydraulic performance were analyzed. In order to verify the reliability and accuracy of the numerical simulation results, clean water and solid–liquid two-phase flow wear tests of the slurry pump were carried out, and the results showed that a high solid volume fraction and solid–phase slip velocity were generated at the junction of the blade leading edge and the rear cover plate, thus leading to easier wear of the blade. Therefore, enhancing the strength of the junction between the blade leading edge and the rear cover plate is beneficial for improving service life and should be considered in the design of slurry pumps.

1. Introduction

As an important piece of energy conversion equipment, the slurry pump has been widely used in mining, electric power, metallurgy, coal, and other industries. Both the complexity of the solid–liquid two-phase flow in the slurry pump and the limitations of two-phase flow field measurement technology have made it very difficult to obtain flow field information of an entire flow channel. Therefore, capturing the flow field characteristics of slurry pumps is the fundamental objective of their optimized design and wear investigation. In recent years, there has been much research on the motion of the solid–liquid two-phase flow. Wang et al. [1] used a CFD-DEM coupling algorithm to study the spatial distribution and motion characteristics of particles with different sizes, and the effects of particle diameter on the intensity and scale of the vortex in a guide vane were investigated; it was concluded that the existence of particles had a limited effect on the hydraulic performance of the pump in low-concentration fluids. In a numerical study of the internal flow field of the solid–liquid slurry pump, Shi et al. [2] analyzed the wear mechanism of the volute wall of a slurry pump and proposed an effective wear equation for estimating the wear strength and wear area of the slurry pump volute. Peng et al. [3] analyzed slurry flow under different particle concentrations and volume flows by using the Euler–Euler method, and the effects of particle concentration on flow resistance, reflux, and wall wear were assessed. Li et al. [4] simulated the solid–liquid two-phase flow in a centrifugal pump by using the computational fluid dynamics discrete element coupling method. Their results showed that the increase in the wear rate was related to the increase in particle mass concentration. Tan et al. [5] utilized high-speed photography to track the movement of solid–liquid two-phase flow particles in a double-blade slurry pump, and the effects of particle diameter and density on the collision characteristics were analyzed. The results showed that with the increase in particle size, the average time through the pump first decreased and then increased. Shen et al. [6] designed a new type of longitudinal groove structure for the volute to improve the internal flow field. Wang et al. [7] combined numerical simulations and experiments to study the wear characteristics of an open impeller, and they concluded that the most serious wear area of the impeller was the middle of the pressure surface. Zhao et al. [8] simulated turbulence with a homogeneous balance model, and the relationships between concentration and external performance, velocity, pressure, and turbulent kinetic energy distribution were evaluated. Wang et al. [9] investigated the relationships between particle size, volume concentration, solid-phase volume, and inlet pressure fraction by using a mixed multiphase flow model. Wang et al. [10] combined experiments and calculation models to study the effects of different coating thicknesses on the operating characteristics of centrifugal pumps, and they reported on the effect of coating thickness on performance and pressure fluctuations. Gu et al. [11] employed the Euler model to build a non-smooth surface on an impeller blade for numerical simulation, and they found that the non-smooth surface area was better able to reduce drag and affect the performance of the pump. Yan et al. [12] carried out a full-channel numerical simulation of solid–liquid two-phase flow by using the McLaury wear model, and the distribution region and variation trend of impeller and volute wall wear caused by the change of clearance were assessed. Wang et al. [13] studied the flow characteristics and wear performance of the pump at different rotational speeds with numerical simulation and calculated the wear rate of the blade surface at different rotational speeds. Tang et al. [14] studied the solid–liquid flow in a pump and compared the contact force and collision characteristics of particles with different shapes.
Most of the abovementioned studies considered the effects of the shape and size of particles on the wear characteristics of pumps, but there has been little research on the investigation of slurry pumps under different flow conditions and pump speeds. Therefore, the authors of this paper used numerical simulations and experiments to analyze the internal flow characteristics of a slurry pump under the conditions of clear water and two-phase flow. The flow characteristics of each part under different flow conditions were studied, and the effects of different particle volume concentrations, particle sizes, and pump speed on the impeller’s wear and hydraulic performance were analyzed. Additionally, in order to verify the reliability and accuracy of the numerical simulation results, clean water and solid–liquid two-phase flow wear tests of the slurry pump were carried out to provide reference for the optimization of the design of the slurry pump.

2. Analysis Model

In this paper, a 25 MZ slurry pump is selected as the research object. Its main geometric parameters are shown in Table 1, where the design flow conditions are represented by QBEP (Best Efficiency Point, BEP).

2.1. 3D Modeling

In order to study the internal flow field of the slurry pump, the fluid domain was simplified into four parts: inlet, impeller, volute, and outlet. Based on the three-dimensional modeling software UG, the solid modeling of each fluid domain was built, and the three-dimensional model of the main components is shown in Figure 1.

2.2. Grids

In this paper, ICEM was employed to mesh the fluid domains. Considering that the quality of the grid has a great influence on the convergence and reliability of calculation results, the calculation domain was divided into a hexahedral structured grid to better improve the accuracy of the numerical simulation. The structural grids of the main components are shown in Figure 2.
Meanwhile, the greater the number and the higher the quality of grids that are generated, the more accurate the calculation results that can be obtained. However, too many grids consume many computing resources. Therefore, to ensure the accuracy of numerical simulation results and the rational use of computer resources, the grid independence of the calculation domain was conducted [15,16,17,18,19,20]. For this section, the calculation of slurry pump models with different grids was carried out, and a reasonable number of grids were obtained by comparing the fluctuation of head and efficiency. As shown in Figure 3, with the increase in grid number, the fluctuation value of the head efficiency gradually decreased. Additionally, when the grid number was 2.7 million, the fluctuation value of the external characteristic was less than 1.0%, which met the requirements of numerical simulations. Therefore, a grid number of 2.7 million was selected for the investigation.
ANSYS CFX was employed the calculation of the water, which was selected as the fluid medium, and the medium temperature was 298 K. Total pressure inflow (1 atm) and mass flow outflow were adopted, and the standard k-ε turbulence model was selected as the turbulence model. Meanwhile, the fluid domain of the impeller was set as the rotating part; the inlet section, the outlet section, and the volute were set as the stationary parts; the frozen rotor method was adopted for the interface; and the convergence accuracy was set to 1.0 × 10⁻⁵. In this paper, the continuity equation of incompressible fluid and the Navier–Stokes equation were employed to describe the three-dimensional turbulence in a centrifugal pump.
The continuity equation is as follows:
( ρ u i ) x i = 0
The Navier–Stokes equation for incompressible fluid is as follows:
( ρ u i ) t + ( ρ u i u j ) x j = p x j + ρ F i + 2 ( μ S i j ) x j
In the formula, ρ: fluid density; t: time; Fi: the volume force component of a fluid per unit mass; P: pressure; ui and uj (i, j = 1, 2, 3): the velocity component of the fluid; xi and xj (i, j = 1, 2, 3): coordinate components; μ: molecular viscosity coefficient; and Sij: the fluid deformation rate tensor.
S i j = 1 2 ( u i x j + u j x i )
For the calculation of solid–liquid two-phase flow, the heterogeneous flow model of the particle in the Euler–Euler method was adopted. The flow conditions of 0.6 QBEP, 1.0 QBEP, and 1.5 QBEP were selected to carry out the calculations, and particle volume concentrations of 5%, 10%, 15%, 20%, and 25% were chosen. Meanwhile, the density of solid particles was set to 2900 kg/m3, and the particle diameters were 0.15, 0.3, and 0.6 mm. The Gidaspow model was selected for the drag force, the Favre-averaged drag force model was selected for the turbulent dissipative force, and the dissipation coefficient was 1.0. In this paper, the effects of lift, virtual mass force, and wall lubrication force on the flow field were not considered. The inlet of the two-phase flow adopted the mass flow inlet, and the outlet adopted the average static pressure outlet. Considering the liquid without the slip velocity on the wall, the liquid phase adopted the non-slip wall. However, the wear effect of particles on the wall was considered, the solid phase adopted a free slip wall, and the SIMPLE algorithm was used to solve the pressure–velocity coupling.
Due to the different densities of solid particles and water, the density of the transport medium of the slurry pump changed after the solid particles were added to the clear water, and the calculation formula is as follows:
ρ = C v ( ρ 1 ρ 2 ) + ρ 2
In the formula, ρ′ is the density of solid–liquid two-phase flow, ρ1 is the density of solid particles, ρ2 is the density of water, and Cv is the volume concentration of particles. The calculation results of fluid density in the centrifugal pump under different solid phase volume concentrations are shown in Table 2.

3. Results and Discussion

3.1. Flow Field Analysis of Inlet

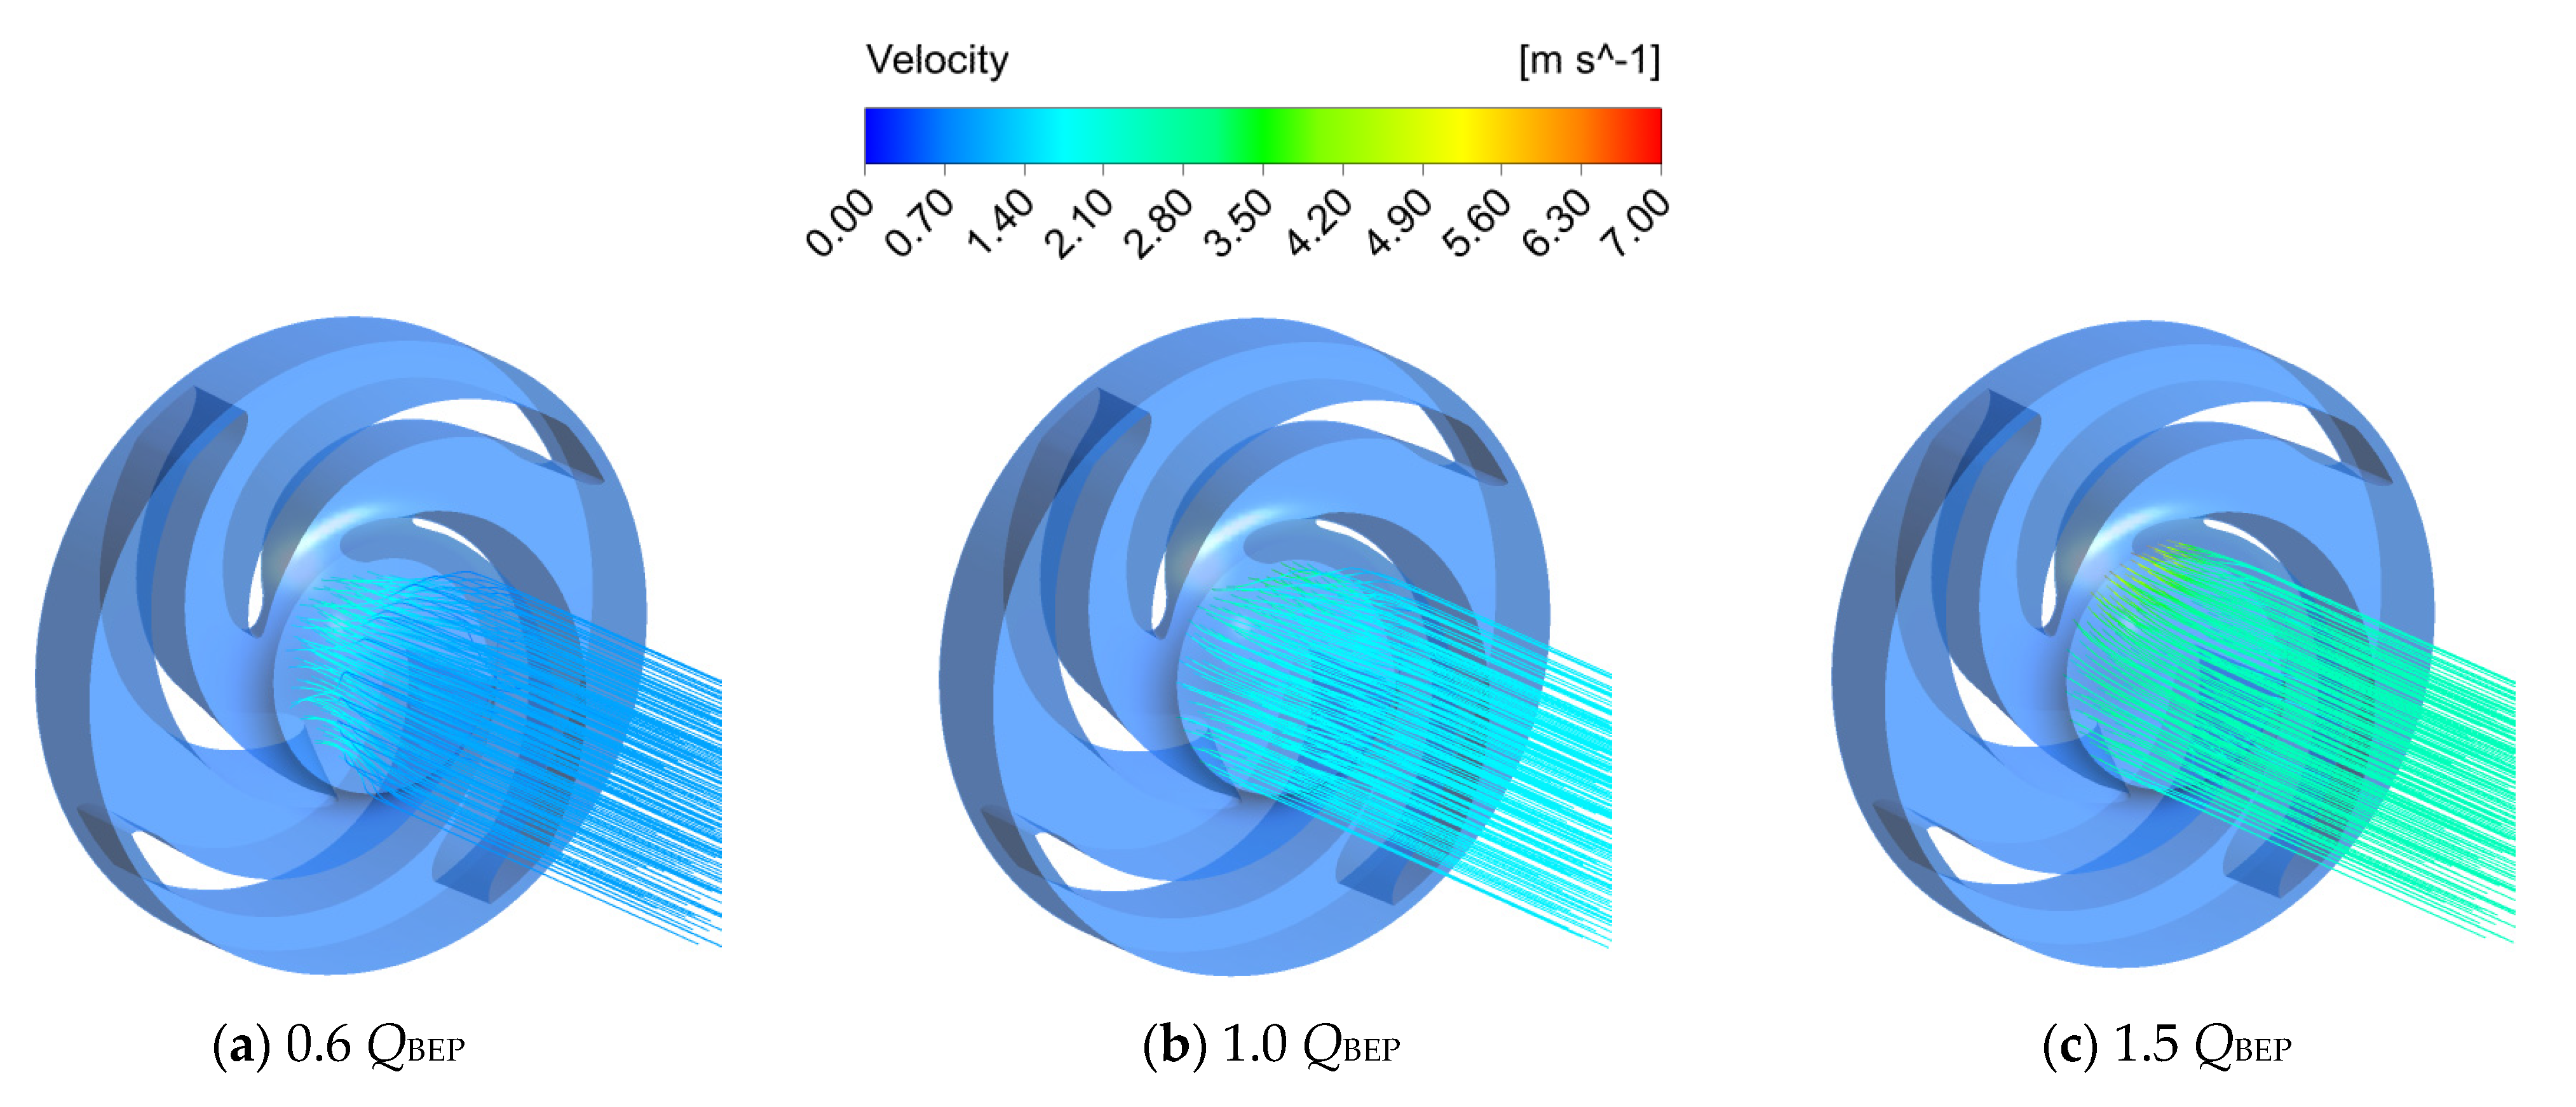
Figure 4 and Figure 5 show the streamline distribution of the inlet section when using clean water and when using a medium containing 15% solid particles with a diameter of 0.6 mm under 0.6 QBEP, 1.0 QBEP, and 1.5 QBEP. It can be seen from Figure 4 that the fluid in the inlet section had a slight pre-rotation, and the pre-rotation direction was consistent with the rotation direction of the impeller under 0.6 QBEP. Under the effect of the rotation impeller, the fluid direction changed from axial flow to radial flow. Meanwhile, with the increase in the flow rate, the velocity at the impeller inlet gradually increased, and the ability of the impeller to rotate the fluid near the inlet was weakened. When the solid particles were added to the fluid, the kinematic viscosity and flow resistance of the medium were increased, and the ability of the pre-rotation was weaker than that of clean water, as shown in Figure 5. A slight pre-rotation could be observed at the impeller inlet under 1.0 QBEP, and due to the solid particles being carried in the fluid, a certain degree of wear was generated at the leading edge of the blade. Furthermore, the ability of the pre-rotation continuously decreased with the increase in flow rate. When the flow rate reached 1.5 QBEP, the fluid movement at the inlet section was relatively stable.

3.2. Flow Field Analysis of Impeller

The solid volume fraction and slip velocity had obvious influence on the wall wear, and the collision frequency of particles against the wall were enhanced with the increase in solid volume fraction. Additionally, the increase in solid particle slip velocity improved the impaction of a single particle on the wall. However, according to a previous investigation [3], solid-phase slip velocity has a great influence on wall wear. Figure 6 shows the solid volume fraction distribution on the impeller wall under different flow conditions; the solid volume concentration was 15% and the particle size was 0.6 mm. It can be seen from the figure that the solid volume fraction of the blade pressure surface gradually moved from the leading edge to the trailing edge with the increase in flow rate. Under the 0.6 QBEP condition, the velocity of the liquid and the centrifugal force on the solid particles was low, which made the solid particles accumulate at the impeller inlet. When the flow rate increased to 1.5 QBEP, the solid particles moved to the rear cover plate under the effect of inertia force, which resulted in a large solid volume fraction at the interface between the impeller and the rear cover plate.

3.3. Flow Field Analysis of Volute

Figure 7 and Figure 8 present the solid volume fraction distributions of the volute wall under the flow conditions of 0.6 QBEP, 1.0 QBEP, and 1.5 QBEP; the solid volume concentration was 15% and the particle diameter was 0.6 mm. Under the 0.6 QBEP condition, the larger solid volume fraction was mainly distributed between the sixth and eighth sections, and the solid volume fraction at the tongue was lower.
With the increase in flow rate, the region with a large solid volume fraction on the volute wall gradually moved from the front cover to the rear cover. When the fluid entered the volute from the impeller under the effect of centrifugal force, the volume fraction of solid particles near the rear cover plate was larger, resulting in the wear on the rear cover plate being higher than that on the front cover.

3.4. Effect of Particle Parameters on Wear Characteristic

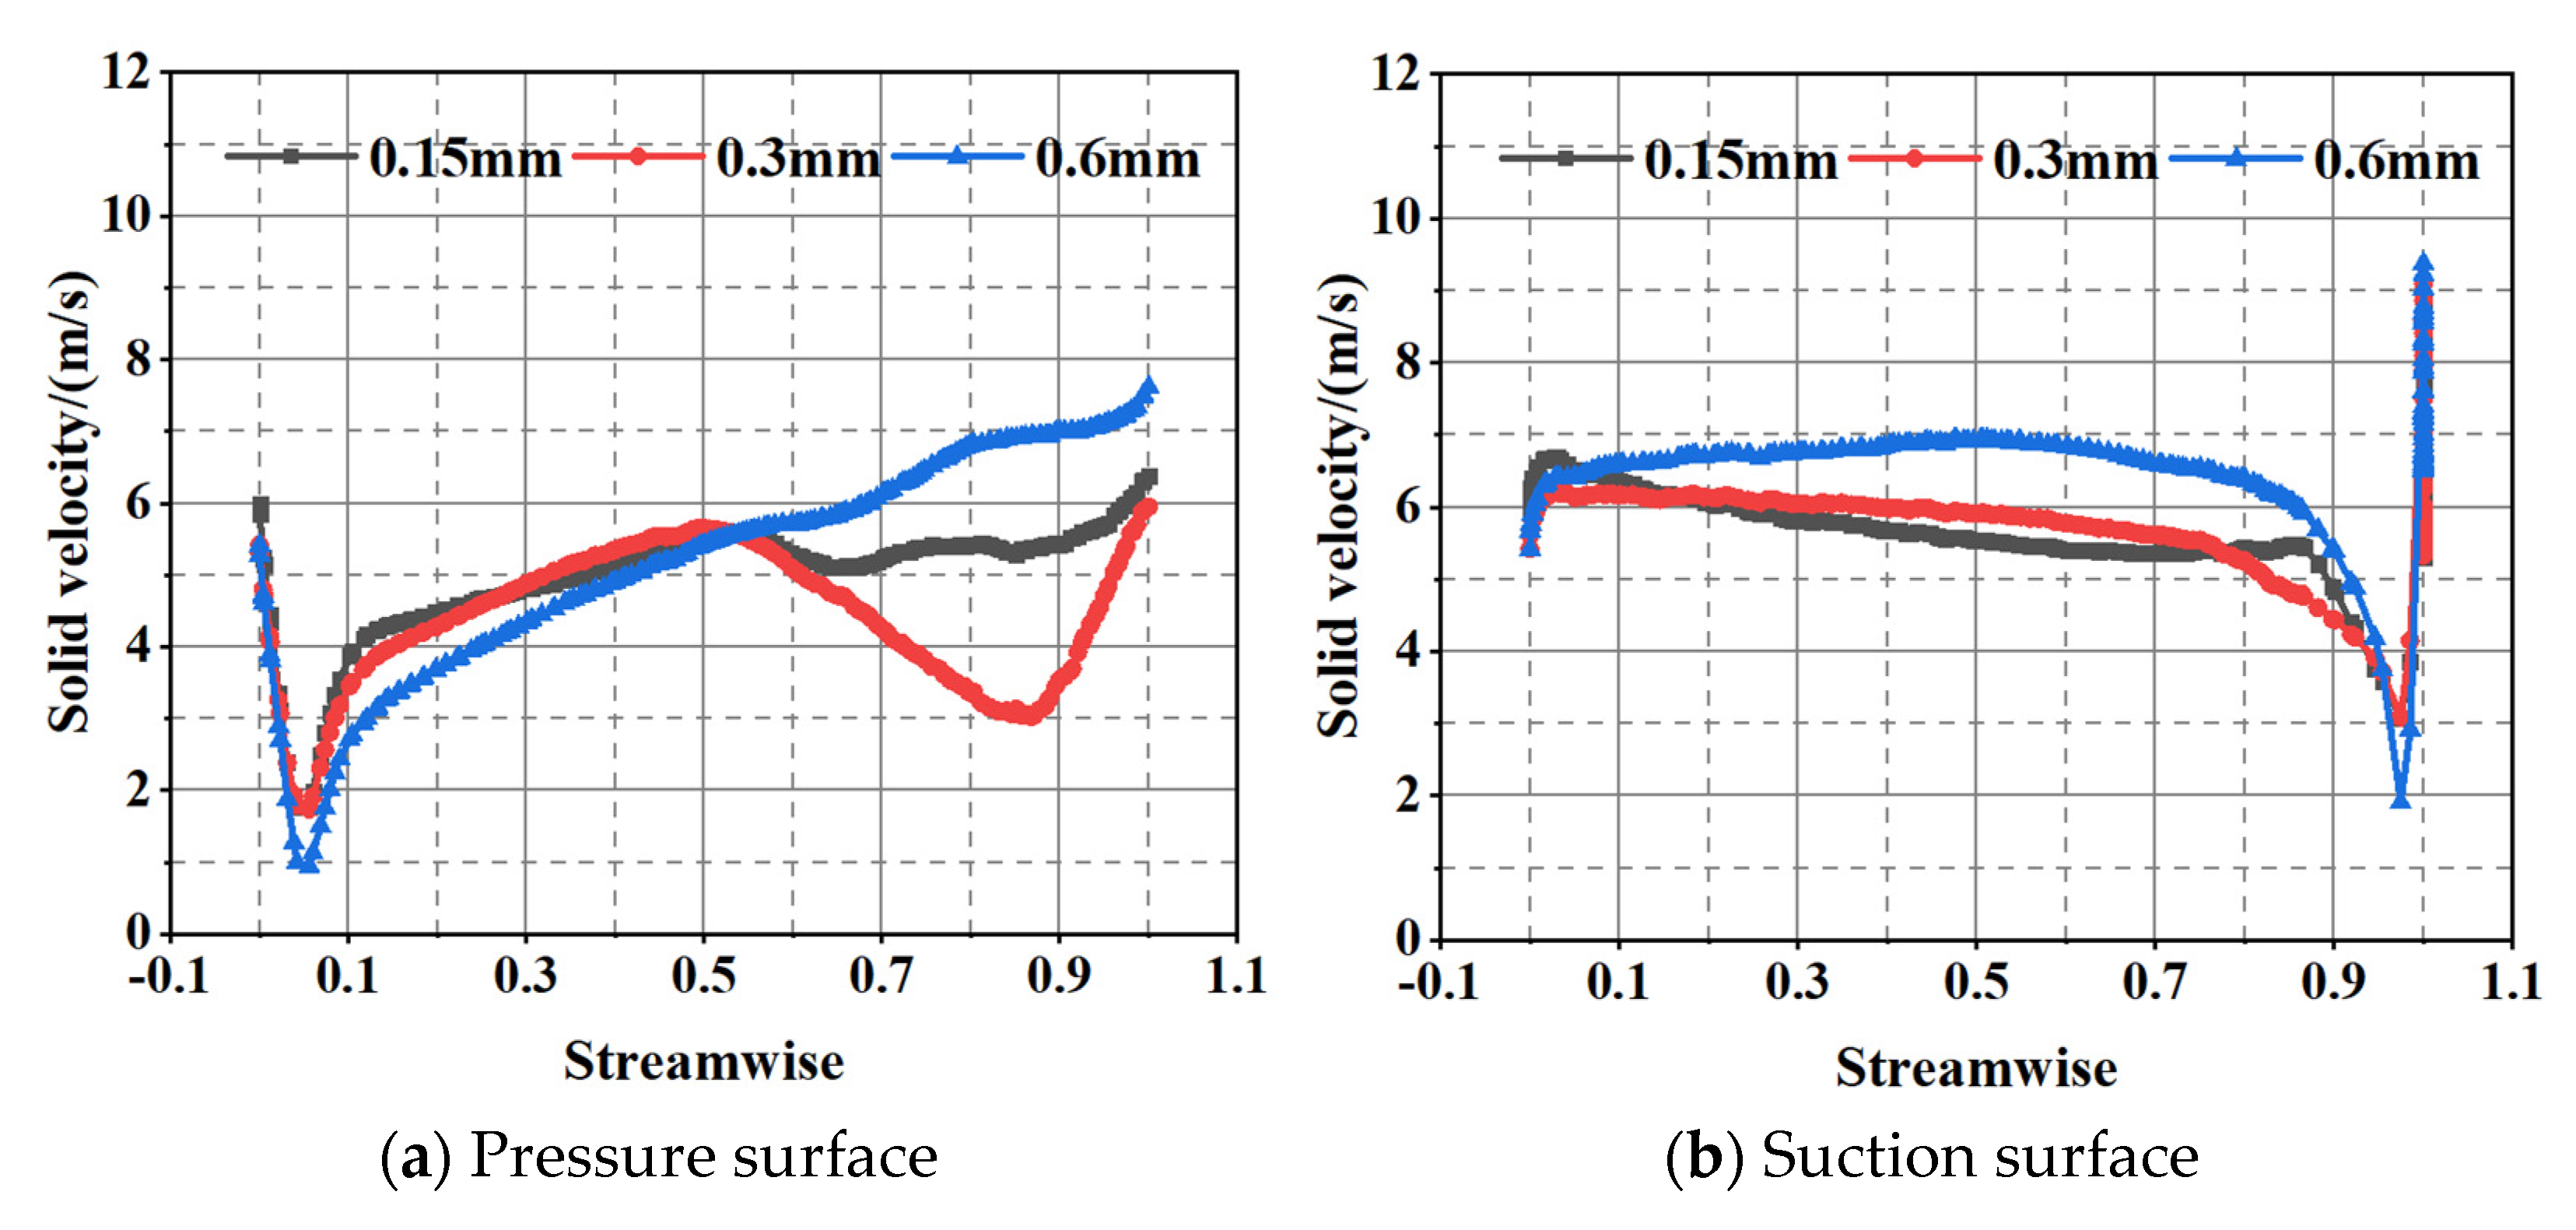
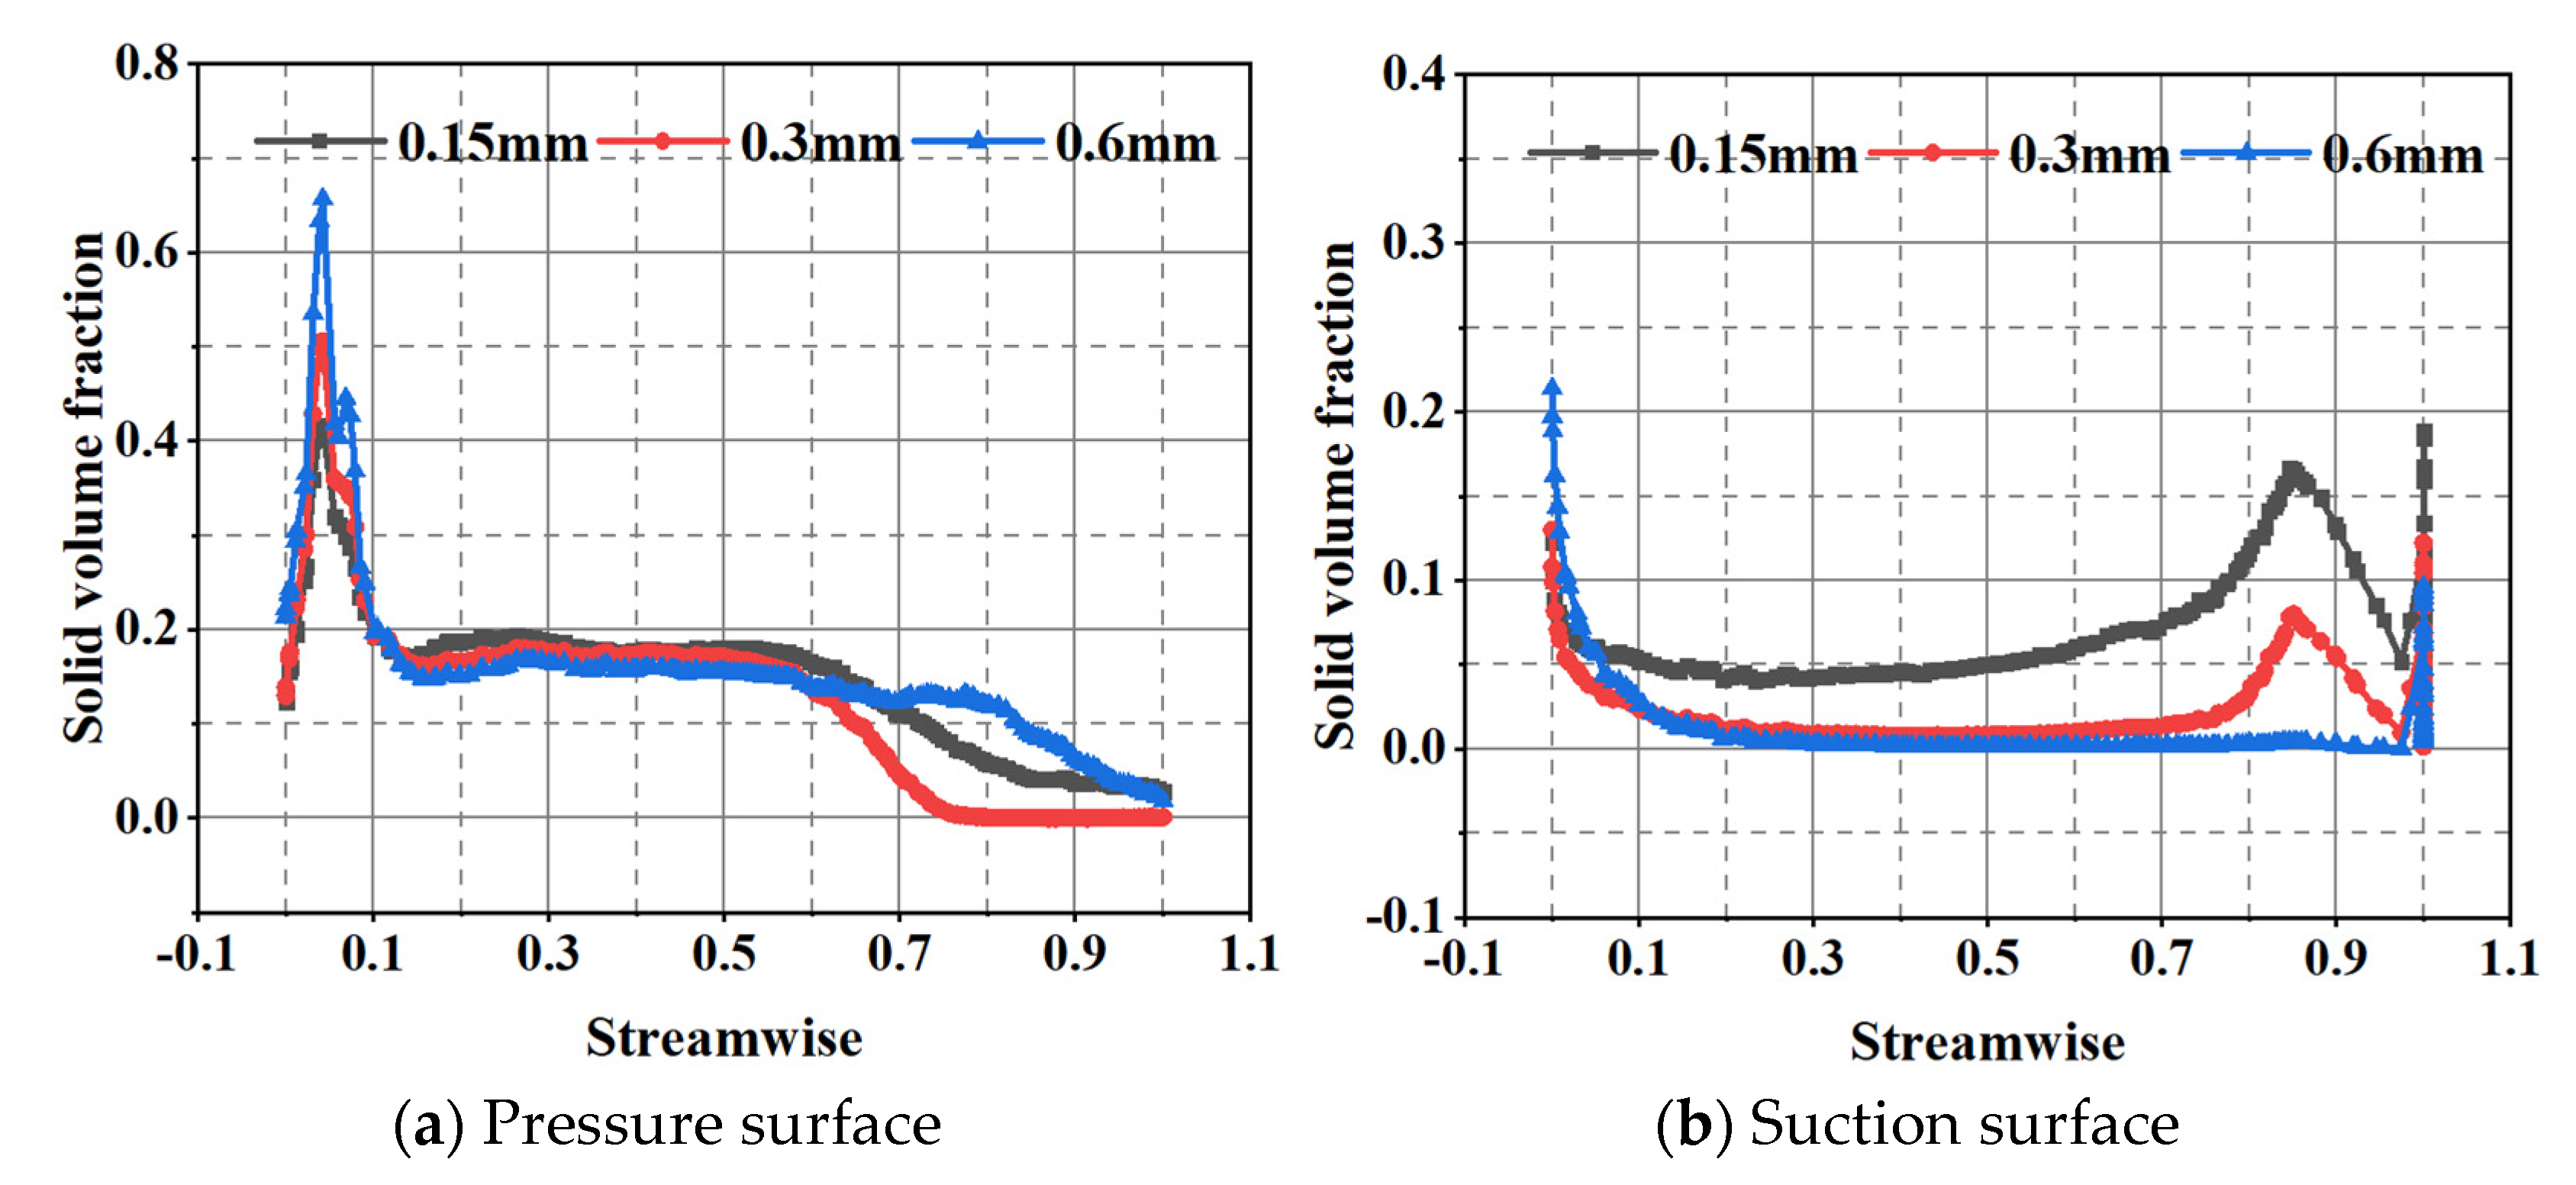
In this section, the effects of particle volume concentration and particle diameter on impeller wear are discussed, and the effects of the solid volume fraction and solid slip velocity on the blade are analyzed. Abscissa indicates the relative distance in the direction of the blade streamline (streamwise); a relative distance of the blade streamline of 0 represents the leading edge of the blade, a relative distance of the streamline of 1 indicates the trailing edge of the blade, and an ordinate represents the solid phase volume fraction (solid volume fraction) and the solid phase slip velocity (solid velocity).

3.4.1. Effect of Particle Volume Concentration on Wear

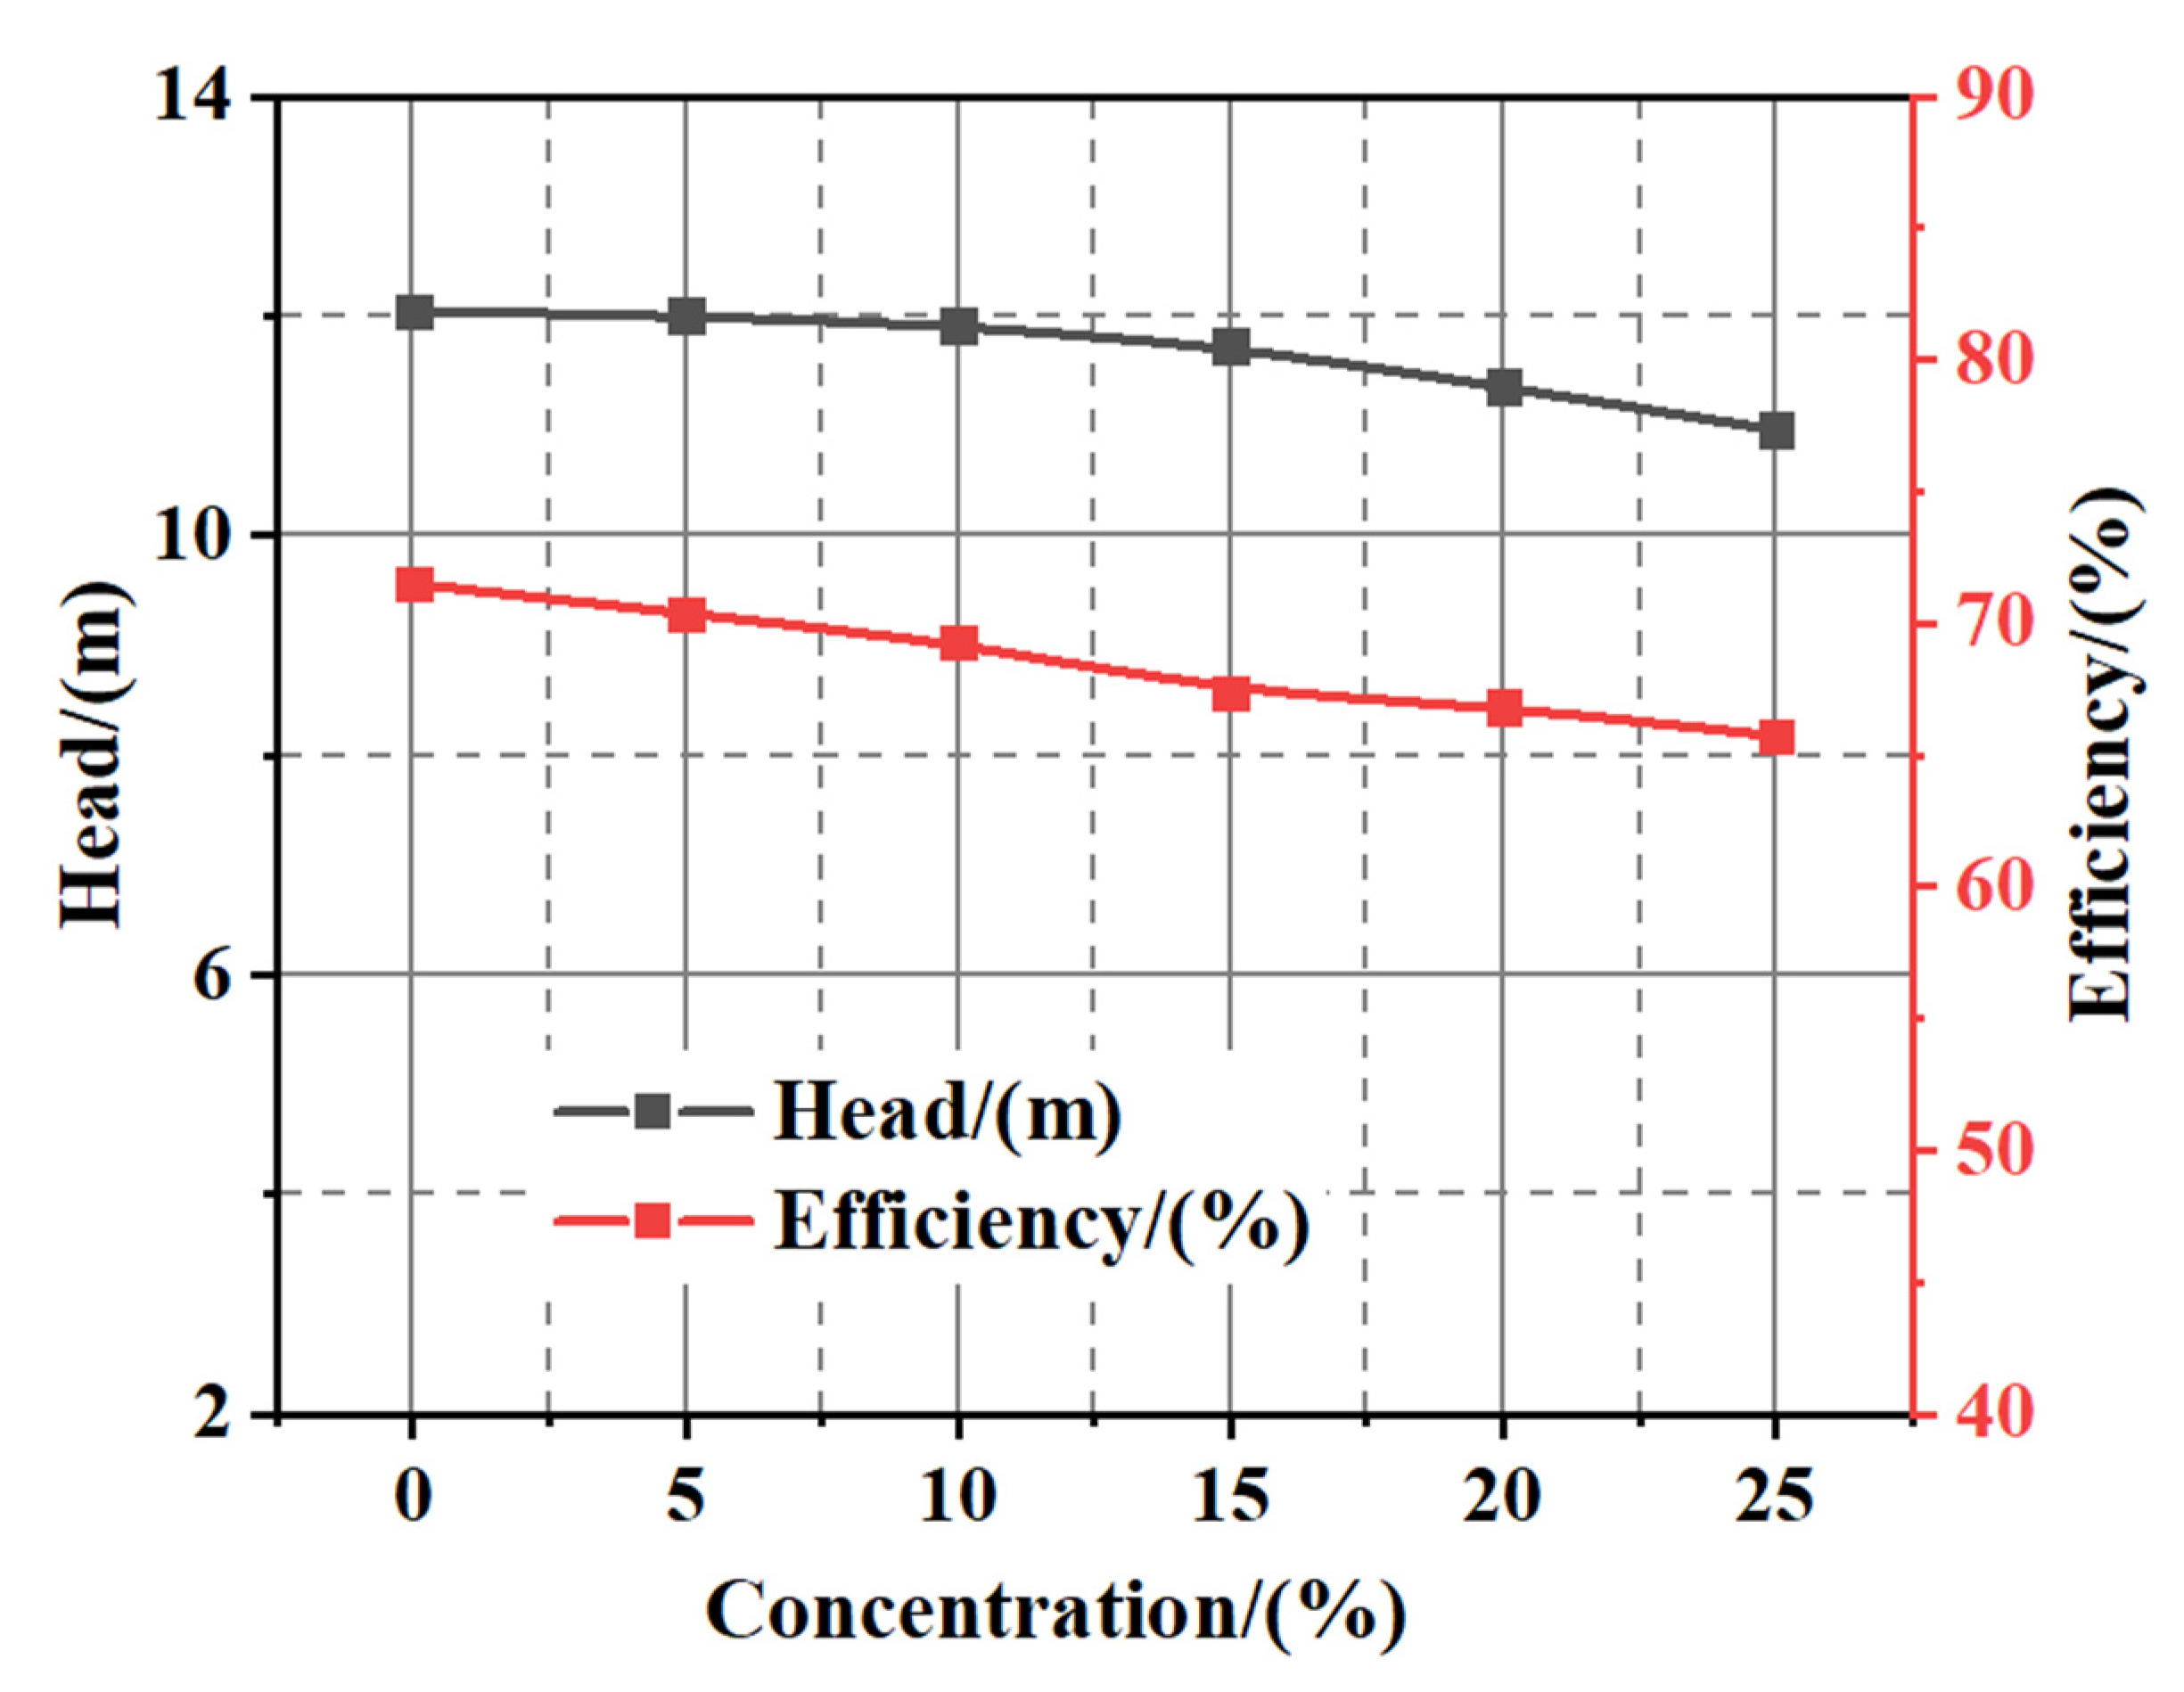
Figure 9 shows the hydraulic performance curves of different concentrations under optimal flow conditions. Here, 0 indicates that the medium is clear water. It can be seen from the figure that with the increase in concentration, the head gradually and continuously decreased. With the increase in the concentration, the viscosity of the solid–liquid two-phase flow increased and the friction force and energy loss between the internal fluids gradually increased, which resulted in a decrease in the head. At the same time, with the increase in solid particle volume concentration, the enhancement of the centrifugal pump impeller torque led to the increase in motor power consumption and the decrease in centrifugal pump efficiency. When the concentration was 5%, the head decreased by 0.33% and the efficiency decreased by 1.60%. When the concentration was 25%, the head decreased by 8.9% and the efficiency decreased by 8.09%. Therefore, the head and efficiency of the pump decreased with the increases in particle volume concentration.
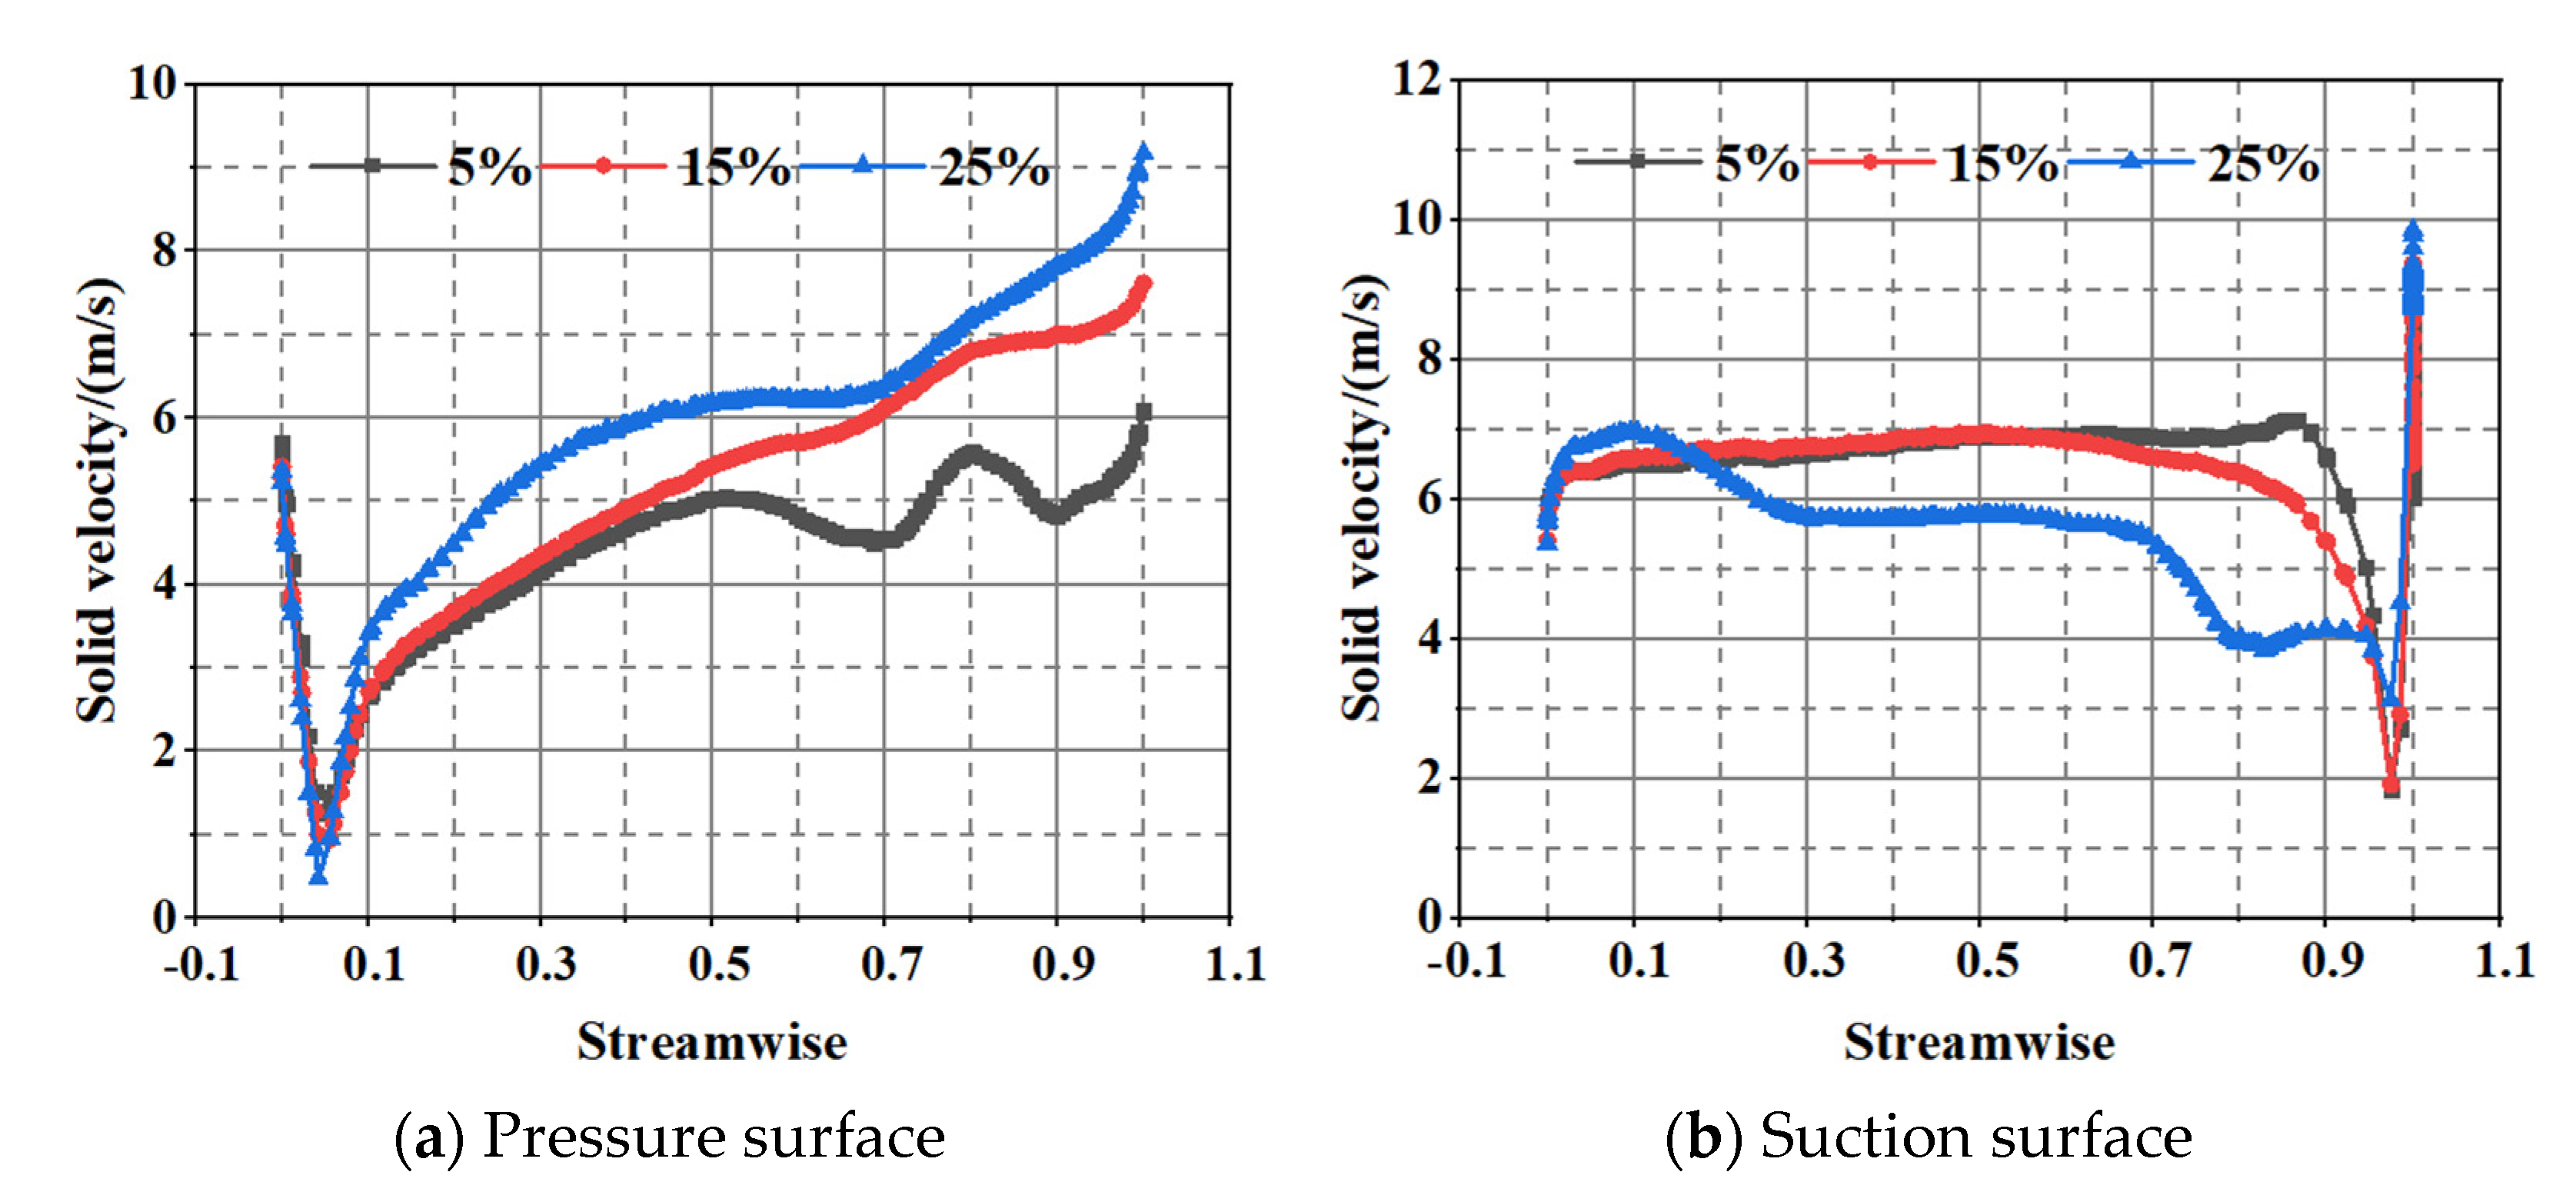
Figure 10 shows the solid phase slip velocity distribution of the impeller when the particle size was 0.6 mm and the particle volume concentrations were 5%, 15%, and 25%. It was found that the solid phase slip velocity at the leading edge of the pressure surface was the smallest—when the particles entered the impeller, the particles flowed from the axial direction to the radial direction under the effect of centrifugal force, which decreased the slip velocity. With the increase in concentration, the slip velocity of solid particles on the pressure surface gradually increased. There was no great change in the slip velocity on the suction surface, though a sudden change in the slip velocity of the solid particles was found at the trailing edge of the blade which resulted from the flow separation near the trailing edge of the suction surface. Additionally, the slip velocity of solid particles on the pressure surface was generally larger than that on the suction surface.
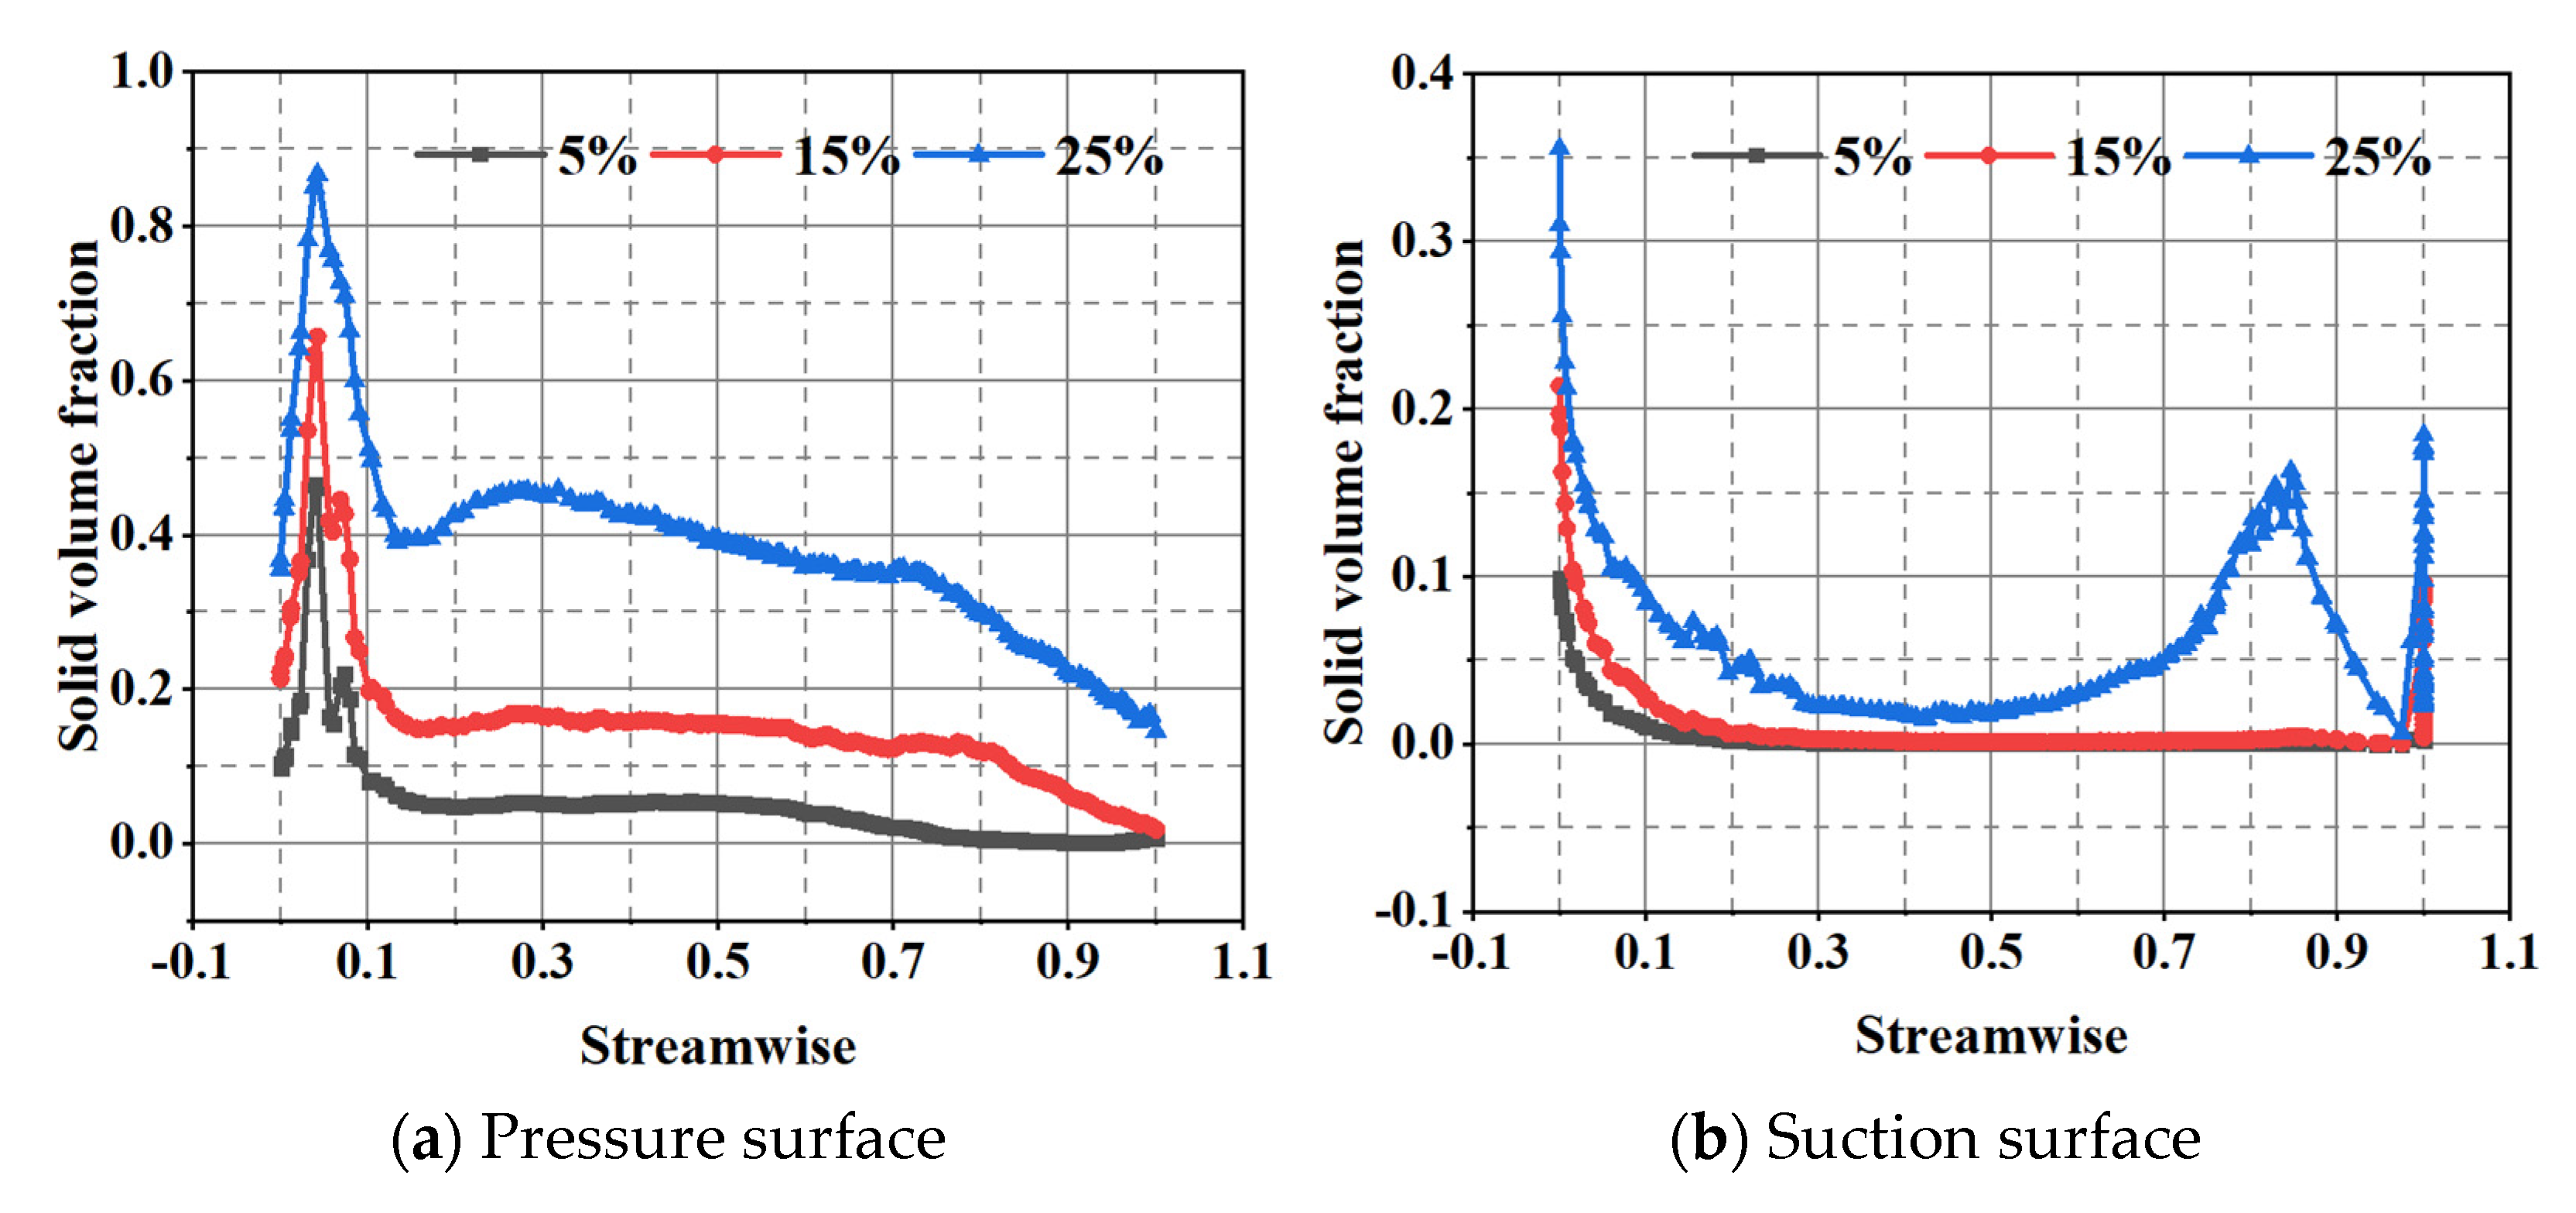
Figure 11 shows the solid volume fraction distribution of the impeller when the particle size was 0.6 mm and the particle volume concentrations were 5%, 15%, and 25%. It can be seen from the figure that the solid volume on the blade pressure surface gradually decreased from the leading edge to the trailing edge, with less and less accumulation of solid particles due to the work of the blade. Meanwhile, there were almost no solid particles on the suction surface of the blade, so the solid volume fraction on the pressure surface of the blade was larger than the suction surface. With the increase in the concentration, the solid particles and solid volume fraction gradually increased.

3.4.2. Effect of Particle Size on Wear Characteristic

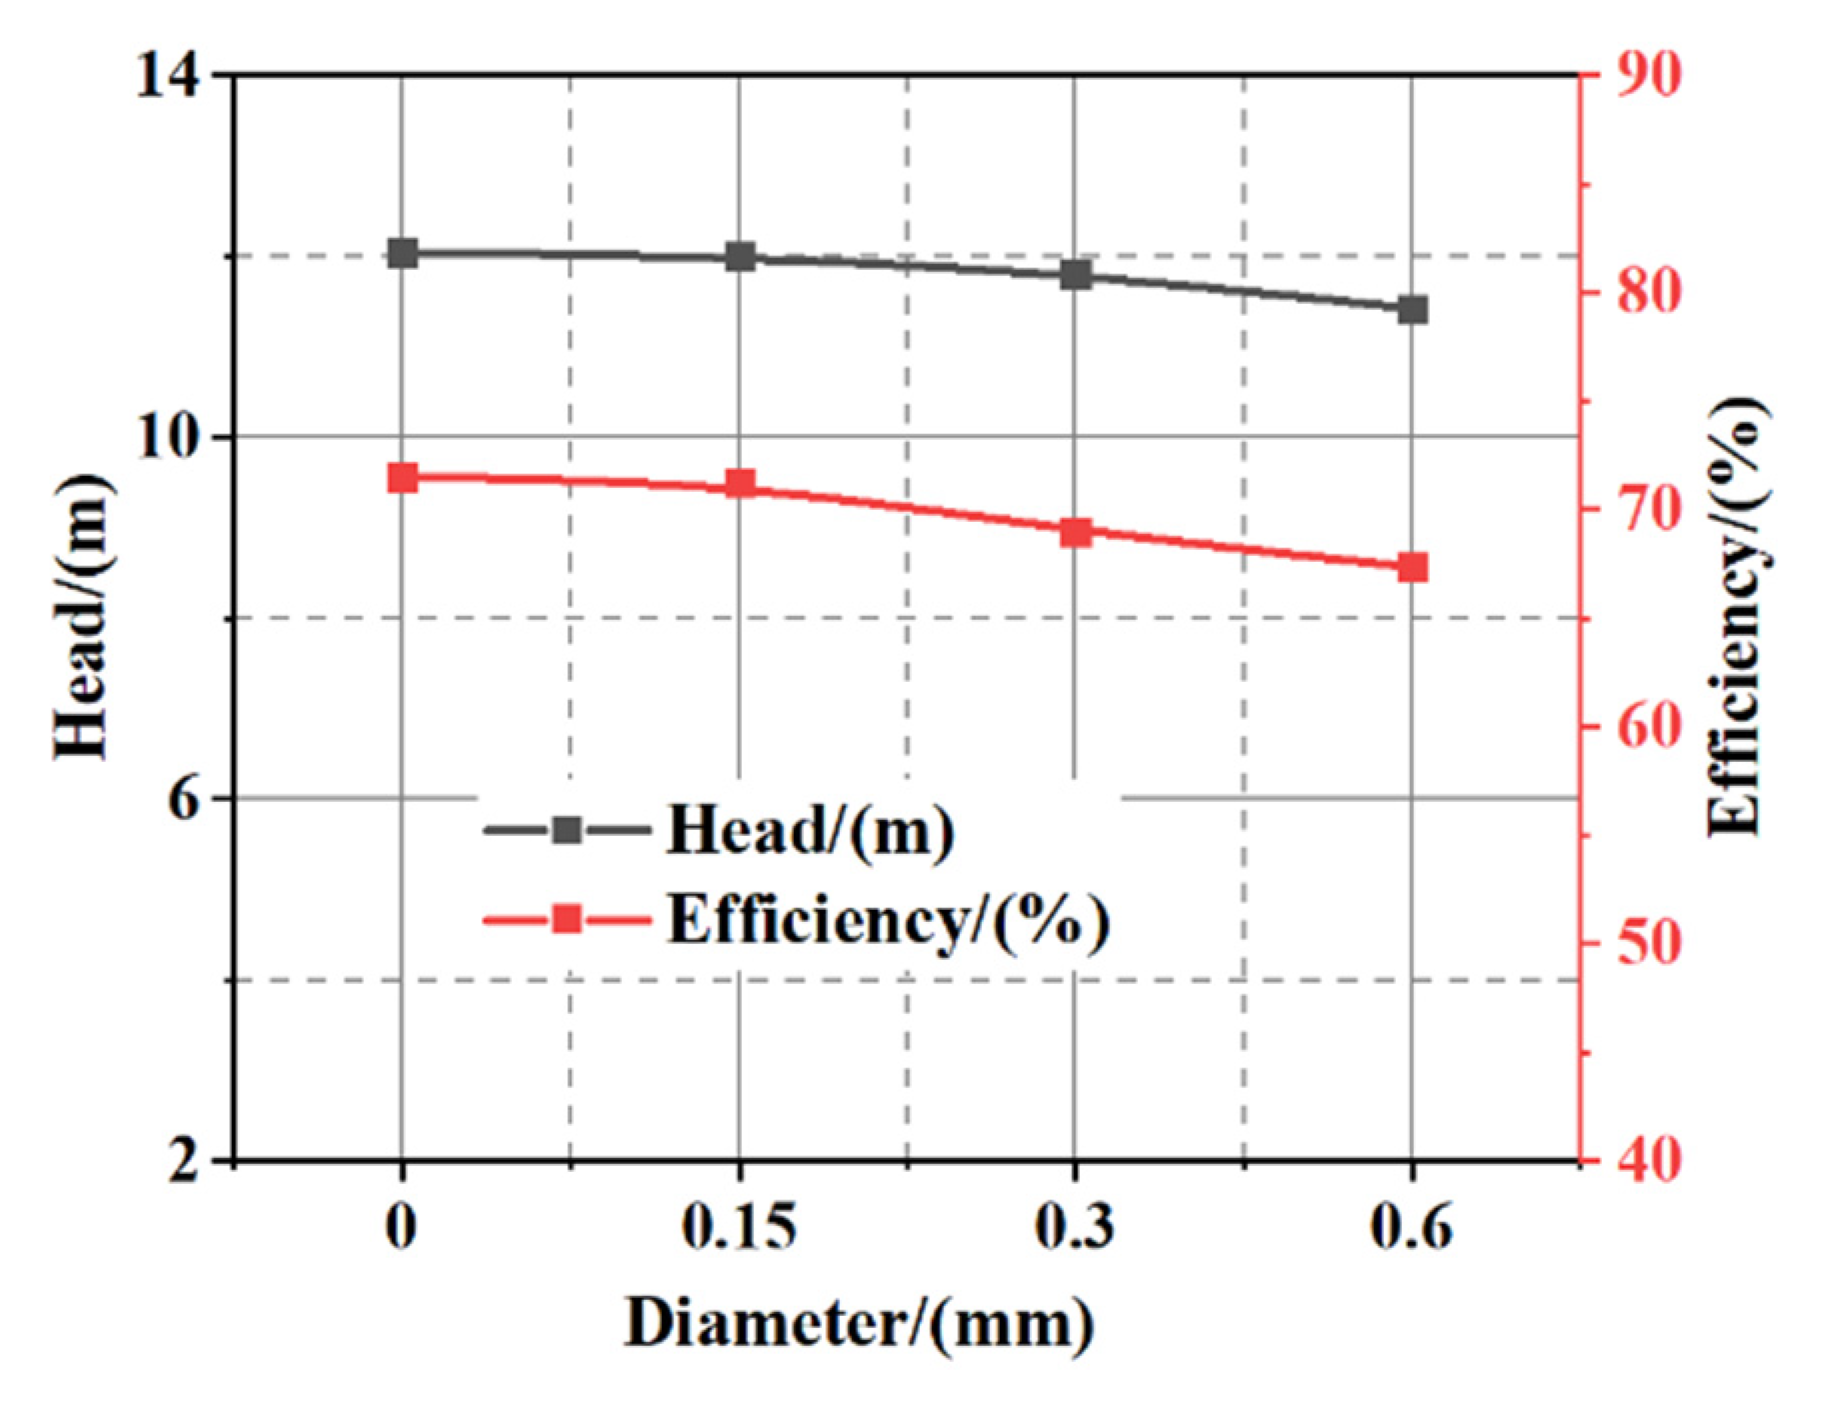
Figure 12 shows the comparison of the hydraulic performance curves of different particle diameters under design flow conditions, where a particle size of 0 mm indicates that the used medium was clear water. With the increase in the particle diameter, the energy driving the solid particles was greater and the head gradually decreased. At the same time, with the increase in solid particle diameter, the friction loss between particles and impeller increased, which led to the increases in impeller torque and motor power consumption. Therefore, as the particle diameter increased from 0.15 to 0.6 mm, the pump head decreased from 12 to 11.42 m and the efficiency decreased from 71.25% to 67.35%.
Figure 13 shows the distribution of the solid-phase slip velocity of the impeller when the particle volume concentration was 15% and the particle diameters were 0.15, 0.3, and 0.6 mm. It can be seen from the figure that the solid slip velocity of the pressure surface gradually increased from the leading edge to the trailing edge. Additionally, with the increase in the particle diameter, the solid slip velocity at the trailing edge of the pressure surface gradually increased. This phenomenon is attributed to the increasing radial velocity and circumferential velocity of solid particles after they entered the impeller, which led to an increase in solid-phase slip velocity. Therefore, the solid phase slip velocity on the blade surface increased with the increase in solid particle diameter.
Figure 14 shows the solid volume fraction distribution of the impeller when the particle volume concentration was 15% and the particle diameters were 0.15, 0.3, and 0.6 mm. It was found that with the increase in solid particle diameter, the region of the larger solid volume fraction moved from the suction surface to the pressure surface. When the solid particles entered the impeller, the effects of the particle’s inertia and the extrusion of the blade resulted in a larger solid volume fraction at the leading edge. At the same time, with the increase in the particle diameter, the influence of the fluid centrifugal force on the solid particles was enhanced, which made the solid particles move from the suction surface to the pressure surface. Moreover, the maximum solid volume fraction was generated at the leading edge of the blade on the pressure surface, while the maximum solid volume fraction was generated at the trailing edge of the suction surface.

3.5. Effect of Pump Speed on External Performance

In the previous analysis of solid–liquid two-phase flow, it can be seen that increases in solid volume concentration led to decreases in the head and efficiency of the slurry pump. With the increase in the solid volume concentration, the viscosity between the solid–liquid two-phase flow increased and the friction force and energy loss between the internal fluids was increased, which resulted in the decline of the head. More importantly, the slurry pump could not reach the corresponding working condition, which may be another reasons for the wear of the impeller. Therefore, in this paper, the influence of speed on hydraulic performance was studied. Under the rated flow condition, solid–liquid two-phase flow simulation calculations were carried out at the rotational speeds of 1480, 1490, 1500, 1510, 1520, and 1530 r/min and media with solid-phase volume concentrations of 0, 5%, 10%, 15%, 20%, and 25%. Then, the head value data obtained by the simulation were plotted into a three-dimensional scatter diagram, as shown in Figure 15.
According to the head scatter diagram, the relationship between the rotational speed and solid volume concentration on the head was evaluated. The head reached its minimum value at Cv = 25% and n = 1480 r/min, and it reached its maximum value at Cv = 0% and n = 1530 r/min. At the same solid volume concentration, the head of the pump increased with the increase in rotational speed. At the same speed, the head of the pump decreased with the increase in solid volume concentration.
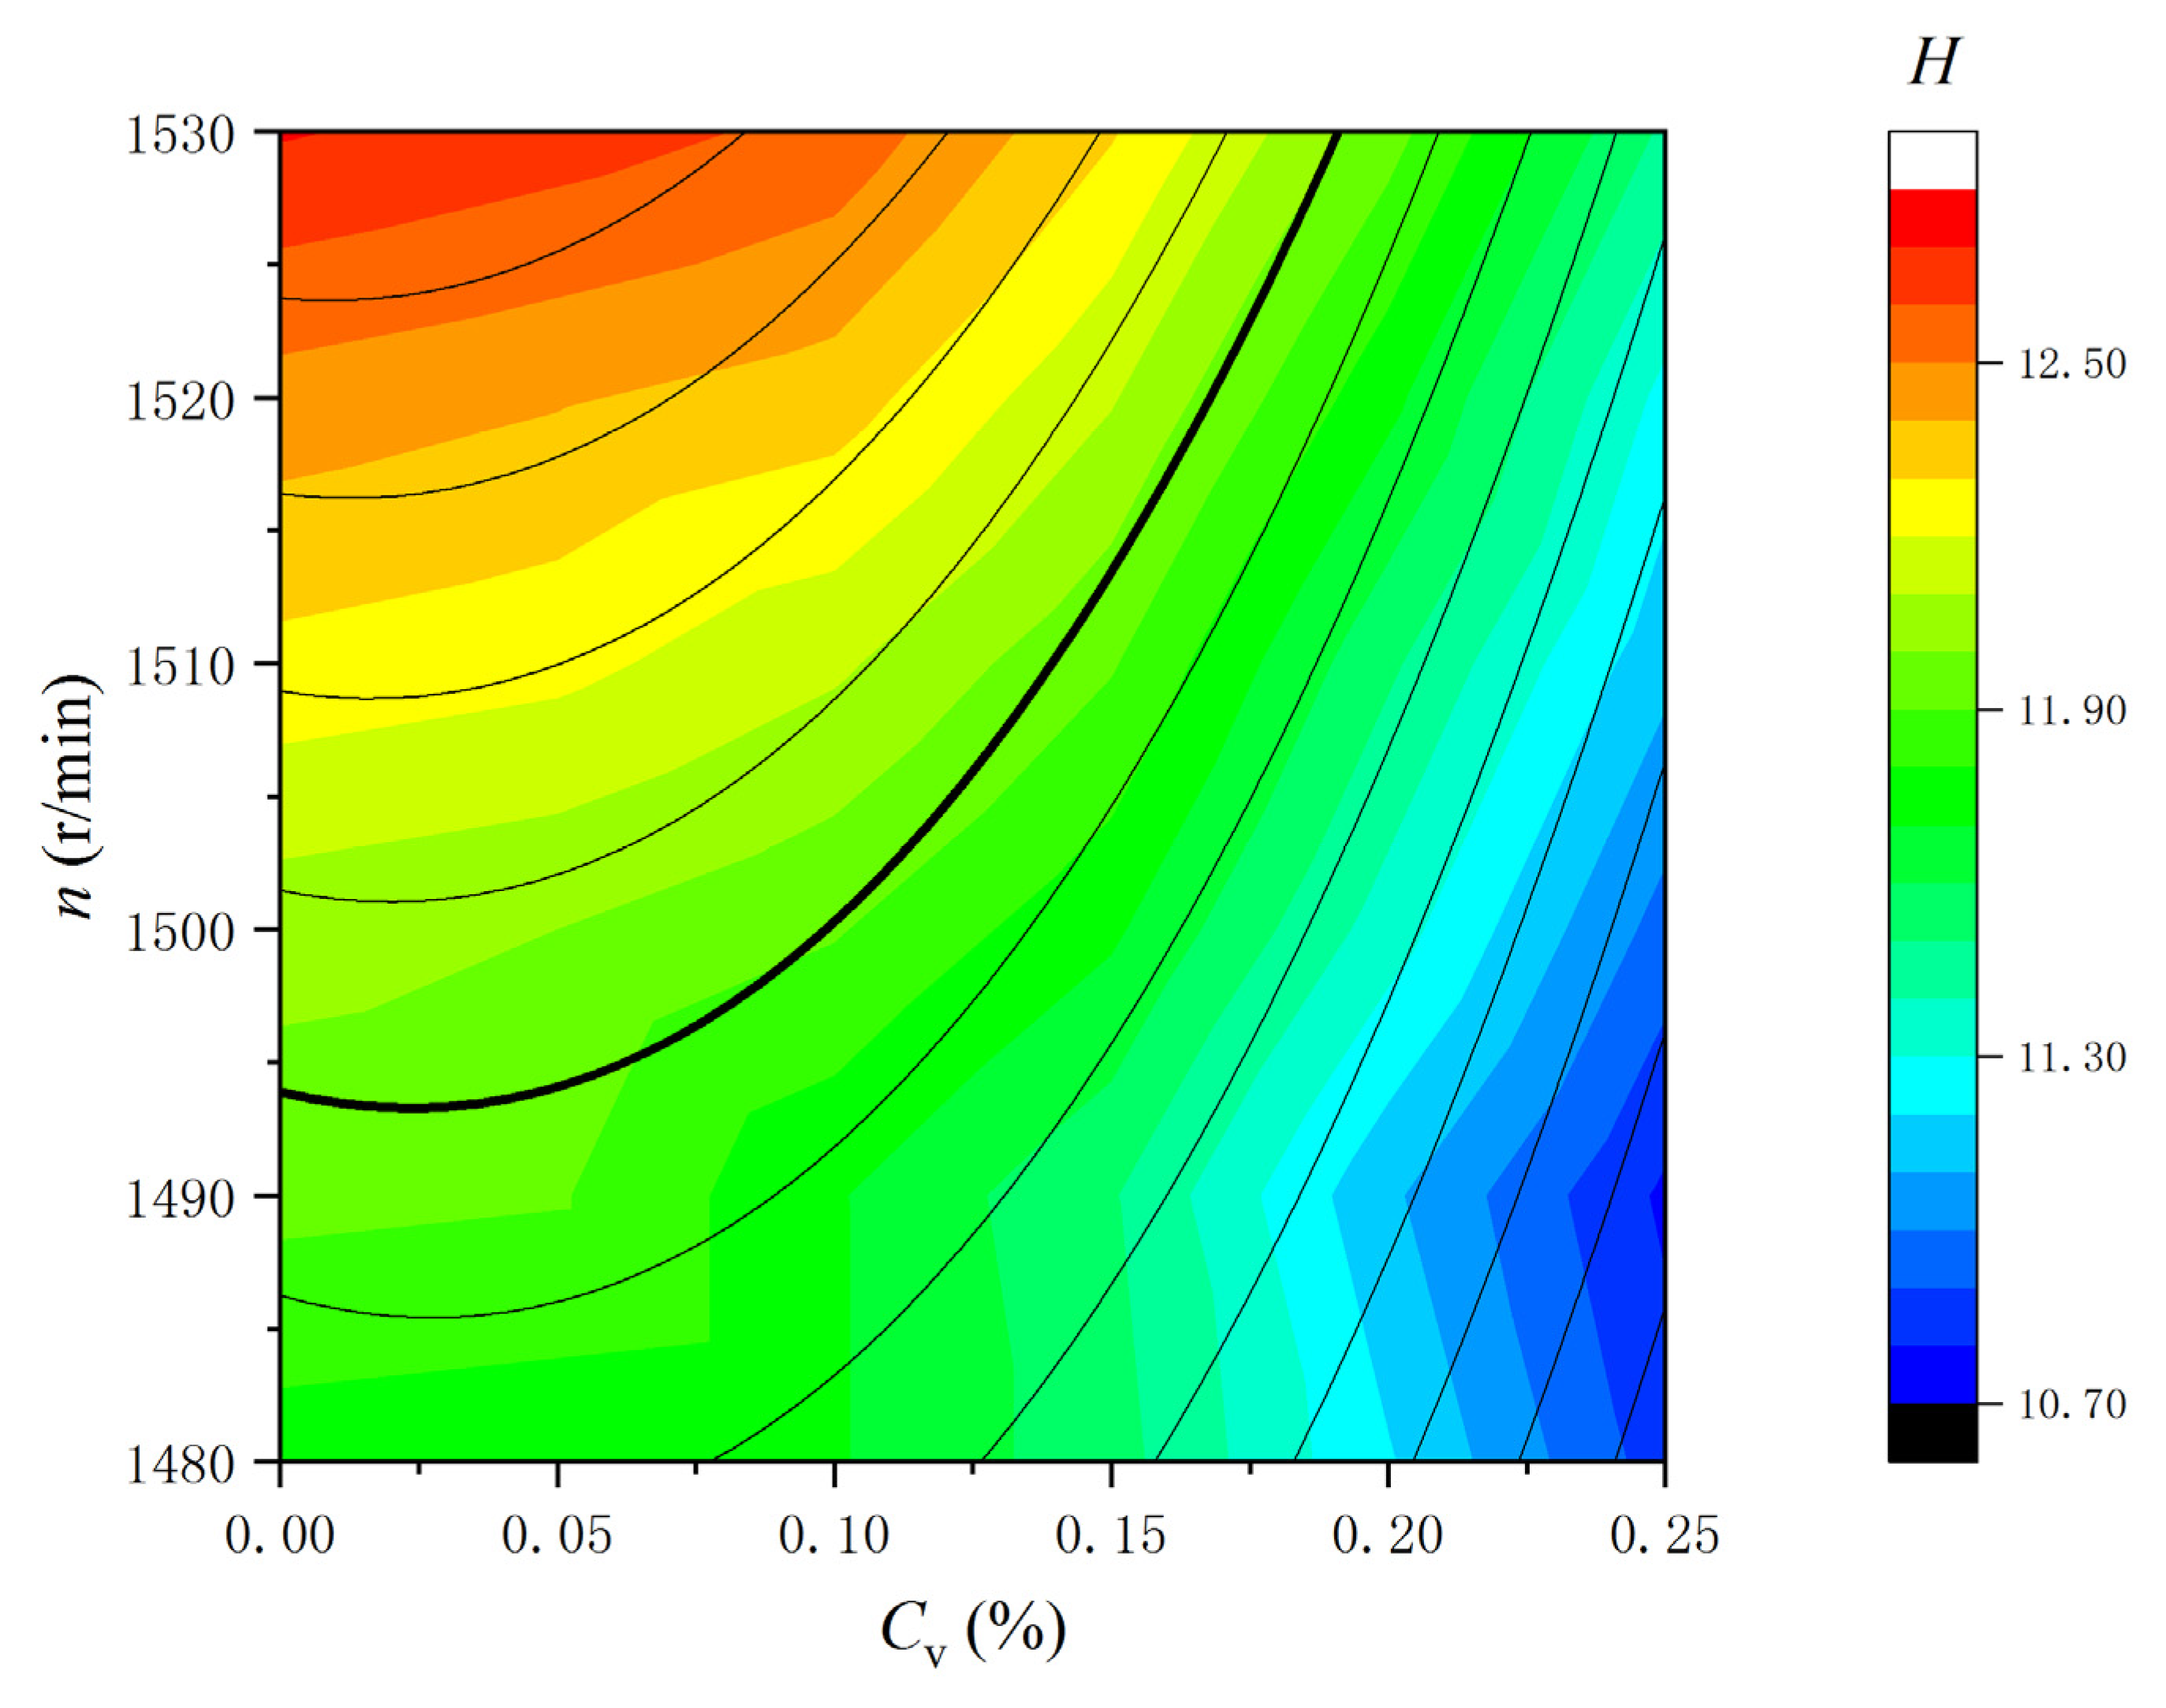
In order to better analyze the influence of rotational speed and solid volume concentration on the head, a three-dimensional fitting surface was built, and the relationship between the rotational speed, solid volume concentration, and the head was evaluated. In the figure, the head value of the thickened equipotential line is 12 m.
At the same speed, with the increase in solid volume concentration, the head first slowly decreased and then rapidly decreased. The surface fitting diagram showed that the fitting effect of Cv = 10% was the best and the head value of Cv = 20% was generally lower than the fitting value. On the whole, the fitting effect was able to meet the investigation requirements. From low rotational speed and high solid volume concentration to high rotational speed and low solid volume concentration, the distribution of head contours was uniform and gradually increased.
A three-dimensional fitting surface diagram was projected onto an XY plane, and solid volume concentration, rotational speed, and head diagram values were obtained, as shown in Figure 16. It can be seen from the figure that under the condition of equal head, the pump speed slowly improved with the increase in solid volume concentration. In the figure, the head value of the thickened equipotential line is 12 m. While the solid phase volume concentration increased, the pump head value could reach the corresponding required value via adjustments of the rotational speed of the pump, which ensured the pump operates at the rated flow condition and reduced the fluctuation of the shaft power. For other operating conditions or head values, the head equipotential curve could be obtained with the same method, and then the corresponding operating conditions could be reached by adjusting the pump speed. Therefore, the head first slowly decreased and then rapidly decreased with the increase in solid volume concentration, and it continuously increased with the increases in rotational speed.

4. Experimental Investigation

4.1. Hydraulic Performance Test

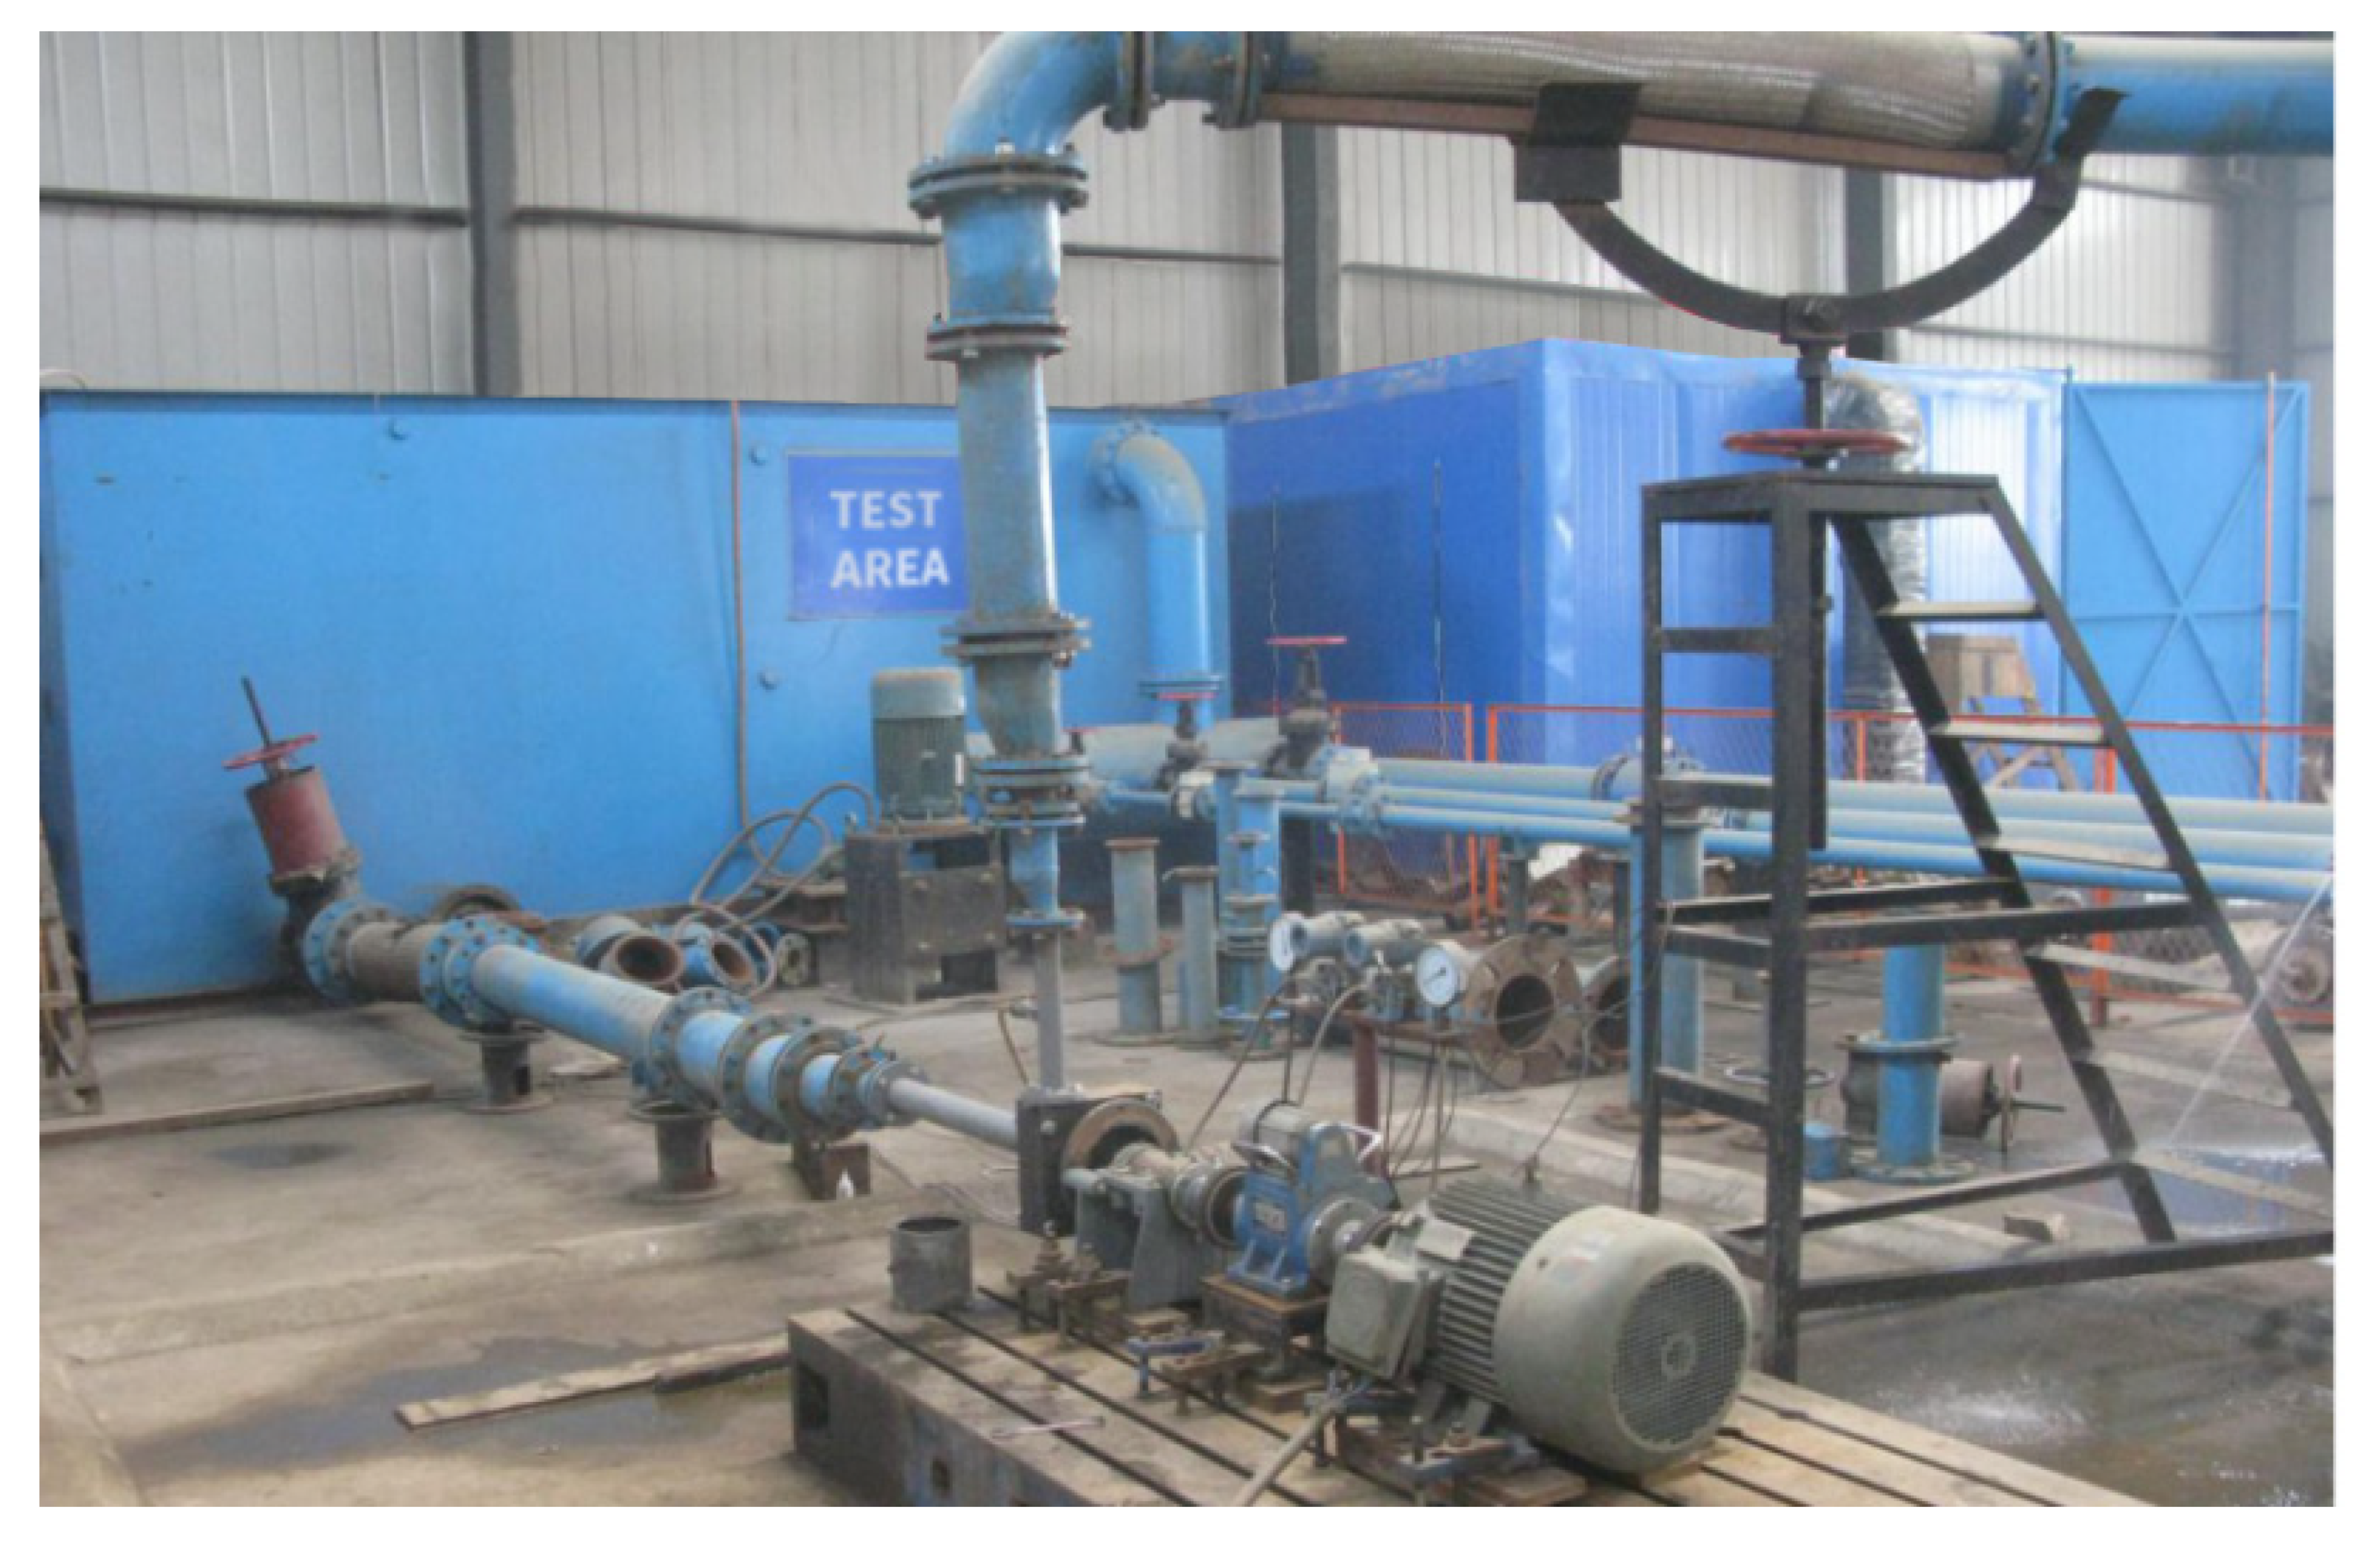
The test of the slurry pump was divided into two parts: the clear water performance test and wear performance test. The clear water performance test mainly investigated the external characteristic performance of the pump by measuring its flow rate, pressure, rotational speed, and torque, which were compared with the numerical simulation results. Meanwhile, the wear test was carried out on the slurry pump wear test bench, and the amount of wear was calculated by the impeller weight-loss method.
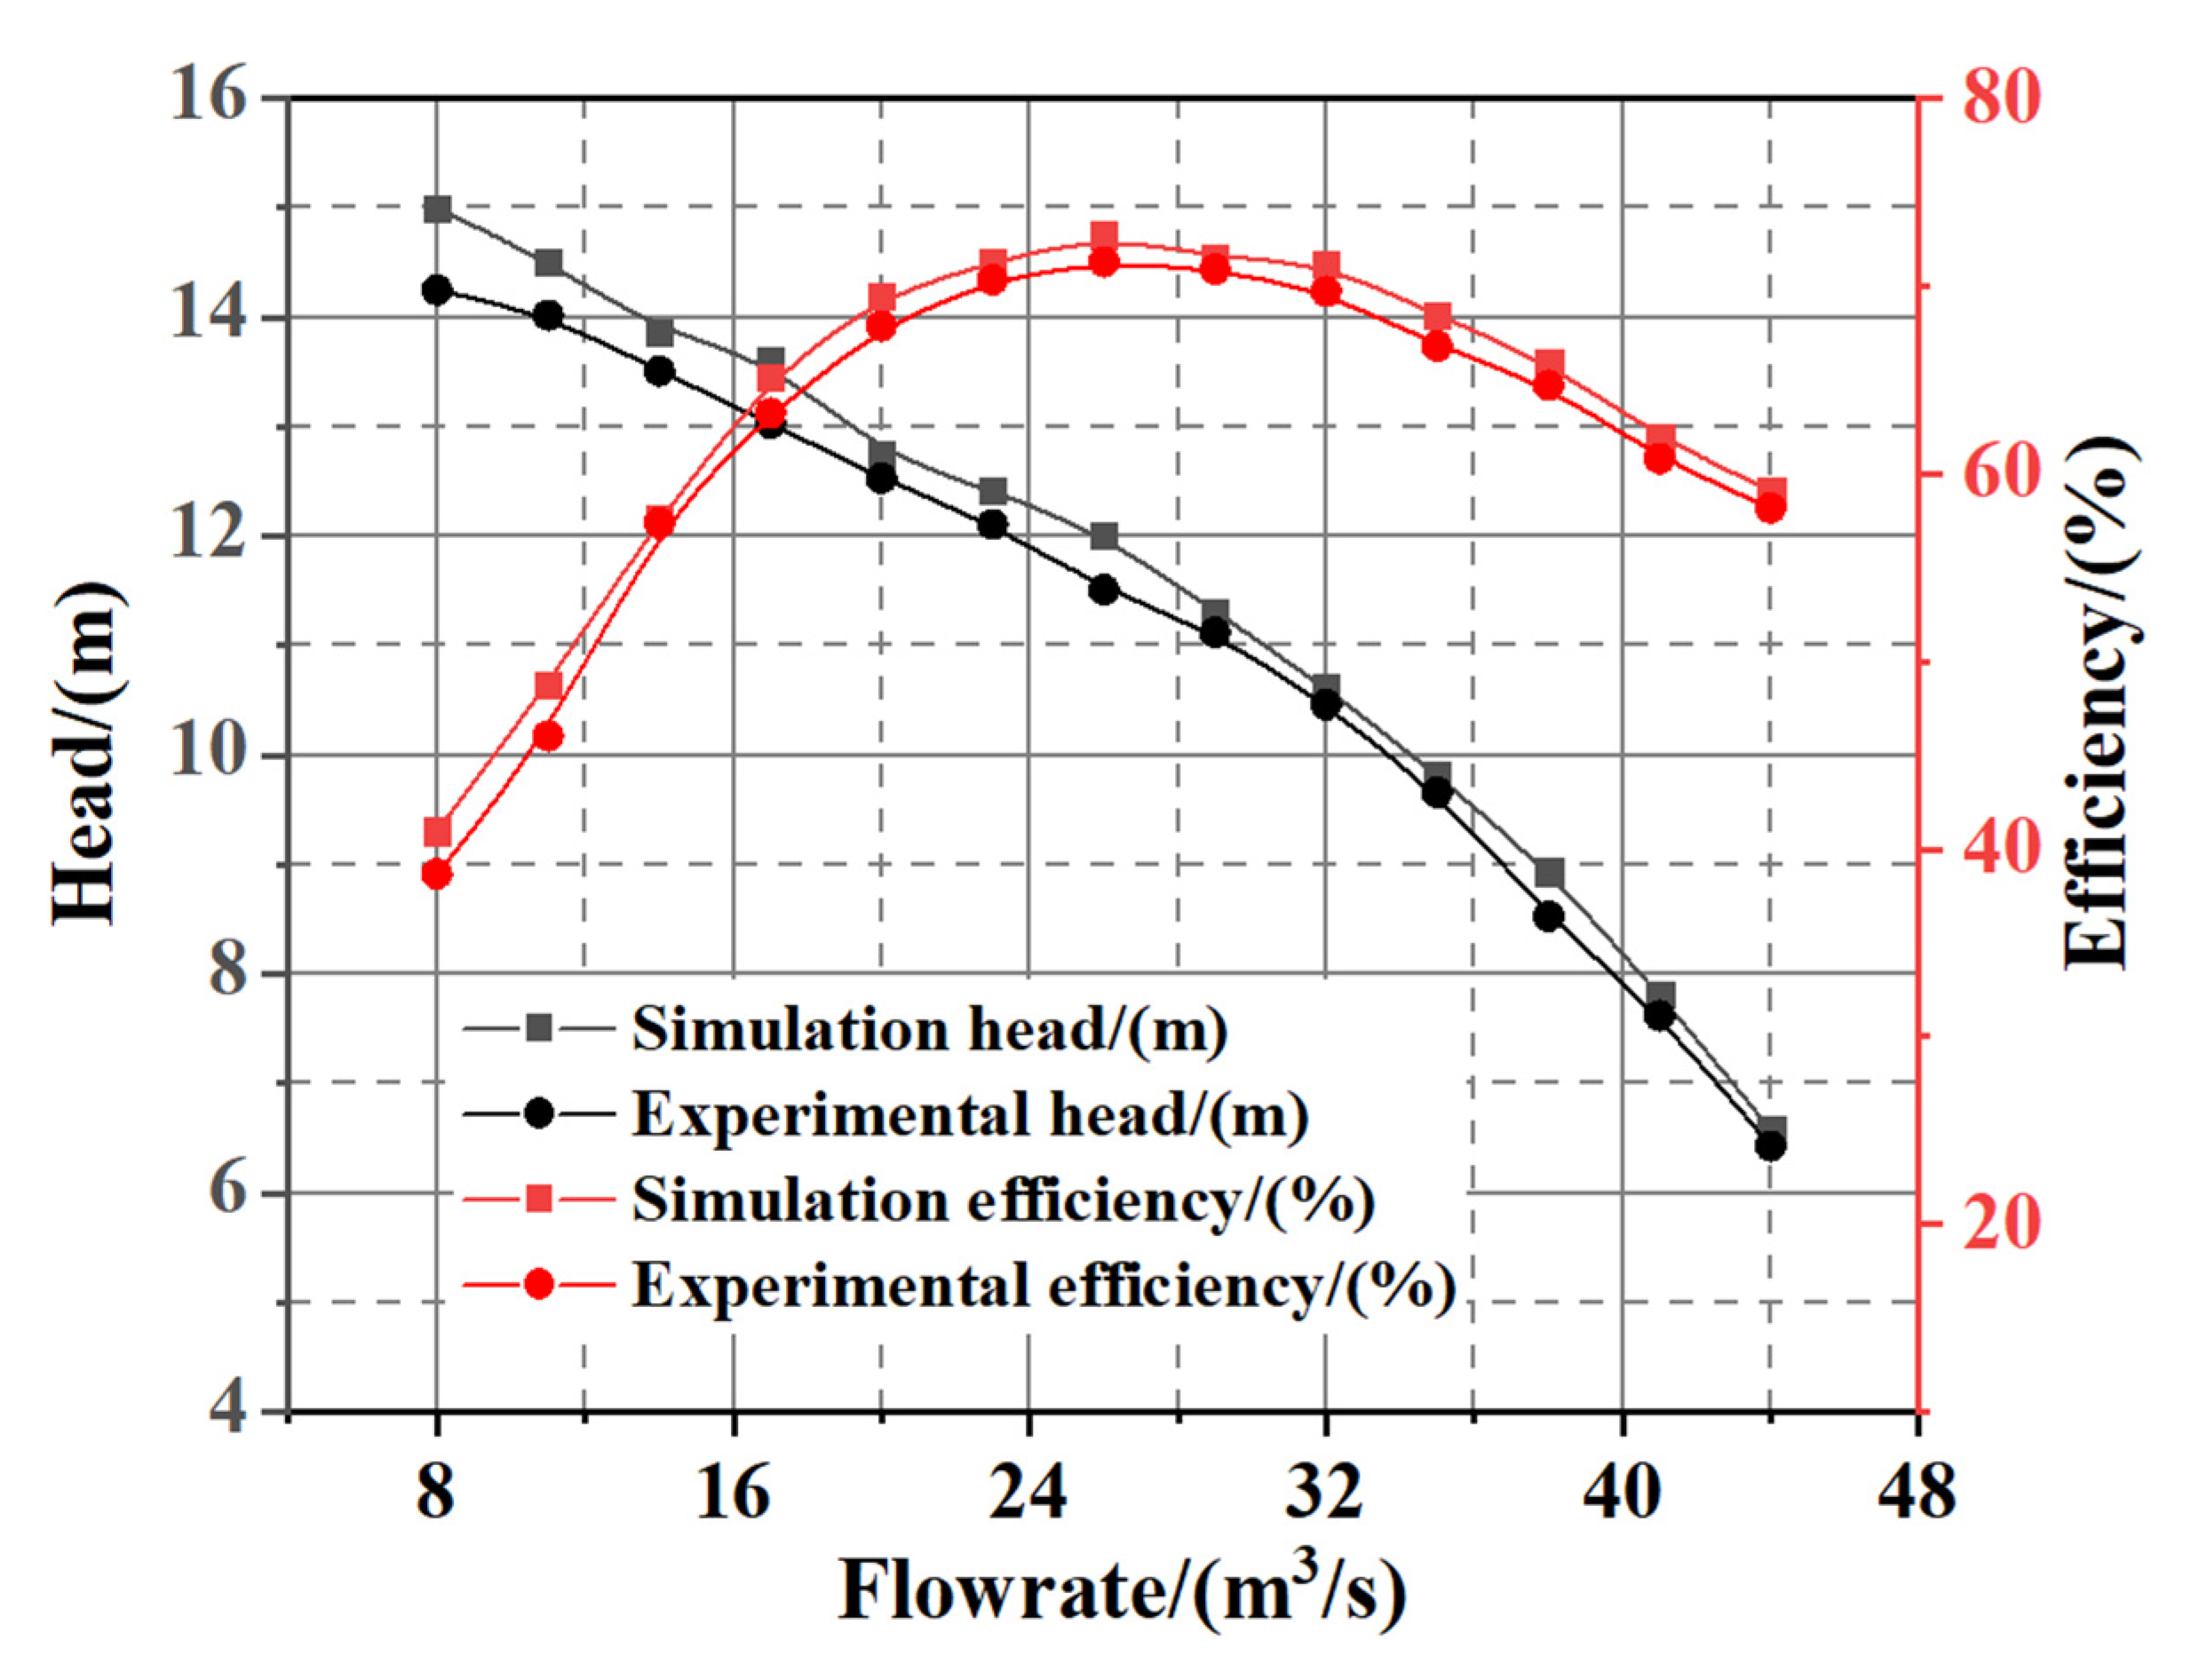
In order to compare the hydraulic performance between the experiment and simulation, the head and efficiency were selected as evaluation indexes and the clear water hydraulic performance under different flow conditions was assessed, as shown in Figure 17. The expressions of the head and efficiency are, respectively, as follows:
H = p 2 p 1 ρ g + v 2 2 v 1 2 2 g + ( z 2 z 1 )
η = ρ g Q H P s × 100 %
In the equations, p1, v1, and z1 are the pump inlet parameters; p2, v2, and z2 are the pump outlet parameters; η is the pump efficiency; and Ps is the output power of the motor. During the test, a turbine flow meter (accuracy ± 0.1%) was used to measure the flow rate, and a pressure sensor (accuracy ± 0.1%) was used to measure the inlet and outlet pressure of the pump. A torque sensor (accuracy ± 0.5%) and a speed sensor (accuracy ± 0.1%) were used to measure torque and speed, respectively.
Figure 18 shows the hydraulic performance results of the simulation and experiment. The leakage loss, disk friction loss, and friction loss between the bearing and sealing device were not taken into account in the numerical simulation, which resulted in the numerical simulation results being larger than the experimental data and the trend of the simulation head and efficiency curve being the same as that of the test. The maximum deviation of the head under 8 m3/h was 4.32%, which was due to the instability of the internal flow field of the pump operation except for optimal flow conditions. However, when the flow rate was 26 m3/h, the minimum deviation between the simulation head and the test head was 2.52% and the efficiency deviation was less than 2.56%. The calculation deviation in the full flow range was less than 5%. Therefore, the calculation model could accurately predict the performance of the pump.

4.2. Wear Performance Test

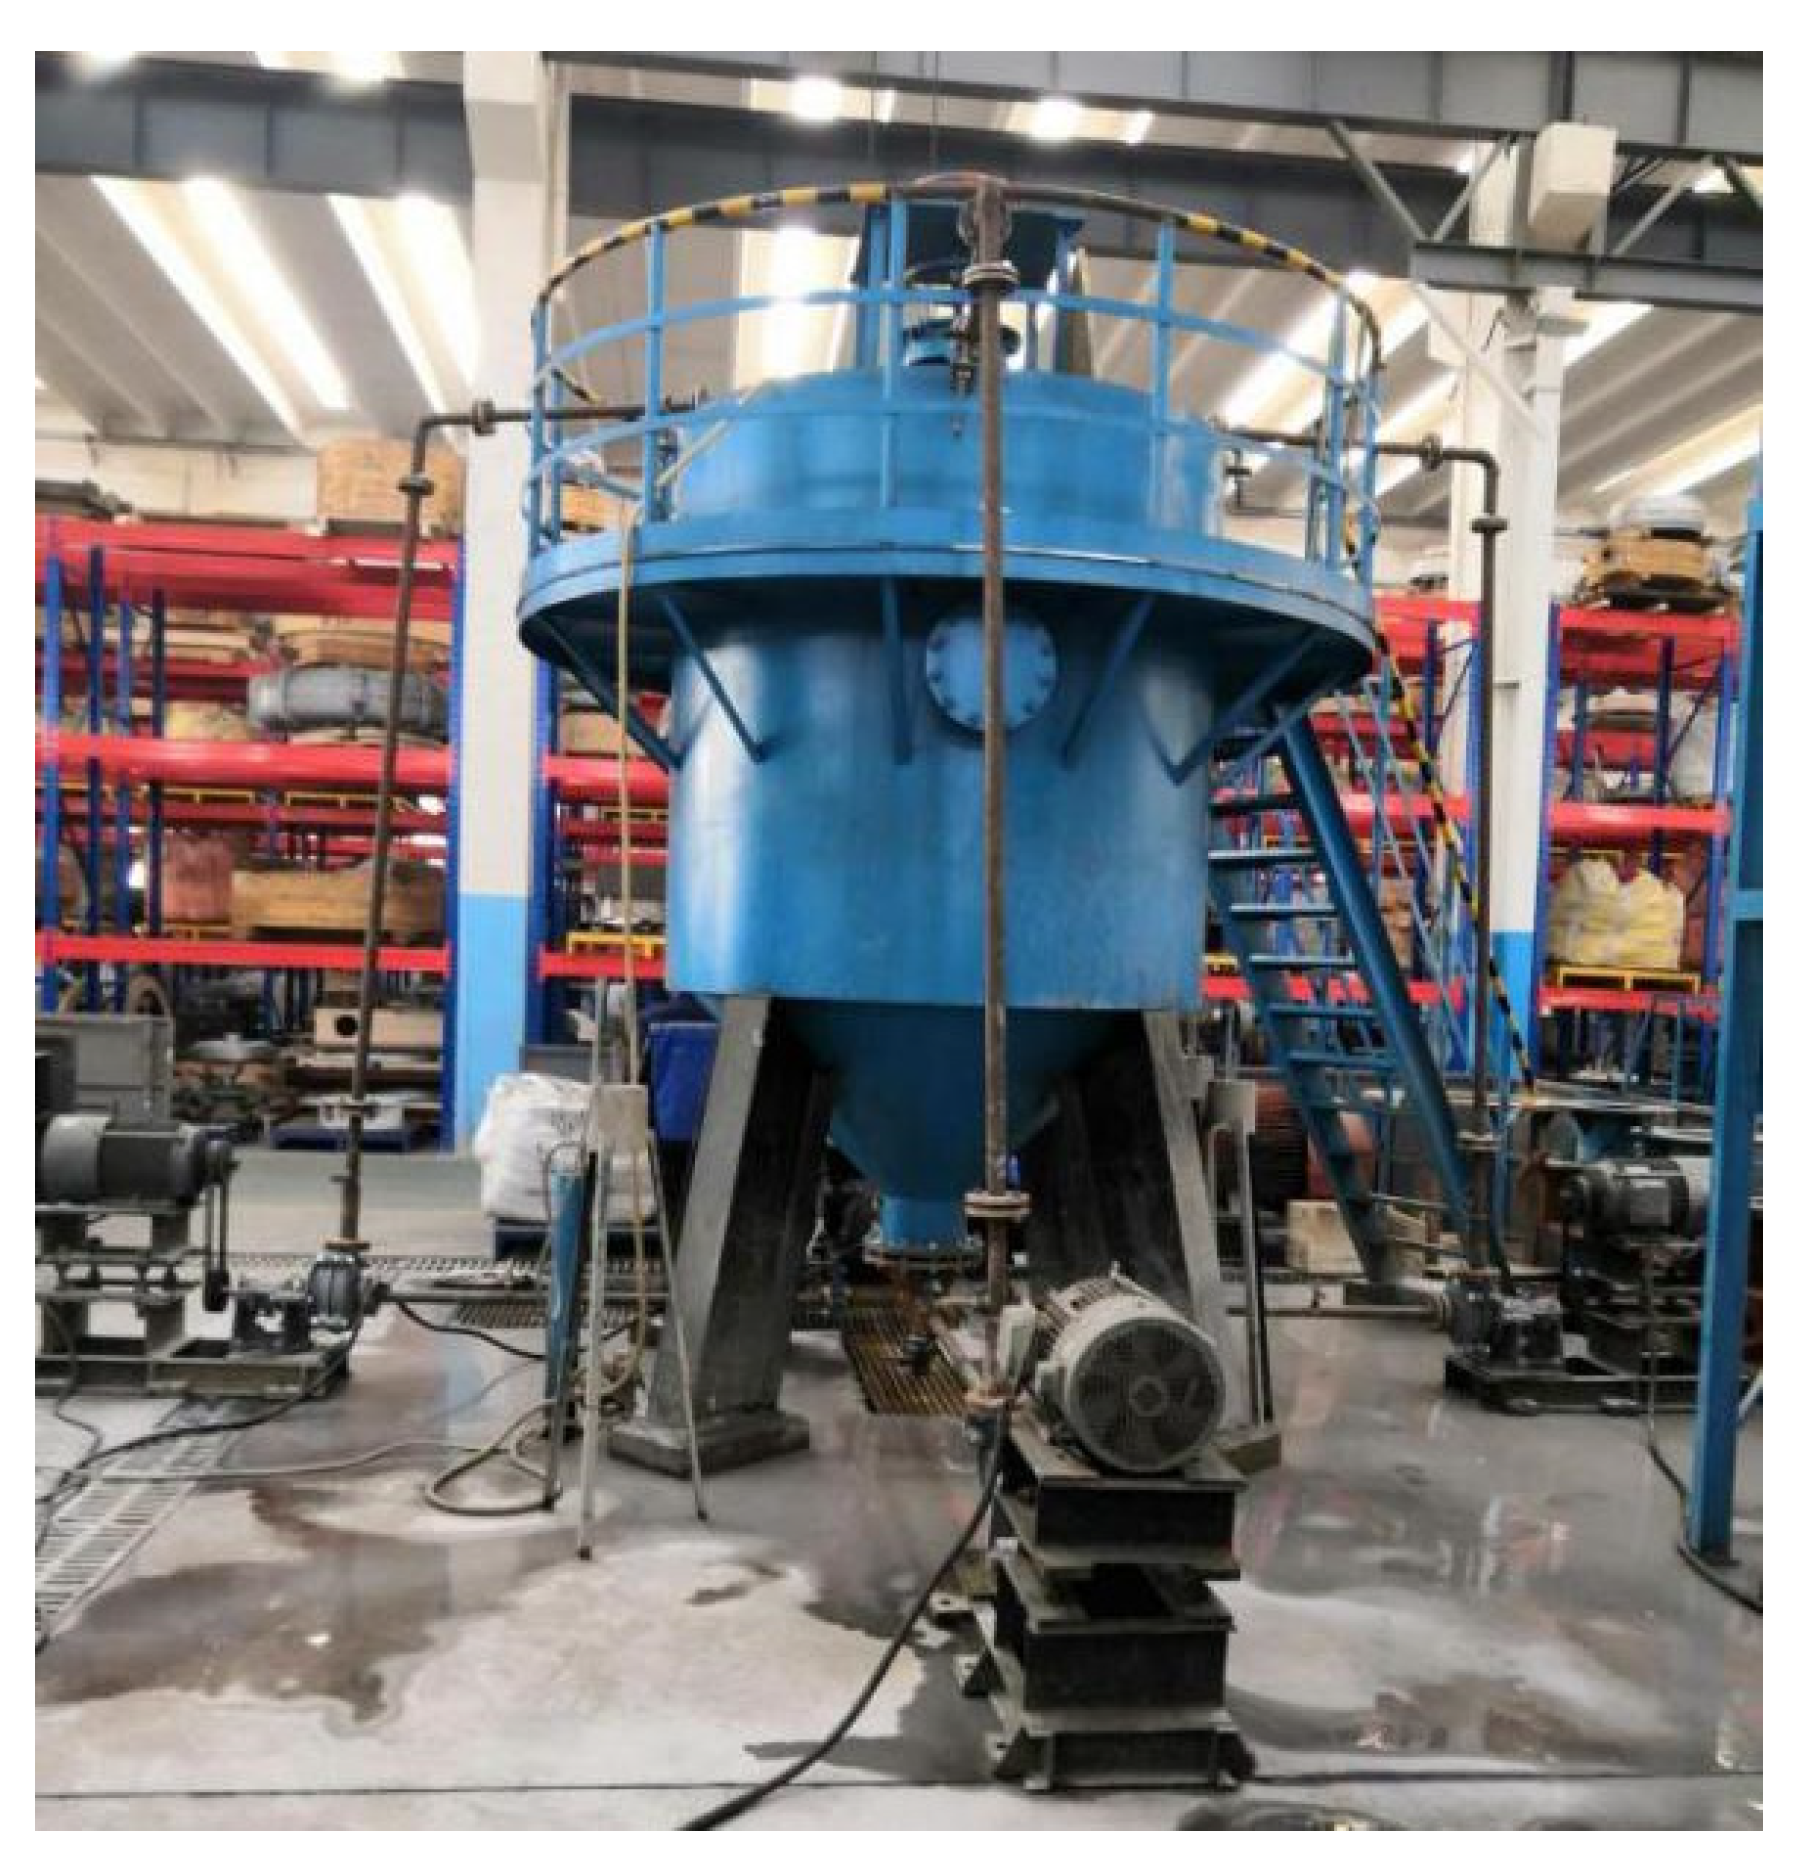
The wear test bench was mainly composed of the slurry pump, pressure gauge, pipeline, valve, motor, and test system. The test system included strong electric parts, such as the step-down starting cabinet, system distribution cabinet, and test conversion protection cabinet, and weak current parts, such as intelligent display instrument, signal conversion device, and various signal sensors. Figure 19 shows the wear test bench.
In the wear test, the wear condition of the impeller was studied by means of equal flow control and impeller weight loss measurements. The inlet and outlet of the pump were equipped with pressure gauges. The wear test was divided into the following two stages.
  • The first stage
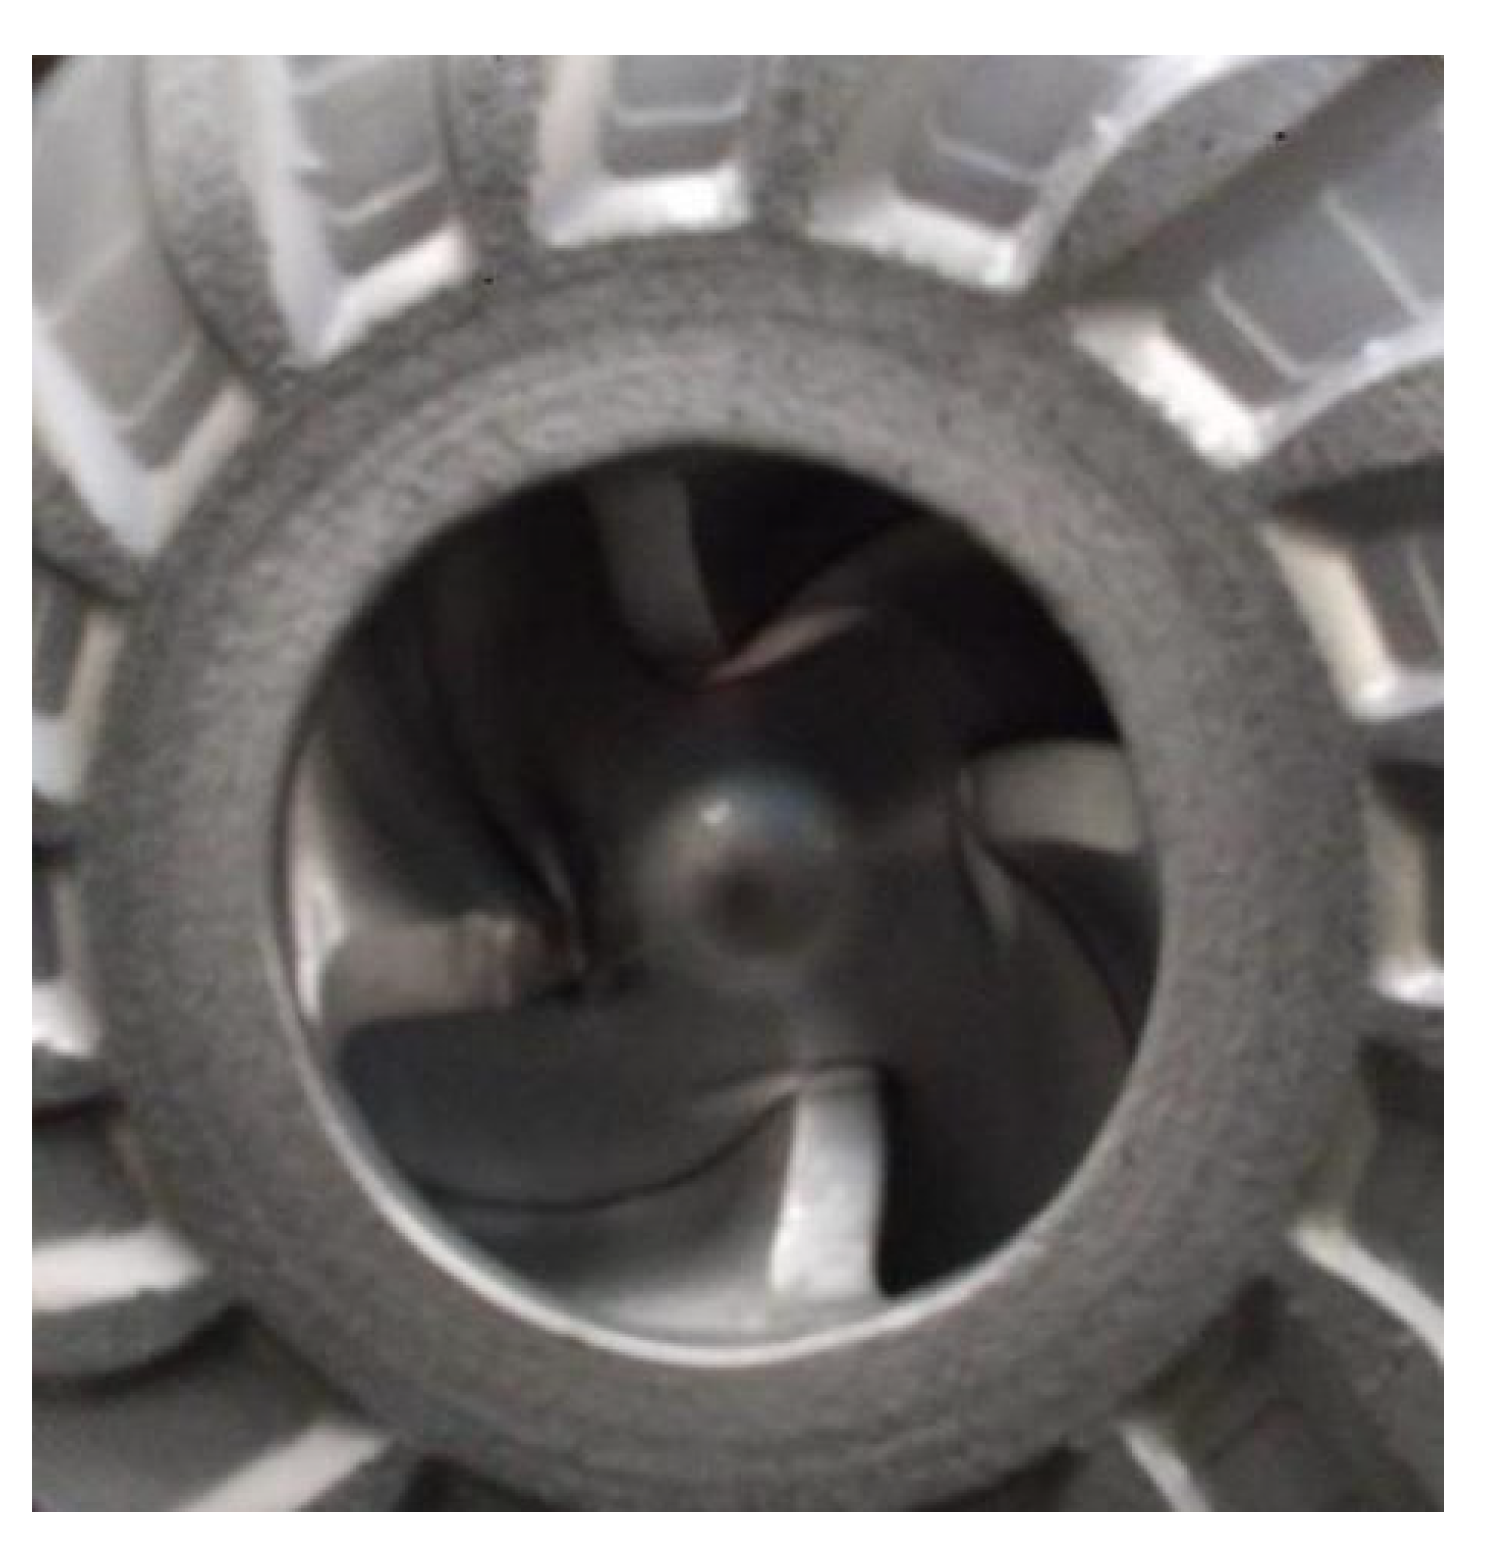
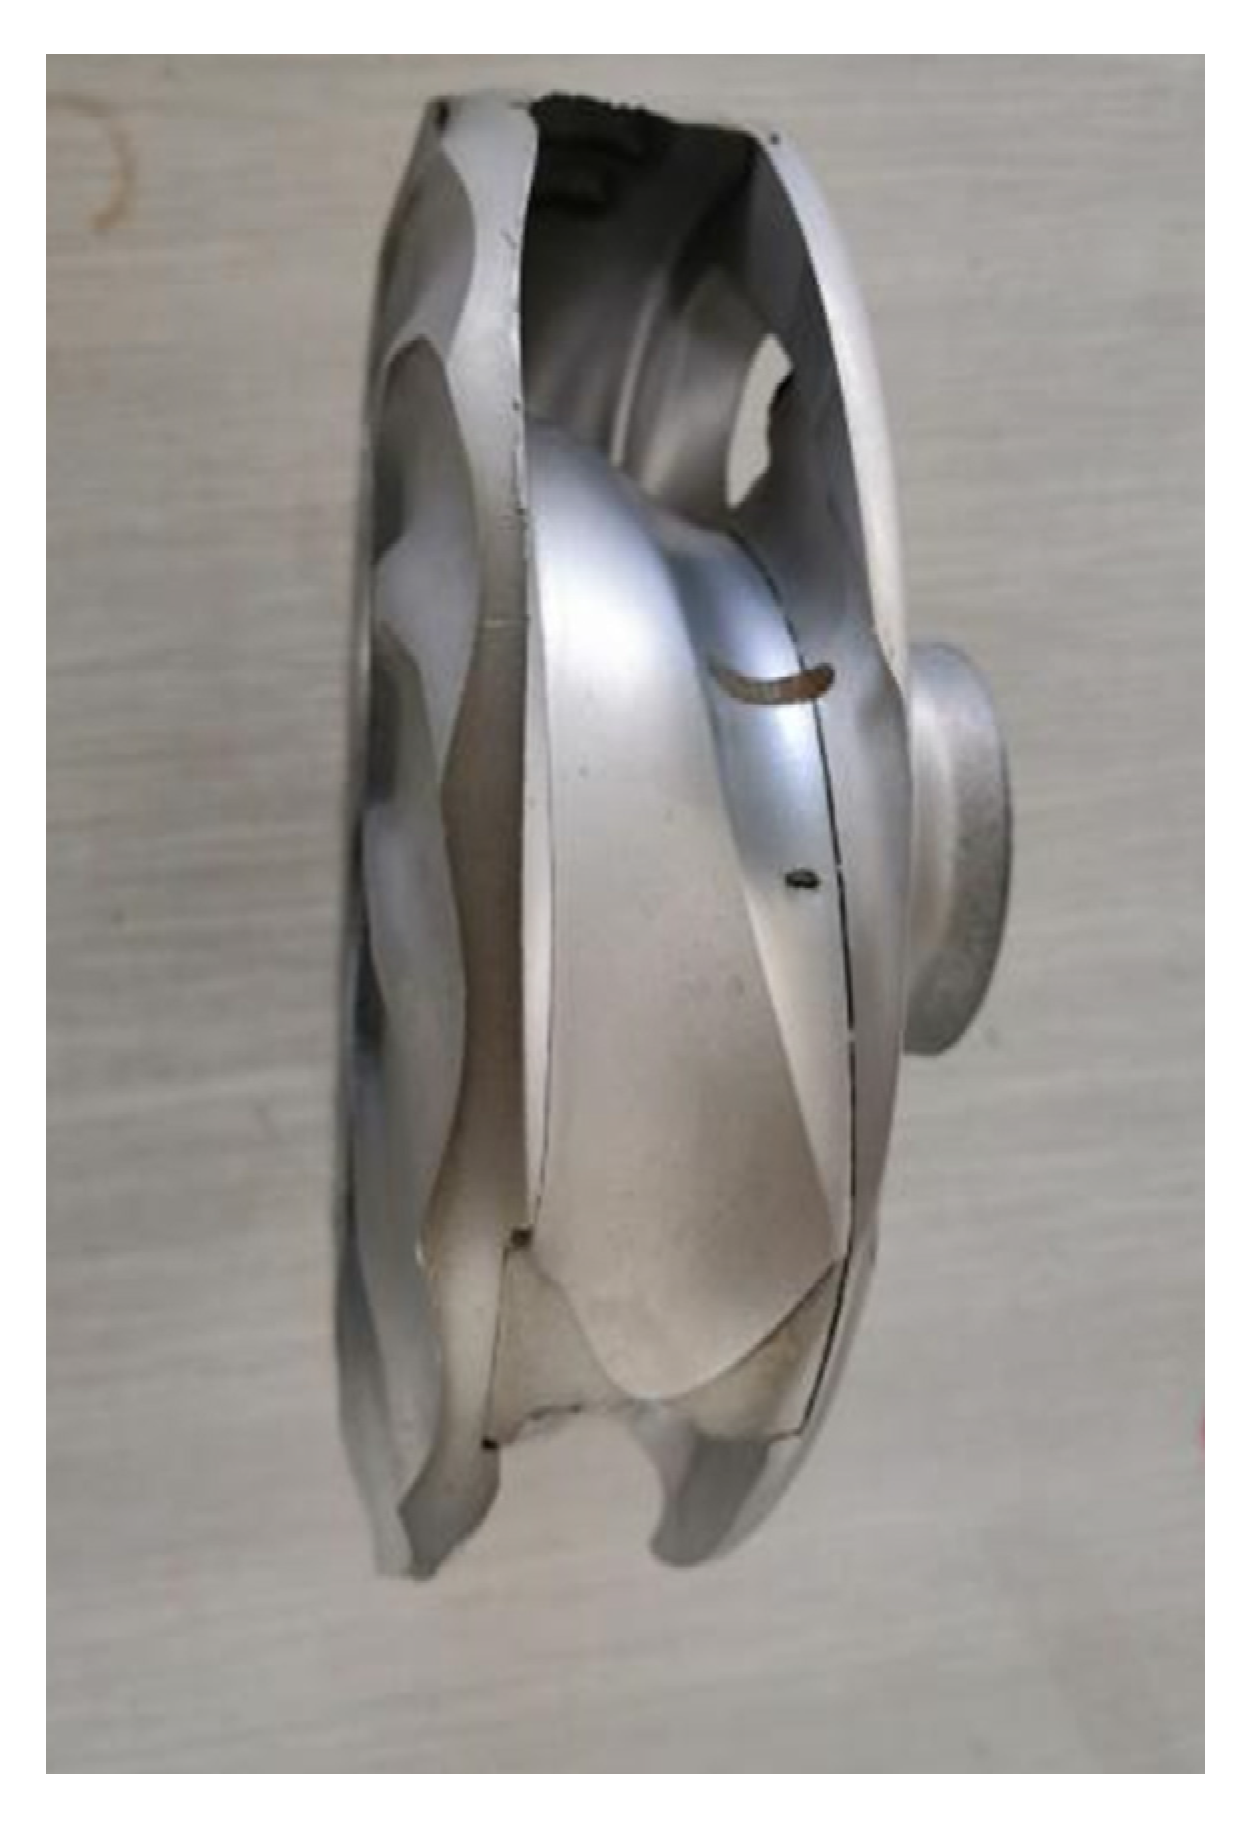
The total duration of the first-stage test was 24 h. The test was carried out under the condition of equal flow rate, and the running speed of the pump was 1500 r/min. Meanwhile, the solid particles were brown corundum, the density was 2900 kg/m3, the particle size was 0.6 mm, and the solid volume was 15%. The mass of the impeller before the test was 2070 g. When the pump was running for 4 h, it was found that there was obvious wear at the intersection between the suction surface and the front cover plate, and slight wear was generated at the entrance of the blade. When the pump was running for 24 h, the weight of the impeller was 1960 g and the weight loss rate was 5.31%. Meanwhile, it was found that the blade was seriously worn at the entrance, and about 1–2 mm oval pits were created on the rear cover plate near the suction surface of the hub. Additionally, the wear of the blade suction surface and the front cover plate joint was more serious; there was an approximately 3 mm long groove on the blade, as shown in Figure 20 and Figure 21.
2.
The second stage
The total duration of the second stage was 24 h. The test was carried out under the condition of equal flow rate, the solid particles were brown corundum, the density was 2900 kg/m3, the particle size was 0.6 mm, the solid volume concentration increased to 25%, and the weight of the impeller before the test was 1960 g. When the pump was running for 24 h, the mass of the impeller was 1560 g and the weight loss rate was 20.41%. After the second-stage wear test, there was serious wear at the junction of the blade pressure surface and the front cover plate that extended from the blade leading edge to the trailing edge. At the same time, serious wear was generated at the junction of the impeller outlet and the rear cover plate, as shown in Figure 22 and Figure 23.

4.3. Analysis of Wear Distribution Characteristic

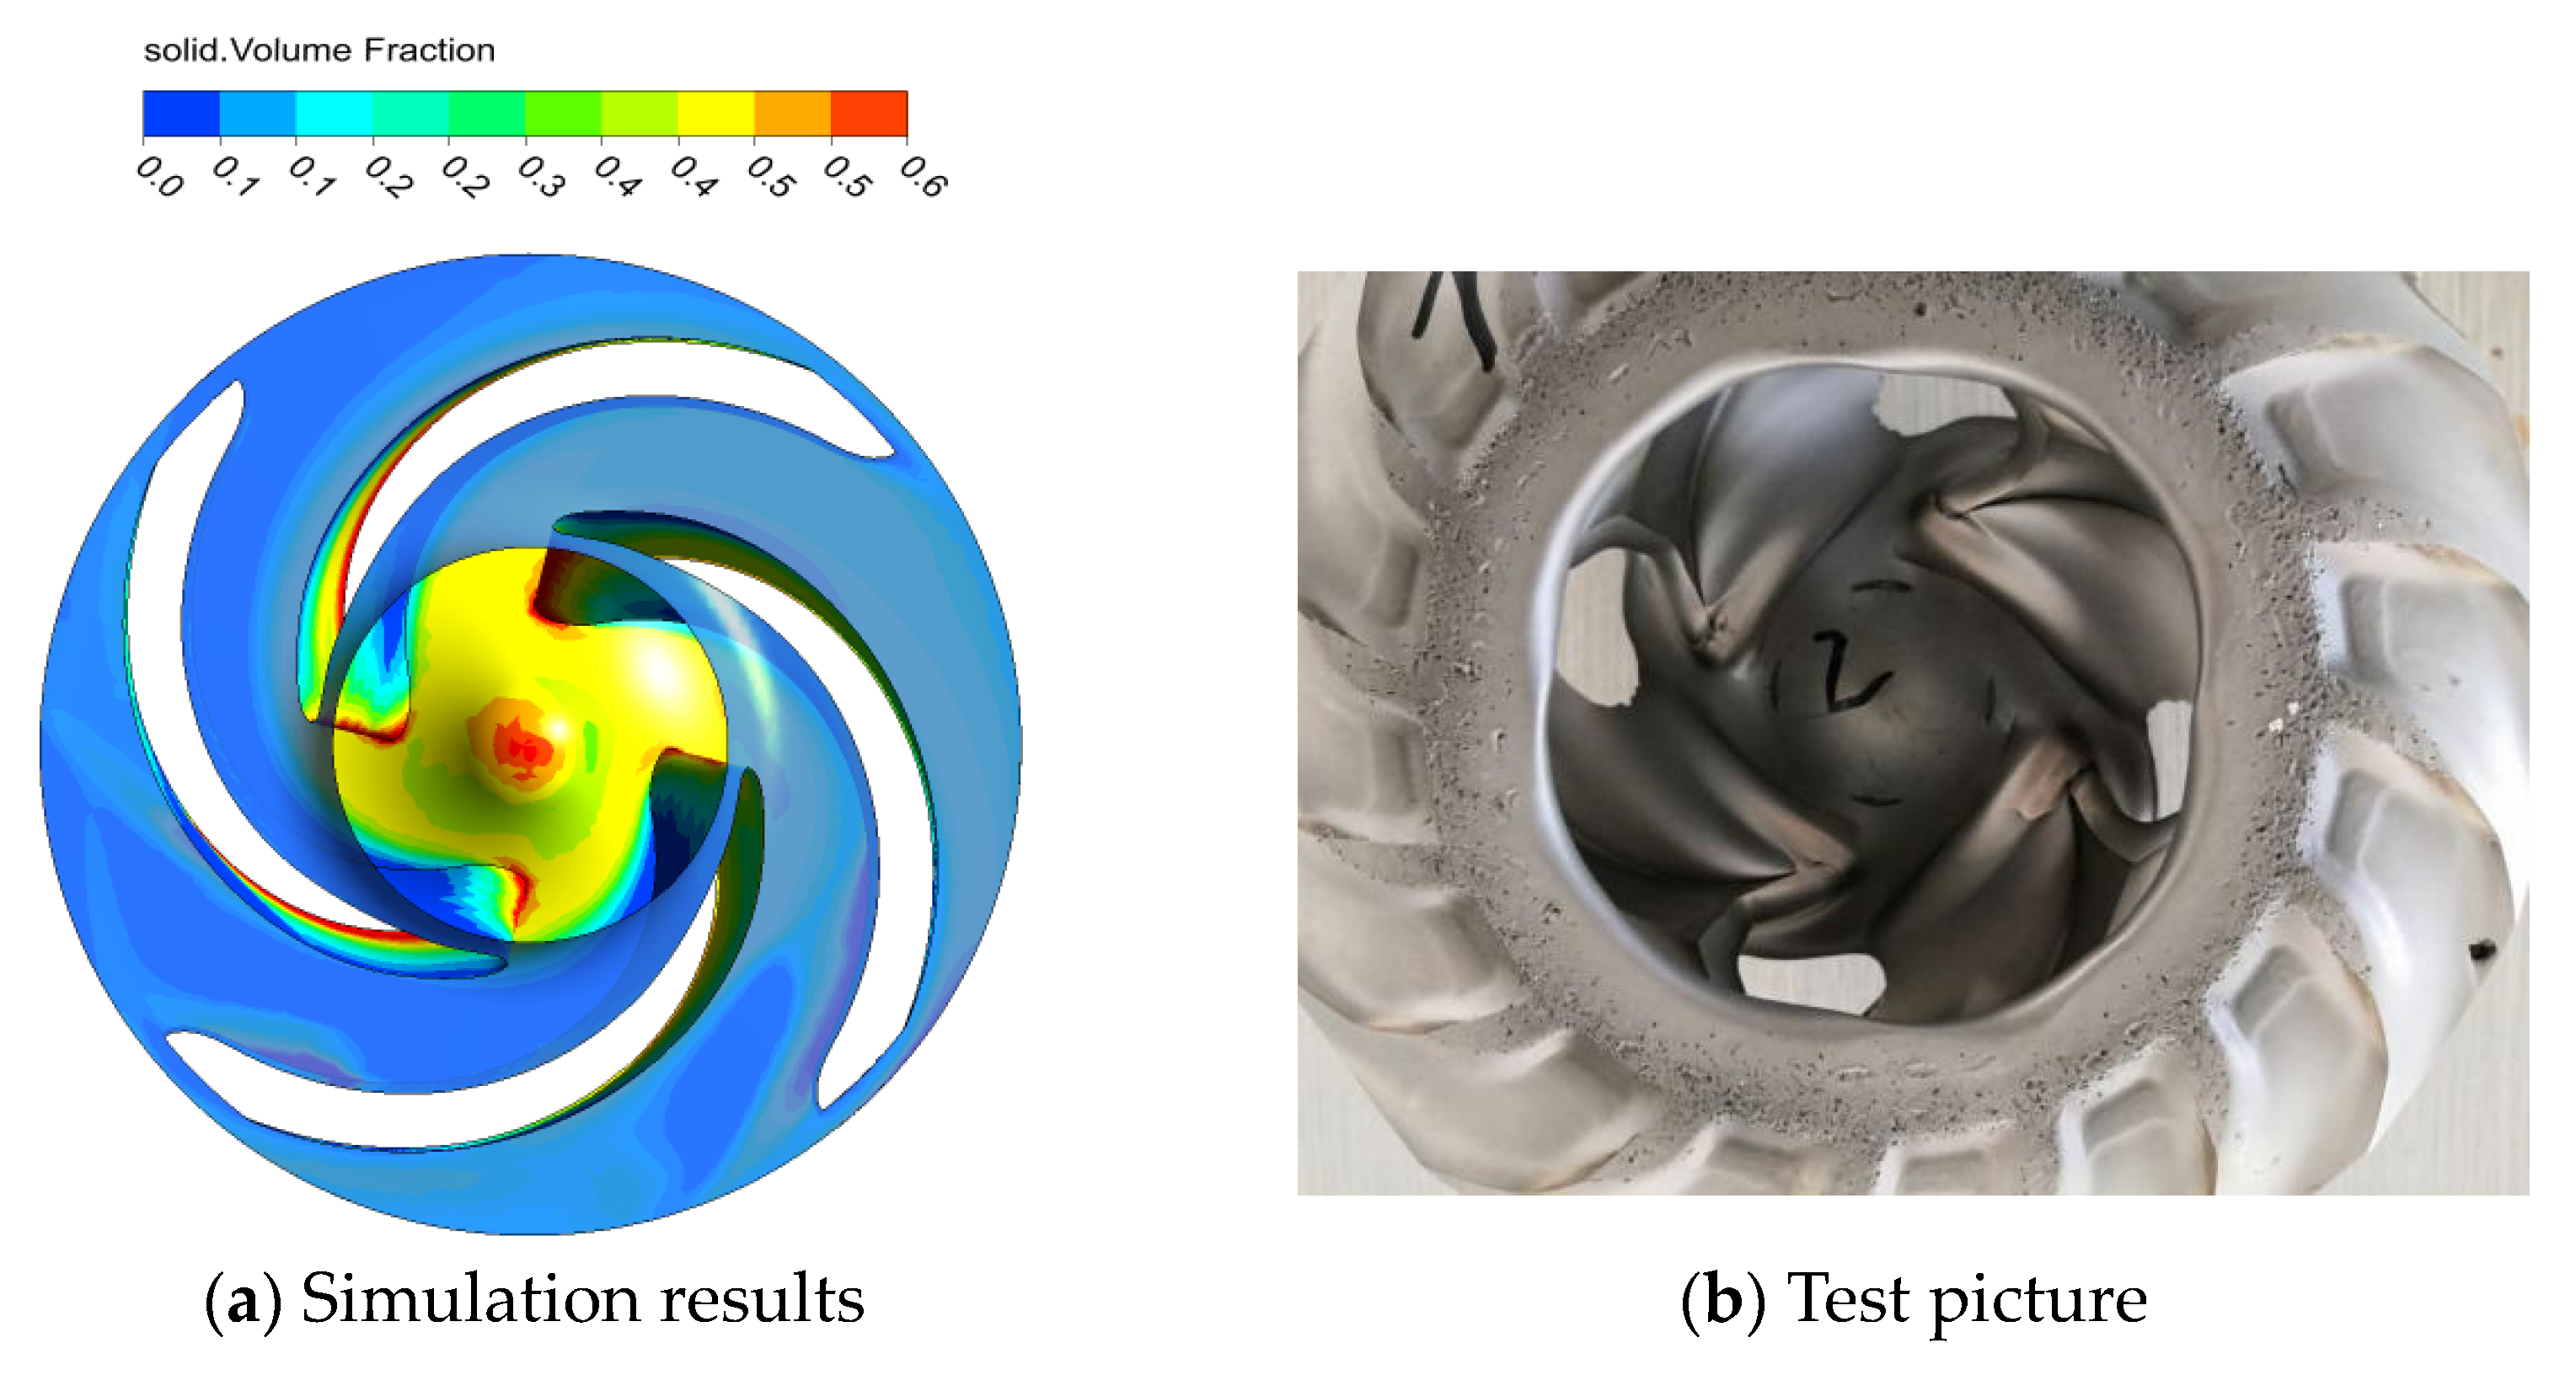
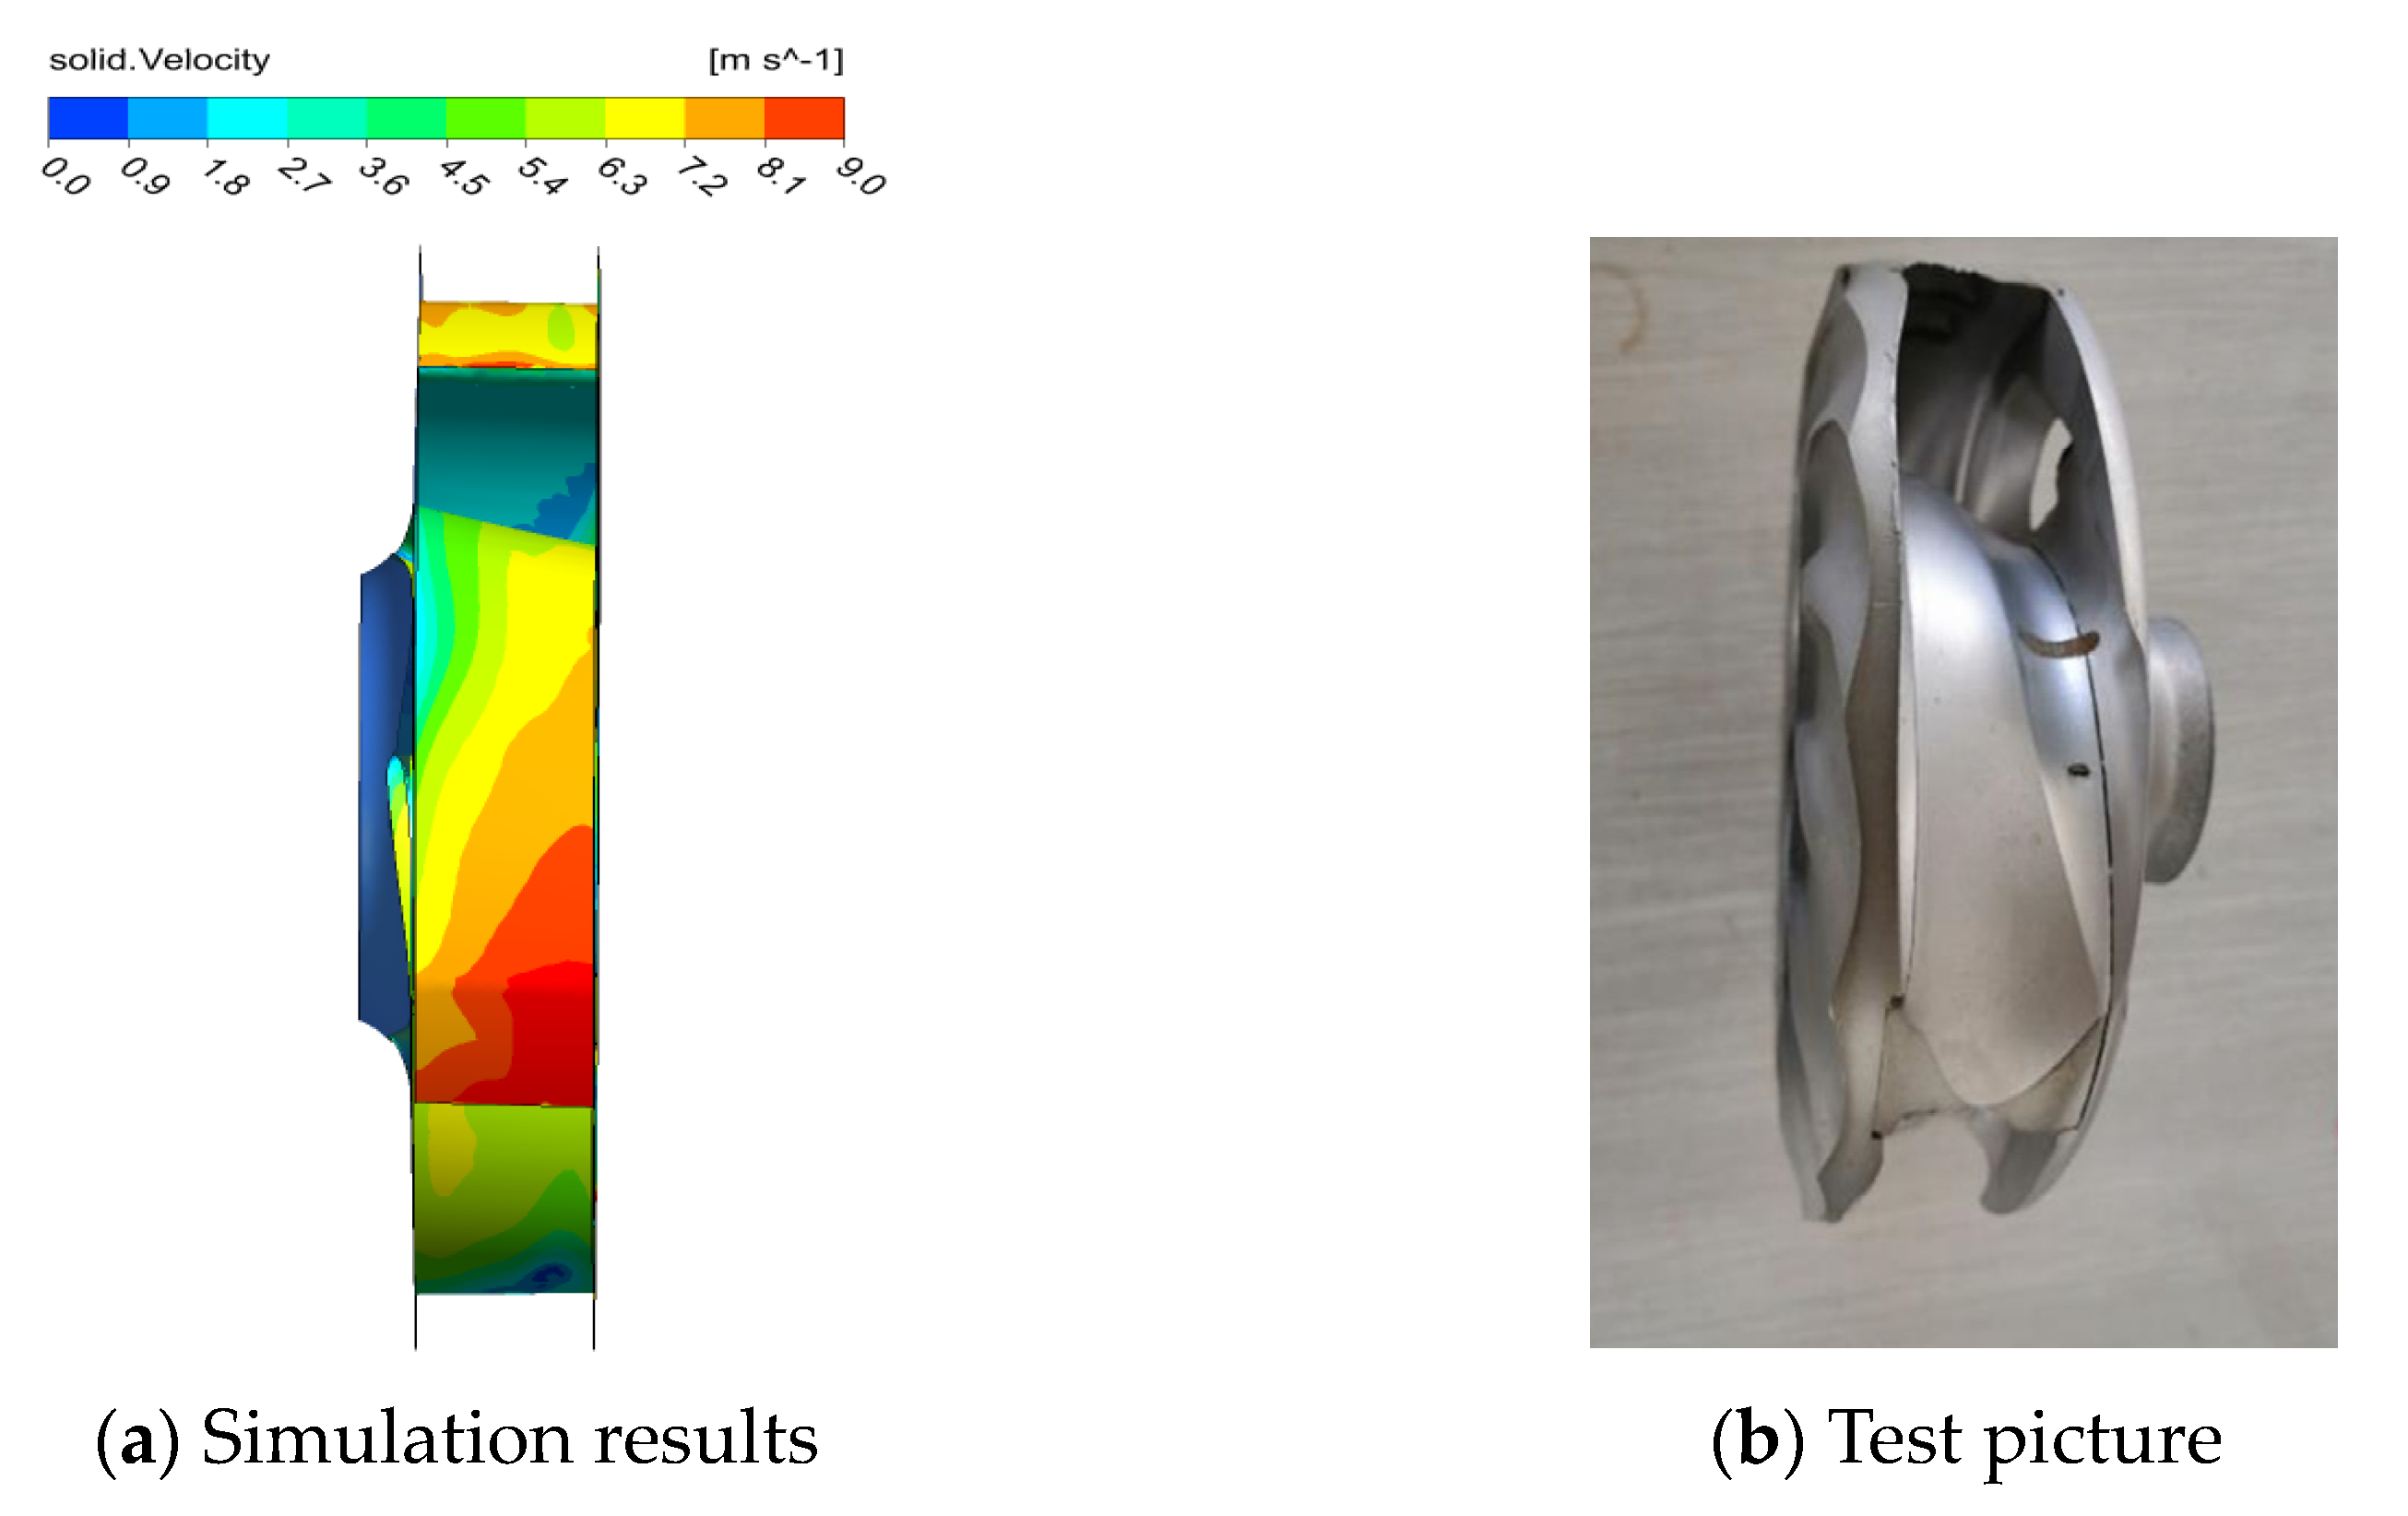
In this section, to analyze the wear distribution characteristic under the design flow condition, the calculation and experimental results with a solid volume concentration of 25% are discussed. Figure 24 shows a contrast diagram of the inlet wear of the impeller. The calculation results show that the high solid volume fraction was generated at the junction of the blade inlet and the rear cover plate. The experiment results showed that slight wear was created at the entrance of the front cover, and the rear cover was worn out. From the previous analysis of blade wear, it could be seen that the high solid-phase slip velocity was generated at the entrance of the front cover plate and the solid phase slip velocity at the leading edge of the blade was larger, which resulted in the rear cover plate being easier to wear out. Figure 25 shows the contrast diagram of impeller outlet wear. The numerical simulation results showed that the solid phase slip velocity at the junction between the blade and the rear cover plate was larger and the slip velocity gradually declined from the trailing edge to the leading edge. At the same time, the numerical simulation results were in good agreement with the experimental results. Therefore, enhancing the strength of the junction between the blade leading edge and the rear cover plate was beneficial for improving the service life of the slurry pump.

5. Conclusions

In this paper, a 25 MZ slurry pump was selected as the research object, and the Euler–Euler multiphase flow model was employed to analyze the internal flow characteristic of the slurry pump under the conditions of clear water and solid–liquid two-phase flow. The following conclusions were obtained:
(1)
Pre-rotation was generated at the inlet section, and the pre-rotation direction was consistent with the rotation direction of the impeller under part-load conditions. Meanwhile, the ability of the pre-rotation continuously decreased with the increase in flow rate. When the flow rate reached 1.5 QBEP, the flow at the inlet section was relatively stable. Furthermore, the solid volume fraction of the blade pressure surface gradually moved from the leading edge to the trailing edge with the increase in flow rate. When the flow rate increased to 1.5 QBEP, the solid particles moved to the rear cover plate under the effect of inertia force, which resulted in a large solid volume fraction at the interface between the impeller and the rear cover plate.
(2)
With the increase in the particle volume concentration, the viscosity of the solid–liquid two-phase flow increased and the friction force and energy loss between the internal fluids gradually increased, which resulted in a decrease in the head. When the concentration was 5%, the head decreased by 0.33% and the efficiency decreased by 1.60%. When the concentration was 25%, the head decreased by 8.9% and the efficiency decreased by 8.09%. Therefore, the head and efficiency of the pump decreased with increases in particle volume concentration.
(3)
When the particle diameter gradually increased, the energy driving the solid particles was greater and the head gradually decreased. At the same time, with the increase in solid particle diameter, the friction loss between particles and impeller increased, which led to the increases in impeller torque and motor power consumption. Therefore, when the particle diameter increased from 0.15 to 0.6 mm, the pump head decreased from 12 to 11.42 m and the efficiency decreased from 71.25% to 67.35%.
(4)
Finally, clean water and solid–liquid two-phase flow wear tests of the slurry pump were carried out. The calculation deviation in the full flow range was less than 5%, so the calculation model could accurately predict the performance of the pump. By comparing the wear distribution of numerical and experiment, it was found that high solid volume fraction and solid-phase slip velocity were generated at the junction of the blade leading edge and the rear cover plate, which made the latter easier to wear out. Therefore, enhancing the strength of the junction between the blade leading edge and the rear cover plate would be beneficial for improving the service life of a slurry pump.
In this paper, in order to simplify the analysis model, a uniformly spherical particle was employed in the calculation process. However, particles in a slurry pump have a lot of different shapes during actual operation. Therefore, the influence of particle shapes on the hydraulic performance and wear characteristics of slurry pumps will be investigated in the future.

Author Contributions

This was a joint work, and the authors worked according to their expertise and capability. G.P. and L.T.: investigation, analysis, writing, and revision; H.C.: for methodology and revision; S.H. and D.Y.: validation and revision; B.Y.: data analysis. All authors have read and agreed to the published version of the manuscript.

Funding

The authors gratefully acknowledge the support from Open Research Fund Program of State key Laboratory of Hydro-science and Engineering grant number: sklhse-2020-E-01; Open Research Subject of Key Laboratory of Fluid Machinery and Engineering (Xihua University) grant number LTJX2021-003; Open Research Subject of Hubei Key Laboratory of Hydroelectric Machinery De-sign and Maintenance (China Three Gorges University) grant number 2020KJX07; the 69th batch of general funding from the China Postdoctoral Science Foundation grant number: 2021M691298; Natural Science Research Project of Jiangsu Province Colleges and Universities: 21KJB570004, Priority Academic Program Development of Jiangsu Higher Education Institutions (PAPD).

Institutional Review Board Statement

Not applicable.

Informed Consent Statement

Not applicable.

Data Availability Statement

Not applicable.

Conflicts of Interest

The authors declare no conflict of interest.

References

  1. Wang, R.; Guan, Y.; Jin, X.; Tang, Z.; Zhu, Z.; Su, X. Impact of Particle Sizes on Flow Characteristics of Slurry Pump for Deep-Sea Mining. Shock. Vib. 2021, 2021, 1–13. [Google Scholar] [CrossRef]
  2. Shi, B.; Pan, J.; Wu, L.; Zhang, X.; Qiu, Y.; Zhang, Y. A Prediction Method of Wear for Volute Casing of a Centrifugal Slurry Pump. Geofluid 2020, 2020, 1–12. [Google Scholar] [CrossRef]
  3. Peng, G.; Huang, X.; Zhou, L.; Zhou, G.; Zhou, H. Solid-liquid two-phase flow and wear analysis in a large-scale centrifugal slurry pump. Eng. Fail. Anal. 2020, 114, 104602. [Google Scholar] [CrossRef]
  4. Li, Y.; Zeng, X.; Lv, W.; He, Z. Centrifugal pump wear for solid–liquid two-phase flows based on computational fluid dynamics–discrete element method coupling. Adv. Mech. Eng. 2020, 12, 1–17. [Google Scholar] [CrossRef]
  5. Tan, M.; Lian, Y.; Liu, H.; Wu, X.; Ding, R. Visualizing test on the pass-through and collision characteristics of coarse particles in a double blade pump. Int. J. Nav. Archit. Ocean. Eng. 2018, 10, 1–8. [Google Scholar] [CrossRef]
  6. Shen, Z.; Chu, W.; Yan, S.; Chen, X.; Guo, Z.; Zhong, Y. Study of the performance and internal flow in centrifugal pump with grooved volute casing. Mod. Phys. Lett. B 2020, 34, 2050268. [Google Scholar] [CrossRef]
  7. Wang, Y.; Han, C.; Zhou, Y.; Lin, Z.; Ma, J.; Li, X.; Zhang, W. Wear Characteristics of Dense Fine Particles Solid-Liquid Two-Phase Fluid Centrifugal Pump with Open Impellers. Shock. Vib. 2021, 2021, 1–13. [Google Scholar] [CrossRef]
  8. Zhao, W.; Zhao, G. Numerical investigation on the transient characteristics of sediment-laden two-phase flow in a centrifugal pump. J. Mech. Sci. Technol. 2018, 32, 167–176. [Google Scholar] [CrossRef]
  9. Wang, Y.; Chen, B.; Zhou, Y.; Ma, J.; Zhang, X.; Zhu, Z.; Li, X. Numerical Simulation of Fine Particle Solid-Liquid Two-Phase Flow in a Centrifugal Pump. Shock. Vib. 2021, 2021, 1–10. [Google Scholar] [CrossRef]
  10. Wang, Y.; Chen, J.; Xie, L.; Liu, H.-L.; Luo, K.-K. Combined experimental and computational investigation of the effect of coating on operation characteristics of solid–liquid two-phase flow centrifugal pump. Mod. Phys. Lett. B 2021, 35, 2150062. [Google Scholar] [CrossRef]
  11. Gu, Y.; Liu, N.; Mou, J.; Zhou, P.; Qian, H.; Dai, D. Study on solid–liquid two-phase flow characteristics of centrifugal pump impeller with non-smooth surface. Adv. Mech. Eng. 2019, 11, 1–12. [Google Scholar] [CrossRef]
  12. Yan, C.; Liu, J.; Zheng, S.; Huang, B.; Dai, J. Study on the effects of the wear-rings clearance on the solid-liquid two-phase flow characteristics of centrifugal pumps. Symmetry 2020, 12, 2003. [Google Scholar] [CrossRef]
  13. Wang, P.; Zhu, X.; Li, Y. Analysis of Flow and Wear Characteristics of Solid–Liquid Two-Phase Flow in Rotating Flow Channel. Processes 2020, 8, 1512. [Google Scholar] [CrossRef]
  14. Tang, C.; Kim, Y.J. CFD-DEM simulation for the distribution and motion feature of solid particles in single-channel pump. Energies 2020, 13, 4988. [Google Scholar] [CrossRef]
  15. Wang, H.L.; Hu, Q.X.; Yang, Y.; Wang, C. Performance differences of electrical submersible pump under variable speed schemes. Int. J. Simul. Model. 2021, 20, 76–86. [Google Scholar] [CrossRef]
  16. Zhou, J.; Zhao, M.; Wang, C.; Gao, Z. Optimal design of diversion piers of lateral intake pumping station based on orthogonal test. Shock. Vib. 2021, 2021, 1–9. [Google Scholar] [CrossRef]
  17. Shi, L.; Zhu, J.; Tang, F.; Wang, C. Multi-disciplinary optimization design of axial-flow pump impellers based on the approximation model. Energies 2020, 13, 779. [Google Scholar] [CrossRef] [Green Version]
  18. Wang, H.; Long, B.; Wang, C.; Han, C.; Li, L. Effects of the impeller blade with a slot structure on the centrifugal pump performance. Energies 2020, 13, 1628. [Google Scholar] [CrossRef]
  19. Wang, C.; Chen, X.; Qiu, N.; Zhu, Y.; Shi, W. Numerical and experimental study on the pressure fluctuation, vibration, and noise of multistage pump with radial diffuser. J. Braz. Soc. Mech. Sci. Eng. 2018, 40, 481. [Google Scholar] [CrossRef]
  20. Zhang, L.; Wang, C.; Zhang, Y.; Xiang, W.; He, Z.; Shi, W. Numerical study of coupled flow in blocking pulsed jet impinging on a rotating wall. J. Braz. Soc. Mech. Sci. Eng. 2021, 43, 508. [Google Scholar] [CrossRef]
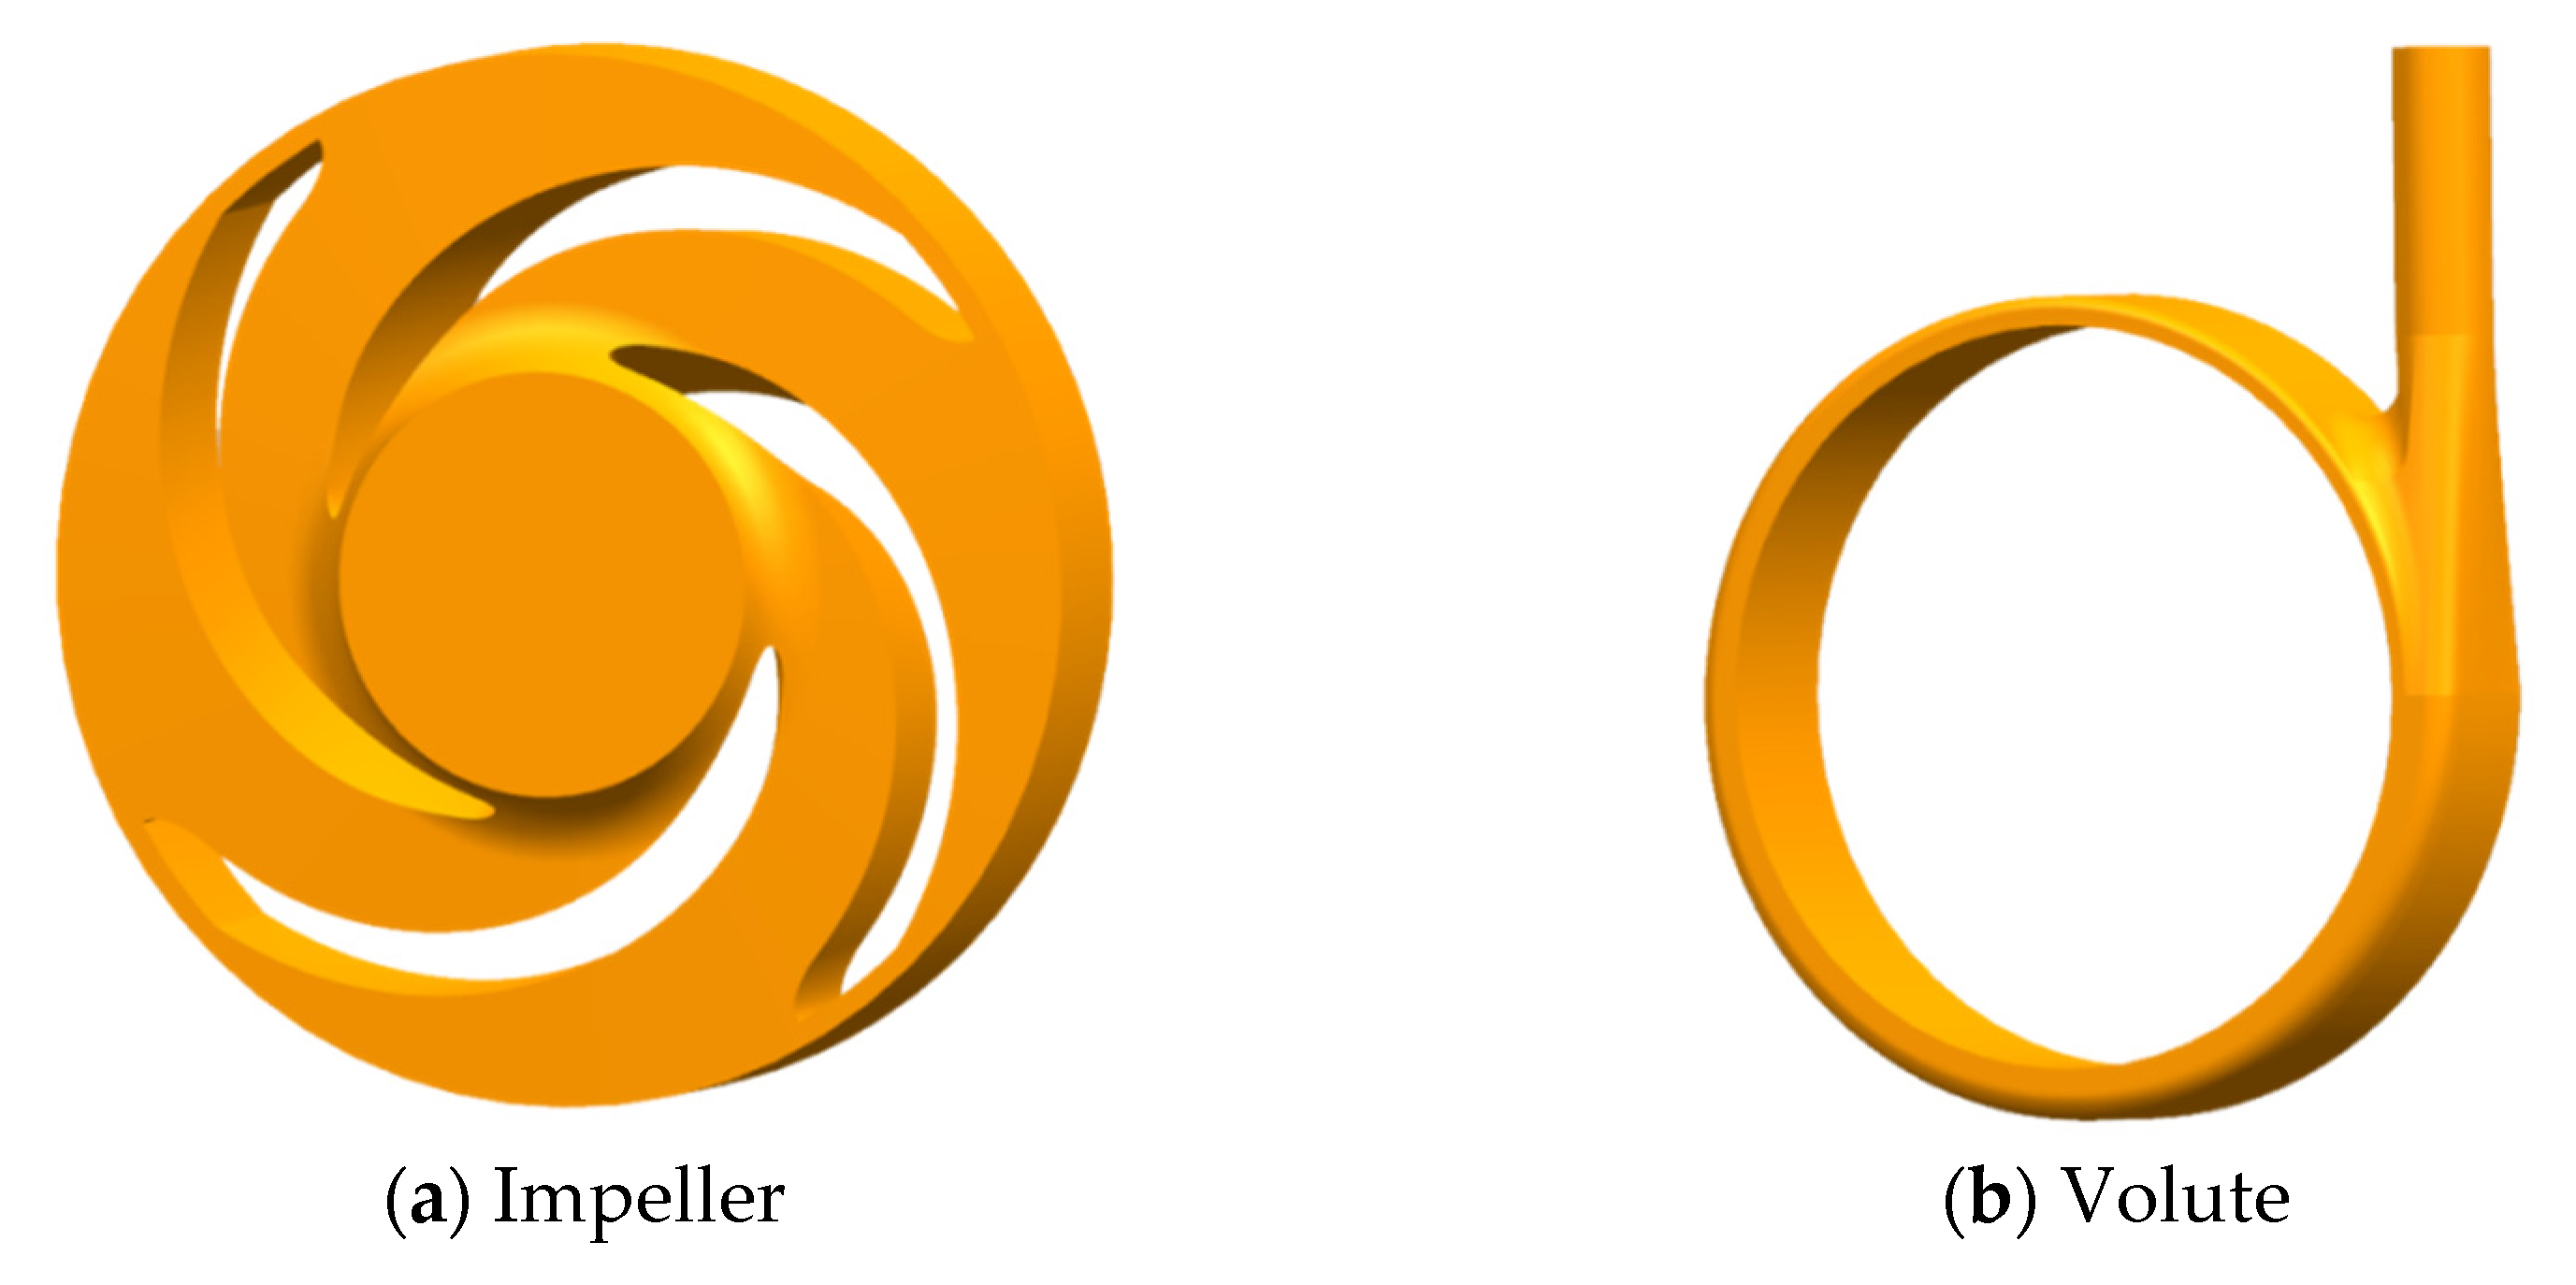
Figure 1. (a,b) Three-dimensional models of the flow domain.
Machines 09 00373 g001
Figure 2. (a,b) Mesh generation of the flow domains.
Machines 09 00373 g002
Figure 3. The grid independence.
Machines 09 00373 g003
Figure 4. (ac) Flow distribution in the inlet section under clean water.
Machines 09 00373 g004
Figure 5. (ac) Flow distribution in the inlet section under two-phase flow.
Machines 09 00373 g005
Figure 6. (ac) Solid volume fraction distribution of the blade.
Machines 09 00373 g006
Figure 7. (ac) Solid volume fraction distribution on the rear cover.
Machines 09 00373 g007
Figure 8. (ac) Solid volume fraction distribution on the front cover.
Machines 09 00373 g008
Figure 9. External characteristic curves of different concentrations.
Machines 09 00373 g009
Figure 10. (a,b) Solid velocity distribution of the blade.
Machines 09 00373 g010
Figure 11. (a,b) Solid volume fraction distribution of blade.
Machines 09 00373 g011
Figure 12. Characteristic curve under different particle sizes.
Machines 09 00373 g012
Figure 13. (a,b) Solid velocity distribution of the blade.
Machines 09 00373 g013
Figure 14. (a,b) Solid volume fraction distribution of blade.
Machines 09 00373 g014
Figure 15. Three-dimensional fitting surface of different solid volume concentrations and speeds.
Machines 09 00373 g015
Figure 16. Equipotential head diagram of different solid concentrations and speeds.
Machines 09 00373 g016
Figure 17. Hydraulic performance test bench.
Machines 09 00373 g017
Figure 18. Comparison of external characteristics under the clean water condition.
Machines 09 00373 g018
Figure 19. Wear test bench.
Machines 09 00373 g019
Figure 20. Photograph of impeller wear in the first stage (at the inlet).
Machines 09 00373 g020
Figure 21. Photograph of impeller wear in the first stage (direction of the outlet side).
Machines 09 00373 g021
Figure 22. Photograph of the second-stage impeller wear.
Machines 09 00373 g022
Figure 23. Photograph of the second-stage impeller wear.
Machines 09 00373 g023
Figure 24. (a,b) Comparison of impeller inlet wear.
Machines 09 00373 g024
Figure 25. (a,b) Comparison of impeller outlet wear.
Machines 09 00373 g025
Table 1. Main parameters of 25 MZ slurry pump.
Design Flow
QBEP (m3/h)
Head
H (m)
Speed
n (r/min)
Blade
Number
Impeller Outer
Diameter D2 (mm)
Blade Outlet Width b2 (mm)Inlet Diameter
Dj (mm)
2611150041783075
Table 2. Density under different particle volume concentrations.
Cv/%05101520253050
ρ (kg/m3)10001095119012851380147515751950
Publisher’s Note: MDPI stays neutral with regard to jurisdictional claims in published maps and institutional affiliations.