
Experimentally Validated Extension of the Operating Range of an Electrically Driven Turbocharger for Fuel Cell Applications

Abstract
:1. Introduction
2. Investigated Geometries and Parameters
2.1. Compressor
2.2. Turbine
3. Numerical Setup
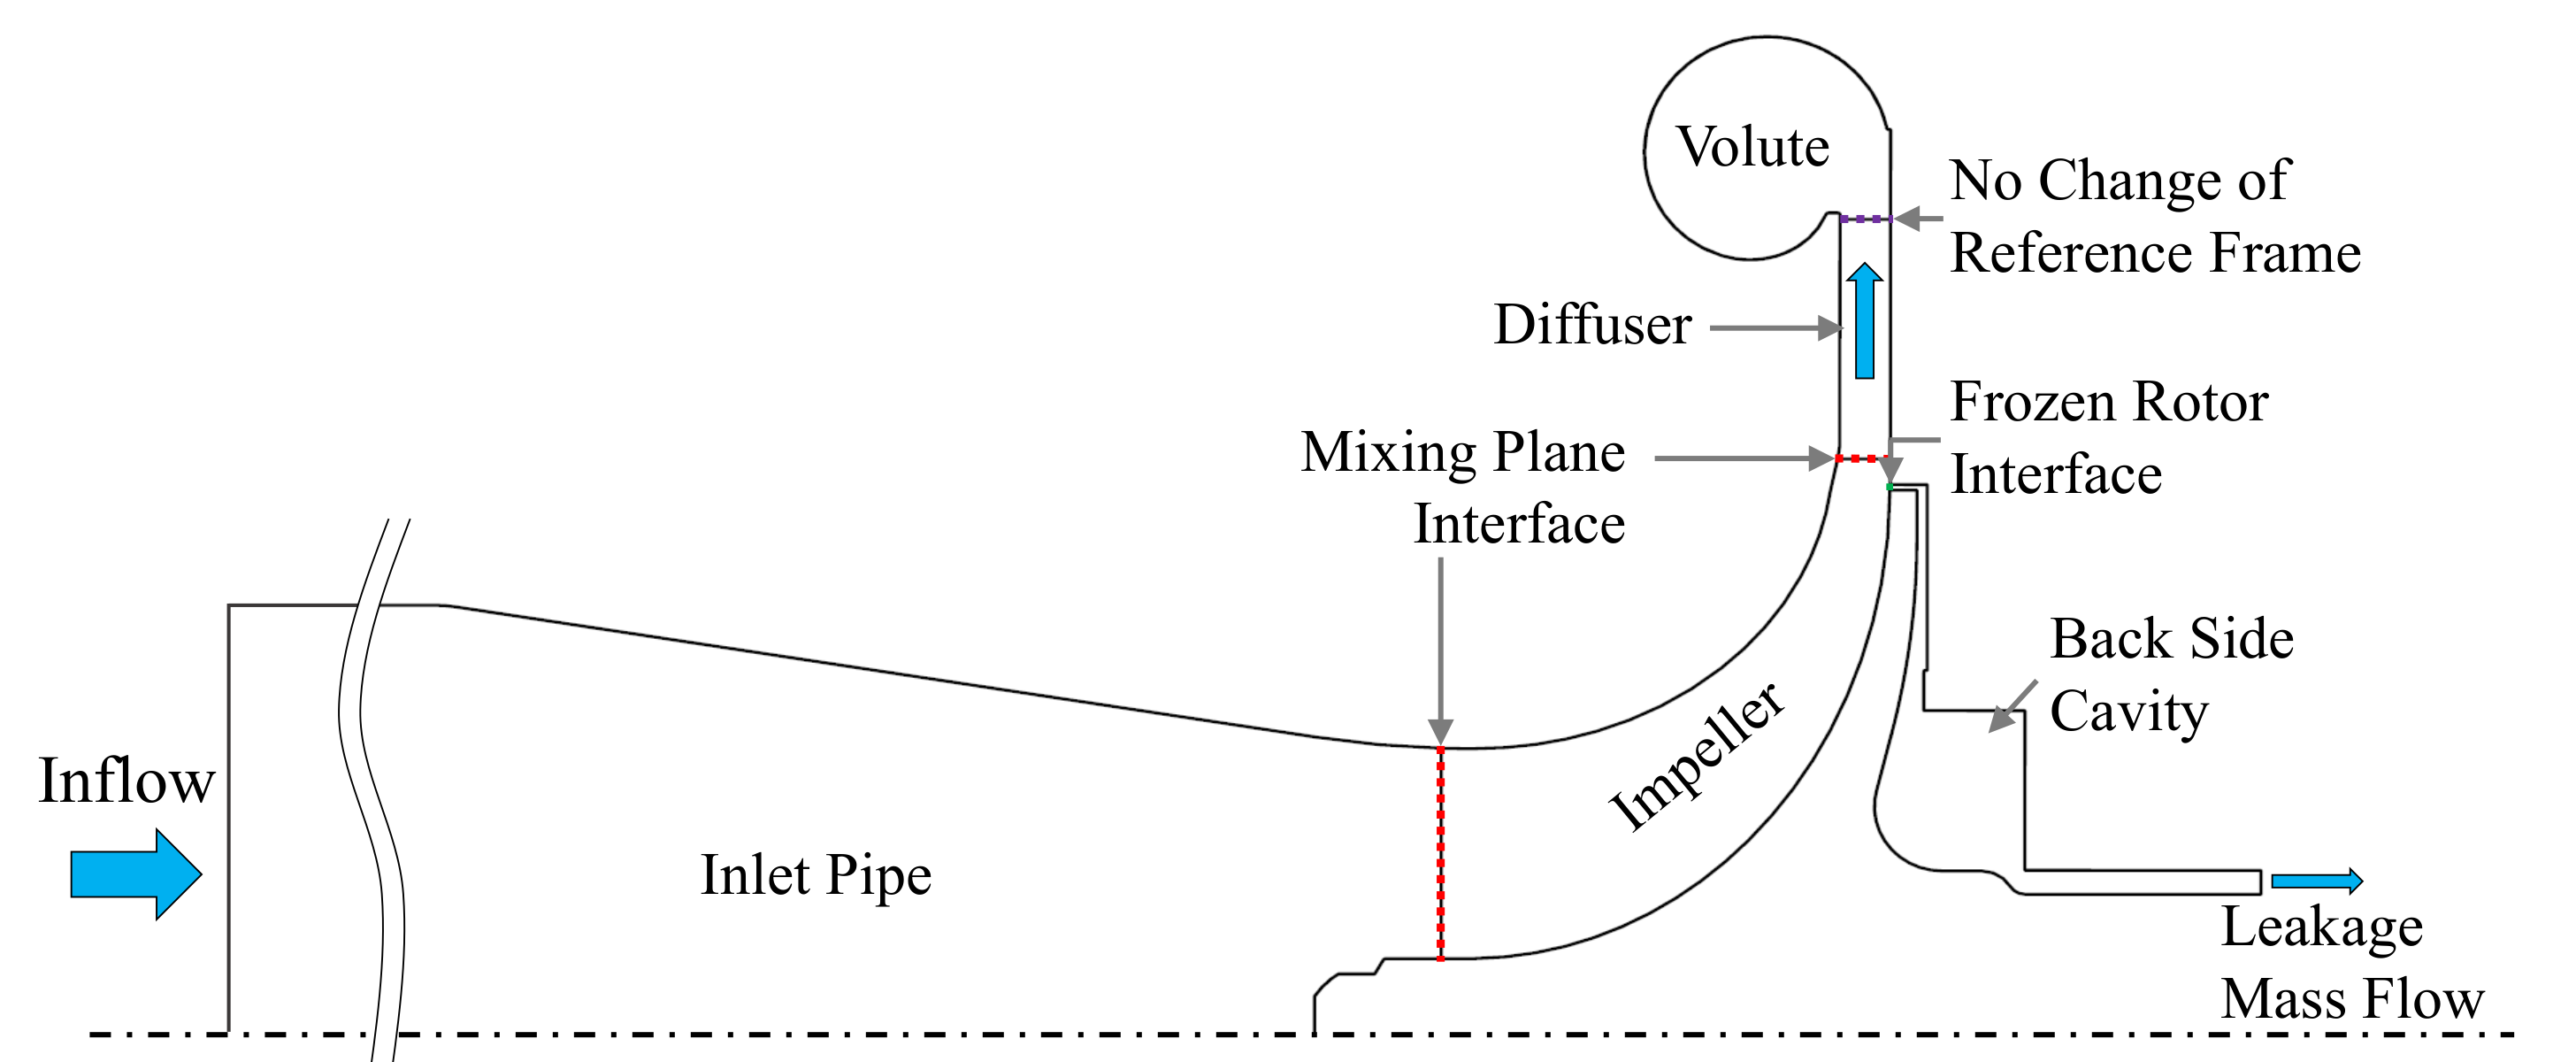
3.1. Compressor
3.2. Turbine
4. Results
4.1. Compressor
4.1.1. Experimental Validation
4.1.2. Baseline Compressor
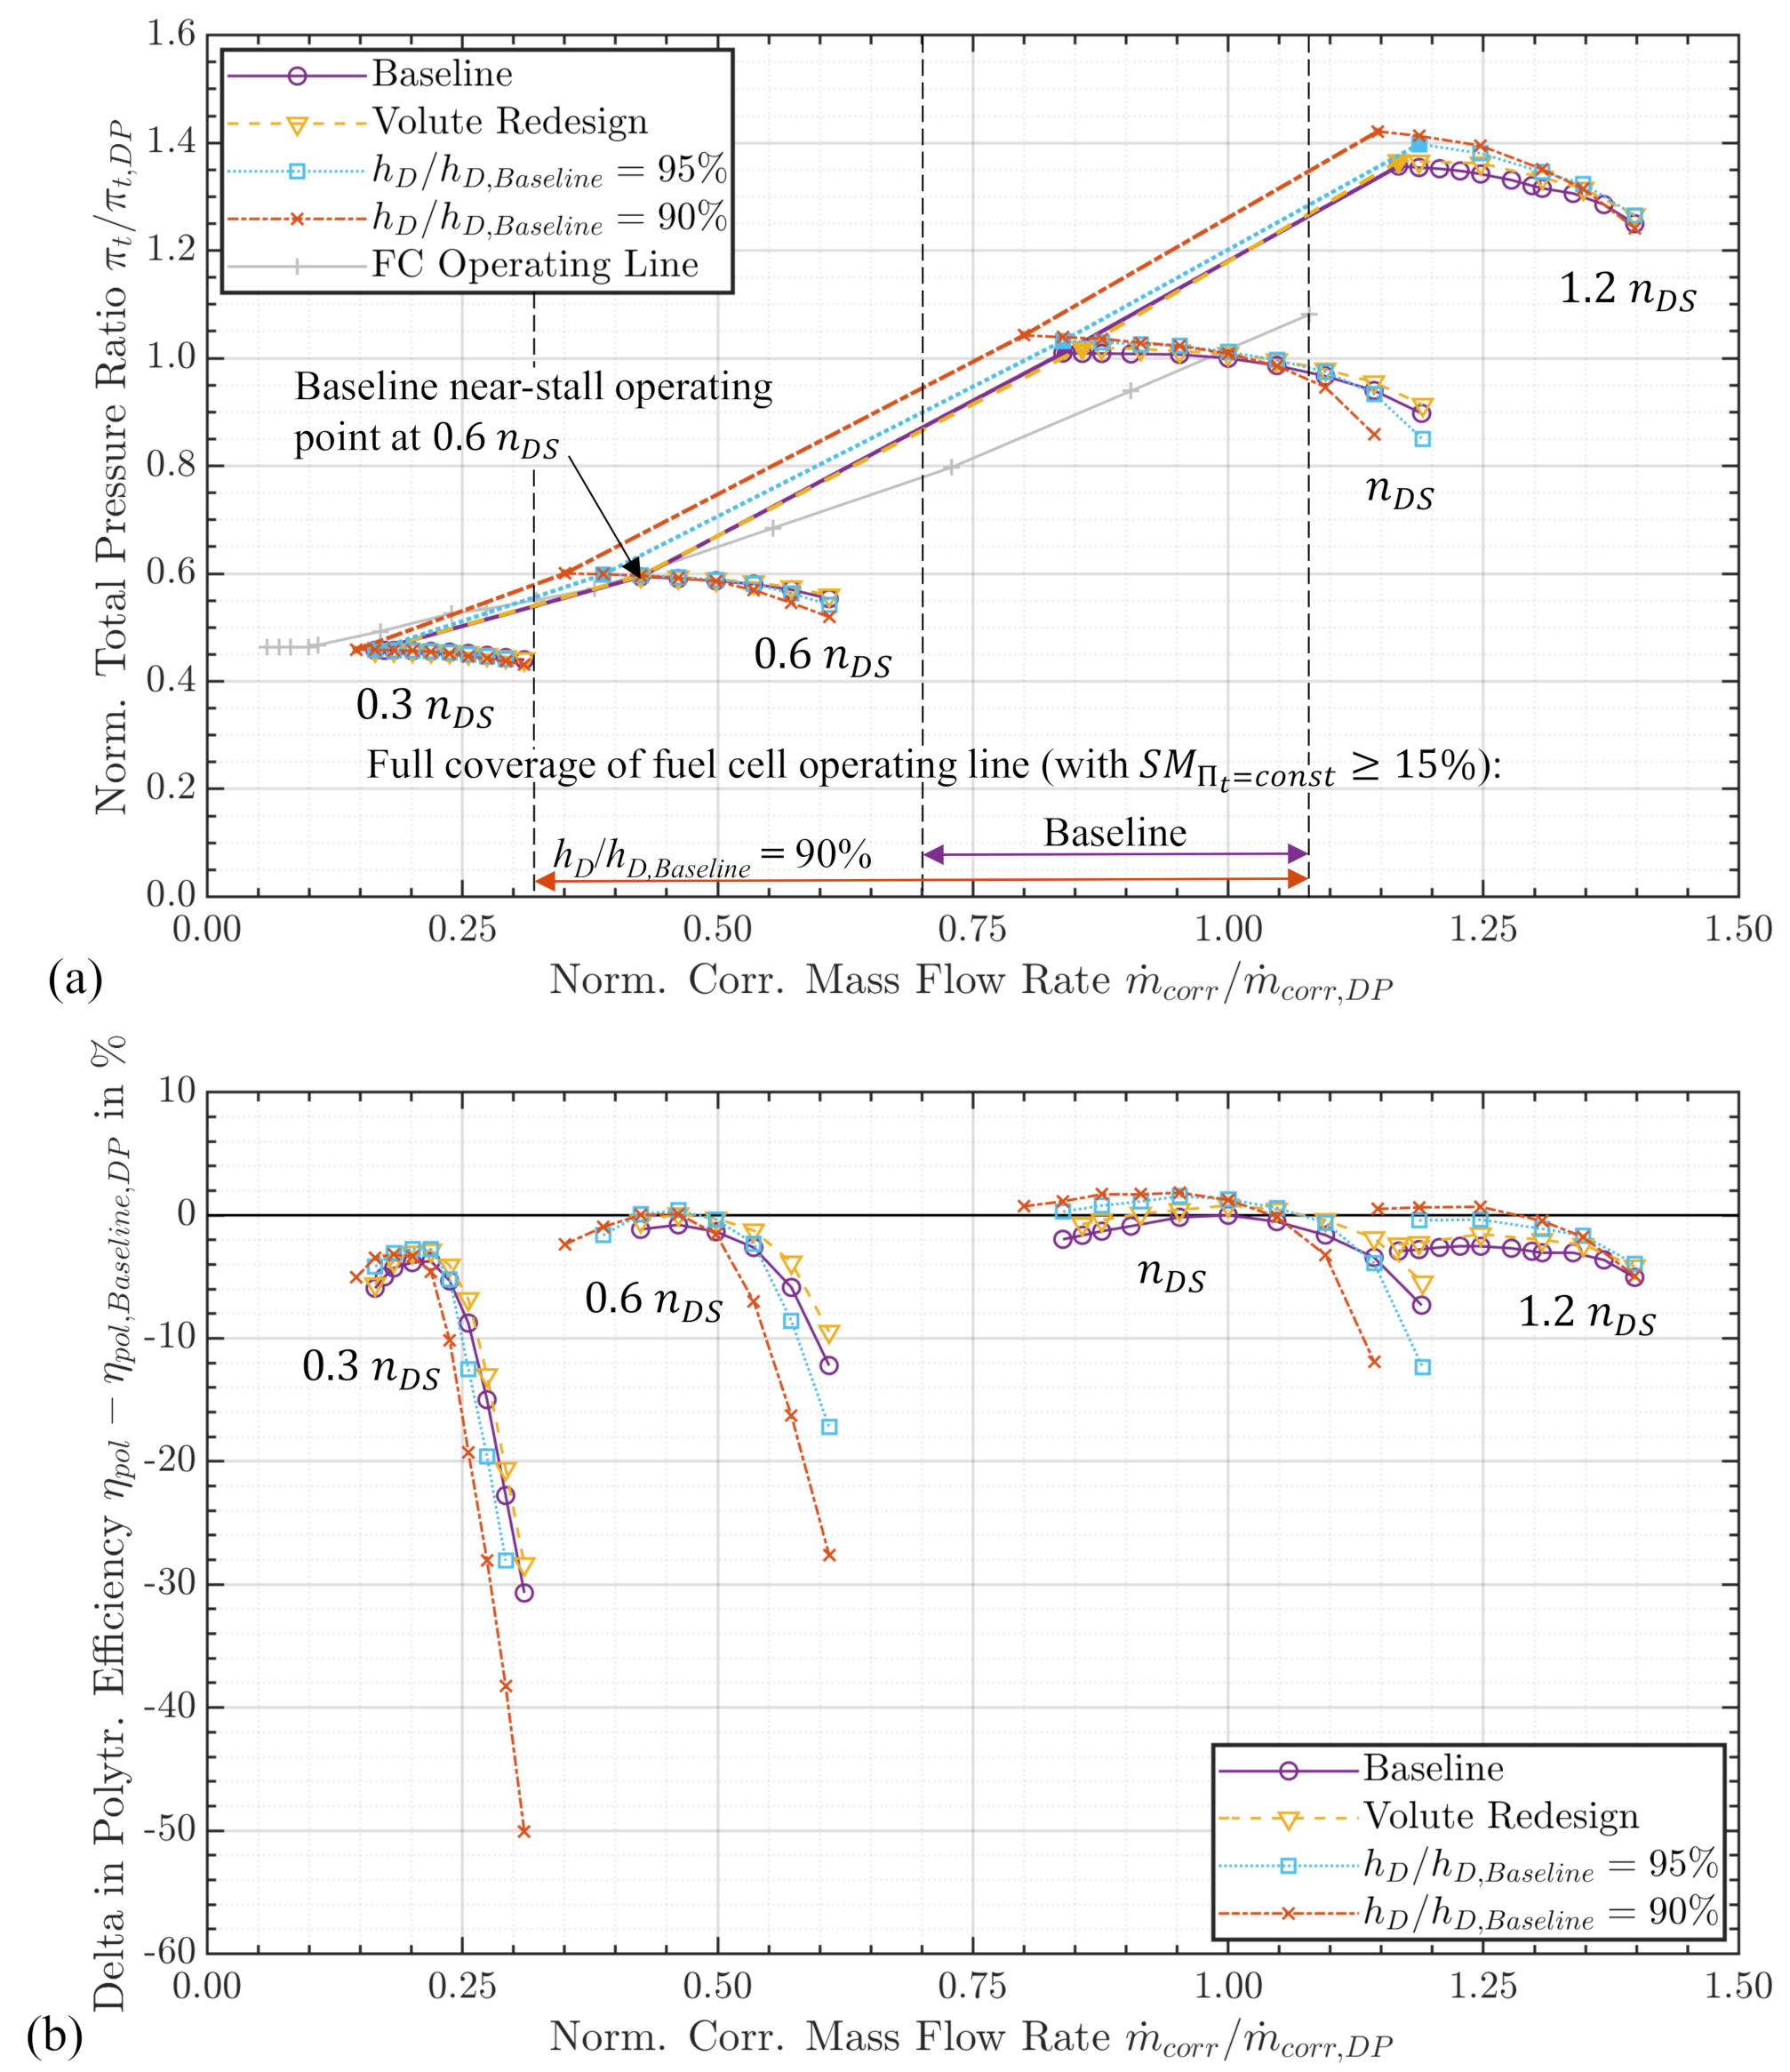
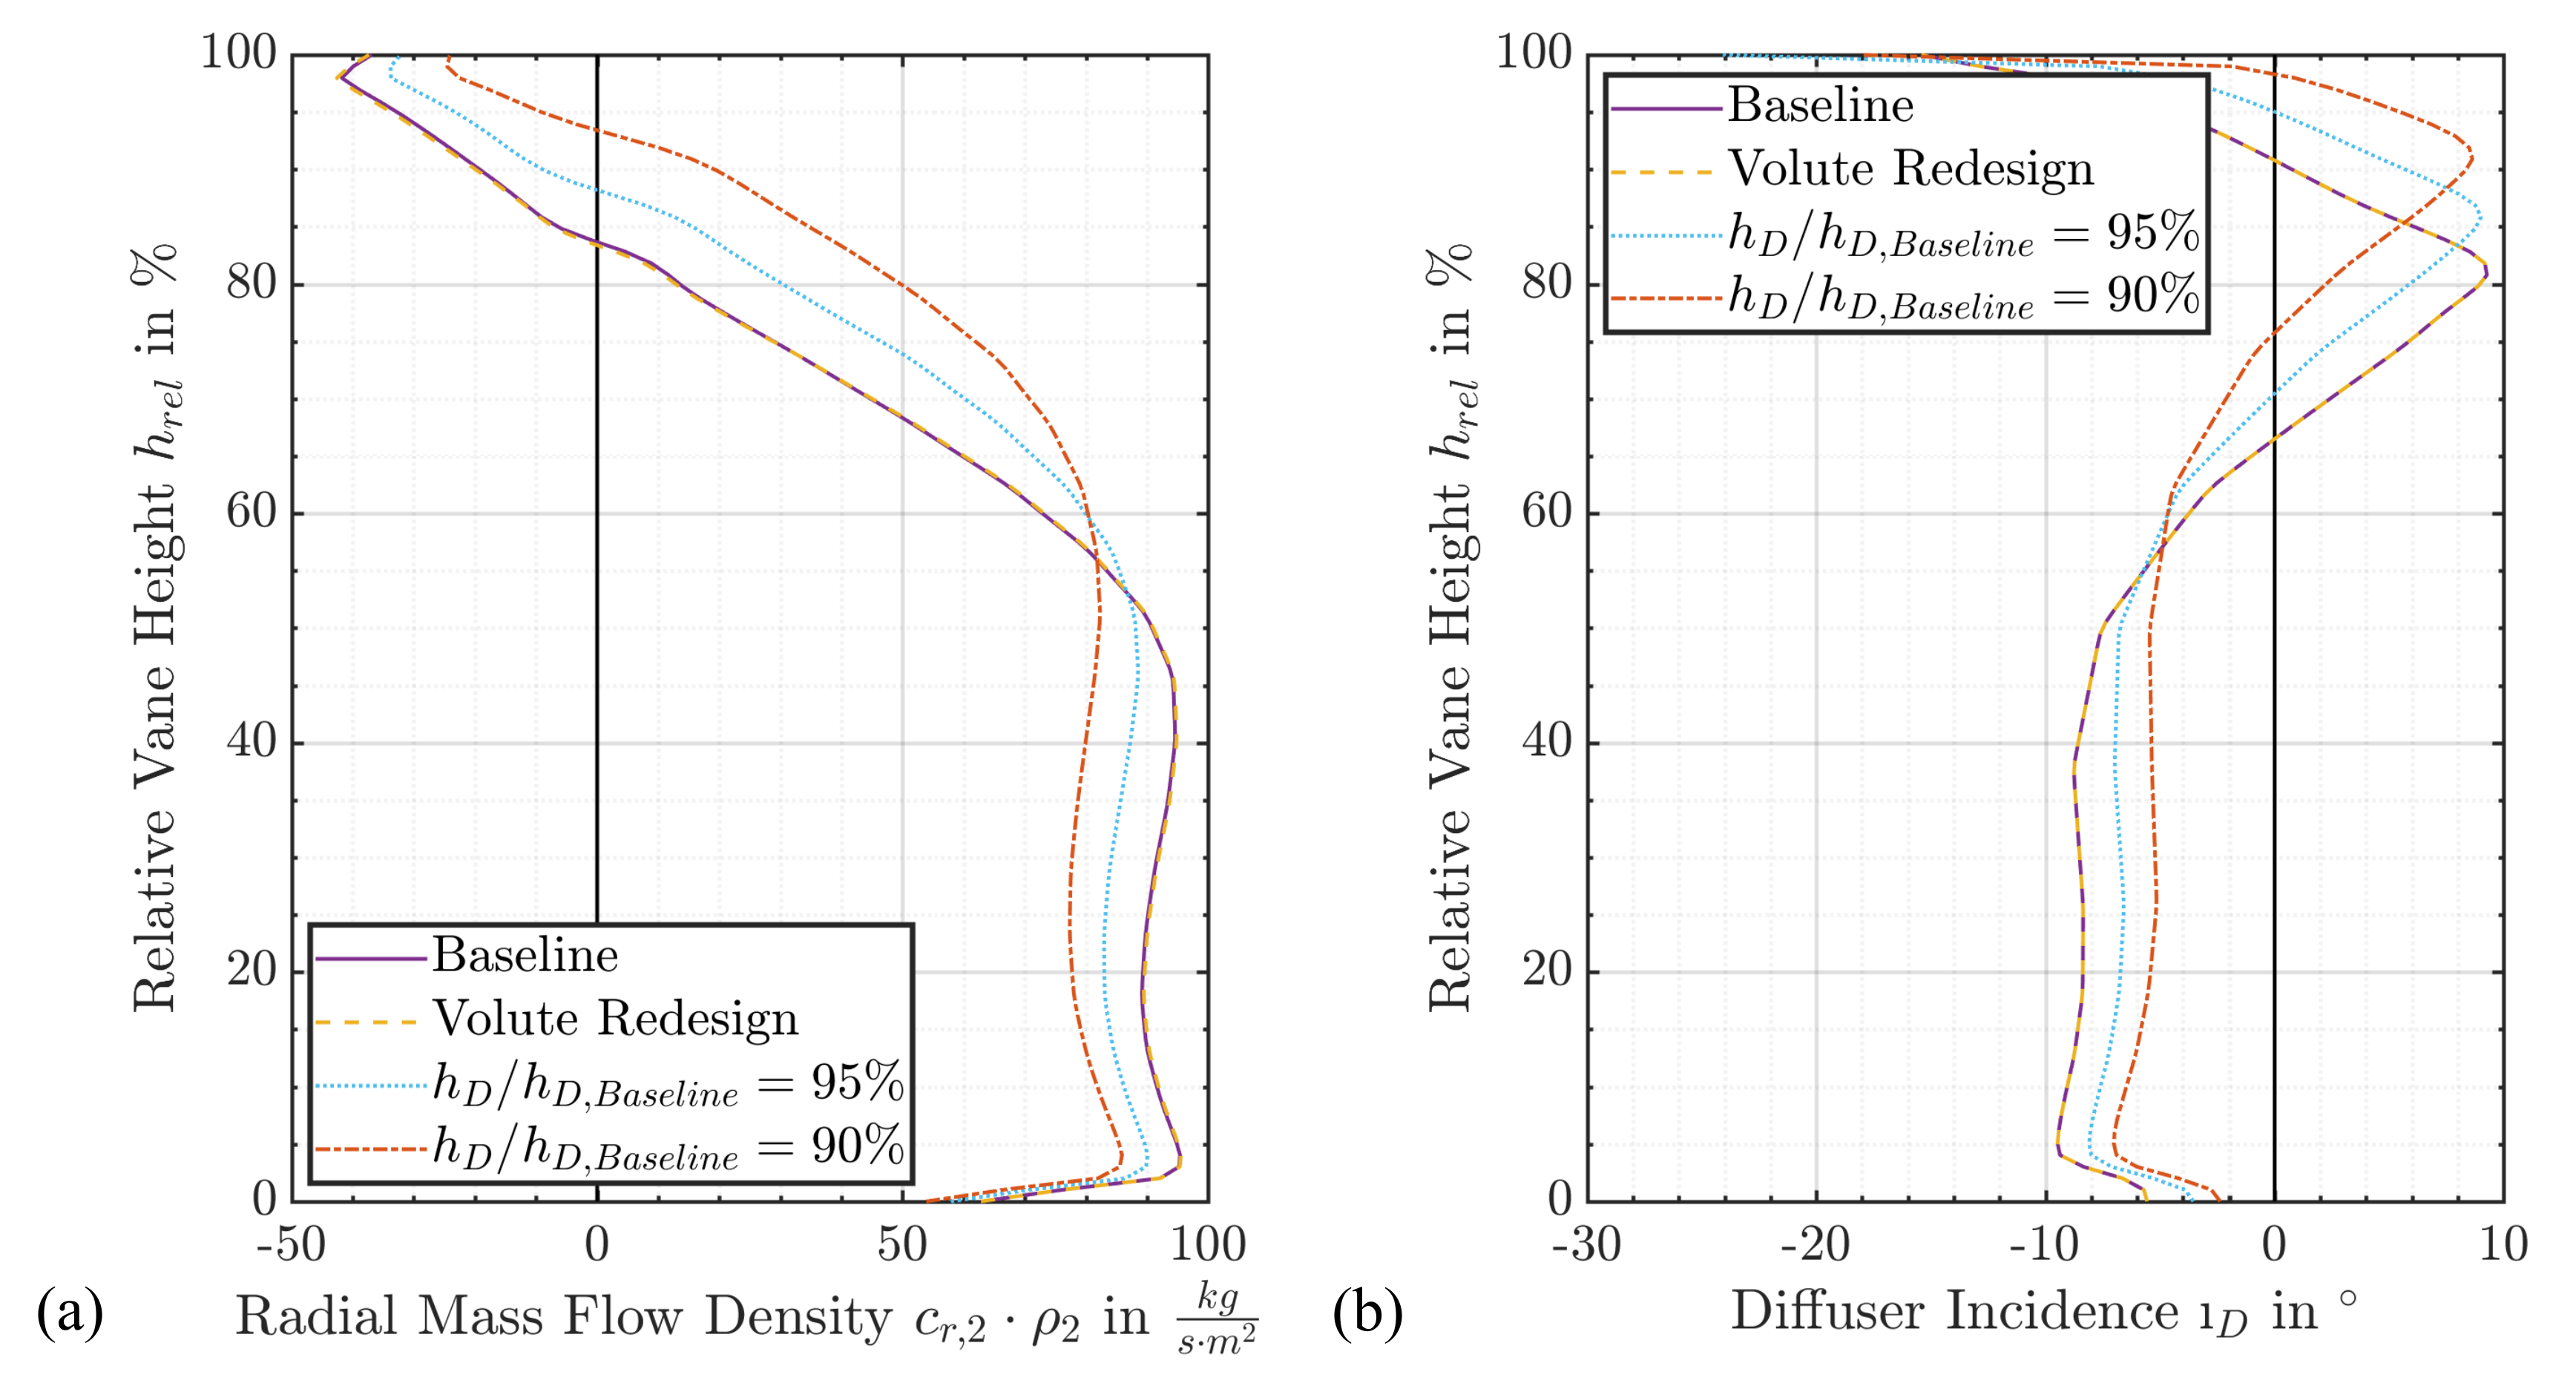
4.1.3. Reduction in the Diffuser Height
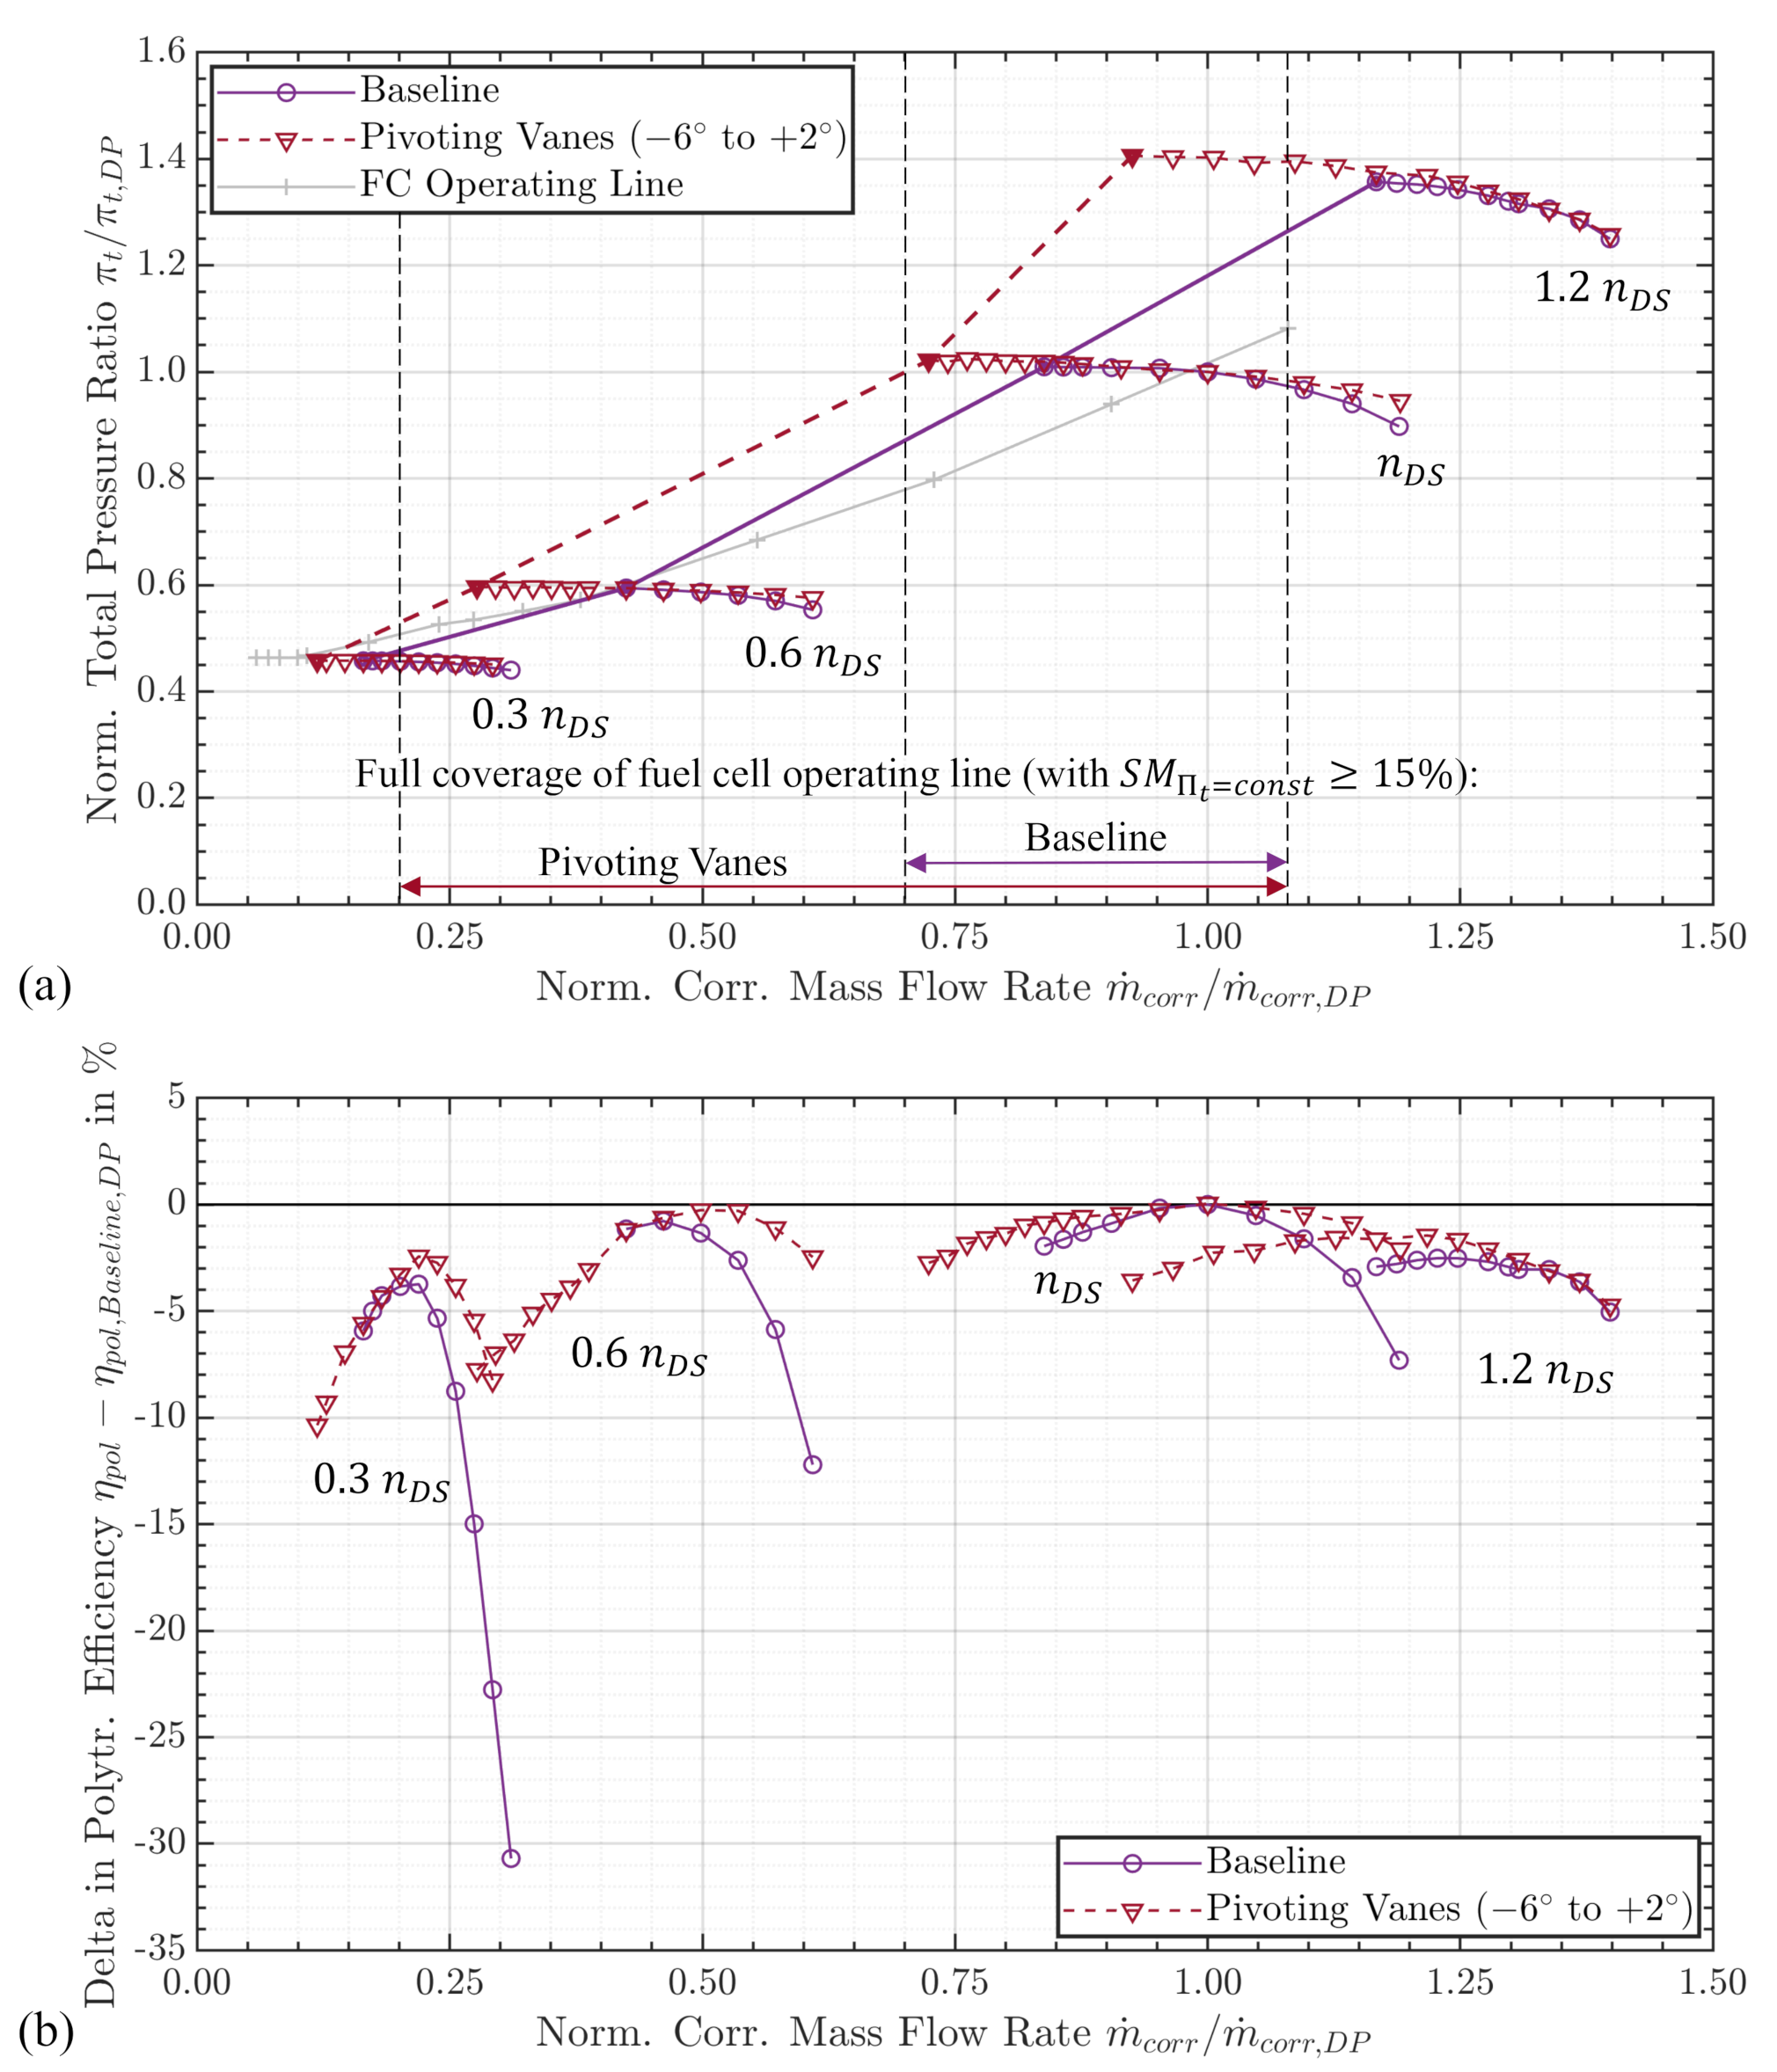
4.1.4. Pivoting Vane Diffuser
4.2. Turbine
4.2.1. Experimental Validation
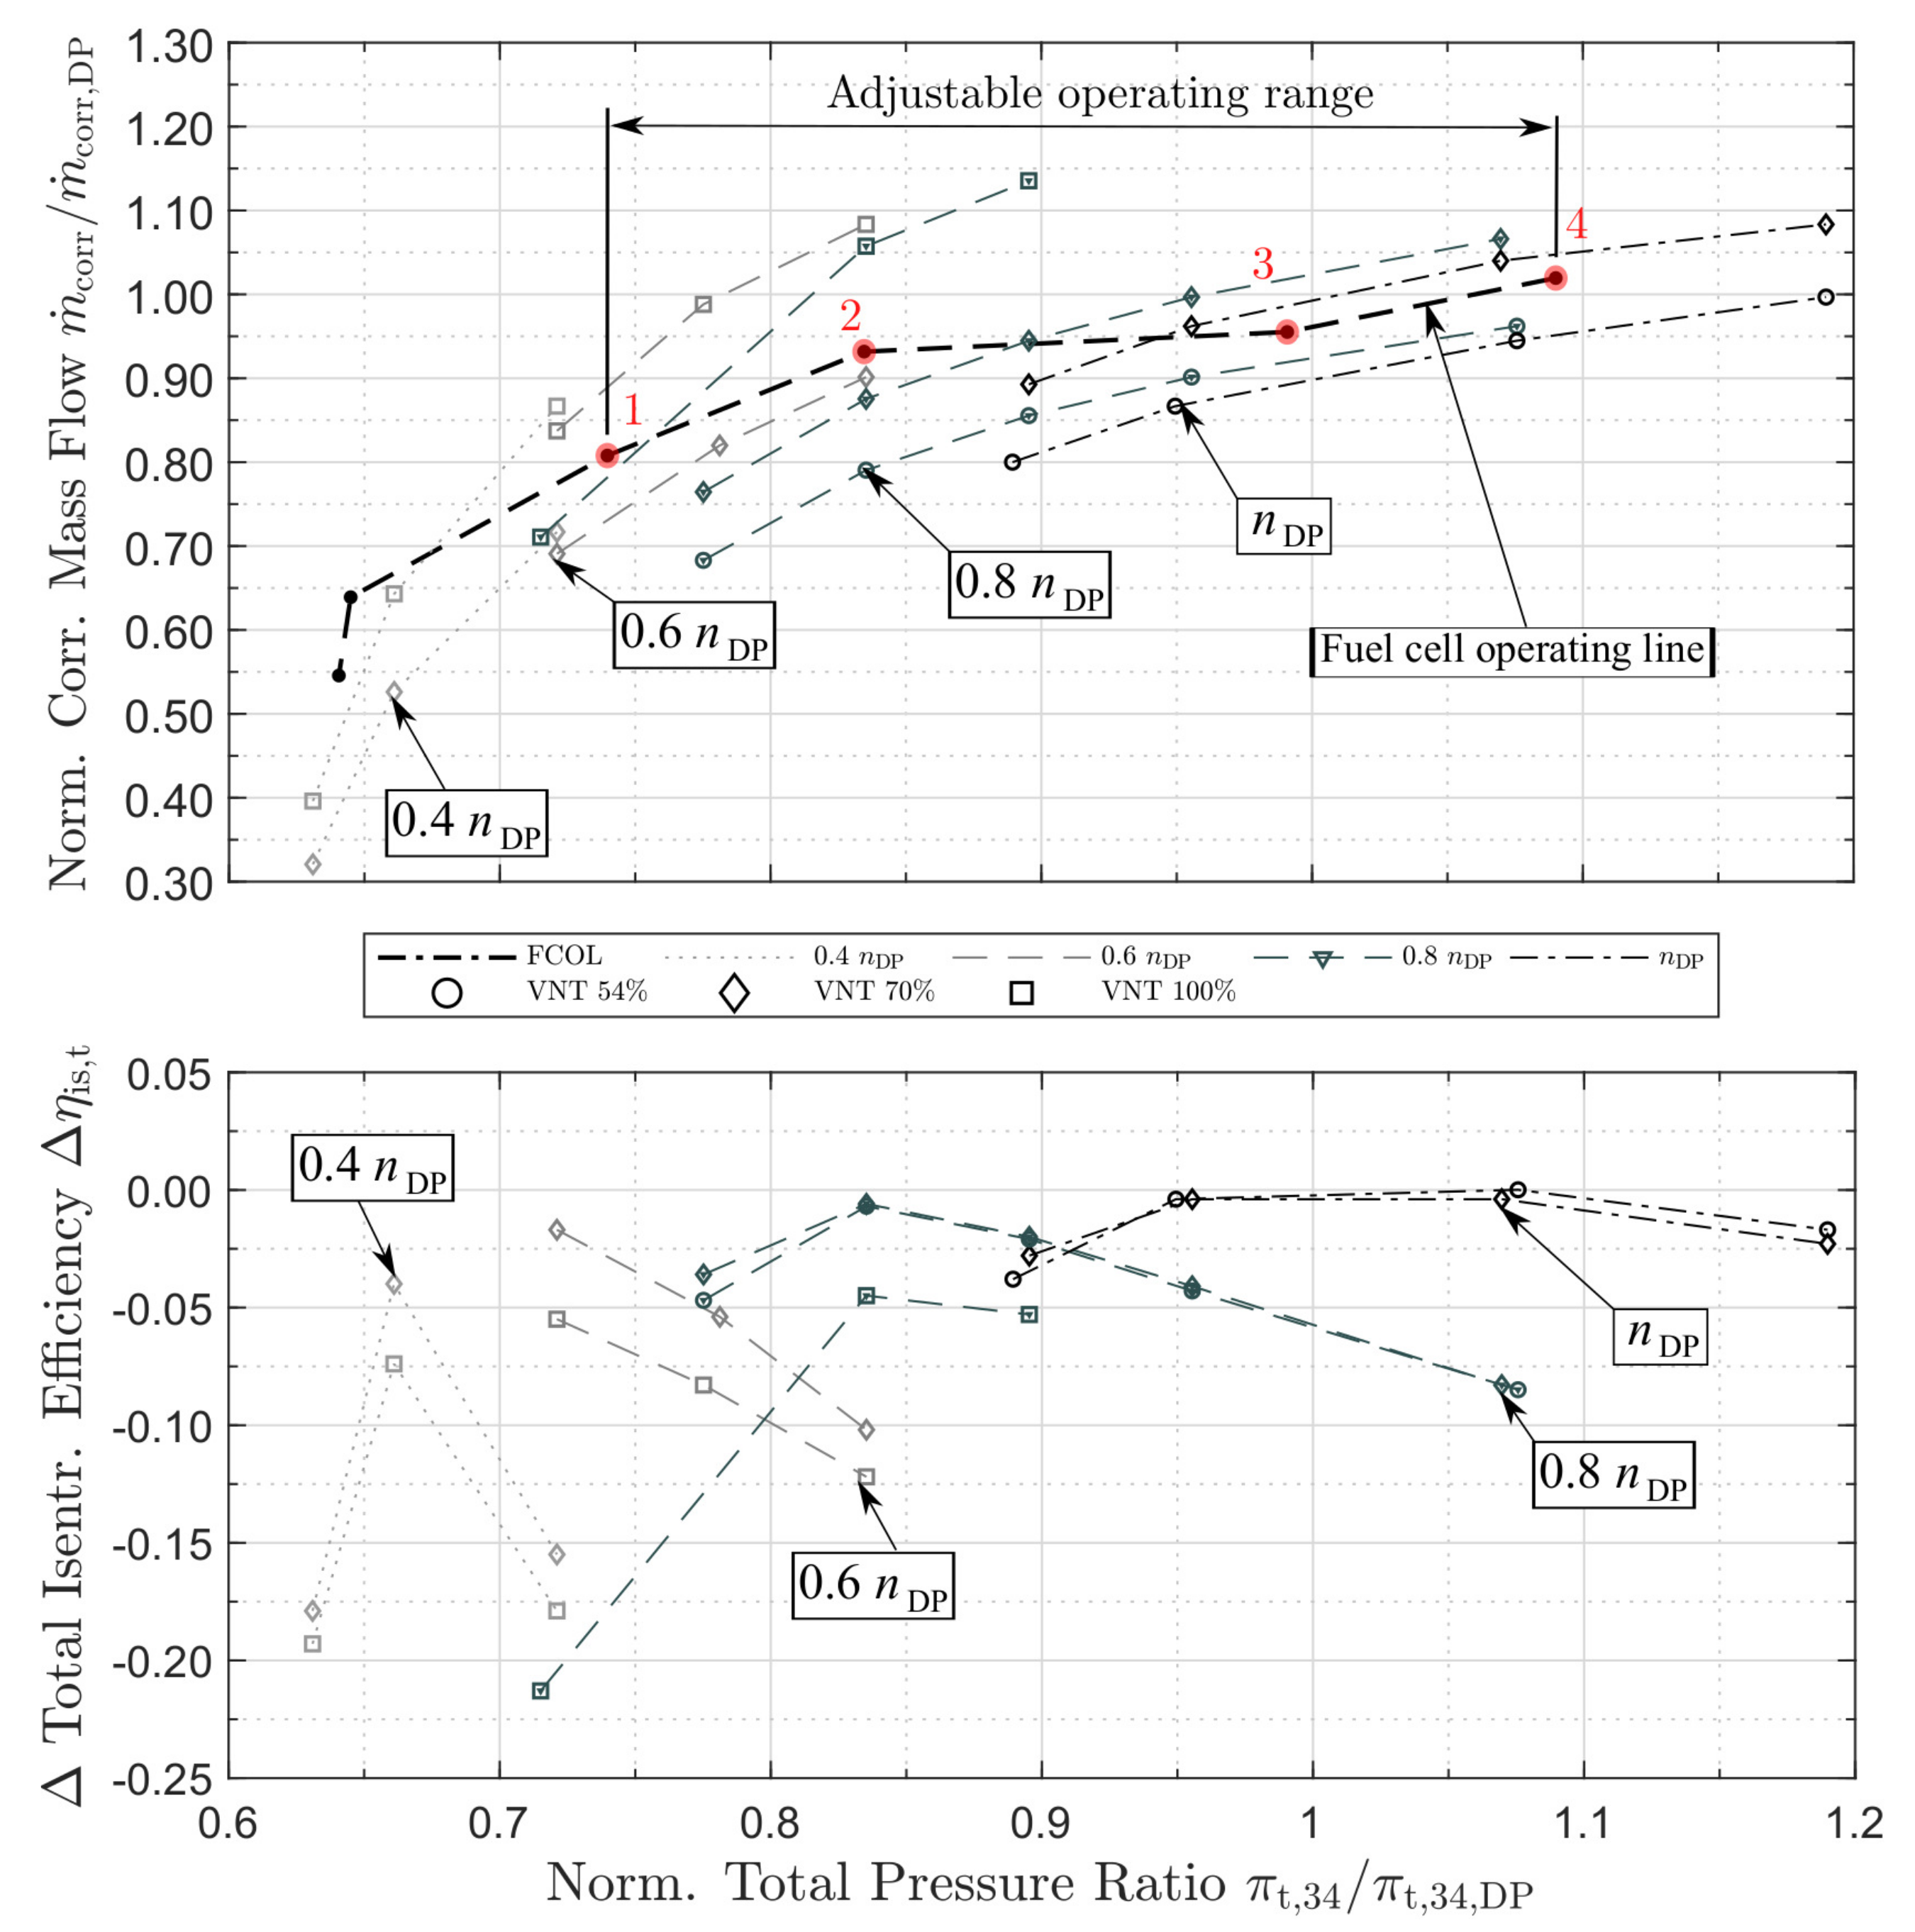
4.2.2. Variable Nozzle Turbine
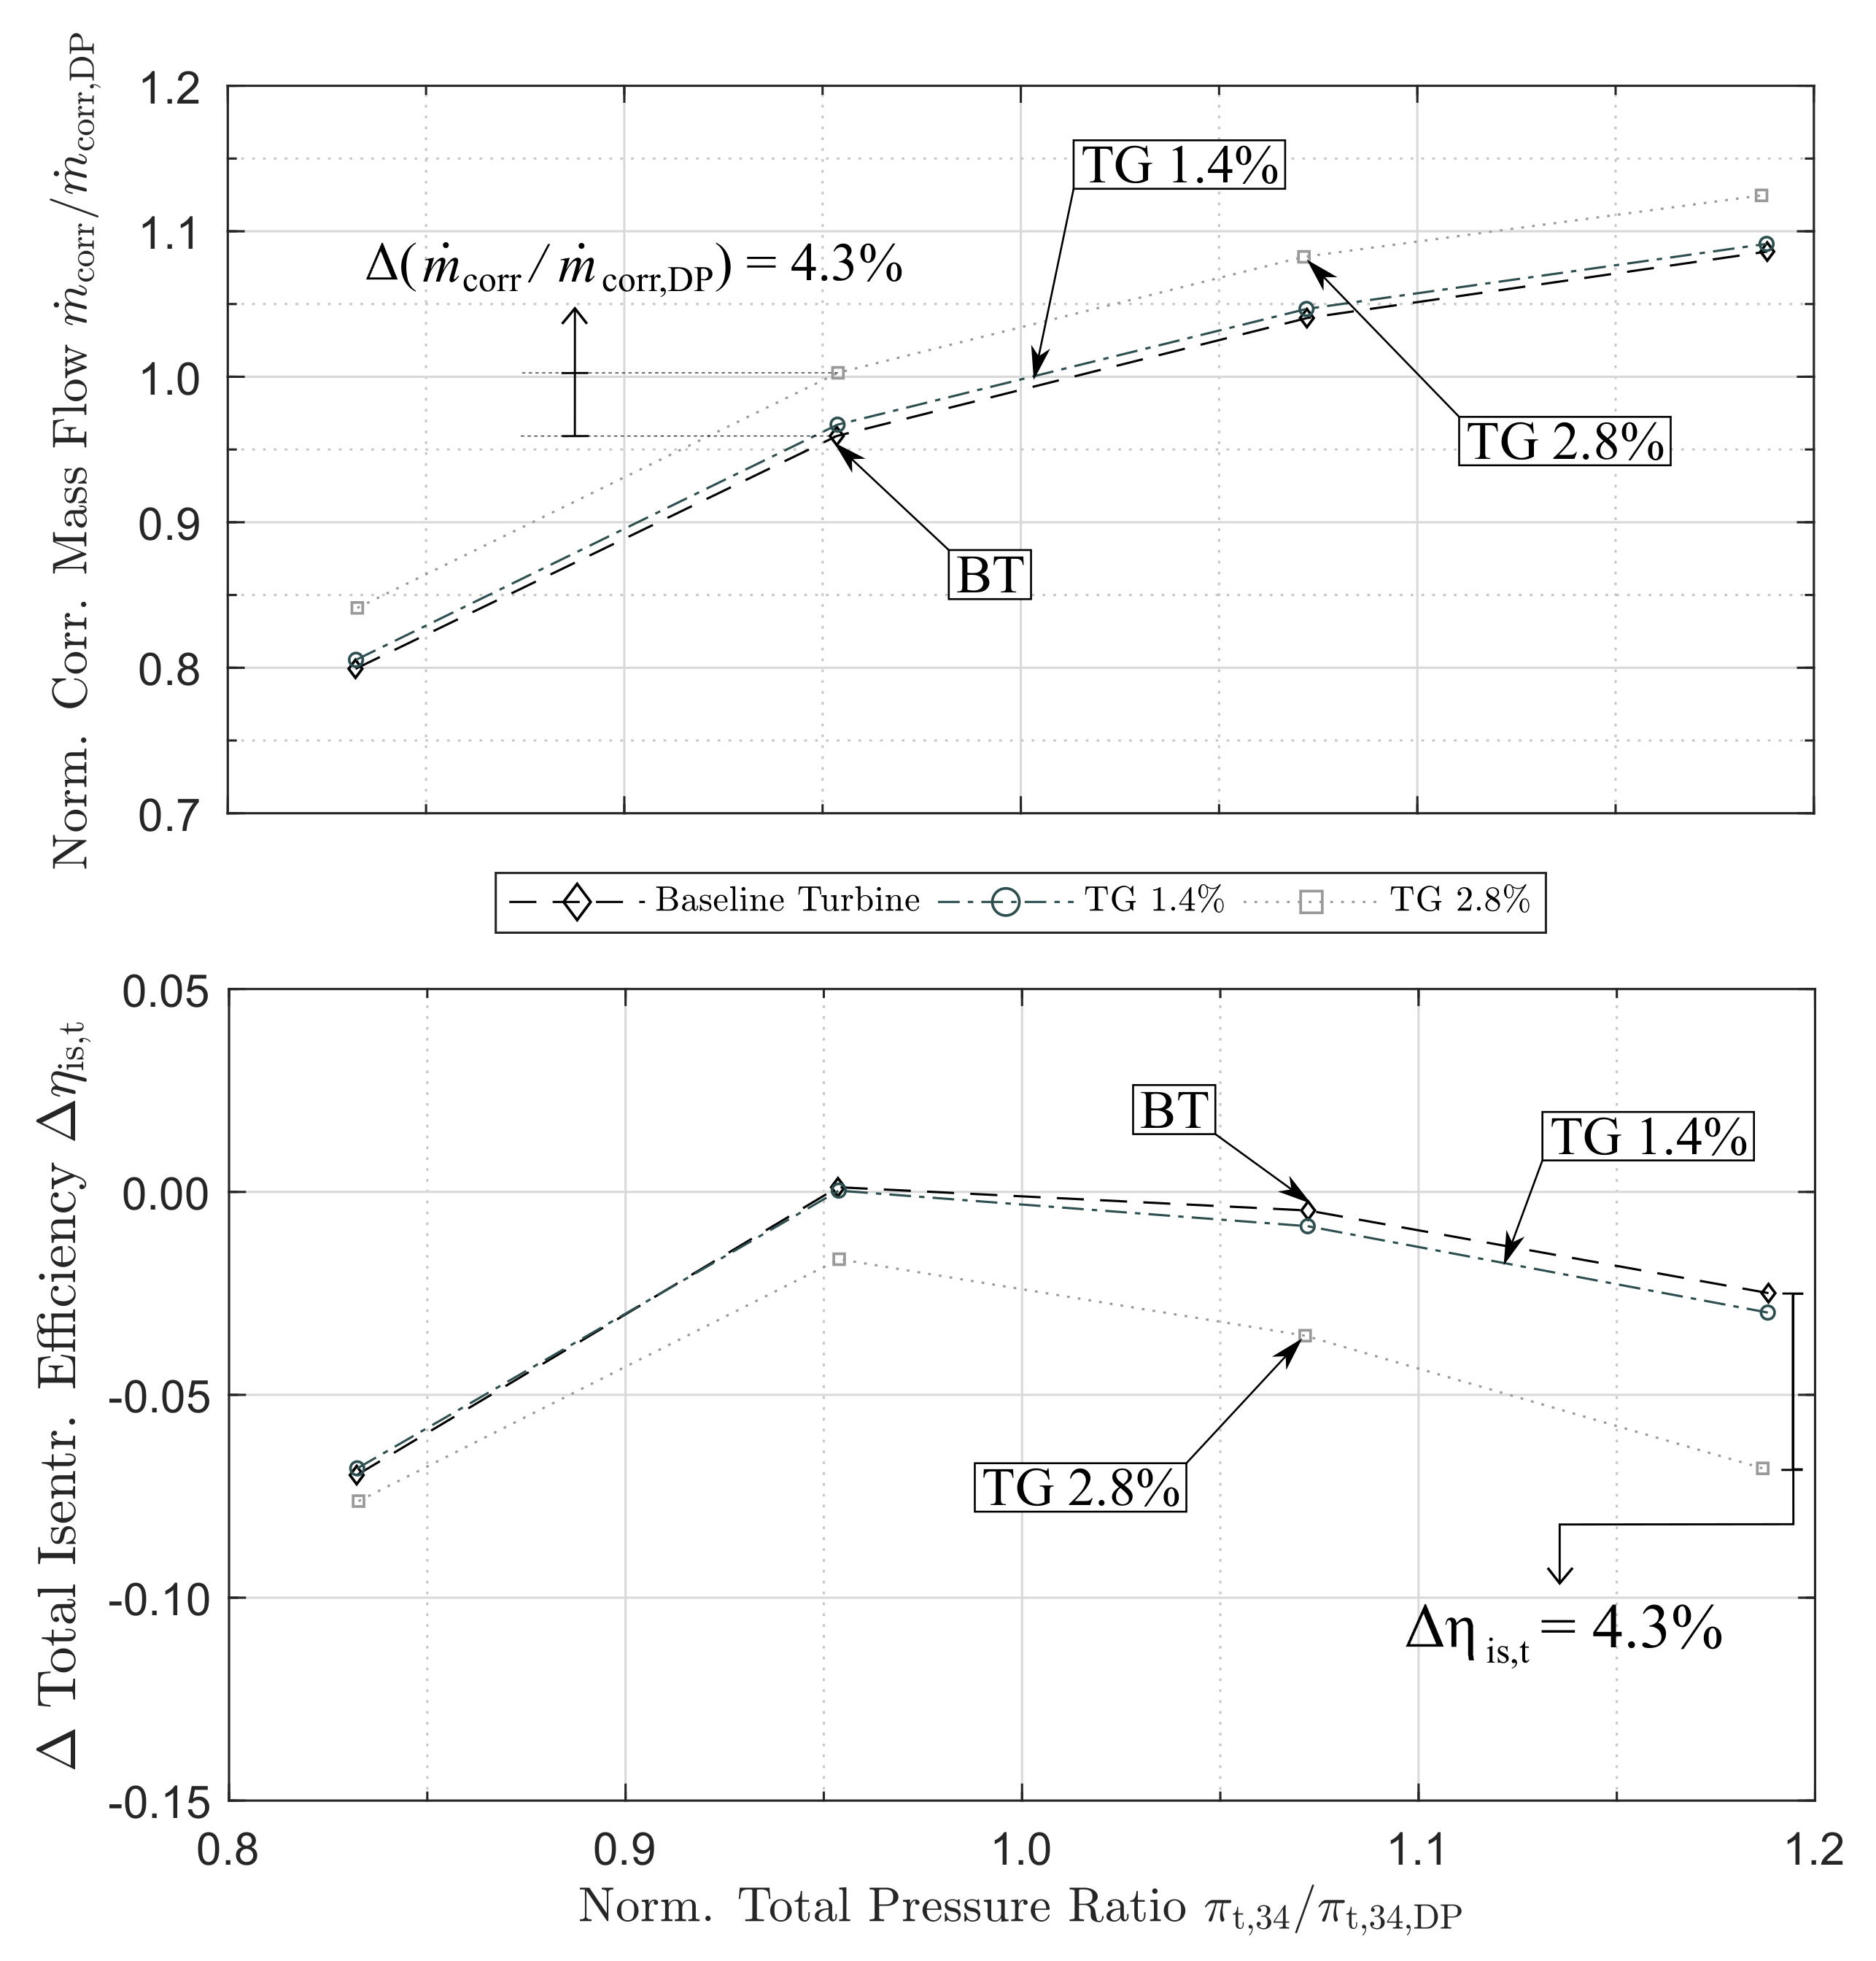
4.2.3. Influences of Tip Gaps
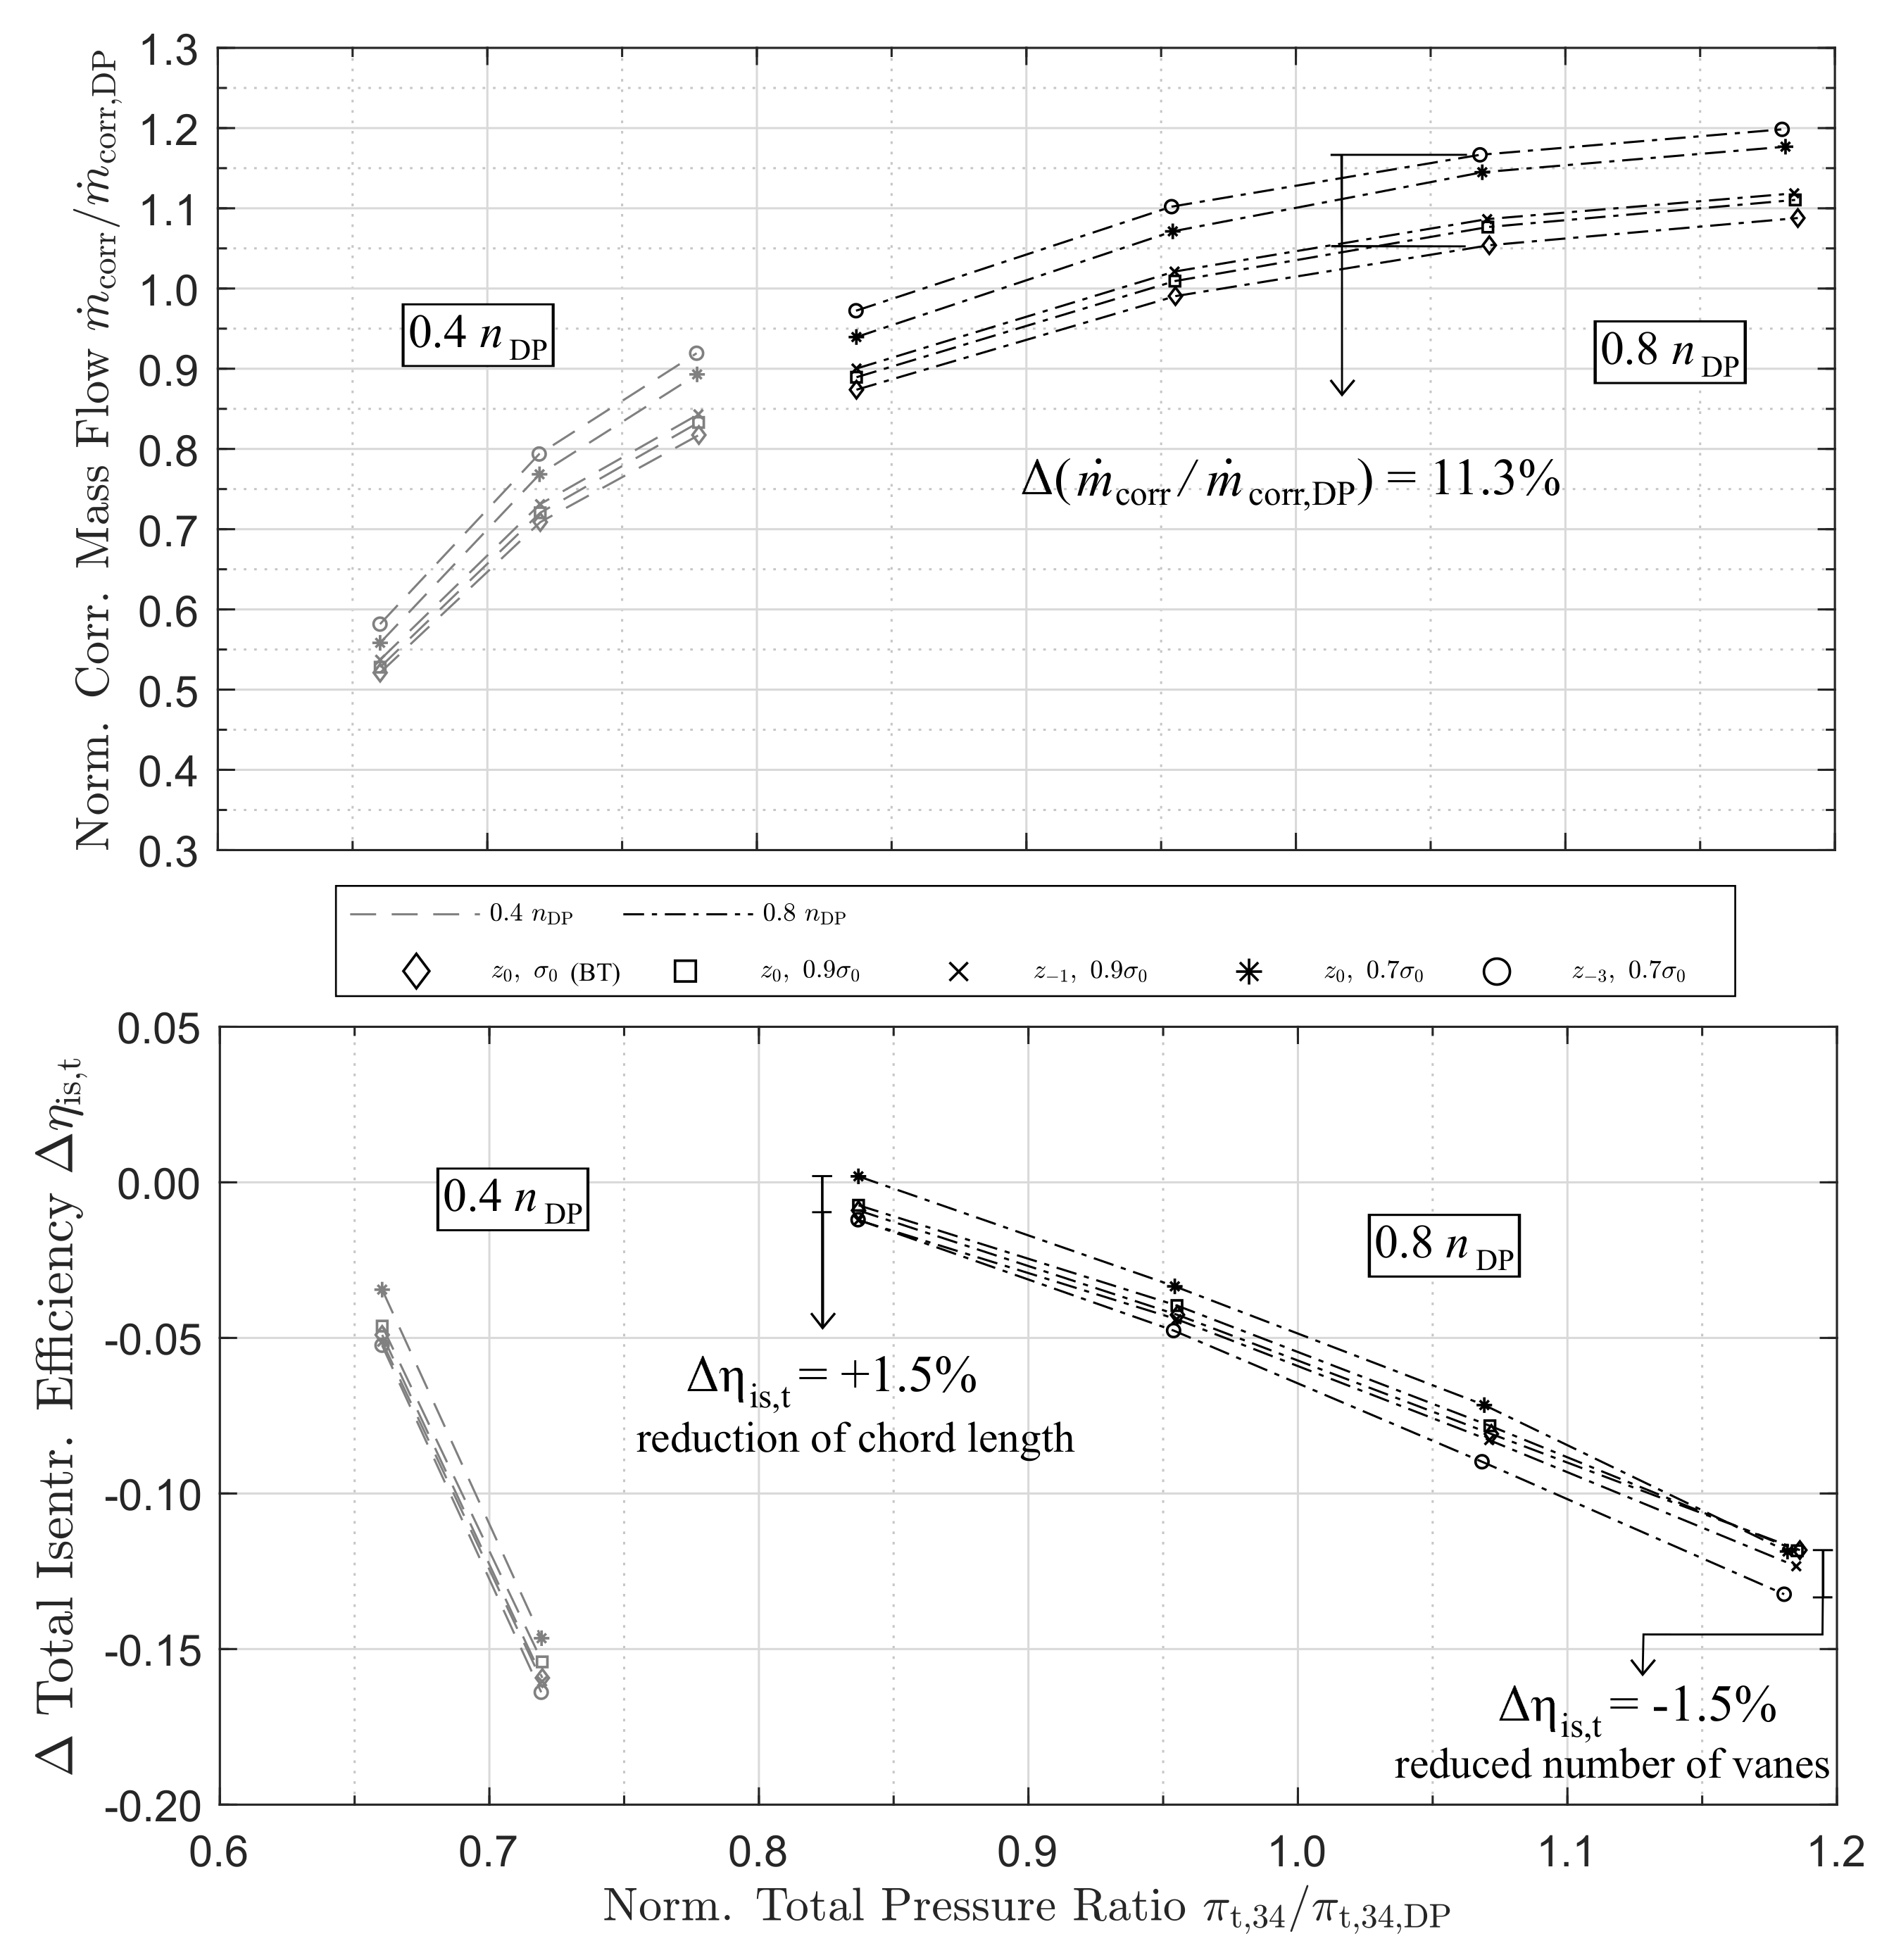
4.2.4. Low Solidity Turbine
5. Conclusions
6. Outlook on Experimental Investigations
Author Contributions
Funding
Institutional Review Board Statement
Informed Consent Statement
Data Availability Statement
Acknowledgments
Conflicts of Interest
Abbreviations
| a | Activity | A | Area |
| c | Chord Length | cr,2 | Radial Flow Velocity At Diffuser Inlet |
| E | Electrode Potential | E0 | Normal Potential |
| F | Faraday Constant | h | Height |
| hrel | Relative Height | i | Incidence |
| corr | Corrected Mass Flow Rate | p | Oxygen Partial Pressure |
| p0 | Standard Pressure | r | Radius |
| R | Universal Gas Constant | s | Pitch |
| SM | Surge Margin | is | Isentropic Efficiency |
| pol | Polytropic Efficiency | Circumferential Angle | |
| t | Total Pressure Ratio | 2 | Density at Diffuser Inlet |
| Solidity | ARIEL | Charging of Fuel Cell Systems through | |
| CFD | Computational Fluid | Interdisciplinary Developed Electrically | |
| Dynamics | Driven Air Compressors | ||
| CI | Confidence Interval | const | Constant |
| D | Diffuser | DC | Direct Current |
| DP | Design Point | DS | Design Speed |
| FC | Fuel Cell | I | Impeller |
| LE | Leading Edge | MDPI | Multidisciplinary Digital Publishing Institute |
| NS | Near Stall | OP | Operating Point |
| PEM | Polymer Electrolyte Membrane | PEMFC | Polymer Electrolyte Membrane Fuel Cell |
| TE | Trailing Edge | VNT | Variable Nozzle Turbine |
References
- Cunningham, J.M.; Hoffman, M.A.; Friedman, D.J. A Comparison of High-Pressure and Low-Pressure Operation of PEM Fuel Cell Systems. SAE Trans. 2001, 110, 464–470. [Google Scholar]
- Kurzweil, P. Brennstoffzellentechnik–Grundlagen, Komponenten, Systeme, Anwendungen, 2nd ed.; Springer: Wiesbaden, Germany, 2013. [Google Scholar]
- Balasubramanian, B.; Barbir, F.; Neutzler, J. Optimal Operating Temperature and Pressure of PEM Fuel Cell Systems in Automotive Applications. In Proceedings of the 218 ACS National Meeting, New Orleans, LA, USA, 22–26 August 1999; Volume 44, pp. 977–981. [Google Scholar]
- Barbir, F. Vehicles with Hydrogen-Air Fuel Cells. Energy Carr. Convers. Syst. 2008, 2, 25–45. [Google Scholar]
- Blunier, B.; Miraoui, A. Air Management in PEM Fuel Cells: State-of-the-Art and Prospectives. In Proceedings of the ACEMP ’07 International Aegean Conference on Electrical Machines and Power Electronics, Bodrum, Turkey, 10–12 September 2007; pp. 245–254. [Google Scholar]
- Filsinger, D.; Kuwata, G.; Ikeya, N. Tailored Centrifugal Turbomachinery for Electric Fuel Cell Turbocharger. Int. J. Rotating Mach. 2021, 2021, 3972387. [Google Scholar] [CrossRef]
- Berning, T.; Djilali, N. Three-dimensional computational analysis of transport phenomena in a PEM fuel cell—A parametric study. J. Power Sources 2003, 124, 440–452. [Google Scholar] [CrossRef]
- Galloway, L.; Rusch, D.; Spence, S.; Vogel, K.; Hunziker, R.; Kim, S.I. An Investigation of Centrifugal Compressor Stability Enhancement Using a Novel Vaned Diffuser Recirculation Technique. ASME J. Turbomach. 2018, 140, 121009. [Google Scholar] [CrossRef]
- Hoeflinger, J.; Hofmann, P. Air mass flow and pressure optimisation of a PEM fuel cell range extender system. Int. J. Hydrogen Energy 2020, 45, 29246–29258. [Google Scholar] [CrossRef]
- Fujisawa, N.; Inui, T.; Ohta, Y. Evolution Process of Diffuser Stall in a Centrifugal Compressor With Vaned Diffuser. ASME J. Turbomach. 2019, 141, 041009. [Google Scholar] [CrossRef]
- Eynon, P.A.; Whitfield, A. Performance of a Turbocharger Compressor with a Range of Low Solidity Vaned Diffusers. SAE Trans. 1998, 107, 1039–1055. [Google Scholar]
- Guandal, S.M.; Govardhan, M. Improvement in Stable Operating Range of a Centrifugal Compressor with Leaned Diffuser Vanes. J. Mech. Sci. Technol. 2019, 33, 5261–5269. [Google Scholar] [CrossRef]
- Ebrahimi, M.; Huang, Q.; He, X.; Zheng, X. Effects of Variable Diffuser Vanes on Performance of a Centrifugal Compressor with Pressure Ratio of 8.0. Energies 2017, 10, 682. [Google Scholar] [CrossRef] [Green Version]
- Wöhr, M.; Müller, M.; Leweux, J. Variable Geometry Compressors for Heavy Duty Truck Engine Turbochargers. ASME J. Eng. Gas Turbines Power 2017, 140, 072701. [Google Scholar] [CrossRef]
- Glahn, C.; Kluin, M.; Hermann, I.; Königstein, A. Anforderungen an das Aufladesystem zukünftiger Ottomotoren. MTZ-Mot. Z. 2017, 78, 16–23. [Google Scholar] [CrossRef]
- Menze, M.; Schödel, M.; Willers, O.; Seume, J.R. Brennstoffzellensysteme im Straßenverkehr als Antriebskonzept für die Mobilität der Zukunft. J. für Mobilität Verkehr 2019, 3, 40–43. [Google Scholar] [CrossRef]
- Schödel, M.; Menze, M.; Seume, J.R. Numerical Investigation of a Centrifugal Compressor with Various Diffuser Geometries for Fuel Cell Applications. In Proceedings of the 14th European Conference on Turbomachinery Fluid dynamics & Thermodynamics, ETC2021-686, Gdansk, Poland, 12–16 April 2021. [Google Scholar]
- Aungier, R.H. Centrifugal Compressors: A Strategy for Aerodynamic Design and Analysis; ASME Press: New York, NY, USA, 2000. [Google Scholar]
- Menze, M.; Schödel, M.; Seume, J.R. Numerical investigation of a radial turbine with variable nozzle geometry for fuel cell systems in automotive applications. In Proceedings of the 14th European Conference on Turbomachinery Fluid dynamics & Thermodynamics, ETC2021-748, Gdansk, Poland, 12–16 April 2021. [Google Scholar]
- Menter, F.R. Zonal Two Equation k-ω Turbulence Models for Aerodynamic Flows. In Proceedings of the AIAA Fluid Dynamics Conference, AIAA 93-2906, Orlando, FL, USA, 6–9 July 1993. [Google Scholar]
- Wilcox, D.C. Reassessment of the Scale-Determining Equation for Advanced Turbulence Models. AIAA J. 1988, 26, 1299–1310. [Google Scholar] [CrossRef]


| Operating Point | VNT Area in % | ||||
|---|---|---|---|---|---|
| 1 | 0.740 | 0.808 | ∼98 | −0.12 | |
| 2 | 0.835 | 0.932 | ∼85 | −0.03 | |
| 3 | 0.991 | 0.955 | ∼65 | −0.01 | |
| 4 | 1.090 | 1.019 | ∼65 | 0 |
Publisher’s Note: MDPI stays neutral with regard to jurisdictional claims in published maps and institutional affiliations. |
© 2021 by the authors. Licensee MDPI, Basel, Switzerland. This article is an open access article distributed under the terms and conditions of the Creative Commons Attribution (CC BY) license (https://creativecommons.org/licenses/by/4.0/).
Share and Cite
Schoedel, M.; Menze, M.; Seume, J.R. Experimentally Validated Extension of the Operating Range of an Electrically Driven Turbocharger for Fuel Cell Applications. Machines 2021, 9, 331. https://doi.org/10.3390/machines9120331
Schoedel M, Menze M, Seume JR. Experimentally Validated Extension of the Operating Range of an Electrically Driven Turbocharger for Fuel Cell Applications. Machines. 2021; 9(12):331. https://doi.org/10.3390/machines9120331
Chicago/Turabian StyleSchoedel, Markus, Marco Menze, and Joerg R. Seume. 2021. "Experimentally Validated Extension of the Operating Range of an Electrically Driven Turbocharger for Fuel Cell Applications" Machines 9, no. 12: 331. https://doi.org/10.3390/machines9120331
APA StyleSchoedel, M., Menze, M., & Seume, J. R. (2021). Experimentally Validated Extension of the Operating Range of an Electrically Driven Turbocharger for Fuel Cell Applications. Machines, 9(12), 331. https://doi.org/10.3390/machines9120331