Article

Bayesian Optimization Design of Inlet Volute for Supercritical Carbon Dioxide Radial-Flow Turbine

1
School of Energy and Power Engineering, Dalian University of Technology, Dalian 116024, China
2
China Shipping Co. 704th Reserch Institude, Shanghai 200031, China
*
Author to whom correspondence should be addressed.
These authors contributed equally to this work.
Machines 2021, 9(10), 218; https://doi.org/10.3390/machines9100218
Submission received: 30 July 2021 / Revised: 9 September 2021 / Accepted: 23 September 2021 / Published: 28 September 2021
(This article belongs to the Special Issue Emerging Techniques and Their Application in Turbomachinery)

Abstract

:
The radial-flow turbine, a key component of the supercritical CO2 (S-CO2) Brayton cycle, has a significant impact on the cycle efficiency. The inlet volute is an important flow component that introduces working fluid into the centripetal turbine. In-depth research on it will help improve the performance of the turbine and the entire cycle. This article aims to improve the volute flow capacity by optimizing the cross-sectional geometry of the volute, thereby improving the volute performance, both at design and non-design points. The Gaussian process surrogate model based parameter sensitivity analysis is first conducted, and then the optimization process is implemented by Bayesian optimization (BO) wherein the acquisition function is used to query optimal design. The results show that the optimized volute has better and more uniform flow characteristics at design and non-design points. It has a smoother off-design conditions performance curve. The total pressure loss coefficient at the design point of the optimized volute is reduced by 33.26%, and the flow deformation is reduced by 54.55%.

1. Introduction

With the increasing demand for clean and efficient use of energy, it has become difficult to further enhance the thermal system with water vapor as the work substance to meet people’s needs, as the components of this thermal system are extensively investigated and used to a high design level. In recent years, the supercritical CO 2 ( S - CO 2 ) Brayton cycle has gained widespread attention due to its high cycle thermal efficiency, compact structure, and environmental friendliness [1,2,3].
The radial-inflow turbine is a key component of the S - CO 2 Brayton cycle, which affects the efficiency of the entire cycle, and is suitable for operating conditions where the mechanical power of the turbine is less than 30 MW [4]. At present, the research on S - CO 2 radial-flow turbine is mainly focused on the nozzle and impeller, but the research on inlet volute is rarely reported. However, the inlet volute, as the infusion and acceleration component of the radial-flow turbine, not only affects its internal flow and loss but also has an important impact on the performance of the whole machine. Therefore, the optimization design of the inlet volute is necessary.
For the conventional volutes, Simpson et al. [5] demonstrated the feasibility of using the CFD method to analyze inlet volute by comparing numerical calculation results with experimental data. Suhrmann et al. [6] found that the combination of small volute angle and volute radius can effectively reduce the losses in the volute but increasing the amplitude of the static pressure pulsation at the volute exit. Lee et al. [7] found that the secondary flow inside the volute significantly changes the distribution of the outlet airflow angle. Yang et al. [8] obtained a new cross-sectional shape of the volute by changing its aspect ratio, which makes the radial flow channel cross-section more gentle, weakening the secondary flow development inside the volute and reducing the internal losses. Samuel et al. [9] investigated the effect of different volute aspect ratios on the performance of mixed-flow radial turbines. Lee et al. [10] introduced the concept of the inclined volute and found that compared to the ordinary inlet volute, the inclined volute can effectively improve the efficiency of radial flow turbine under steady-state and pulsating flow conditions. Huang et al. [11] used the response surface method to robustly optimize the cross-sectional shape of the volute, which improves the internal flow performance of the volute.
Note that the above studies are focused on incompressible fluids. There are a few research works on the volutes with real gases such as high-density, high specific heat capacity S - CO 2 as the working fluid. Currently, Du et al. [12] take the design of S - CO 2 centripetal compressor as the background to optimize the volute by the orthogonal design test method. Zhu et al. [13] studied the interaction between the geometry and performance of the S - CO 2 radial-inflow turbine vaneless inlet volute and found that the radial dimension of the vaneless volute turbine obtained in the final design is significantly reduced under the condition of meeting the total efficiency of the design point. However, there is still very little research on the radial-flow turbine inlet volute with S - CO 2 as the working fluid. The special thermophysical properties of S - CO 2 will cause differences in the design and research process, and further research is necessary.
In this paper, the surrogate-based sensitivity analysis as well as the Bayesian optimization (BO) method is used to optimize the cross-sectional shape of the radial-inflow turbine inlet volute. Furthermore, the surrogate-based optimization analysis method [14,15] has been increasingly used in the optimal design of turbomachinery components because of its cheapness and efficiency. The optimal volute cross-section shape with the global spread angle 24.25°, the corner radius factor 200 mm, and the outlet size factor 300 mm is determined by BO, and then the variation of the flow energy inside the optimized vortex shell, including the design and non-design points, is investigated. The results show that the optimized volute cross-section shape has less internal losses and more uniform outlet flow field than the original volute and can operate well under a wider range of operating conditions.
The remainder of the article is organized as follows. Section 2 gives a brief introduction of the volute design method. Thereafter, Section 3 introduces the three-dimensional simulation model of the volute, followed by the Bayesian optimization framework in Section 4. Section 5 provides an in-depth analysis and discussion of the optimized results. Finally, Section 6 offers the conclusion.

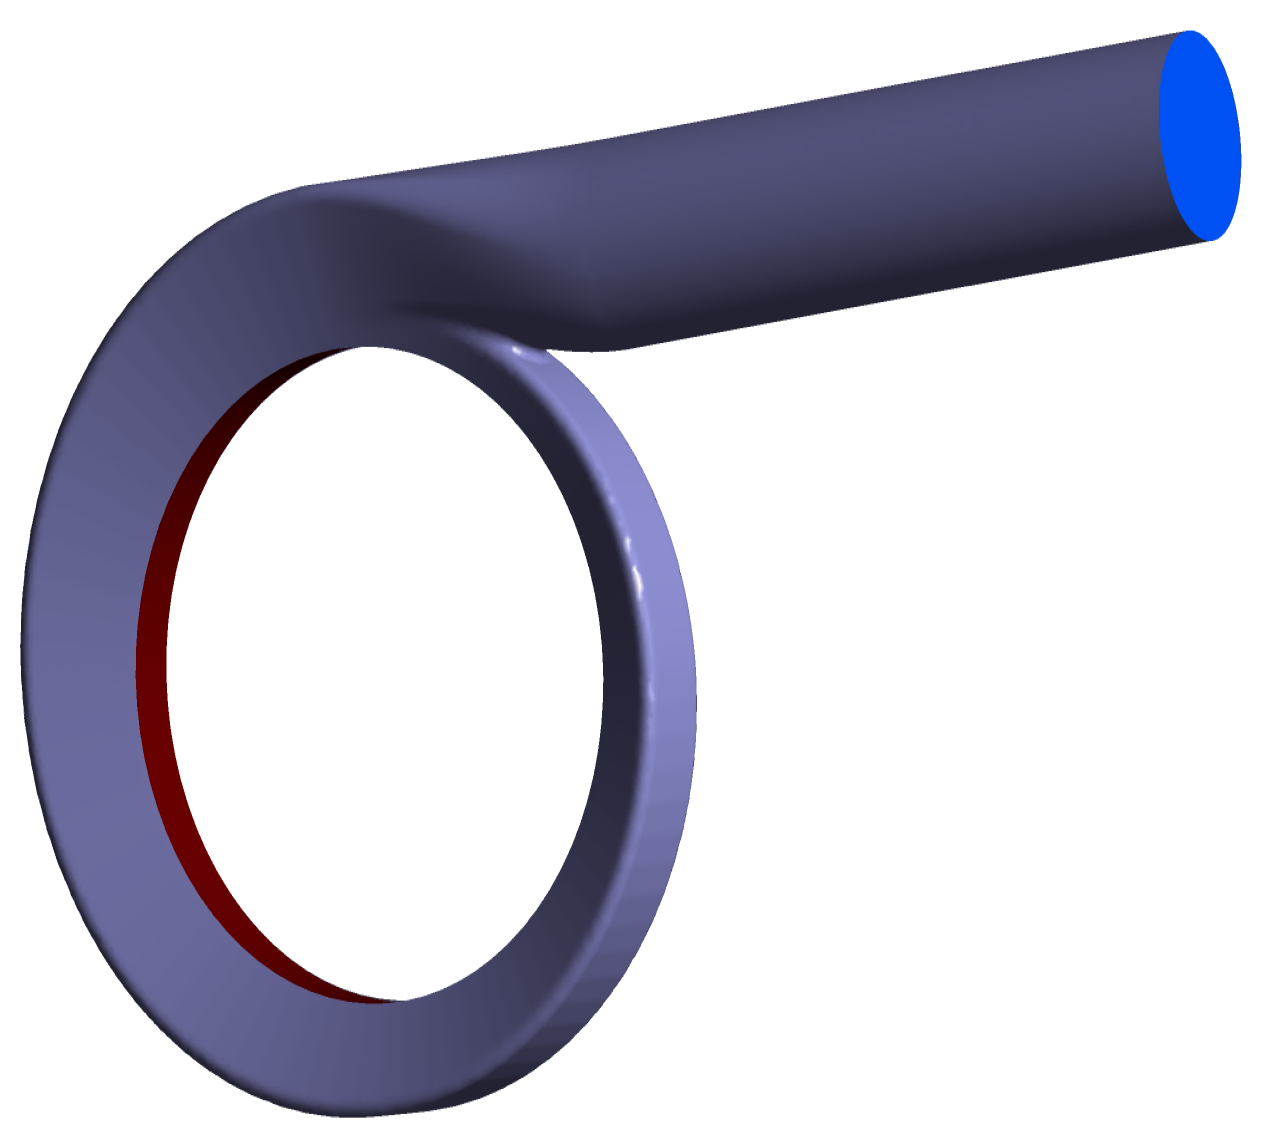
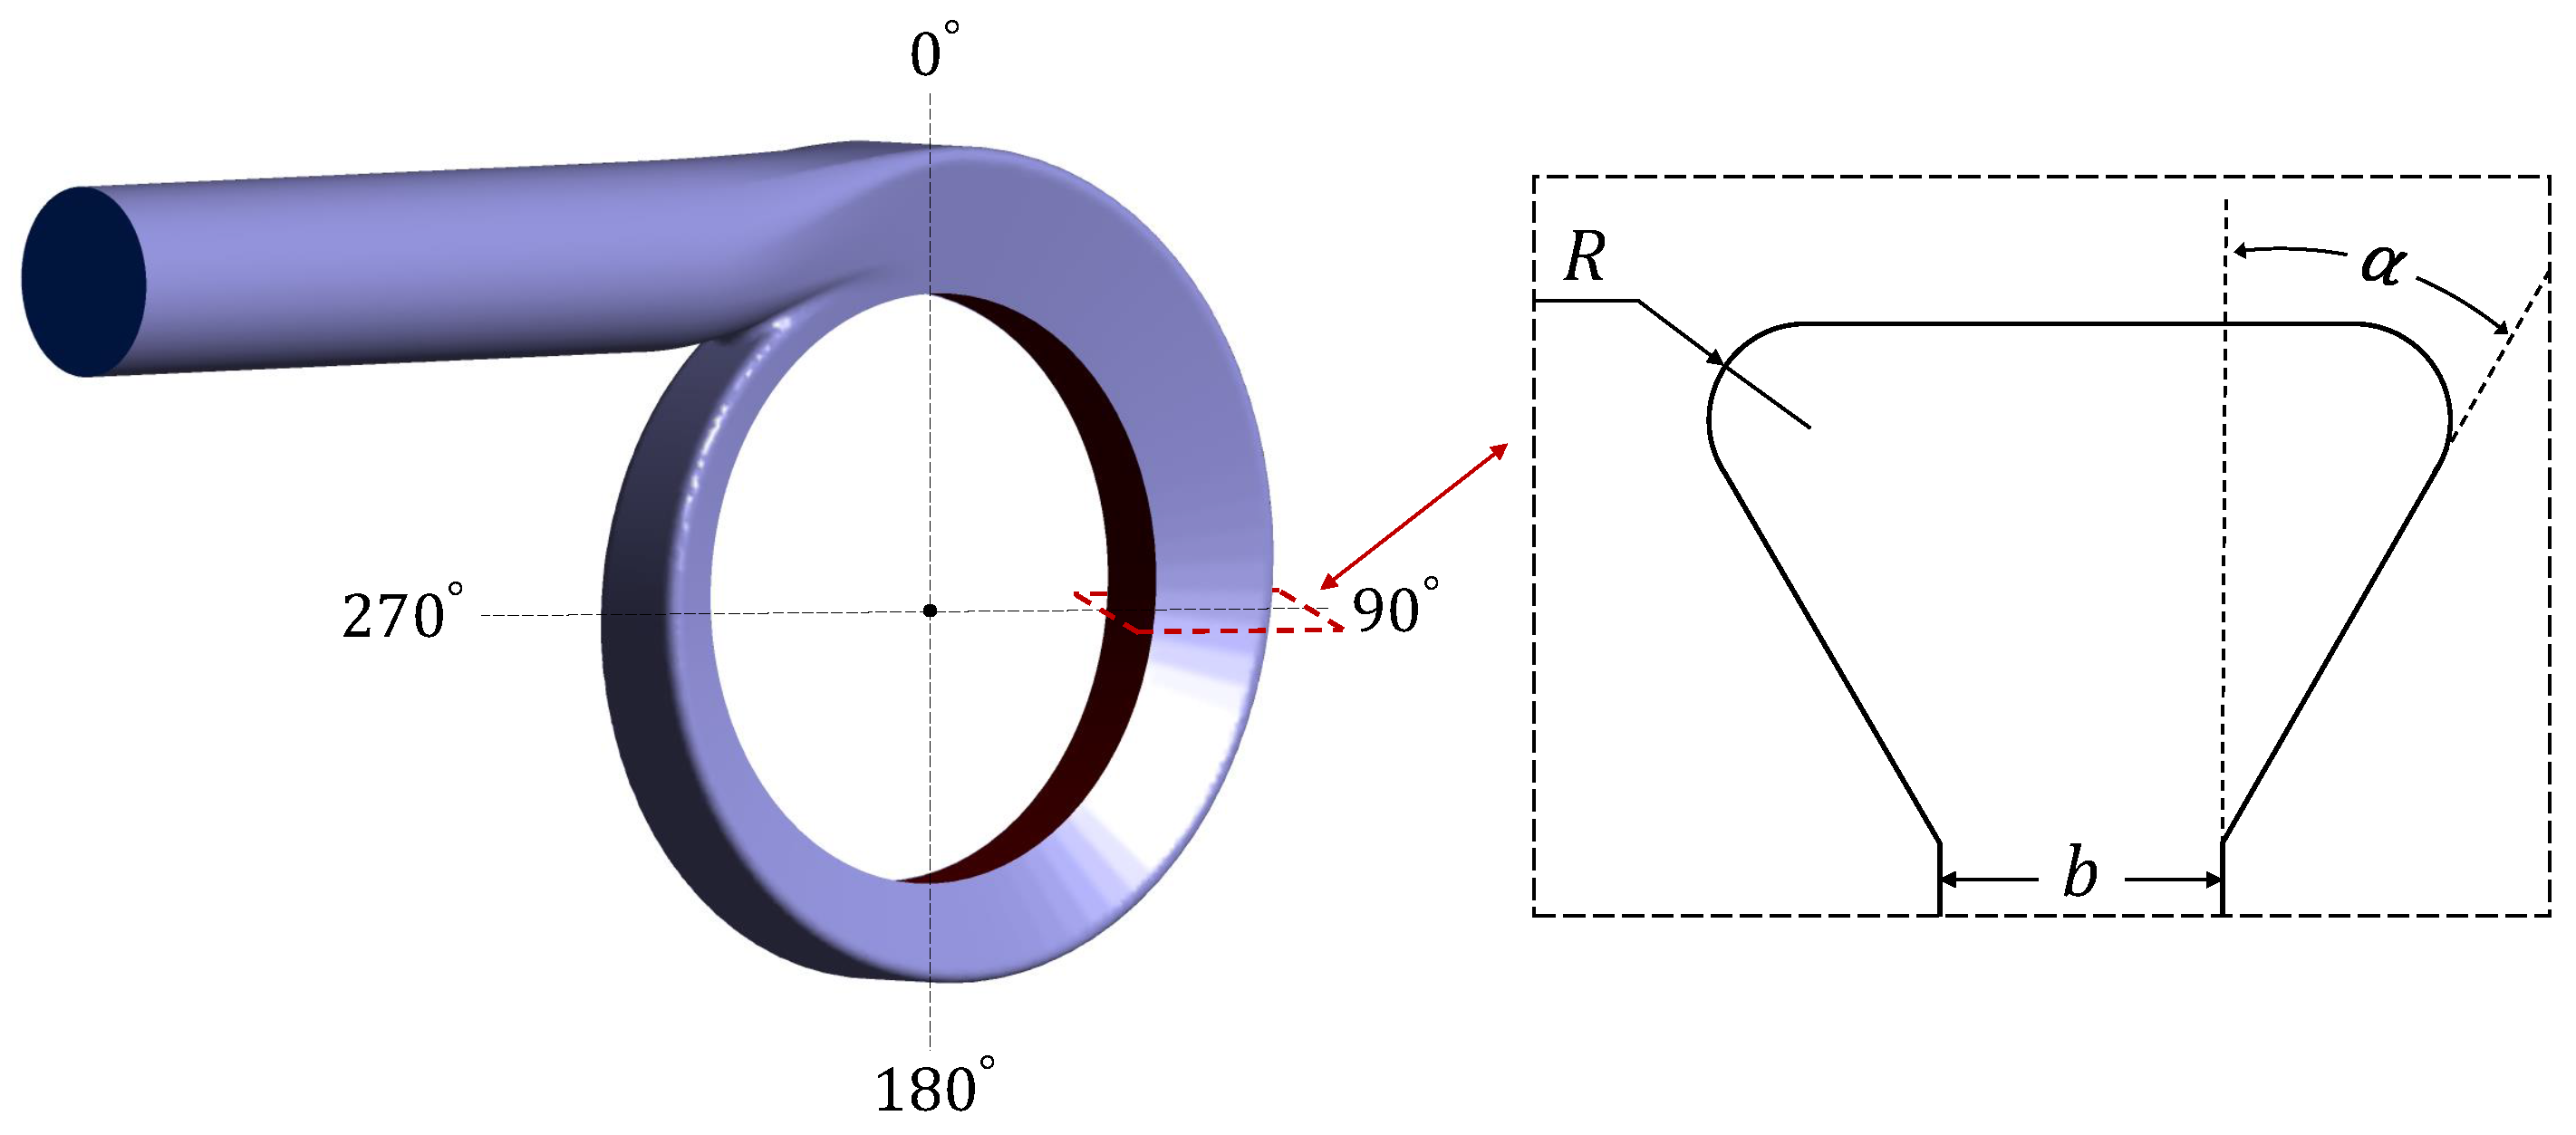
2. Volute Design Method

For the design of the inlet volute, a one-dimensional design method based on the equal-circulation theory [16] is usually adopted, which assumes that the complex three-dimensional viscous flow inside the volute is frictionless free flow and its momentum is constant:
c u θ R θ φ = c u 1 R 1 = const ,
where c u is circumferential speed, θ is the circumferential azimuth angle of the inlet volute, φ represents the speed loss coefficient, the subscript one indicates the exit of the volute, and R is the volute radius. The following relationship exists between the mass flow rate Q m θ and the azimuthal angle θ :
Q m θ = Q m ( θ m a x θ ) θ m a x ,
where Q m represents the inlet flow rate of the volute, and θ m a x represents the maximum azimuth angle of the volute. Thereafter, four additional relations are obtained based on the continuity equation:
Q m = c r 1 ρ 1 A 1 ,
A 1 = 2 π R 1 L Γ ,
Q m θ = c u θ ρ θ A θ ,
tan α θ = c u θ c r θ ,
where A denotes the cross-sectional area, L is the exit height of the volute, Γ denotes the partial air inlet degree, and α θ represents the airflow angle corresponding to the azimuth θ section. Finally, the relationship between the cross-sectional area and the radius can be obtained:
A θ R θ = 2 π L Γ φ ρ 1 ρ θ 1 tan α 1 ( θ m a x θ ) θ m a x .
However, the one-dimensional design method for volute is limited by the lack of a conditional equation to obtain the specific density variation of each runner section in the volute. To design a volute with better performance, many researchers have conducted in-depth work volute design methods. Chen et al. [17] proposed different two-dimensional design methods considering the variation of density inside the volute. Owarish et al. [18] considered the influence of the volute cross-sectional shape and cut the volute into several small pieces along the flow path, thereby developing a two-dimensional design for the volute geometry. Nevertheless, Ayder et al. [19,20] showed that the flow inside the volute is a complex three-dimensional viscous flow with vortexes, resulting in secondary flow and uneven cross-sectional pressure distribution in the volute, causing flow losses. Therefore, neither one-dimensional nor two-dimensional models can accurately predict the flow of the volute, and the three-dimensional CFD technology is widely used in the performance prediction of the volute.
In this paper, a three-dimensional model of the inlet volute shown in Figure 1 is used to study the effect of changing the cross-sectional geometry on the performance of the volute. Note that the model has extended upstream to make the inlet boundary conditions as accurate as possible and improve the convergence of the computational process.

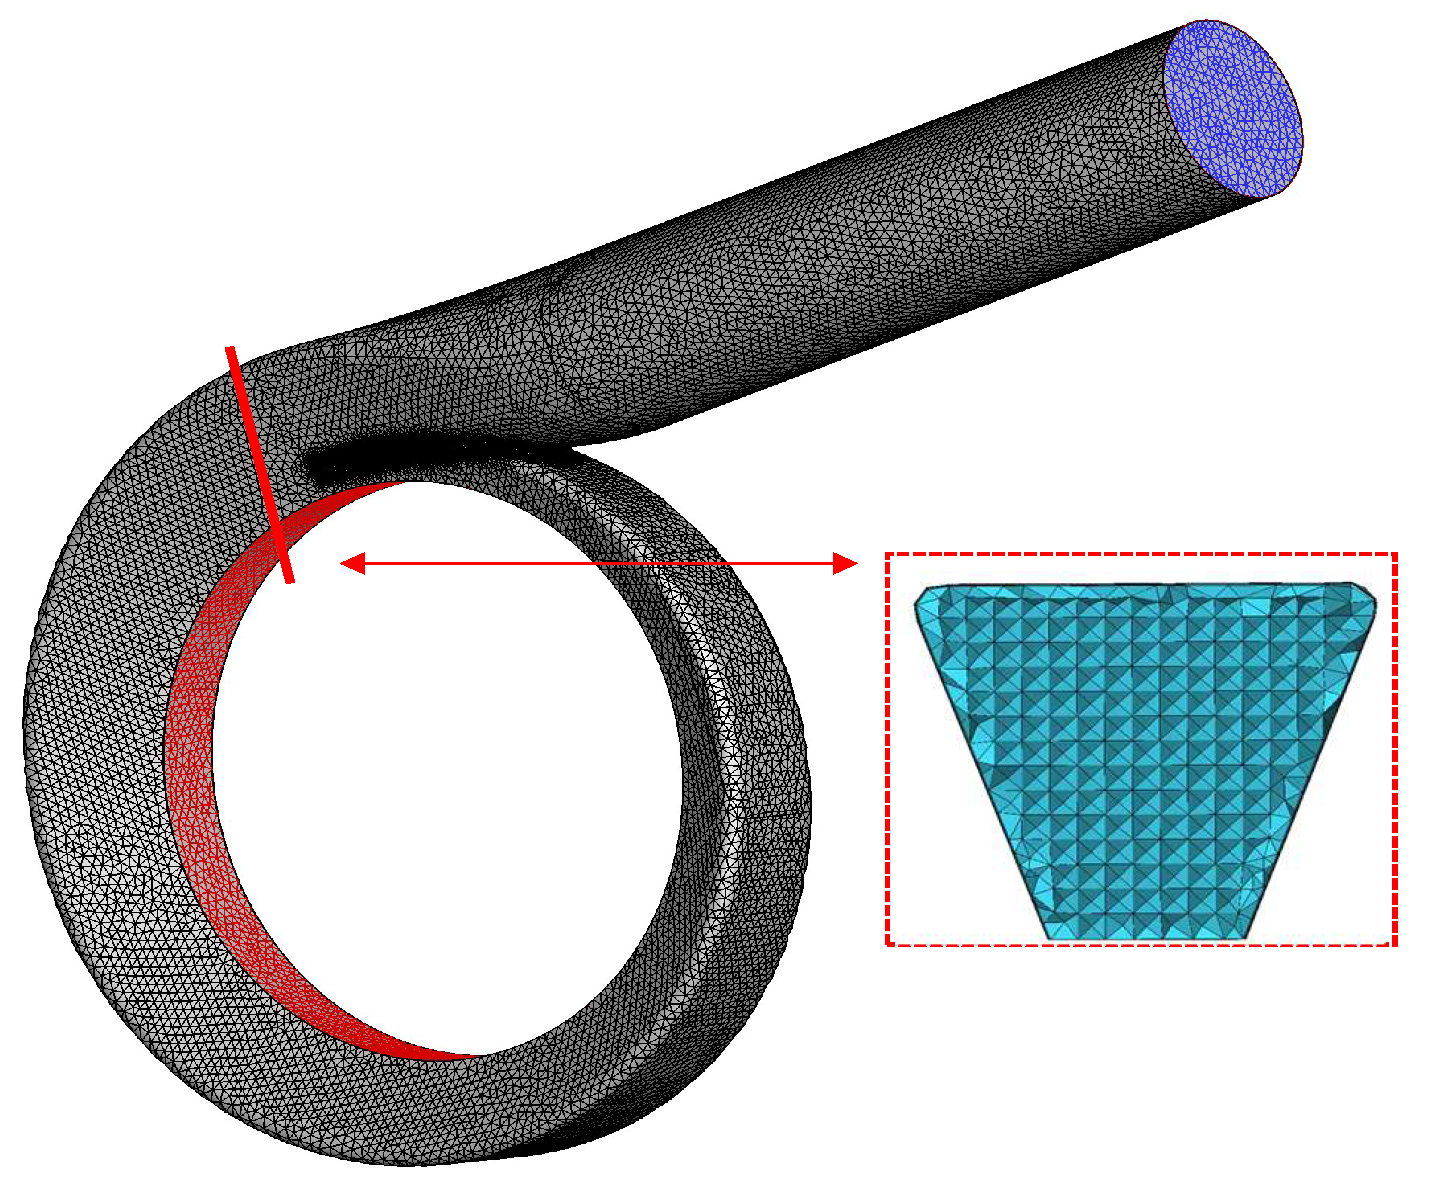
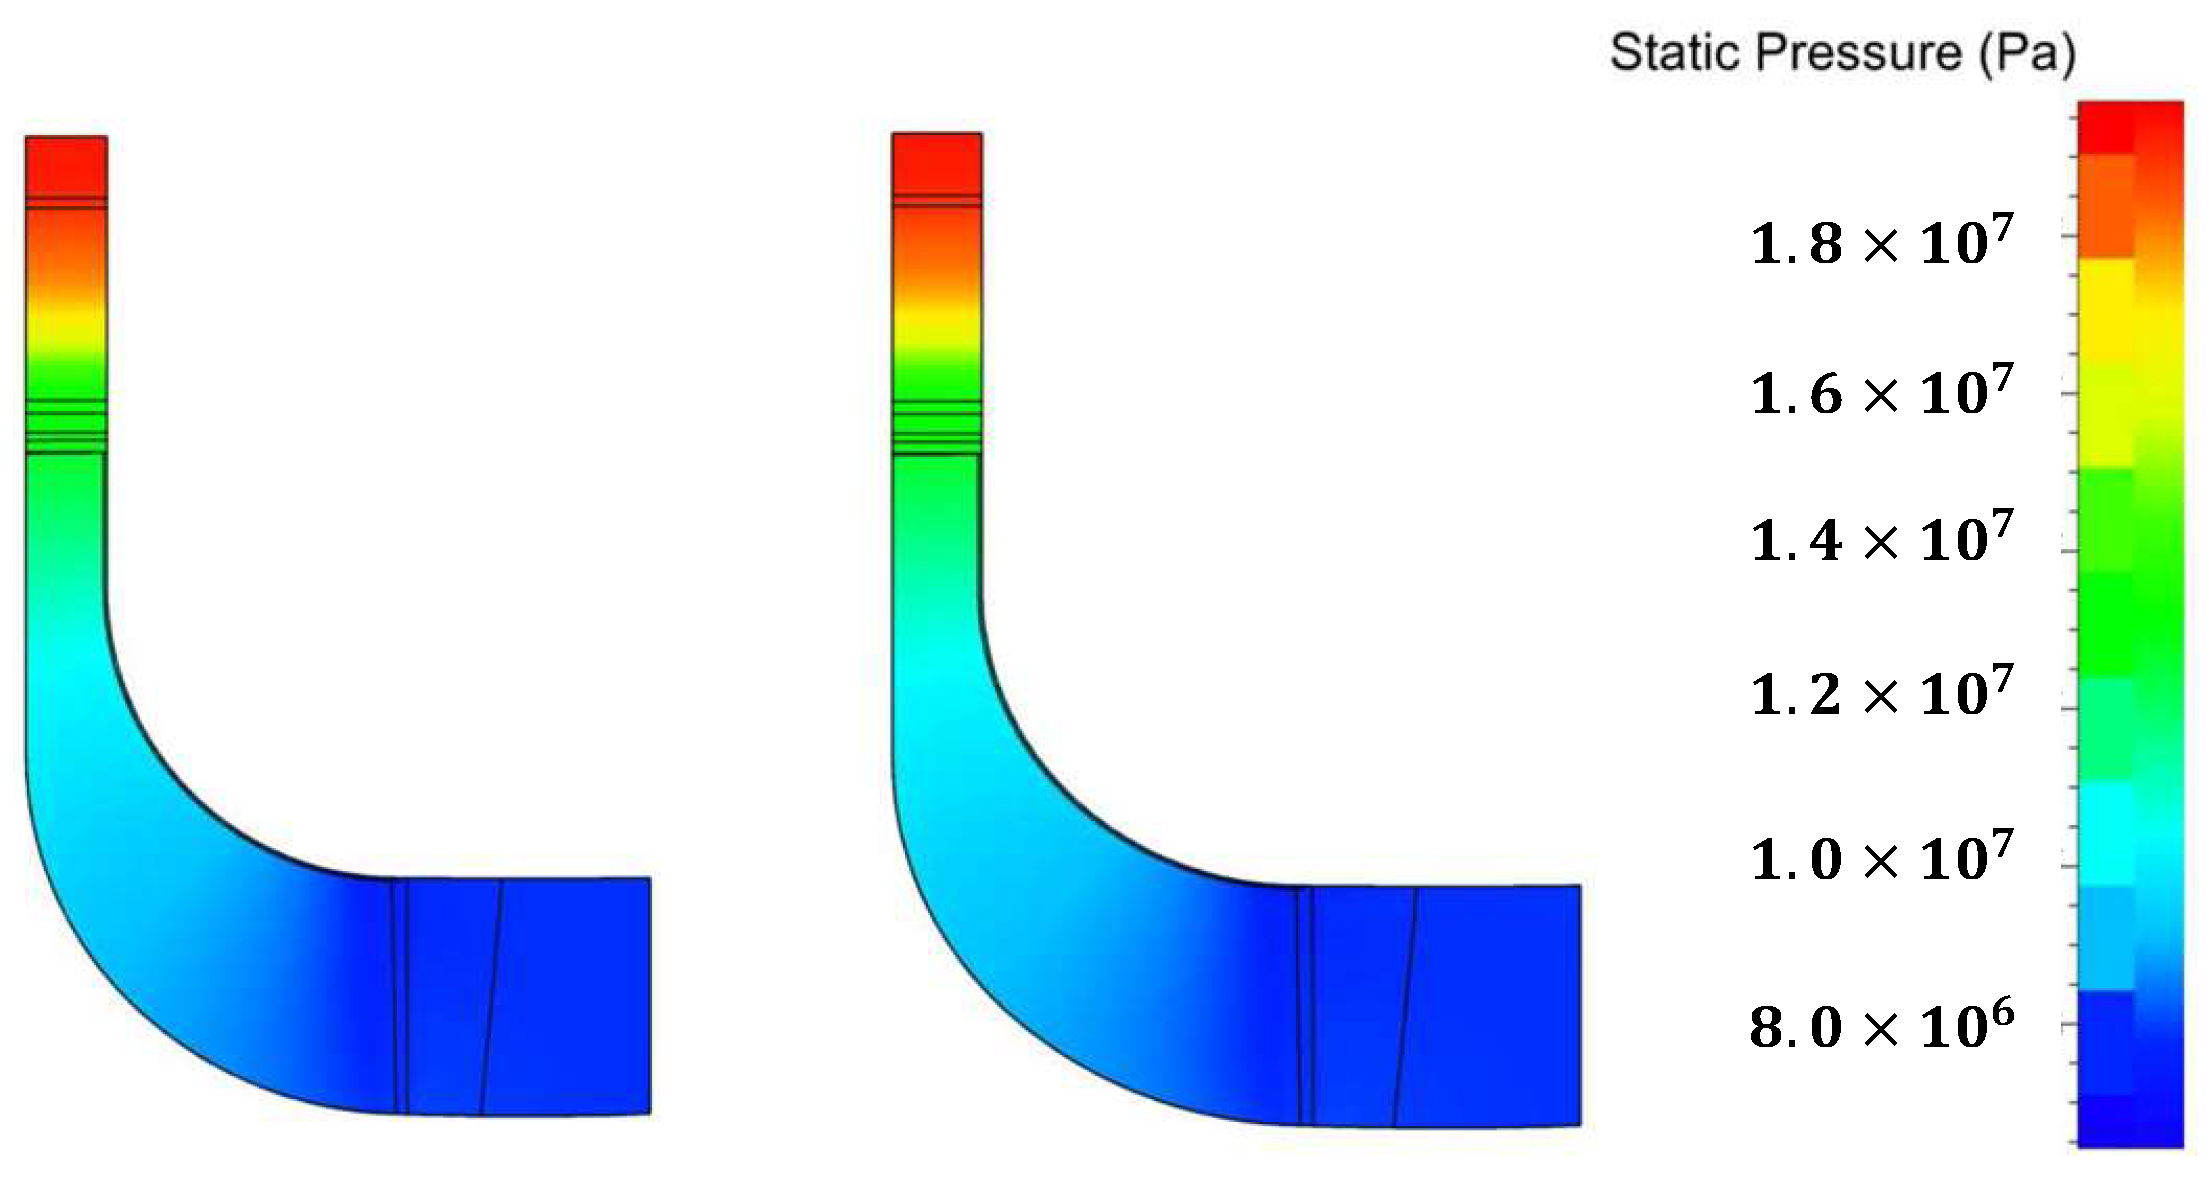
3. The Three-Dimensional Simulation Model of the Volute

In this paper, the three-dimensional model of the inlet volute of the S - CO 2 radial-inflow turbine is numerically calculated under the design and non-design working conditions by ANSYS FLUENT software. The calculation results of the flow field are obtained by solving the three-dimensional compressible Reynolds time-averaged Navier–Stokes equations. We use a pressure-based solver, with a coupled implicit algorithm to increase the speed of calculation convergence and the second-order upwind scheme to increase the computational accuracy. Moreover, the calculation is considered to have converged when the energy residuals are less than 10 6 and all other variable residuals are less than 10 3 . The boundary conditions in the numerical calculation process are shown in Table 1. We adopted the mass flow rate Q m = 16 kg/s as the outlet boundary condition. The outlet static pressure is used as a reference condition. Furthermore, the NIST physical property database integrated by ANSYS FLUENT software is utilized to calculate the thermodynamic properties of S - CO 2 . For the turbulence model, the Spalart–Allmaras (SA) single-equation model is used in this paper. The SA model has excellent robustness and can achieve good results in the numerical simulation of complex flows. Moreover, in the public research work [21], the SA model has shown to be suitable for the numerical simulation of S - CO 2 radial-flow turbine. Hence, this paper uses this SA model to study the S - CO 2 radial-flow turbine inlet volute.The SA model is extended to the y + insensitive wall treatment in ANSYS FLUENT, which makes the application of the model unaffected by the near-wall y + resolution. Furthermore, the y + values of our grid are less than ten, which meets the requirements of SA model. The mesh generation of the volute was done via ICEM CFD. This paper uses the Grid Convergence Index (GCI) method for grid-independent verification [22]. The GCI method is an acceptable and recommended method that has been evaluated in many CFD cases [22,23]. Three sets of grids are used in our verification, and their numbers are N 1 = 3.8 million, N 2 = 2.1 million, and N 3 = 1.0 million, respectively. The corresponding total outlet pressures, an important parameter in our optimization calculations, are ϕ 1 = 19,975,060 Pa, ϕ 2 = 19,974,180 Pa, and ϕ 3 = 19,973,340 Pa respectively. The results of grid convergence study via the GCI method are shown in Table 2. It can be seen that the G C I 21 and G C I 32 are small, indicating that the solutions are within the asymptotic range of convergence, and the exact solution is approximately obtained. Therefore, based on the measurement of calculation cost and calculation accuracy, N 3 = 1.0 million unstructured grids shown in Figure 2 were selected for subsequent calculation research.

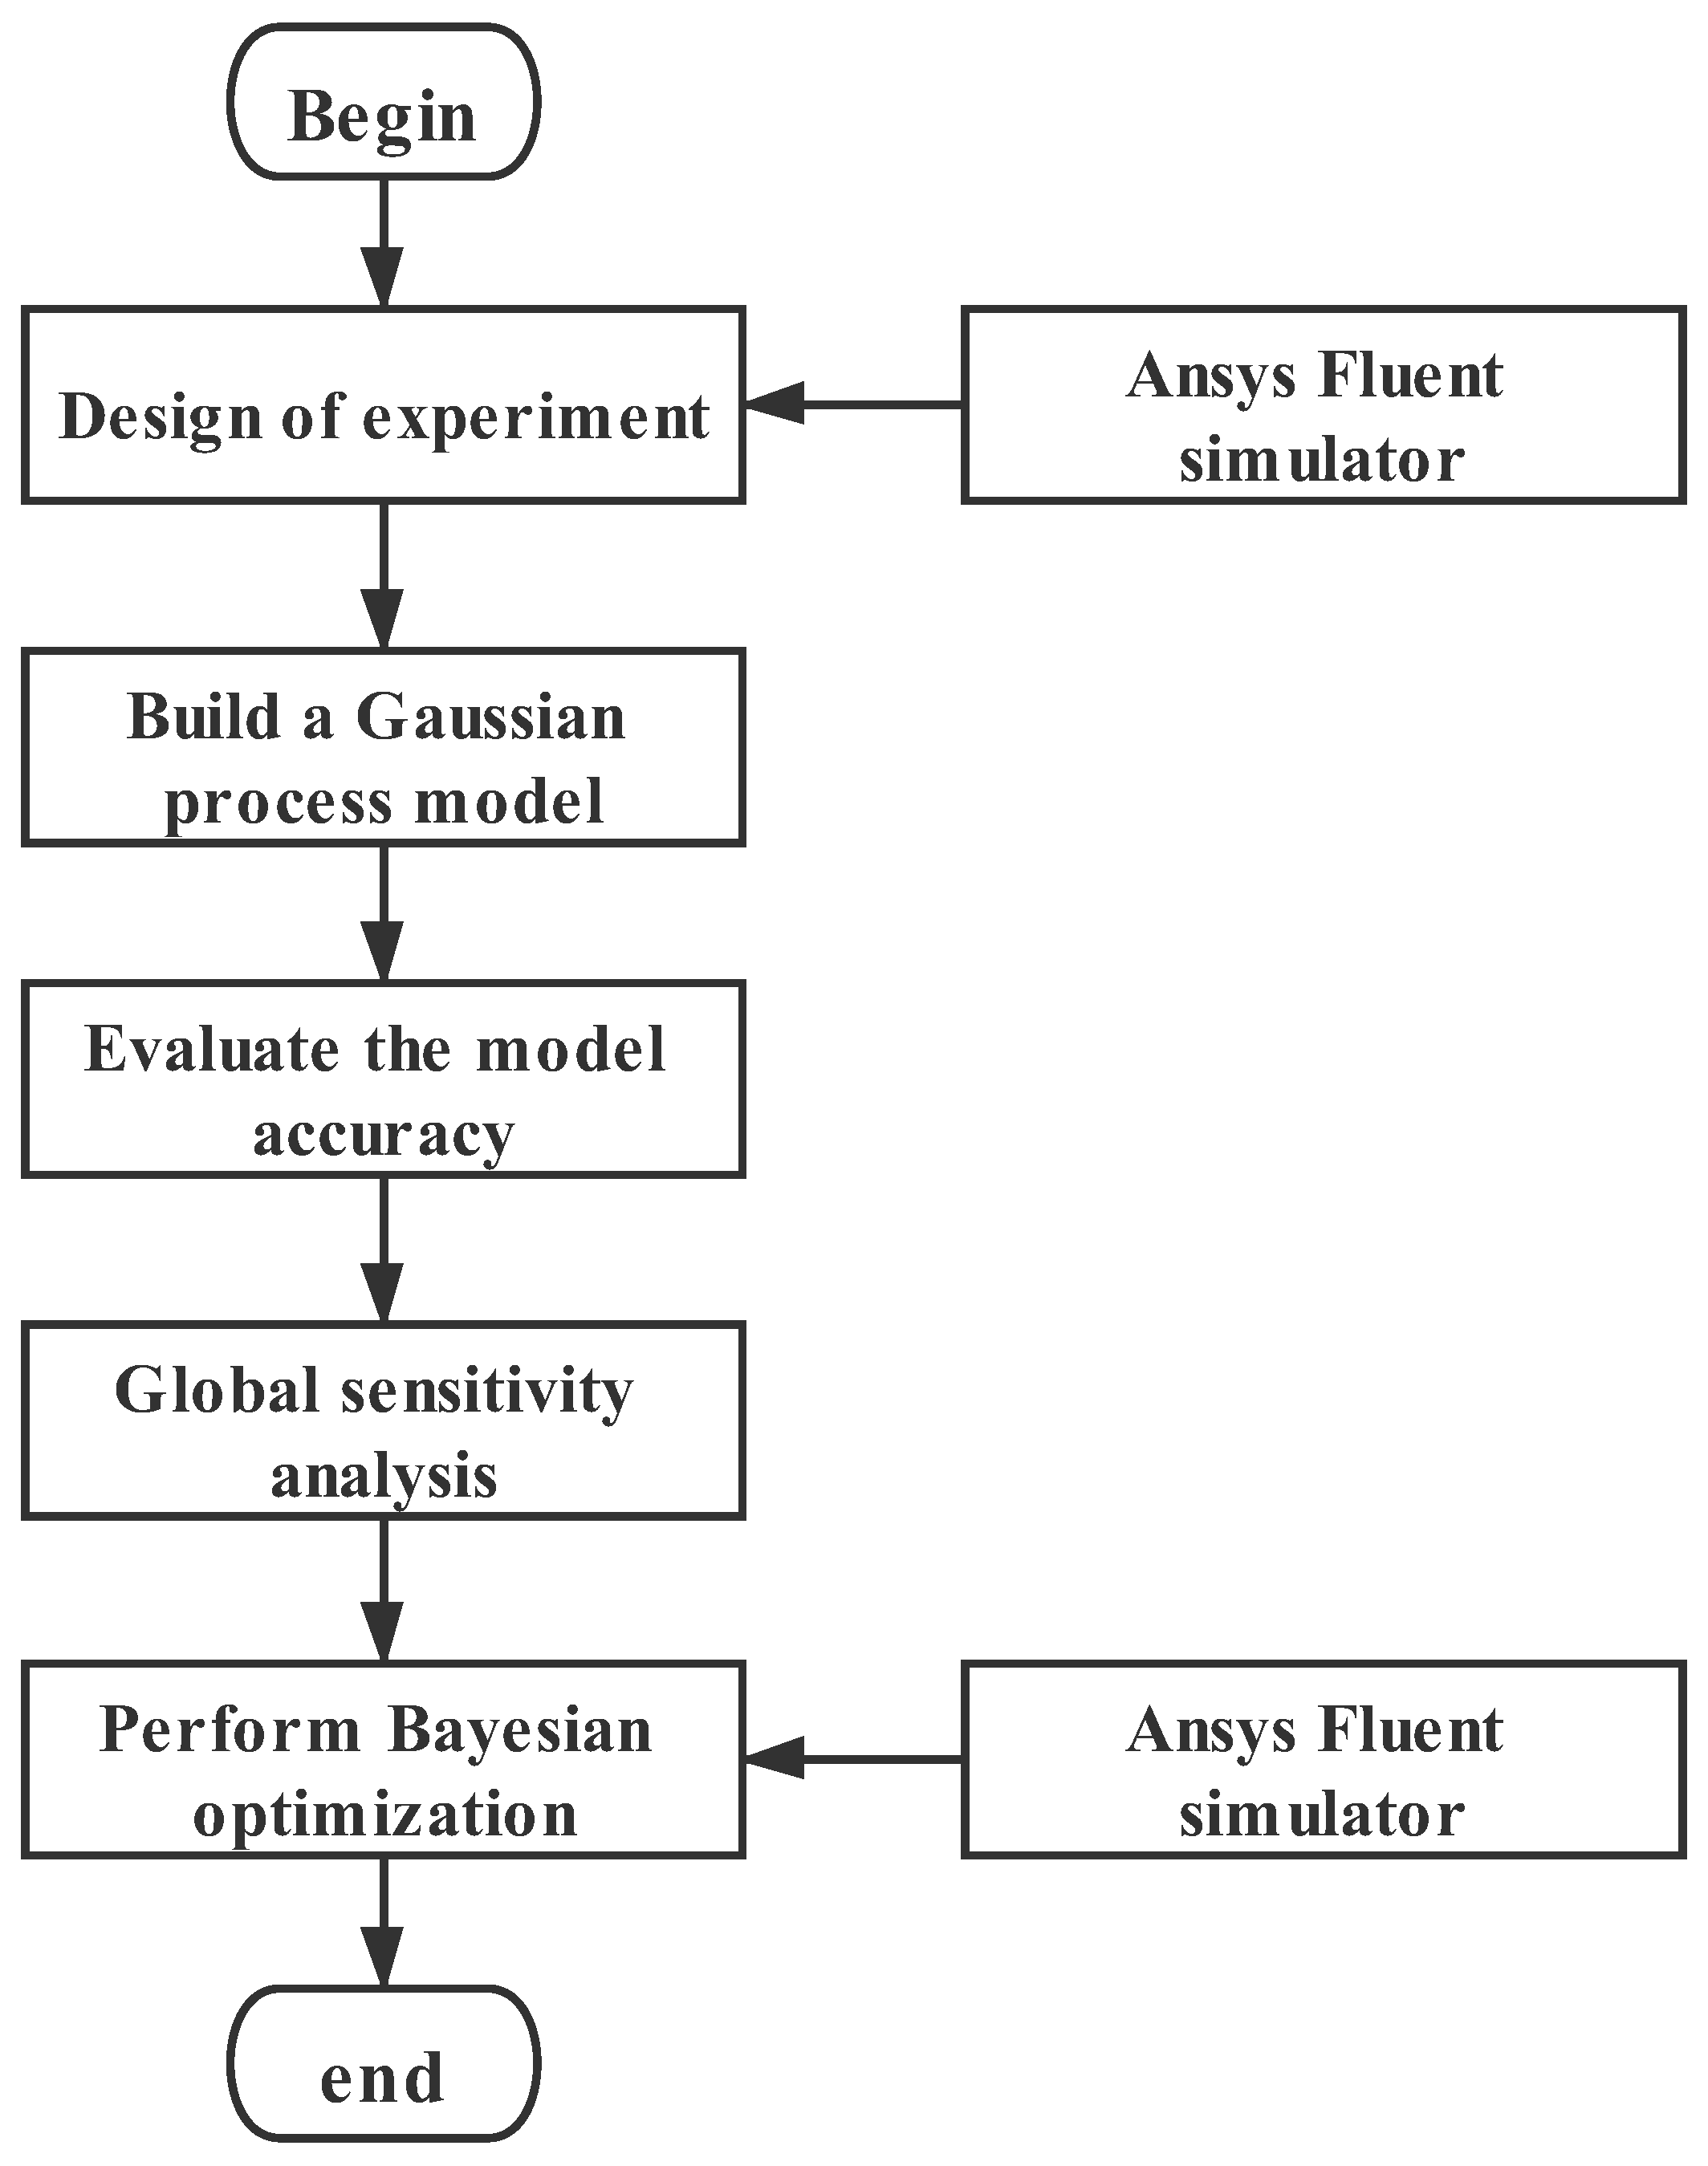
4. Bayesian Optimization Framework for the Design of Volute

4.1. Optimization Object Description

As the optimization object of this paper, the cross-sectional shape of the volute is shown in Figure 3, which is defined by three parameters, including the global spread angle α , the corner radius factor R, and the outlet size factor b. Note that the volute needs to be coupled to the impeller, so the volute outlet radius is equal to the nozzle inlet radius, which is 82 mm. The ranges of each design variable in the optimization process are shown in Table 3. The total pressure loss coefficient K s [16] and the flow distortion F d [24], as the optimization objectives of our interest, are expressed as follows:
K s = P t , i n P t , o u t P t , i n P i n ,
F d = max ( P t , o u t ) min ( P t , o u t ) P t , o u t ,
where P t , i n and P t , o u t represent the average total pressure at the inlet and outlet of the volute, respectively; P i n is the average static pressure at the inlet of the volute; and finally, max ( P t , o u t ) and min ( P t , o u t ) denote the maximum and minimum total pressures at the outlet of the volute, respectively. Lower values of K s and F d are favorable.

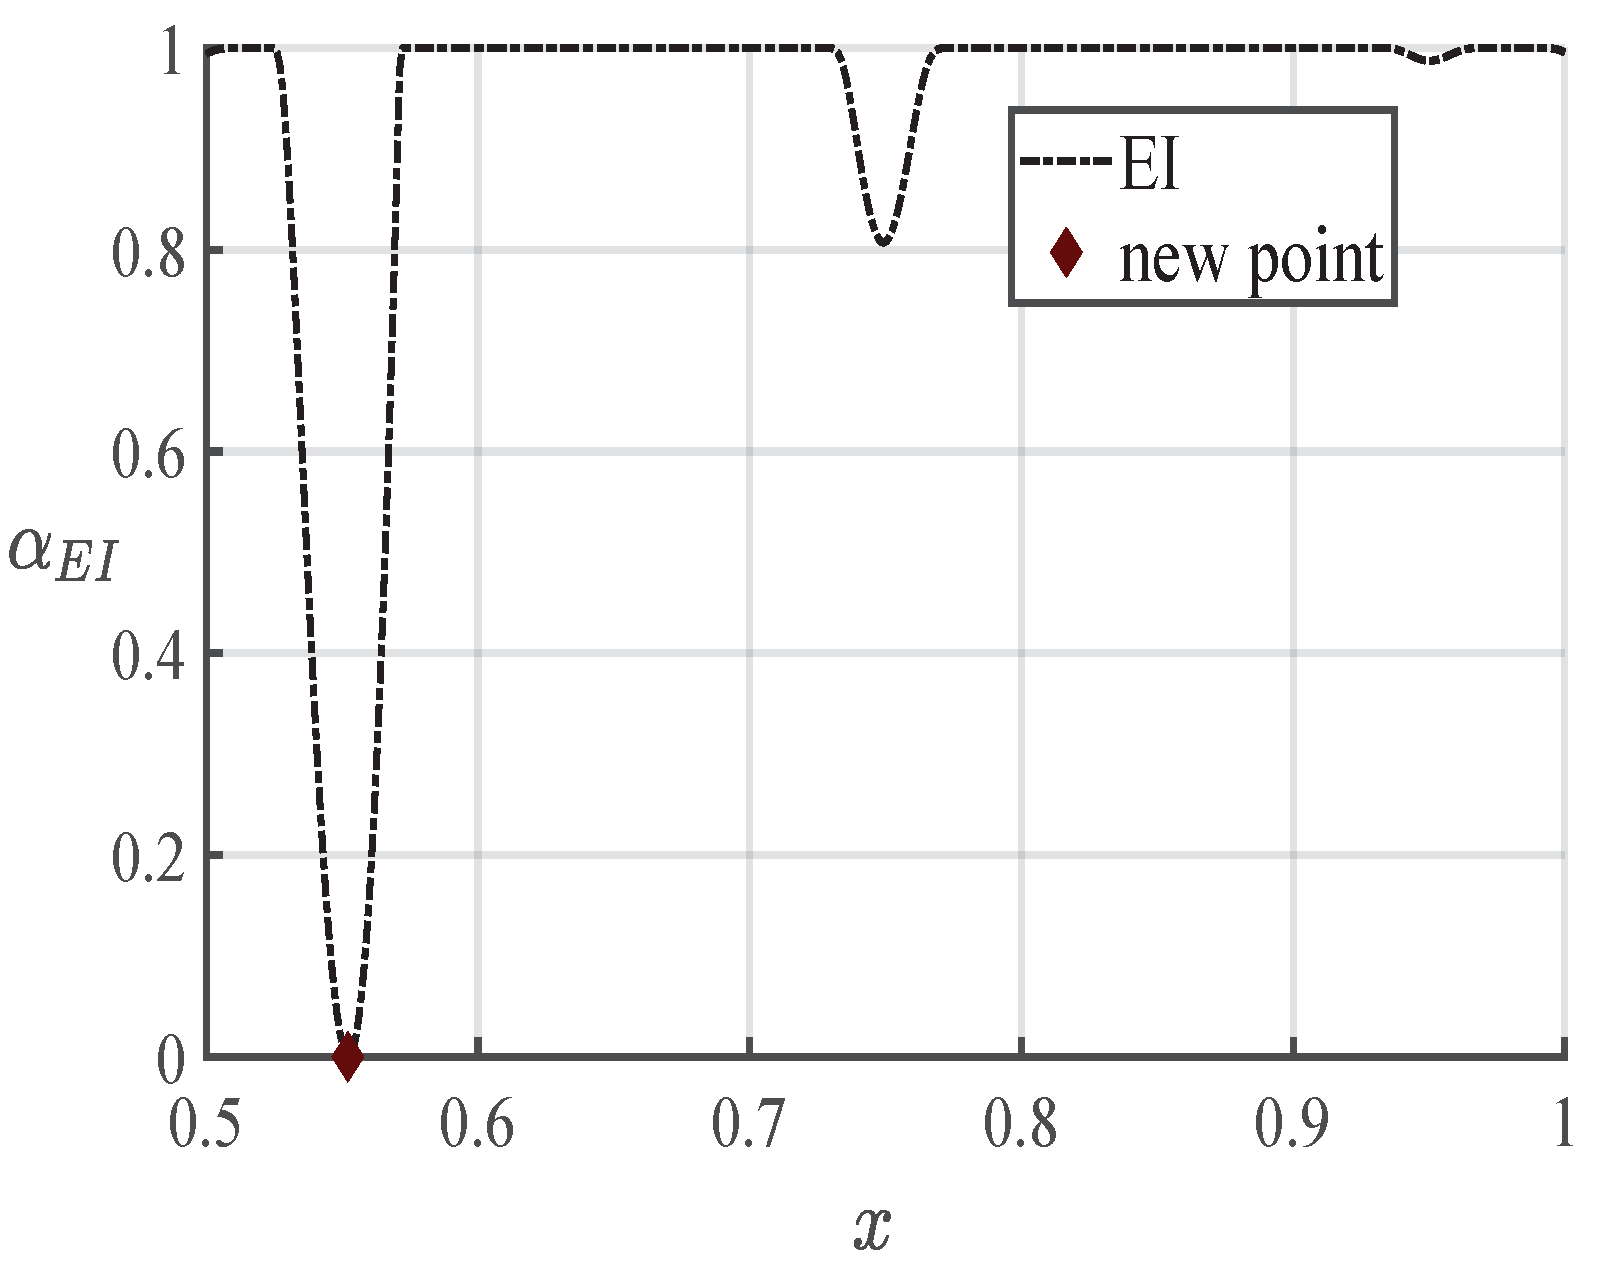
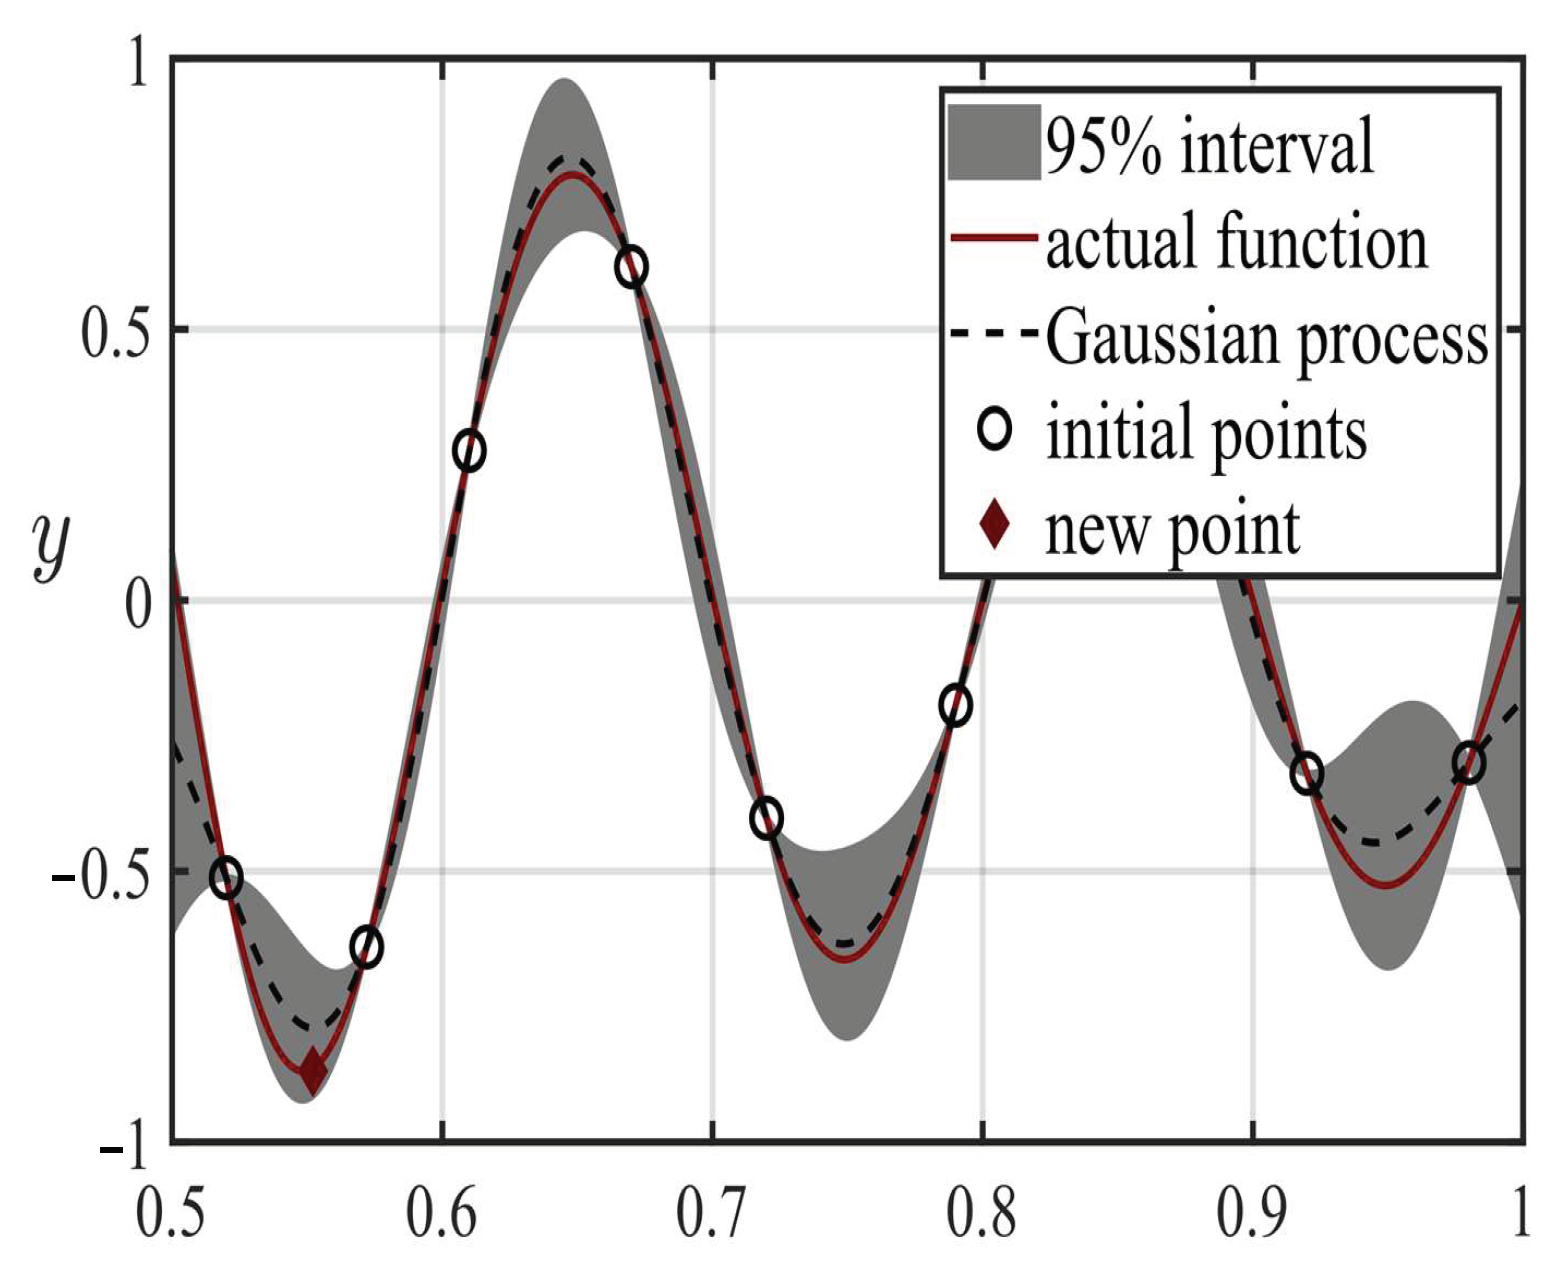
4.2. Optimization Framework Introduction

In this paper, the Bayesian optimization (BO) algorithm is used to optimize the cross-sectional shape of the volute. The BO algorithm obtains the optimal solution of the complex objective function with a relatively small number of function evaluations to efficiently and quickly optimize such time-consuming simulation-based problems. Figure 4 shows the flow chart of BO framework. It can be described as six steps, as follows:
Step 1. Design of experiment (DOE). The DOE method in the optimization framework is Sobol sampling [25]. It is a low discrepancy sequence method. Compared with random numbers, the Sobol sequence focuses on generating a uniform distribution in the probability space. The DOE generates 100 sample points, 90 of which are used as the training set to construct the surrogate model and the remaining 10 points as the test set to evaluate the model accuracy. Note that each point is fed into the three-dimensional simulation model presented in Section 3 to solve the response values using ANSYS FLUENT simulator.
Step 2. Build a Gaussian process model. As a non-parametric model, the Gaussian process surrogate model is widely used in regression and classification problems. A Gaussian process is a generalization of the multivariate Gaussian probability distribution [26]. After constructing the Gaussian process surrogate model from a small number of samples, we can obtain the prediction information about the complex real problem, including the predicted mean and the predicted standard deviation, as shown in Figure 5. Note that the Gaussian process constructed in this paper does not use a mean function. However, the squared exponential covariance function, the Gaussian likelihood function, and the Gaussian likelihood inference function are employed. For the optimization of the hyperparameters, the conjugate gradient method is adopted. When the number of samples is large enough to meet the model accuracy requirements, the Gaussian process can almost replace the expensive and time-consuming simulation calculations and solve them through cheap and fast predictions.
Step 3. Evaluate the model accuracy. After constructing the Gaussian process surrogate model, the model accuracy needs to be evaluated. If the model accuracy does not meet the requirements, further points need to be added. On the contrary, the sensitivity analysis and optimization can be continued if the requirements are met. Commonly used criteria to test the model accuracy include the coefficient of determination R 2 , root mean square error (RMSE), maximum absolute error (MAE), and maximum relative error (MRE). The specific expressions are as follows:
R 2 = 1 i = 1 p ( f i ( x ) f ^ i ( x ) ) 2 i = 1 p ( f i ( x ) f ¯ i ( x ) ) 2 ,
R M S E = 1 p i = 1 p ( f i ( x ) f ^ i ( x ) ) 2 ,
M A E = max f i ( x ) f ^ i ( x ) , i = 1 , 2 , 3 , , p ,
M R E = max f i ( x ) f ^ i ( x ) f i ( x ) , i = 1 , 2 , 3 , , p ,
where f ^ i ( x ) represents the approximate response value obtained by the surrogate model, f ¯ i ( x ) denotes the average of all true response values f i ( x ) , and p is the number of test points. Note that for these four model accuracy criteria, the closer R 2 is to 1, the higher the model accuracy is. In addition, the smaller the values of RMSE, MAE, and MRE are, the higher the model accuracy is.
Step 4. Global sensitivity analysis. Sensitivity analysis is an effective tool that can reveal the effect of changes in input parameters on the output response [27] and can provide reference for optimal design. This article uses the Sobol global sensitivity method to analyze the effects of changes in each design variable of the volute on two performance indicators of interest, including the total pressure loss coefficient K s , and the outlet flow distortion F d [28]. Sobol global sensitivity analysis is a method based on variance decomposition, which can determine the sensitivity of individual factors and factor coupling by calculating the contribution of single and multiple factors to the total variance [29]. The most commonly used Sobol sensitivity indices are the first-order Sobol indices S i and the total-order Sobol indices S T i [30]. S i shows the individual influences of each input variable on the output response, indicating that the contributions of each variable without considering the mutual effects of the variables, which is called the main effect. It is the expected amount of variance of an input variable over the total output variance, as follows:
S i = V E ( Y | X i ) ) V ( Y ) .
Correspondingly, S T i considers the interaction between input variables and quantifies the total impact of an input variable on the model output. It can be interpreted as the expected amount of output variance; the expression is as follows:
S T i = 1 V E ( Y | X i ) V ( Y ) .
Note that we adopt a Gaussian process surrogate modeling-based approach to evaluate the Sobol sensitivity indices, which can effectively alleviate the computational cost caused by the traditional Monte Carlo simulations approach method. At the same time, the Gaussian process surrogate model is also employed for the subsequent Bayesian optimization.
Step 5. Perform Bayesian optimization. BO is a powerful and efficient strategy to find the optimum of the expensive, black-box objective function. It approximates the optimal solution of the real problem as quickly as possible through a limited number of evaluations. Therefore, BO is now used not only for various expensive machine learning problems [31,32] but also gradually for time-consuming simulation-based mechanical optimization design problems [33,34], such as the optimization of impeller shapes [35]. After the surrogate model of the actual function is constructed using the Gaussian process as shown in Figure 5, we actively query the optimal solution of the model by minimizing the acquisition function, which is composed of the predicted mean and predicted standard deviation of the Gaussian model, as shown in Figure 6 is the expected improvement (EI) [36] acquisition function.

5. Results and Discussion

In this paper, based on 90 sample points, the surrogate model of the real problem is built using the Gaussian process. Table 4 shows the model accuracy test results of the two optimization indicators for different surrogate models, i.e., GP, thin-plate spline RBF, quadratic PRS, and MARS, at ten test points. The best results are marked in bold. The results show that the GP surrogate model almost has the best fitting effect. For the Guassian process, it can be seen that the coefficient of determination R 2 is greater than 0.95 for both optimization objectives K s and F d , and the other error indicators RMSE, MAE, and MRE are very small. It indicates that the surrogate model can reflect the mapping relationship between input and output of the real problem accurately. Therefore, it can be used for the subsequent sensitivity analysis as well as optimization design.

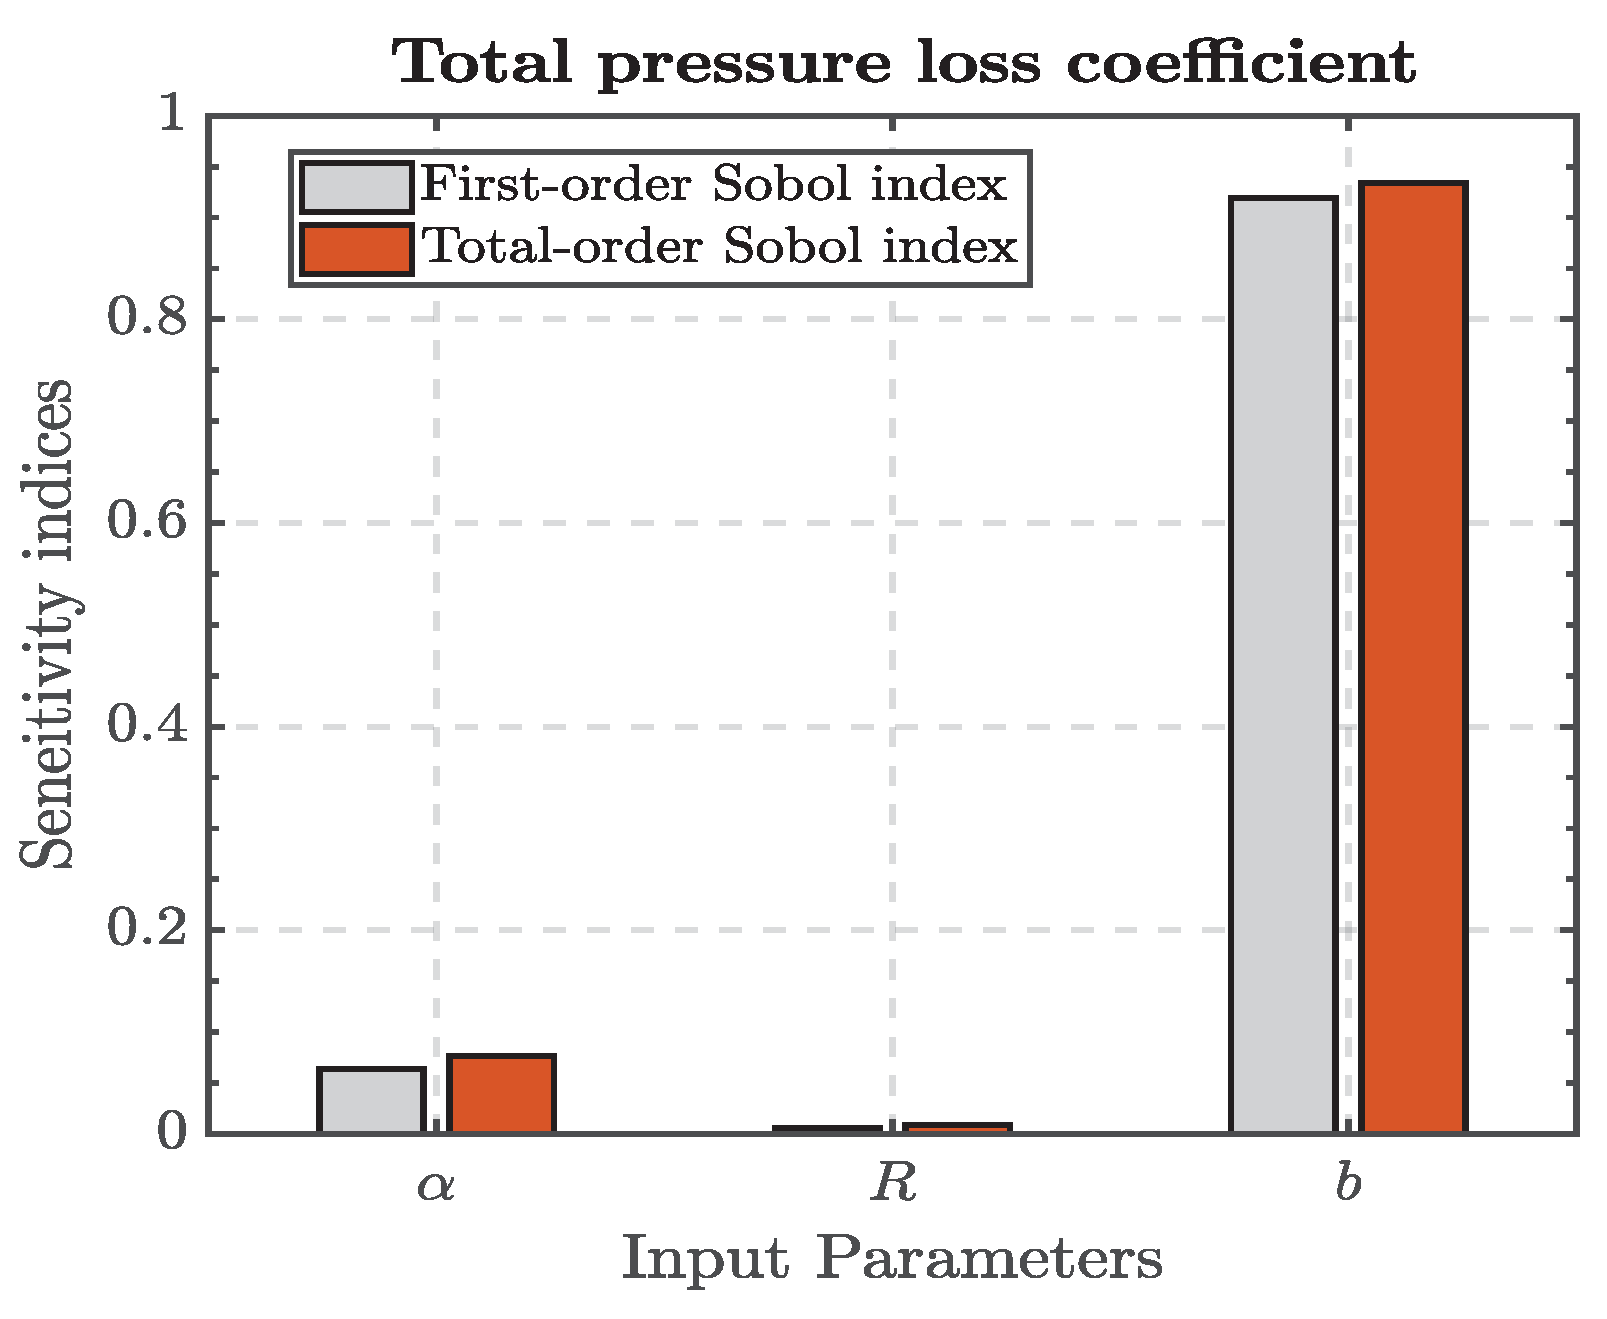
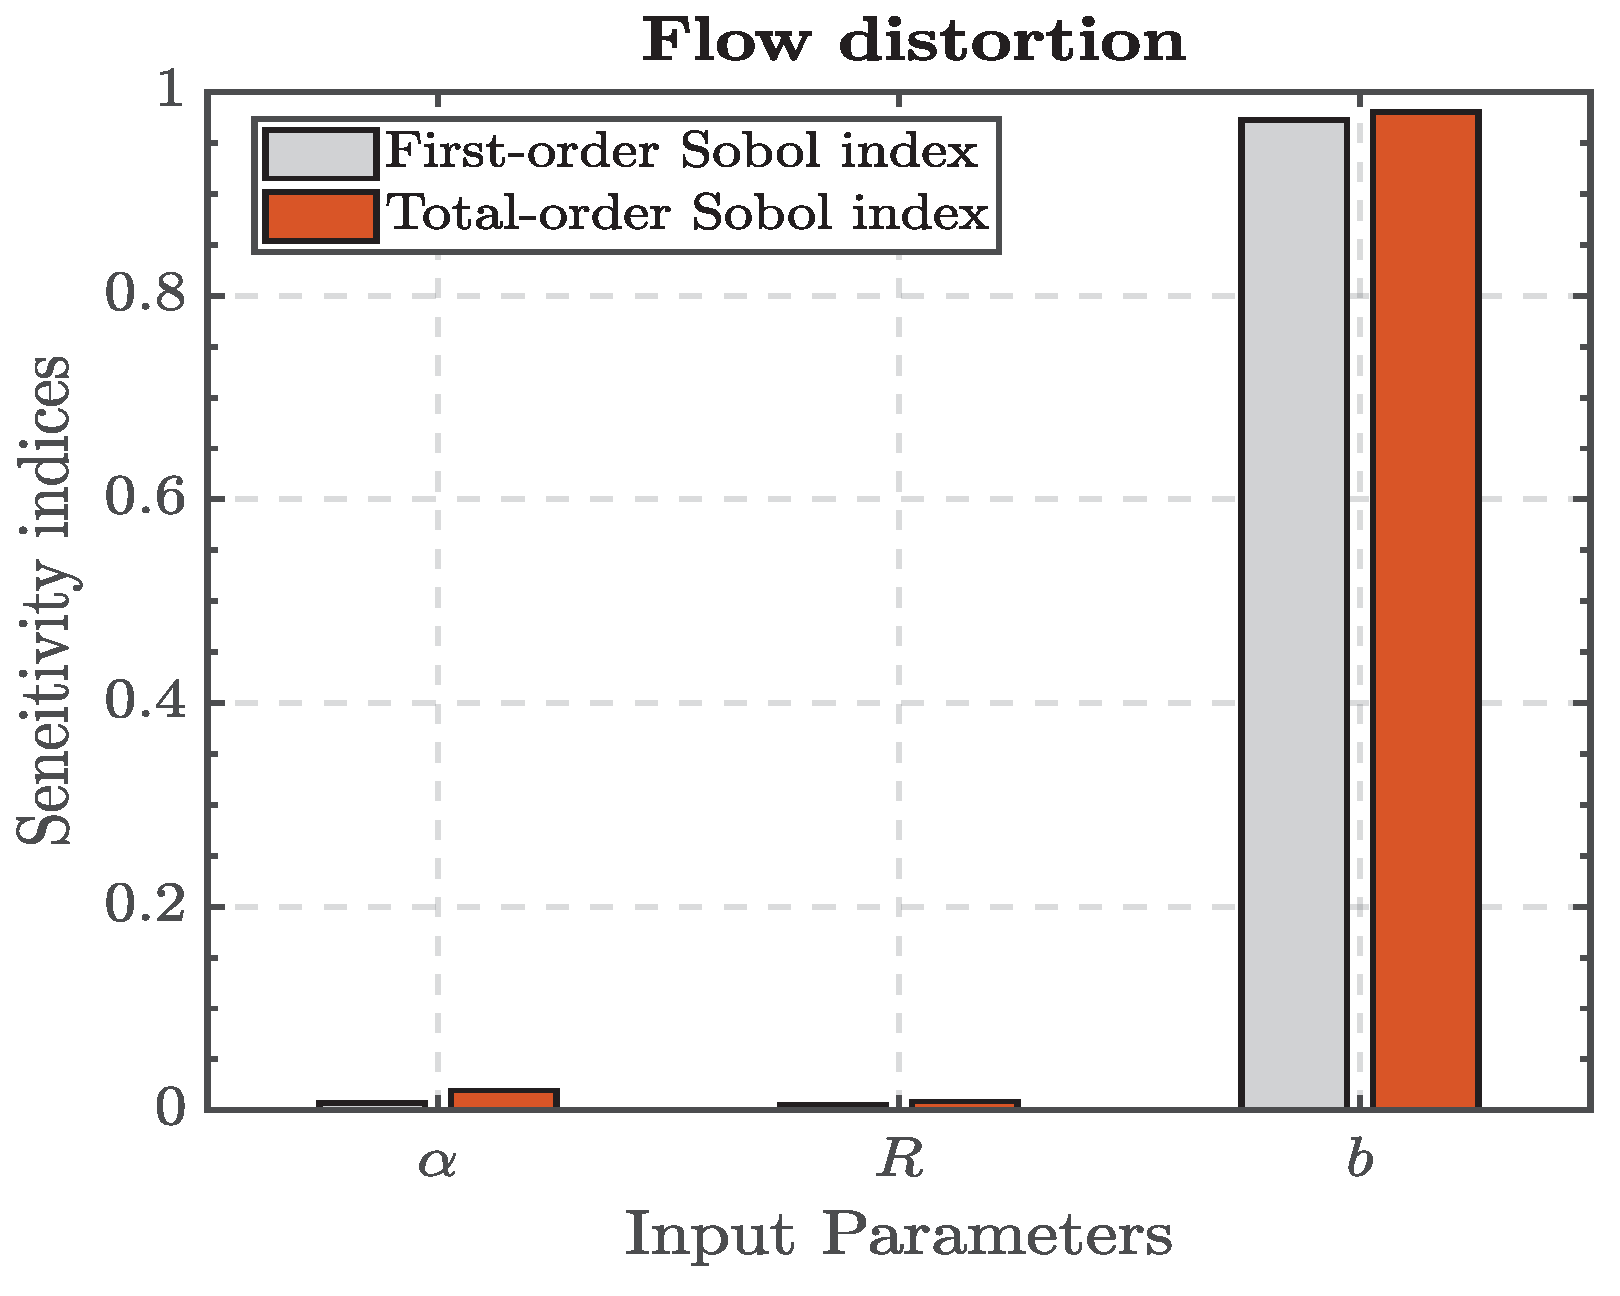
5.1. Sensitivity Analysis of Volute Optimization Parameters

Figure 7 shows the sensitivity analysis results of the volute design parameters to the total pressure loss coefficient K s , including the first-order Sobol indices S i and the total-order Sobol indices S T i . Obviously, the most important parameter is the outlet width coefficient b, which accounts for about 90% of the output variation for the pressure loss inside the volute. This is in line with understanding, because the variation of b has a significant effect on the internal flow velocity of the volute. It leads to a variation of the flow and vortex intensity inside the volute, which in turn leads to a strong change in K s . Note that the indicators S i and S T i of each design variable in Figure 7 do not differ significantly, indicating that the interaction effect between them is weak. In addition, Figure 8 presents the sensitivity analysis results of the design parameters of the volute to the flow distortion F d . It is similar to the sensitivity analysis result of the K s . The b remains the input parameter that has the most significant effect on the variation of the flow distortion, accounting for more than 95% of the output variation. In summary, for the intake volute, the parameter b on the cross-section is the key geometric parameter that has a great impact on the performance.

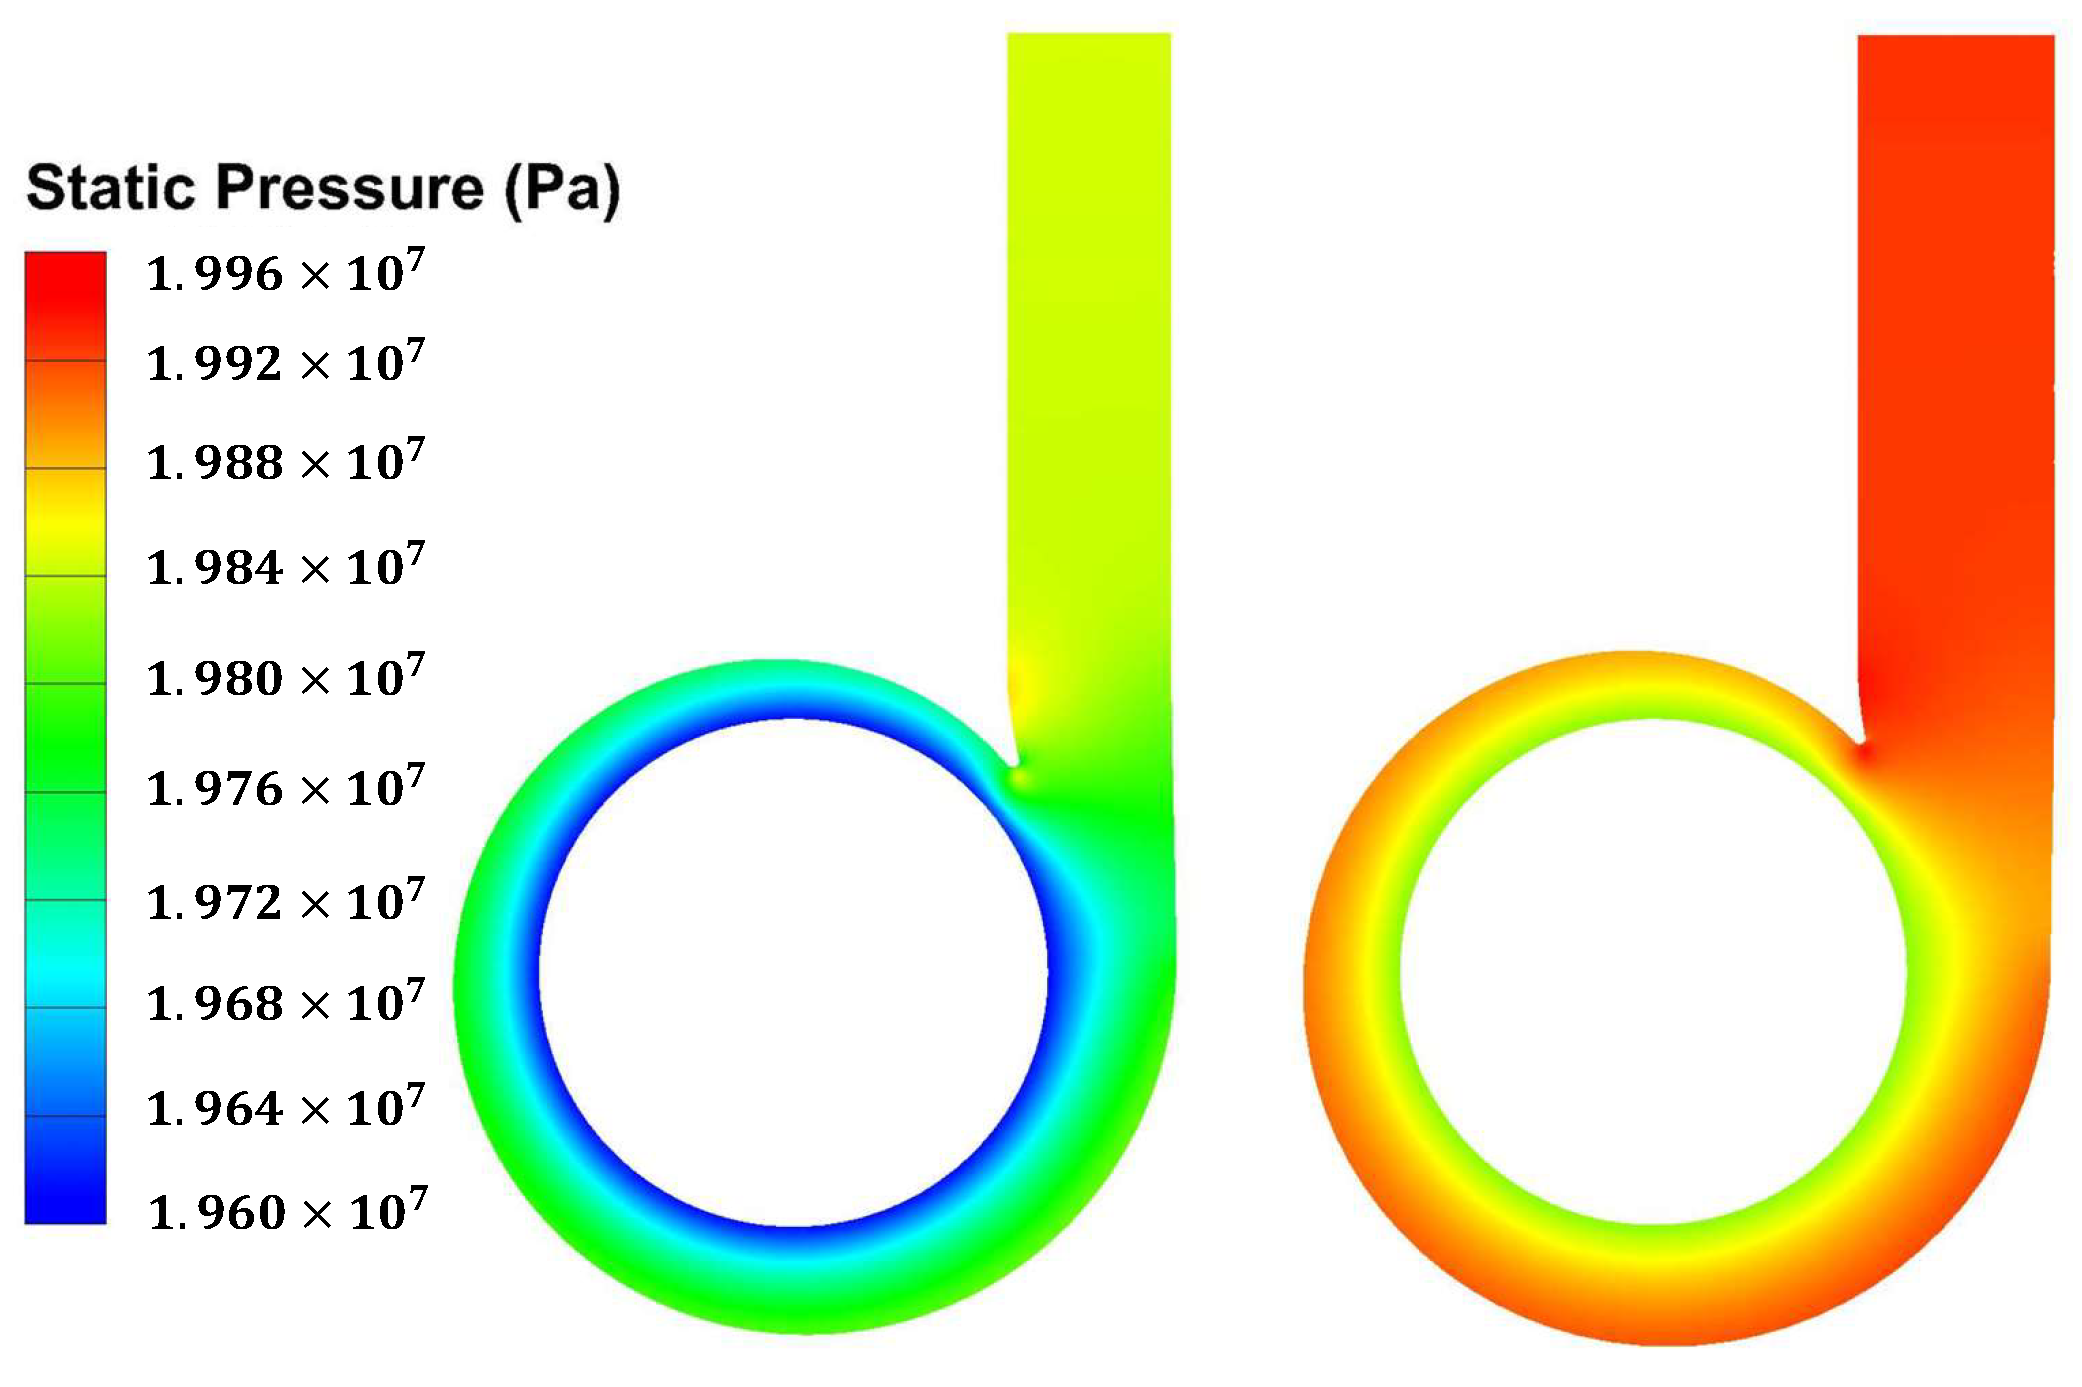
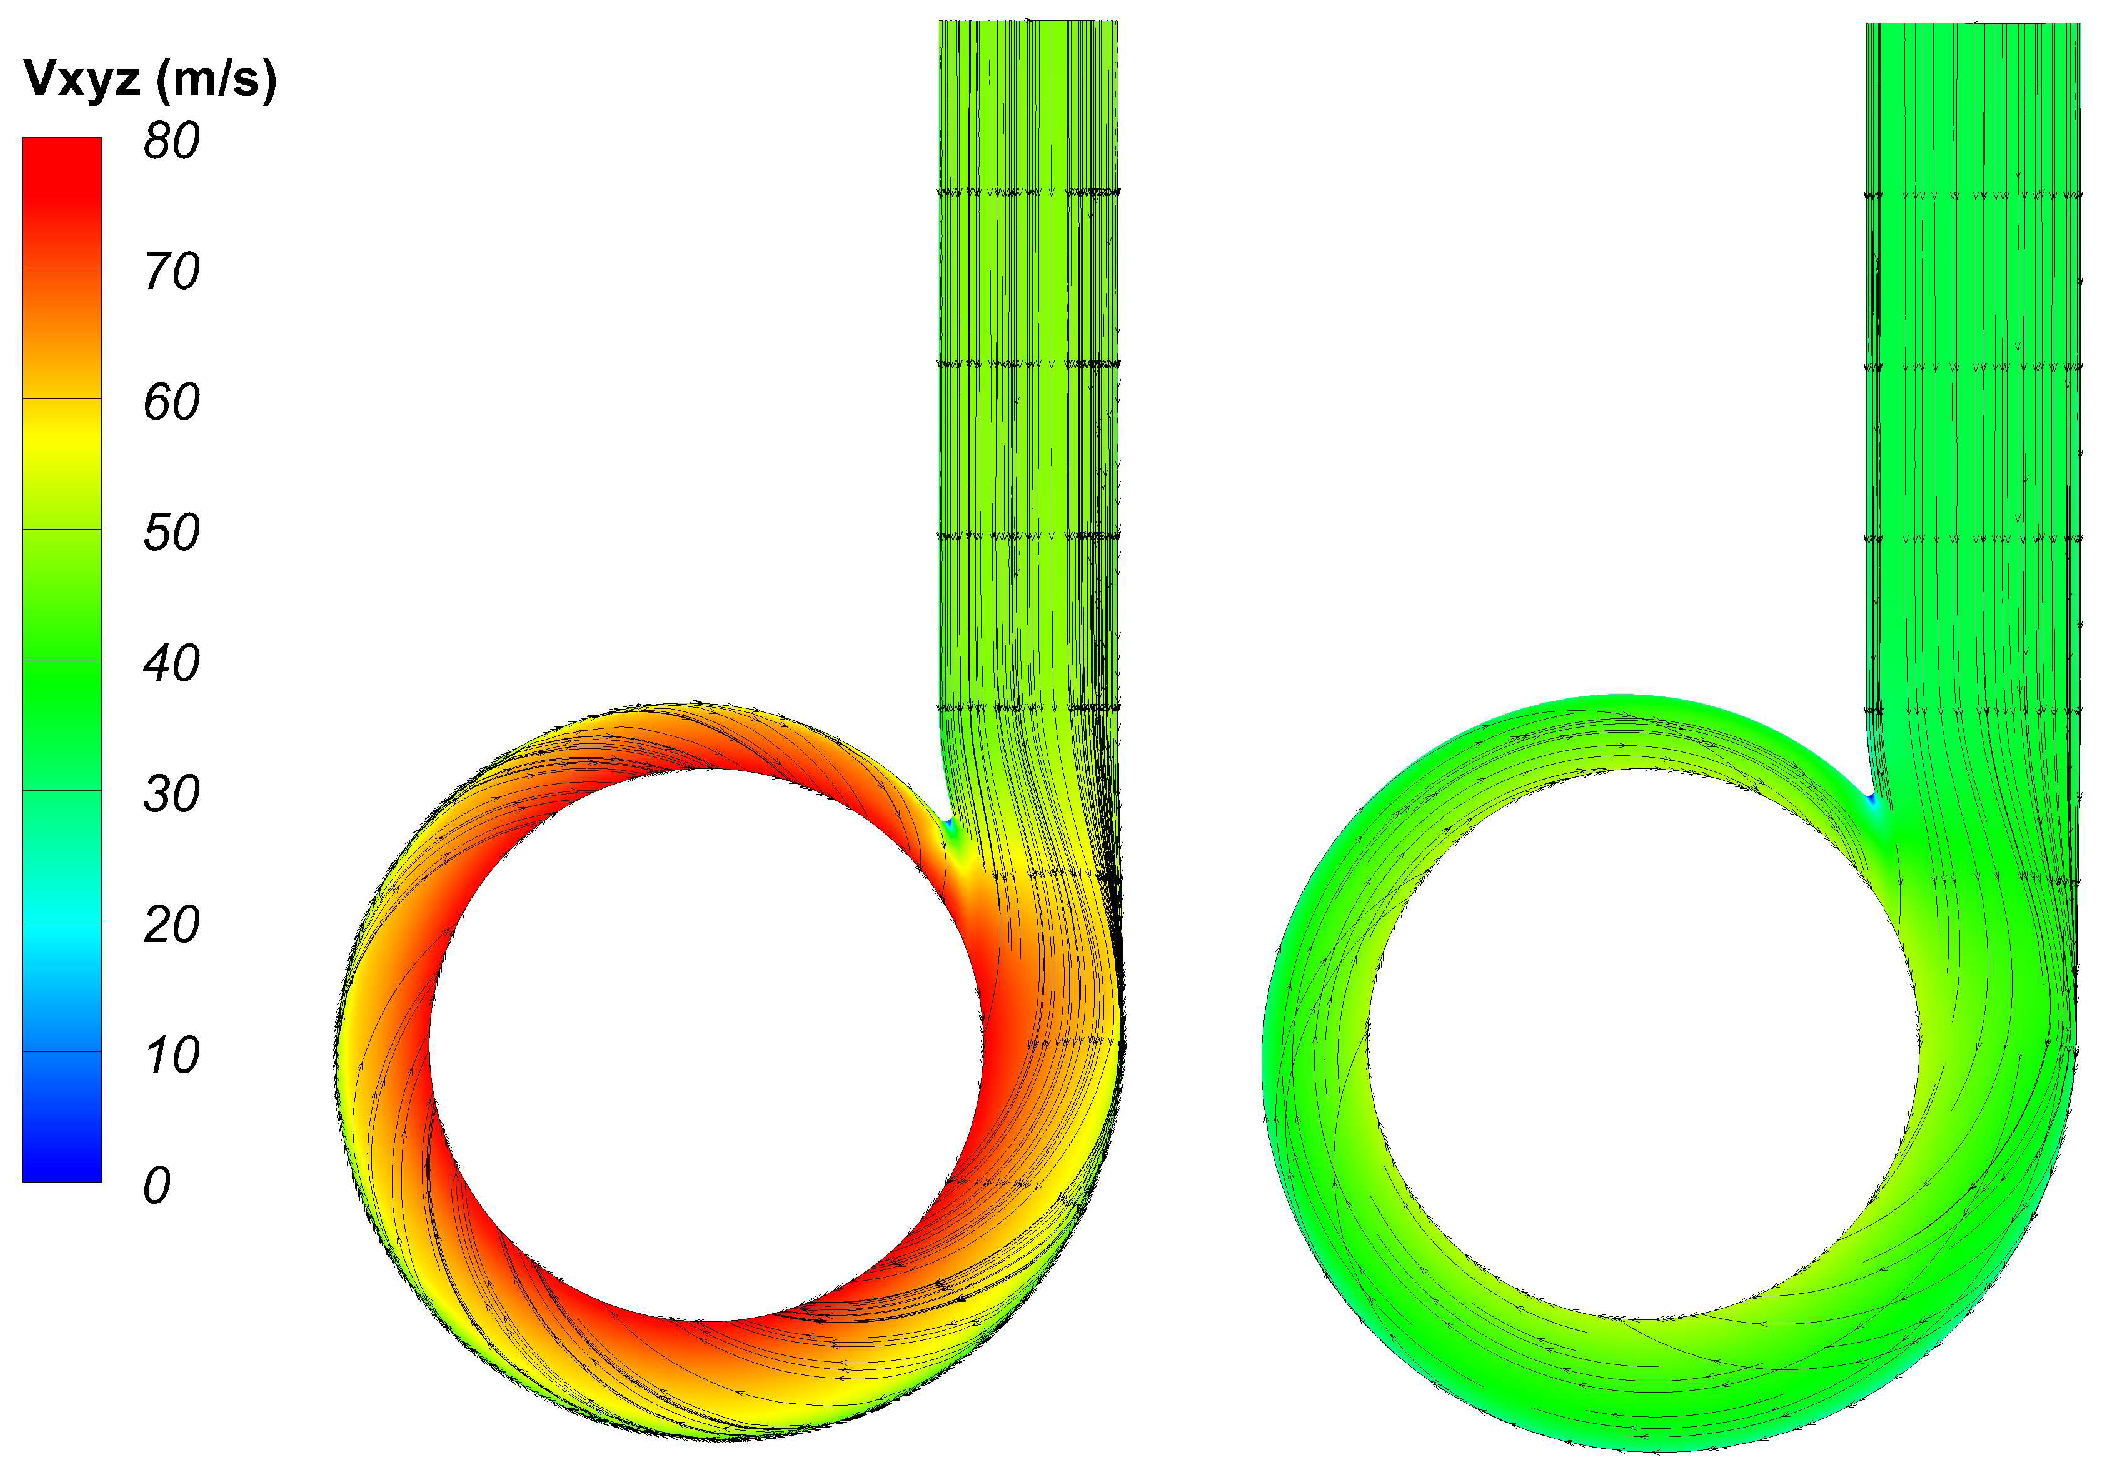
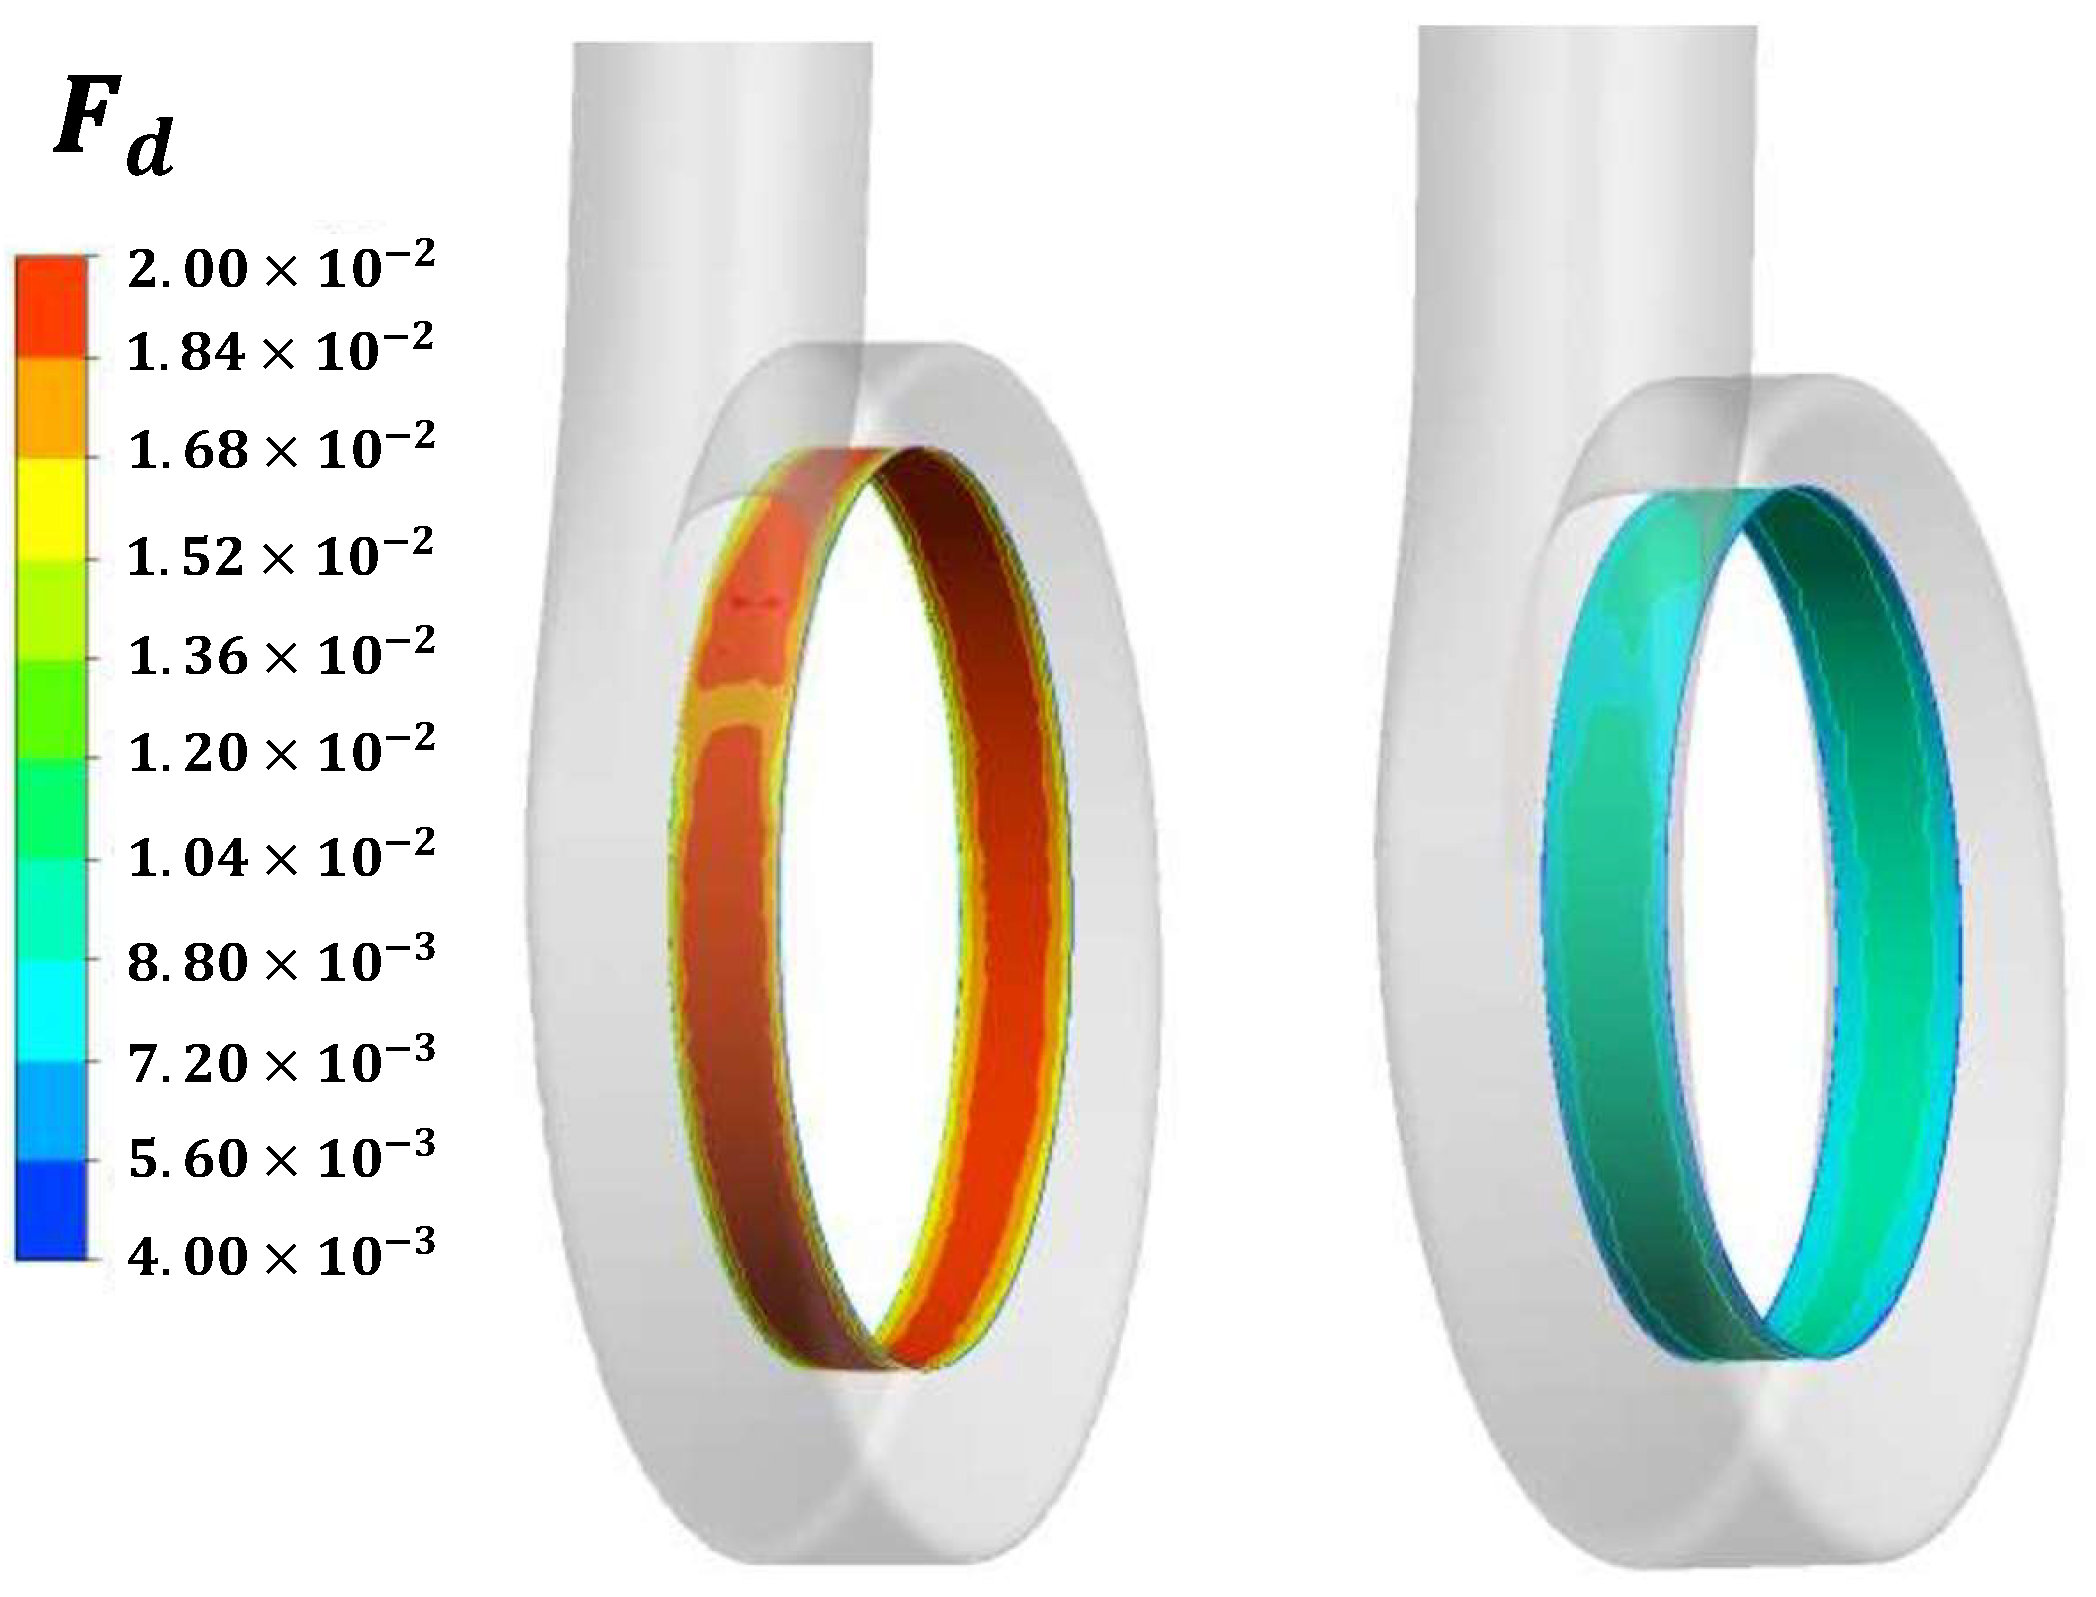
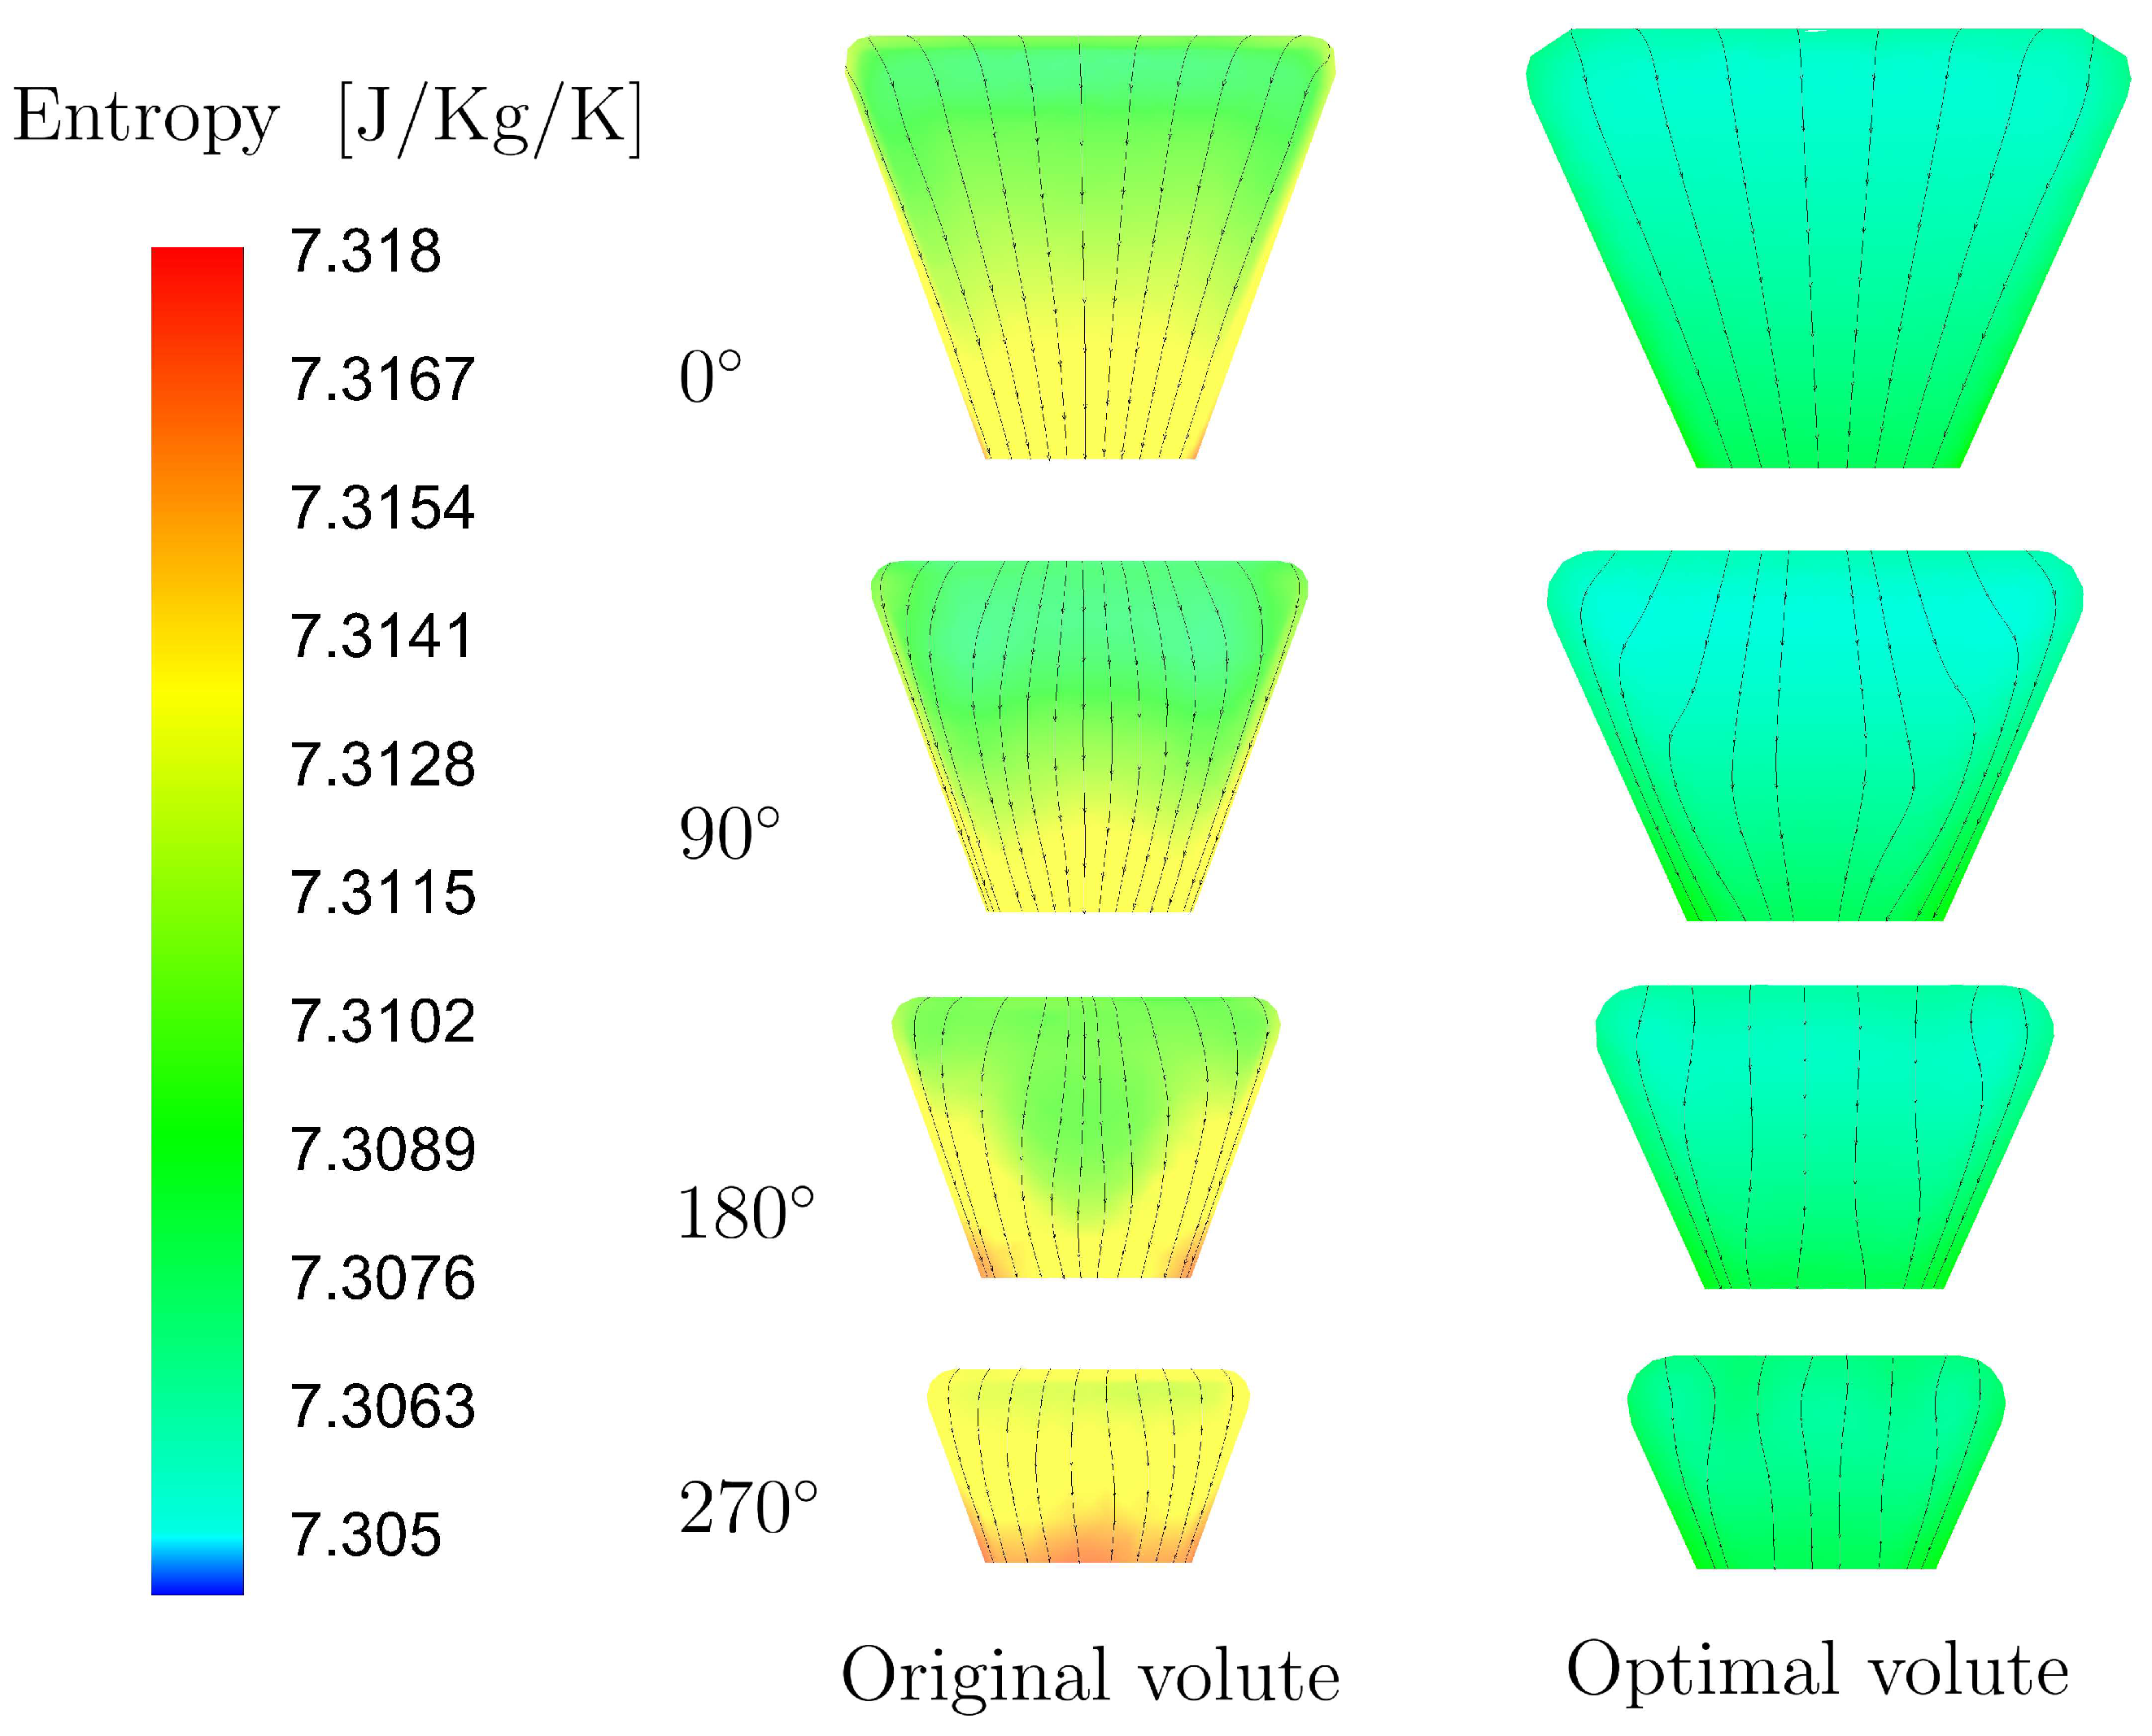
5.2. Performance Analysis of the Optimal Volute

After constructing a surrogate model that meets the accuracy requirements, we select the optimal point on the model by minimizing the acquisition function. The genetic algorithm (GA) is used to minimize the acquisition function, which is a common swarm intelligence algorithm. For the optimization of the inlet volute cross-section shape, we take the total pressure loss coefficient as the optimization objective, because the two objectives of interest, K s and F d , are found to have a strong correlation rather than two conflicting objectives through the sample points. Therefore, the optimization problem can be described as follows:
Minimize K s s . t . 10 α 30 , 70 R 200 , 200 b 300 .
After optimization, we obtained the optimal volute cross-sectional shape and optimal K s within the design range and substituted the volute cross-sectional shape into the real model for numerical simulation. We have tried different acquisition functions, namely the Probability of improvement (PI) and EI. The optimization result obtained through PI is slightly better than EI and is used for subsequent analysis. Note that based on the Gaussian process surrogate model with the required accuracy, this paper performs a single iteration BO optimization. The results are shown in Table 5. It can be seen that the relative error between the numerical simulation result and surrogate model prediction result is 1.25%, which is within an acceptable range and proves the feasibility of Bayesian optimization in volute optimization.
In addition, the comparison between the original and optimized models concerning design variables and performance indicators of interest is shown in Table 6. After Bayesian optimization, not only the total pressure loss coefficient K s of the volute is reduced by 33.26% but also the flow distortion F d is effectively improved, which is reduced by 54.55%. The flow inside the inlet volute is effectively improved, reducing the flow loss inside the volute while making the flow field more uniform.
Figure 9 and Figure 10 show the static pressure contours and velocity fields of the optimized volute and original volute at the mid-span section, respectively. It can be seen that the distributions of the velocity field and pressure field of the optimized volute are uniform, and there is no obvious flow separation. Although there is weak local inhomogeneous flow near the volute tongue, it does not have a significant effect on the whole flow field. The internal flow velocity of the optimized volute is significantly reduced, and the velocity distribution is better and more uniform than the original volute. Correspondingly, the reduction of velocity in the volute increases the static pressure.
Figure 11 shows the flow distortion contours of the volute outlet section. It can be seen that because two fluids are mixed near the volute tongue, the flow near the volute tongue is more complicated, and there are large pressure fluctuations, which also is an obvious location where the flow is not uniform. Nevertheless, the F d of the outlet section of the optimized volute is smaller than that of the original volute as a whole and is more consistent, indicating that the optimized volute has a more uniform outflow, which meets the needs of our optimized design.
Figure 12 presents the entropy contours and streamlines of the optimized volute and the original volute in each azimuthal position as shown in Figure 3. It can be seen that the flow inside the volute is uniform, and there is no a pair of counter-rotating vortexes like [13], which uses a circular cross-section. It is favorable for the organization of uniform flow inside the volute. For the entropy of each azimuthal position, due to the difference in velocity, i.e., the friction effect, and the inverted pear cross-section shape, the large entropy area mainly exists in the lower part of the volute cross-section and near the wall. Note that the optimized volute can effectively reduce the entropy on the cross-section of the volute and reduce the flow loss inside the volute.
Overall, we reduce the F d and K s of the volute through BO. By optimizing the three volute cross-sectional geometric parameters α , R and b, the flow velocity inside the volute is reduced, and the flow is more uniform, which effectively decrease the flow loss inside the volute, and at the same time decrease the flow distortion of the outlet section of the volute. In addition, we also performed matching calculations between the original and optimized volute and the radial-inflow turbine. The results are shown in Table 7, which indicate the optimized volutes maintain the good aerodynamic performance of the radial-inflow turbine. We can also observe more in detail in Figure 13 that by matching the radial-inflow turbine to the original and the optimized volute, the static pressure contours on the meridional plane of the radial-inflow turbine are almost identical.

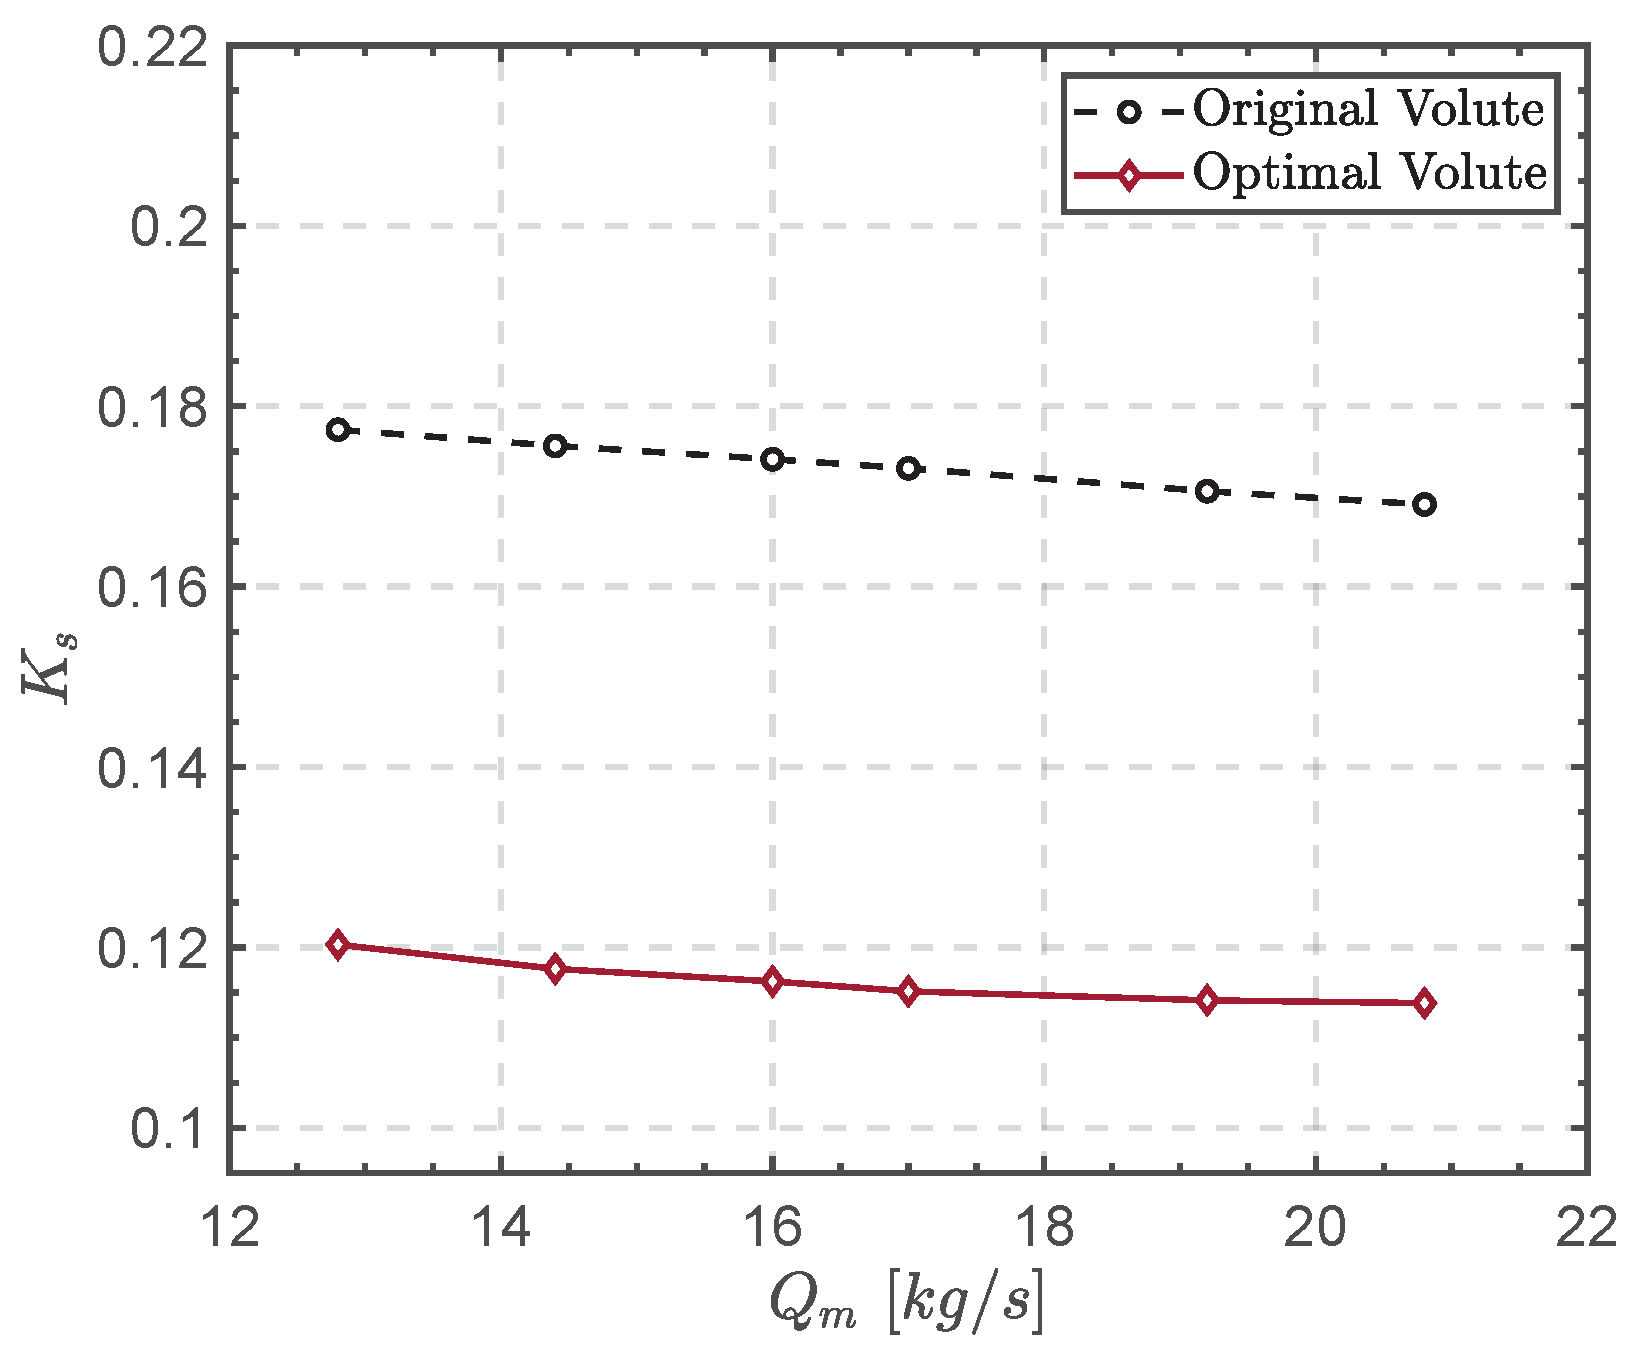
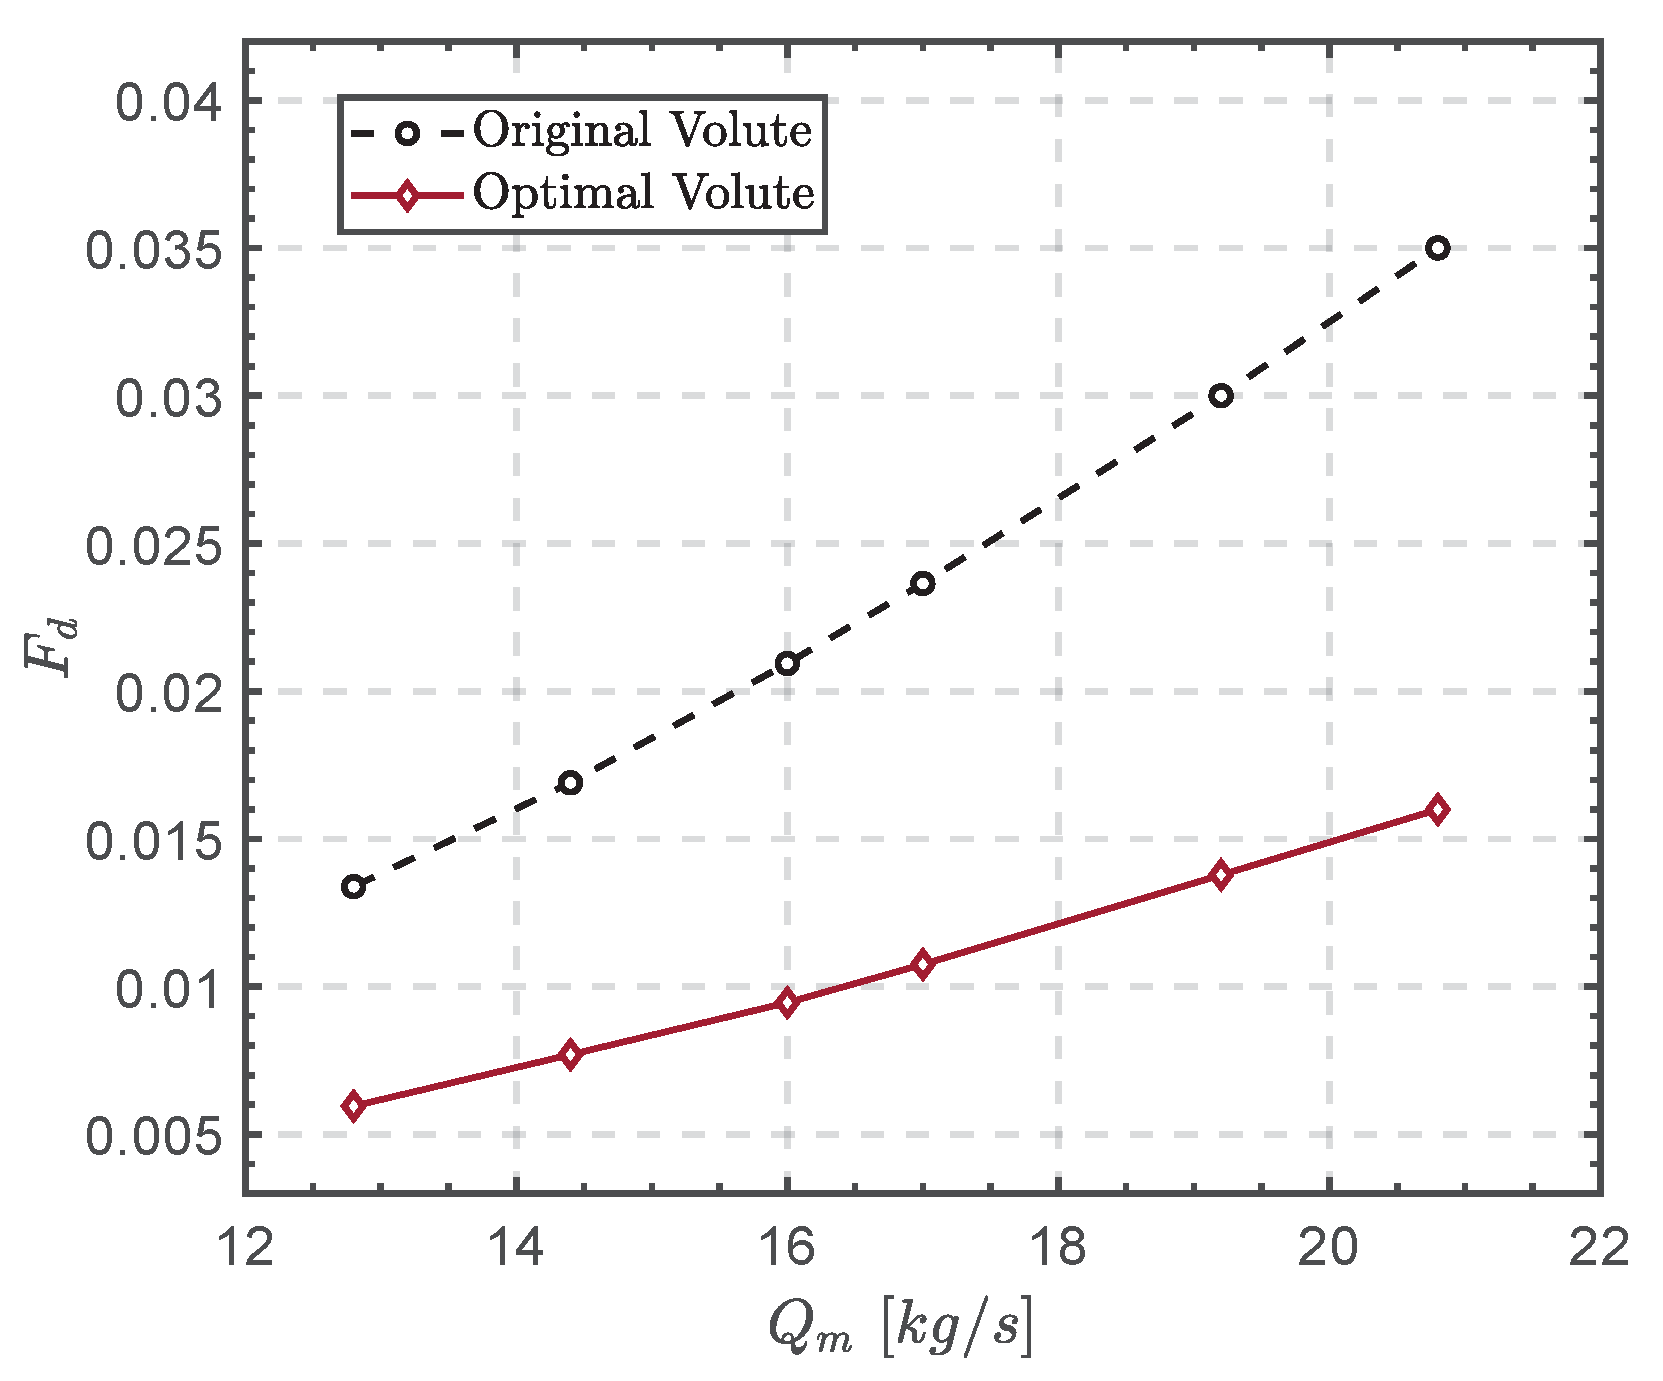
5.3. Off Design Performance Analysis of Optimal Volute

To ensure that the optimized intake volute has good off-design condition characteristics, we compare the total pressure loss coefficient K s and flow rate F d of the original and optimized volutes under different flow conditions to explore the performance of the optimized volute shape in a wide working range.
In this paper, the performance curves of K s and flow distortion F d as a function of flow rate are obtained for optimized and original volutes at 12.8 kg/s, 14.4 kg/s, 16 kg/s, 17 kg/s, 19.2 kg/s, and 20.8 kg/s mass flow rates, respectively, as shown in Figure 14 and Figure 15. From Figure 15, it can be seen that F d ascends continuously with the increase of flow rate. This is because with the increasing flow rate and the fixed size of the volute, the flow velocity inside the volute will gradually increase, which will lead to the intensification of the loss inside the volute and the flow field disturbance, which will finally show the ascend of F d in the outlet section. However, there is a decreasing trend of K s with an increasing flow rate in Figure 14. This is because when the flow rate grows, the dynamic pressure also increases. Therefore, although the internal loss of the volute has increased, according to Equation (8), K s still appears to have a slight reduction.
Furthermore, by comparing the off-design condition performance curves of the optimal and original volutes with respect to K s and F d , it is obvious that the optimized volute has a smaller total pressure loss coefficient and flow distortion at design point and non-design point conditions. Moreover, the performance curves of the optimized volute are smooth under off-design conditions, that is, the optimized volute is more robust than the original one.
In Figure 16, we display the velocity contours of the optimal and original volute at the mid-span under different mass flow rates, including 12.8 kg/s, 14.4 kg/s, 16 kg/s, 17 kg/s, and 19.2 kg/s. It can be seen from the figure that the flow velocity of the working fluid inside the original volute is always greater than the optimized one. Moreover, there is a large velocity gradient inside the original volute, especially for a high mass flow rate. Furthermore, the flow field of the volute has a large variation under different flow conditions. In contrast, the optimized volute has a uniform internal flow field, and the velocity field does not change drastically between different flow conditions. It again confirms that, as shown in Figure 14 and Figure 15, the optimized volute has more robust and better flow performance.

6. Conclusions

To reduce the flow losses and flow distortions in the supercritical CO2 centripetal turbine inlet volute, this paper employs the Bayesian optimization algorithm based on numerical simulation to optimize the inlet volute. A sensitivity analysis of the design parameters global spread angle α , corner radius factor R, and outlet size factor b is first performed, and the results show that b has the most powerful effect on the total pressure loss coefficient K s and flow distortion F d . The flow field structure and off-design condition performance of the optimized and original volutes are thereby comprehensively compared. The results show that the optimized volute has a more uniform internal flow field, less flow distortion in the outlet section, and significantly lower flow losses under the design conditions. The total pressure loss coefficient is reduced by 33.26%, and the flow distortion is reduced by 54.55%. The optimized volute also decreases the flow loss and flow distortion under non-design conditions and has a smooth performance curve.

Author Contributions

Conceptualization, C.B. and S.Z.; methodology, C.B., H.L., S.Z., J.Y. and X.W.; software, C.B., F.Z. and S.Z.; validation, C.B. and S.Z.; formal analysis, C.B.; investigation, C.B.; resources, C.B., F.Z. and S.Z.; data curation, C.B. and S.Z.; writing—original draft preparation, C.B.; writing—review and editing, C.B.; visualization, C.B.; supervision, X.W., J.Y. and H.L.; project administration, X.W., J.Y. and H.L.; funding acquisition, X.W. and H.L. All authors have read and agreed to the published version of the manuscript.

Funding

The research is supported by the National Key R&D Program of China, grant number 2016YFB0600104, the National Natural Science Foundation of China, grant number 52005074, the Fundamental Research Funds for the Central Universities, grant number DUT19RC(3)070, and the Research and Innovation in Science and Technology Major Project of Liaoning Province, grant number 2019JH1-10100024.

Institutional Review Board Statement

Not applicable.

Informed Consent Statement

Not applicable.

Data Availability Statement

Not applicable.

Acknowledgments

The authors would like to gratefully thank the collaborative innovation center of major machine manufacturing in Liaoning for the support during this research.

Conflicts of Interest

The authors declare no conflict of interest.

Abbreviations

S - CO 2 Supercritical carbon dioxide
BOBayesian optimization
CFDComputational fluid dynamics
SASpalart–Allmaras
NISTThe national institute of standards and technology
ICEMThe integrated computer engineering and manufacturing code
RMSERoot mean square error
MAEMaximum absolute error
MREMaximum relative error
EIExpected improvement
PIProbability of improvement
GAGenetic algorithm
DOEDesign of experiment
GPGaussian processes
RBFRadial basis function
PRSPolynomial response surface
MARSMultivariate adaptive regression splines

References

  1. Apostolos, A.G.; Anastassios, M.S.; Anestis, I.K. Recuperators Investigation for High Temperature Supercritical Carbon Dioxide Power Generation Cycles. Appl. Therm. Eng. 2017, 125, 1094–1102. [Google Scholar]
  2. Chen, Y. Thermodynamic Cycles using Carbon Dioxide as Working Fluid: CO2 Transcritical Power Cycle Study. Toxicol. In Vitro 2017, 25, 206–212. [Google Scholar]
  3. Dostal, V.; Driscoll, M.J.; Hejzlar, P. Advanced Nuclear Power Technology Program. In A Supercritical Carbon Dioxide Cycle for Next Generation Nuclear Reactors; MIT: Cambridge, MA, USA, 2004. [Google Scholar]
  4. Sienicki, J.J.; Moisseytsev, A.; Fuller, R.L.; Wright, S.A.; Pickard, P.S. Scale Dependencies of Supercritical Carbon Dioxide Brayton Cycle Technologies and the Optimal Size for a Next-Step Supercritical CO2 Cycle Demonstration. In Proceedings of the SCO2 Power Cycle Symposium, Boulder, CO, USA, 24–25 May 2011; pp. 24–25. [Google Scholar]
  5. Simpson, A.T.; Stephen, S.; John, W. A Comparison of the Flow Structures and Losses Within Vaned and Vaneless Stators for Radial Turbines. J. Turbomach.-Trans. ASME 2009, 131, 031010. [Google Scholar] [CrossRef]
  6. Suhrmann, J.F.; Peitsch, D.; Gugau, M.; Heuer, T. On the Effect of Volute Tongue Design on Radial Turbine Performance. In Proceedings of the ASME Turbo Expo 2012: Turbine Technical Conference and Exposition, Copenhagen, Denmark, 11–15 June 2012; pp. 891–901. [Google Scholar]
  7. Lee, S.P.; Jupp, M.L.; Nickson, A.K. The Influence of Secondary Flow Structures in a Turbocharger Turbine Housing in Steady State and Pulsating Flow Conditions. In Proceedings of the 2016 7th International Conference on Mechanical and Aerospace Engineering (ICMAE), London, UK, 18–20 July 2016; IEEE: Piscataway, NJ, USA, 2016; pp. 154–159. [Google Scholar]
  8. Yang, M.; Martinez-Botas, R.; Rajoo, S.; Yokoyama, T.; Ibaraki, S. An Investigation of Volute Cross-Sectional Shape on Turbocharger Turbine under Pulsating Conditions in Internal Combustion Engine. Energy Convers. Manag. 2015, 105, 167–177. [Google Scholar] [CrossRef] [Green Version]
  9. Lee, S.P.; Barrans, S.M.; Jupp, M.L.; Nickson, A.K. The Impact of Volute Aspect Ratio on the Performance of a Mixed Flow Turbine. Aircr. Eng. Aerosp. Technol. 2017, 4, 56. [Google Scholar] [CrossRef] [Green Version]
  10. Lee, S.P.; Jupp, M.L.; Nickson, A.K.; Allport, J.M. Analysis of a Tilted Turbine Housing Volute Design under Pulsating Inlet Conditions. In Proceedings of the ASME Turbo Expo 2017: Turbomachinery Technical Conference and Exposition, Charlotte, NC, USA, 26–30 June 2017. [Google Scholar]
  11. Huang, J.; Xu, S.; Liu, H.; Wang, X. Robust Performance Optimization of Centrifugal Compressor Volute with a Rectangular Cross-Section. In Proceedings of the ASME Turbo Expo 2015: Turbine Technical Conference and Exposition, Montreal, QC, Canada, 15 June 2015. [Google Scholar]
  12. Du, X.; Yu, D.; Luo, D.; Huang, D. Supercritical Carbon Dioxide Centripetal Compressor—Aerodynamic Design and Analysis of Off Design Conditions. J. Nucl. Eng. Radiat. Sci. 2019, 5, 041209. [Google Scholar] [CrossRef]
  13. Zhu, C.; Shao, W.Y.; Ma, Z.Y.; Lv, G.C.; Wang, X.F. Investigation on Interaction between Geometry and Performance and Design of S-CO2 Radial Inflow Turbine’s Vaneless Inlet Volute. IOP Conf. Ser. Mater. Sci. Eng. 2021, 1081, 012009. [Google Scholar] [CrossRef]
  14. Liu, H.; Xu, S.; Wang, X.; Wu, J.; Song, Y. A Global Optimization Algorithm for Simulation-Based Problems via the Extended DIRECT Scheme. Eng. Optim. 2015, 47, 1441–1458. [Google Scholar] [CrossRef]
  15. Liu, H.; Ong, Y.S.; Cai, J. A Survey of Adaptive Sampling for Global Metamodeling in Support of Simulation-Based Complex Engineering Design. Struct. Multidiscip. Optim. 2018, 57, 393–416. [Google Scholar] [CrossRef]
  16. Moustapha, H. Axial and Radial Turbines; Concepts NREC: White River Junction, VT, USA, 2003. [Google Scholar]
  17. Chen, H. Design Methods of Volute Casings for Turbocharger Turbine Applications. Proc. Inst. Mech. Eng. Part A J. Power Energy 1996, 210, 149–156. [Google Scholar] [CrossRef]
  18. Owarish, H.O.; Ilyas, M.; Bhinder, F.S. A Two-Dimensional Flow Analysis Model for Designing a Nozzle-less Volute Casing for Radial Flow Gas Turbines. J. Turbomach.-Trans. ASME 1992, 114, 402–410. [Google Scholar] [CrossRef]
  19. Ayder, E.; Van den Braembussche, R.; Brasz, J.J. Experimental and Theoretical Analysis of the Flow in a Centrifugal Compressor Volute. J. Turbomach.-Trans. ASME 1993, 115, 582–589. [Google Scholar] [CrossRef]
  20. Ayder, E.; Van den Braembussche, R. Numerical Analysis of the Three-Dimensional Swirling Flow in Centrifugal Compressor Volutes. J. Turbomach.-Trans. ASME 1994, 116, 462–468. [Google Scholar] [CrossRef]
  21. Lv, G.; Yang, J.; Shao, W.; Wang, X. Aerodynamic Design Optimization of Radial-Inflow Turbine in Supercritical CO2 Cycles using a One-Dimensional Model. Energy Convers. Manag. 2018, 165, 827–839. [Google Scholar] [CrossRef]
  22. Roache, P.J.; Ghia, K.; White, F. Editorial Policy Statement on the Control of Numerical Accuracy. ASME J. Fluids Eng. 1986, 108, 2. [Google Scholar] [CrossRef] [Green Version]
  23. Eça, L.; Hoekstra, M.; Roache, P. Verification of Calculations: An Overview of the 2nd Lisbon Workshop. In Proceedings of the 18th AIAA Computational Fluid Dynamics Conference, Miami, FL, USA, 25–28 June 2007. [Google Scholar]
  24. Abedi, M.; Askari, R.; Sepahi-Younsi, J.; Soltani, M.R. Axisymmetric and Three-Dimensional Flow Simulation of a Mixed Compression Supersonic Air Inlet. Propuls. Power Res. 2020, 9, 51–61. [Google Scholar] [CrossRef]
  25. Joe, S.; Kuo, F.Y. Constructing Sobol Sequences with Better Two-Dimensional Projections. SIAM J. Sci. Comput. 2008, 30, 2635–2654. [Google Scholar] [CrossRef] [Green Version]
  26. Rasmussen, C.E.; Williams, C.K.I. Gaussian Processes for Machine Learning; The MIT Press: Cambridge, MA, USA, 2005; pp. 1–30. [Google Scholar]
  27. Karkee, M.; Steward, B.L. Local and Global Sensitivity Analysis of a Tractor and Single Axle Grain Cart Dynamic System Model. Biosyst. Eng. 2010, 106, 352–366. [Google Scholar] [CrossRef]
  28. Burnaev, E.; Panin, I.; Sudret, B. Efficient Design of Experiments for Eensitivity Analysis Based on Polynomial Chaos Expansions. Ann. Math. Artif. Intell. 2017, 81, 187–207. [Google Scholar] [CrossRef] [Green Version]
  29. Sobolá, I.M. Global Sensitivity Indices for Nonlinear Mathematical Models and Their Monte Carlo Estimates. Math. Comput. Simul. 2001, 55, 271–280. [Google Scholar] [CrossRef]
  30. Al, R.; Behera, C.R.; Zubov, A.; Gernaey, K.V.; Sin, G. Meta-Modeling Based Efficient Global Sensitivity Analysis for Wastewater Treatment Plants—An Application to the BSM2 Model. Comput. Chem. Eng. 2019, 127, 233–246. [Google Scholar] [CrossRef]
  31. Letham, B.; Karrer, B.; Ottoni, G.; Bakshy, E. Constrained Bayesian Optimization with Noisy Experiments. Bayesian Anal. 2019, 14, 495–519. [Google Scholar] [CrossRef]
  32. Snoek, J.; Larochelle, H.; Adams, R.P. Practical Bayesian Optimization of Machine Learning Algorithms. Adv. Neural Inf. Process. Syst. 2012, 25, 2951–2959. [Google Scholar]
  33. Ghosh, S.; Mondal, S.; Fernandez, E.; Kapat, J.S.; Roy, A. Parametric Shape Optimization of Pin-Fin Arrays Using a Surrogate Model-Based Bayesian Method. J. Thermophys. Heat Transf. 2021, 35, 245–255. [Google Scholar] [CrossRef]
  34. Bonfiglio, L.; Perdikaris, P.; Brizzolara, S.; Karniadakis, G.E. Multi-Fidelity Optimization of Super-Cavitating Hydrofoils. Comput. Methods Appl. Mech. Eng. 2018, 332, 63–85. [Google Scholar] [CrossRef]
  35. Tran, A.; Sun, J.; Furlan, J.M.; Pagalthivarthi, K.V.; Visintainer, R.J.; Wang, Y. pBO-2GP-3B: A Batch Parallel Known/Unknown Constrained Bayesian Optimization with Feasibility Classification and Its Applications in Computational Fluid Dynamics. Comput. Methods Appl. Mech. Eng. 2019, 347, 827–852. [Google Scholar] [CrossRef]
  36. Jones, D.R.; Schonlau, M.; Welch, W.J. Efficient Global Optimization of Expensive Black-Box Functions. J. Glob. Optim. 1998, 13, 455–492. [Google Scholar] [CrossRef]
Figure 1. Three-dimensional illustration of the studied volute.
Machines 09 00218 g001
Figure 2. Mesh model of the volute.
Machines 09 00218 g002
Figure 3. Schematic diagram of the volute cross section.
Machines 09 00218 g003
Figure 4. Bayesian optimization flow chart for the design of volute.
Machines 09 00218 g004
Figure 5. Bayesian Optimization diagram based on Gaussian process.
Machines 09 00218 g005
Figure 6. Minimizing the EI acquisition function to query new point.
Machines 09 00218 g006
Figure 7. Sensitivity analysis of design parameters to the total pressure loss coefficient.
Machines 09 00218 g007
Figure 8. Sensitivity analysis of design parameters to the flow distortion.
Machines 09 00218 g008
Figure 9. Static pressure contours at the volute mid section, (left) original volute, (right) optimal volute.
Machines 09 00218 g009
Figure 10. Velocity field contours at the volute mid-span section, (left) original volute, (right) optimal volute.
Machines 09 00218 g010
Figure 11. Flow distortion at the volute mid-span section, (left) original volute, (right) optimal volute.
Machines 09 00218 g011
Figure 12. Flow fields at different azimuthal positions in the inlet volute with different cross-sectional shapes.
Machines 09 00218 g012
Figure 13. Static temperature contours on the meridional plane of the radial-inflow turbine with the original volute (left) and the optimal volute (right).
Machines 09 00218 g013
Figure 14. Performance comparison of optimized volute and original volute for the total pressure loss coefficient under off-design conditions.
Machines 09 00218 g014
Figure 15. Performance comparison of optimized volute and original volute for the flow distortion under off-design conditions.
Machines 09 00218 g015
Figure 16. Velocity field contours at the volute mid-span section under different working conditions, (left) original volute, (right) optimal volute.
Machines 09 00218 g016
Table 1. The boundary conditions for the numerical simulation model of the intake volute.
ItemSymbolUnitValue
Inlet total temperature T t , i n K773.15
Inlet total pressure P t , i n MPa20
Outlet static pressure P o u t MPa19.62
Mass flow rate Q m kg/s16
Table 2. Grid convergence study using total outlet pressure as an indicator.
ItemSymbolValue
Grid refinement ratio between N 2 and N 1 r 21 1.28
Grid refinement ratio between N 3 and N 2 r 32 1.30
The order of convergenceP1.0520
The extrapolated values between ϕ 2 and ϕ 1 ϕ e x t 21 19,882,247 (Pa)
The extrapolated values between ϕ 3 and ϕ 2 ϕ e x t 32 19,980,611 (Pa)
Approximate relative error between ϕ 2 and ϕ 1 e α 21 0.004405
Approximate relative error between ϕ 3 and ϕ 2 e α 32 0.004205
Extrapolated relative error between ϕ 2 and ϕ 1 e e x t 21 0.035960
Extrapolated relative error between ϕ 3 and ϕ 2 e e x t 32 0.032185
The fine-grid convergence index between N 2 and N 1 G C I 21 0.032185
The fine-grid convergence index between N 3 and N 2 G C I 32 0.308447
Table 3. Design variables and their ranges of the volute.
SymbolRangeParameterUnit
α [10, 30]Global spread angle of the volute°
R[70, 200]Corner radius factor of the volute cross-sectionmm
b[200, 300]Outlet size factor of the volutemm
Table 4. Model accuracy of the two optimization indicators for different surrogate models.
SymbolSurrogate Model R 2 RMSEMAEMRE
K s GP0.98610.00460.01010.0513
RBF0.95960.00790.01460.1007
PRS0.98470.00490.00790.0643
MARS0.96380.00750.01290.0658
F d GP0.99800.00040.00080.0515
RBF0.96330.00160.00360.2643
PRS0.98470.00050.00790.0642
MARS0.96370.00750.01290.0658
Table 5. Comparison of surrogate model optimization results and numerical simulation results.
α (°)R (mm)b (mm) K s Relative Error (%)
BONumerical Calculation
24.252003000.11770.11621.25%
Table 6. Comparison of numerical results between optimized volute and original volute.
Item α (°)R (mm)b (mm) F d K s
original201352500.02090.1741
optimal24.252003000.00950.1162
Improvement///54.55%33.26%
Table 7. The effect of original and optimal volute on the impeller’s performance.
ItemTotal Pressure RatioIsentropic Efficiency
Impeller matching original volute0.41970.9095
Impeller matching optimal volute0.41950.9111
Publisher’s Note: MDPI stays neutral with regard to jurisdictional claims in published maps and institutional affiliations.

