Abstract
In order to improve vehicle control safety in intelligent and connected environments, a fuzzy drive control strategy is proposed. Through the fusion of vehicle driving data, an early warning level model was established, and the fuzzy control method was used to obtain the appropriate torque command under the vehicle condition; torque optimization processing was performed according to the different corresponding vehicle following characteristics. The control strategy was tested and verified on an established platform. Based on the experimental results, compared with the traditional drive strategy in one-way front and rear following scenarios, the vehicle avoided excessive opening and closing of the accelerator pedal when the distance between vehicles was close, maintained the correct distance in the following situation, and had better dynamic response when the distance between vehicles was large, indicating that the proposed drive strategy had a better real-time and security performance.
1. Introduction
Due to the development of the automobile industry, traffic congestion and environmental pollution have gradually become the most significant problems in the urban transportation system [1,2]. As a result, various countries have launched research on Intelligent and Connected Vehicles (ICVs). ICVs [3] use sensors, controllers and other equipment to share information and data with the external environment of the vehicle. At the same time, they can make intelligent decisions and output the shared data in combination with the vehicle condition. An ICV is a vehicle with a partially or fully autonomous driving function [4].
As one of the most important components of automobile architecture, the Vehicle Controller Unit (VCU) is the processing center for analyzing driving requirements between the driver and the vehicle [5]. The vehicle controller mainly realizes the functions of vehicle driving requirements, CAN network management, fault diagnosis and energy management [6]. As the control core of the vehicle, the vehicle controller is responsible for monitoring of the battery system, motor system and other modules in the vehicle through the signal acquisition capacity of the CAN bus [7]. The digital, analog, and switch signals in the external circuit are used to analyze the driver’s driving intentions to obtain an output torque that meets the power requirements, so as to meet the vehicle’s internal control requirements.
Vehicle control strategies have been extensively researched. Sajith et al. [8] proposed different torque control strategies in each gear mode, distinguished three driving modes (economic, linear, and power modes) and formulated torque output rules according to the three modes. In reference to the problem of vehicle power demand, [9] proposed that in linear pedal mode, the driver’s pedal opening and the rate of change of pedal opening be used as input, and a fuzzy controller be designed to control the torque output. Gao et al. [10] proposed a power distribution strategy to achieve the function of power optimization by establishing an ideal braking force distribution curve, energy recovery, and parallel distribution methods. Jaehyun et al. [11] proposed an integrated approach combining automated driving controls and signal preemption. Zhang et al. [12] presented a model adaptive torque control and distribution method. Masjosthusmann et al. [13] proposed a fuzzy algorithm based on particle swarm optimization to solve the problem of optimal distribution of power considering the parameters of the braking torque in the energy feedback process, which greatly improved the efficiency of the motor’s energy recovery. Hao et al. [14] proposed an eco-driving strategy involving coordinated control for an intelligent electric vehicle (IEV). Fu et al. [15] proposed a model predictive control (MPC) strategy integrating Markov chain driving intention identification to avoid unnecessary driving mode switching (DMS). Qi [16] proposed a fuzzy control strategy which could meet the requirements of road cycle conditions and drivers’ driving intentions and take into account the vehicle operating states. Guo et al. [17] presented a supervisory control strategy for distributed drive electric vehicles to coordinate vehicle handling, lateral stability, and economical energy performance. The above research mainly focused on drive control strategies incorporating data for a single vehicle, without combining driving information from surrounding vehicles.
With the development of intelligent networked technology, multiple vehicles can transmit and exchange information within communication range, so as to integrate connected information to realize vehicle control. Wang et al. [18] proposed an eco-driving strategy for connected and automated hybrid electric vehicles (CAHEVs), using real-time traffic information via vehicle-to-vehicle (V2V) and vehicle-to-infrastructure (V2I) transmission. Li et al. [19] presented an optimization model for an electric vehicle (EV) transportation system to achieve eco-driving. Ma et al. [20] described a predictive optimization strategy considering a V2V topological communication structure of leader–predecessor–follower. Zhang et al. [21] proposed a real-time control algorithm for parallel hybrid electric vehicles (HEVs) in a connected environment. Zhang et al. [22] proposed a constrained optimization model to facilitate real-time updating of the optimal speed in connected vehicles. Lu et al. [23] proposed a novel speed control method for signalized intersections using V2I and V2V technology.
In the above studies, research on the driving strategy of the controller has mostly focused on traditional torque calculation methods, with less attention paid to fusion with connected data. Research on fused connected data has mainly focused on the design and research of vehicle decision-making control models and methods. In this paper, for pure electric vehicles, the traditional torque calculation method is improved and integrated with connected data. The main contributions of this paper can be summarized as follows:
(i) For pure electric vehicles, the traditional torque calculation method is fused with connected data, after which an intelligent and connected based vehicle controller control strategy is proposed.
(ii) Based on the fusion of vehicle driving data, an early warning level model is established and a fuzzy control method is used to obtain a suitable torque under the current vehicle condition, after which the torque is optimized for different corresponding vehicle following characteristics.
(iii) A test platform was established to verify the designed strategy. The experimental results showed that, compared with the traditional driving strategy, the intelligent and connected driving control strategy is more sensitive to factors such as the distance and speed of the front and rear vehicles, and the vehicle can maintain a safer position during driving.
The rest of the paper is organized as follows. In Section 2, the vehicle controller control strategy framework is described. The fuzzy drive control strategy integrating connected data is detailed in Section 3. Section 4 presents the experimental results and analysis of the proposed method and the traditional method. Finally, a conclusion is provided in Section 5.
2. VCU Control Strategy Framework
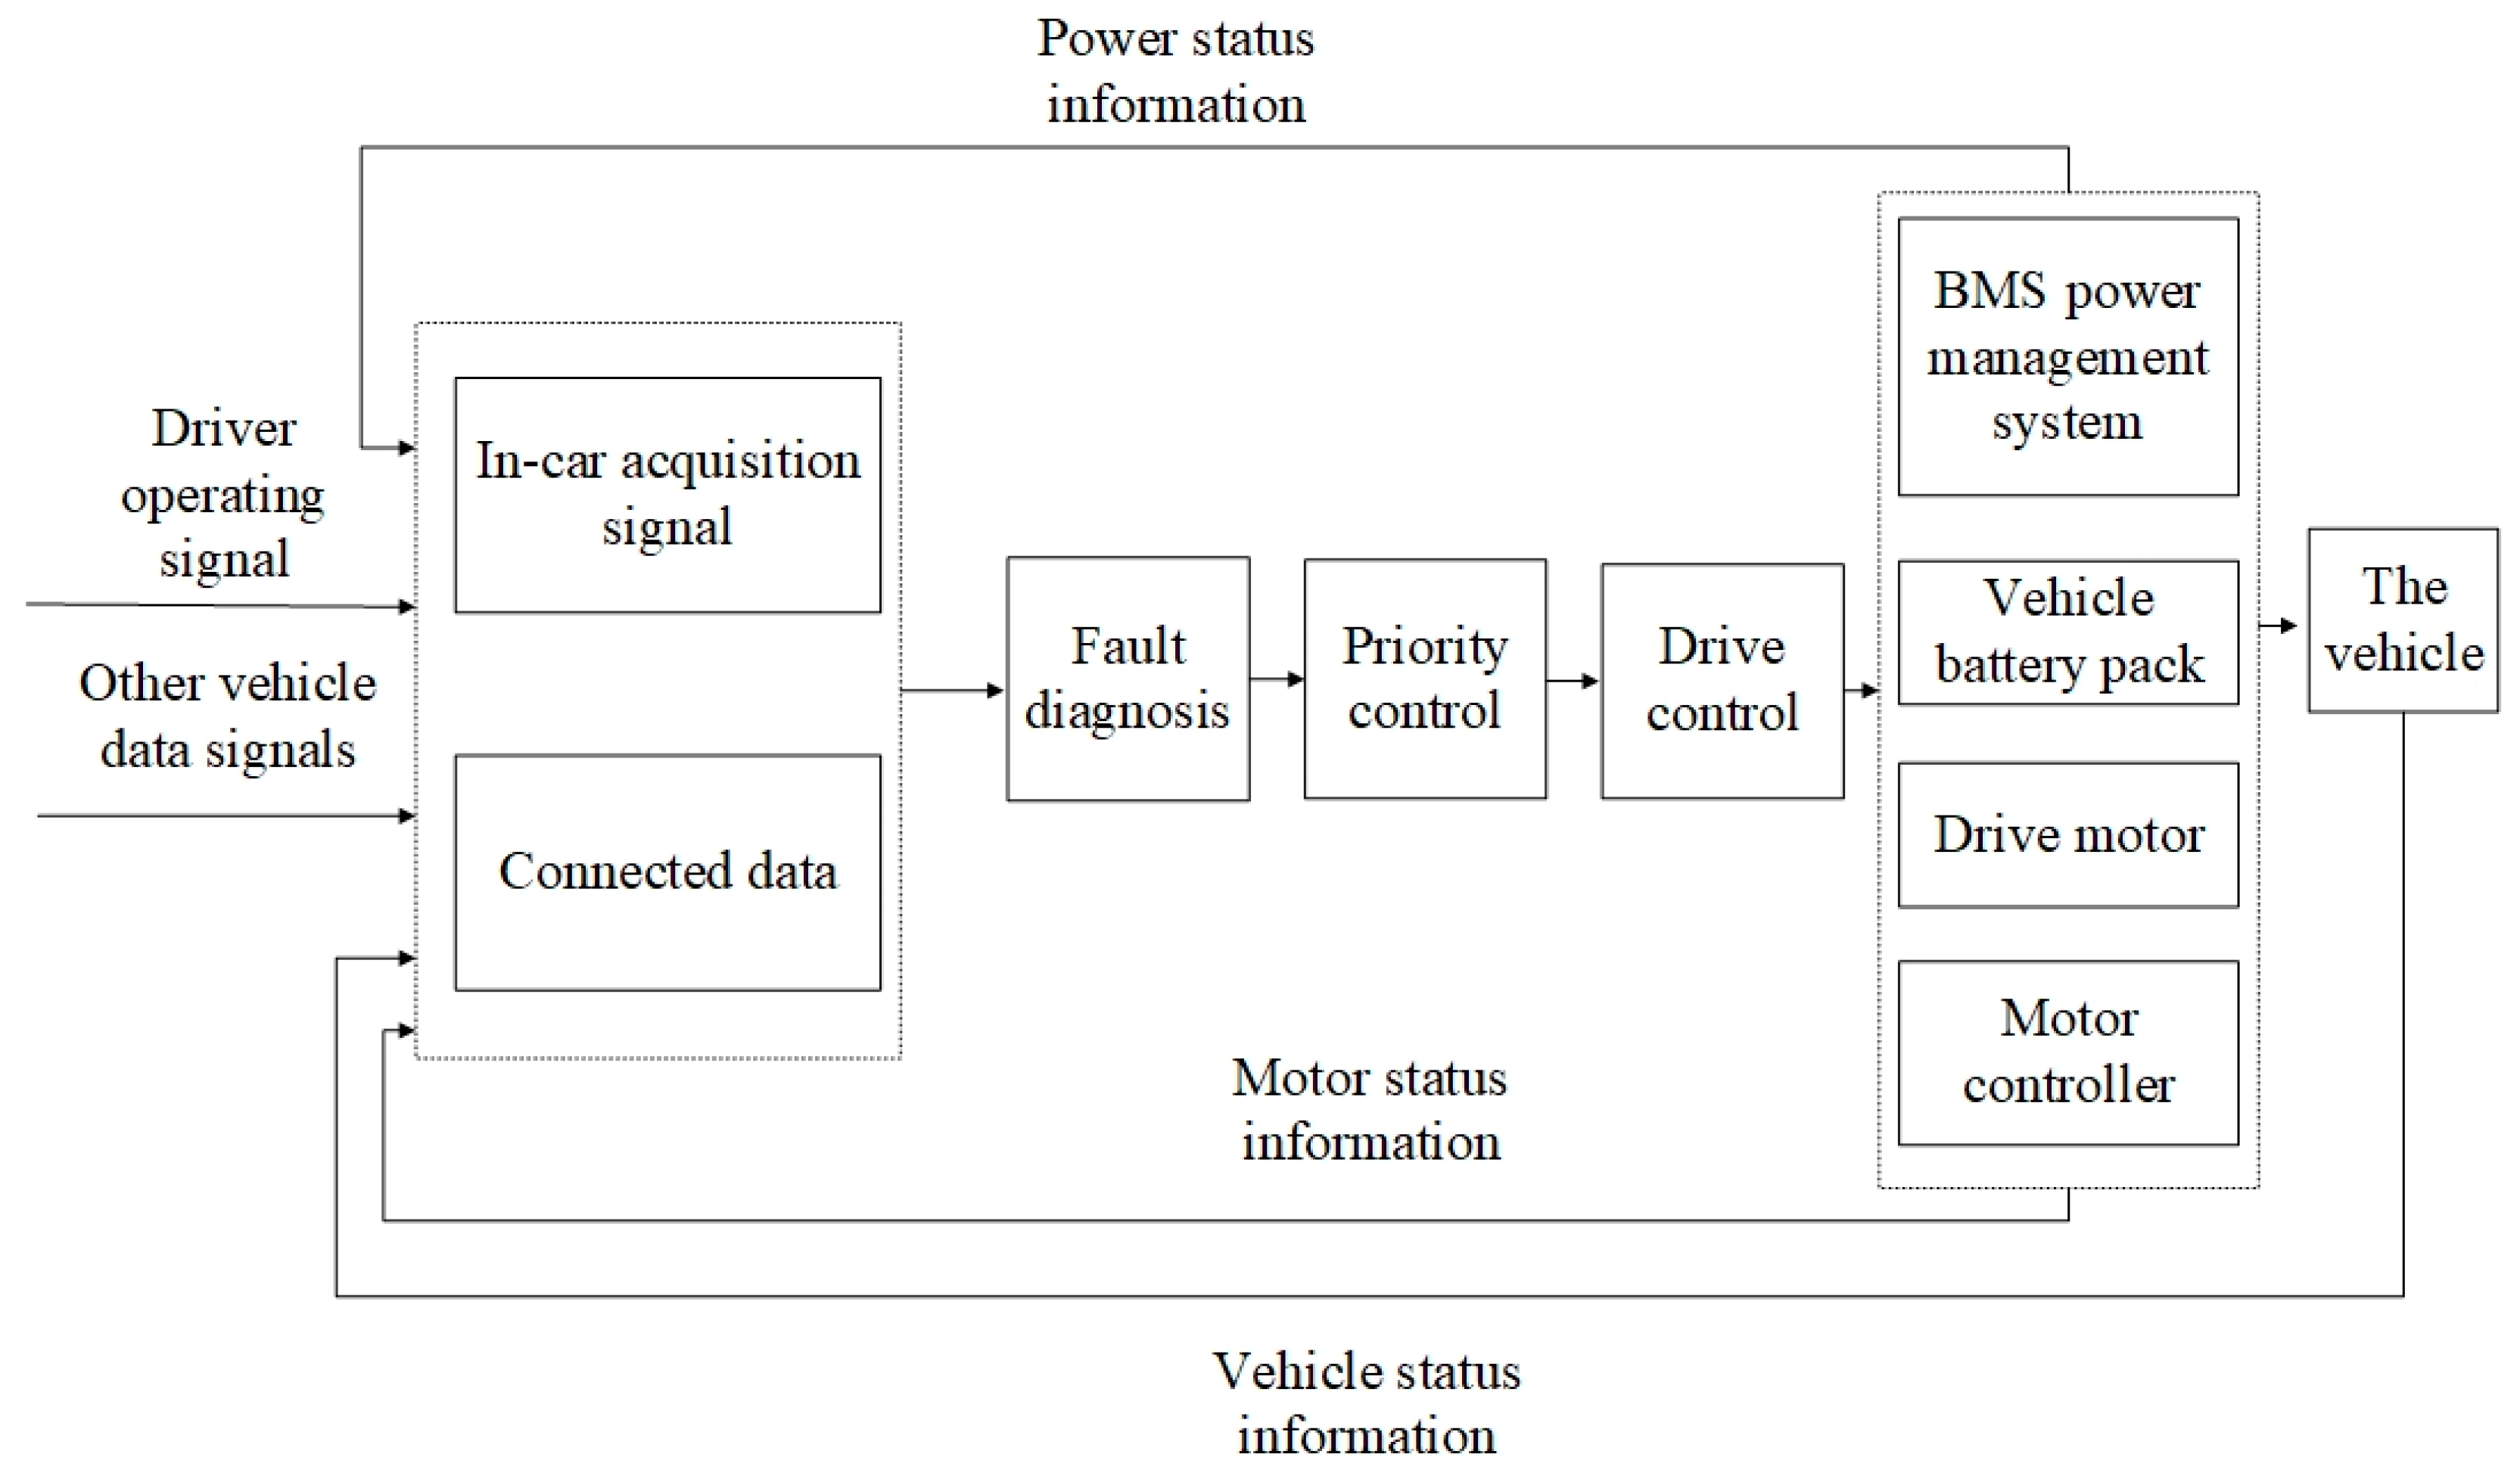
The driving strategy and the fault handling strategy were formulated based on the different working conditions of the vehicle and the actions of the driver, respectively, and the priority according to the different vehicle working conditions was set to ensure the normal operation of the vehicle under the established control strategy. The overall framework for the control strategy of the intelligent networked vehicle controller is shown in Figure 1.
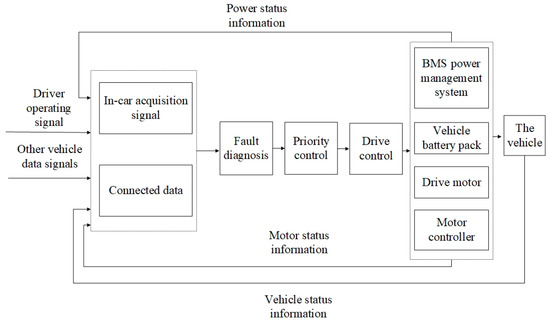
Figure 1.
Schematic diagram of the intelligent and connected VCU control strategy process.
The definition of priority mainly included the classification of charging conditions, driving conditions and braking conditions. When the vehicle was connected for charging, the vehicle controller communicated with the on-board battery pack to obtain charging information through the CAN bus. At this time, the vehicle was considered to be in charging mode. When the vehicle controller obtained the driver’s operation signal, the vehicle was considered to be in driving mode. When the brake pedal signal was detected, the vehicle was considered to be in braking mode. Of these three working conditions, the brake working condition had the highest, the charging working condition the second, and the driving working condition the lowest priority. When the vehicle entered the starting state, defined as the vehicle controller detecting the accelerator pedal signal and the charging signal at the same time, the accelerator pedal signal was forcibly set to zero, that is, the charging prohibition driving mode. When both the accelerator pedal signal and the brake pedal signal were detected at the same time, the accelerator pedal was forced to zero, that is, the brake priority processing method.
The fault handling strategy mainly provided a protective effect for ensuring the operation of each component in the vehicle system. Classification was based on the importance of each control module in the vehicle control system. The fault level was classified as one of three levels: the first level referred to core module failure, which mainly includes the acquisition signal circuit module and the motor drive module. In this case, the vehicle would enter a stopped state. The second level was failure of the communication module and power management module. In this case, the vehicle would limit the torque output. The third level was failure of the auxiliary system modules, including the air-conditioning system, entertainment system, etc. In this case, the vehicle would only provide a warning display, and the vehicle could still be driven normally.
The driving strategy was the most important part of the vehicle control strategy, and the main realization process of it could be summarized as: when the vehicle was in driving conditions, the vehicle controller collected the driver’s operation information, and the intelligent network module obtained the operation information of the preceding vehicle. Taking this as the input end of the intelligent networked vehicle controller, they jointly decided the required torque of the motor.
3. Design of the Fuzzy Drive Control Strategy
3.1. Vehicle Drive Control Torque Model
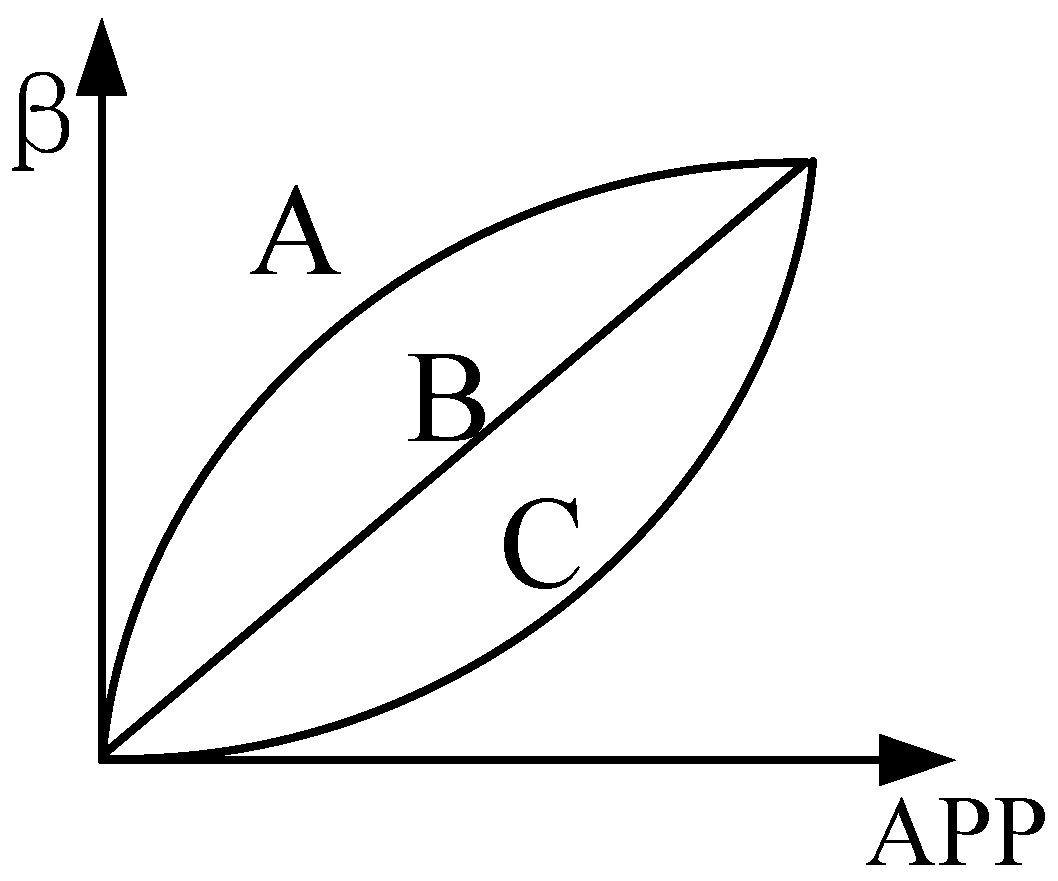
During the driving process of the vehicle, the accelerator pedal opening degree reflects the driver’s required torque to a certain extent. At the same time, the specific value of the output torque is jointly determined according to the internal motor speed of the vehicle. These quantities can be established as a mapping function, as shown in Figure 2, which defines the corresponding relationship between the load torque coefficient β and the vehicle accelerator pedal opening (APP) in the motor system.

Figure 2.
Motor load torque coefficient and accelerator pedal opening function.
There are three corresponding relationships between the load torque coefficient and the accelerator pedal opening, among which curve A is the hard pedal mode, curve B is the linear pedal mode, and curve C is the soft pedal mode. The characteristic of curve A is that the load torque coefficient is larger and the vehicle has a better dynamic response at this time, with poor operating performance but better dynamic performance. The characteristic of curve B is that the load torque coefficient has a linear relationship with the throttle opening, and the operating performance and power performance of the vehicle are both average. The characteristic of curve C is that the load torque coefficient corresponds to a lower value and the vehicle has better operating performance, but the power performance is poor, and the power of the vehicle is weak when accelerating.
Depending on the specific configuration parameters of the vehicle power system, the maximum torque that the motor power system can provide at the current vehicle speed is , and the driver’s demand torque is calculated according to the demand torque coefficient determined by the drive mode:
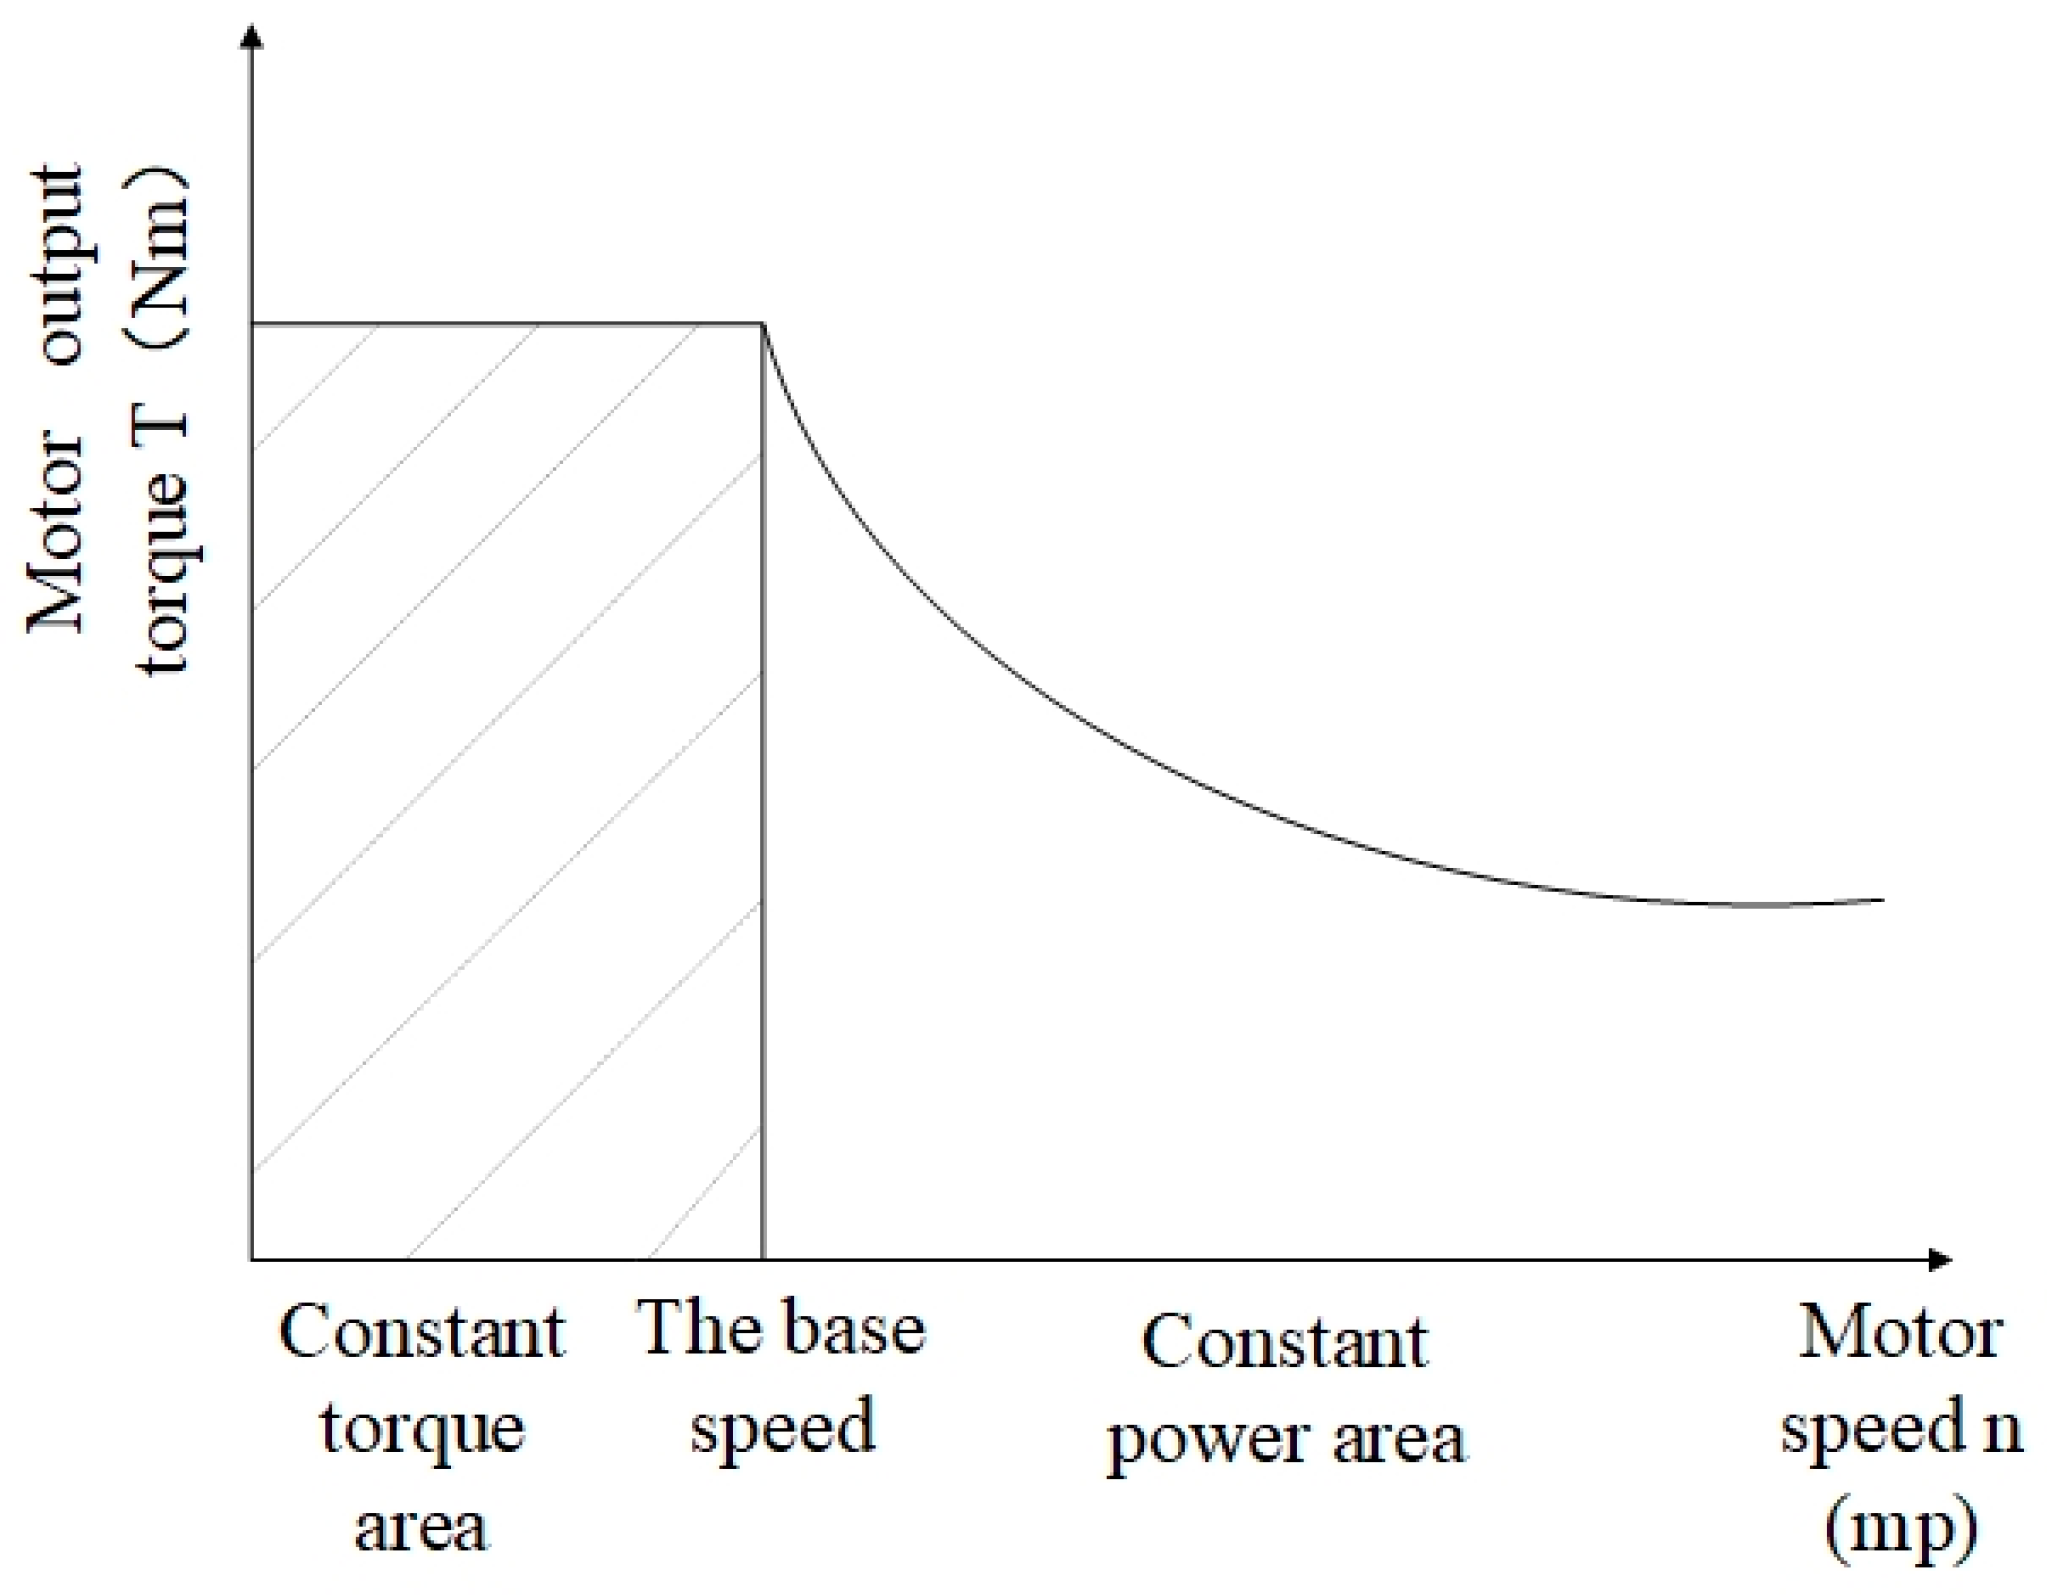
In a motor control system, when the motor speed exceeds the base speed, the motor system cannot maintain the output of the peak torque. Therefore, the torque must be reduced in the system and the constant power output is required. The relationship between speed and torque of the motor system is shown in Figure 3.
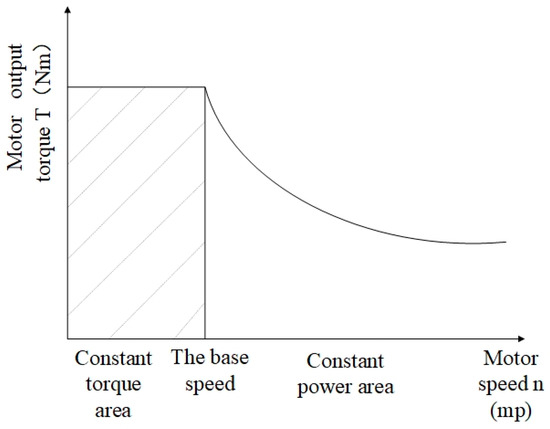
Figure 3.
Schematic diagram of constant torque and constant power control process.
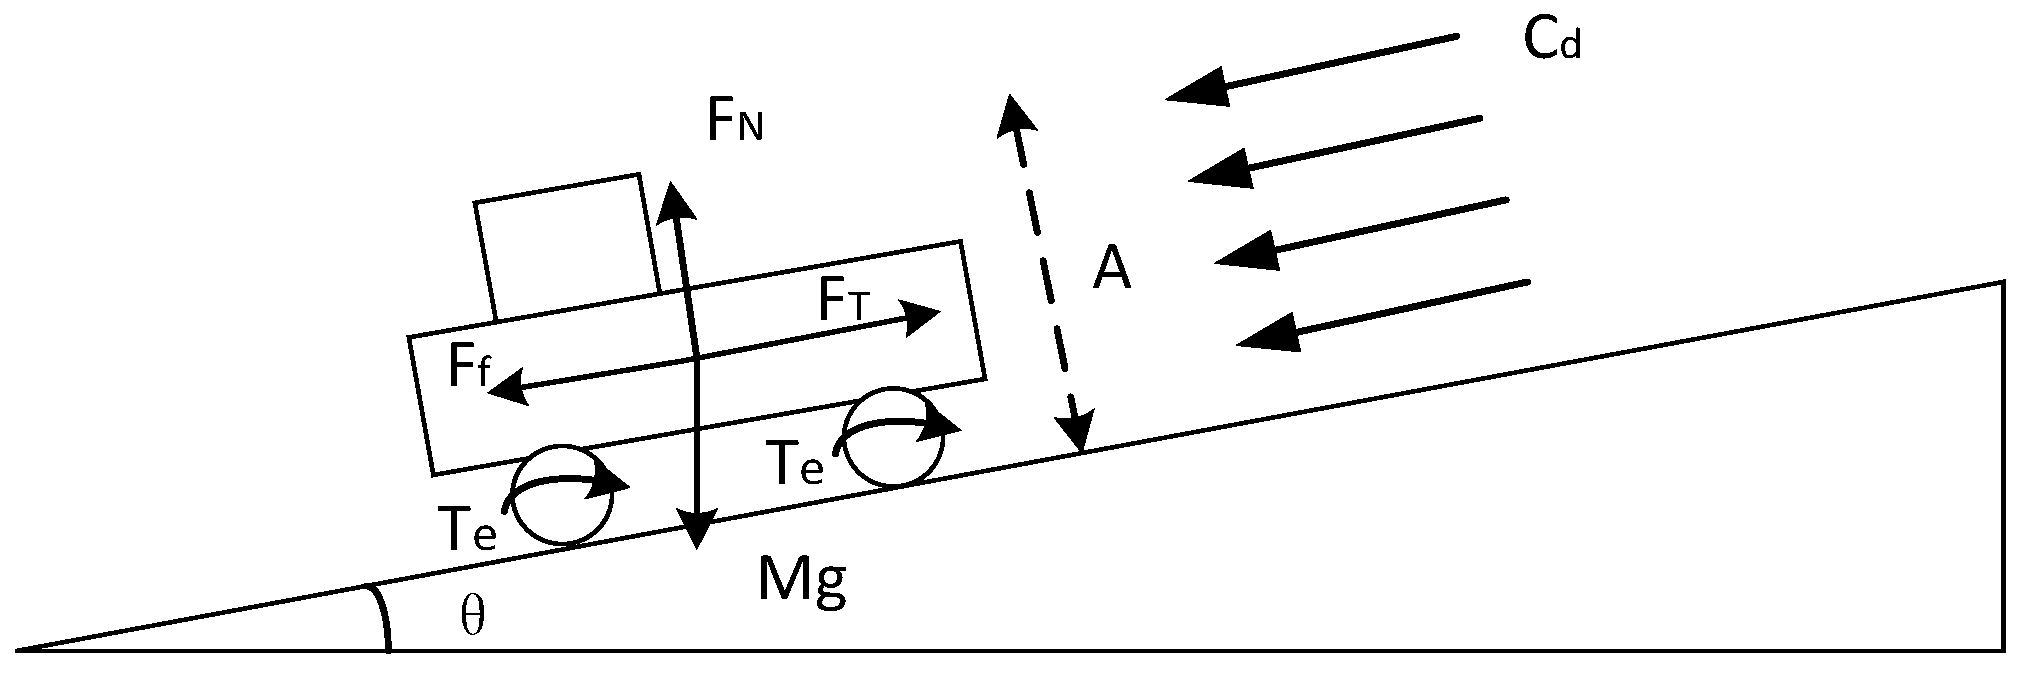
During the vehicle’s driving process, the motor system generates torque output, which is transmitted to the wheels through the transmission device, and the wheels realize the driving function under the conditions of overcoming friction and gradient resistance. The entire driving motion model can be simplified as shown in Figure 4, where FN is the supporting force of the ground on the vehicle, Ff is the friction force downward along the slope, and FT is the driving force of the vehicle angle forward.

Figure 4.
The vehicle dynamics analysis.
Carrying out force analysis on the vehicle:
After sorting out:
where is the motor output torque, is the road gradient, is the acceleration of gravity, is the transmission coefficient of the system, is the vehicle mass, is the vehicle speed, is the windward area of the vehicle, is the air resistance coefficient, is the Rotational quality factor, is the acceleration of the vehicle, is the tire rolling radius of the vehicle, is the vehicle rolling friction coefficient, is the transmission ratio, is the transmission ratio of the main reducer, is the load mass, is the total mass of the load and the vehicle’s own weight.
It can be seen from the above that the accelerator pedal opening has a functional relationship with the output torque, and the output torque has a corresponding relationship with the expected vehicle speed. Therefore, the driver’s expected speed can be calculated according to the actual motor speed and output torque, and the expected speed can be obtained from this value.
3.2. Fuzzy Drive Control Strategy
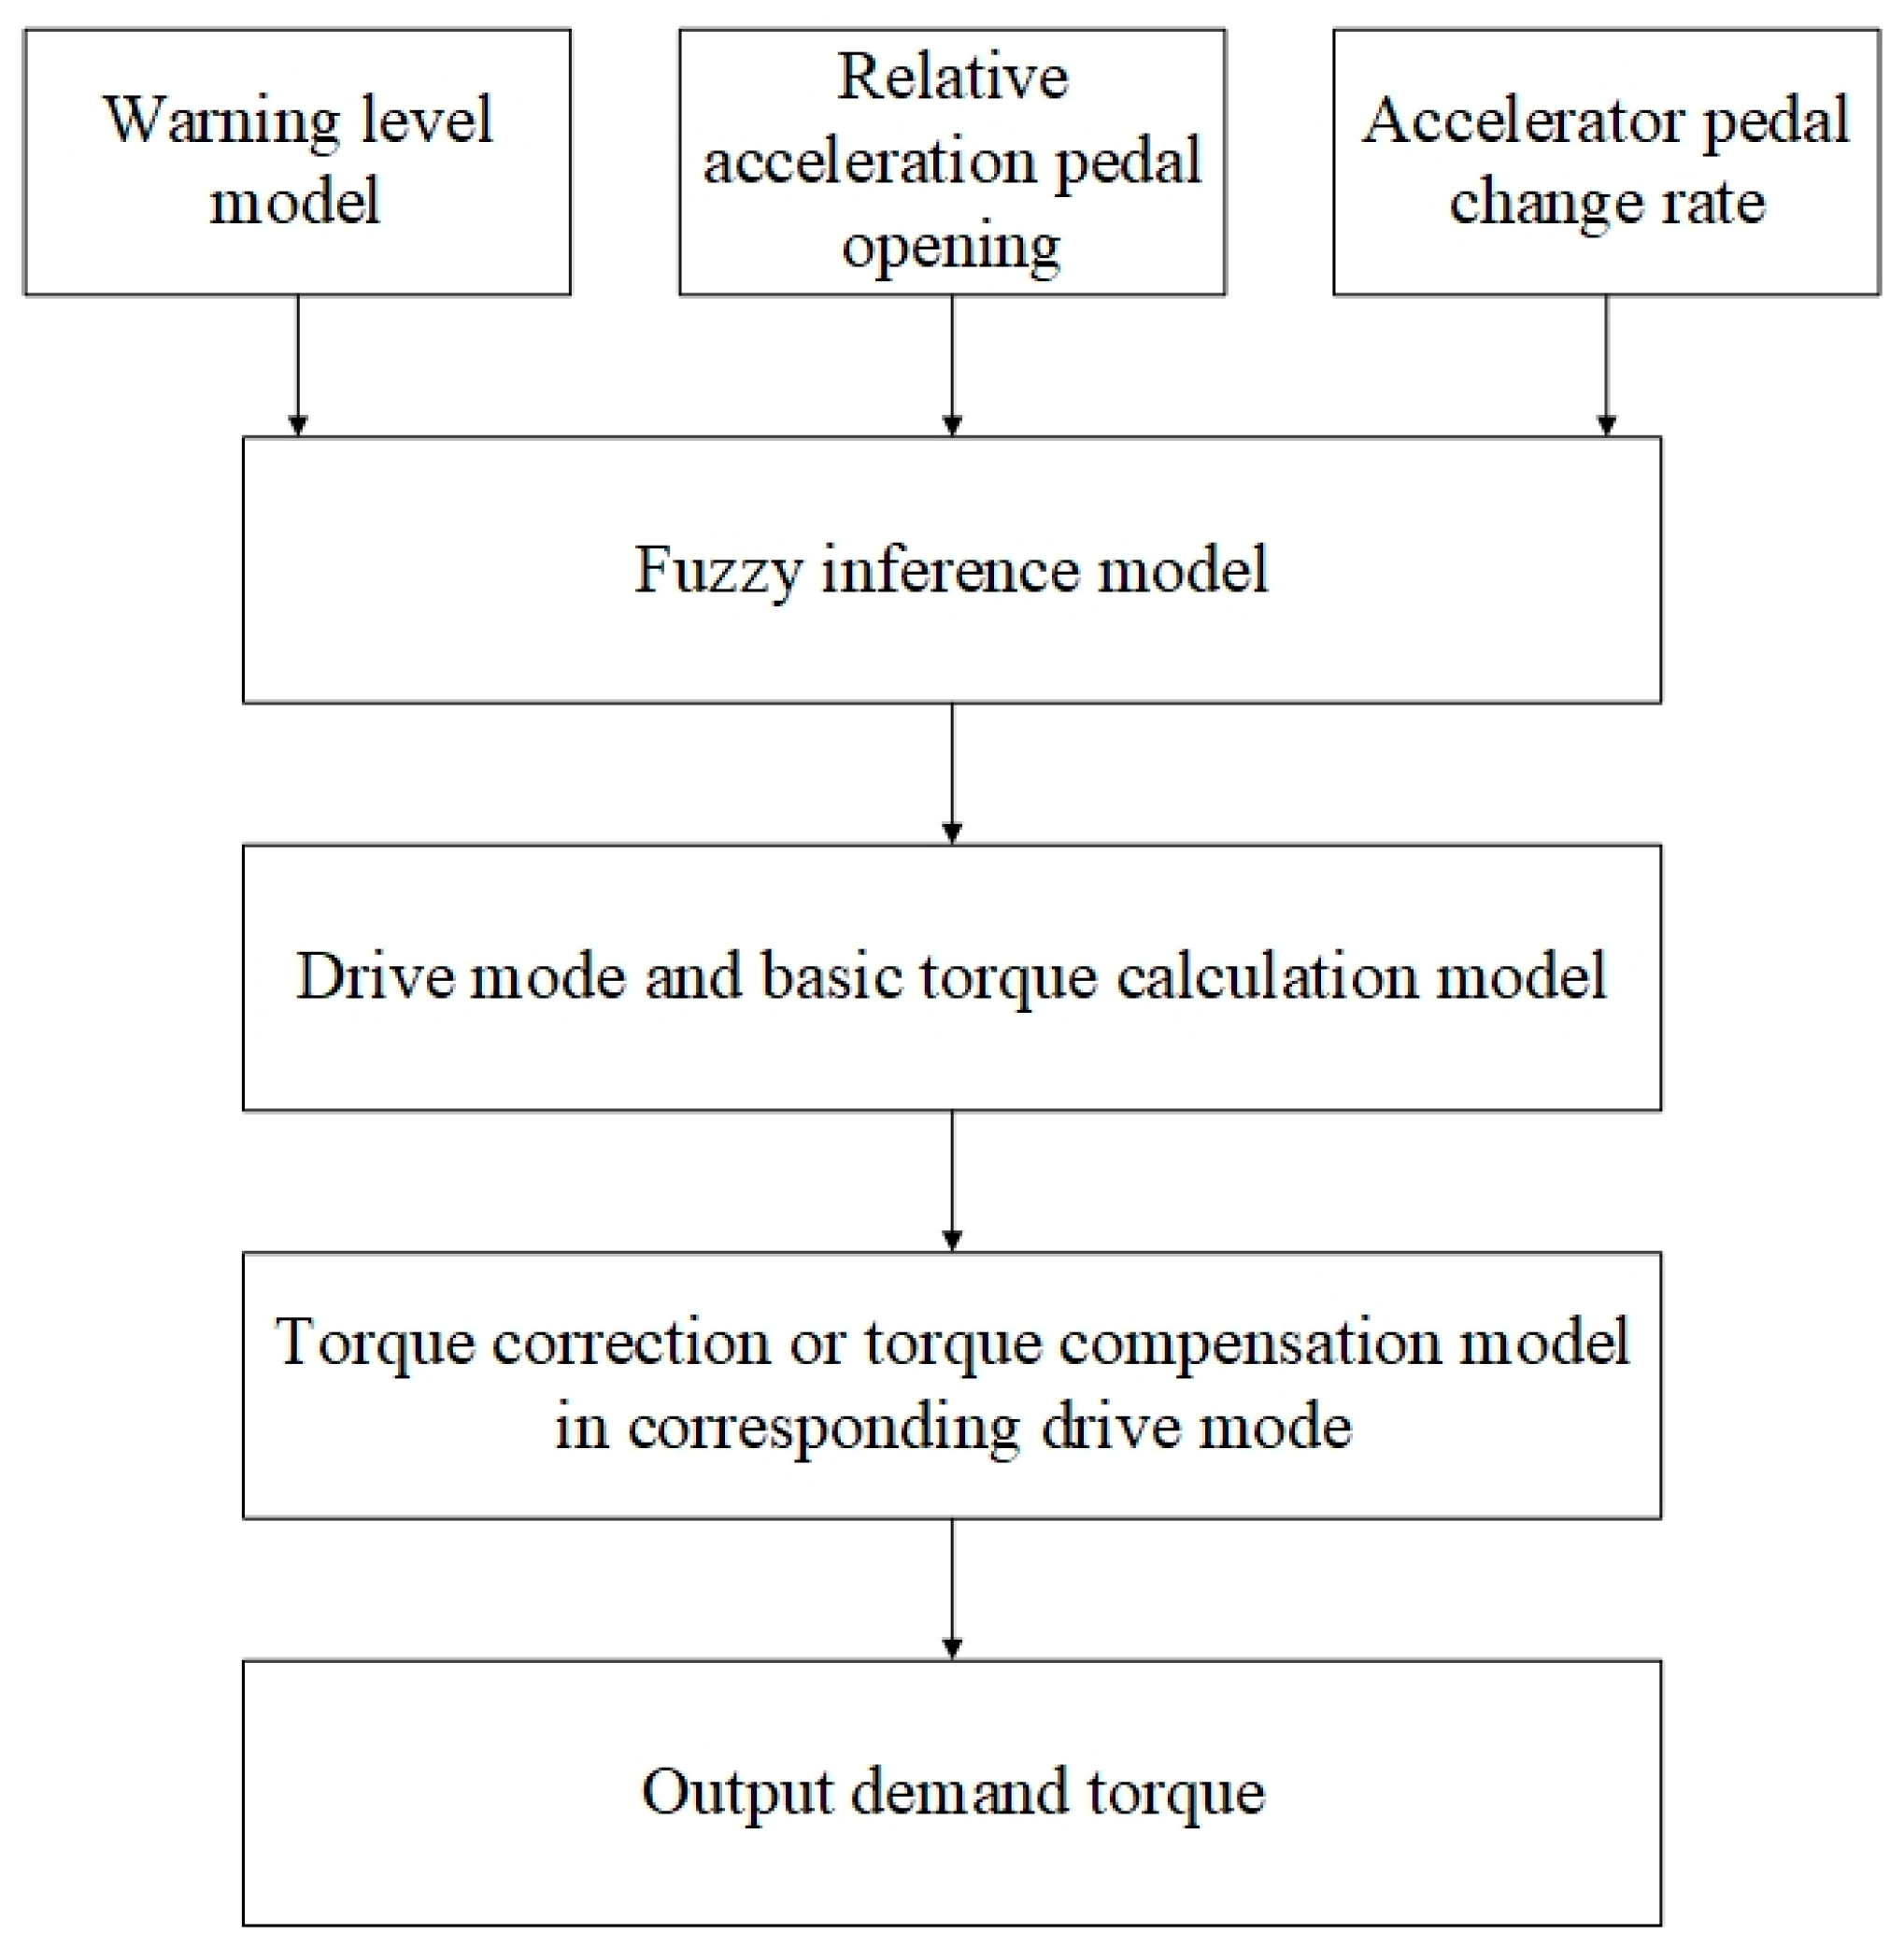
In the paper, a representative one-way front and rear following vehicle scene was selected for research, and a drive control strategy combined with intelligent and connected technology is proposed. An early warning model was established to classify the risk related to the distance between the front and rear vehicles, and the pedal drive mode was selected together with the driver’s driving intention. For different driving modes, the torque correction model, optimized torque correction model and torque compensation model under the safe distance were established respectively, so as to realize the combination of in-vehicle drive control and real-time vehicle condition information, and intelligently adjust the output torque. The process of the drive control strategy is shown in Figure 5.
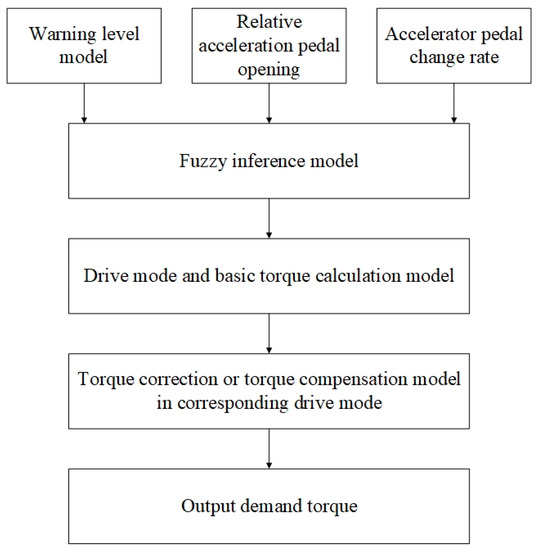
Figure 5.
Drive control strategy flowchart.
3.2.1. Early Warning Level Model
The one-way front and rear following vehicle scene is shown in Figure 6. In a lane in the same driving direction, the length of the vehicle body is h, the speed of the designated vehicle is Vb, and the speed of the preceding vehicle is Vf. Under the premise that the speed of the designated vehicle is greater than the speed of the preceding vehicle, that is, Vb > Vf, when the headway is equal to 5 s, the distance threshold Sa at this time is calculated. When the following vehicle finds that a collision is about to occur, the distance between the two vehicles is Sb, and then the following vehicle starts to react and starts to brake. After the reaction time Tr has elapsed, the driver of the following vehicle brakes, the following vehicle receives a response after the elapse of time Ti, and performs a uniform linear deceleration motion at the maximum deceleration a. After the front and rear vehicles have traveled the distances of S1 and S2 respectively, the speeds of the front and rear vehicles remain the same. At this time, the speeds of the front and rear vehicles are both Vf, and the two vehicles maintain a safe distance d. The warning level threshold is:
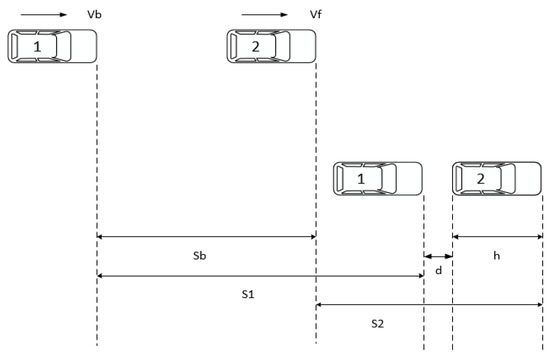
Figure 6.
The one-way front and rear following vehicle scene.
As shown in Figure 7, the front-to-rear vehicle time distance equal to 5 s (the critical point of the vehicle following state [24]) and the safe distance model distance were used as two thresholds, which were divided into three segments in order to set the early warning level. As shown in Figure 8, when the distance between two vehicles was greater than Sa, early warning level was classified as A (safe mode). When the distance between two vehicles was between Sa and Sb, it was classified as early warning level B (following mode), and when the distance between the two vehicles was less than Sb, it was classified as early warning level C (dangerous mode).
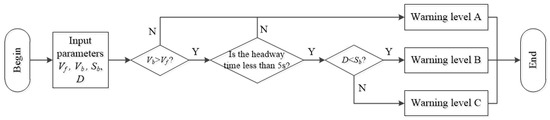
Figure 7.
The early warning model.
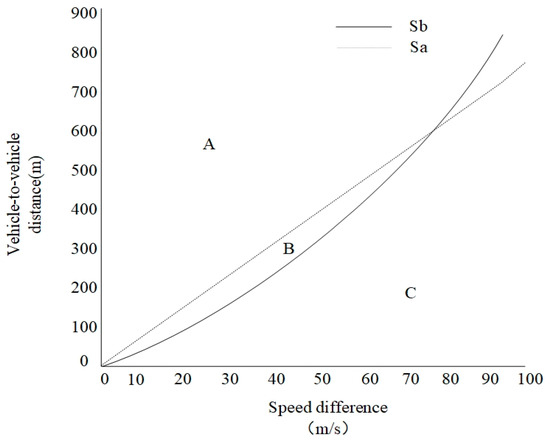
Figure 8.
Function of warning level model.
3.2.2. Drive Pattern Recognition
Using the accelerator pedal opening APP, the accelerator pedal opening change rate dAPP and the warning level as input parameters, the accelerator pedal opening and its change rate were fuzzified according to the membership function using the fuzzy inference method, after which the inference was performed according to the fuzzy rules to complete the choice of drive mode. The drive mode selection process is shown in Figure 9.
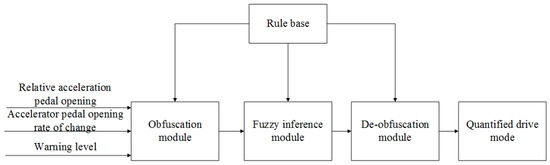
Figure 9.
Flow chart of drive mode selection.
The process can be summarized as: Define the range of the accelerator pedal change rate dAPP domain as [−1, 1], and define its language value as: NB (negative big), NM (negative middle), NS (negative small), PS (positive small), PM (positive middle), PB (positive big). Define the domain range of the accelerator pedal change APP as [0, 1], and define its language according to the amount of change: Z (zero), PVS (positive very small), PS (positive small), PM (positive middle), PB (positive big), PVB (positive very big); define the domain of output torque coefficient as [0.1, 0.9], and divide the domain from C1 to C9 with an interval of 0.1.
As shown in Table 1, in the dangerous mode or when the relative accelerator pedal opening change is small and the accelerator pedal change rate is small, select the soft pedal mode, in which the torque coefficient increases slowly with the increase in the pedal opening. When the vehicle is in the following behavior, or when the relative accelerator pedal opening degree is medium and the accelerator pedal change rate is medium, select the linear pedal mode, in which the torque coefficient increases linearly with the increase of the pedal opening degree. In the hard pedal mode, the torque coefficient rises sharply with the increase of the pedal opening. Therefore, in the safe mode, this pedal mode is selected when the relative accelerator pedal opening changes and the accelerator pedal change rate is large.

Table 1.
Fuzzy rules for driving mode selection.
- (1)
- Soft pedal drive mode
In the soft pedal mode, the vehicle is at warning level C (dangerous mode), so the basic output torque in this mode needs to be corrected to prevent misoperation and blurred vision from affecting the driver.
In this mode, when the distance between the vehicle and the vehicle in front is S, the vehicle immediately starts to make an emergency deceleration at the maximum acceleration a, and the distance to the vehicle in front is d when it decelerates to the same speed as the vehicle in front. In this process, when the basic torque under the soft pedal is selected, the vehicle should be corrected using the correction torque when it is greater than the assumed correction torque. The entire vehicle system only outputs the correction torque to reduce the driving force of the vehicle to avoid an accident. If the basic output torque in this pedal mode is less than the corrected torque, the vehicle still outputs according to the basic torque. When the value of the corrected torque is less than zero, it means that the vehicle is about to collide, and the output torque is forcibly set to zero. The calculation formula is:
where the correction torque is , and is the forward driving force of the vehicle.
The process of correcting torque in soft pedal drive mode is shown in Figure 10.
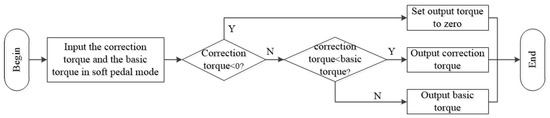
Figure 10.
Flow chart of correcting torque in soft pedal drive mode.
- (2)
- Linear pedal drive mode
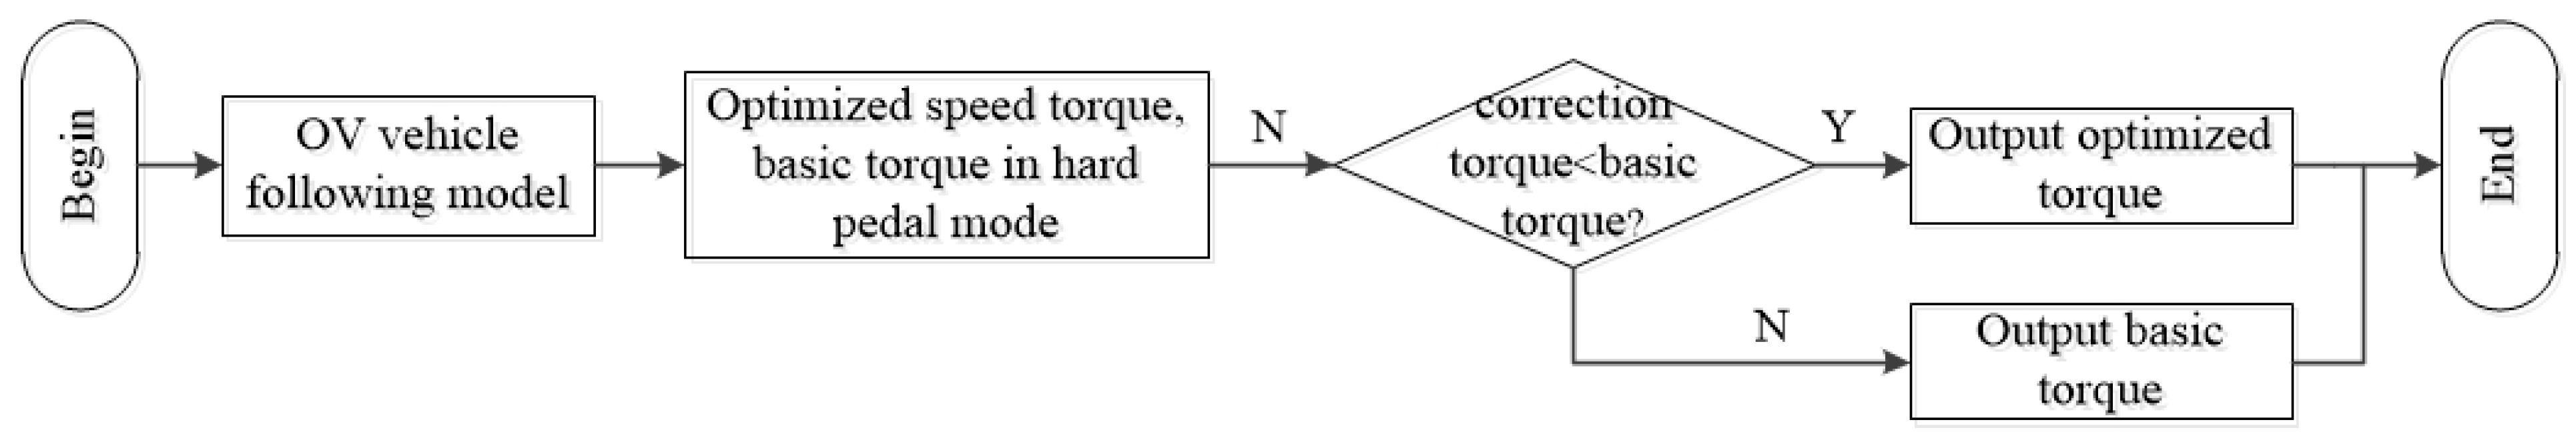
In the linear pedal mode, the front and rear vehicles are close to each other and are in a car-following state. Therefore, the optimized torque and optimized speed are proposed to optimize the original output basic torque, so that the vehicle maintains a relatively stable condition relative to the front and rear vehicles. Based on the optimized velocity (OV) model, the optimized speed and optimized acceleration are combined with the vehicle drive model, and the optimized speed and optimized torque are used as thresholds to limit the torque output:
where (N·m) is the optimized torque, (m/s2) is the acceleration of the following car at time t, is the optimized speed function, (m) is the relative position of the following car at time t, (m/s) is the speed of the rear vehicle at time t, (1/s) is the sensitivity coefficient, (m/s) is the maximum road speed limit, and (m) is the distance between the front and rear vehicles.
As shown in Figure 11, the optimized torque calculated based on the optimized speed and optimized acceleration under the OV car-following model is used to correct the basic torque. When the basic torque is within the optimized torque range, the vehicle still outputs the basic torque. When the basic torque is greater than the optimized torque, the vehicle uses the optimized torque as output, so that the vehicle is in an optimized acceleration and speed state.
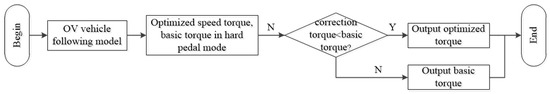
Figure 11.
Calculation process for the optimized torque.
- (3)
- Hard pedal drive mode
In the hard pedal mode, the vehicle is in safe road conditions. At this time, the vehicle has a better dynamic response. Therefore, a strategy to compensate the basic torque in hard pedal mode is proposed.
The rate of change of the accelerator pedal opening at the current moment and the difference dv between the current vehicle speed and the expected vehicle speed are used as input parameters. The fuzzy reasoning method is adopted to obtain the fuzzy magnitude of the compensation torque according to the fuzzy rules. The expected vehicle speed can be calculated by Equation (7) as follows:
Define the rate of change of the accelerator pedal dAPP domain as [−1, 3]. According to the rate of change, the language value is defined as: Z (negative change and no change), HS (very slow change), S (slow change)), M (middle change), B (big change), HB (very big change). Define the domain of the speed difference dv as [0, 100], and define its language as: HS (very small), S (small), M (middle), B (big), HB (very big) according to the amount of change. Define the domain of output compensation torque cT as [0, 20]. Based on the compensation torque, define its language as: Z (zero), S (small), M (middle), B (big).
The fuzzy rules are determined according to the driver’s acceleration requirements. As shown in Table 2, the accelerator pedal opening and the rate of change of the accelerator pedal opening reflect the driver’s eagerness to accelerate to a certain extent.
Table 2.
Fuzzy rules of compensation torque.
4. Experimental Results and Analysis
4.1. Test Environment
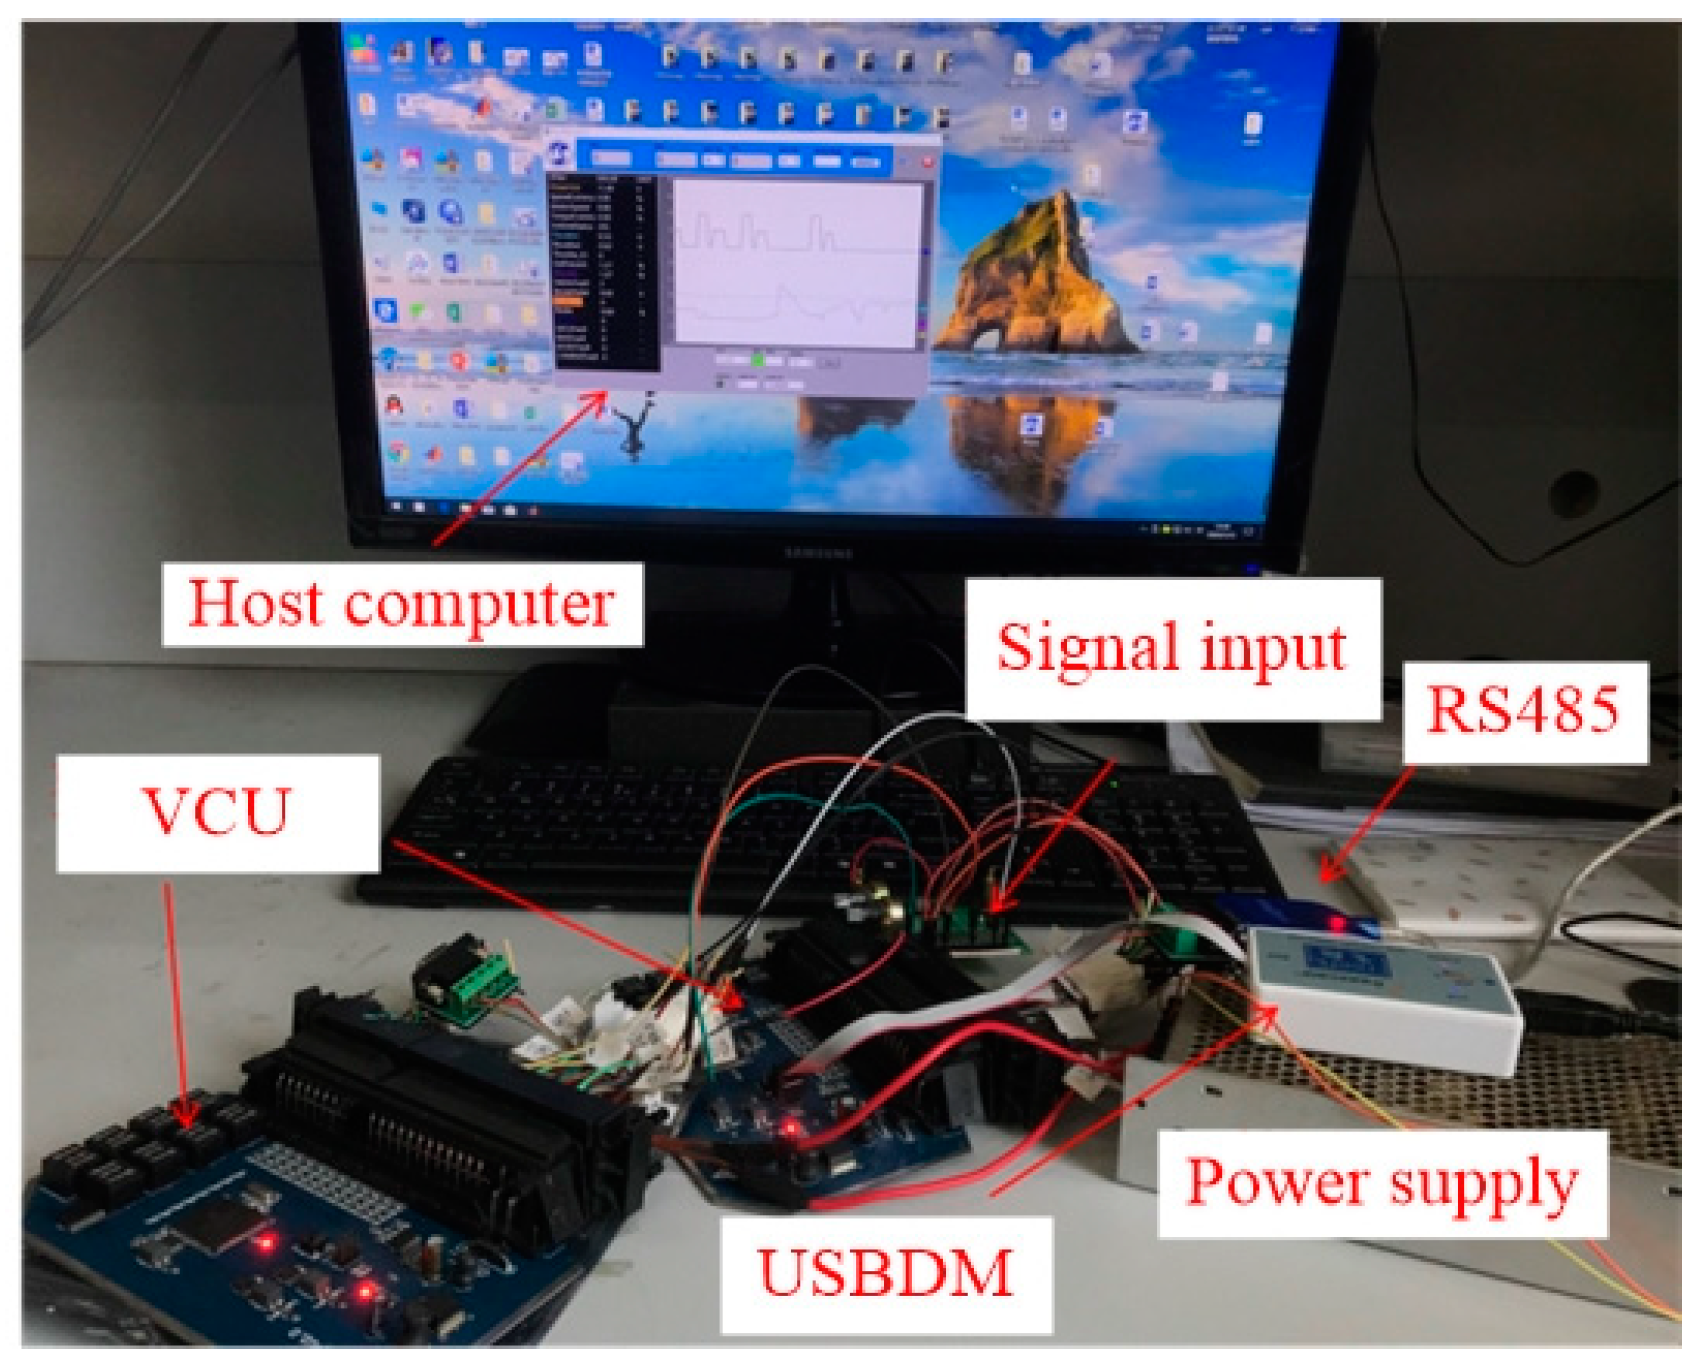
Based on the establishment of this vehicle control strategy model, an experimental verification test platform for pure electric vehicles was built, as shown in Figure 12. The relevant test model was established in Simulink, the source code generated by the model was added to the compilation integrated environment through the target language compiler in Simulink Coder, and the source code was downloaded to the target hardware. In the designed simulation model, the focus was to study the control strategy, and temporarily ignore the delay and unreliability of data transmission in the networked environment.
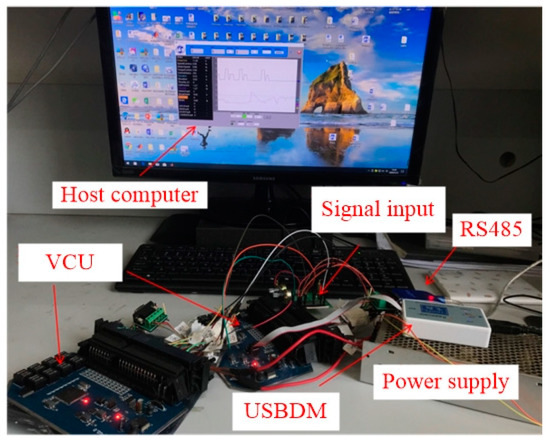
Figure 12.
The experimental verification test platform.
The vehicle controller collected accelerator pedal signals, brake pedal signals, and gear switch signals, then sent them to the host computer through the 485 bus, and displayed and saved them to the host computer in real time. At the same time, the vehicle parameters could be modified in the host computer to debug the vehicle controller. The main performance parameters and module parameters are shown in Table 3 and Table 4, respectively.
Table 3.
Main performance parameters.
Table 4.
Module parameters.
4.2. Experimental Results
The response priority of the accelerator pedal signal, brake pedal signal and charging signal was tested first, and the test results are shown in Figure 13. During the test, after the initialization of the system was completed, the accelerator pedal opening was changed and the vehicle entered the driving state. At 56 s, when the charging signal was connected, the accelerator pedal signal returned to zero immediately, and the system exited the driving state and entered the charging mode. At this time, there was no accelerator pedal signal. After the charging signal was maintained for a period of time, the system added the brake pedal signal and the vehicle entered the braking state. At this time, it did not respond to the charging signal or any changes in the accelerator pedal signal; only the brake pedal signal was collected.
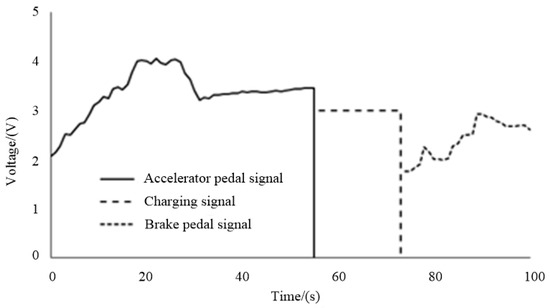
Figure 13.
Signal priority test results.
In the test model, a single-passage road was preset, and the distance between the vehicle and the vehicle in front was maintained. According to the distance characteristics of the early warning model in Figure 8, the distance between the front and rear vehicles was set to 500 m in the initial state under the condition of realizing communication. At the same time, the running speed of the preceding vehicle was preset. By changing the accelerator pedal opening of the preceding vehicle, the preceding vehicle could drive in the speed range of 20 KM/h to 40 KM/h. During driving, the distance between the front and rear vehicles and the speed information of the vehicles were transmitted to the following vehicle to verify the response of the drive control strategy that integrates the connected information.
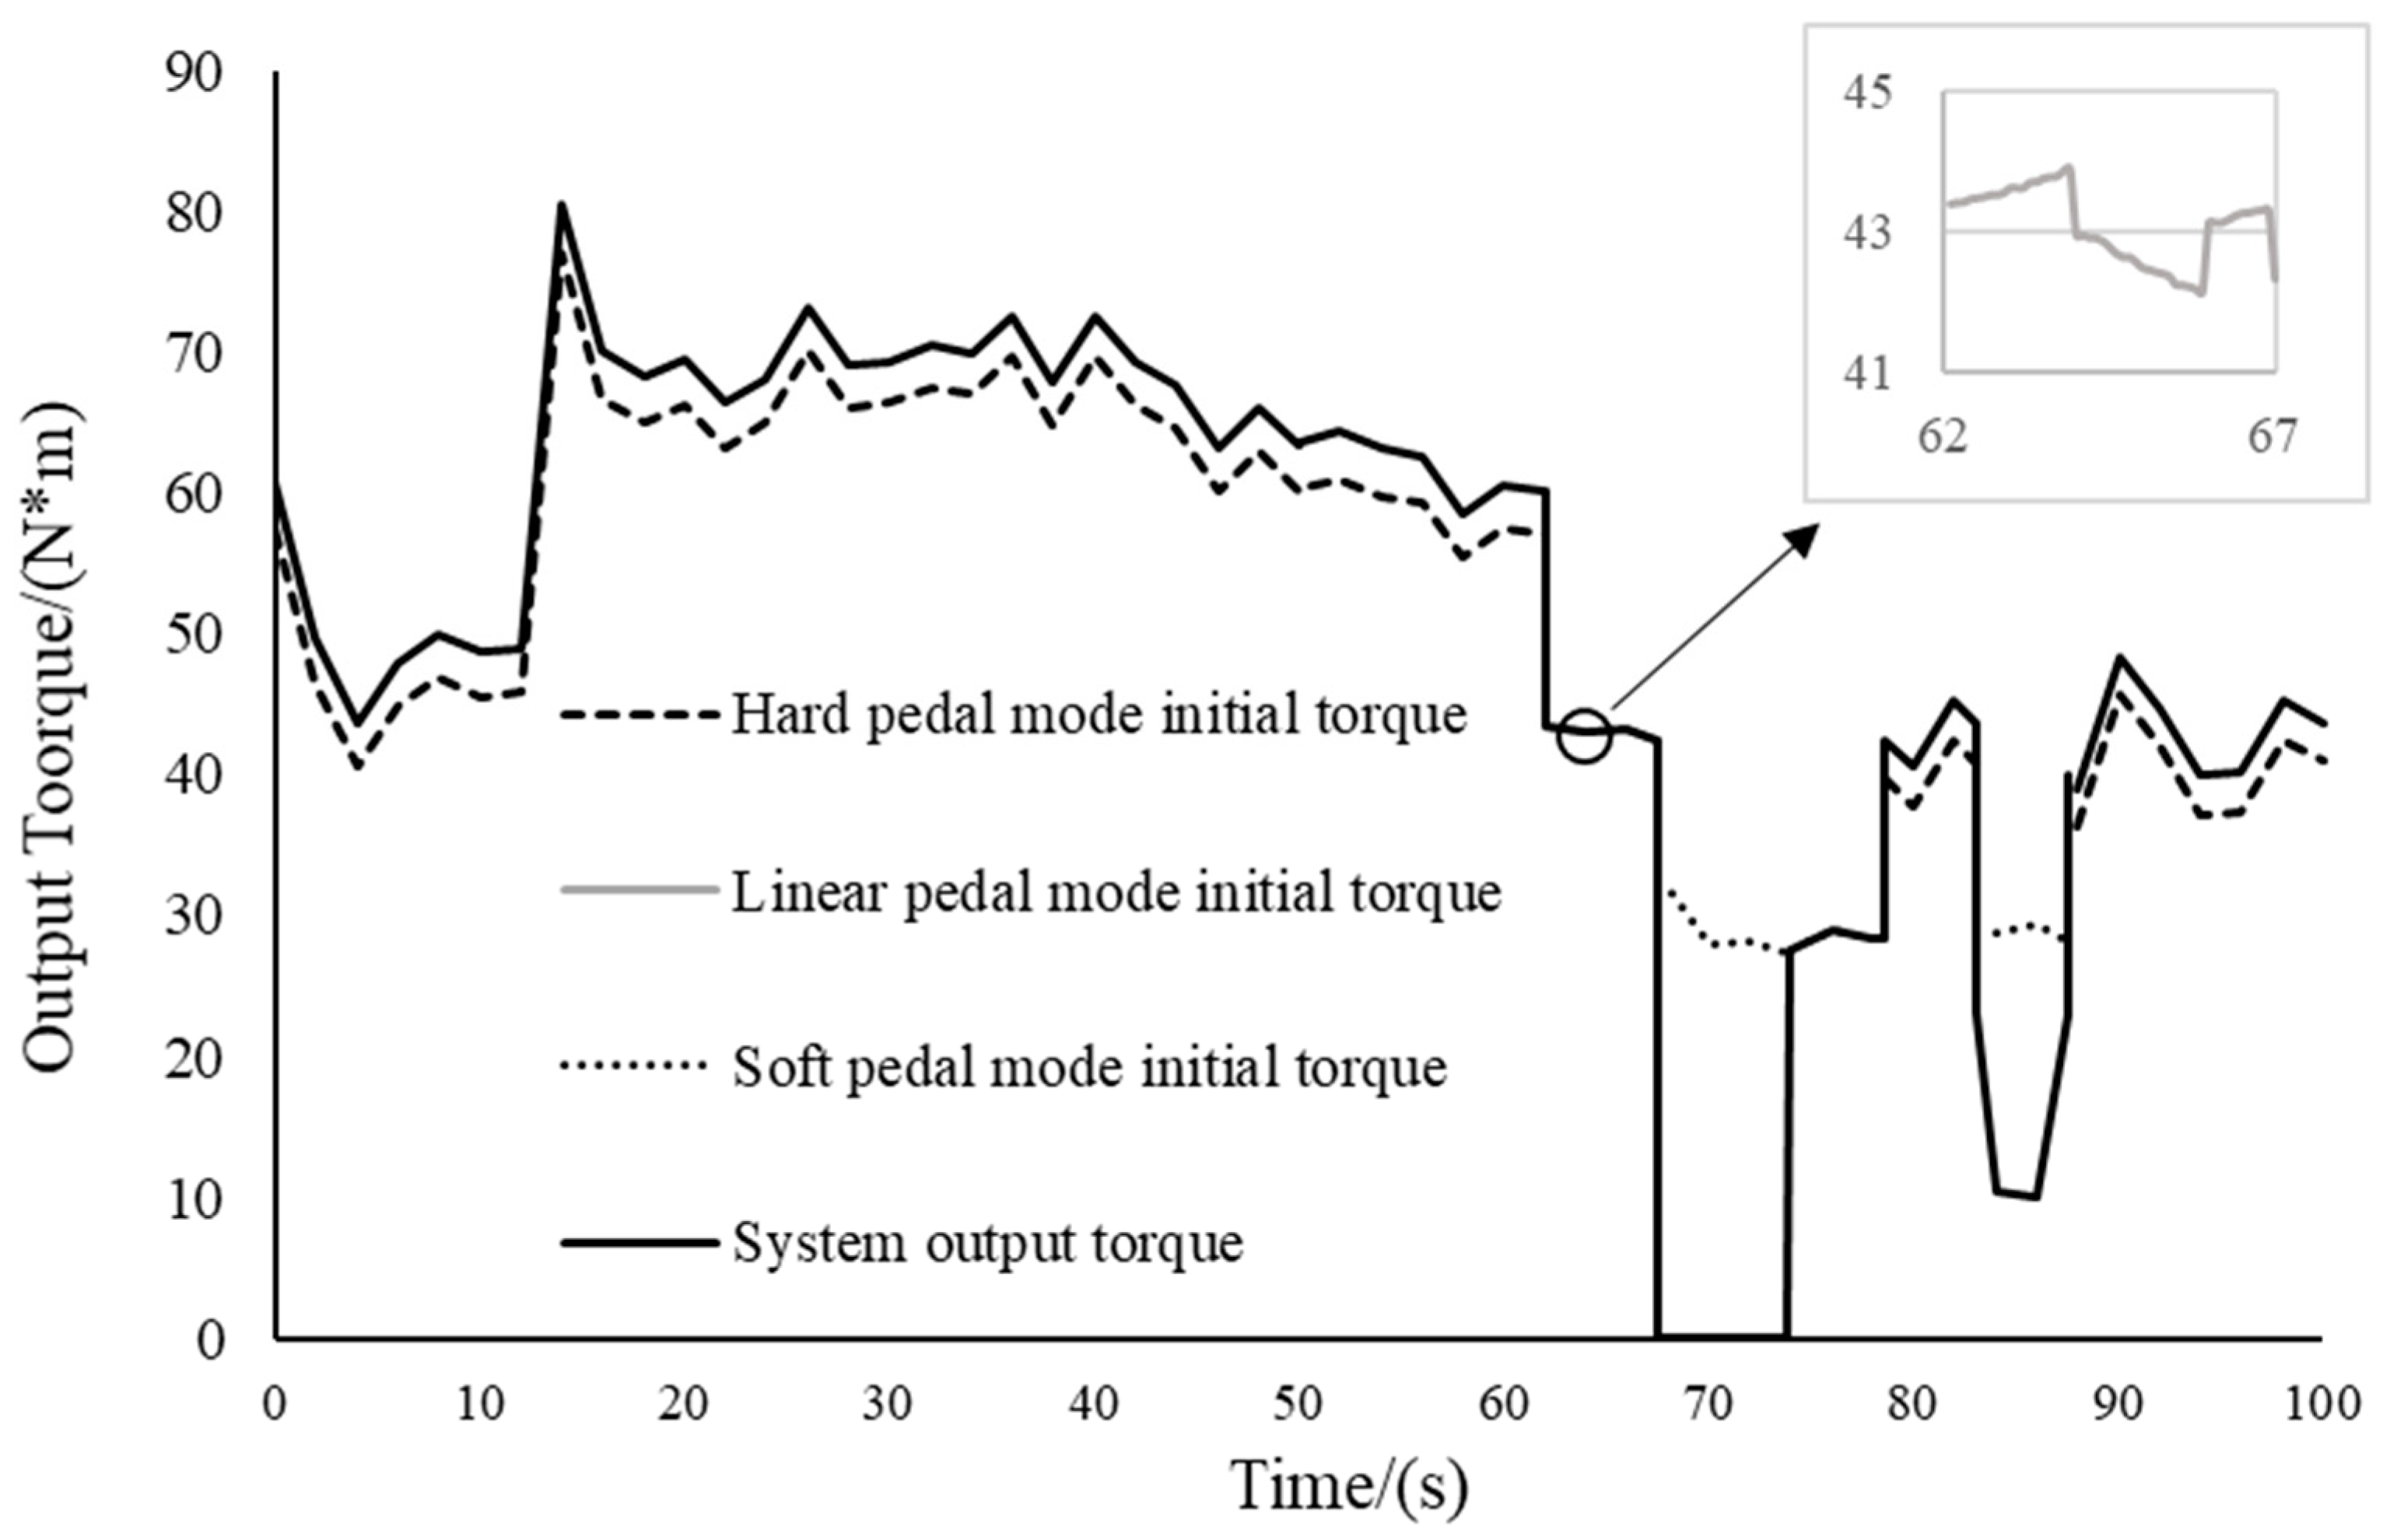
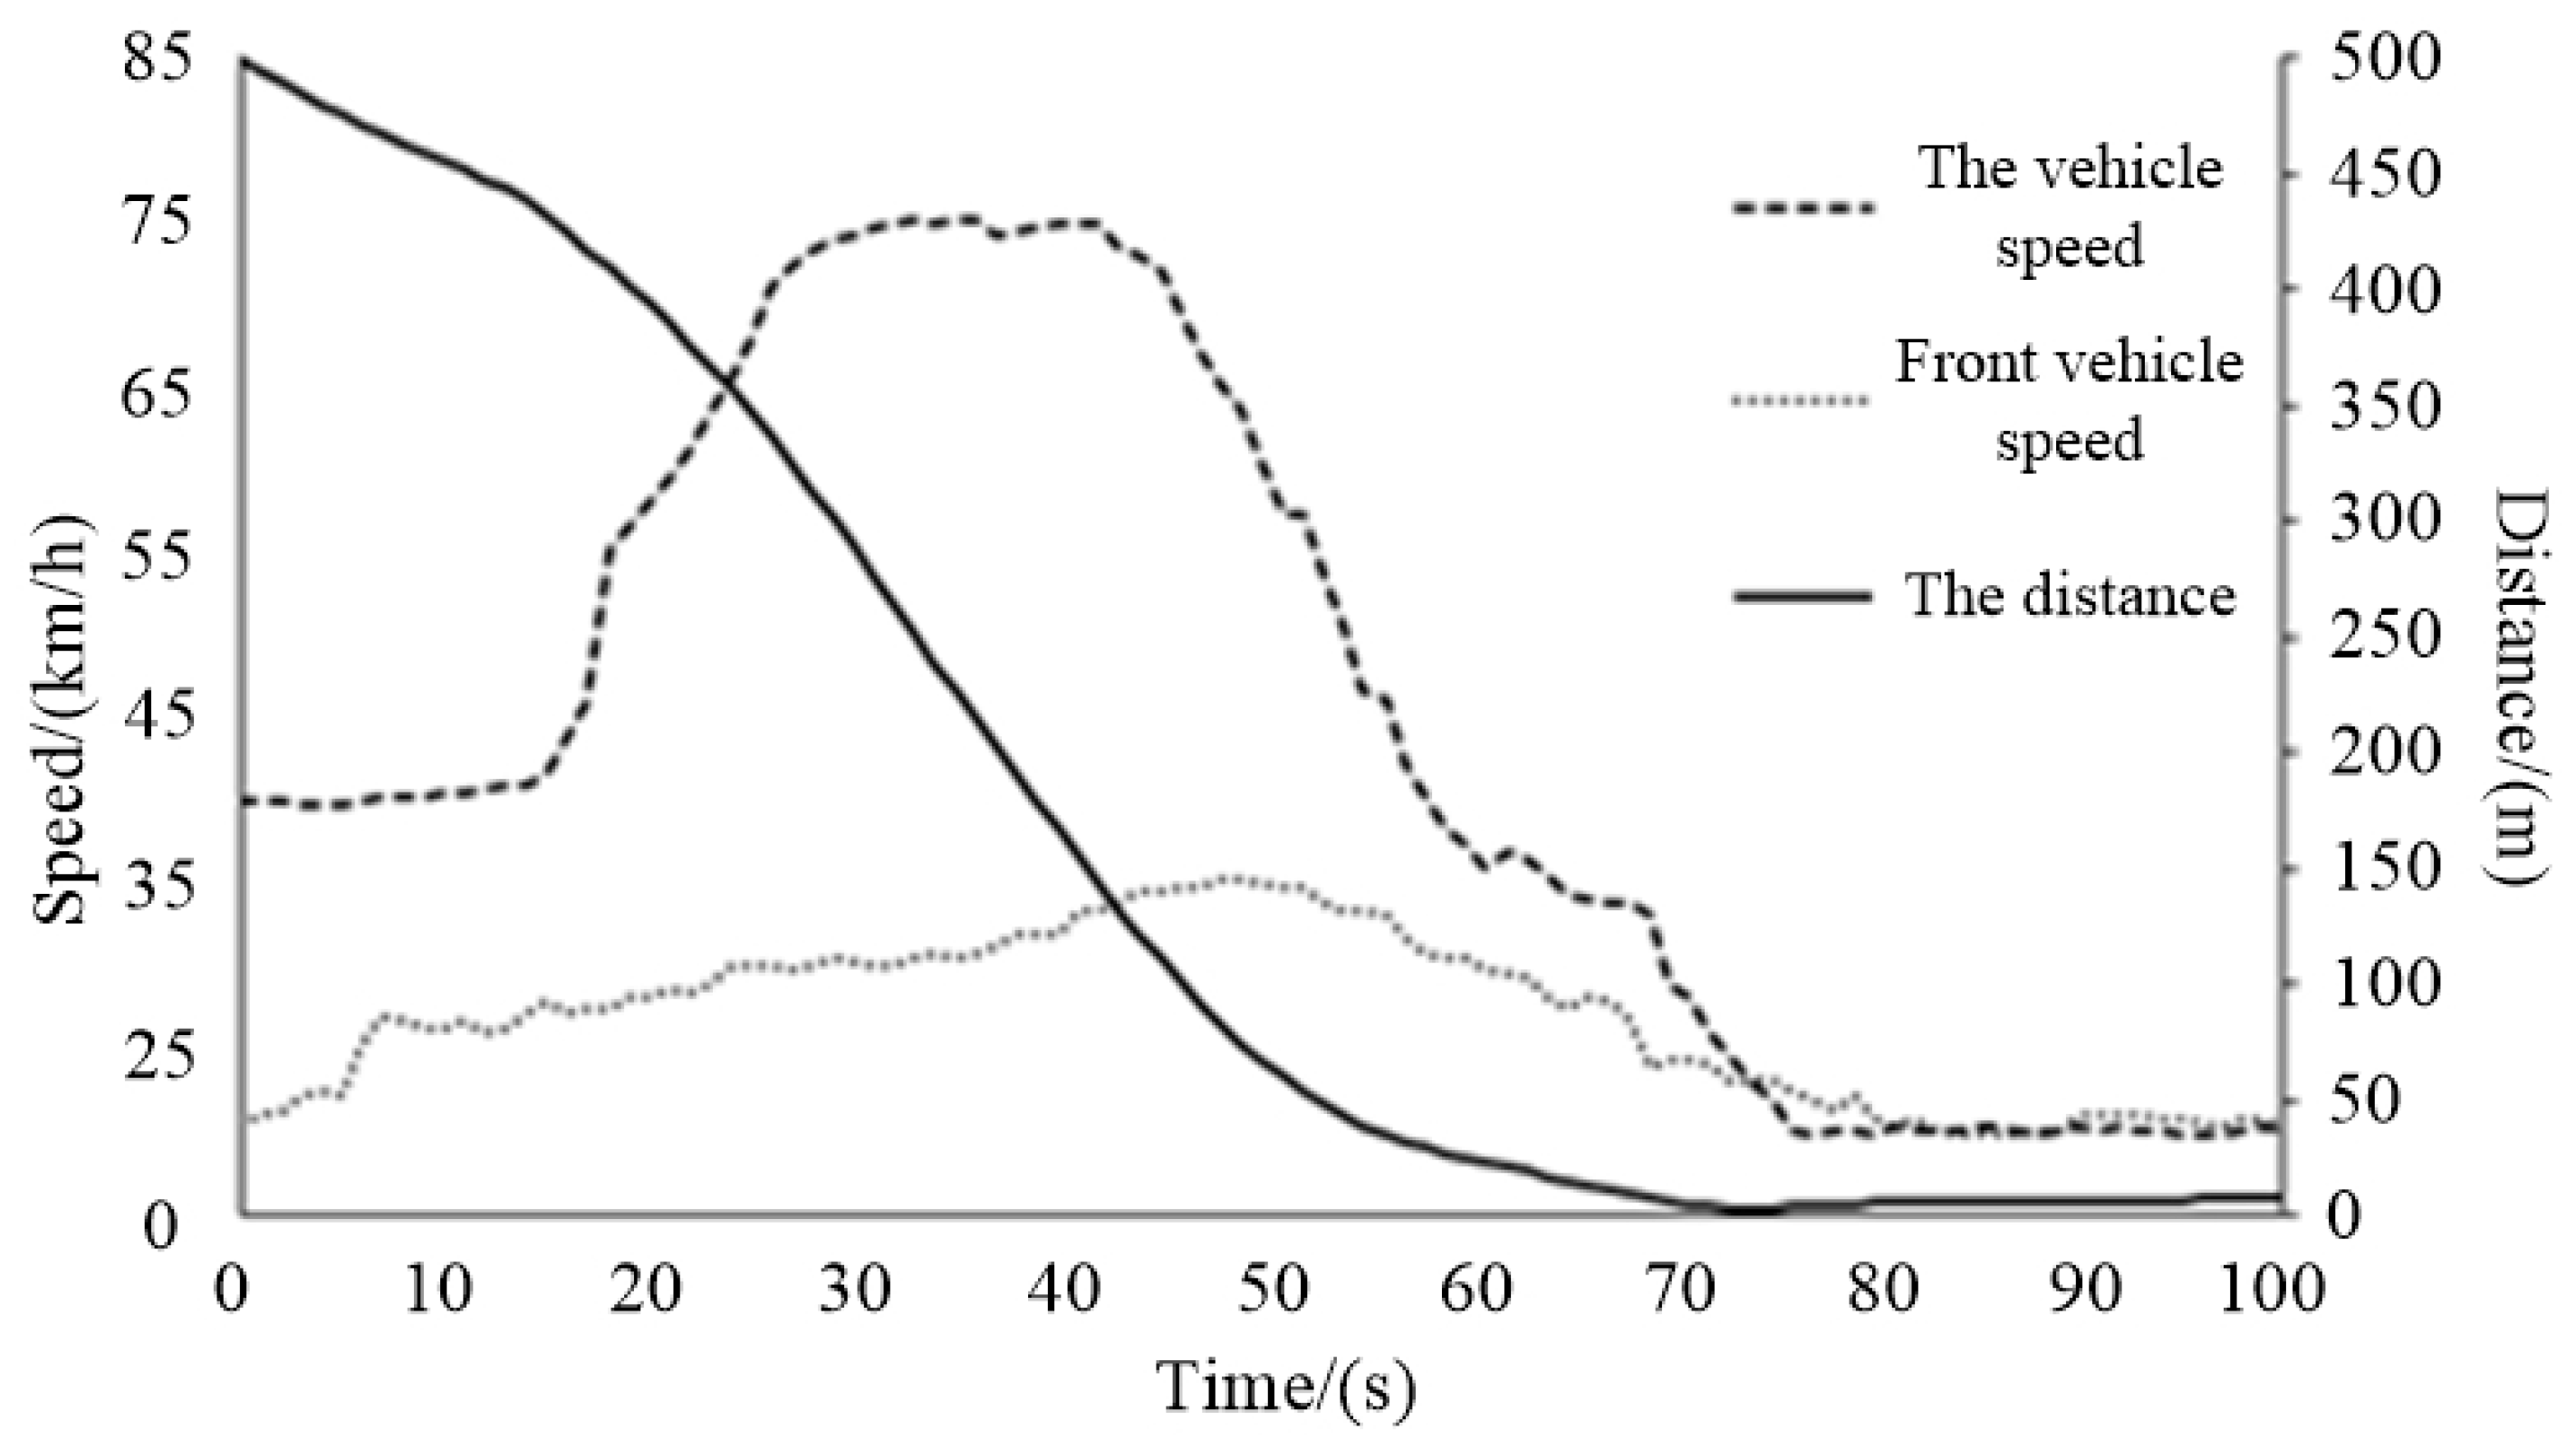
The pedal opening of the vehicle during the experiment is shown in Figure 14. Figure 15 shows the torque output of the vehicle during the experiment and the corresponding correction in the corresponding mode. Figure 16 shows the changes in speed and distance between the front and rear vehicles during the driving process.
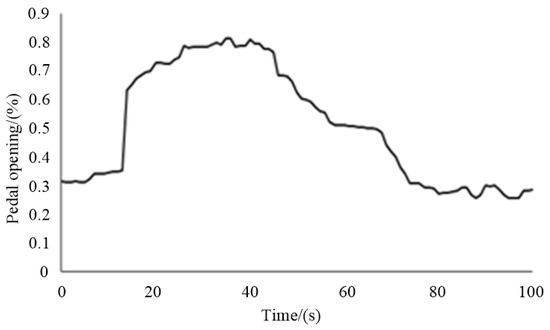
Figure 14.
The pedal opening of the vehicle during the experiment.
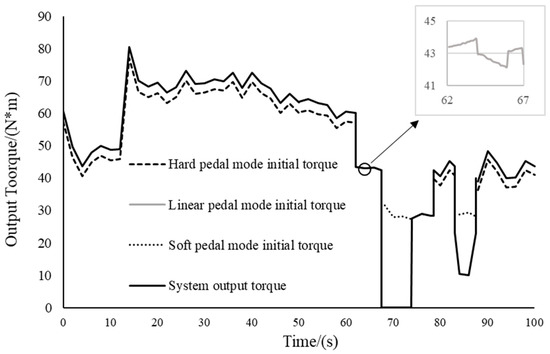
Figure 15.
The torque output of the vehicle during the experiment.

Figure 16.
The speed of and distance between the front and rear vehicles during the experiment.
It can be seen from the figure that the whole driving process was consistent with the expected drive control strategy effect. During the time from 0 s to 60 s, due to the large distance between the two vehicles, the hard pedal mode was selected in safe mode. At this time, the vehicle displayed a good torque response. From the output torque curve, it can be seen that the original torque obtained torque compensation in the hard pedal mode, which made the vehicle more dynamic. In the 60 s to 70 s interval, from the corresponding distance curve, it can be seen that the distance between the vehicle and the preceding vehicle was relatively close at this time, and the two vehicles were in a vehicle following state, so the response characteristic was the general linear pedal mode. Since the output torque at this stage did not exceed the value of the optimized torque in the linear pedal mode, the output torque was the original torque. In the 70 s to 80 s and 80 s to 90 s intervals, the distance between the two vehicles was gradually reduced. At this time, the pedal opening and the rate of change were small, so the soft pedal mode was selected. In this mode, the values of the initial torque and the original torque exceeded the correction torque, so the output torque was set to zero, thus avoiding accidents such as rear-end collisions. In the time after 90 s, it can be seen from the vehicle speed curve that the speed of the preceding vehicle was lower than that of the following vehicle, and the distance between the two vehicles tended to increase. Therefore, the hard pedal mode with better dynamic performance response was selected at this stage.
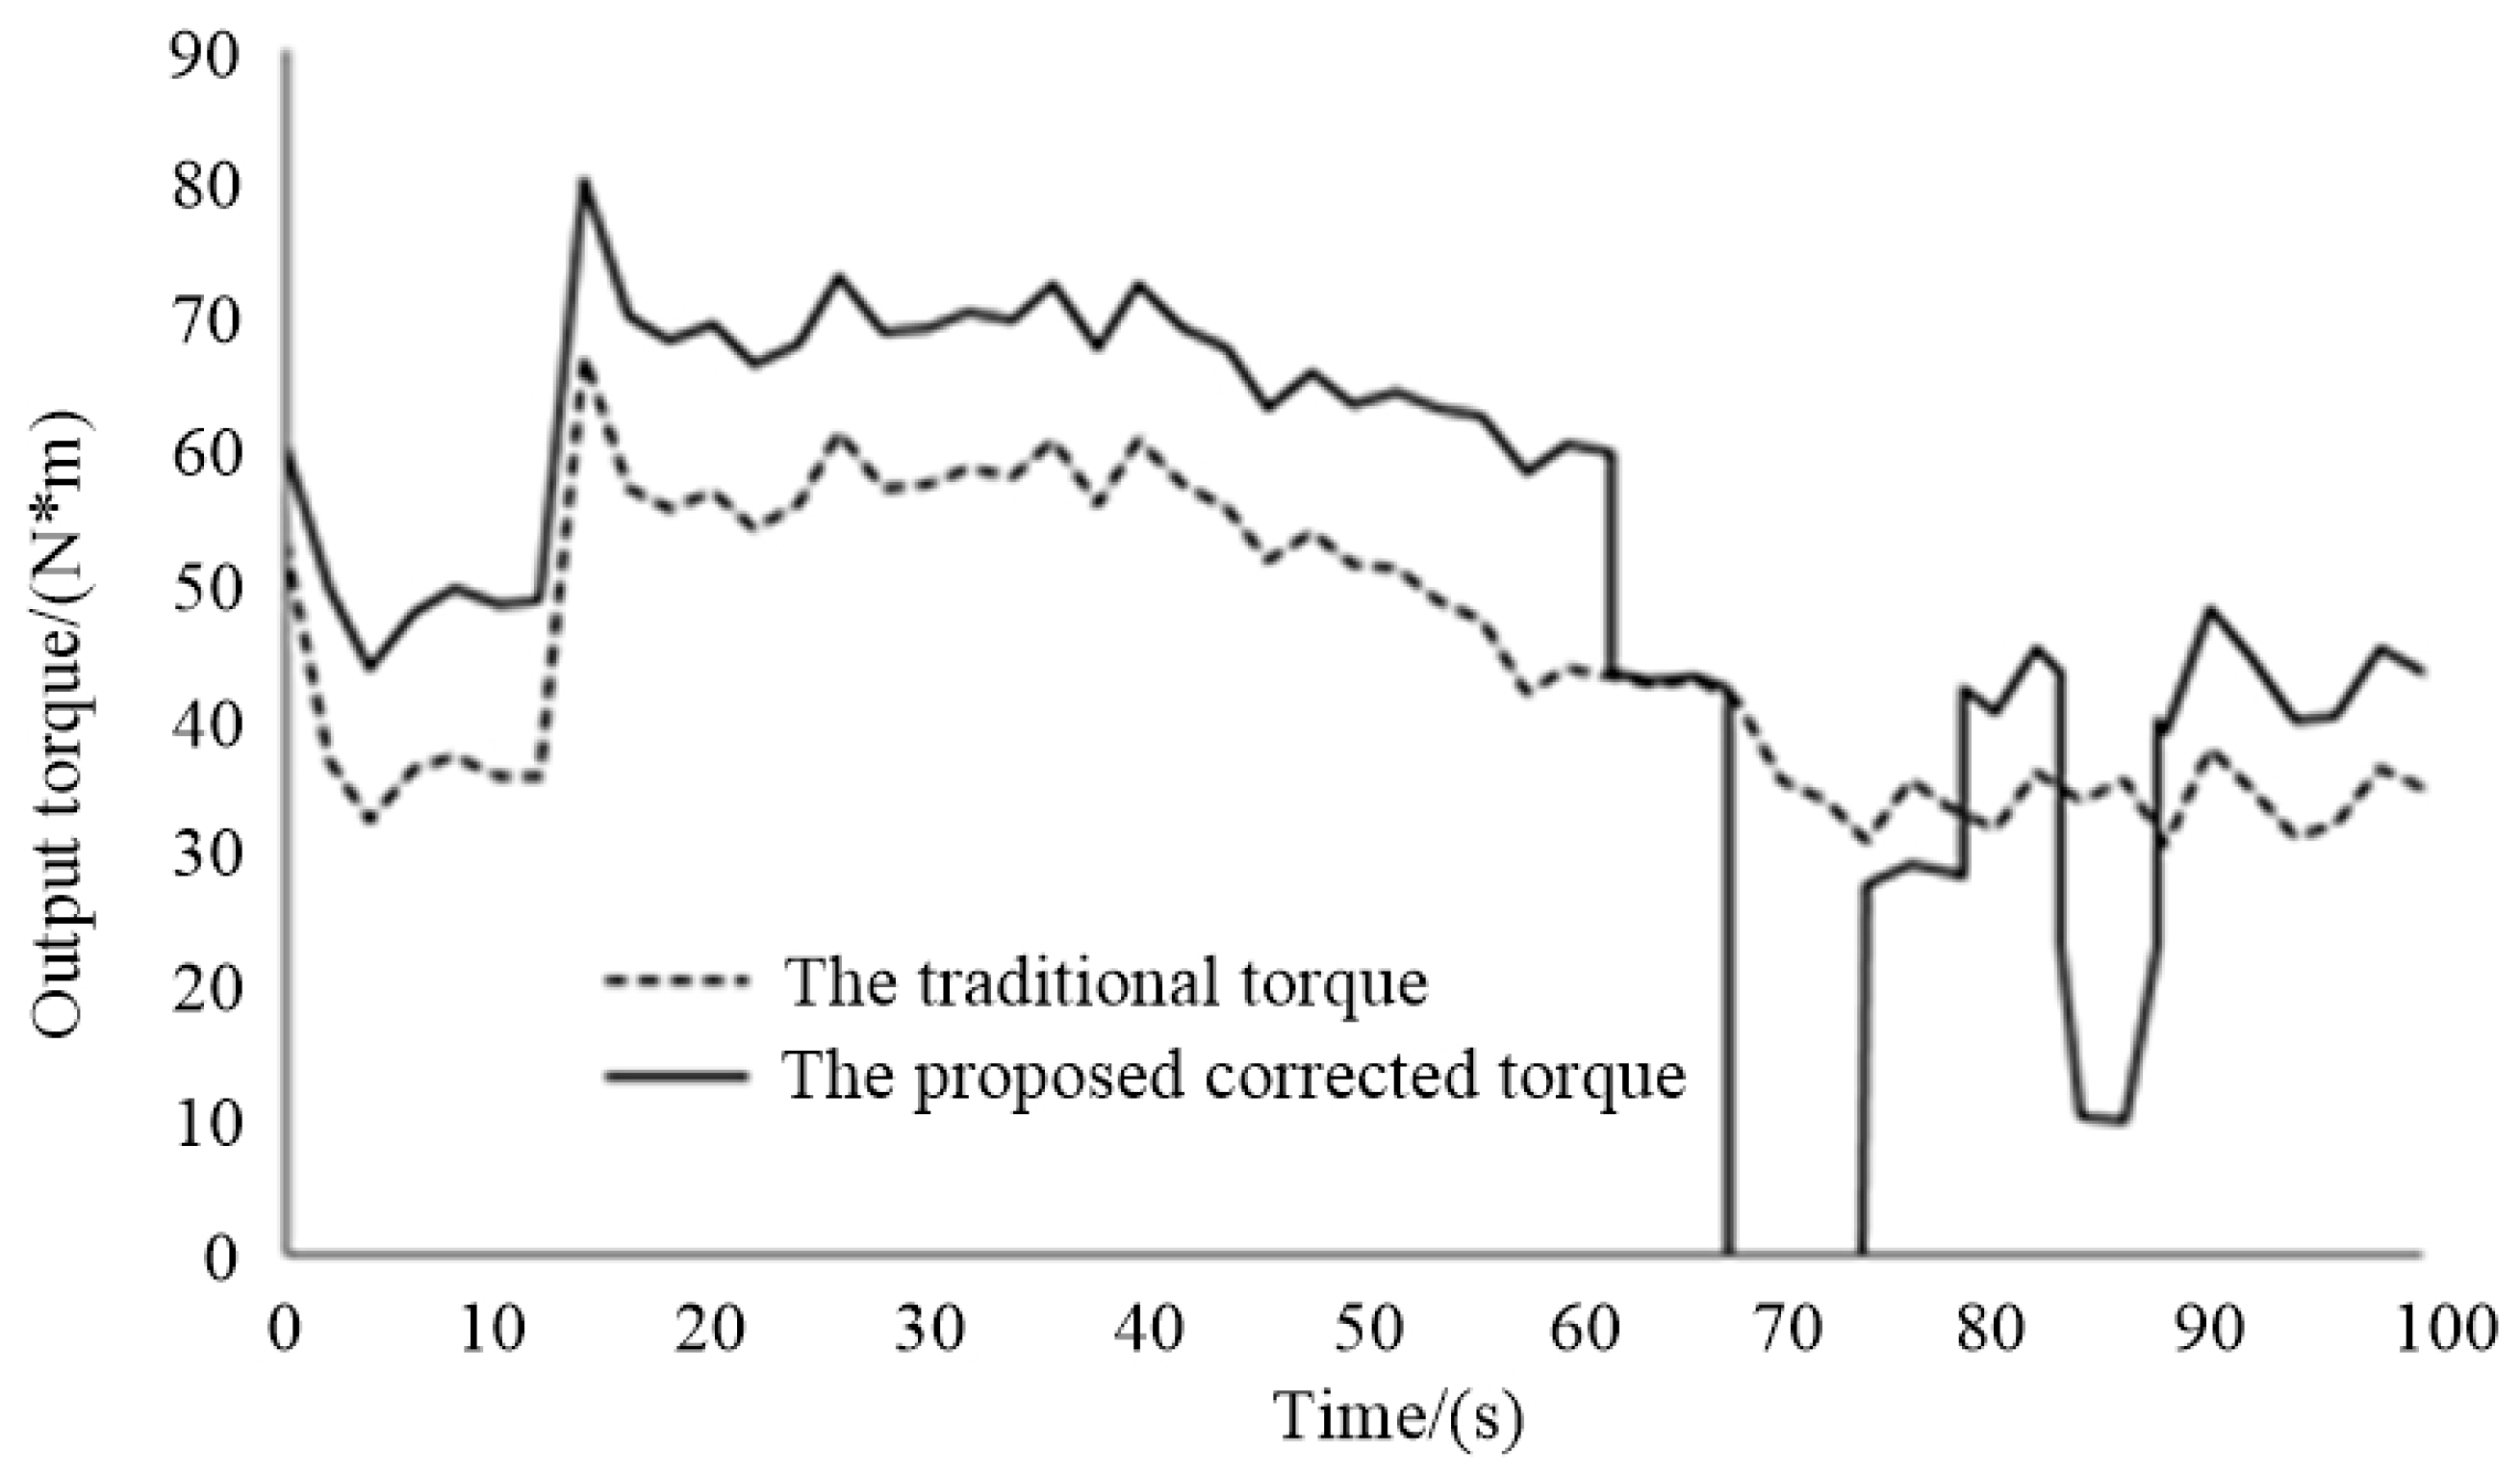
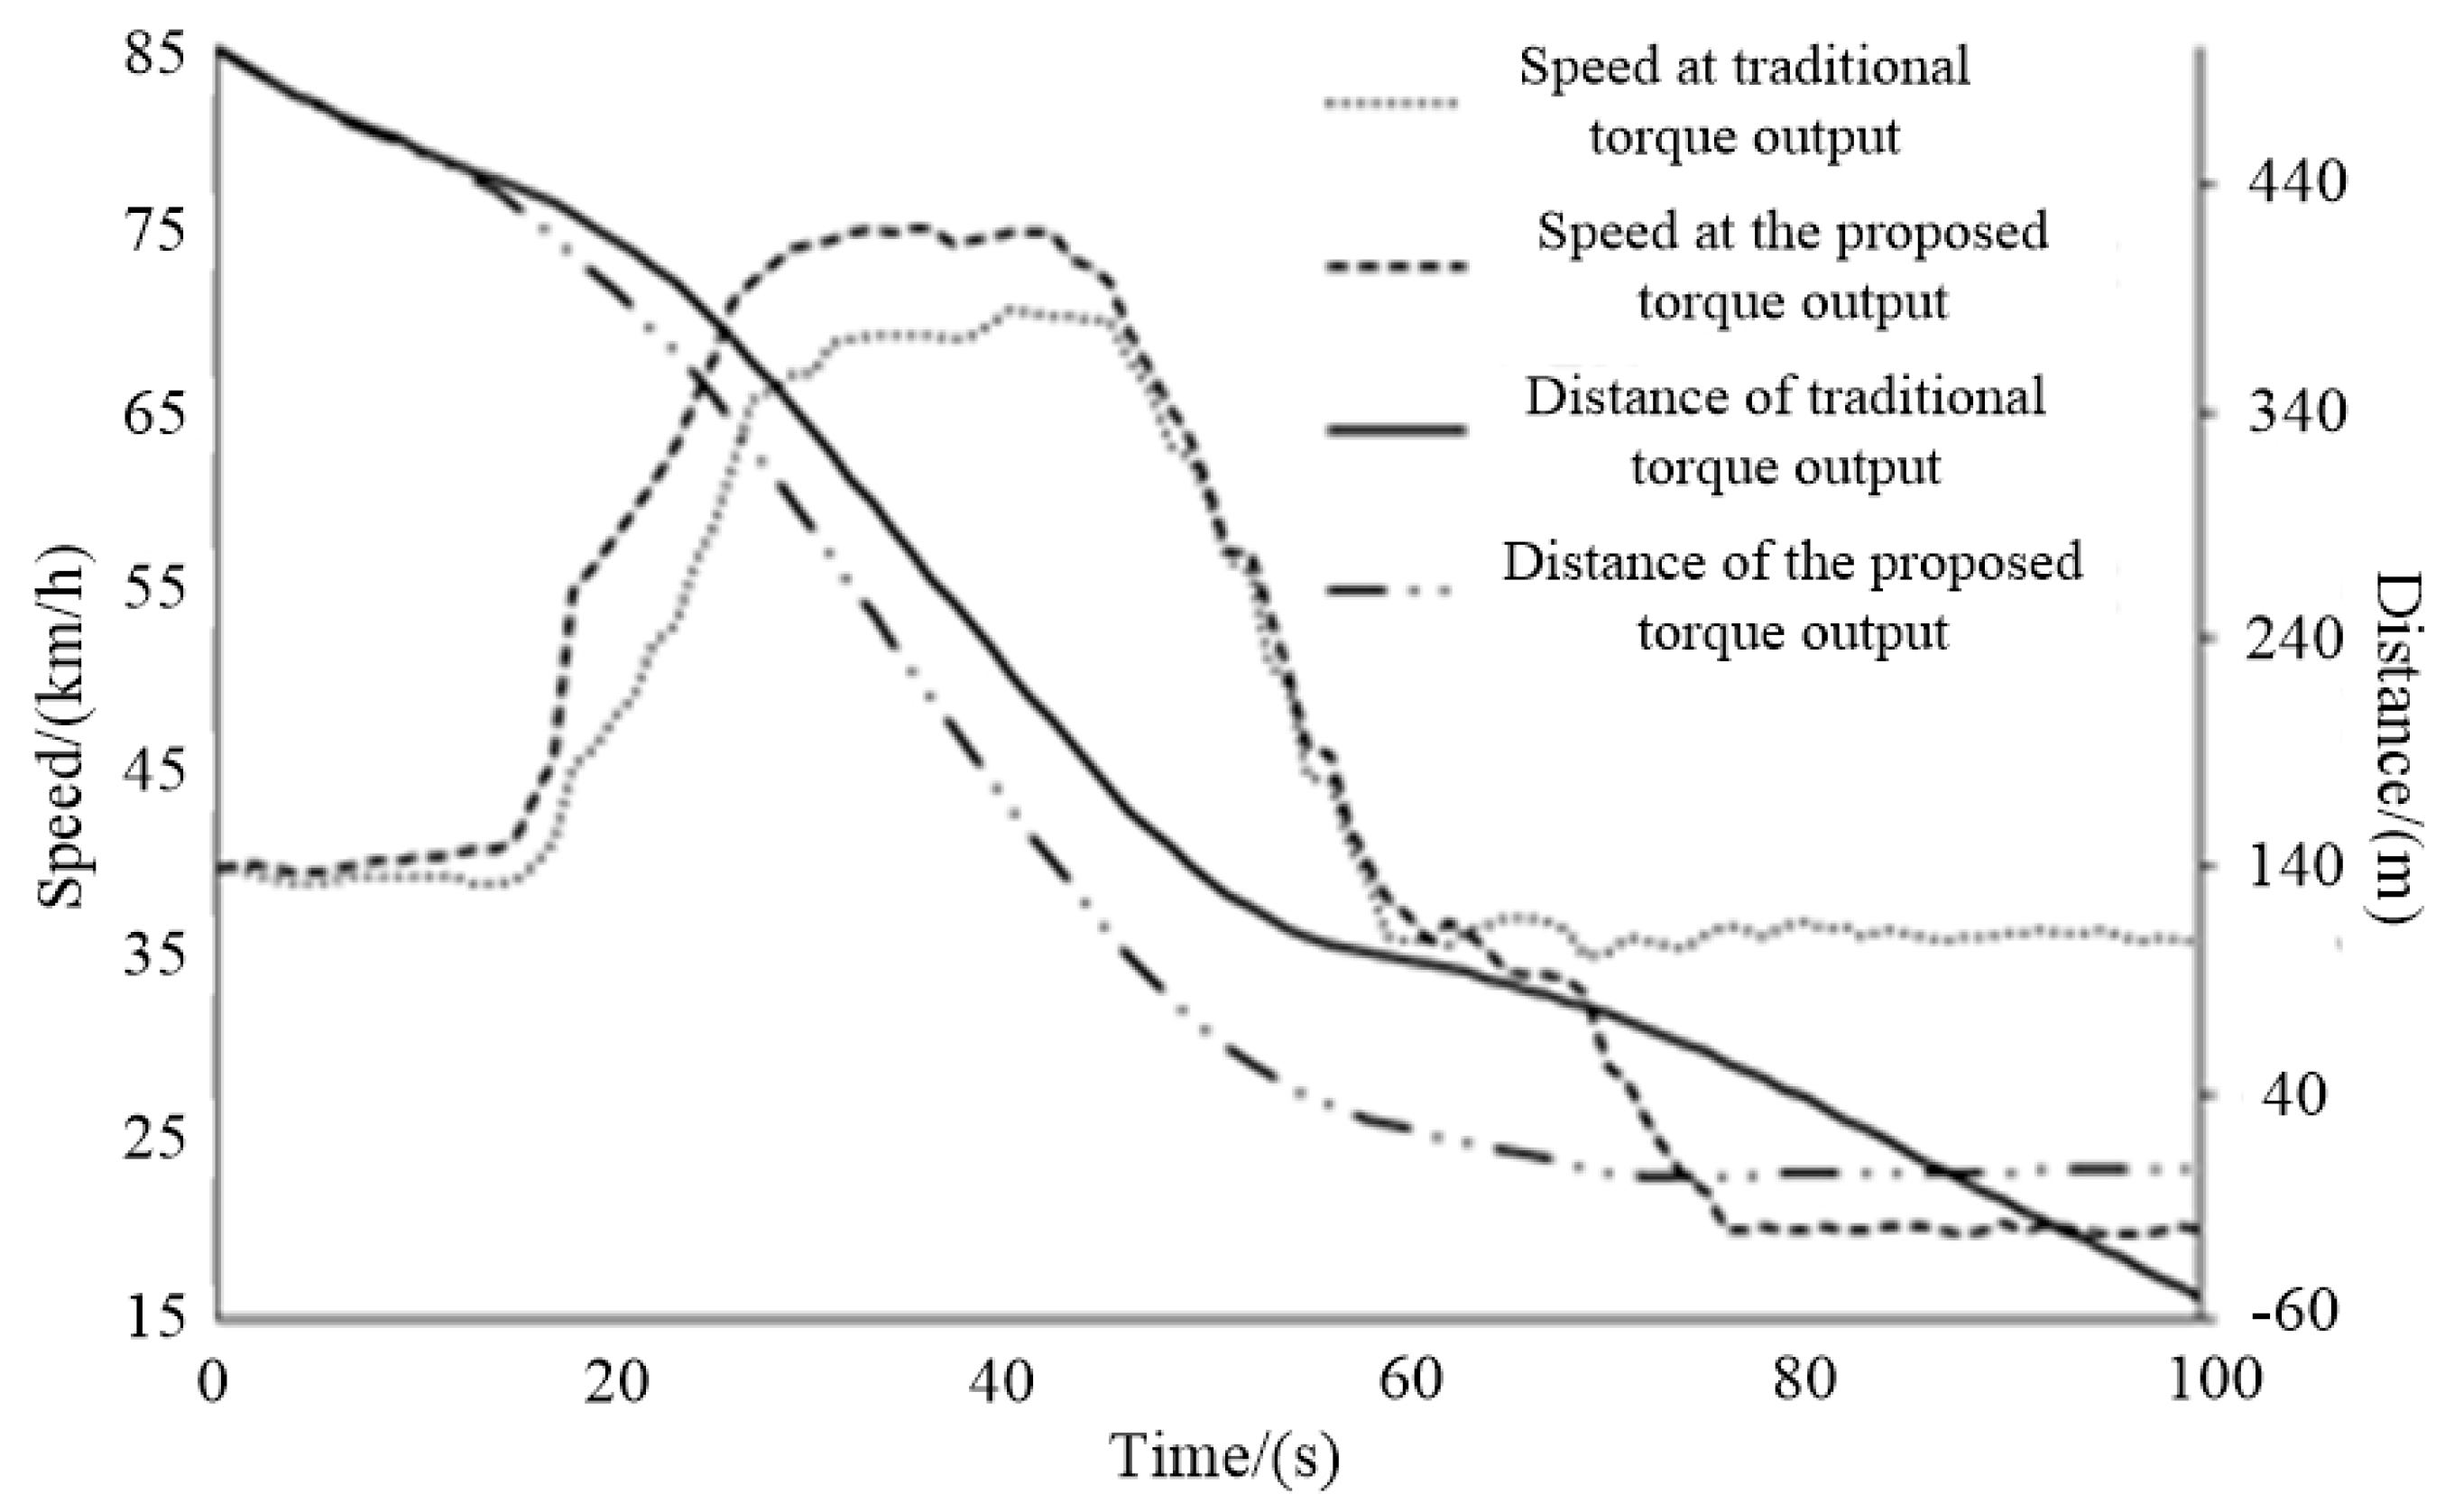
Under the conditions that the initial distance remained the same, the speed curve of the vehicle in front was the same, and the throttle opening curve of the vehicle remained the same, the proposed strategy was compared with the traditional control strategy. The result is shown in Figure 17. It can be found that under the traditional control strategy, the vehicle output torque trend was the same as the output torque trend of this experiment, but the sensitivity to factors such as distance and speed was not high. As shown in Figure 18, under the same open road conditions (within 0 s to 60 s), the output torque of the traditional strategy was slightly lower than that of the proposed strategy, and its power was relatively poor. When the front-to-rear vehicle distance was close (within 60 s to 100 s), the traditional torque output was large. From the corresponding front-to-rear vehicle distance curve, it can be found that the front-to-rear vehicle distance was negative at nearly 70 s, and its value gradually increased. The driving output torque of the proposed strategy maintained stable changes in the front to rear vehicle distance, which could improve the driver’s operating comfort and safety.
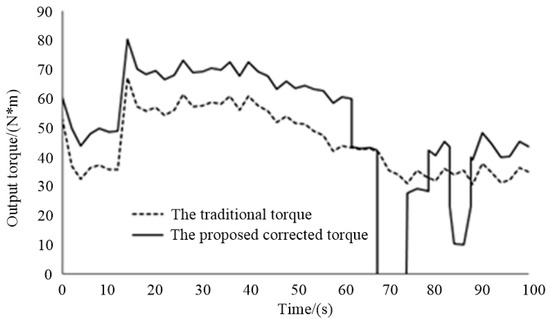
Figure 17.
Comparison of output torque via the two methods.
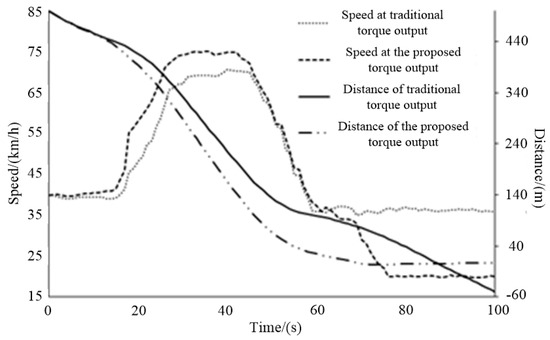
Figure 18.
Comparison of vehicle speed and distance via the two methods.
In the traditional mode, the driver’s operating behavior generally adjusts the vehicle’s travel according to the driver’s own perceptual perspective. When there are problems such as blind areas of vision and poor vision caused by bad weather, the driver often cannot make correct judgments. The proposed drive control strategy integrates connected vehicle information. Compared with the traditional drive strategy, it is more sensitive to factors such as the distance between and speed of the front and rear vehicles, so that it can make real-time decisions for various road conditions. Through torque compensation, optimization, and correction, the vehicle can maintain a relatively safe position during driving.
5. Conclusions
In this paper, a vehicle controller control strategy under the intelligent network connection scenario was proposed. Depending on the speed of the vehicle in front, the distance between the vehicles and other information, three types of pedal modes could be selected for driving: the soft pedal mode was selected when the distance between the vehicles was close. In this mode the vehicle dynamic response was weak and the initial torque was corrected at the same time to avoid excessive opening and closing of the accelerator pedal, which would improve the safety of the driver and the vehicle. In the vehicle-following state, the vehicle selected the linear pedal mode to maintain the distance between the vehicles. In the case of a large vehicle distance, the hard pedal mode was selected, and torque compensation was performed according to the driver’s acceleration demand, which would have a better dynamic response. The proposed control strategy was trialed on a built-in test platform, and the results showed that the proposed strategy could make real-time decisions based on road conditions in the typical scenario of one-way front and rear following vehicles. Through torque compensation, optimization, and correction, the vehicle could maintain a relatively safe position during driving, with better real-time decisions and safety. The proposed control strategy could make real-time decision-making sensitively based on factors such as vehicle distance and speed by fusing connected data, avoiding problems that might arise in the traditional mode when the driver’s judgment is susceptible to blind spots or bad weather.
Author Contributions
Conceptualization, L.D. and J.J.; methodology, J.J., W.C., D.Z., H.Z. and L.D.; software, J.J. and L.D.; validation, J.J., H.Z. and D.Z.; formal analysis, W.C., H.Z. and D.Z.; data curation, J.J.; writing—original draft preparation, L.D. and J.J.; writing—review and editing, L.D. and W.C.; visualization, J.J. and L.D.; supervision, W.C.; project administration, W.C.; funding acquisition, W.C., H.Z. and D.Z. All authors have read and agreed to the published version of the manuscript.
Funding
The research work was supported in part by the National Key R&D Program of China under Grant 2018YFB0105205, and in part by Hubei Province Technological Innovation Major Project under Grant 2019AAA025.
Institutional Review Board Statement
Not applicable.
Informed Consent Statement
Not applicable.
Data Availability Statement
No new data were created or analyzed in this study. Data sharing is not applicable to this article.
Conflicts of Interest
The authors declare no conflict of interest.
References
- Qiu, L.H.; Qian, L.J.; Zomorodi, H.; Pisu, P. Design and optimization of equivalent consumption minimization strategy for 4WD hybrid electric Vehicles incorporating vehicle connectivity. Sci. China Technol. Sci. 2018, 61, 147–157. [Google Scholar] [CrossRef]
- Bin, R.A.N.; Huachun, T.A.N.; Jian, Z.H.A.N.G.; Xu, Q.U. Development status and trend of connected automated vehicle highway system. J. Automot. Saf. Energy 2018, 9, 119–130. [Google Scholar]
- Keqiang, L.I.; Yifan, D.A.I.; Shengbo, L.I.; Mingyuan, B.I.A.N. State-of-the-art and technical trends of intelligent and connected vehicles. J. Automot. Saf. Energy 2017, 8, 1–14. [Google Scholar]
- China Journal of Highway and Transport. Review on China’s Automotive Engineering Research Progress: 2017. China J. Highw. Transp. 2017, 30, 1–197. [Google Scholar]
- Pei, H.L.; Xie, Y.B.; Wang, W.M.; Li, M.Z.; Sheng, W. Design and Development of Platform for Electric Vehicle Control Unit. High Power Convert. Technol. 2012, 2, 35–38. [Google Scholar]
- Zulkefli MA, M.; Mukherjee, P.; Sun, Z.; Zheng, J.; Liu, H.X.; Huang, P. Hardware-in-the-loop testbed for evaluating connected vehicle applications. Transp. Res. Pan C Emerg. Technol. 2017, 78, 50–62. [Google Scholar] [CrossRef]
- Pérez Fernández, J.; Alcázar Vargas, M.; Velasco García, J.M.; Cabrera Carrillo, J.A.; Castillo Aguilar, J.J. Low-Cost FPGA-Based Electronic Control Unit for Vehicle Control Systems. Sensors 2019, 19, 1834. [Google Scholar] [CrossRef] [PubMed] [Green Version]
- Sajith, A.H.; Babu, S.N.; Kumar, V.; Prakash, R. Optimisation of an Electric Drive Train for ‘On Road’ Electric Vehicle. SAE Tech. Pap. 2009. [Google Scholar] [CrossRef]
- Gao, Y.; Chen, L.; Ehsani, M. Investigation of the Effectiveness of Regenerative Braking for EV and HEV. SAE Trans. 1999, 108, 3184–3190. [Google Scholar] [CrossRef]
- Gao, Y.; Ehsani, M. Electronic Braking System of EV and HEV—Integration of Regenerative Braking, Automatic Braking Force Control and ABS. SAE Trans. 2001, 110, 576–582. [Google Scholar] [CrossRef]
- So, J.J.; Kang, J.; Park, S.; Park, I.; Lee, J. Automated Emergency Vehicle Control Strategy Based on Automated Driving Controls. J. Adv. Transp. 2020, 2020, 3867921. [Google Scholar] [CrossRef]
- Zhang, Y.; Zeng, T.; Zhang, Y.; Ai, Z.; Feng, Y. Model adaptive torque control and distribution with error reconstruction strategy for RWID EVs. IET Intell. Transp. Syst. 2020, 14, 382–391. [Google Scholar] [CrossRef]
- Masjosthusmann, C.; Köhler, U.; Decius, N.; Büker, U. A vehicle energy management system for a battery electric vehicle. In Proceedings of the 2012 IEEE Vehicle Power and Propulsion Conference, Seoul, Korea, 9–12 October 2012; pp. 339–344. [Google Scholar]
- Hao, L.; Sun, B.H.; Li, G.; Guo, L. The Eco-Driving Considering Coordinated Control Strategy for the Intelligent Electric Vehicles. IEEE Access 2021, 9, 10686–10698. [Google Scholar] [CrossRef]
- Fu, J.T.; Fu, Z.M.; Song, S.Z. Model predictive control-based control strategy to reduce driving-mode switching times for parallel hybrid electric vehicle. Trans. Inst. Meas. Control 2021, 43, 167–177. [Google Scholar] [CrossRef]
- Qi, W.Q. Fuzzy control strategy of pure electric vehicle based on driving intention recognition. J. Intell. Fuzzy Syst. 2020, 39, 5131–5139. [Google Scholar] [CrossRef]
- Guo, N.; Zhang, X.; Zou, Y.; Lenzo, B.; Du, G.; Zhanga, T. A Supervisory Control Strategy of Distributed Drive Electric Vehicles for Coordinating Handling, Lateral Stability, and Energy Efficiency. IEEE Trans. Transp. Electrif. 2021. [Google Scholar] [CrossRef]
- Wang, S.Y.; Lin, X.K. Eco-driving control of connected and automated hybrid vehicles in mixed driving scenarios. Appl. Energy 2020, 271, 115233. [Google Scholar] [CrossRef]
- Li, M.; Wu, X.; He, X.; Yu, G.; Wang, Y. An eco-driving system for electric vehicles with signal control under V2X environment. Transp. Res. Part C 2018, 93, 335–350. [Google Scholar] [CrossRef]
- Ma, F.W.; Yang, Y.; Wang, J.W.; Liu, Z.; Li, J.; Nie, J.; Wu, L. Predictive energy-saving optimization based on nonlinear model predictive control for cooperative connected vehicles platoon with V2V communication. Energy 2019, 189, 116120. [Google Scholar] [CrossRef]
- Zhang, B.; Xu, F.; Zhang, J.; Shen, T. Real-time control algorithm for minimising energy consumption in parallel hybrid electric vehicles. Iet Electr. Syst. Transp. 2020, 10, 331–340. [Google Scholar] [CrossRef]
- Zhang, X.; Zhang, T.; Zou, Y.; Du, G.; Guo, N. Predictive Eco-Driving Application Considering Real-World Traffic Flow. IEEE Access 2020, 8, 82187–82200. [Google Scholar] [CrossRef]
- Lu, Y.; Xu, X.; Ding, C.; Lu, G. A Speed Control Method at Successive Signalized Intersections under Connected Vehicles Environment. IEEE Intell. Transp. Syst. Mag. 2019, 11, 117–128. [Google Scholar] [CrossRef]
- National Research Council. Highway Capacity Manual; Transportation Research Board: Washington, DC, USA, 2000. [Google Scholar]


Publisher’s Note: MDPI stays neutral with regard to jurisdictional claims in published maps and institutional affiliations. |
© 2021 by the authors. Licensee MDPI, Basel, Switzerland. This article is an open access article distributed under the terms and conditions of the Creative Commons Attribution (CC BY) license (https://creativecommons.org/licenses/by/4.0/).