Article

Research on Recommendation Method of Product Design Scheme Based on Multi-Way Tree and Learning-to-Rank

School of Mechanical Engineering, Sichuan University, Chengdu 610065, China
*
Author to whom correspondence should be addressed.
Machines 2020, 8(2), 30; https://doi.org/10.3390/machines8020030
Submission received: 15 April 2020 / Revised: 25 May 2020 / Accepted: 31 May 2020 / Published: 5 June 2020

Abstract

:
A product is composed of several components, and the number, type, and combination of components plays a crucial role in the process of product design. It is difficult to get an optimized scheme in a short time. In order to improve the efficiency of product design, a product design scheme recommendation algorithm based on multi-way tree and learning-to-rank is proposed. Firstly, the product solution model, whose nodes are obtained by mapping the product attributes, is generated according to the design process, and the alternative scheme is obtained by traversing the multi-tree model. Secondly, considering users’ cognition of the importance of each product attribute, the analytic hierarchy process (AHP) is applied to assign weight to the product attribute, and then similarity to ideal solution (TOPSIS) method based on AHP is used to rank alternative solutions. Furthermore, according to users’ preference for parts’ supplier information, the learning-to-rank algorithm is used to optimize the list of alternative schemes twice. Finally, taking the design of the hoist as an example, it was verified that the proposed method had higher efficiency and better recommendation effect than the traditional parametric design method.

1. Introduction

With the continuous development of computer technology, product design patterns and methods are changing. In order to meet the increasing demand of personalized product design, it has become the development trend of new product design mode to further shorten the product design cycle, reduce product cost, and improve product performance [1]. In the face of complex products, design companies often consider two design ideas: Top-down and bottom-up. Since the top-down design method is more in line with the designer’s design thinking process, it is more natural to adopt the top-down design method for the design of complex products [2,3,4].
The top-down design process is usually divided into three design phases: Requirements’ analysis, conceptual design, and detailed design. In the process of product design, the functional requirements are first analyzed and the preliminary conceptual models are proposed. Then, through the evaluation of the design scheme, the best conceptual model is determined. Finally, each part in the design scheme is designed in detail [5]. However, the current CAD (Computer Aided Design) software cannot effectively support the whole process of top-down product design, especially in the transition phase between conceptual design and detailed design. Most product design systems based on CAD software (Creo, SolidWorks) are mainly determined by a skeleton model of the main components and the overall layout of the product by the designer [6]. According to the model, the parts are designed in detail, and the finished parts are finally assembled into the initial skeleton model to complete the assembly model of a product [6].
In order to stay competitive in the industry, enterprises should reduce the manufacturing cost while maintaining the product quality [7]. However, the proportion of enterprises’ payment for purchased parts accounts for more than 50% of the total product cost [8]. Therefore, choosing the right supplier can significantly reduce product cost, improve product competitiveness, and improve customer satisfaction. It is reviewed that in recent years, most of the optimization models for supplier selection are established based on each indicator of the supplier, and different algorithms are applied to get a reasonable plan [9,10]. At present, most product design systems basically use a database to store the functions, specifications, dimensions, and other information of different suppliers for purchased parts. The designer completes the selection of each component according to the functional requirements, and the combination of different series’ numbers of different parts’ suppliers also plays an important role in the decision of the final plan.
The work of this paper is divided into two parts. A design model based on multi-way tree structure was proposed. The design scheme is represented by a set of product attributes that are the main structural parameters of the product and the number and type of each component. The conceptual design and detailed design of the product are combined by using the principle of multi-way tree to form a pattern of combining the principles and designing the parts at the same time. After the design is completed, the product solutions are integrated as a feature of multi-way tree. A certain number of design schemes can be obtained by traversing multiple trees.
Analytic hierarchy process (AHP) is a decision-making method that decomposes elements related to decision making into objective, criteria, and plan for qualitative and quantitative analysis at three levels [11]. Technique for order preference by similarity to an ideal solution (TOPSIS) is a sorting method that approximates the ideal solution, which evaluates the relative merits and demerits of the existing objects according to the degree of similarity between the limited evaluation objects and the ideal target [11]. AHP and TOPSIS are used to evaluate the design scheme. In the second part, a recommendation method of optimizing component supplier combination based on learning-to-rank was proposed. According to the preference demand of the designer, the training set is constructed by the user’s operation log. The learning-to-rank algorithm is used to sort the list of recommended schemes twice.
The novelty of this paper is as follows:
  • The design scheme included not only the principle synthesis of the product but also the selection and structure information of the corresponding parts. At the same time, the conceptual design of the product was done by a computer.
  • A simplified and efficient recommendation method was proposed to evaluate design schemes.
In this paper, Section 2 describes previous research and background in top-down product design and combination of suppliers, and then the proposed method is explained in Section 3. This paper presents a recommendation method of product design schemes based on multi-way tree and learning-to-rank. Then, a case study was performed with a hoist to demonstrate the feasibility and usefulness of the proposed method in Section 4. A conclusion of this study is described in Section 5.

2. Related Research

In the development history of product design, top-down product design has always been an important issue, and the support of top-down design of a computer aided system is absolutely necessary. This section outlines some important research work on both top-down product design and supplier portfolio selection.
Most 3D CAD software can only provide a geometric modeling function for the design/drawing operation, which cannot completely replace the top-down design process of the product by the computer [12]. Therefore, many researchers hope to replace CAD systems with more automated, knowledge-based, and intelligent design systems by expanding CAD systems.
Aleixo et al. [13] combined the conceptual design with the final product modeling, and verified the method by testing two CAD software conceptual design tools. He et al. [14] proposed an original understanding integrated modeling method based on physical quantity model, which connected functional design, principle concept design, and structure concept design. Nahm et al. [15] combined the practice of SBD (Schottky Barrier Diode) with parametric modeling and proposed a design model based on preference set to make the early design stage more flexible. In order to improve the efficiency of design/redesign, Sharma and Gao [16] proposed a method that combines sequential flowchart logic with expert system, uses user-defined feature tree as input for analysis, and takes flange as an example to verify the effectiveness of the method. Kong et al. [17] developed a 3D injection mold design system integrated with SolidWorks by using Visual C++. Varela et al. [18] proposed a C++ rapid parameterization system for ship structure based on 3D CAD software. Lin et al. [19] developed a mold parametric design system based on Pro/engineer. Yang et al. [20] developed a blade modeling system. On Creo platform, Zhang et al. [21] established a feature information model based on part feature description by using CAD technology, parametric design, and part model library technology. Li et al. [22] proposed a full-parameter correlation modeling design system for standard CAMs (Computer Aided Manufacturing) with different working angles, which simplified the steps of CAM modeling.
In recent years, scholars have carried out a lot of research on supplier portfolio selection. Most of the suppliers involved in the product design process are as a multi-objective decision problem. Therefore, analytic hierarchy process (AHP), mathematical programming, linear programming, data envelope analysis (DEA), genetic algorithm, and other methods have been proposed. Benyoucef et al. [23] proposed a supplier selection system based on analytic hierarchy process (AHP) which integrates fuzzy concepts and empirical data. Balakrishnan et al. [24] constructed a product component portfolio design scheme and a multi-objective optimization model of suppliers, which was optimized by mathematical programming method to achieve the optimal product design, which takes both tangible and intangible factors into consideration when selecting the best supplier, so as to determine the optimal supplier and order quantity. Toloo et al. [25] constructed a comprehensive data enveloping analysis (DEA) model that can identify the most effective suppliers from the cardinal and ordinal data, and illustrated the applicability of the method by taking the specification data of 18 suppliers as an example. Cao et al. [26] established an optimization model of integrating product family design and supplier selection based on multiple logit consumer selection rules and using genetic algorithm, which further saved costs and improved production efficiency.
According to the literature, three problems were identified in terms of computer-aided product design and supplier portfolio. First of all, it is seldom considered to combine conceptual design and detailed design, and most product design systems only realize one or the other of computer-aided product conceptual design or detailed design. Second, the previous product design system requires designers to interact with the system to determine certain design parameters and parts’ selection by experience, so the number of design schemes obtained is very few and the schemes are not optimal. Finally, most supplier combinations need to collect a lot of information to establish mathematical models to solve problems, which is a complex process. In the next section, we will discuss in detail how to recommend product design solutions based on multi-way tree and learning-to-rank.

3. The Recommendation Method

3.1. Product Design Model Based on Multi-Way Tree Structure

The design scheme can be represented by the attributes of the product. Since the attributes of a product are limited, the number of design schemes is also limited by permutation and combination [27]. At the same time, the principle for designers to judge the advantages and disadvantages of a scheme is to weigh whether the values of several important attributes of the scheme are better on the basis of meeting the design requirements. Therefore, given a set of attributes, S = {A1,…,An} describes a design scheme.
In order to make the design process of the scheme have a clear structure, the product design system adopts the multi-way tree structure to establish the model, and attributes generate the multi-way tree nodes in each layer in order of the design process requirements. Among them, the nodes in this model are divided into two categories: Inherent nodes and generated nodes. The inherent node corresponds to the inherent attribute that will remain unchanged while design requirements are changed. The generated node corresponds to the generated attribute that is calculated from the inherent attribute and other design parameters. A complete path of the structure is a design scheme for the product. After the design is completed, the structure can be traversed to generate all possible solutions (alternatives). All possible solutions (alternatives) can be obtained by traversing the structure, after the design is completed. The attribute structure table is shown in Table 1, and the multi-way tree structure is shown in Figure 1.
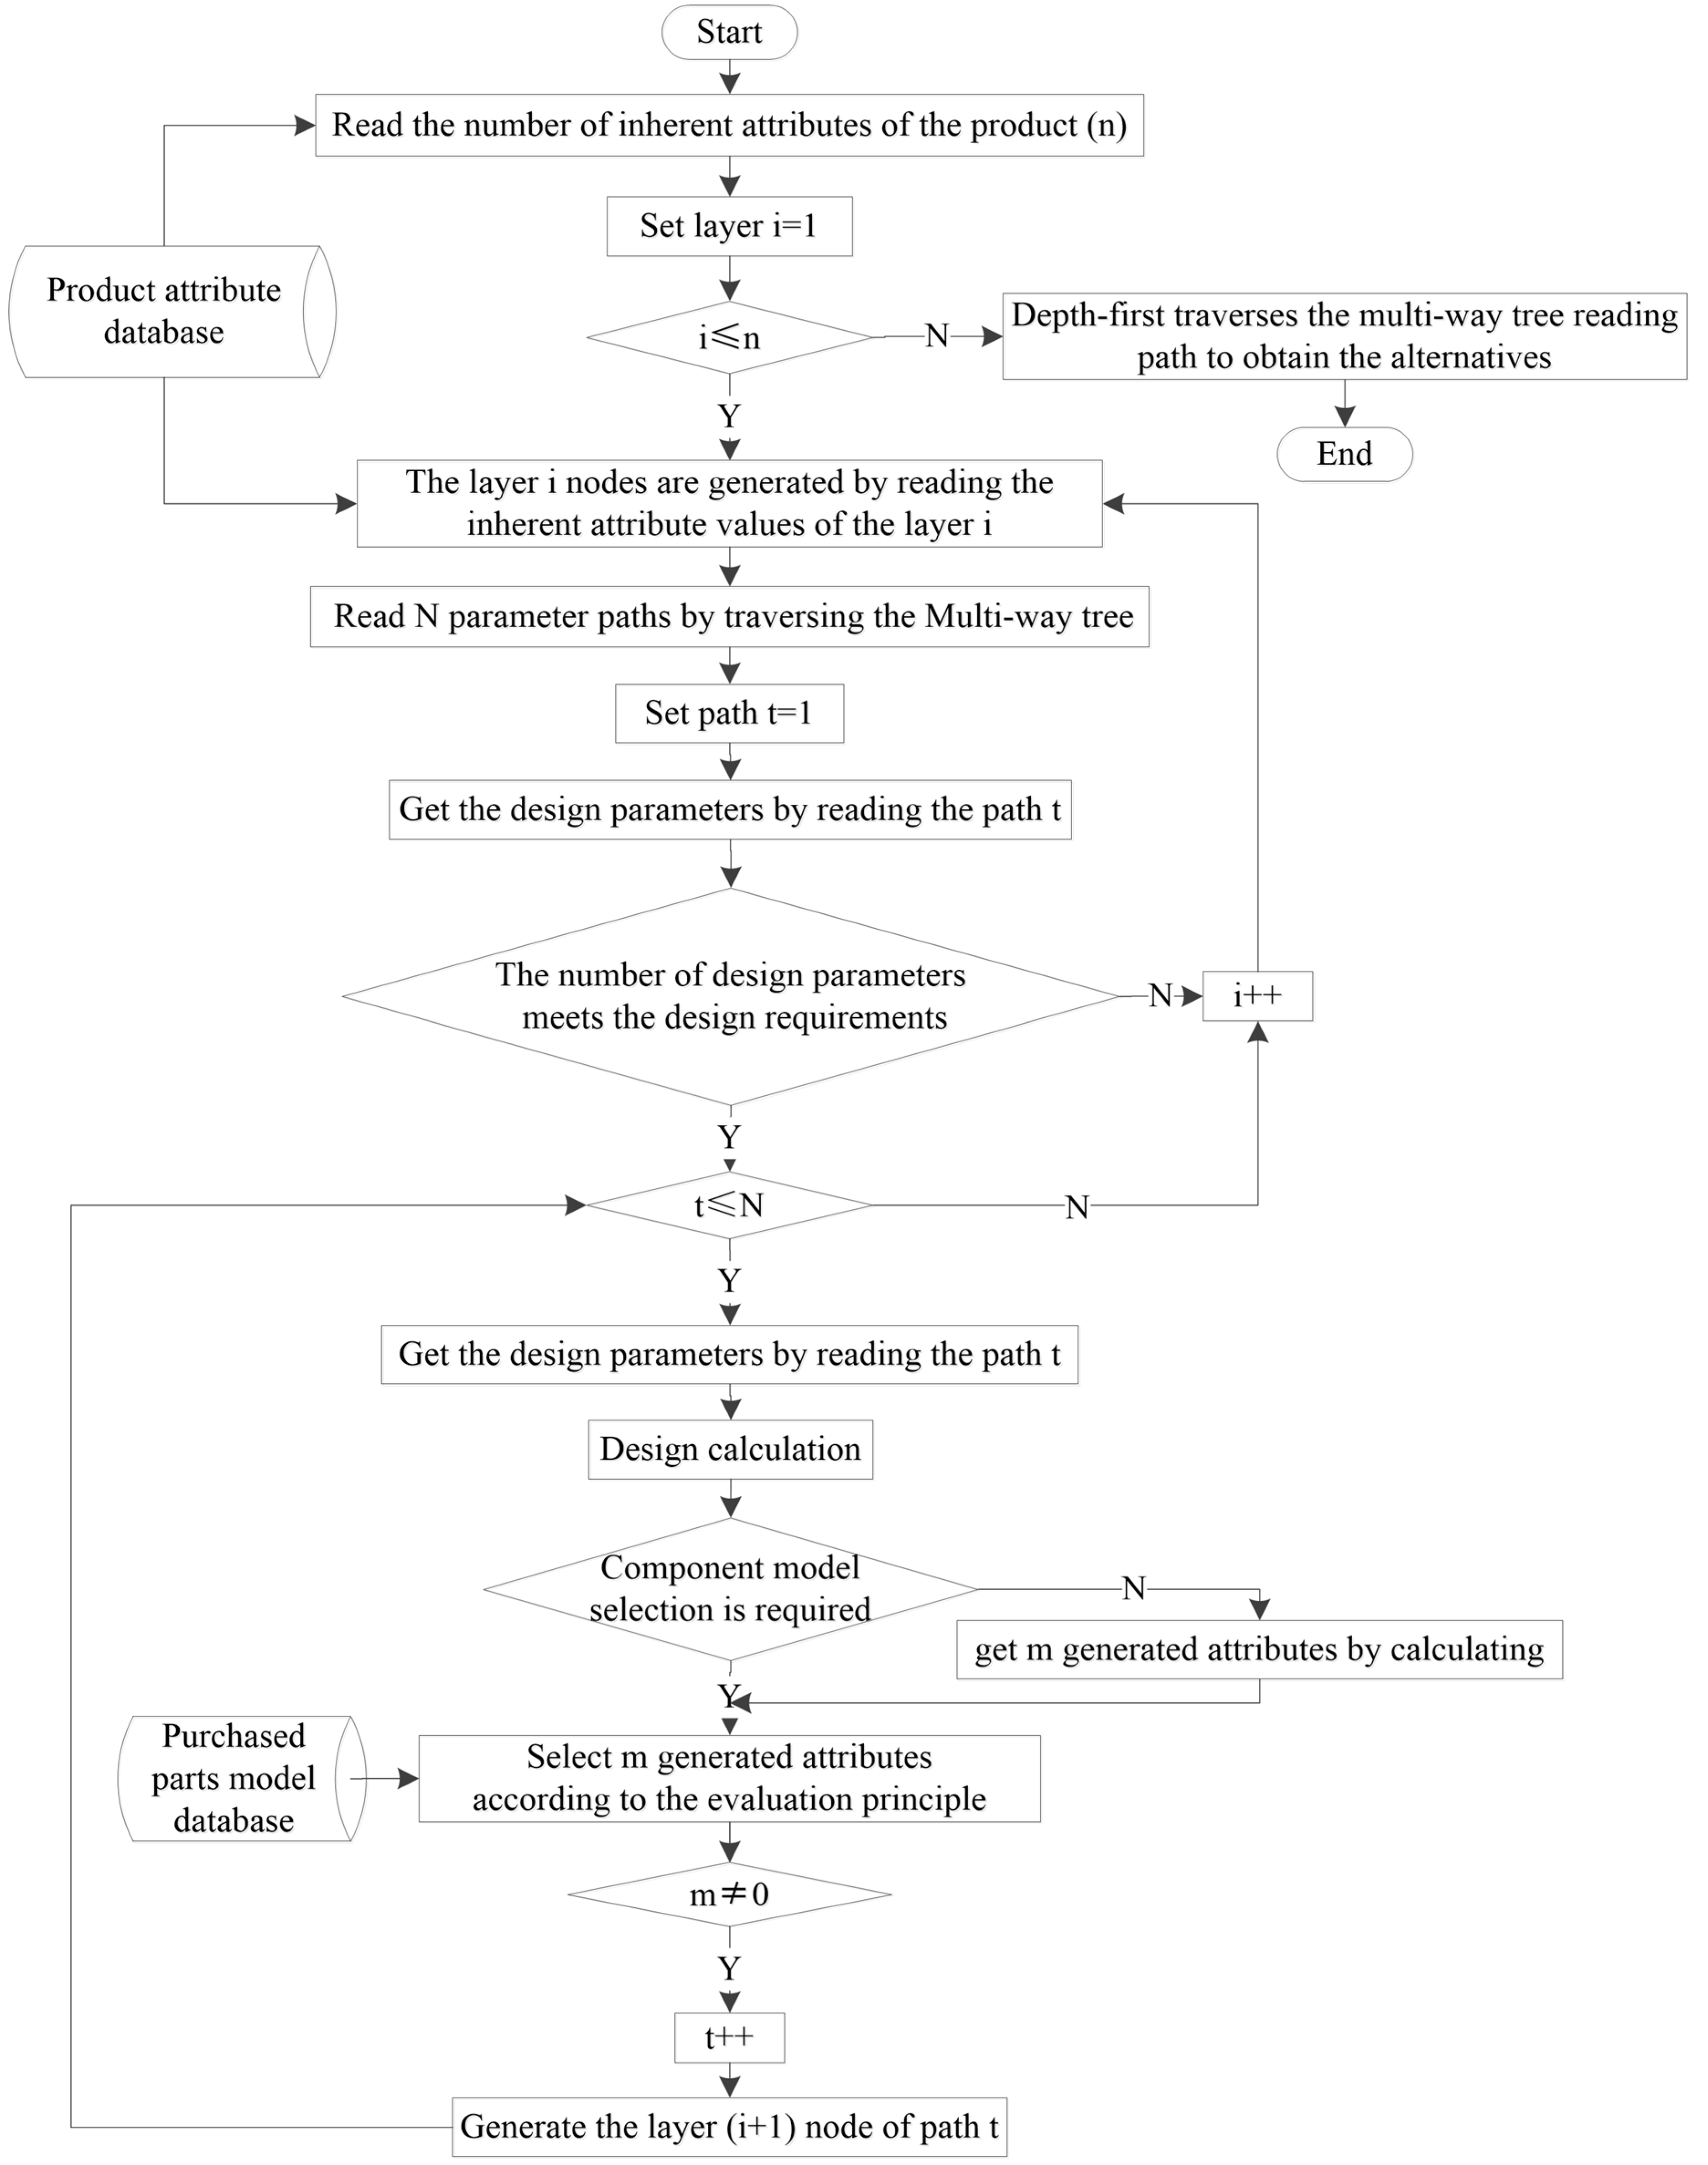
The specific process of multi-way tree model is shown in Figure 2.
Step 1: Multi-way tree model initialization.
Get the total number of inherent attributes n by reading the number of the product inherent attributes from product attribute database; set layer i = 1, and start the system.
Step 2: Generation of lower level nodes.
In order to obtain sufficient parameter values, the current multi-way tree model needs to be judged. If the number of nodes in the node path t that reads the current number of layers meets the required design parameters, the component design is started; otherwise, the next layer node is loaded: Layer i = i + 1.
Step 3: The component design.
When the design parameters meet the requirements, the path t is read (t = 1). If the component is purchased from abroad, the selection is required. According to the evaluation rules, the lower level nodes are generated from the purchased parts model database; otherwise, the lower level nodes are generated by calculating. If m ≠ 0, t = t + 1 and generate the layer (i + 1) of path t; otherwise, the path t ends.
Step 4: Acquisition of alternatives.
When the multi-way tree model is complete (i > n), alternatives were obtained by depth-first traversal [28].

3.2. Design Scheme Ordering Based on AHP-TOPSIS Method

3.2.1. AHP-TOPSIS Method

The analytic hierarchy process (AHP) proposed by Saaty, an American operations research scientist, in the 1970s, is a decision analysis method combining qualitative and quantitative analysis, which is widely applicable to the decision analysis of various types of problems. It is decomposed into the problem of complex constituent factors. These factors will govern how formation is grouped with hierarchical structure, through comparing the two ways to determine the relative importance of various factors in the hierarchy, relative weights under single criterion, and the consistency check, Then human judgment is integrated to decide the total sorts of the relative importance of various factors. The disadvantage of AHP is that when the judgment matrix is constructed in a qualitative way, the judgment may be too subjective due to human factors [29]. The basic idea of TOPSIS is to determine the ideal solution and the negative ideal solution, according to the elements of the decision-making problem, and to rank each scheme according to the relative closeness degree of the ideal solution of its elements. That is, the scheme closest to the ideal solution and furthest from the negative ideal solution is the optimal scheme. The disadvantage of TOPSIS method is that it adopts a one-dimensional qualitative method to determine the index weight, so it is difficult to determine the index weight in the case of multi-factor analysis [29].
This paper, on the basis of summarizing the previous research results, applied AHP and TOPSIS in the evaluation and ranking of design schemes [30]. First, it used AHP to divide all factors into ordered levels and scientifically assign weights. Then, it constructed the AHP-TOPSIS comprehensive evaluation model by combining with TOPSIS. TOPSIS can rank the evaluation objects according to how close they are to the ideal target, but in the case of multi-factor analysis, it is difficult to determine the index weight, and AHP can effectively overcome this disadvantage to some extent. TOPSIS can comprehensively consider more than 10 factors of program evaluation, and AHP can objectively give the weight of each influencing factor. The combination of the two can create conditions for improving the accuracy of program ranking.
Product life cycle cost includes design phase cost, manufacturing phase cost, sales phase cost, use and maintenance cost, and recovery and scrap cost [31]. Since more than 70% of the total cost of product life cycle is borne in the initial stage of design, designers can fully consider the impact of design decisions on the life cycle, thus greatly reducing the product life cycle cost [32]. Therefore, it is very important to estimate and optimize the cost as early as possible and as accurately as possible. In order to achieve the above goals, this part mainly uses typical parameters in the product concept design phase to estimate the cost of alternative solutions and to sort the solution set. In order to achieve the above purposes, this part mainly uses typical parameters [33] of the product concept design stage to estimate the cost of alternative schemes and to sort the scheme set. Typical parameters mainly refer to the cost of each component that affects the product cost. Sometimes the cost of the product parts is not clear, and other parameters of the parts can be used to group the evaluation indicators for the evaluation of the scheme. According to the evaluation objects, the role of each indicator in the comprehensive evaluation is not equally important, and the weight of traditional TOPSIS is generally set artificially to take the average value, which cannot reflect the preference and personality of experts [34]. Therefore, according to the characteristics and requirements of the product, experts establish the evaluation index system. In order to calculate the overall cost of the product scientifically, the weight of components is taken as the evaluation index, and AHP is applied to determine the weight of each index in the evaluation index system of the product. TOPSIS is used to determine the relative proximity of each index value of the alternative solution to the ideal solution, so as to rank the advantages and disadvantages of the product design alternatives for subsequent processing by comparing the relative proximity [35].

3.2.2. Scheme Ranking Process

The sequence of design schemes based on AHP-TOPSIS is as follows [36] (AHP is summarized in step 1, TOPSIS is summarized in steps 2–8):
Step 1: Experts select m typical parameters C1, C2, …, Cm from the program attributes based on empirical knowledge to establish the evaluation index system of the product. AHP method was used to calculate the weight of each evaluation index ω. The five-scale method was adopted to compare and assign values, and then the corresponding judgment matrix A was constructed according to the assignment criteria, as shown in Table 2.
A = ( C 11 C 12 C 1 m C 21 C 22 C 2 m C m 1 C m 2 C mm )
Step 2: Set the scheme S = {S1, S2, …, Sn) and each scheme evaluation index R = {r1, r2, …, rm}. The evaluation index rij represents the j evaluation index of the i scheme, where i∈[1, n], j∈[1, m]. The initial judgment matrix can be expressed as:
S = ( r 11 r 12 r 1 m r 21 r 22 r 2 m r n 1 r n 2 r nm )
Step 3: The initial judgment matrix S = (rij)n × m is normalized to get the matrix Z = (zij)n × m, where the elements are:
z i j = r i j / i = 1 n r i j 2
Step 4: By multiplying the column vectors of the matrix and the weights of evaluation indicators determined by AHP method, the weighted standardized decision matrix B = (bij)n × m can be obtained, where the elements are:
b i j = ω i z i j
Step 5: The positive and negative ideal solutions are obtained. That is, the optimal value and the worst value of each index constitute the positive ideal solution B+ and the negative ideal solution B:
B + = ( b 1 + , b 2 + , , b m + )
B = ( b 1 , b 2 , , b m )
b j + = max ( b 1 j , b 2 j , , b n j ) j = 1 , 2 , , m
b j = min ( b 1 j , b 2 j , , b n j ) j = 1 , 2 , , m
Step 6: Calculate the n-dimensional Euclidean distance Qi+ and Qj+ of each design scheme from B+ and B using the following equations:
Q i + = j = 1 m ( b i j b j + ) 2 1 2
Q i = j = 1 m ( b i j b j ) 2 1 2
Step 7: Calculate the relative proximity of each design scheme to the ideal solution Di:
D i = Q i / ( Q i + + Q i )
Step 8: Sort each design scheme according to the size order of Di, and select the first n1 schemes for the designer to choose.

3.3. Optimization of Component Supplier Combination Based on Learning-to-Rank

The list of solutions generated based on AHP-TOPSIS did not reflect the designer’s preference for the component supplier combination. In order to solve this problem, a component supplier combination recommendation algorithm based on user behavior feedback was proposed to further optimize the recommendation list.

3.3.1. Problem Statement

Our problem can be formalized as follows: Given a set of product suppliers and serial numbers S = {S1, S2, …, Sn} describing these products’ attributes’ combination based on the designer’s preference, our goal was to induce a function f that scored design schemes in S according to the degree to which they satisfy the specific requirements of a designer, given as an n-tuple (s1, s2, …, sn)

3.3.2. Formulation as a Learning-to-Rank Problem

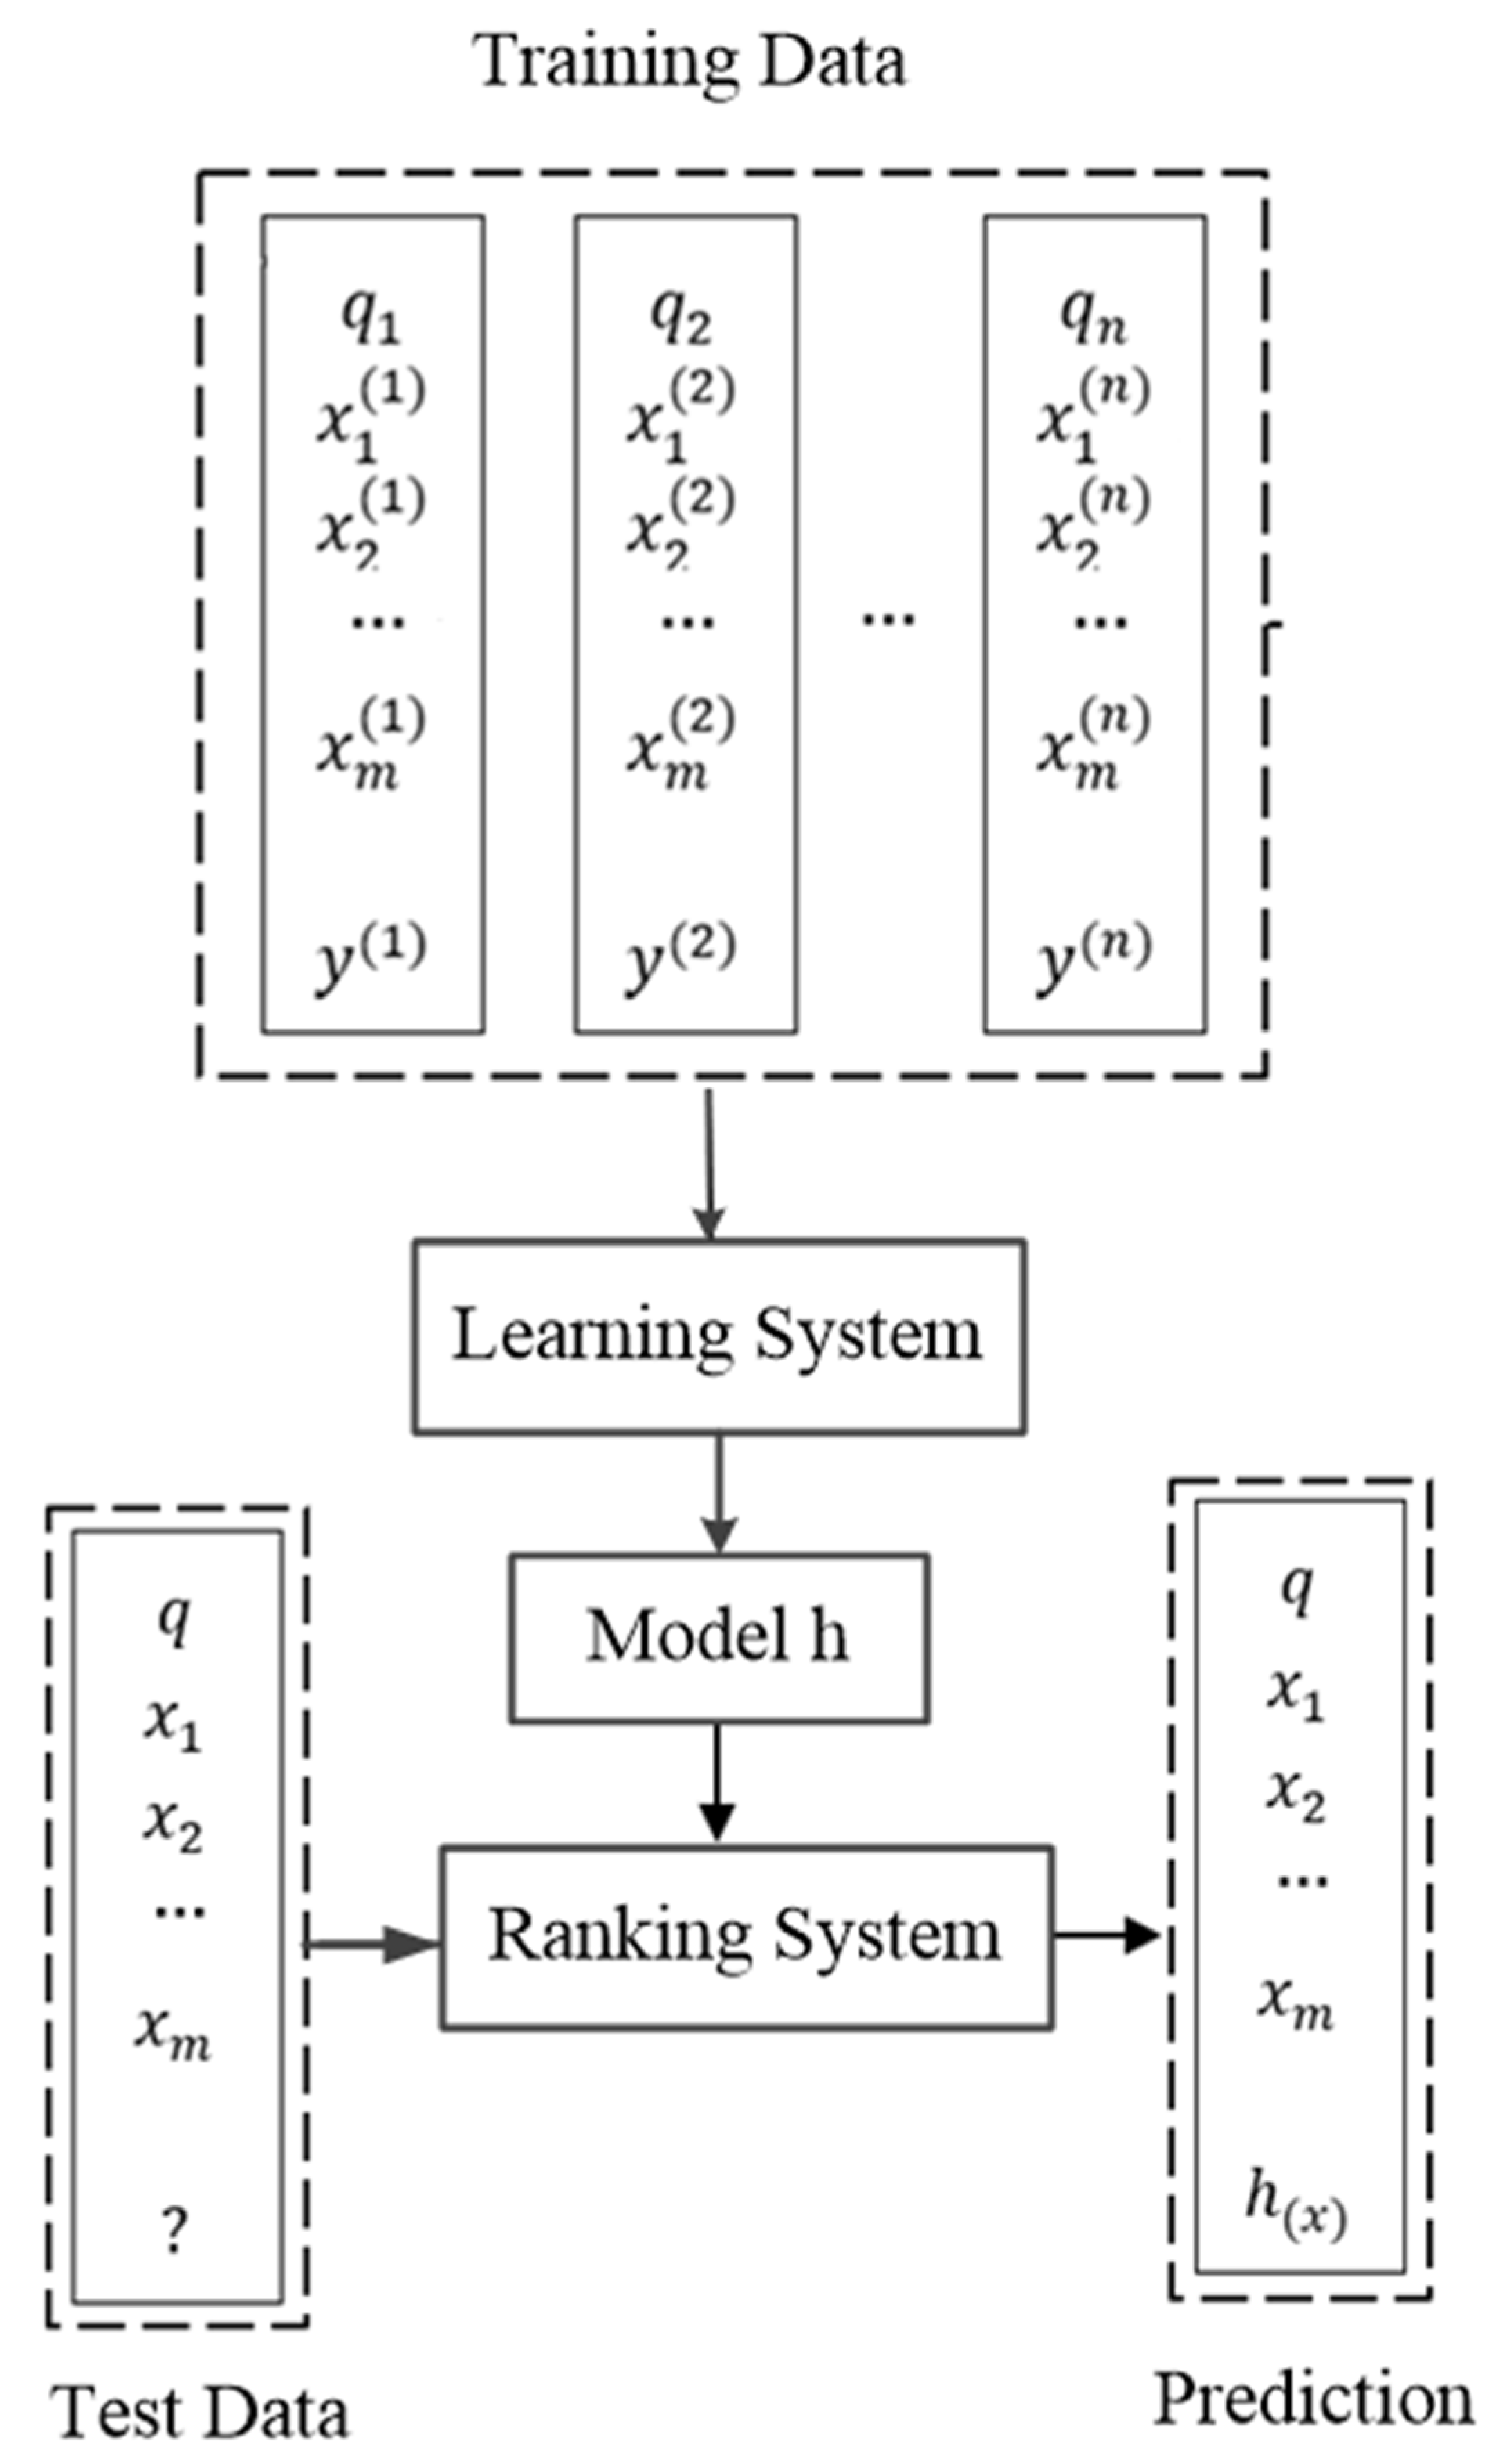
Learning-to-rank [37] method uses machine learning method in an information retrieval problem to automatically learn the final sorting function for retrieval based on feature set. The classic learning-to-rank framework is shown in Figure 3.
In this framework, first extract the characteristics of the document to get eigenvector xj(i). The eigenvector and annotation constitute a training example of the document pair (xj(i), y(i)). Then, choose the appropriate ranking algorithm to learn and get the ranking model h. Finally, a new query q (test data) outputs the relevance score of the query and the documents to be sorted according to the ranking model h and then outputs according to the score. Its formal description is as follows:
Suppose the eigenvector space of the ranking object is X = {x1,x2,…,xm} ⊆ Rn, where n is the dimension of the eigenvector xi and m is the number of samples in the training data set. Each eigenvector corresponds to a label yi ∈ Y and dimspace Y = {y1,y2,…,ym}. Y consists of discrete variables and there is an order relationship between them. The purpose of learning-to-rank is to find an optimal rank function f* from the solution space F = {f : Rn →Y} to minimize the risk function, R(f) = ∫X × Yl(x, y, f(x))dp(x, y). Then, rank function f* for all of the output Y′ of the training data sample (X, Y) maximum close to mark Y.
RankSVM [38] is an effective learning-to-rank algorithm. It uses pair-wised samples as training samples. The optimization objective of learning is that, in the sorting function of samples, the number of reverse pairs of samples is the least.
Following Joachims [39], we formalized the task as a ranking problem. We defined a designer requirement as a tuple r = (s1, s2, …, sn), and, if si was more in line with the requirements specified in r than sj, then si > sj. Then, our goal was to induce a ranking function f shown in Equation (12):
s i > s j f ( s i ) > f ( s j )
We approached this problem using the framework of RankSVM provided by Joachims [39]. The function f was assumed a linear model parametrized by a weight vector ω that assigned a weight to all features shown in Equation (13):
f ( s ) = ω ,   s
The loss function of RankSVM algorithm is shown in Equation (14).
min ω , ε 1 2 | ω | 2 + C i j ε i j s . t . y i ( ω , P i P j ) 1 ε i j
The ω is the parameter of the hyperplane, εij is the slack variable in the case that there is an outlier in the training set, and C is the error penalty factor. The larger C is, the fewer outliers can be tolerated, that is, the higher the requirement for error reduction.

3.3.3. Evaluation Method

Because the ultimate goal of the algorithm was to make the predicted project ranking as close as possible to the preference of experts, rather than the rating prediction, the evaluation method selected NDCG (normalized discounted cumulative gain) [40] as the measurement. NDCG is often used as an evaluation index to evaluate the ranking accuracy. NDCG@K refers to taking Top K recommended projects for effect evaluation. The value range was between 0 and 1. The larger the result is, the more the ranking conforms to the expectation. NDCG is more sensitive to the ranking of higher ranked items [38].
In recent years, NDCG has been widely used in information retrieval. First of all, the calculation formula of DCGK (discounted cumulative gain) is shown as follows:
D C G K = i = 1 k 2 r e l i 1 log 2 ( i + 1 )
The reli is the correlation of the recommendation results at position i, and k is the size of the list of recommendations to be examined. In order to normalize DCG, we need to compare DCG with ideal DCG as follows:
N D C G K = D C G K I D C G K

3.3.4. Construction Method of Training Data

This algorithm requires users to mark the query results according to the positive or negative correlation between the scheme result returned by the system and the user’s design intention, and then the system uses the user’s feedback information to improve the scheme sorting. However, most users are unwilling to spend the time and energy to give feedback to the system, so it is difficult for the system to obtain sufficient user feedback [41]. Therefore, in order to obtain sufficient user feedback to construct training data, user clicking and browsing are regarded as implicit user feedback [42]. By referring to the usage of the existing shopping software, the system will refer to the user feedback behavior, as shown in Table 3:
The recommended system constructed training data as follows: Through the collection of the designer’s behavior of browsing the scheme interface, the scheme set was reordered according to the following priority rules, and then the training data needed by the algorithm were constructed.
The priority rules are as follows:
  • Finally determine plan > alternative plan > clicked plan > unclicked plan > deleted plan (“>” means priority over, the same as later).
  • Alternatives of the same level are further prioritized by reading the detailed page time of the scheme, that is, the scheme with a long reading time has a high priority.
  • Click schemes of the same level are further prioritized by the number of clicks, that is, the schemes with more clicks have higher priority.

3.3.5. Optimization of Component Supplier Combination Process

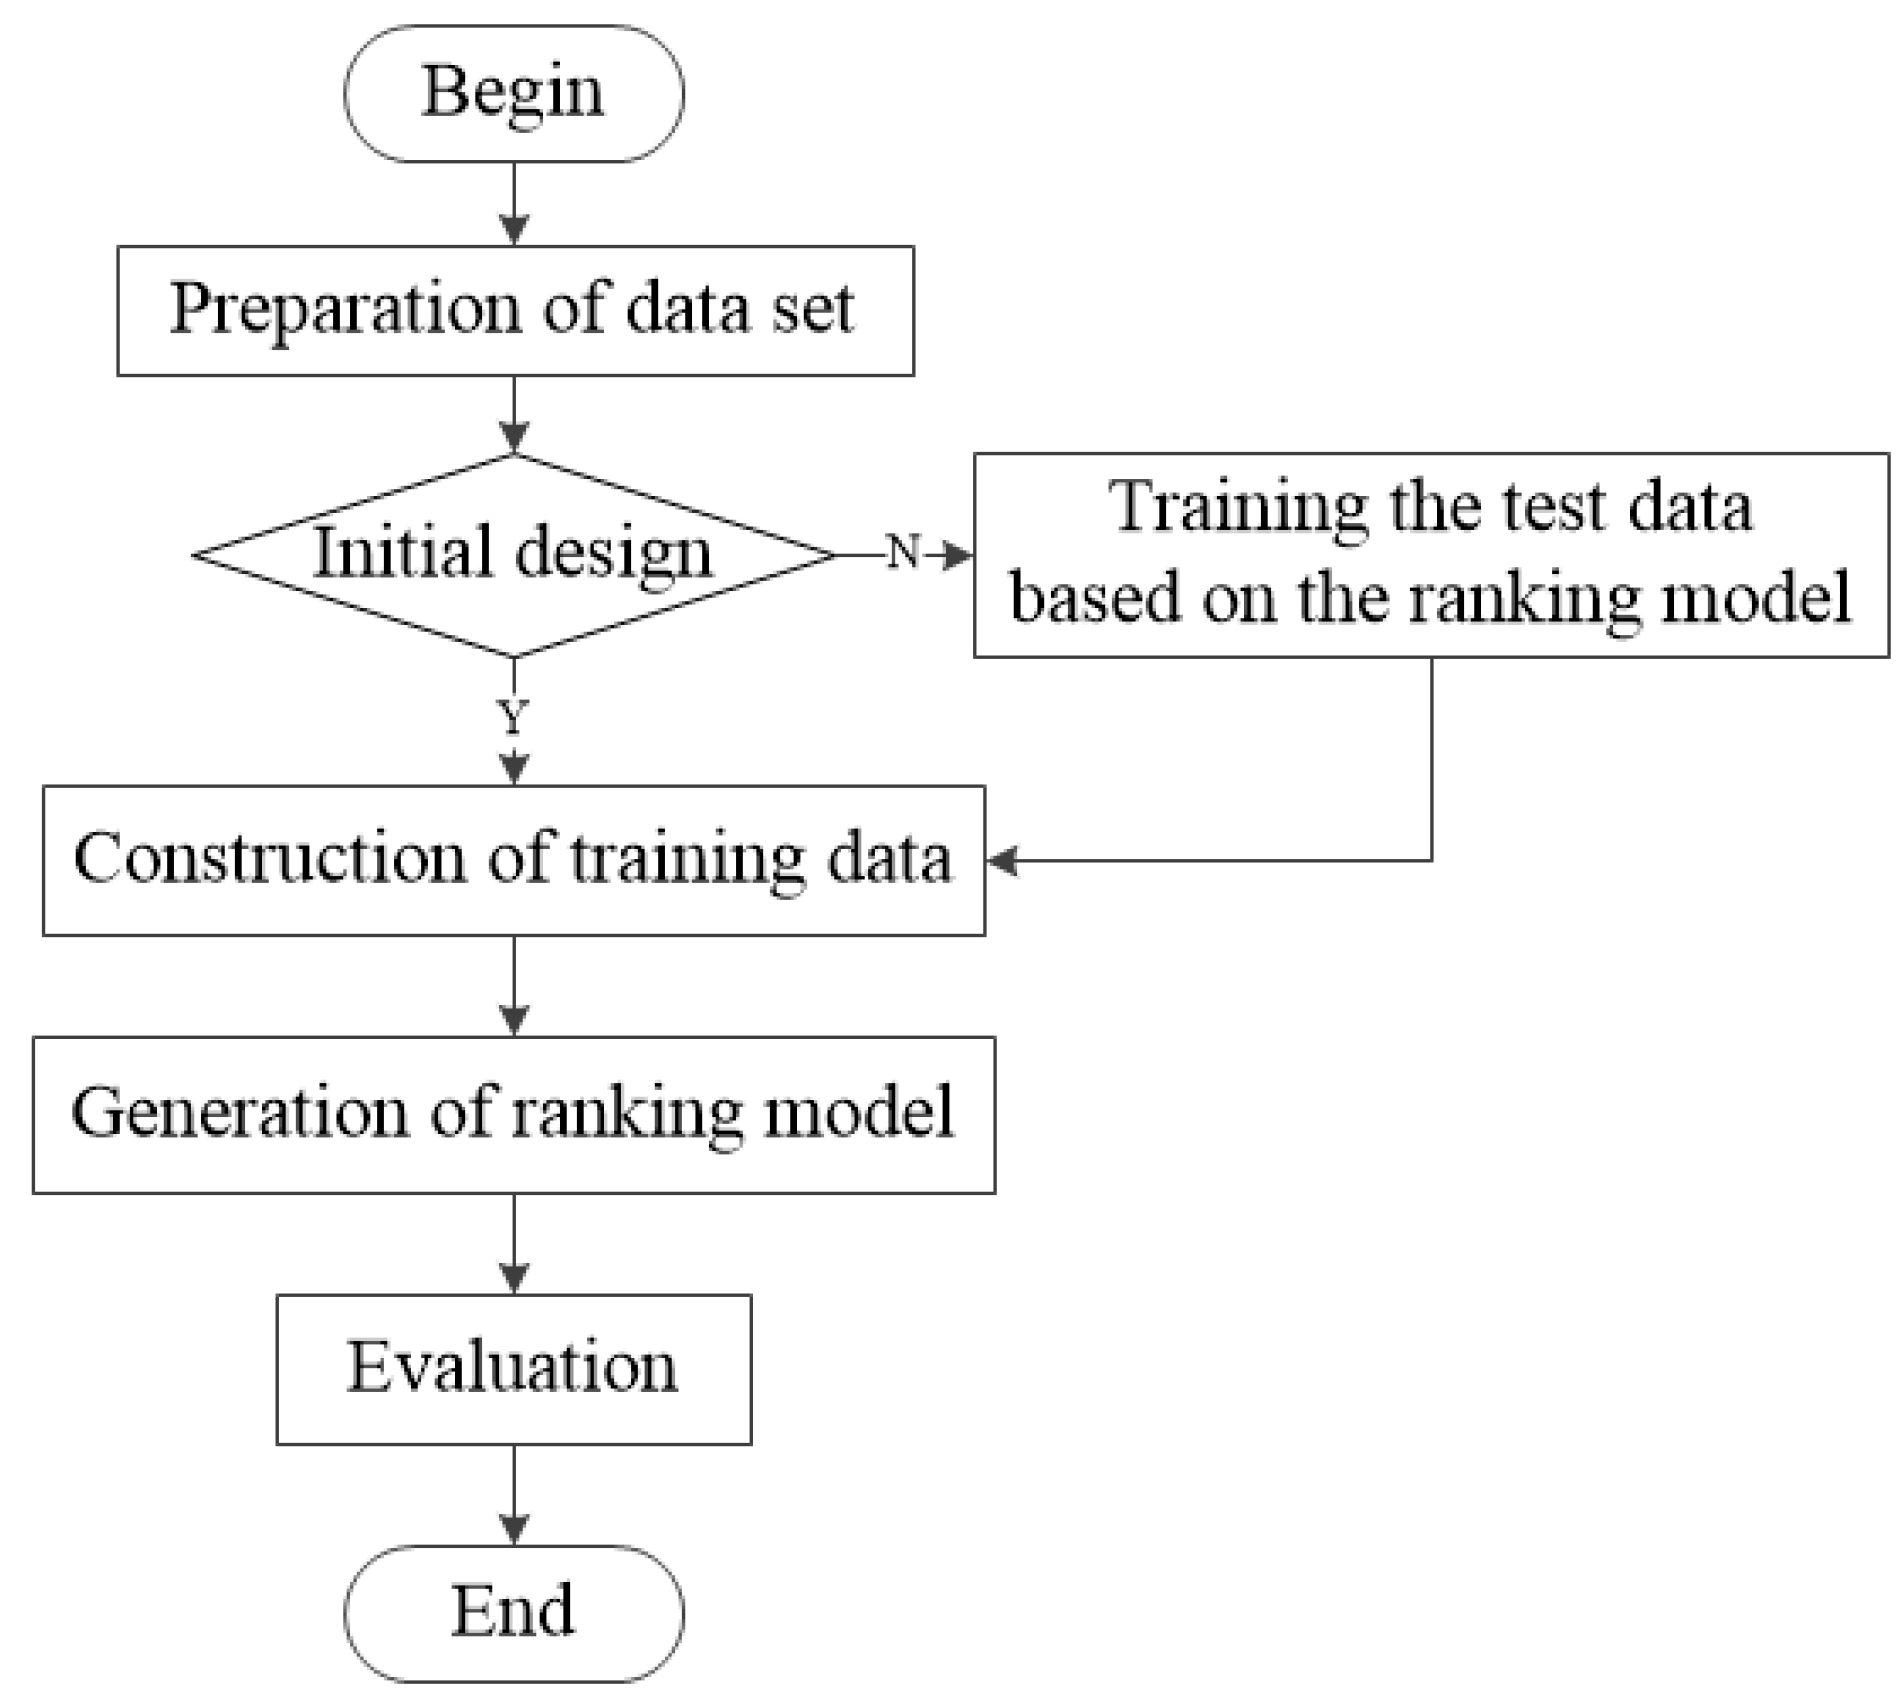
The specific process of optimization of component supplier combination is shown in Figure 4.
Step 1: Preparation of data set.
Select the first n alternatives sorted by AHP-TOPSIS. The eigenvector space (data set) of the ranking object is formed by extracting the manufacturer, series number, and other features of the parts in the scheme. The data set of the ranking object is obtained by selecting the first n alternatives sorted by AHP-TOPSIS, which is formed by extracting the manufacturer, series number, and other features of the parts in the scheme.
Step 2: Construction of training data.
If it is the first time to design, the designer will choose the best design scheme based on experience. According to the above priority rules, the data set is reordered to form the training data. If not, the data set is sorted by a trained sorting model, and then the above operation is performed.
Step 3: Generation of ranking model.
An appropriate learning-to-rank algorithm is selected to train the data set to obtain the model.
Step 4: Evaluation.
In order to evaluate the effect of different algorithms on this problem, the metric of NDCG is adopted to evaluate the ranking result.

4. Case Study

4.1. The Data Set

In order to verify the efficiency of the above comprehensive recommendation algorithm, it was used to design the “fixed winch hoist” of a water conservancy and hydropower machinery company. The properties of fixed winch hoist are shown in Table 4. The project information parameters of the test set of the hoist are shown in Table 5, the system structure of the hoist multi-way tree was constructed according to the attributes in Table 4, and the corresponding alternative combination for generating each instance was calculated.

4.2. Ranking of Design Schemes Based on AHP-TOPSIS Method

4.2.1. Determination of Evaluation Index Weight

First of all, the experts of the water conservancy and hydropower machinery company were invited to screen out a number of attributes that affect the selection of hoist design scheme. According to the attribute importance decided by experts, the evaluation index system of hoist design scheme, as shown in Table 6, could be established, and the pairwise comparison judgment matrix could be constructed to obtain the characteristic vector. On the basis of Table 6, the judgment decision matrix of indicator layer C1, C2, …, C7 for criterion layer B1 was constructed. The feature vectors obtained by Matlab program were as follows: ω = ( 0.0102 , 0.2602 , 0.0633 , 0.2602 , 0.0198 , 0.0198 , 0.3664 ) .
Judgment decision matrix
A = ( 0 2 1 2 1 1 2 2 0 1 0 2 2 0 1 1 0 1 1 1 2 2 0 1 0 2 2 0 1 2 1 2 0 0 2 1 2 1 2 0 0 2 2 0 2 0 2 2 0 )

4.2.2. The Alternatives’ Ranking Based on TOPSIS

No. 1 of the test dealt with AHP-TOPSIS algorithm, the positive and negative ideal solutions were obtained, and all alternatives were sorted as follows.
(1) No. 1 generated 4288 schemes, shown in Table 7. Matrix Z was obtained by normalizing the decision matrix S, which was constituted by the attribute values.
S = ( 22 957.34 390 380 105 1100 29.5 22 957.34 390 380 105 1120 29.5 22 957.34 390 380 104 1120 29.5 38 1335.86 402 180 135 1120 29.5 38 1335.86 402 180 103 1100 29.5 38 1335.86 402 180 103 1120 29.5 )
Z = ( 0.0184 0.0209 0.0276 0.0175 0.0239 0.0254 0.0103 0.0184 0.0209 0.0276 0.0175 0.0239 0.0258 0.0103 0.0184 0.0209 0.0276 0.0175 0.0236 0.0254 0.0103 0.0318 0.0291 0.0284 0.0083 0.0307 0.0258 0.0103 0.0318 0.0291 0.0284 0.0083 0.0234 0.0254 0.0103 0.0318 0.0291 0.0284 0.0083 0.0234 0.0258 0.0103 )
(2) Generate AHP weighted decision matrix B.
B = ( 0.000188 0.0054 0.0017 0.0046 0.000473 0.000502 0.0038 0.000188 0.0054 0.0017 0.0046 0.000473 0.000511 0.0038 0.000188 0.0054 0.0017 0.0046 0.000468 0.000502 0.0038 0.000324 0.0076 0.0018 0.0022 0.000608 0.000511 0.0038 0.000324 0.0076 0.0018 0.0022 0.000464 0.000502 0.0038 0.000324 0.0076 0.0018 0.0022 0.000464 0.000511 0.0038 )
(3) Find the positive ideal solution B+ and the negative ideal solution B:
B + = ( 0.000324     0.0084     0.0024     0.0105     0.000608     0.000511     0.0191 )
B = ( 0.000188     0.0052     0.00027     0.0017     0.000464     0.000502     0.0038 )
(4) Calculate the distance from each design scheme to the positive and negative ideal solutions C+ and C:
C + = ( 0.0252     0.0252     0.0252     0.0251     0.0253     0.0253 ) T
C = ( 0.0046     0.0046     0.0046     0.0047     0.0045     0.0046 ) T
(5) Calculate the relative proximity D of each design scheme to the ideal solution:
D = ( 0.1548     0.1511     0.1546     0.1574     0.1523     0.1526 ) T
(6) Sort each design scheme according to the order of Di. The scheme set sorted by example 1 is shown in Table 8.
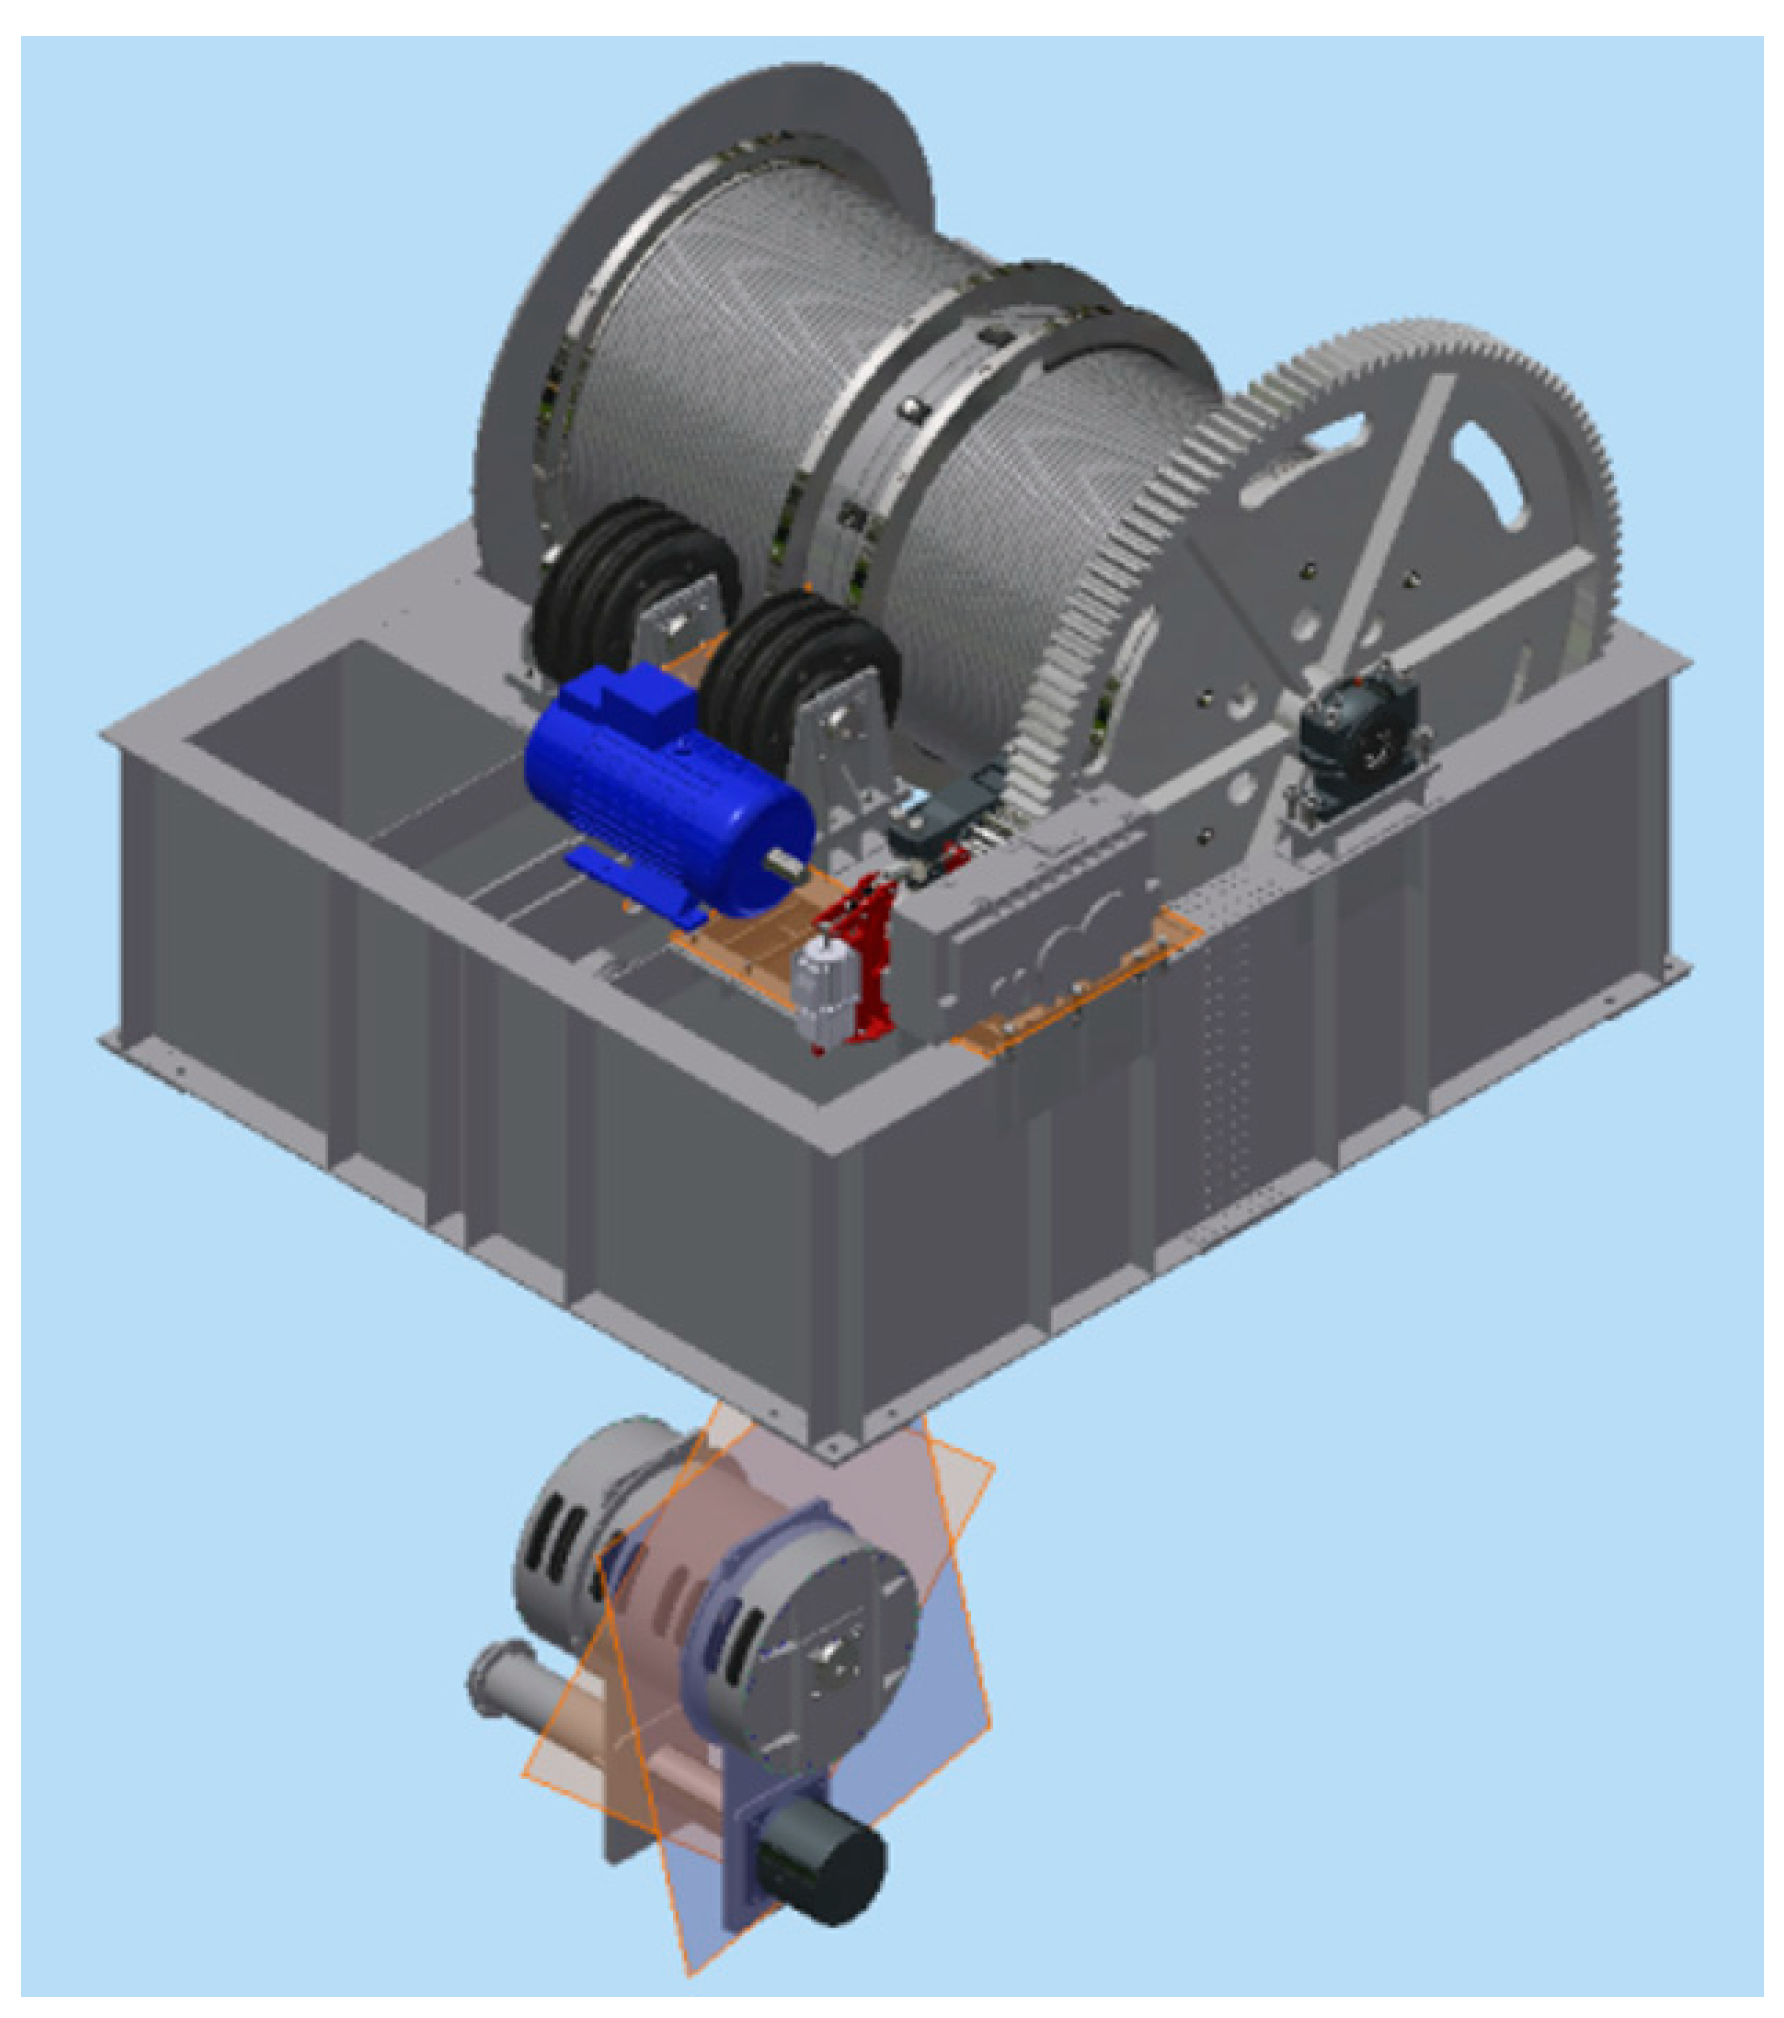
In No. 1, the 3D model of the hoist was generated in Inventor by the design scheme selected by the experts, shown in Figure 5.

4.3. Part Combination Results Based on Learning-to-Rank

According to the importance, experts chose 7 attributes of purchased parts as training parameters: Motor manufacturer, motor series number, reducer manufacturer, reducer series number, service brake type, service brake manufacturer, safety brake manufacturer. RankSVM method was used to solve the model, which was part of SVMrank toolbox, with standard parameters (C = 0.01) and a linear kernel function. We compared the performance of the RankSVM method with the other three learning-to-rank methods: RankNet [43], Coordinate Ascent [44], and ListNet [45]. The versions of these learners implemented in RankLib library version 2.5 was used, which also had standard parameters.
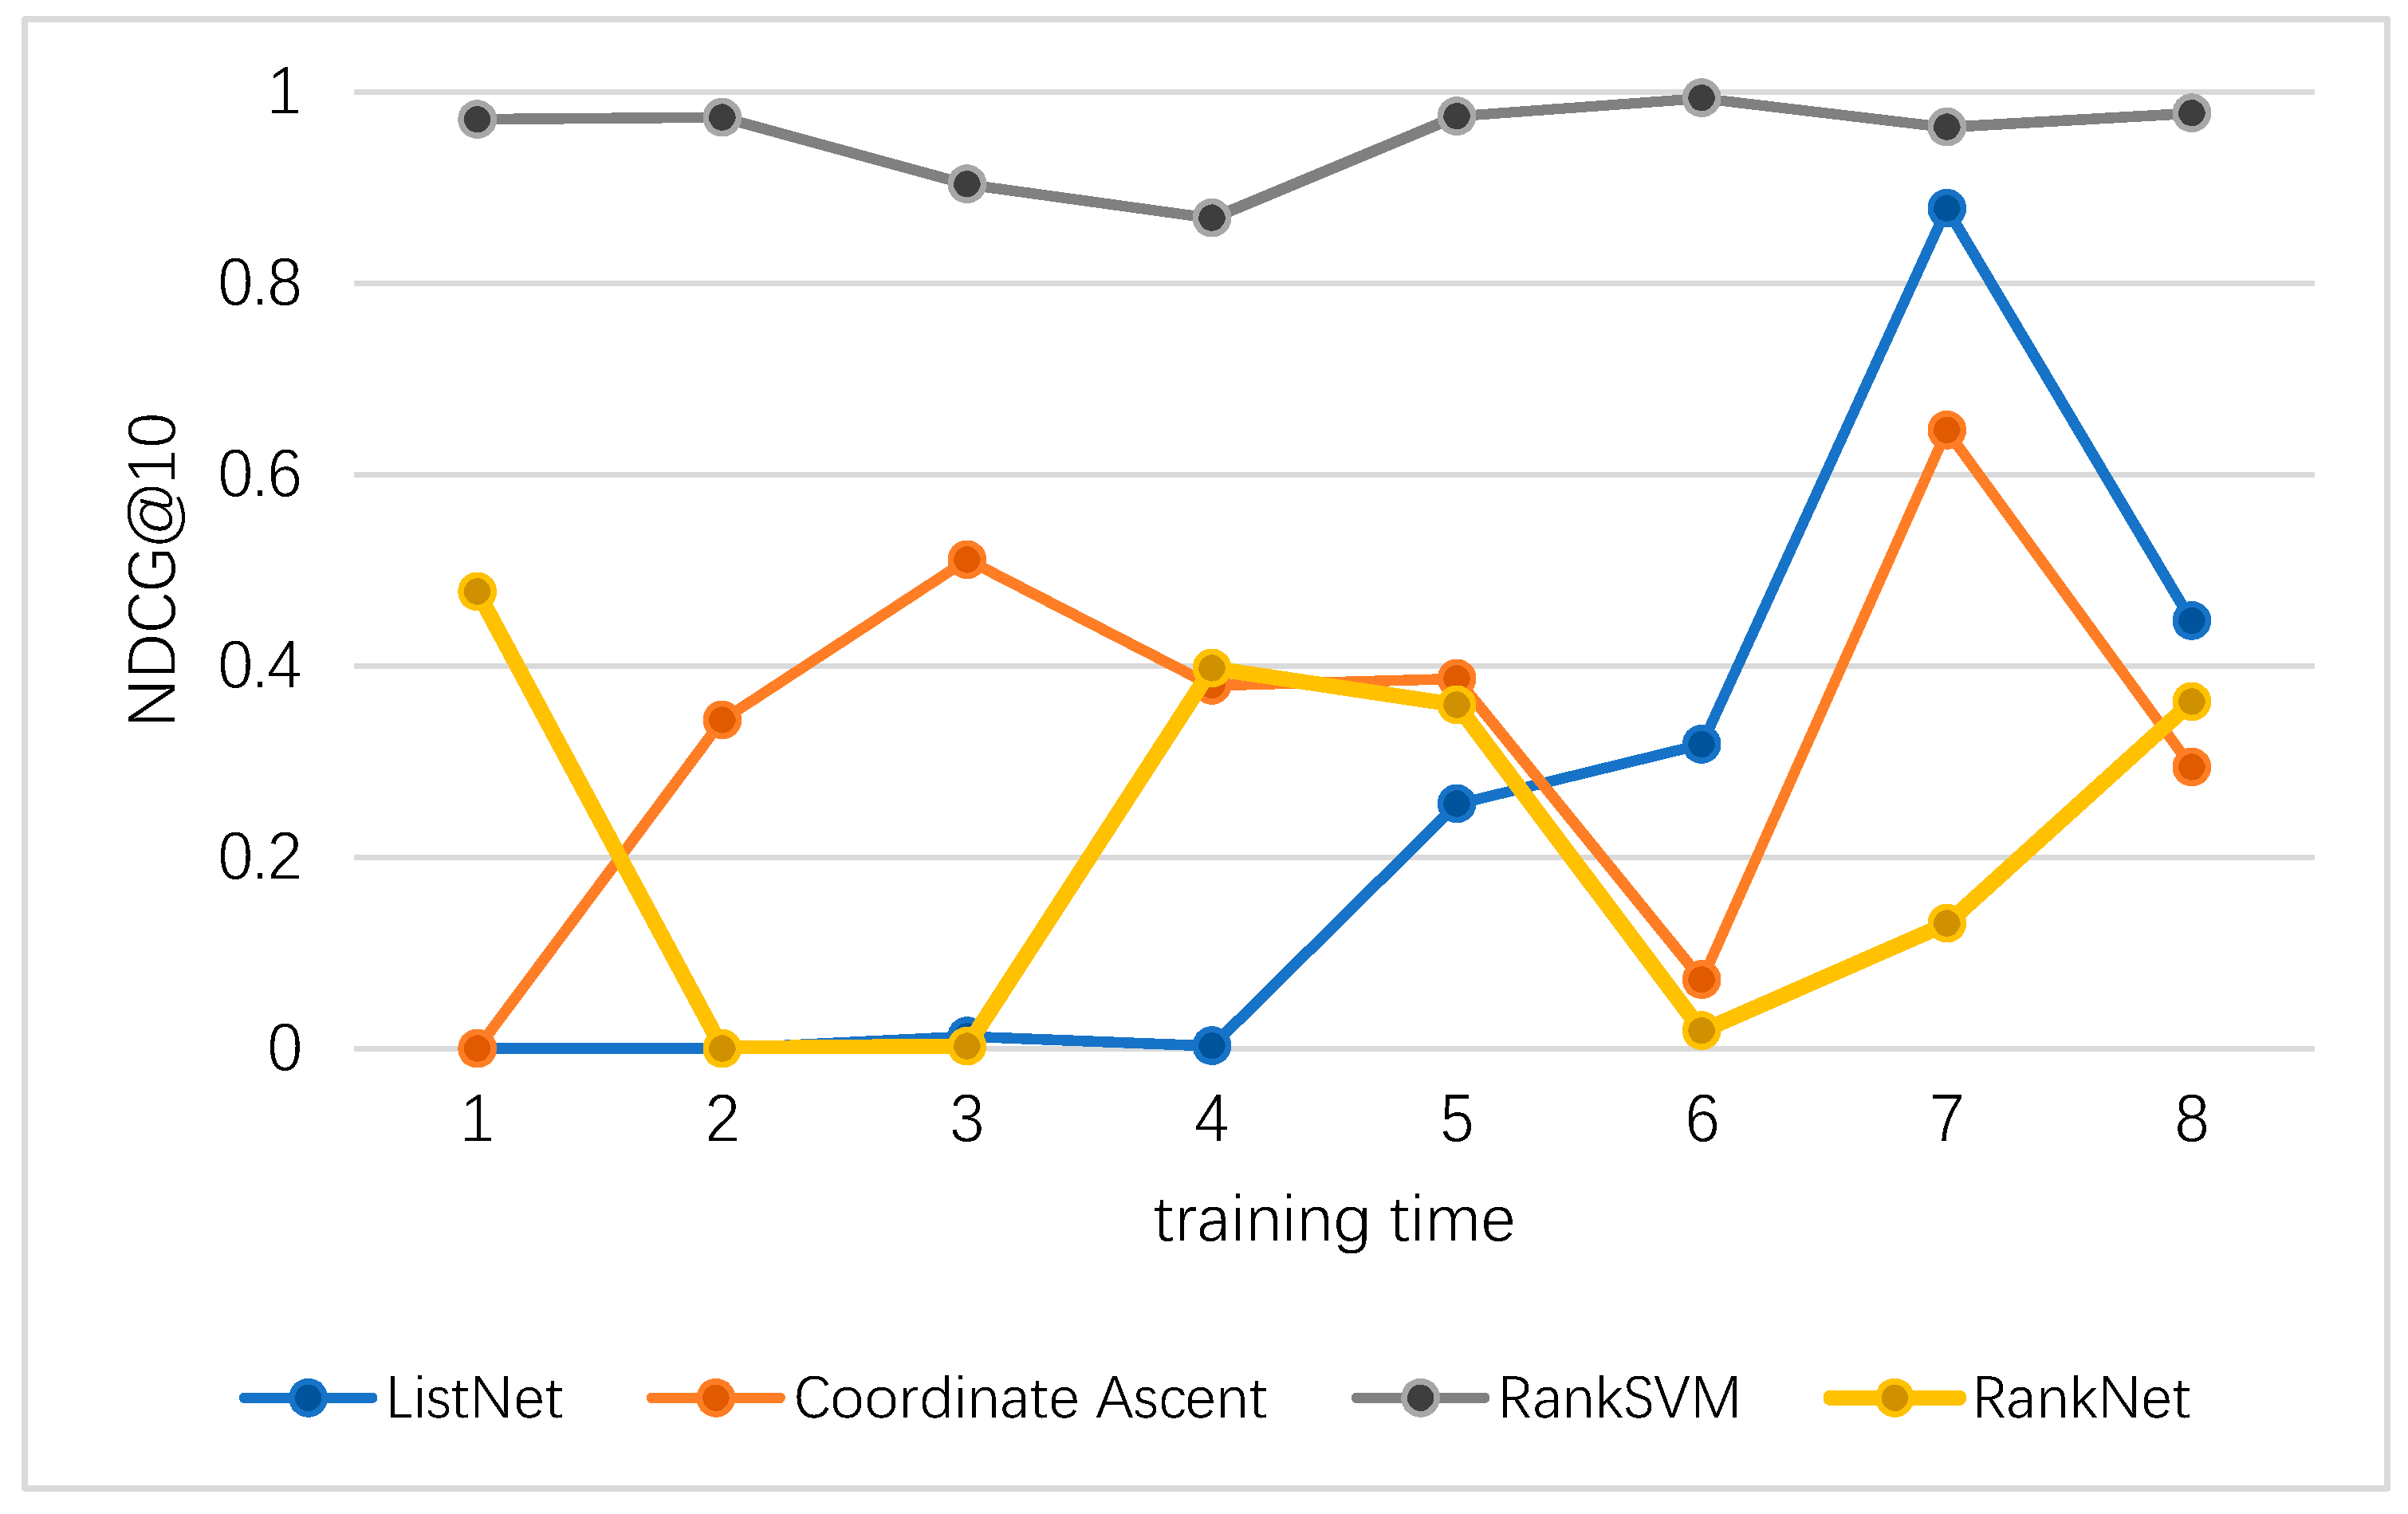
The expert operated on the program decision interface of the hoist design system for nine tests. The first 50 schemes were selected each time, and 10 schemes were displayed on each page of the interface, with a total of five pages. It was important that the optimal scheme could be presented on the homepage as far as possible to improve the efficiency of scheme decision. Therefore, NDCG@10 was selected as the evaluation index for the algorithm. The test results are shown in Figure 6.
The performance of NDCG@10 for the supplier combination of hoist was very high, with values above 0.86 (see Figure 6), which strongly correlated with the preference ranking provided by the expert. Compared with the results of other methods, RankSVM always performed well: With the increase of training times, the performance values of RankNet and Coordinate Ascent fluctuated strongly, while ListNet showed an upward trend in the first seven training times, but significantly decreased in the eighth training time. In contrast, the performance values of RankSVM slightly oscillated and NDCG@10 remained around 0.9. This was the best outcome for all learners. Therefore, the conclusion that the rankings produced by the RankSVM approach contained the relevant product schemes at the top of the ranked list was drawn.

4.4. Results and Discussion

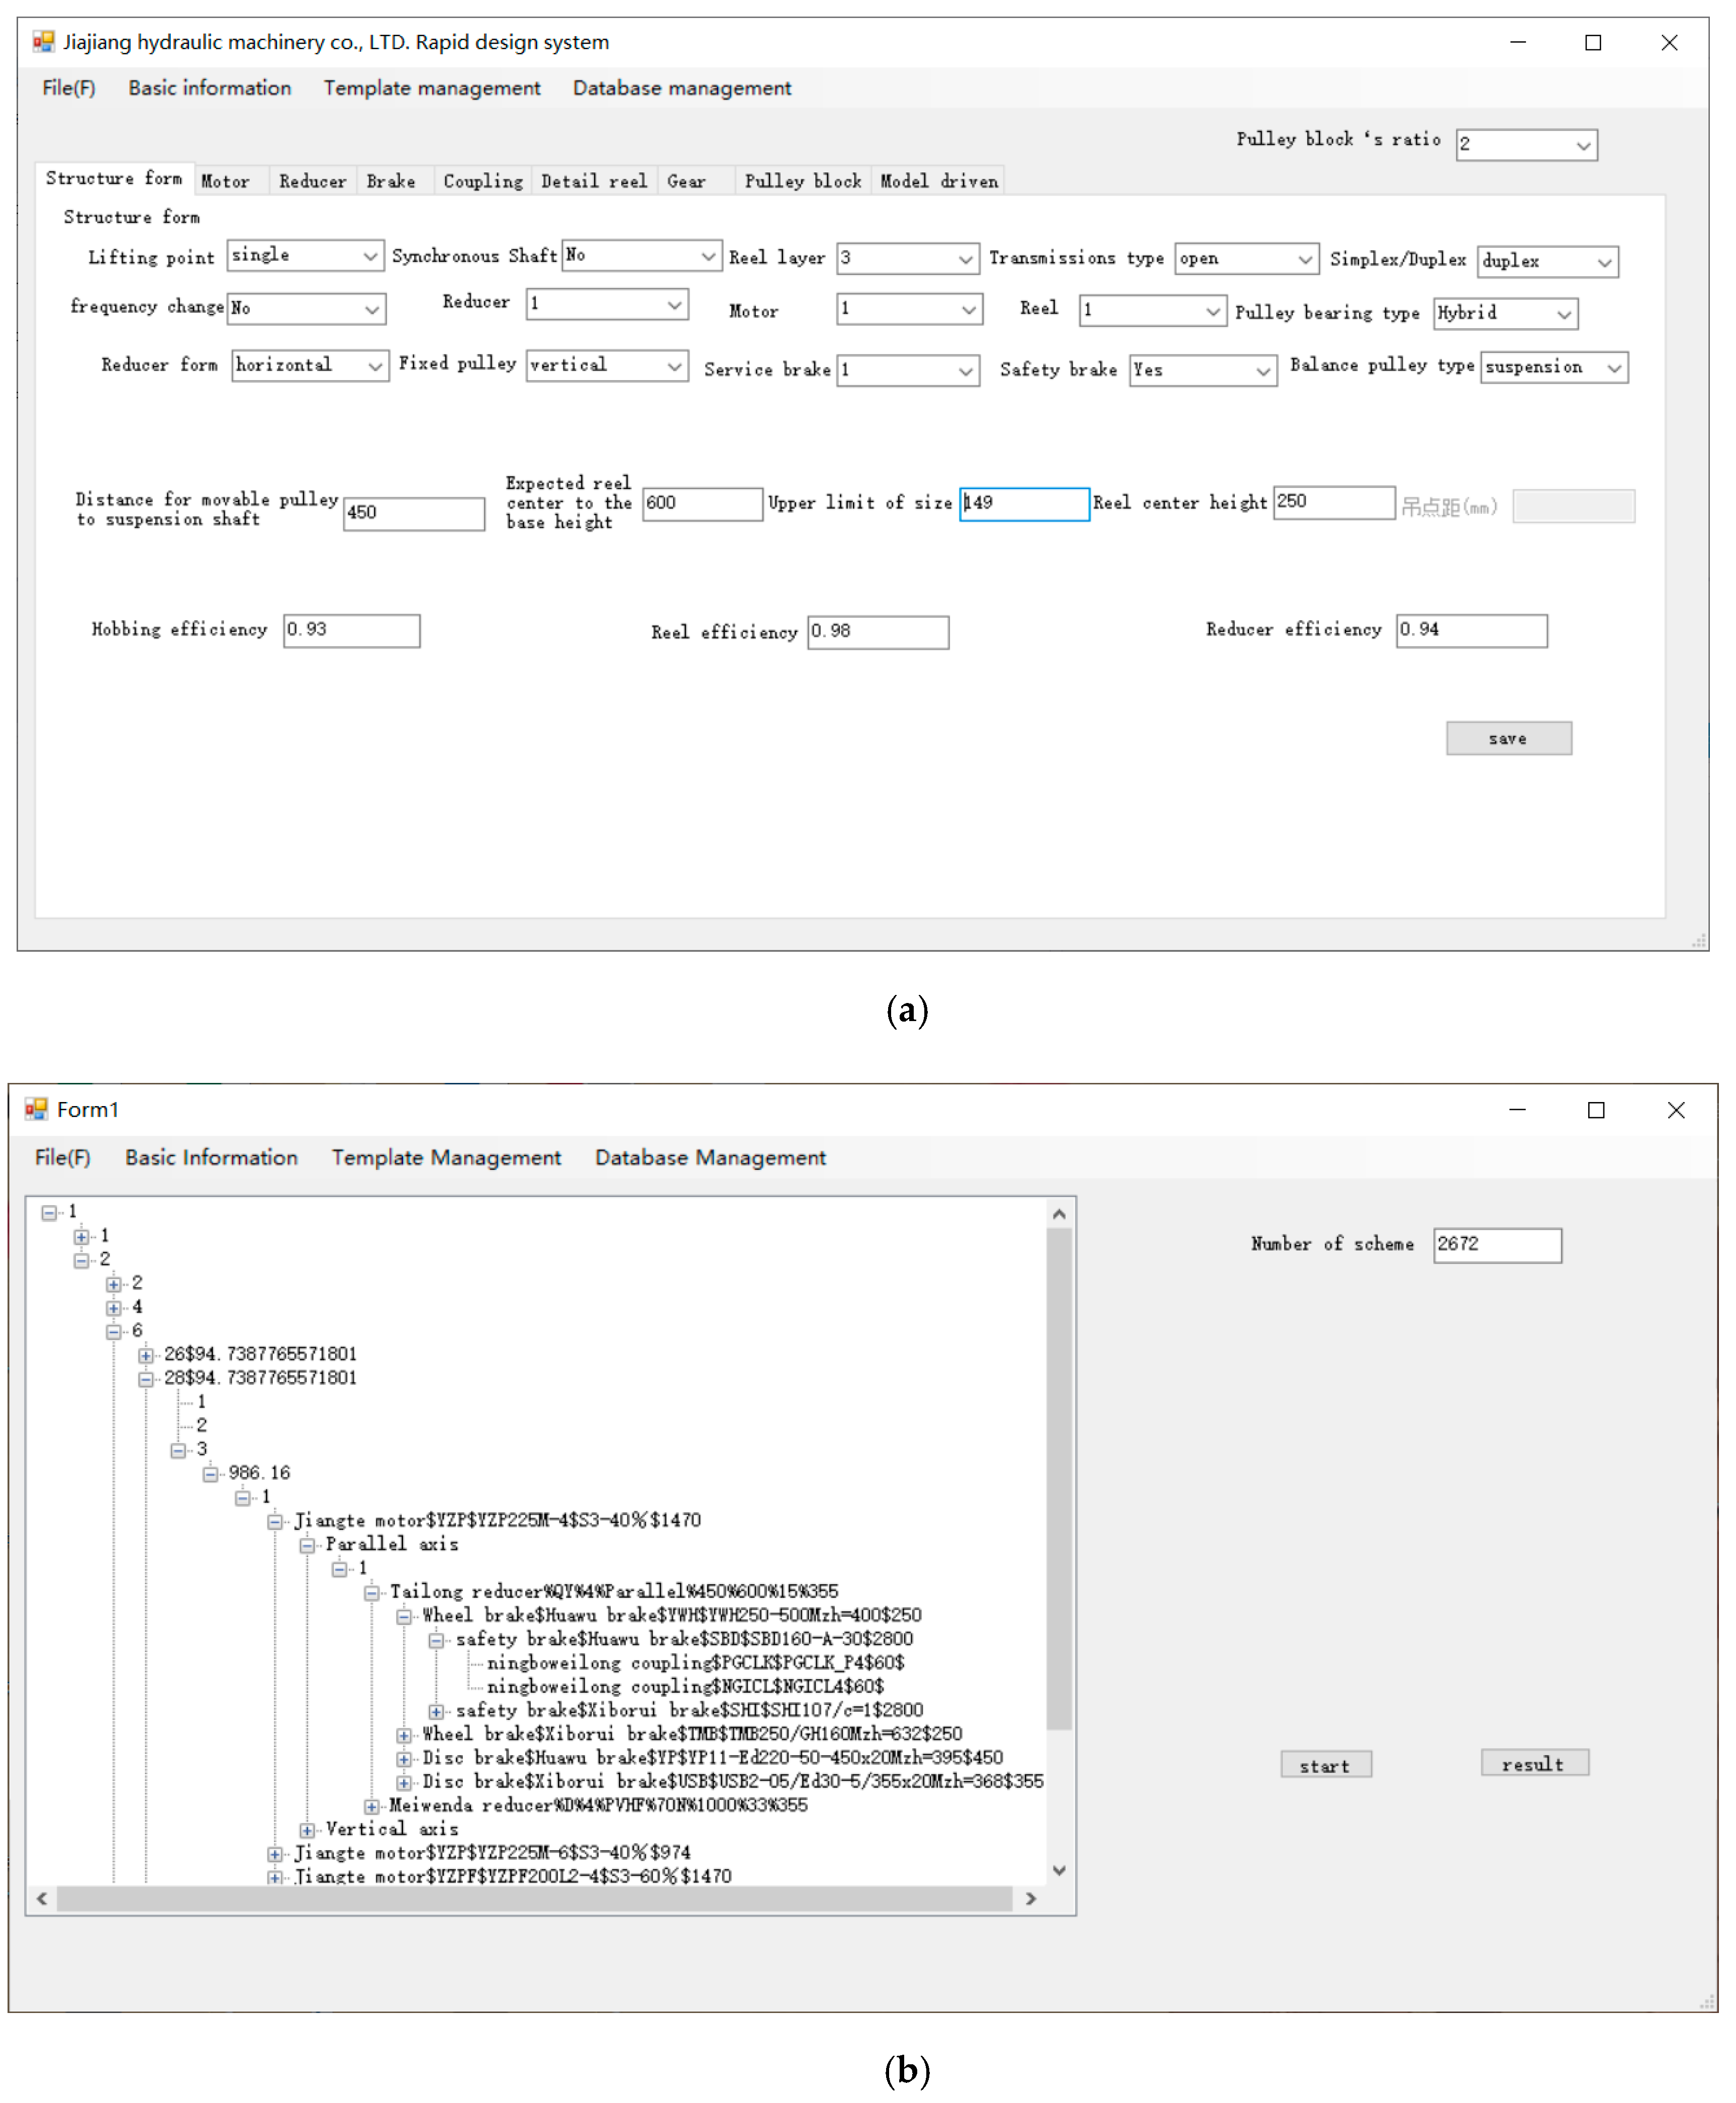
By using the proposed method, the hoist was designed for nine times, and thousands of alternative schemes were obtained in each time. As shown in Figure 7a, designers used the empirical design system [46] to complete the design process from the determination of structural form to the design of various parts such as reel and motor and finally to the driving model. As shown in Figure 7b, designers used the improved design system that generated a multi-way tree model supported by a TreeView control.
Under the same conditions, the scheme A was designed by the proposed method, and the scheme B was designed by the company’s designers using an empirical design system of the company. From the economic perspective, the evaluation indicators of the hoist were all negative indicators: The smaller the indicator, the lower the cost. As shown in Table 9, the scheme A had a total of five indexes, namely, wire rope diameter, reel diameter, reducer weight, working brake weight, and safety brake weight, that were less than that of scheme B, and the reduction rate was 7.14%, 0.63%, 78.9%, 22.2% and 1.8%. The remaining indicators were all the same as scheme B. It was concluded that the proposed method reduced the product cost.
The empirical design system and the method proposed in this paper were compared synthetically from the aspects of occupation, design cycle, number of alternatives, reliability of results, and economy. The results are shown in Table 10.
This time, we took the data of a water conservancy and hydropower company as an example to prove the feasibility of this method, which can be extended to more product design fields in the future. From the point of view of method, the overall layout of the product model can be added into the evaluation index system of the product in the program ranking to make the process of program evaluation more reasonable.

5. Conclusions

This paper proposed an efficacy product design method. The main contributions are summarized as follows:
  • Through a simplified evaluation model, the scheme that best conformed to the designer’s preference was obtained.
  • It was proven that RankSVM had better ranking performance than other learning-to-rank methods in NDCG@10.
  • Taking the design of the hoist as an example, the feasibility and efficiency of the method were verified and, compared with the empirical expert system, the design cycle was greatly shortened.

Author Contributions

Conceptualization, B.C. and X.H.; methodology, B.C.; software, B.C.; validation, X.H., Y.H. and X.D.; formal analysis, X.H.; investigation, B.C. and X.D.; resources, X.D.; data curation, B.C.; writing—original draft preparation, B.C. and Y.H.; writing—review and editing, B.C.; visualization, B.C.; supervision, X.H.; project administration, X.H.; funding acquisition, X.H. All authors have read and agreed to the published version of the manuscript.

Funding

This research was funded by the National Science and Technology Major Project, grant number 2018ZX04032-001, the Made in China 2025 Sichuan action plan, grant number 2018ZZ011, the Made in China 2025 Sichuan action plan, grant number 2017ZZ018.

Conflicts of Interest

The authors declare no conflict of interest.

References

  1. Raffaeli, R.; Mengoni, M.; Germani, M. Improving the link between computer-assisted design and configuration tools for the design of mechanical products. Artif. Intell. Eng. Des. Anal. Manuf. 2013, 27, 51–64. [Google Scholar] [CrossRef]
  2. Mun, D.; Hwang, J.; Han, S. Protection of intellectual property based on a skeleton model in product design collaboration. Comput.-Aided Des. 2009, 41, 641–648. [Google Scholar] [CrossRef]
  3. Chu, D.; Lyu, G.; Chu, X.; Shen, J. Multi-skeleton model for top-down design of complex products. Adv. Mech. Eng. 2016, 8, 1–20. [Google Scholar] [CrossRef] [Green Version]
  4. Chu, X.; Li, Y.; Lyu, G.; Xue, D. A multi-skeleton modelling approach based on top-down design and modular product design for development of complex product layouts. J. Eng. Des. 2016, 27, 1–26. [Google Scholar] [CrossRef]
  5. Pan, Z.; Wang, X.; Teng, R.; Cao, X. Computer-aided design-while-engineering technology in top-down modeling of mechanical product. Comput. Ind. 2016, 75, 151–161. [Google Scholar] [CrossRef]
  6. Chen, X.; Gao, S.; Yang, Y.; Zhang, S. Multi-level assembly model for top-down design of mechanical products. Comput.-Aided Des. 2012, 44, 1033–1048. [Google Scholar] [CrossRef]
  7. Martinez, F.C.; Fernandez-Pacheco, D.G. Virtual simulation: A technology to boost innovation and competitiveness in industry. DYNA 2019, 94, 118–119. [Google Scholar] [CrossRef]
  8. Kanagaraj, G.; Ponnambalam, S.G.; Jawahar, N. Supplier Selection: Reliability Based Total Cost of Ownership Approach Using Cuckoo Search. E-Bus. Telecommun. Netw. 2012, 330, 491–501. [Google Scholar]
  9. Çebi, F.; Otay, İ. A two-stage fuzzy approach for supplier evaluation and order allocation problem with quantity discounts and lead time. Inf. Sci. 2016, 339, 143–157. [Google Scholar] [CrossRef]
  10. Arabzad, S.M.; Ghorbani, M.; Razmi, J.; Shirouyehzad, H. Employing fuzzy TOPSIS and SWOT for supplier selection and order allocation problem. Int. J. Adv. Manuf. Technol. 2015, 76, 803–818. [Google Scholar] [CrossRef]
  11. Karahalios, H. The application of the AHP-TOPSIS for evaluating ballast water treatment systems by ship operators. Transp. Res. Part D Transp. Environ. 2017, 52, 172–184. [Google Scholar] [CrossRef]
  12. McMahon, C.; Browne, J. CADCAM: Principles, Practice and Manufacturing Management; Addison-Wesley Longman Publishing Co., Inc.: Boston, MA, USA, 1999. [Google Scholar]
  13. Aleixos, N.; Company, P.; Contero, M. Integrated modeling with top-down approach in subsidiary industries. Comput. Ind. 2004, 53, 97–116. [Google Scholar] [CrossRef] [Green Version]
  14. He, B.; Song, W.; Wang, Y. A feature-based approach towards an integrated product model in intelligent design. Int. J. Adv. Manuf. Technol. 2013, 69, 15–30. [Google Scholar] [CrossRef]
  15. Nahm, Y.E.; Ishikawa, H. A new 3D-CAD system for set-based parametric design. Int. J. Adv. Manuf. Technol. 2006, 29, 137–150. [Google Scholar] [CrossRef]
  16. Sharma, R.; Gao, J.X. A knowledge-based manufacturing and cost evaluation system for product design/re-design. Int. J. Adv. Manuf. Technol. 2007, 33, 856–865. [Google Scholar] [CrossRef]
  17. Kong, L.; Fuh, J.Y.H.; Lee, K.S.; Liu, X.L.; Ling, L.S.; Zhang, Y.F.; Nee, A.Y.C. A Windows-native 3D plastic injection mold design system. J. Mater. Process. Technol. 2003, 139, 81–89. [Google Scholar] [CrossRef]
  18. Varela, J.; Ventura, M.; Guedes Soares, C. Product data model of hull structures and digital prototyping system for basic structural design. Ships Offshore Struct. 2011, 6, 3–14. [Google Scholar] [CrossRef]
  19. Lin, B.-T.; Chan, C.-K.; Wang, J.-C. A knowledge-based parametric design system for drawing dies. Int. J. Adv. Manuf. Technol. 2008, 36, 671–680. [Google Scholar] [CrossRef]
  20. Yang, J.; Ning, T.; Xi, P. A Parametric Geometry Representation Method for Blades’ Profiles Design. In Proceedings of the 2015 International Conference on Computer Science and Mechanical Automation (CSMA), Hangzhou, China, 23–25 October 2015; pp. 335–339. [Google Scholar]
  21. Zhang, L.; Jiang, R.; Jin, Z.-F.; Huang, H.-H.; Li, X.-Y.; Zhong, Y.-J. CAD-based identification of product low-carbon design optimization potential: A case study of low-carbon design for automotive in China. Int. J. Adv. Manuf. Technol. 2019, 100, 751–769. [Google Scholar] [CrossRef]
  22. Li, G.; Long, X.; Zhou, M.; Xiong, H.; Wang, W. A geometric feature-based design system of full parametric association modeling of standard cam for automotive stamping dies. Int. J. Adv. Manuf. Technol. 2017, 92, 3627–3645. [Google Scholar] [CrossRef]
  23. Benyoucef, M.; Canbolat, M. Fuzzy AHP-based supplier selection in e-procurement. Int. J. Serv. Oper. Manag. 2007, 3, 172–192. [Google Scholar] [CrossRef]
  24. Balakrishnan, N.; Chakravarty, A.K. Product design with multiple suppliers for component variants. Int. J. Prod. Econ. 2008, 112, 723–741. [Google Scholar] [CrossRef]
  25. Toloo, M.; Nalchigar, S. A new DEA method for supplier selection in presence of both cardinal and ordinal data. Expert Syst. Appl. 2011, 38, 14726–14731. [Google Scholar] [CrossRef]
  26. Cao, Y.; Luo, X.; Kwong, C.K.; Tang, J.; Zhou, W. Joint optimization of product family design and supplier selection under multinomial logit consumer choice rule. Concurr. Eng. 2012, 20, 335–347. [Google Scholar] [CrossRef]
  27. Wu, M.-C.; Lo, Y.-F.; Hsu, S.-H. A case-based reasoning approach to generating new product ideas. Int. J. Adv. Manuf. Technol. 2006, 30, 166–173. [Google Scholar] [CrossRef]
  28. Sinha, K.; Srimani, P. Broadcast Algorithms for Mobile Ad hoc Networks Based on Depth-first Traversal. In Proceedings of the 3rd International Workshop on Wireless Information Systems, Porto, Portugal, 14–17 April 2004; pp. 170–178. [Google Scholar] [CrossRef]
  29. Ahmad, M.M.; Dhafr, N. Establishing and improving manufacturing performance measures. Robot. Comput. Integr. Manuf. 2002, 18, 171–176. [Google Scholar] [CrossRef]
  30. Lin, M.-C.; Wang, C.-C.; Chen, M.-S.; Chang, C. Using AHP and TOPSIS approaches in customer-driven product design process. Comput. Ind. 2008, 59, 17–31. [Google Scholar] [CrossRef]
  31. Laura, C.-S.; Vicente, D.-C. Life-cycle cost analysis of floating offshore wind farms. Renew. Energy 2014, 66, 41–48. [Google Scholar] [CrossRef]
  32. Seo, K.K.; Park, J.H.; Jang, D.S.; Wallace, D. Approximate Estimation of the Product Life Cycle Cost Using Artificial Neural Networks in Conceptual Design. Int. J. Adv. Manuf. Technol. 2002, 19, 461–471. [Google Scholar] [CrossRef]
  33. Saravi, M.; Newnes, L.; Mileham, A.R.; Goh, Y.M. Estimating Cost at the Conceptual Design Stage to Optimize Design in terms of Performance and Cost. In Collaborative Product and Service Life Cycle Management for a Sustainable World; Springer: London, UK, 2008; pp. 123–130. [Google Scholar]
  34. Guru, D.; Mahalik, D. A comparative study on performance measurement of Indian public sector banks using AHP-TOPSIS and AHP-grey relational analysis. OPSEARCH 2019, 56, 1213–1239. [Google Scholar] [CrossRef]
  35. Choudhary, D.; Shankar, R. An STEEP-fuzzy AHP-TOPSIS framework for evaluation and selection of thermal power plant location: A case study from India. Energy 2012, 42, 510–521. [Google Scholar] [CrossRef]
  36. Dağdeviren, M.; Yavuz, S.; Kılınç, N. Weapon selection using the AHP and TOPSIS methods under fuzzy environment. Expert Syst. Appl. 2009, 36, 8143–8151. [Google Scholar] [CrossRef]
  37. Aslam, J.; Kanoulas, E.; Pavlu, V.; Savev, S.; Yilmaz, E. Document Selection Methodologies for Efficient and Effective Learning-to-Rank. In Proceedings of the 32nd Annual International ACM SIGIR Conference on Research and Development in Information Retrieval, SIGIR 2009, Boston, MA, USA, 19–23 July 2009; pp. 468–475. [Google Scholar] [CrossRef] [Green Version]
  38. Liu, Y.; Yang, J. A Novel Learning-to-Rank Based Hybrid Method for Book Recommendation. In Proceedings of the International Conference on Web Intelligence—WI ’17, Leipzig, Germany, 23–26 August 2017; pp. 837–842. [Google Scholar]
  39. Joachims, T. Training linear SVMs in linear time. In Proceedings of the 12th ACM SIGKDD International Conference on Knowledge Discovery and Data Mining, Philadelphia, PA, USA, 20–23 August 2006; pp. 217–226. [Google Scholar]
  40. Wang, S.; Sun, J.; Gao, B.J.; Ma, J. VSRank: A Novel Framework for Ranking-Based Collaborative Filtering. ACM Trans. Intell. Syst. Technol. 2014, 5, 1–24. [Google Scholar] [CrossRef]
  41. Zhang, L.; Shum, H.P.H.; Shao, L. Discriminative Semantic Subspace Analysis for Relevance Feedback. IEEE Trans. Image Process. 2016, 25, 1275–1287. [Google Scholar] [CrossRef] [PubMed] [Green Version]
  42. Smith, G.; Brien, C.; Ashman, H. Evaluating implicit judgments from image search clickthrough data. J. Assoc. Inf. Sci. Technol. 2012, 63, 2451–2462. [Google Scholar] [CrossRef]
  43. Yang, X.; Chen, Q.; Wan, L.; Wang, X. Ranknet based English stressed syllable detection. In Proceedings of the 2010 International Conference on Audio, Language and Image Processing, Shanghai, China, 23–25 November 2010; pp. 1084–1089. [Google Scholar]
  44. Wu, T.T.; He, X. Coordinate ascent for penalized semiparametric regression on high-dimensional panel count data. Comput. Stat. Data Anal. 2012, 56, 25–33. [Google Scholar] [CrossRef]
  45. Cao, Z.; Qin, T.; Liu, T.-Y.; Tsai, M.-F.; Li, H. Learning to rank: From pairwise approach to listwise approach. In Proceedings of the 24th International Conference on Machine Learning, Corvalis, ON, USA, 20–24 June 2007; pp. 129–136. [Google Scholar]
  46. Huo, Y.-L.; Hu, X.-B.; Chen, B.-Y.; Fan, R.-G. A Product Conceptual Design Method Based on Evolutionary Game. Machines 2019, 7, 18. [Google Scholar] [CrossRef] [Green Version]
Figure 1. Product design model. (a) Multi-way tree structure. (b) The process from inherent nodes to generated nodes.
Machines 08 00030 g001
Figure 2. Multi-way tree model flowchart.
Machines 08 00030 g002
Figure 3. Learning-to-rank framework.
Machines 08 00030 g003
Figure 4. Optimization of component supplier combination framework.
Machines 08 00030 g004
Figure 5. The 3D model of No. 1.
Machines 08 00030 g005
Figure 6. Training effect of learning-to-rank.
Machines 08 00030 g006
Figure 7. Design system of hoist. (a) Current design method system. (b) The improved design system.
Machines 08 00030 g007
Table 1. Attribute structure.
LayerAttributeCategory[1][2][3]
1A1inherentA1-v1 1A1-v2
2A2inherentA2-v1A2-v2A2-v3
3A3generatedA3-v1A3-v2
1 A-v represents attribute value.
Table 2. Value-determined standard of the importance of index weight.
Standard ValuesDefinition
2Ci is intense or extremely more important than Cj
1Ci is slightly or significantly more important than Cj
0Ci is as important as Cj
−1Ci is slightly or significantly less important than Cj
−2Ci is intense or extremely less important than Cj
Table 3. Analysis of user behaviors.
User Feedback BehaviorPriority Criteria
Reading behaviorThe time of reading the proposal recommendation list page
The time of reading the scheme details page
Click behaviorNumber of clicks on the scheme title
Add the scheme to the “shopping cart” (alternatives)
Select the final scheme
Negative feedback behaviorDelete the scheme
Table 4. Attribute structure of hoist.
Attribute[1][2][3][4][5][6][7]
The number of lifting points12/////
The number of reels12/////
Simplex/Duplex12/////
Pulley block‘s ratio2468101214
The number of reel layer123////
The number of motors1248///
Reducer shaft formparallelvertical/////
The number of reducers1248///
The number of coupling1248///
The number of brakes124816//
Table 5. Test set.
Table 5. Test set.
Project Information ParameterTest Set
No.123456789
Hoisting capacity (kN)100036001500180025001300500045003500
Holding capacity (kN)010005006501000200350030001500
Orifice length (mm)360035002870260034001800250030002700
Orifice width (mm)36002500158019002000980210015001800
Head (m)605762514953555560
Upper limit of size (mm)400036005800500047003800600056004200
Load multiple1.251.251.301.251.301.251.301.301.25
Transmissions typeOpenOpenCloseOpenCloseOpenCloseCloseOpen
Safety brakeWithWithWithoutWithoutWithWithoutWithWithoutWithout
The number of alternatives428843524504375654235976612047665382
Table 6. Technical index system of scheme of hoist.
Object Layer ACriterion Layer BIndicator Layer C
Hoist scheme costSelection cost B1Wire rope diameter C1
Reel diameter C2
Motor weight C3
Reducer weight C4
Coupling weight C5
Service brake weight C6
Safety brake weight C7
Table 7. Scheme set for instance 1.
Program FeaturesScheme Set
123428642874288
Wire rope diameter (mm)222222383838
Reel diameter (mm)957.34957.34957.341335.81335.81335.8
Motor manufacturerMM-1MM-1MM-1MM-2MM-2MM-2
Motor serial numberMS-1MS-1MS-1MS-2MS-2MS-2
Motor weight (kg)390390390402402402
Reducer manufacturerRM-2RM-2RM-2RM-2RM-2RM-2
Reducer serial numberRS-4RS-4RS-4RS-1RS-1RS-1
Reducer weight (kg)380380380180180180
Service brake typewheeledwheeledwheeleddiscdiscdisc
Service brake manufacturerSEM-1SEM-1SEM-2SEM-1SEM-2SEM-2
Service brake serial numberSES-1SES-1SES-2SES-3SES-4SES-4
Service brake weight (kg)105105104135103103
Safety brake manufacturerSAM-1SAM-2SAM-1SAM-2SAM-1SAM-2
Safety brake serial numberSAs-1SAs-2SAs-1SAs-2SAs-1SAs-2
Safety brake weight (kg)110011201100112011001120
Coupling manufacturerCM-1CM-1CM-1CM-1CM-1CM-1
Coupling serial numberCS-1CS-1CS-1CS-1CS-1CS-1
Coupling weight (kg)29.529.529.529.529.529.5
Table 8. Scheme set based on AHP-TOPSIS.
Program Features.Scheme Set
123428642874288
Wire rope diameter (mm)262626383838
Reel diameter (mm)913.2913.2913.21335.81335.81335.8
Motor manufacturerMM-1MM-1MM-1MM-1MM-1MM-1
Motor serial numberMS-1MS-1MS-1MS-2MS-2MS-2
Motor weight (kg)60.760.760.7287287287
Reducer manufacturerRM-1RM-1RM-1RM-1RM-1RM-1
Reducer serial numberRS-1RS-1RS-1RS-2RS-2RS-2
Reducer weight (kg)140140140876876876
Service brake typediscwheeledwheeledwheeleddiscdisc
Service brake manufacturerSEM-2SEM-2SEM-1SEM-1SEM-1SEM-1
Service brake serial numberSES-4SES-2SES-1SES-5SES-3SES-3
Service brake weight (kg)103104105105135135
Safety brake manufacturerSAM-1SAM-1SAM-1SAM-2SAM-1SAM-2
Safety brake serial numberSAS-1SAS-1SAS-1SAS-2SAS-1SAS-2
Safety brake weight (kg)110011001100112011001120
Coupling manufacturerCM-1CM-1CM-1CM-1CM-1CM-1
Coupling serial numberCS-1CS-1CS-1CS-2CS-2CS-2
Coupling weight (kg)29.529.529.5150.1150.1150.1
Table 9. Scheme comparison.
SchemeWire Rope Diameter (mm)Reel Diameter (mm)Motor Weight (kg)Reducer Weight (kg)Service Brake Weight
(kg)
Safety Brake Weight
(kg)
Coupling Weight (kg)
Scheme A26913.260.7140103110029.5
Scheme B28986287180135112029.5
Reduction ratio7.14%0.63%78.9%22.2%23.7%1.8%0
Table 10. Performance comparison.
ProjectOccupationDesign CycleNumber of AlternativesResult ReliabilityEconomyTotal
Current design methodEmpirical design system 2–3 h1ReliableGeneralGeneral
Method of
this Paper
Computer0.5 hThousandsReliableWellGreat
ImprovedGreatlyLittleGreatlyLittleGoodGreatly