1. Introduction
The development of high-performance permanent magnet (PM) motors in electric vehicles (EVs) presents engineers with the challenge of developing new designs to increase efficiency and power density while reducing the cost of the electromechanical devices [
1]. The conventional design process for PM motors is based on utilizing analytical calculations given in generalized form which is labor-intensive and difficult to follow [
2,
3]. With the progress in computer and simulation technologies on the one hand and increasing demand for superior motor characteristics on the other hand, the advanced computer-based simulation tools become an essential part of the design process. Not only do they assist in better understanding of the behavior of the device under different operating conditions, but also allow performance optimization and cost reduction through better material utilization and minimizing the number of prototypes required during the development process [
4,
5]. The PM motor design methodology proposed in this paper is intended to transform the conventional textbook design process from a generalized form to a definite workflow centered on the use of a computer-based simulation tool.
In recent years, commercial and expensive electromagnetic tools have been employed for the design and analysis of PM motors for EVs with some interesting examples found in the literature [
4,
5,
6,
7,
8]. For example, Huynh and Hsieh utilized the commercial finite element (FE) software called JMAG to analyze the electromagnetic and thermal performance of PM motors for EVs. Authors in [
4] studied thin electrical steel laminations in the rotors with different configurations of flux barriers with neodymium–iron–boron (NdFeB) permanent magnets. Liu et al. analyzed the optimization process for PM synchronous motors utilizing ANSYS Maxwell software [
5]. Cetin and Daldaban employed ANSYS Maxwell software and magnetic circuits to analyze axial flux PM motors with different PM geometry designs [
6]. Eklund and Eriksson employed COMSOL Multiphysics software to study the effects of remanence and recoil permeability of a PM material on the performance of PM synchronous generators [
7]. He and Wu employed ANSYS Maxwell software to analyze the design of interior PM brushless direct current (DC) motors for an electric impact wrench used for loading and unloading car bolts [
8].
Nevertheless, the high cost of commercial analysis software is often unaffordable for many PM motor manufacturers with a limited budget. For this reason, it is important to develop new and free analysis and design tools for the PM motor industry. Some recent and interesting examples of free and non-commercial tools are found in the literature [
9,
10,
11,
12,
13]. Meeker in [
9] developed general-purpose and non-commercial FE software called “FEMM software” for two-dimensional (2-D) FE analysis. With FEMM software it is possible to perform magnetostatic and time-harmonic analysis, electrostatic analysis, heat-flow analysis, and current flow analysis. It is not possible to perform transient analysis using FEMM software. In addition, although FEMM software is freely available, the design of PM motors using this FE software is complex and laborious. Lu
et al. [
10] solved this problem by development of SyR-e tool based on Octave-FEMM and Matlab-FEMM scripting library and graphical user interface. SyR-e is a free tool but some calculations, such as steel core losses, PM losses and efficiency map, are still delegated to expensive commercial FE software. Lehikoinen
et al. [
11] developed an open-source Matlab 2-D finite-element method (FEM) library for electrical machines called SMEKlib. SMEKlib is a library in which more attention has been given to the features and basic analysis tools, rather than the user interface. Another popular tool for designing a PM motor which is available for free is JMAG-Express Public developed by the JSOL corporation [
12]. JMAG-Express Public is an analytical tool developed for quick and rough estimation of motor characteristics. Since JMAG-Express Public is not FEM-based, it is suggested to be used only for basic design while a detailed design is achievable by commercial tools provided by the JSOL corporation. Finally, another free tool which is worth mentioning is Emetor [
13]. Emetor is an online tool offering powerful magnetostatic FE analysis features with geometry templates, materials library and automated winding setup.
Table 1 shows a comparison of different free PM-motor design tools. All these developments indicate that there is still an undeniable need for a freely available PM motor design/analysis tool that provides a dedicated user interface with accurate and flexible electromagnetic motor analysis capabilities.
In this article, a new and powerful PM motor design and analysis tool called “MotorAnalysis-PM” is introduced. The capabilities of the software are presented, and the design and analysis methodologies are demonstrated and applied on a 50 kW interior permanent magnet (IPM) motor utilized in a real EV [
14,
15]. Moreover, the numerical results are compared with experimental data obtained from the literature. The novelty of this article is (i) to introduce a recently developed PM motor design tool capable of performing electromagnetic design of PM motors and (ii) to present the associated electromagnetic design workflow.
The content of this article is organized as follows. In
Section 2, a brief description of the characteristics of MotorAnalysis-PM software is presented.
Section 3 describes the analysis methods and models used in MotorAnalysis-PM.
Section 4 introduces the electromagnetic design methodology of an IPM motor using MotorAnalysis-PM. In
Section 5, the numerical results obtained from MotorAnalysis-PM are compared and validated with experimental data.
Section 6 presents the conclusions.
2. General Characteristics of MotorAnalysis-PM Software
MotorAnalysis-PM is a free and powerful software for design and analysis of PM motors and generators. The software is based on automated FE simulations and establishes a complete set of tools for design and analysis of PM motors. It is based on Matlab and C++ programming language [
14,
15] and does not require the use of other commercial FE software, making it a good choice for any PM motor manufacturer. MotorAnalysis-PM can analyze several motor topologies including skewed rotor geometries which can be solved with multi-slice FE analysis [
14,
15]. In addition, it has an automatic and manual stator winding layout generation and can employ different wire-sizing methods [
14,
15]. The software includes a defined materials library, but also gives the users the flexibility to create and define other materials.
The development of MotorAnalysis software started in 2008 as part of a PhD project to study the behavior of induction motors with broken rotor bars. Later, the software was transformed into a design tool for induction motors in 2014. In 2017, the MotorAnalysis software was extended to also include PM motors and the first version of MotorAnalysis-PM was released. MotorAnalysis-PM uses Matlab PDE Toolbox to generate the initial finite element mesh. The mesh is further modified to meet specific needs such as mesh periodicity, rotor rotation with air gap remeshing, periodic and antiperiodic boundary conditions and etc. Most parts of the user interface (UI) are developed using Matlab UI design environment. Geometry import from a DXF file and corresponding UI are implemented based on C++ programming language. The software combines several analysis methods having different accuracy and computation speeds. The appropriate analysis method can be chosen depending on the phase of the machine design process and required speed/accuracy tradeoff. The analysis methods and their features include the following:
a. Magnetostatic finite-element (FE) analysis:
Based on time-stepping magnetostatic FE simulations assuming ideal sinusoidal or trapezoidal current waveform.
Calculation of most commonly used motor parameters like voltage, current, power, back-electromotive force (EMF), torque, power factor, efficiency, and power losses.
Used to analyze cogging torque and torque ripple, back-EMF harmonics, steel core losses, PM losses, and demagnetization effects of PMs.
Visualization features include time-series waveform plots, air gap distribution and field plots as well as field animations.
b. Dynamic FE analysis:
Based on time-stepping transient FE simulations considering induced eddy current effects.
An electrical circuit solver paired with an electromagnetic solver to couple external electrical circuits with FE PM motor models.
Arbitrary supply current or voltage waveforms including pulse width modulation (PWM) inverter supply.
Used to analyze transient motor behavior, cogging torque and torque ripple, back-EMF harmonics, steel core losses including higher harmonics, and demagnetization effects in PMs.
Visualization features include time-series waveform plots, air gap distribution, and field plots as well as animations.
c. Steady state d-q analysis:
Based on a conventional model of the PM motor in d-q reference frame with sinusoidal back-EMF derived from FE solutions.
Saturation and cross-saturation of magnetic cores as well as steel core losses are considered.
Calculation of steady-state performance characteristics, efficiency maps and other performance maps considering field-weakening strategy.
d. Dynamic d-q analysis:
Based on the dynamic model of the motor in d-q reference frame with sinusoidal back-EMF.
Simulation of the PM motor with PWM supply and current control algorithm including field-oriented control and current hysteresis control.
3. Analysis Methods and Models Used in MotorAnalysis-PM
In this section, the numerical and analytical methods and models used in the software are briefly described. MotorAnalysis-PM utilizes four main analysis methods comprising numerical and analytical models that are used in the different steps of the PM motor design process described in
Section 4. Numerical methods are based on FE models and consist of magnetostatic and transient analyses. Analytical methods are based on equivalent circuit models in the d-q axes reference frame, also called d-q models, and represented by steady state d-q analysis and dynamic d-q analysis [
14,
15]. When the FE method is applied, the magnetic field analysis of a PM motor can be solved using a 2-D approximation [
15,
16], which assumes that the magnetic field does not depend on
z-coordinate (
z-axis being parallel to the motor rotor shaft axis). Thus, the magnetic field is solved in the plane of the motor’s cross section (
x-
y plane). For 2-D FE problems, the current density
J and the magnetic vector potential
A have only
z-component and can be expressed as:
where
A is the magnetic vector potential,
µ is the magnetic permeability,
J is the current density,
σ is the electrical conductivity,
V is the voltage applied to the FE area,
l is the length in
z direction of the 2-D FE PM motor model.
There are two methods used in MotorAnalysis-PM to solve PM motor expressions defined by (1) and (2). The first method is called a magnetostatic FE analysis and the second method is called a transient or dynamic FE analysis. For the magnetostatic FE analysis, J is assumed to be independent of the magnetic field variation so only (1) is used to define the magnetostatic problem. The magnetostatic FE simulation is also called current driven since the current is known in advance and no induced eddy currents are considered. To account for the rotor rotation, the magnetostatic FE analysis is repeated for several different rotor positions accordingly changing the J values. This method is called time-stepping magnetostatic FE analysis. When the second method of transient FE analysis is utilized, the numerical simulation is called voltage-driven and the current is treated as an unknown variable.
Although the accuracy of analytical methods is lower, the d-q models offer much higher computational speed compared to the convectional FE method. The d-q reference frame fixed to the rotor is a convenient way to represent sinusoidal quantities as constants [
15,
17,
18].
To consider the effect of cross-saturation, the cross-saturation inductance
Ldq and cross saturation magnet flux linkage
Ψmqd lying in the q-axis are considered. With the cross saturation terms the d-axis and q-axis flux linkages are given as follows [
17]:
where inductances
Ld,
Lq,
Ldq, and magnet flux linkage
Ψmd, and
Ψmqd values depend on current components
Id and
Iq to consider magnetic saturation. The steady state equations, used for the d-q analysis, after resolving voltages into d and q components, can be written as:
The electromagnetic torque
T is calculated as:
where
p is the number of pole pairs,
Ψd and
Ψq are the d-axis and q-axis flux linkages,
Id and
Iq are the d-axis and q-axis current components.
Finally, the dynamic equations used for the dynamic d-q analysis are given by the following expressions:
where
Rs is the stator winding phase resistance,
Lsew is the stator end winding inductance, and
ω is the electrical operating speed.
The computation of flux and inductance parameters
Ld,
Lq,
Ldq,
Ψmd and
Ψmqd in MotorAnalysis-PM is based on the magnetostatic FE analysis for one rotor position with permeance freezing. This allows the use of the superposition method to extract the parameters of the PM motor while considering the magnetic saturation and cross-saturation [
17]. This process is referred to as the parameterization of the d-q model. During parameterization, the magnetostatic FE simulation is run for the entire range of advance angle values from 0° to 360° (electrical degrees) and current values from zero to the maximum current defined by the user. This process can also be repeated for several rotor positions to consider variation of the d-q model parameters with rotor position. Finally, the time-stepping magnetostatic FE simulation is performed for several operating points to include information about the steel core losses into the d-q model. Every time the d-q model is utilized, its parameters are interpolated depending on the current and advance angle values, so the non-linear behavior of the motor is included in the d-q model.
4. Design Methodology Using MotorAnalysis-PM
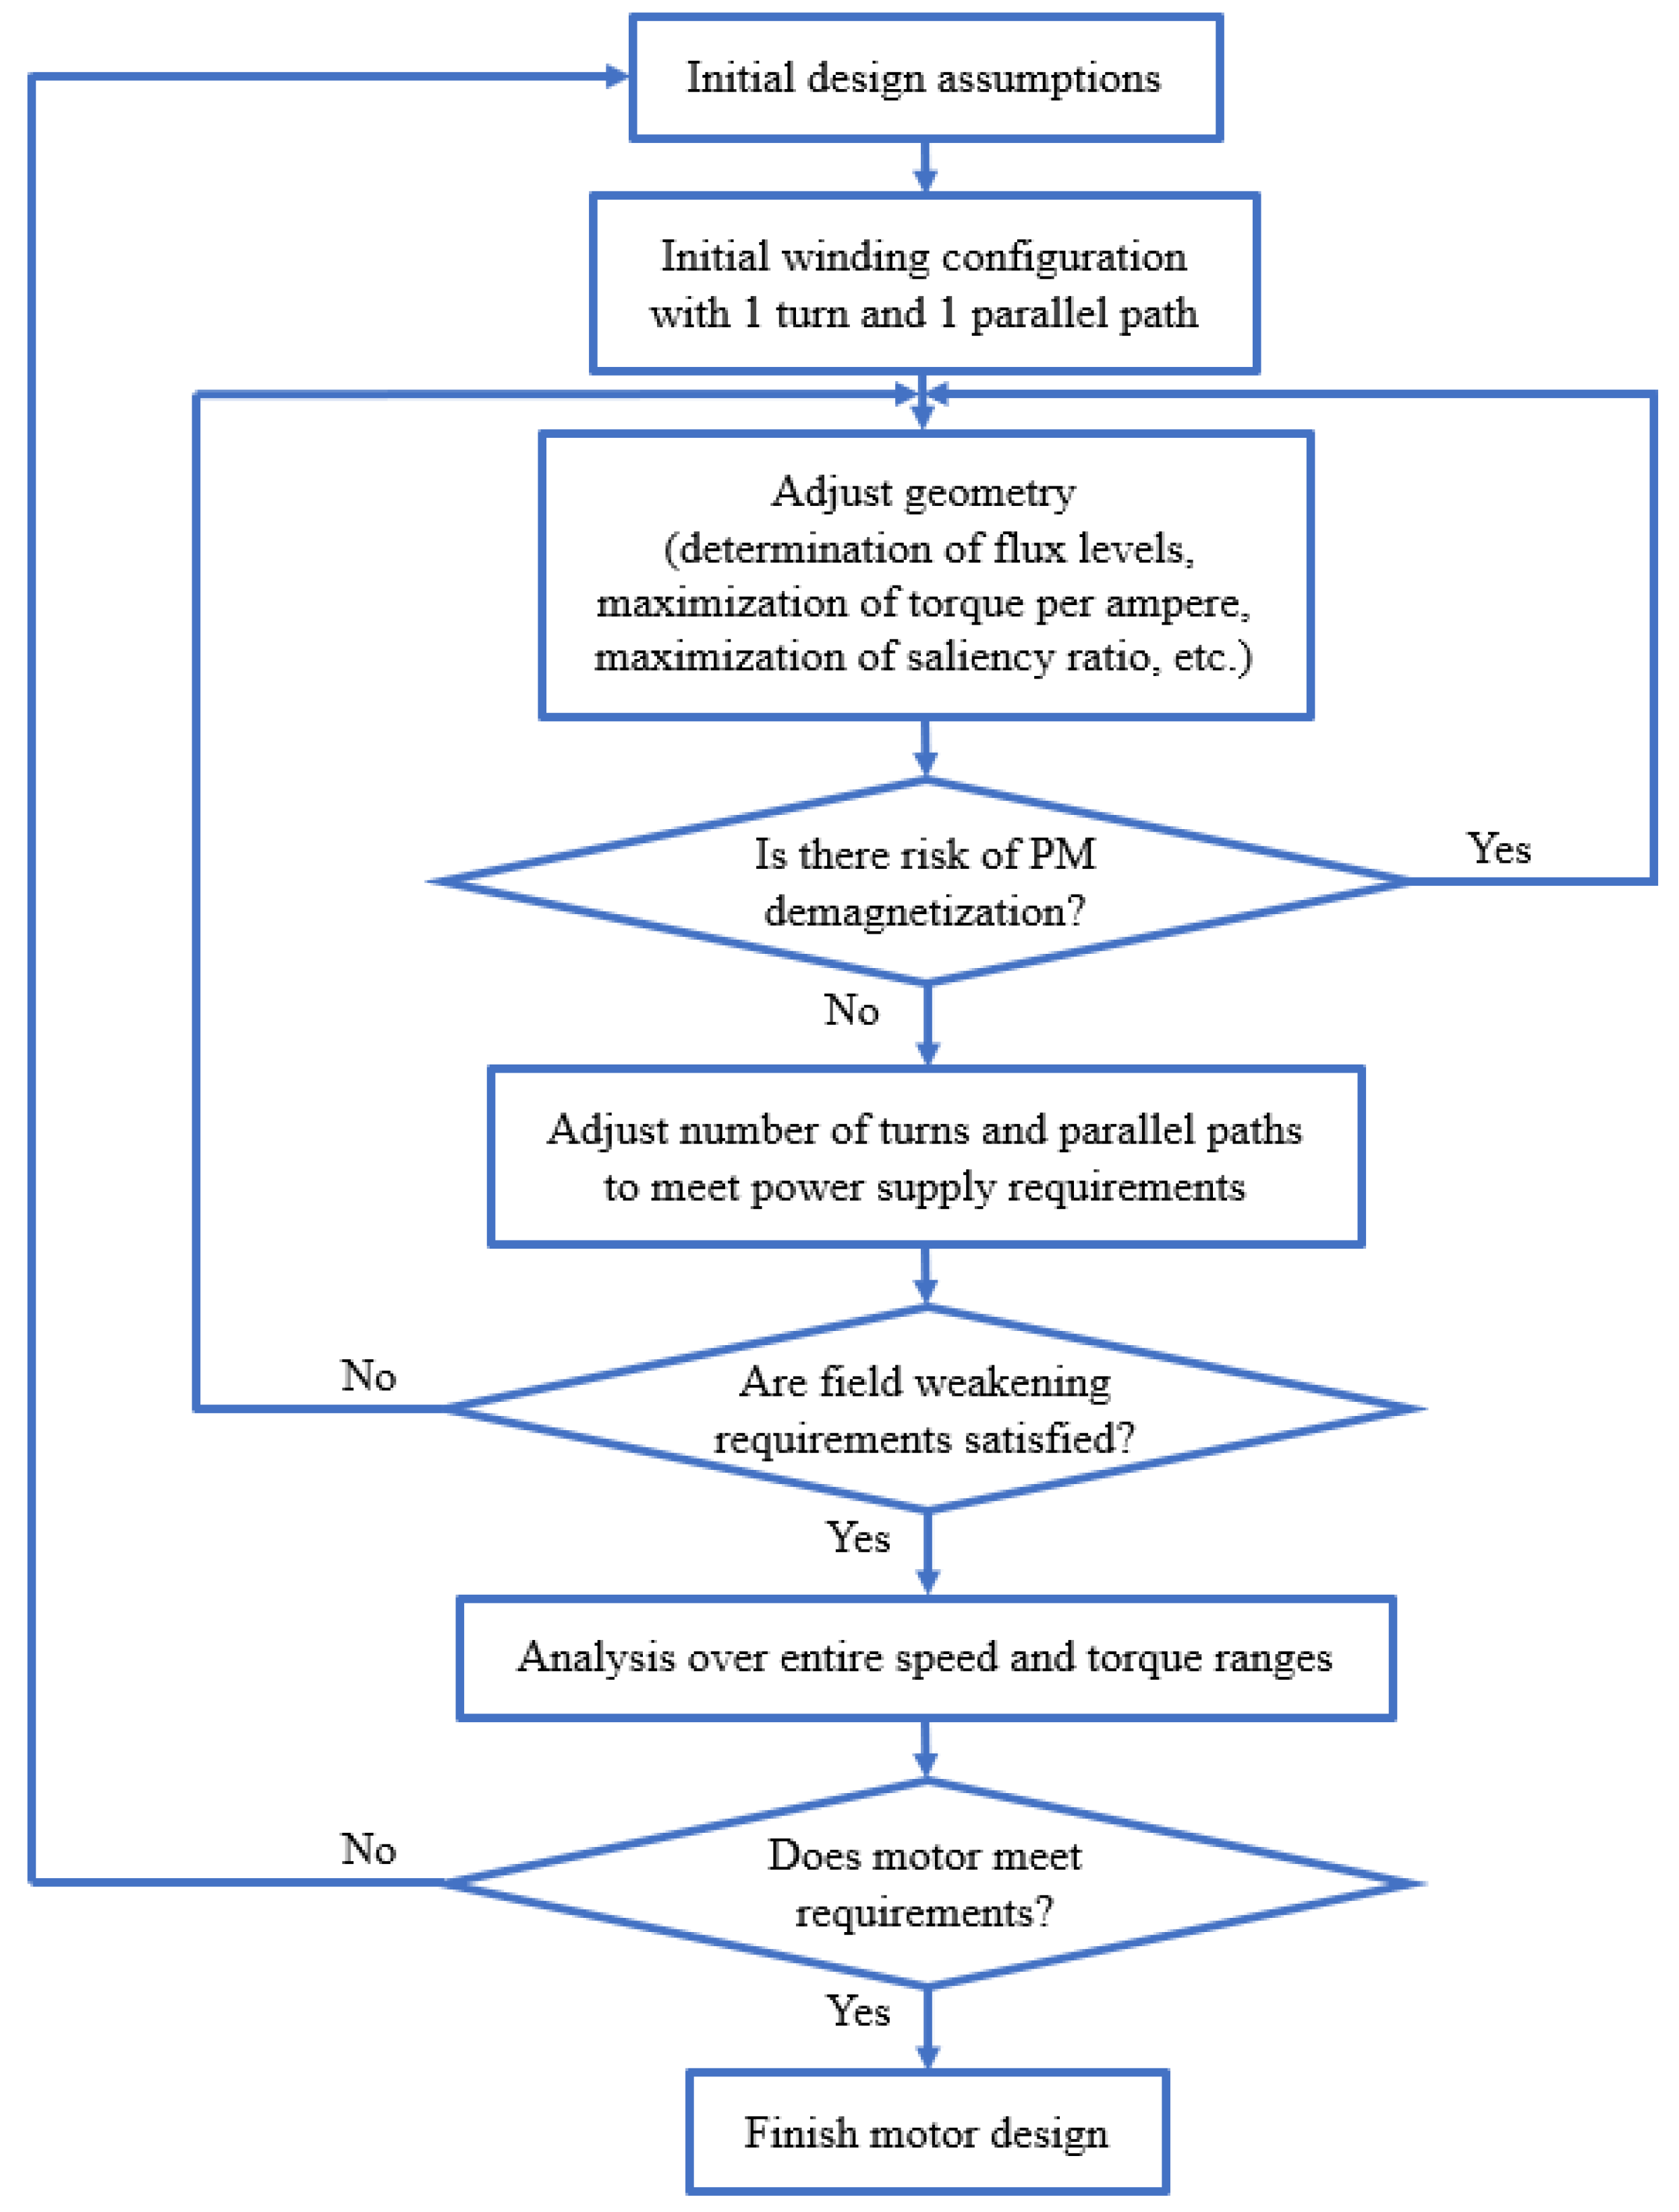
The objective of this section is to emphasize the practical aspects of the design process and to demonstrate how they are solved using MotorAnalysis-PM. The proposed process can be used for the electromagnetic design of alternating current (AC) PM motors. Note that it is not necessary to strictly follow the given step sequence as some steps can be skipped in a certain stage while others can be repeated multiple times. The flowchart of the proposed design methodology using MotorAnalysis-PM is shown in
Figure 1.
The proposed design and analysis process is illustrated by a study of the Toyota Prius 2004 IPM synchronous motor. The FE analysis results obtained from MotorAnalysis-PM are presented here and discussed.
4.1. Initial Design Assumptions
Initial design assumptions include the choice of outer or inner rotor topology, rated current or current density, rated voltage, power and torque, corner speed, materials, size and weight requirements.
Table 2 shows the basic specifications of the Toyota Prius 2004 motor used for this analysis [
19,
20,
21].
4.2. Initial Winding Configuration
The initial winding configuration includes the number of slots, number of pole pairs, coil span and slot fill factor. The basic rules on the winding configuration can be found in [
2,
3,
22,
23]. Once the number of slots, number of pole pairs, and coil span are entered, MotorAnalysis-PM automatically computes the winding layout for each phase using the star of slots method [
24]. The star of slots represents the general theory of multilayer-balanced m-phase windings and the rules to lay out such windings. To simplify the design process, the initial number of parallel paths and the number of turns are set to 1. Since the magnetic field depends on the value of ampere-turn and not on the number of turns itself, this assumption will not affect the calculation of magnetic flux density distribution. Actual values of the number of parallel paths and the number of turns will be determined in future steps.
In the next stage, besides the winding layout, the fundamental winding factor, the least common multiple (LCM) of the number of slots and number of poles, and the greatest common divisor (GCD) of the number of slots and number of poles are calculated. The fundamental winding factor should be kept close to unity. LCM of the number of slots and the number of poles equals to the number of periods of cogging torque waveform per rotor revolution. Selecting a higher value of LCM minimizes the cogging torque. GCD of the number of slots and number of poles should be an even number. Choosing a higher value for this parameter ensures a better balance of radial forces with reduced noise and motor vibrations. Note that maximizing the fundamental winding factor, LCM and GCD, and at the same time minimizing the phase resistance is inherently incompatible, so the task of the designer is to find the optimal balance between winding parameters.
4.3. Geometry Design
Basic sizing rules can be found in [
2,
3,
8,
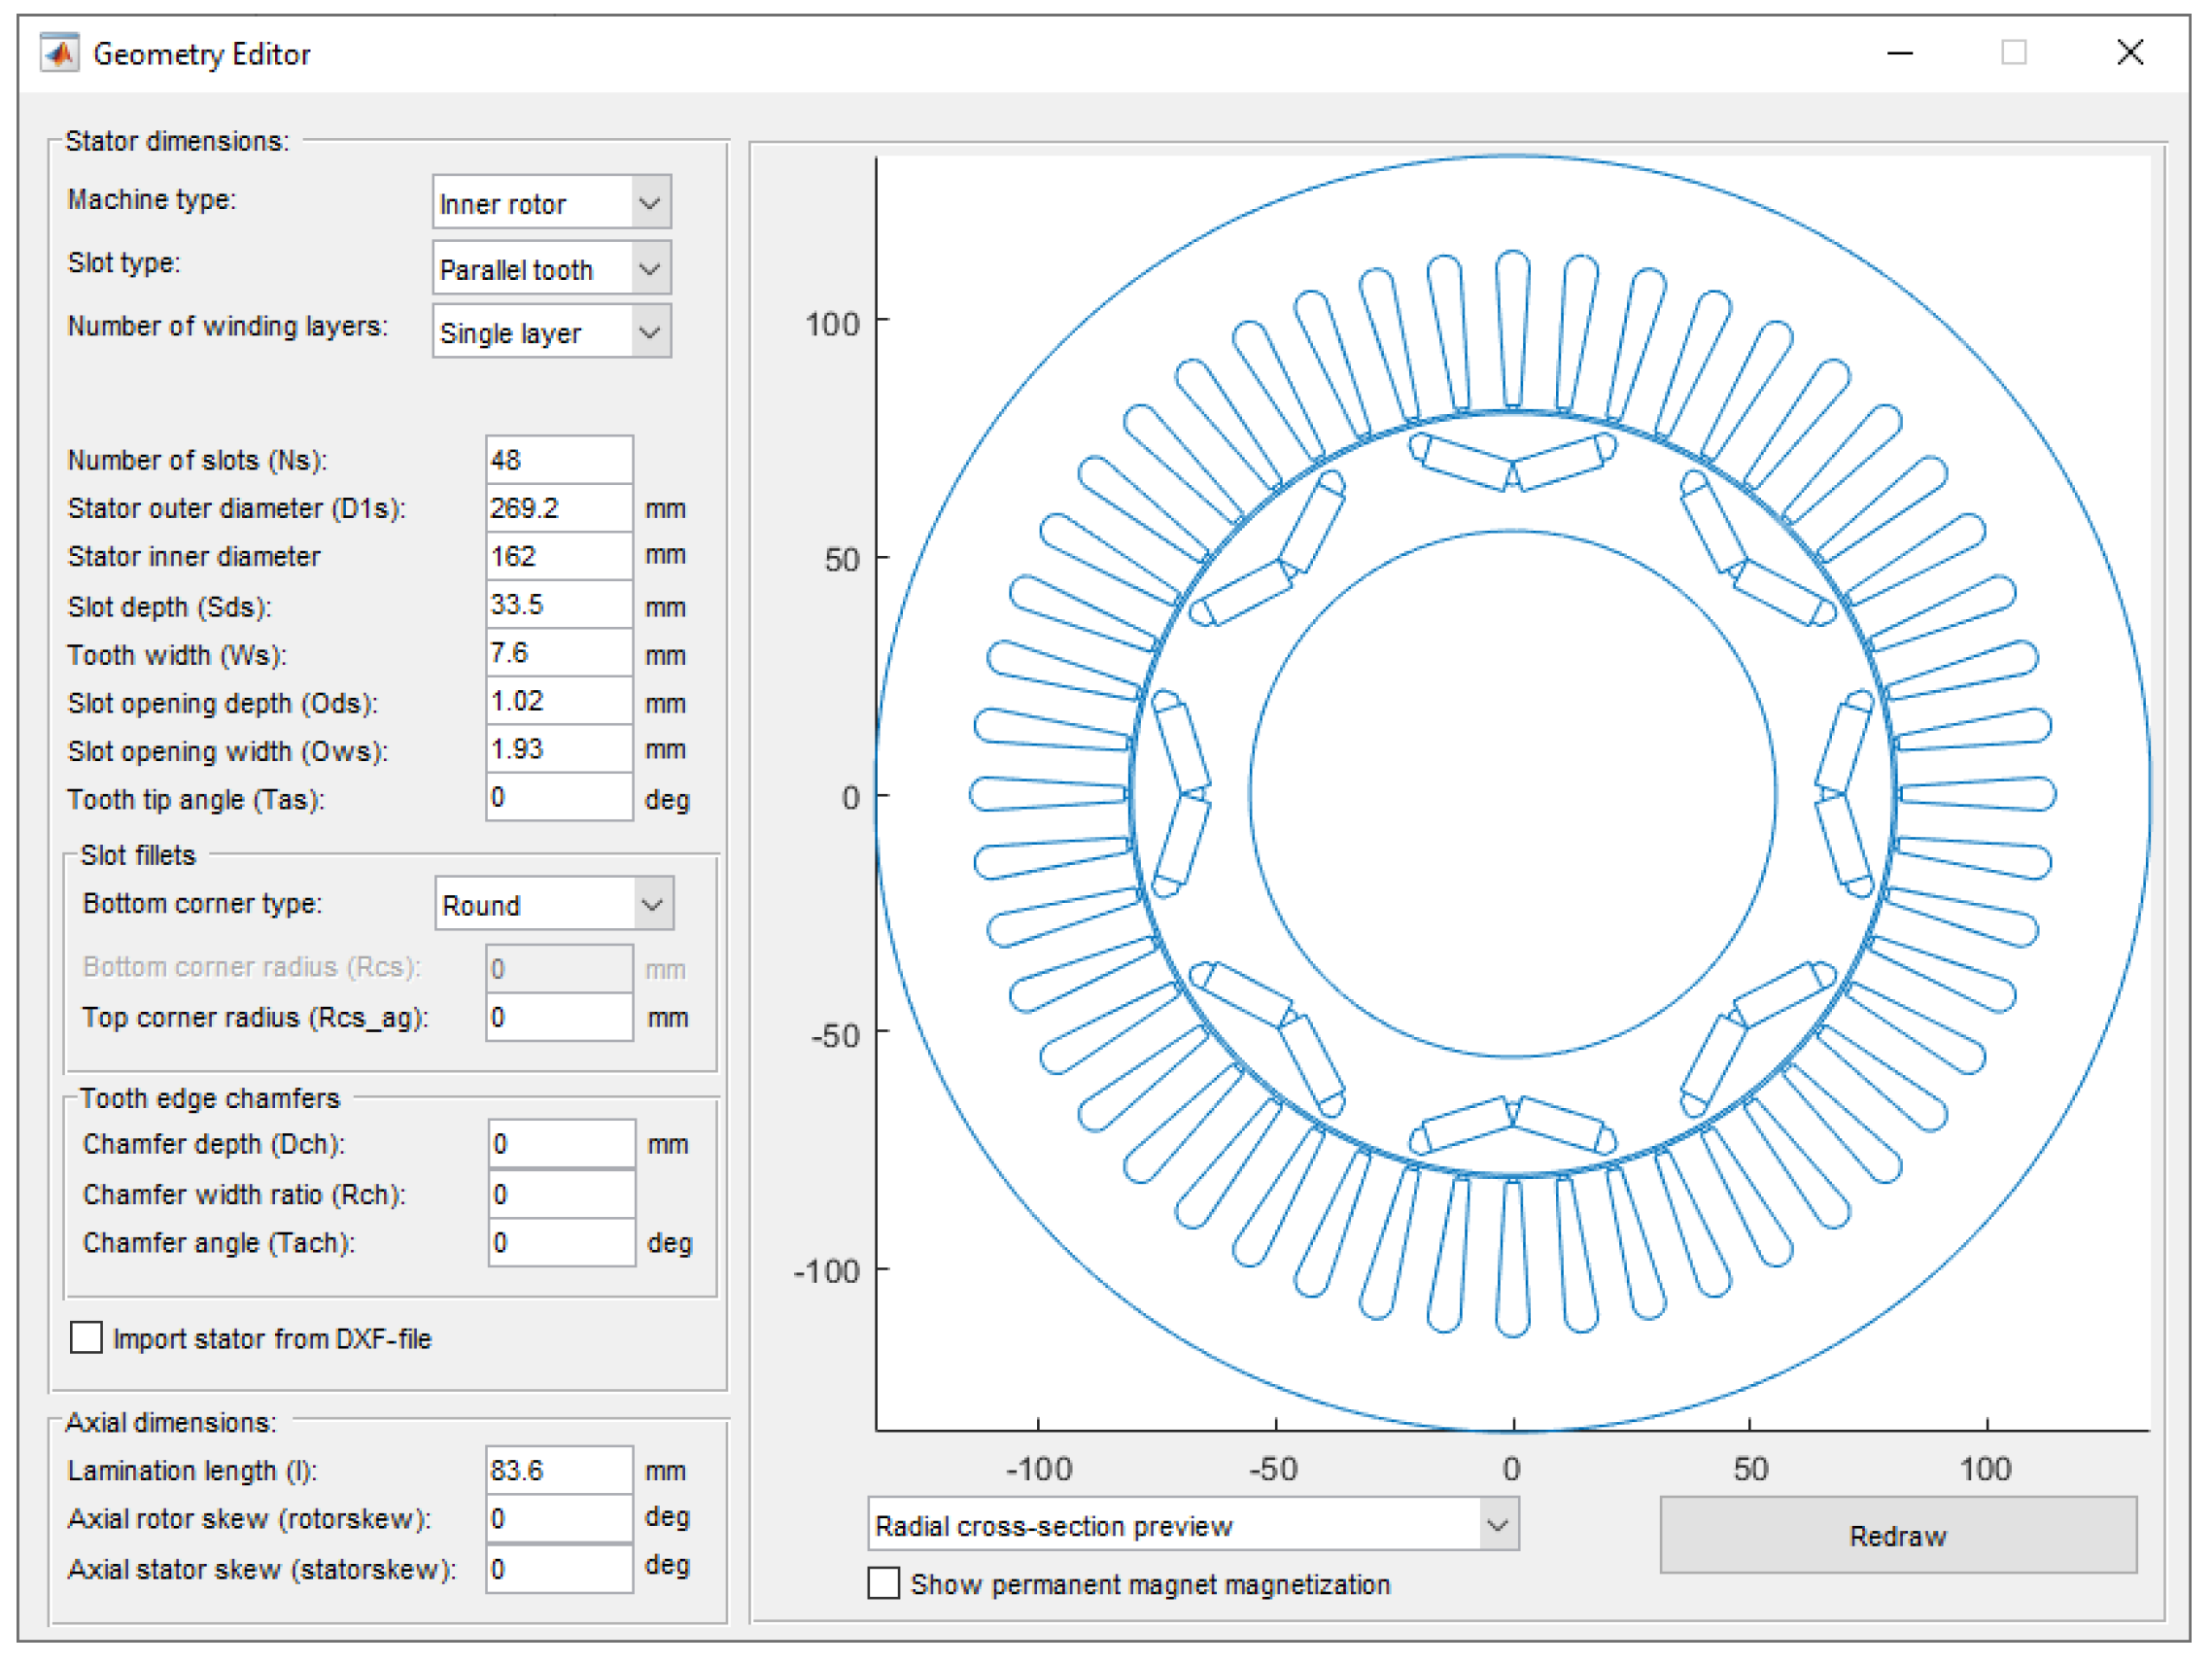
25]. The main objective while adjusting the geometry parameters is to produce the rated torque with the minimum amount of power losses and minimum use of active materials. For IPM motors, this task can be achieved by choosing the appropriate level of magnetic saturation for different steel cores of the motor and by maximizing the saliency ratio of the motor. This section describes how MotorAnalysis-PM can facilitate to achieve these goals. The Geometry Editor window of MotorAnalysis-PM for entering geometry parameters of the motor is shown in
Figure 2.
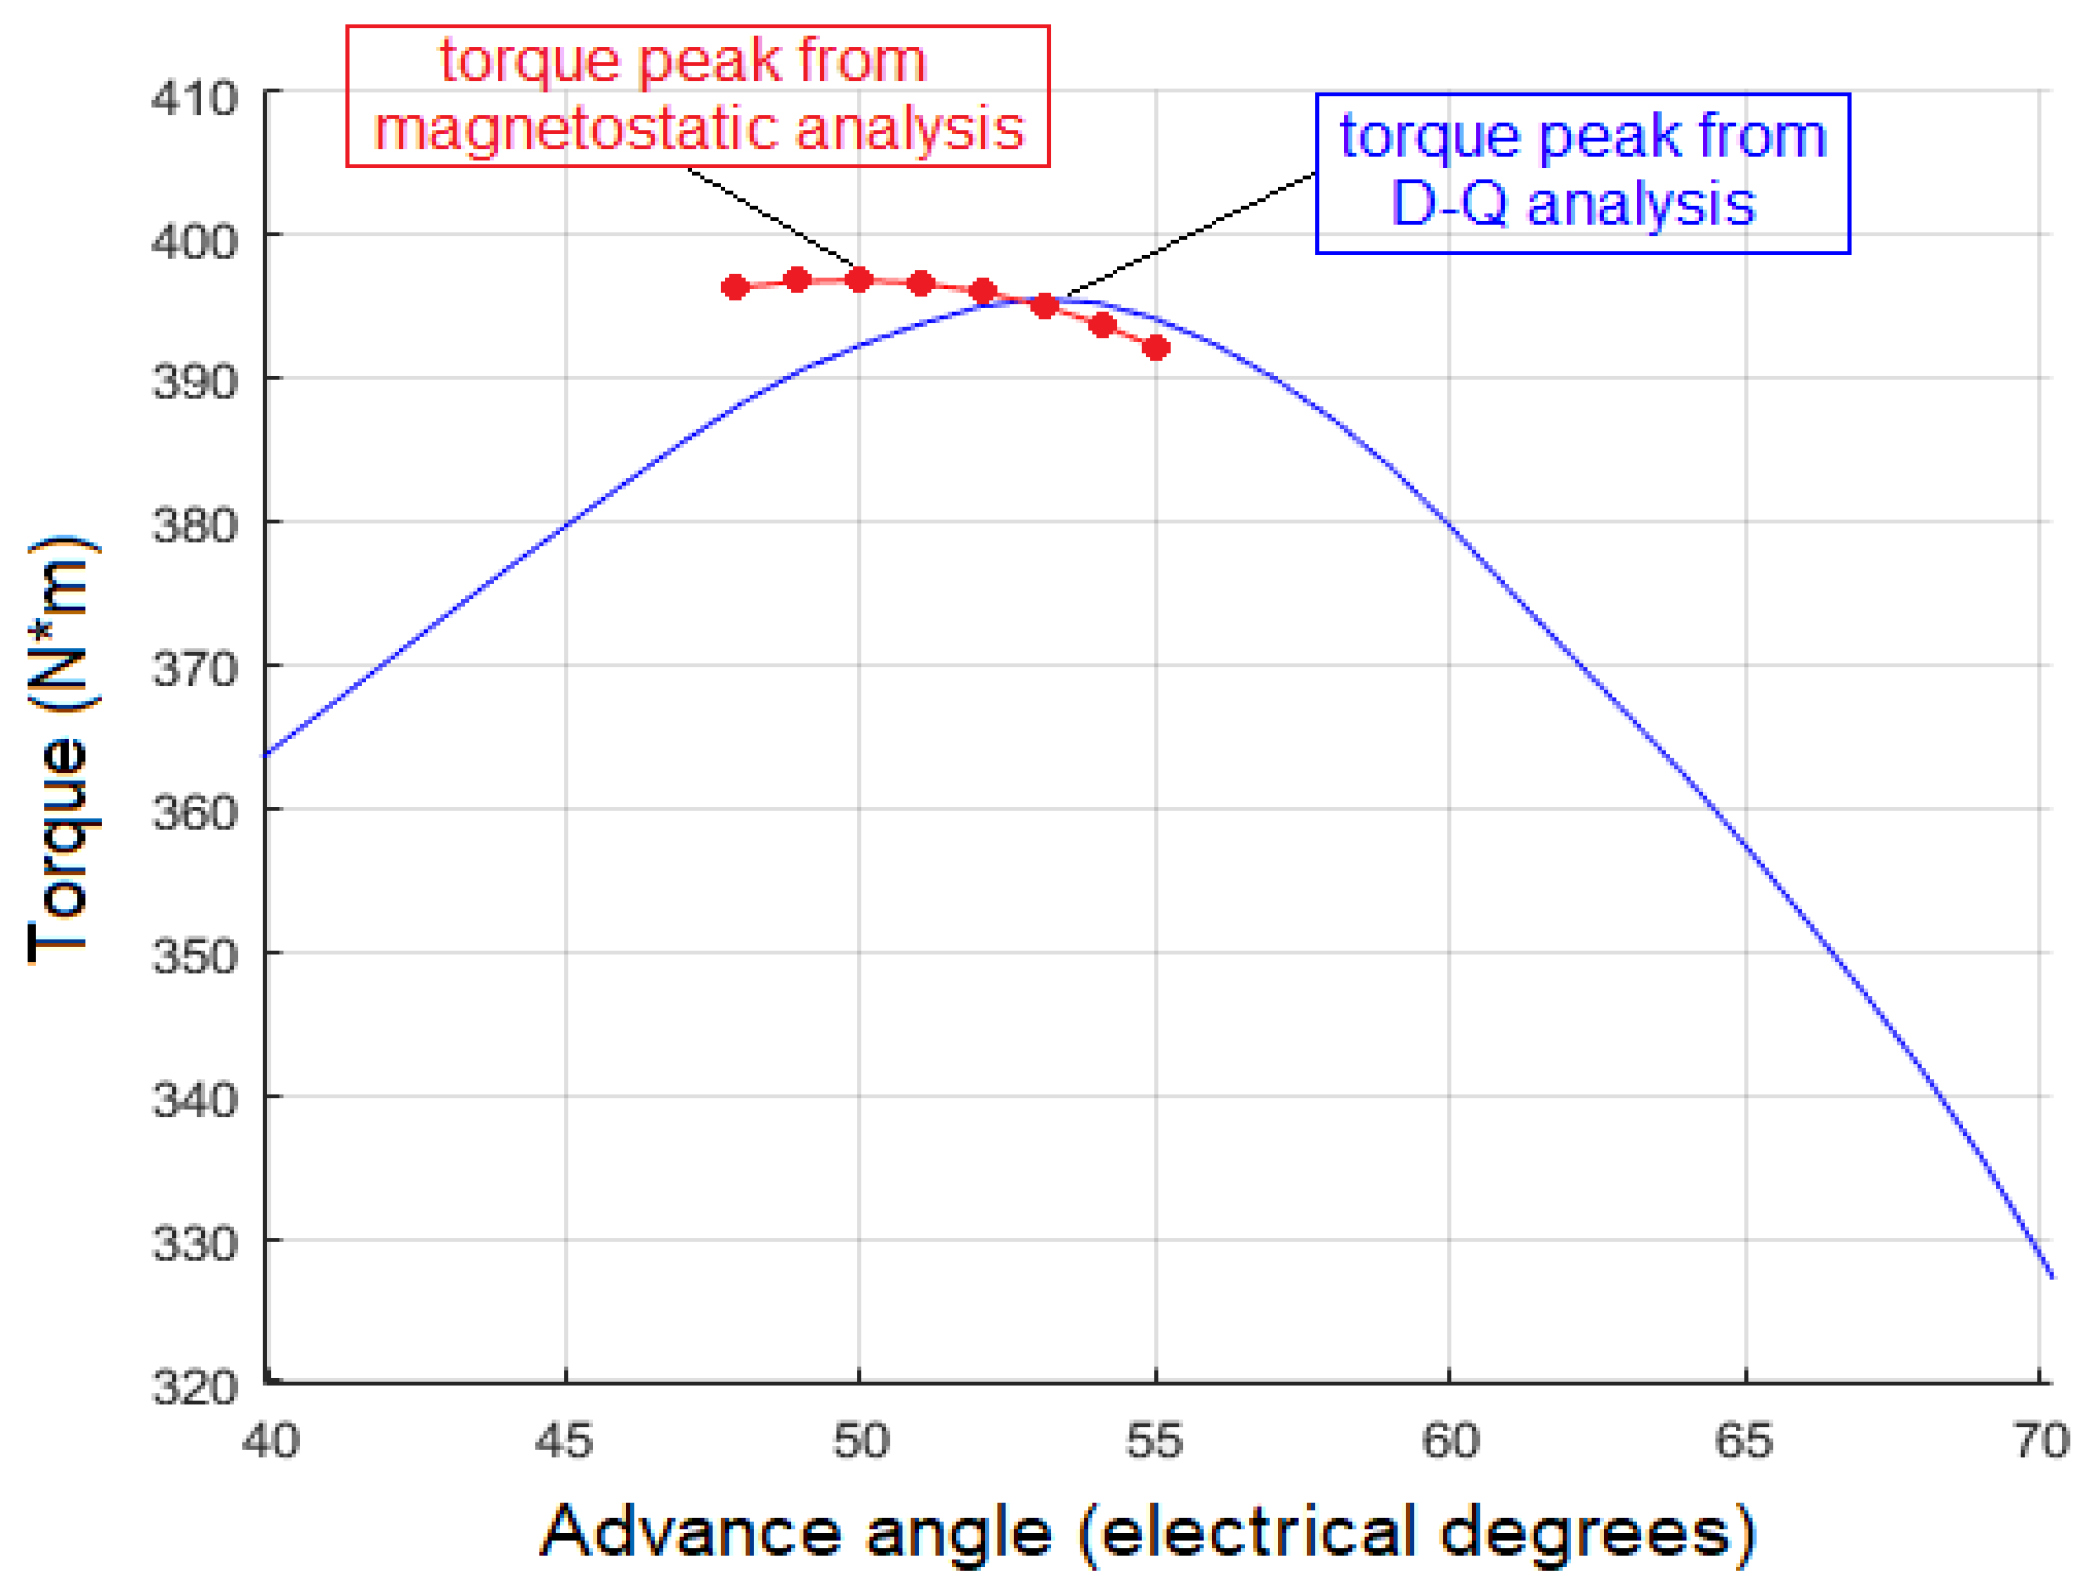
For the surface PM motors, the maximum torque occurs at an advance angle
γ = 0 and the entire analysis can be done with this assumption. In the case of the IPM motor, the maximum torque will occur at an advance angle between 0° and 90° due to a significant reluctance torque component. Therefore, the advance angle at which the maximum torque is achieved should be determined first. The initial torque versus advance angle curve (blue curve in
Figure 3) is obtained by the d-q analysis of MotorAnalysis-PM for the rated current density to determine the advance angle corresponding to the maximum torque. Since the accuracy of the d-q analysis is less than that of the FE method, the time-stepping magnetostatic FE analysis is carried out for several values of advance angles in the vicinity of the torque peak previously obtained from d-q analysis. This results in finding the maximum torque advance angle with better accuracy. Only a few points are used for the time-stepping magnetostatic FE analysis since its computational speed is much lower compared to the d-q analysis. For the PM motor under study, the refined advance angle value of 50° is found that ensures maximum torque as shown in
Figure 3 with red color. The advance angle value of 50° is used for further analysis.
Table 3 compares the results of MotorAnalysis-PM magnetostatic FE analysis for the rated current density and a quarter of rated current density. The corresponding flux density distribution plots obtained from MotorAnalysis-PM are shown in
Figure 4. Note that current and voltage are computed for initial winding configuration employing one turn.
Figure 4 and
Table 3 demonstrate how the magnetic saturation of the steel cores can influence the PM motor performance. With the rated current density, the PM motor is oversaturated, maximum average flux density in the tooth is about 2 T, and in the stator back iron it is about 1.9 T, which leads to efficiency of only 85.5%. With four times lower current density, the observed maximum average flux density in the tooth is reduced to 1.5 T and 1.3 T for the stator back iron, resulting in calculated efficiency of 95.9%. The flux density distribution plots provide valuable insight about motor performance revealing regions with exceeding flux densities. In an ideal case, the flux density values should be kept as low as possible, reducing both the magnetic resistance and steel core losses. In practice, this is restricted by the size and weight requirements. For most steels, it is usually recommended to keep the flux density in the stator teeth below 1.8 T or even less for higher speed motors to minimize core losses. The flux density in the back iron is usually lower than that of the teeth. However, validation with the magnetostatic FE analysis is recommended to determine the back iron dimensions satisfying the desired motor performance and size/weight requirements. More detailed recommendations for choosing flux density levels for different parts of the PM motor can be found in [
2]. If needed, the motor designer may consider adding more steel to the saturated region to reduce flux densities and improve motor performance. By contrast, steel active parts with very low flux densities can be removed to save weight and cost.
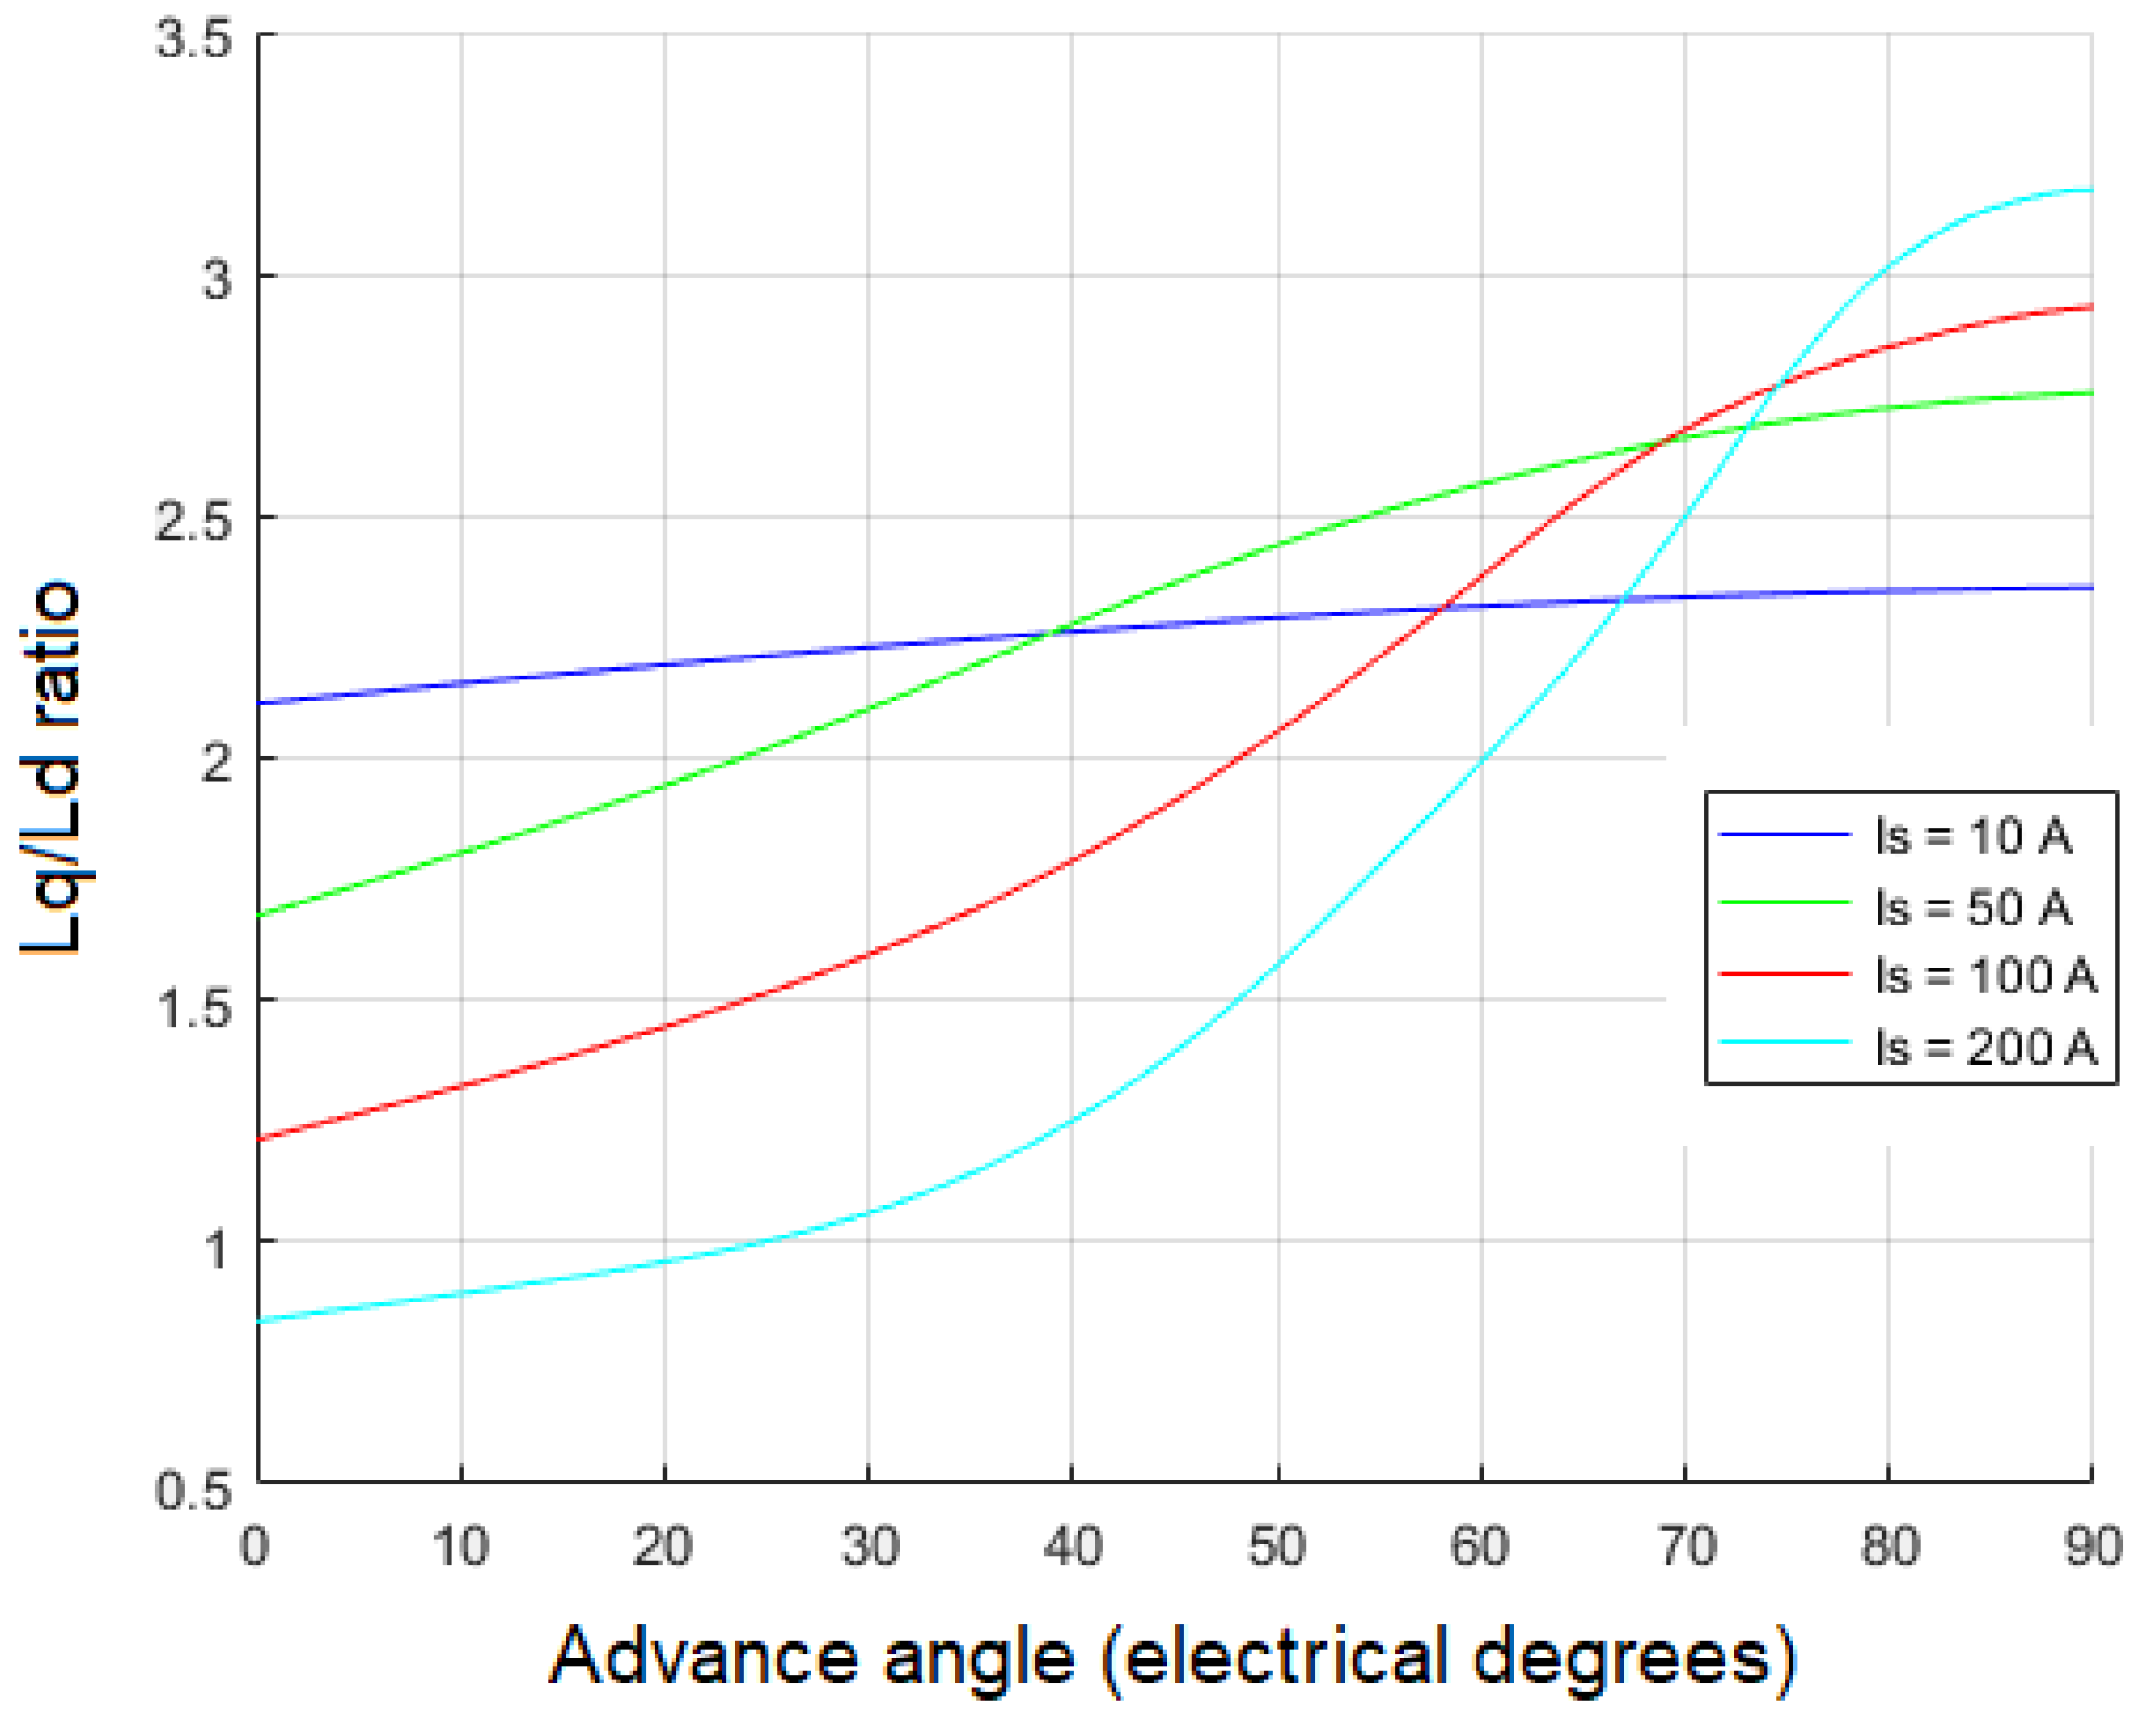
In IPM motors, inserting PMs deeper into the rotor steel decreases magnet torque component in comparison to surface PM motors. This is due to the fact that the distance between magnets and the stator becomes larger and magnetic flux travels a longer distance. This is compensated by the reluctance torque component, which is determined by the saliency ratio,
Lq/
Ld. The saliency ratio, in turn, is affected by the rotor geometry and stator winding configuration [
26,
27].
Figure 5 shows curves of the saliency ratio versus the advance angle for different stator currents generated using the d-q analysis of MotorAnalysis-PM. It is seen that the saliency ratio changes significantly with a change in current and advance angle. The dependence on the advance angle becomes more evident as the rotor saturates which should be considered while designing the motor. Increasing the saliency ratio with the advance angle is an important factor to consider especially for the field-weakening operation. This means that the reluctance torque component increases during operating conditions when the magnet torque component decreases with the weakened flux of the PMs.
4.4. Number of Turns and Parallel Paths
Table 3 shows the FE simulation results with corner speed of 1200 rpm for initial winding configuration with one turn and one parallel path. To adjust the desired levels of the stator root mean square (RMS) phase current and RMS phase voltage, the two expressions below can be used:
where
Npp is the number of parallel paths of the winding,
W is the number of turns,
RMS(
1) and
RMS(
1) are the stator RMS phase current and RMS phase voltage with one parallel path and one turn winding corresponding to corner speed and rated current density.
The corner speed is defined as the maximum speed that the motor can reach with rated torque while operating in maximum torque per ampere (MTPA) regime i.e. without field weakening [
17]. With a given rated torque, the corner speed determines the peak output power of the motor. While setting the number of turns and parallel paths using (11) the maximum phase voltage available from the inverter terminals should be considered such that the phase voltage defined by (11) does not exceed the inverter limit. Parallel paths can be considered to adjust the voltage and current ratings to those of a specific supply and to minimize the unbalanced magnetic pulls due to manufacturing imperfections [
28].
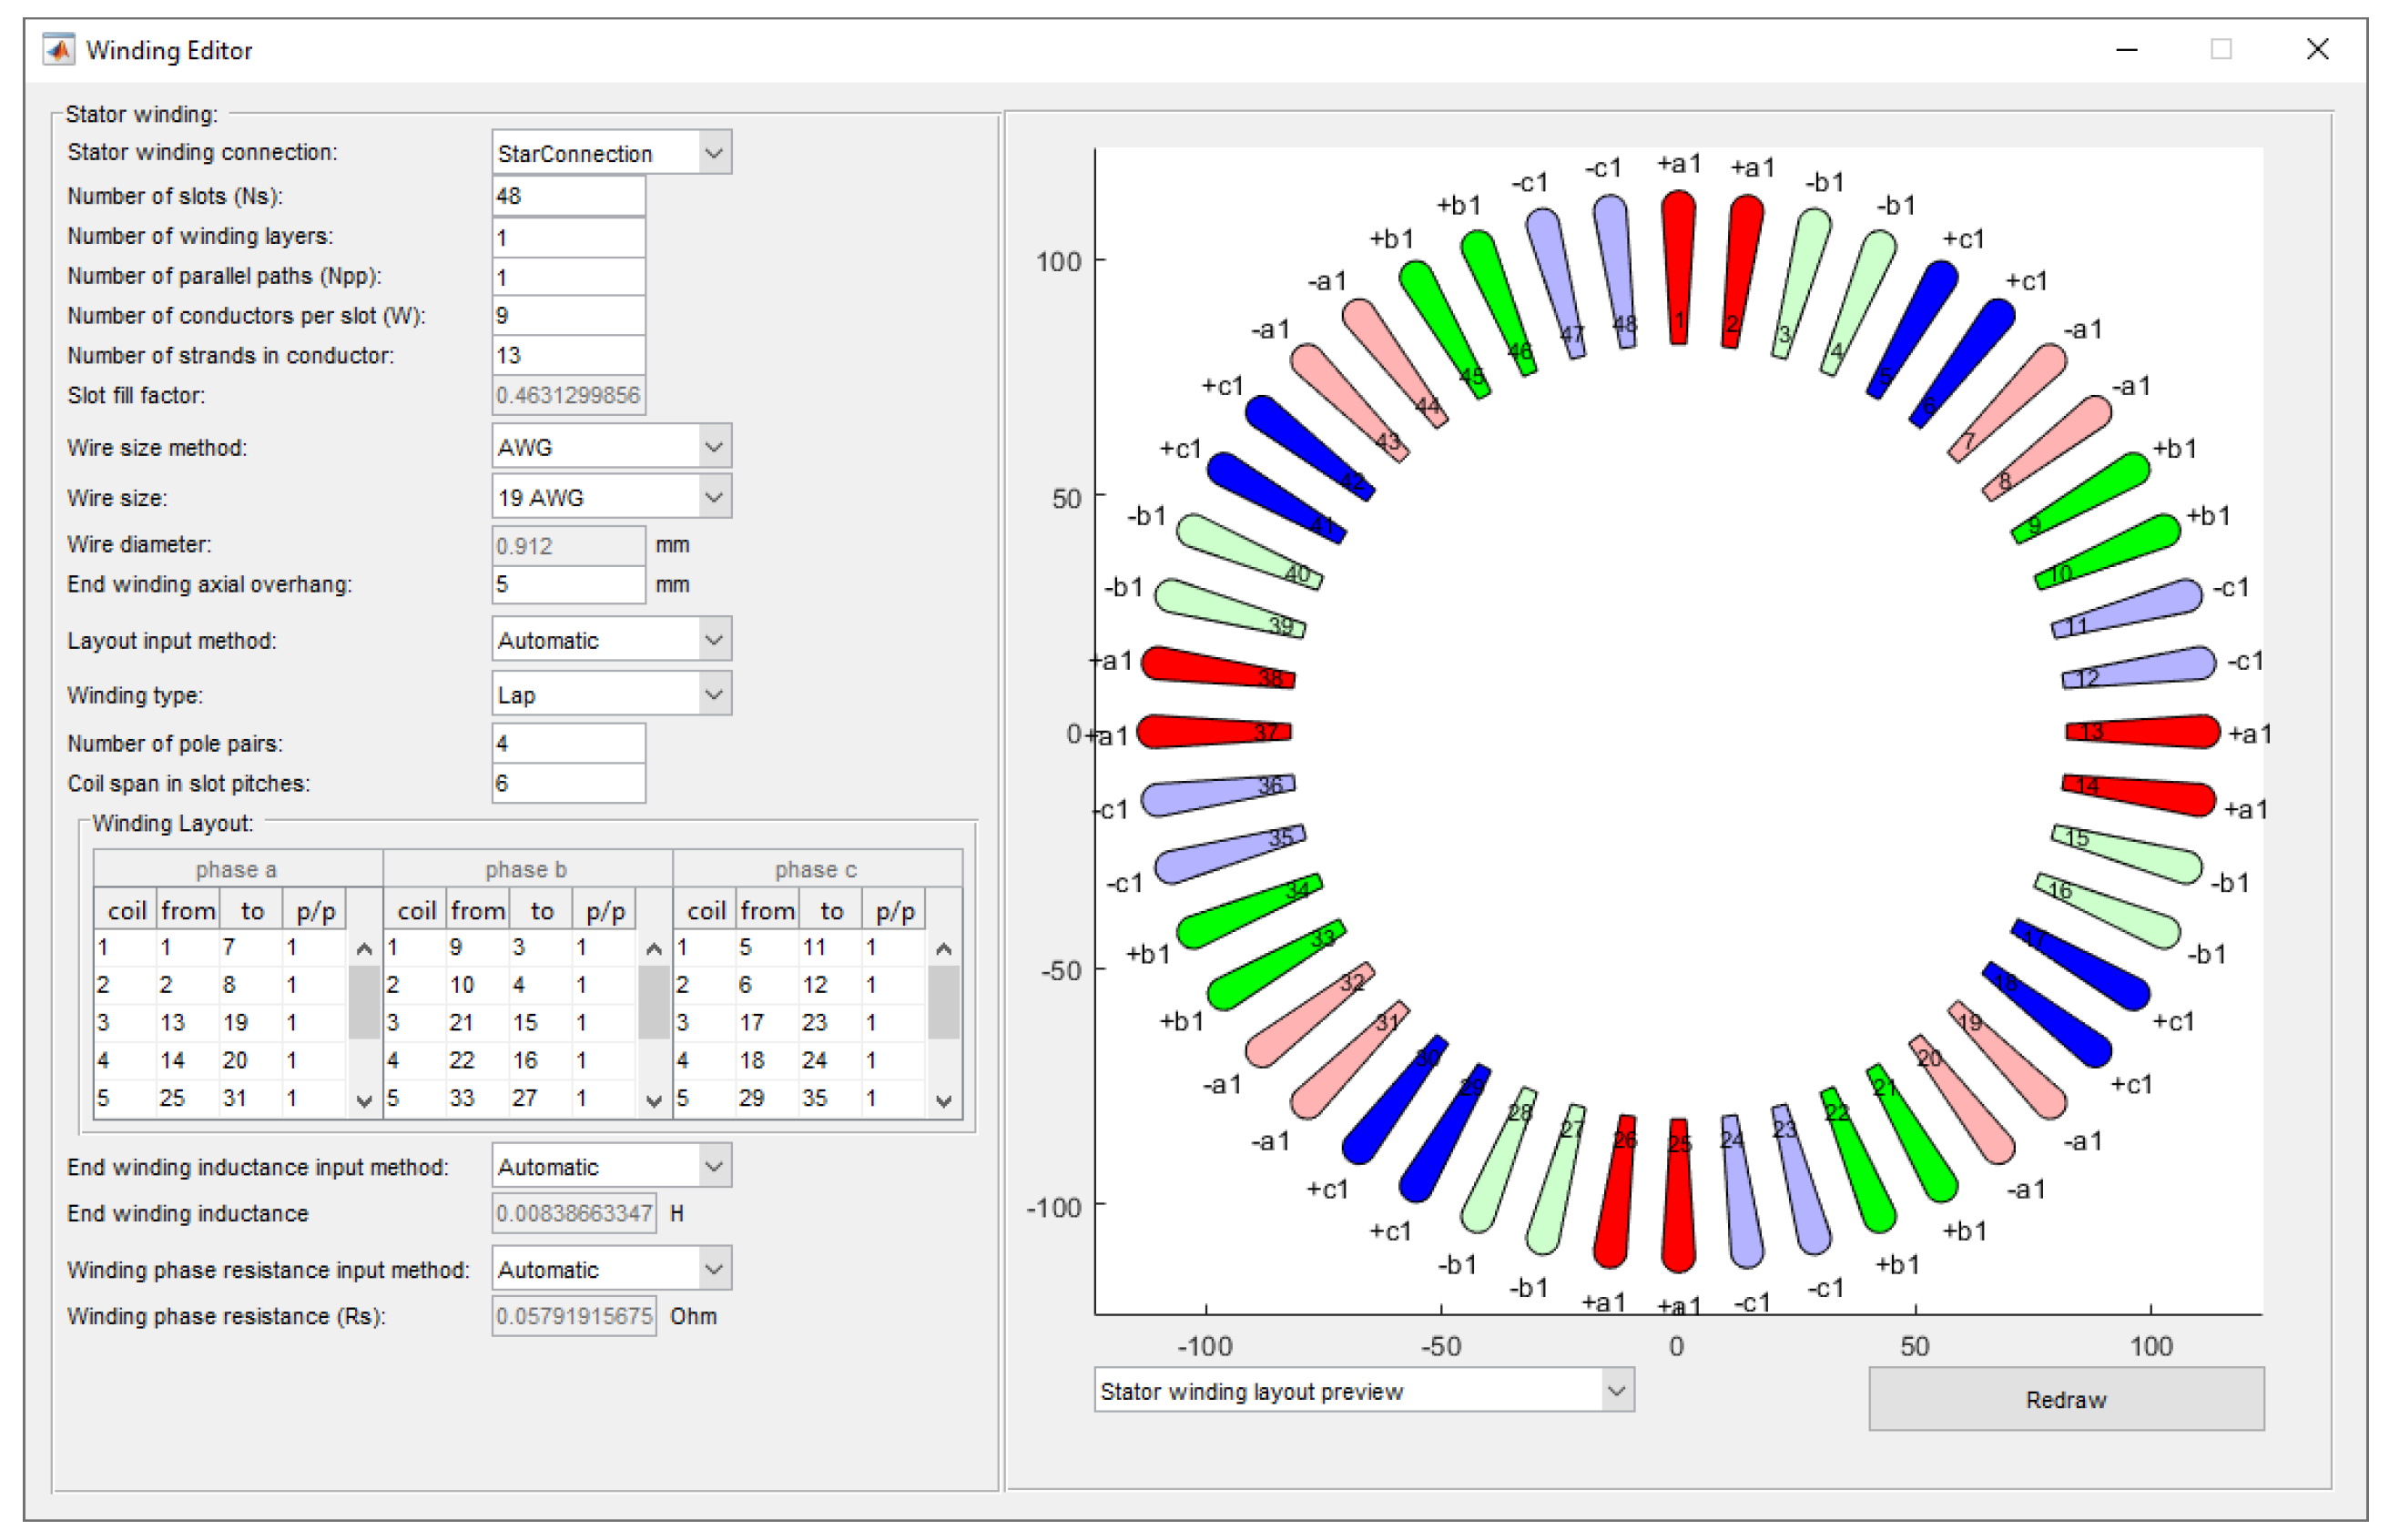
The actual winding arrangement chosen for the considered example comprise of nine turns and one parallel path. The Winding Editor window of MotorAnalysis-PM is shown in
Figure 6. According to (11) and simulation results presented in
Table 3, the actual rated RMS current is reduced to 230 A and the RMS phase voltage is increased to 159.3 V.
4.5. Demagnetization Analysis
Irreversible demagnetization occurs when the operating point of any part of the PMs passes beyond the linear range, i.e. falls below the “knee” of the demagnetization curve. In this case, the residual flux density in the PMs is reduced, causing an irreversible change in the PM properties [
15,
29].
During field-weakening operation the d-axis current can push the flux density in the PMs towards the vicinity of the knee of the demagnetization curve. Hence, IPM motors should be designed with the ability to withstand the demagnetizing field without the risk of PM demagnetization at maximum operating temperatures.
MotorAnalysis-PM provides the calculated value of maximum demagnetizing field strength experienced by the PMs for each run of magnetostatic and dynamic FE analysis. This allows assessment of the risk of demagnetization by the designer. It is recommended to check the design for possible risk of demagnetization at the worst operating conditions (maximum current, magnet temperature and advance angle) and also during fault conditions [
30]. If simulations reveal the risk of demagnetization, the designer should consider increasing the PM thickness, change the PM material, or change the PM grade with a higher intrinsic coercivity or/and operating temperature.
4.6. Field-Weakening Operation
In the development of MotorAnalysis-PM additional attention has been given to the analysis of field-weakening capabilities of the motor, which is especially important for EV applications. The ability of a motor to maintain a constant output power during the field-weakening operation is defined by the characteristic current given by [
31]:
where
λpm is the magnet flux linkage in the d-axis and
Ld is the d-axis inductance. According to (12), the characteristic current of the Prius IPM motor is determined from the MotorAnalysis-PM d-q analysis to be:
Since
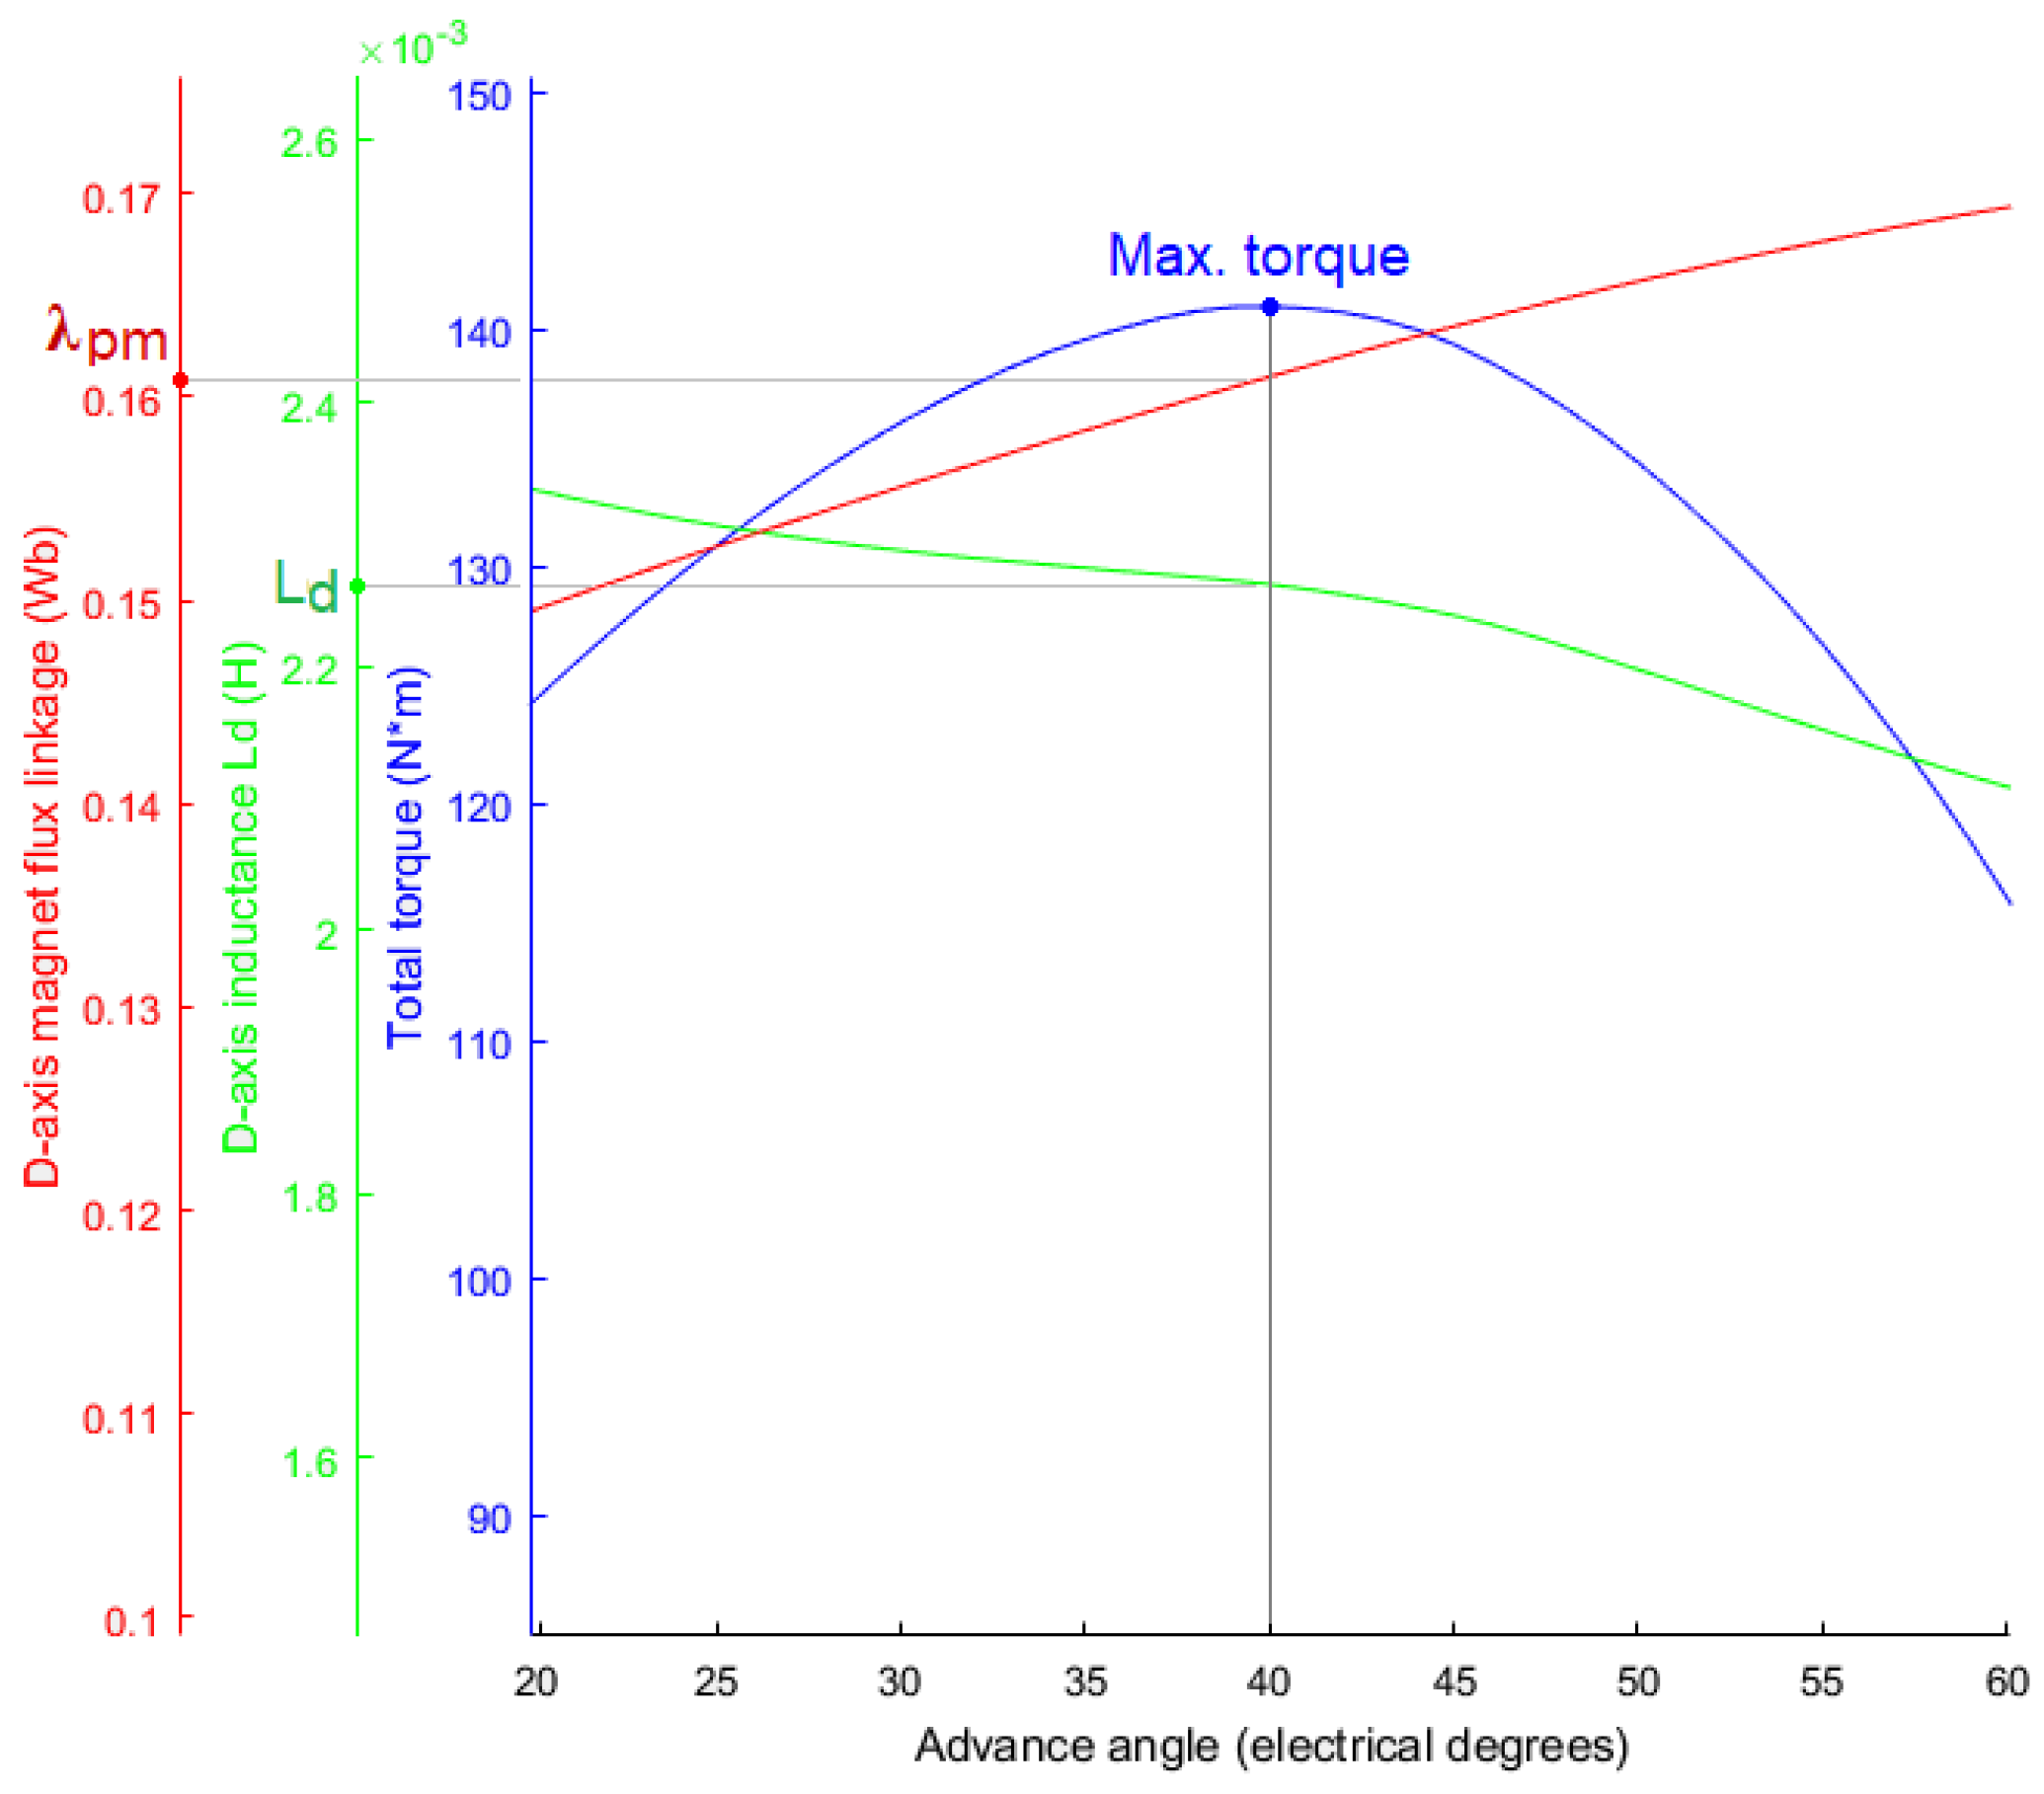
λpm and
Ld nonlinearly depend on the advance angle γ, the characteristic current is determined for γ at which the maximum torque occurs (MTPA operation is implied). This is illustrated in
Figure 7. On the other hand, since the values of
λpm and
Ld also depend on the stator current, multiple iterations are required and calculation is repeated for different stator currents until
Ich converges.
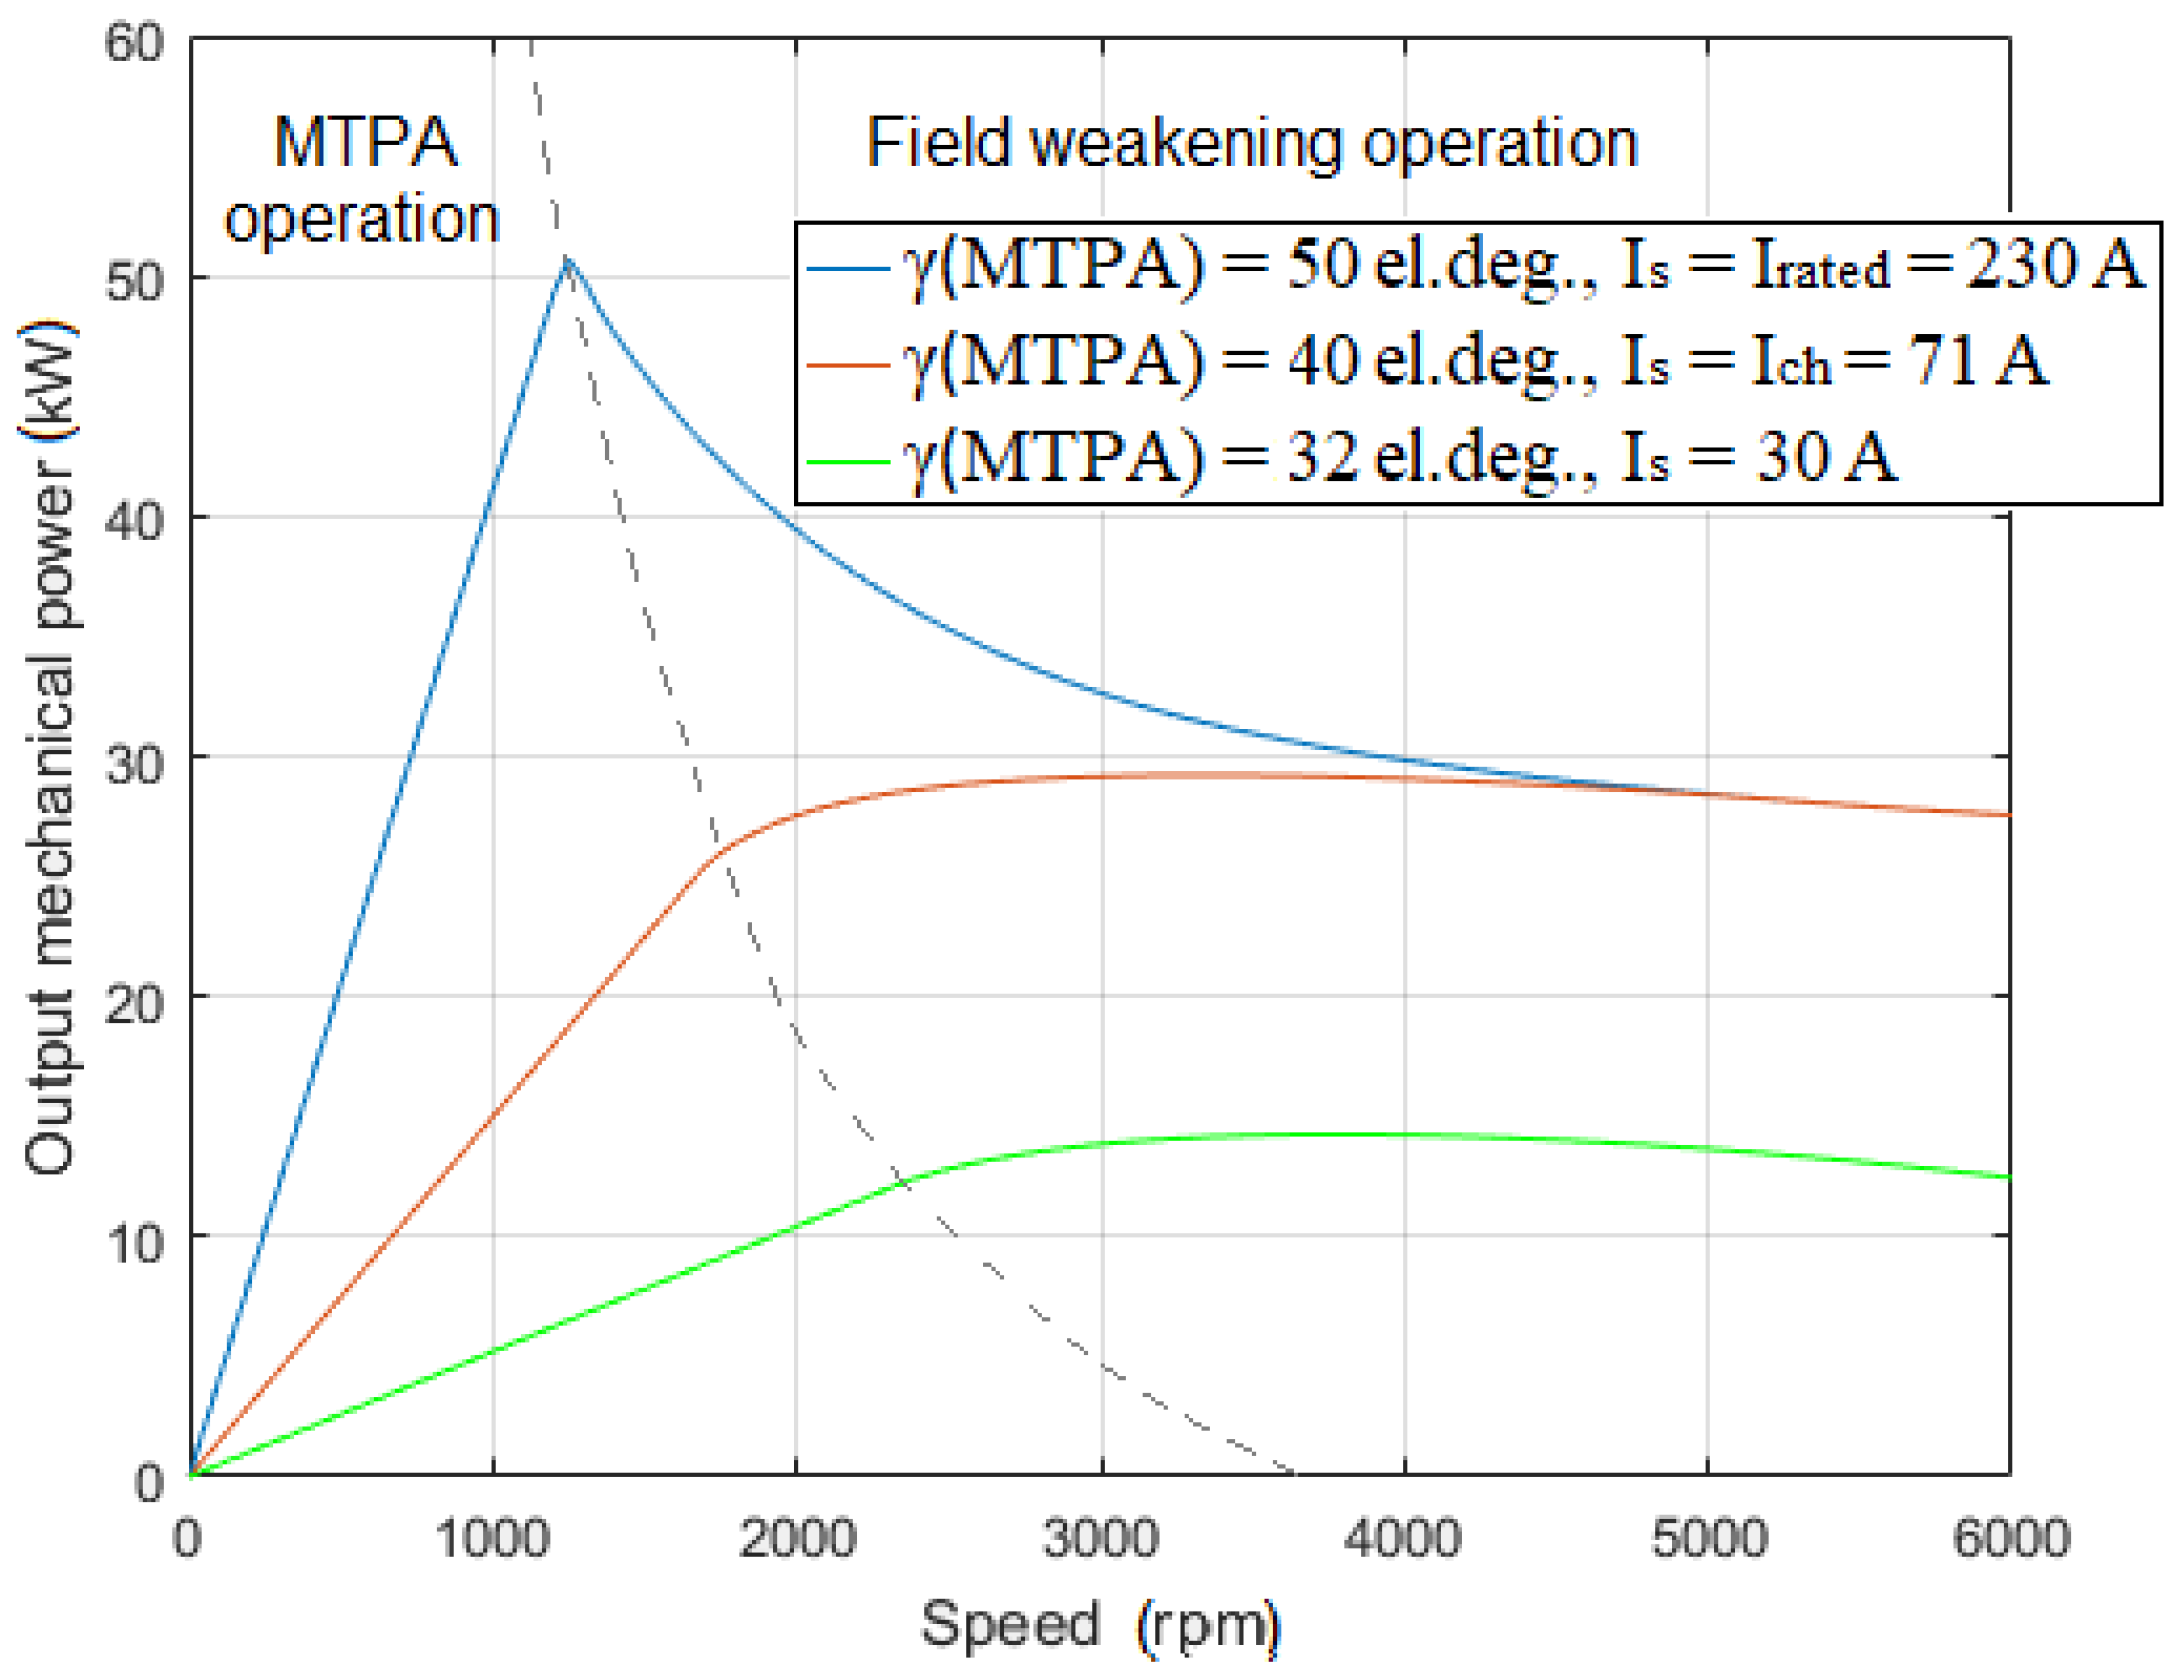
Figure 8 shows results from the d-q analysis of MotorAnalysis-PM demonstrating how the stator current influences the output power during the field weakening operation. The three curves in
Figure 8 pertain to three values of the stator current; rated current of 230 A, previously determined characteristic current of 71 A, and 30 A which is less than half of the characteristic current. As expected, the output power is almost constant for the characteristic current. For the rated current which in this case is much higher than the characteristic current, the output power shows a noticeable peak at the corner speed.
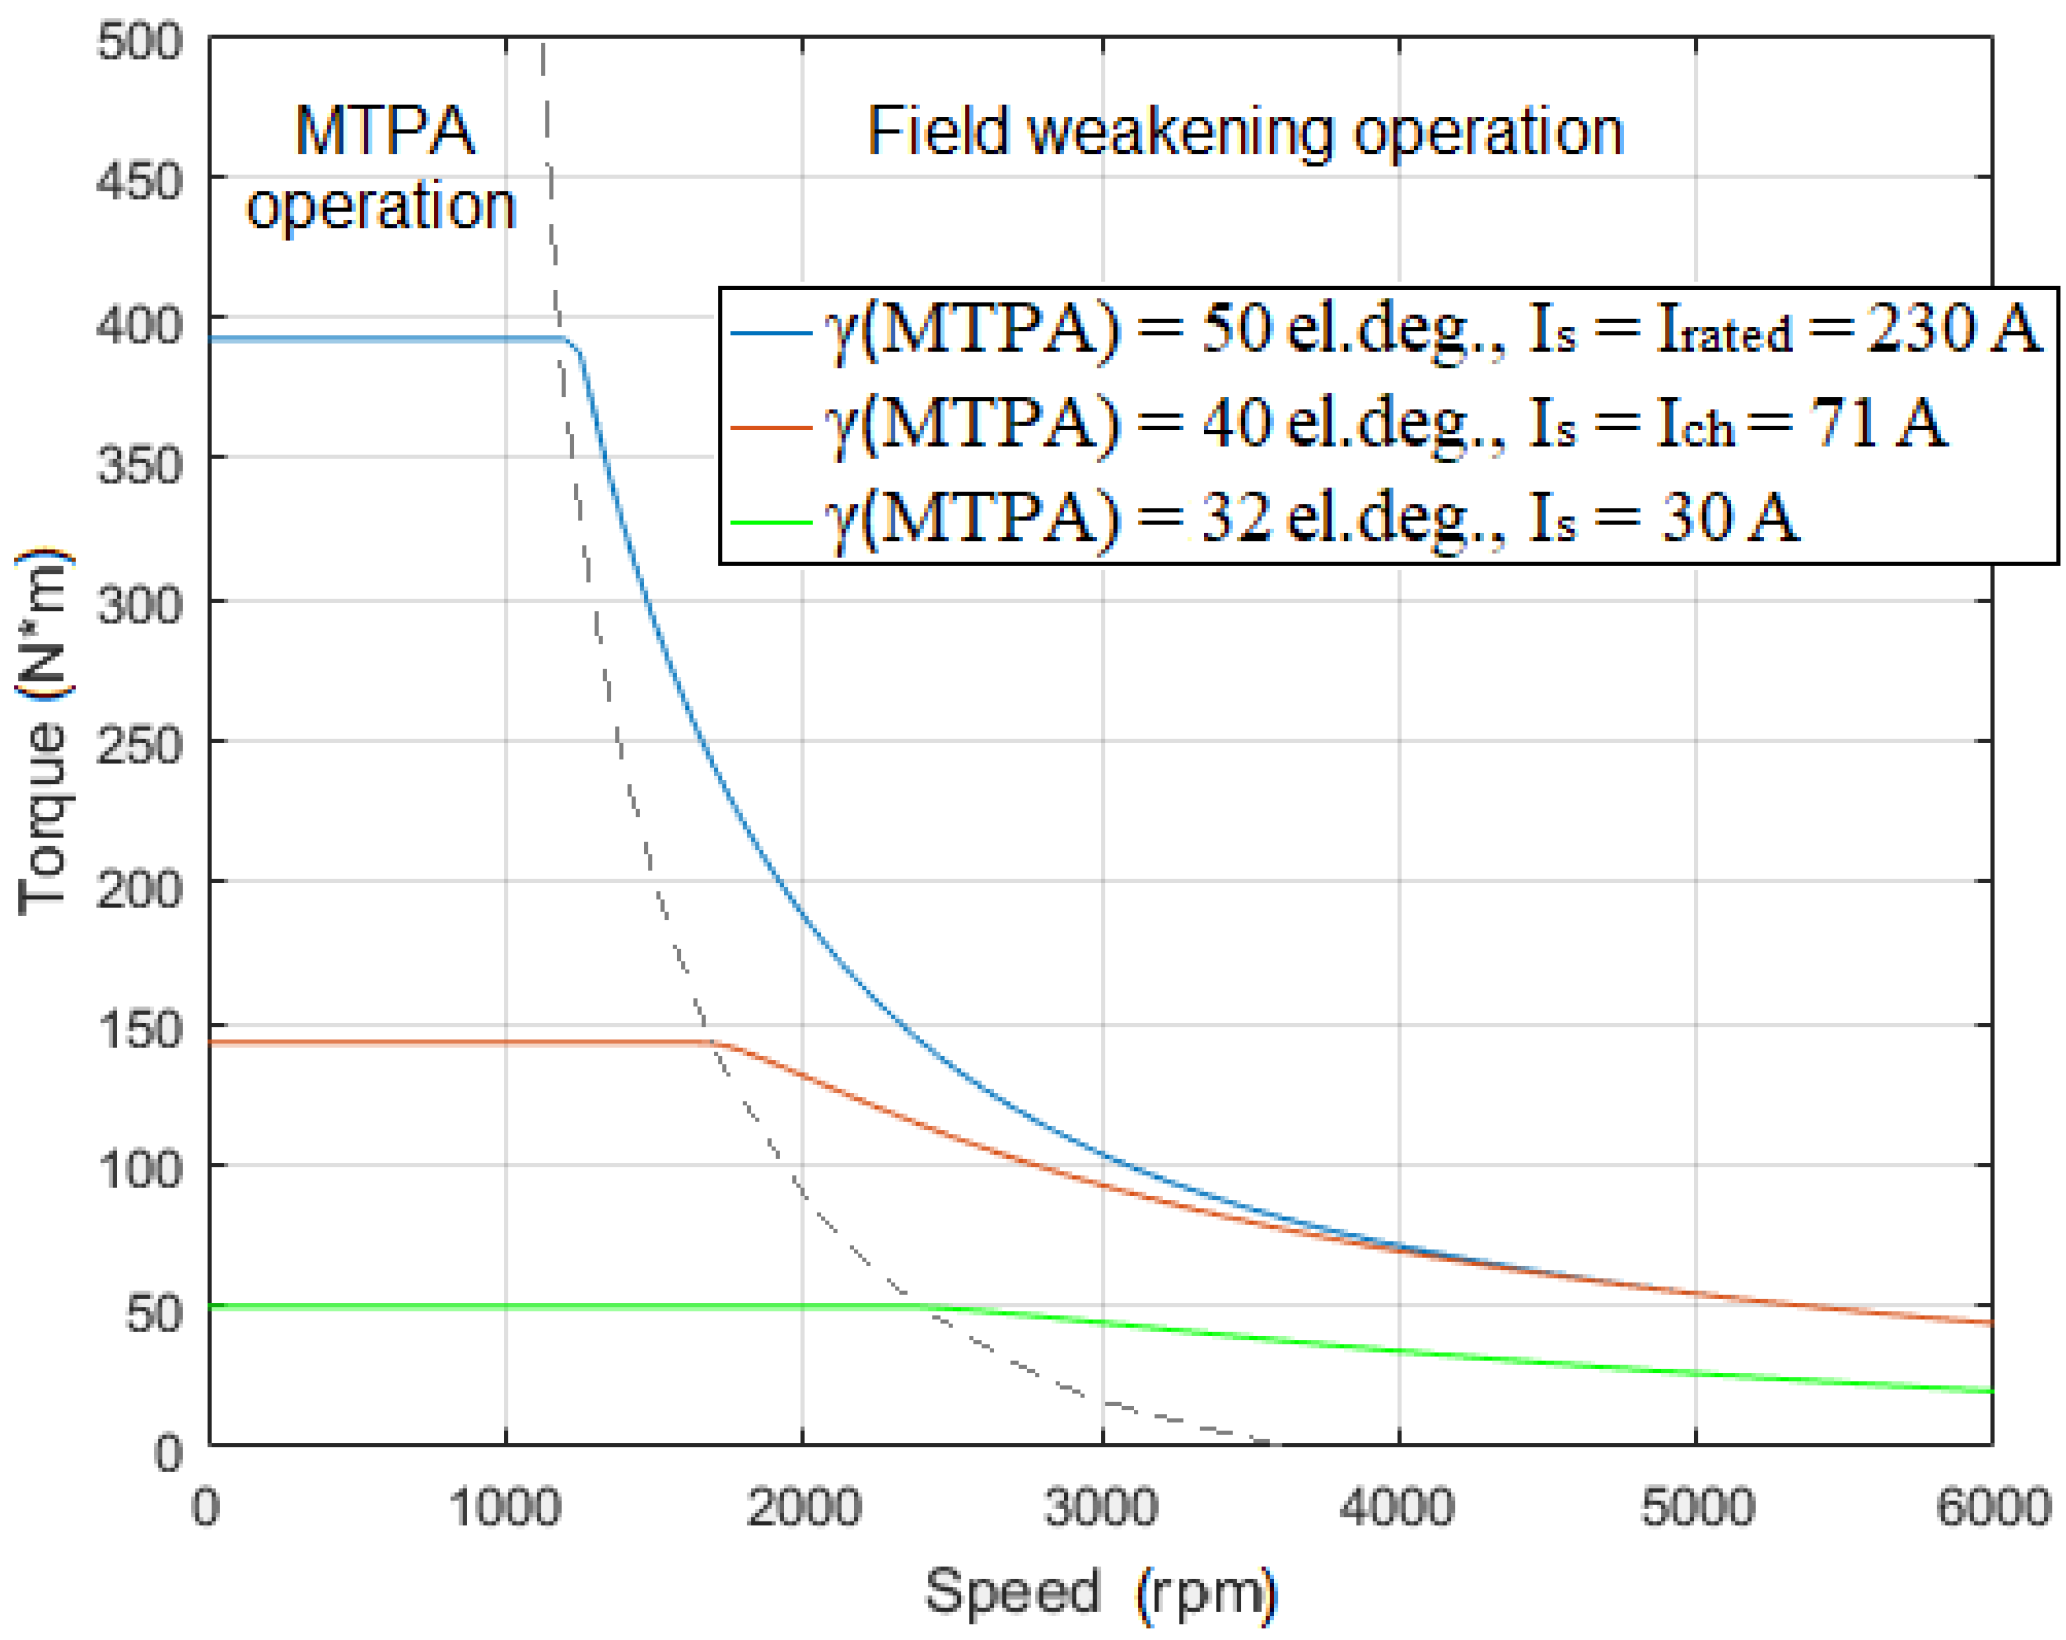
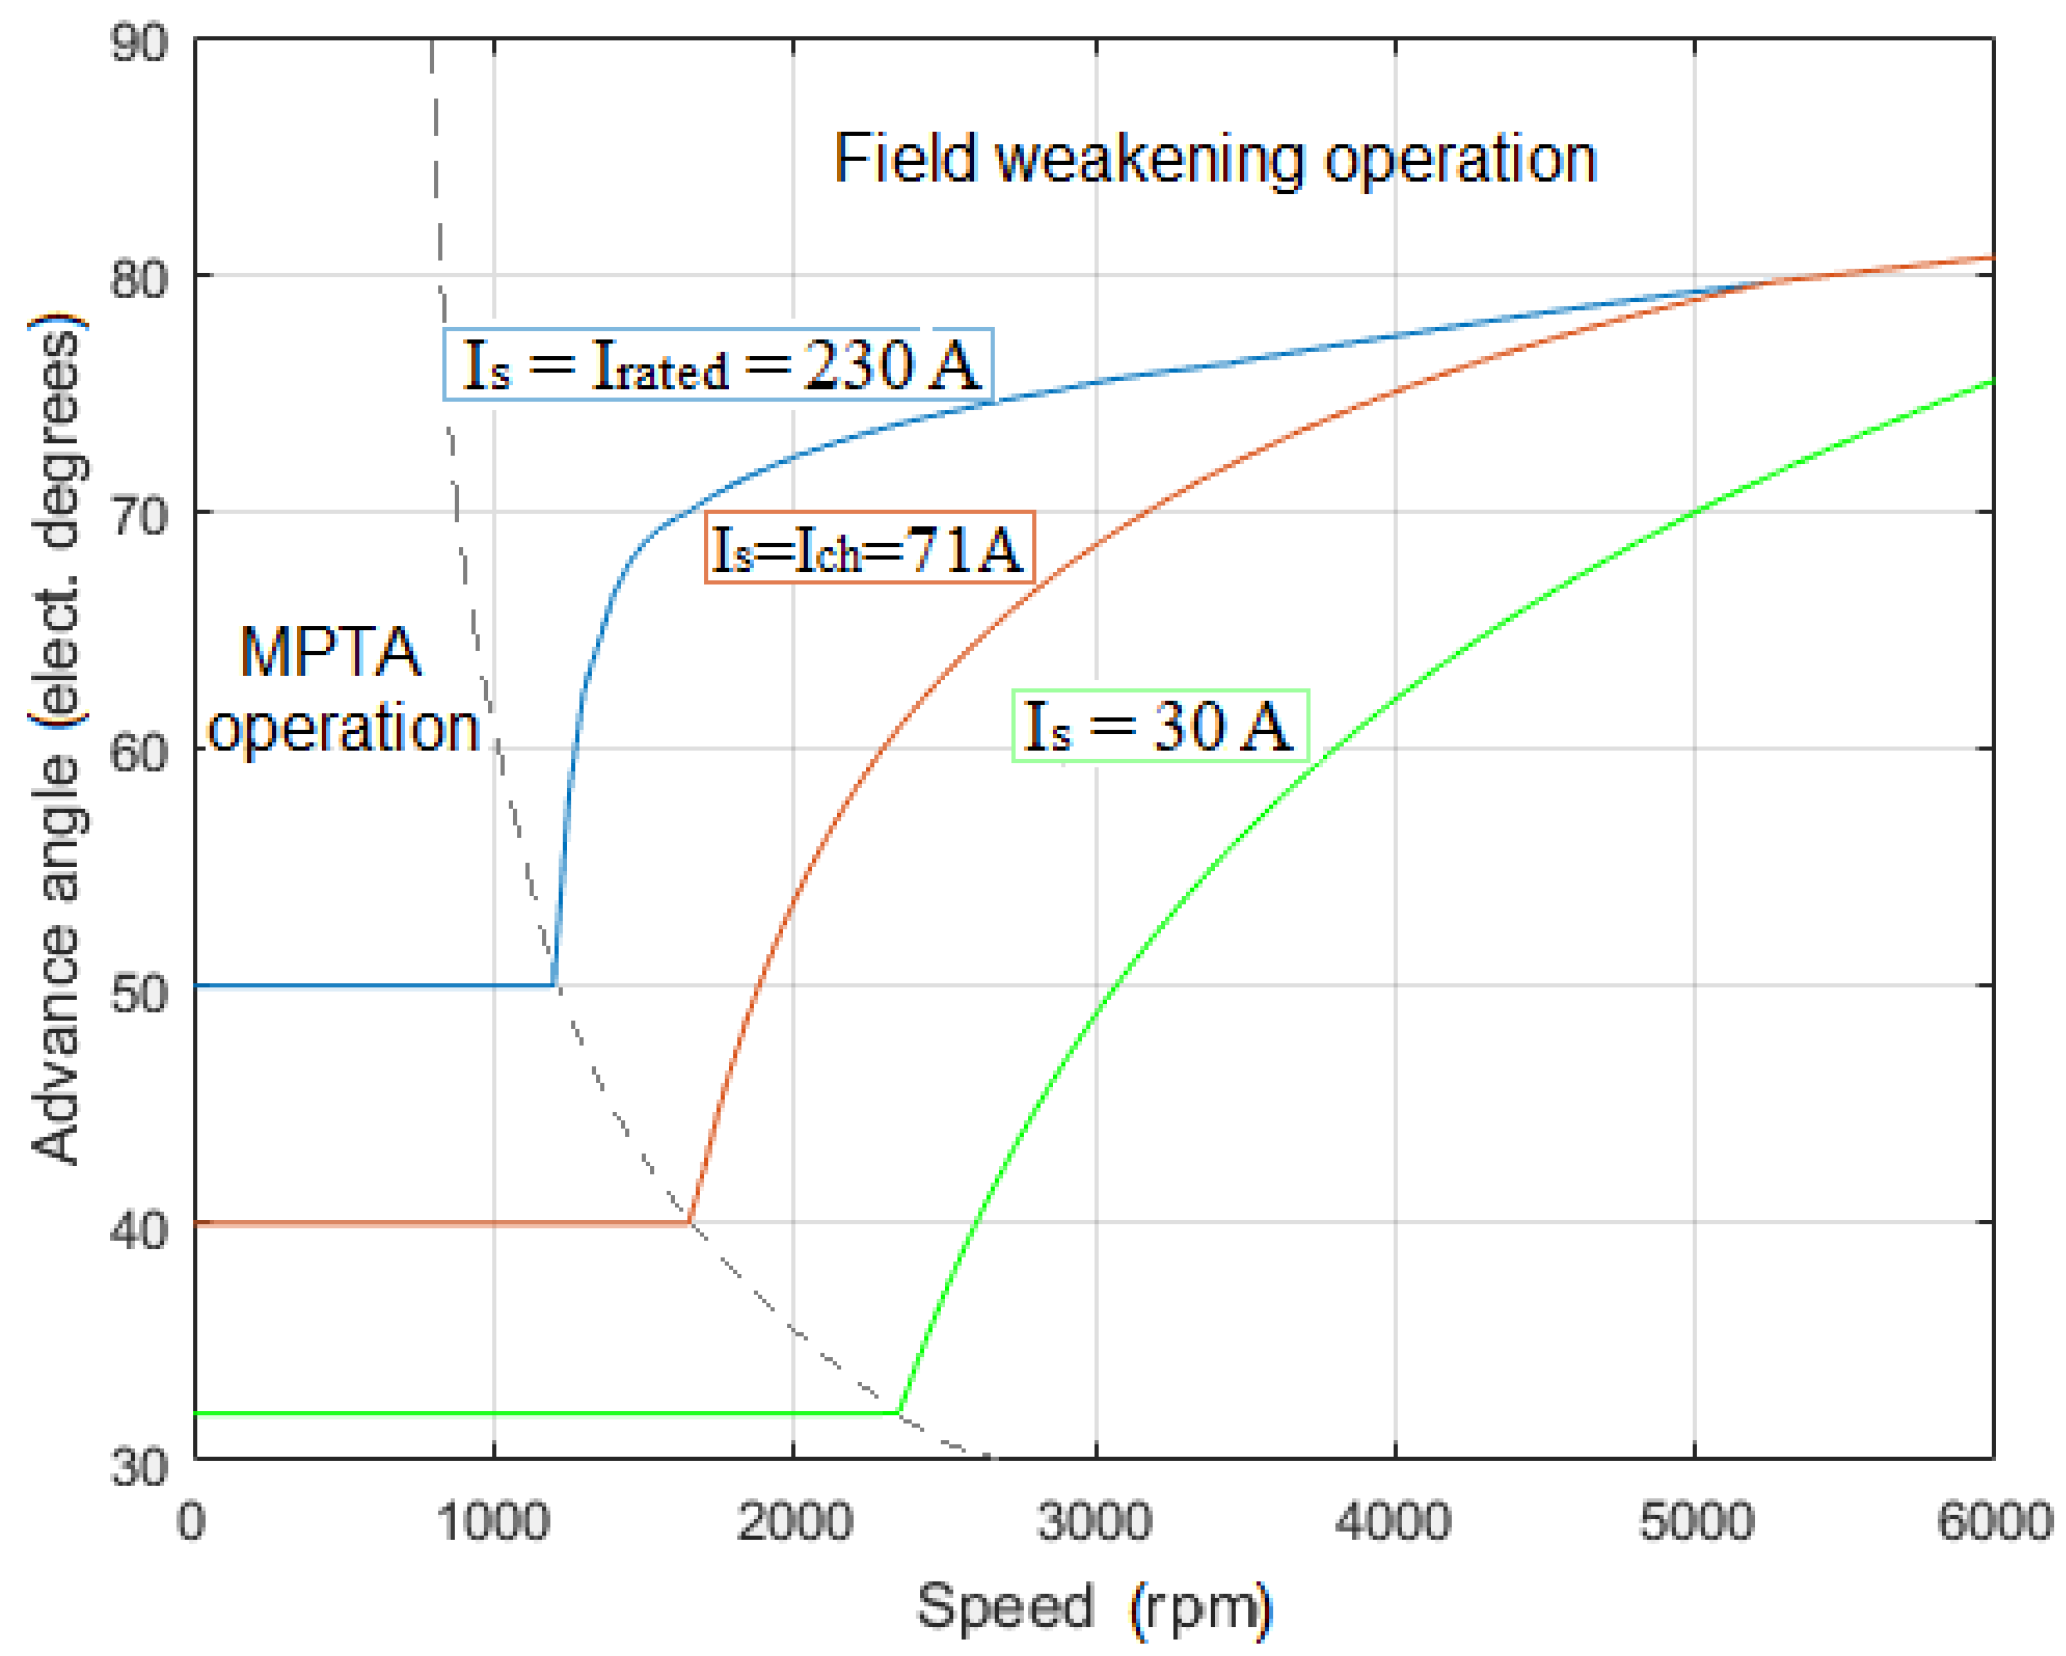
Figure 9 and
Figure 10 show the torque and advance angle curves corresponding to those three values of the stator current. One of the advantages of the MotorAnalysis-PM software is that it automatically adjusts the advance angle in the field-weakening regime, so the torque is maximum for a given current without exceeding the voltage limit.
To ensure that the desired motor performance in the field-weakening region is obtained, the characteristic current value should be defined in the initial stage of the design. The characteristic current is usually chosen to be close to the rated current
Irated [
31,
32] (which is not the case for the Prius motor considered). According to (12) an increase in
λpm and/or a decrease in
Ld leads to an increase of the characteristic current. Therefore, any change in PM dimensions, PM residual flux density, slot dimensions, or winding arrangement may be considered by the designer to adjust the characteristic current. It should be noted that, according to (11), changing the number of turns and number of parallel paths does not affect the
Ich/
Irated ratio even if it changes
Ld.
4.7. Analysis over Entire Speed and Torque Ranges
The MotorAnalysis-PM d-q analysis capability allows the generation of a variety of motor characteristic curves and maps, such as the speed-torque curve, current-torque curve, efficiency map, current and voltage maps, and many others. This flexibility allows the designer to overview the motor performance over an entire operating range as opposed to only examining one or several operating points. Several examples of d-q analysis curves generated by the software are shown in
Figure 8,
Figure 9 and
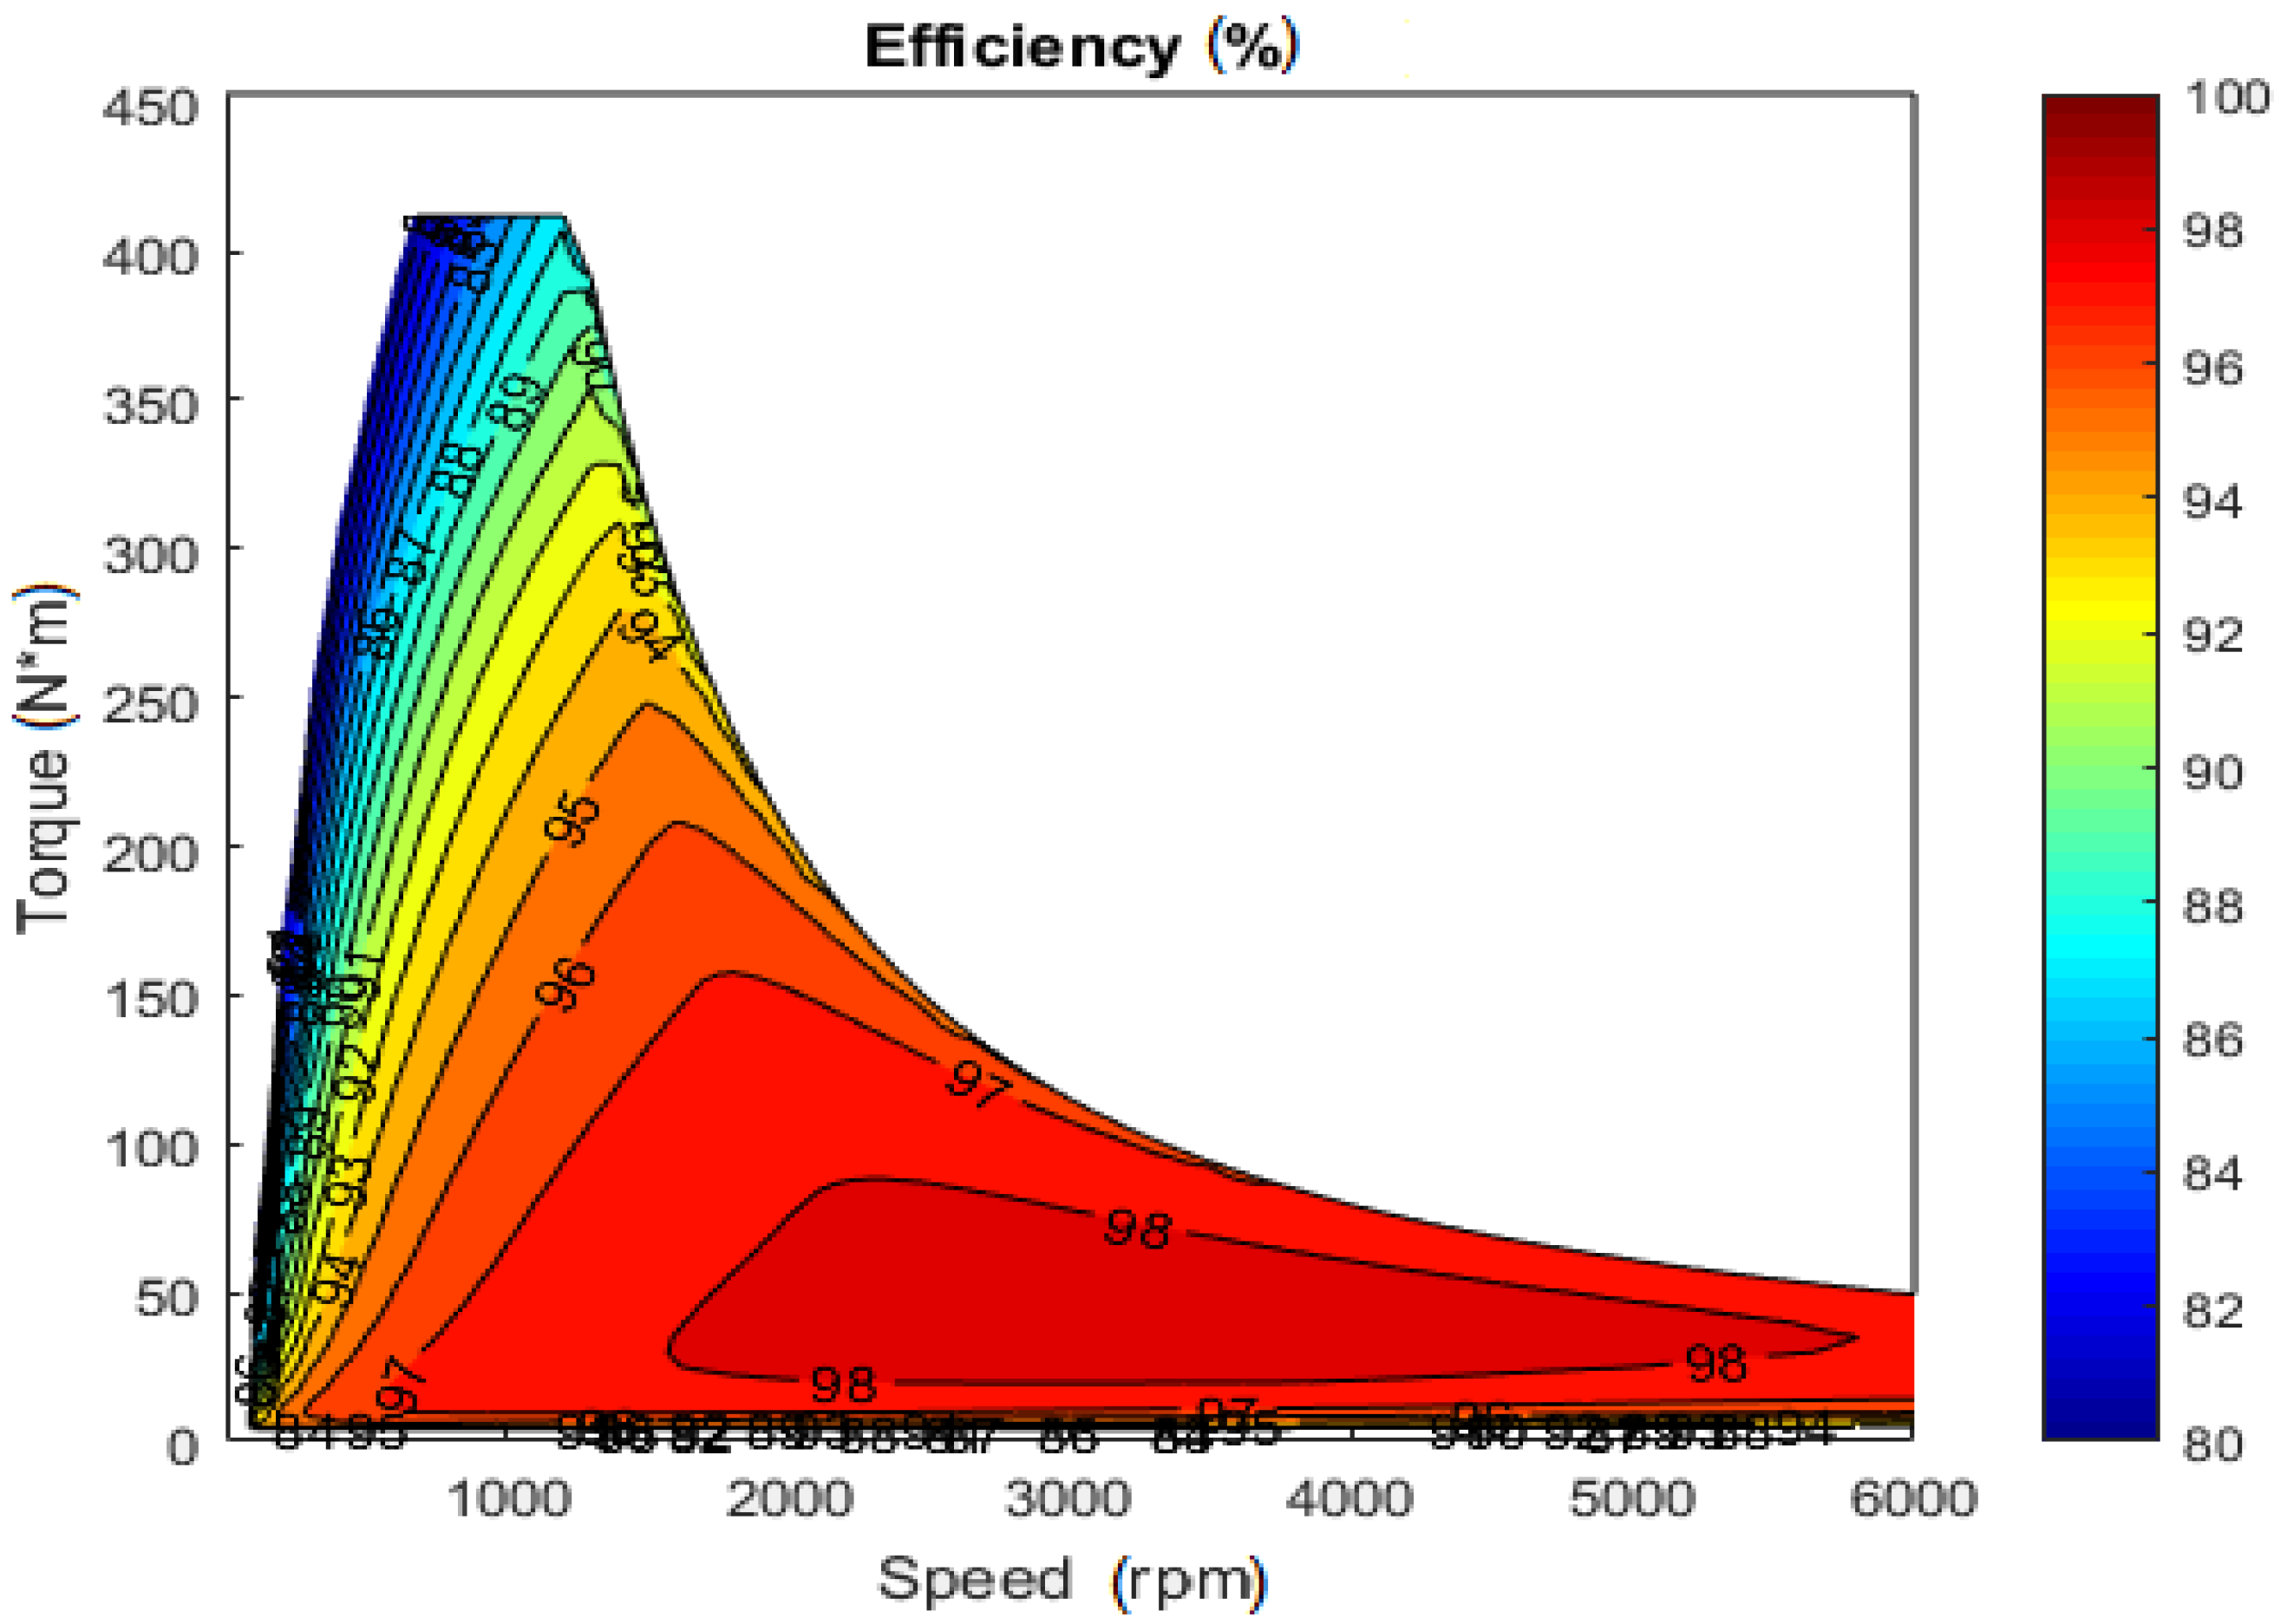
Figure 10. The efficiency map is a contour plot representing the maximum efficiency that can be obtained for specific values of speed and load torque. The efficiency map is usually shown in speed-torque coordinates, with the X-axis being the rotor speed and the Y-axis representing the torque of the machine.
Figure 11 shows the efficiency map for the Prius motor generated by the MotorAnalysis-PM software over an entire speed and torque range (only efficiencies over 80% are shown).
Calculation of the efficiency map is computationally expensive since it requires multiple iterations for every speed-torque pair to find the optimum operating point while considering the constraints of inverter voltage and current limits [
33,
34,
35,
36]. To speed up the efficiency map computation, MotorAnalysis-PM uses the analytical steady-state d-q model previously parametrized with FE simulations. This advantage allows the efficiency map to be generated in a matter of few minutes. For instance, the motor efficiency map (
Figure 11) with 579 points is generated in 33 minutes with MotorAnalysis-PM (Intel Core i7 2.7 GHz CPU and 16 GB RAM). This is significantly faster compared to commercial FE software packages where many hours or days are necessary to compute the motor efficiency maps and expensive computational resources are necessary for this numerical process [
33,
34,
35,
36]. For example, Delafosse et al. utilized ANSYS Maxwell software to compute the efficiency map for the same Prius PM motor presented in this paper using 2-D FE simulations [
33]. An efficiency map with 250 points was computed in 2 hours and 19 minutes using a single core and the same efficiency map with 250 points was obtained in 17 minutes using 10 cores [
33]. Dlala et al. employed ANSYS Maxwell software to compute the PM motor efficiency map with 400 points in 3 hours using 4 cores [
34]. Finally, from references [
33] to [
36] one can see that in some commercial FE software packages where the efficiency map is calculated solely based on FE simulations, the efficiency map calculation requires significantly more time compared to MotorAnalysis-PM, where a combination of FEM and analytical models are utilized to speed up the simulation process. Furthermore, some commercial FE software packages require purchasing additional licenses for the use of several cores which makes the analysis and designing process even more expensive [
37].
5. Verification with Experimental Results
The FE simulation results of the Toyota Prius 2004 PM motor obtained with MotorAnalysis-PM are validated using the experimental data published in [
19,
20,
21].
Figure 12 shows the comparison of simulated and measured peak values of the back-EMF. Numerical results are generated by MotorAnalysis-PM by using time-stepping magnetostatic FE analysis with 200 time steps. Since the stator current during the test is zero, the rotor is heated by the friction and steel core losses in the stator from the rotating magnetic field of the rotor. The temperature of the PMs during the back-EMF test is not reported in the experimental study, and only the oil temperature range of 25–80 °C is available [
19,
20,
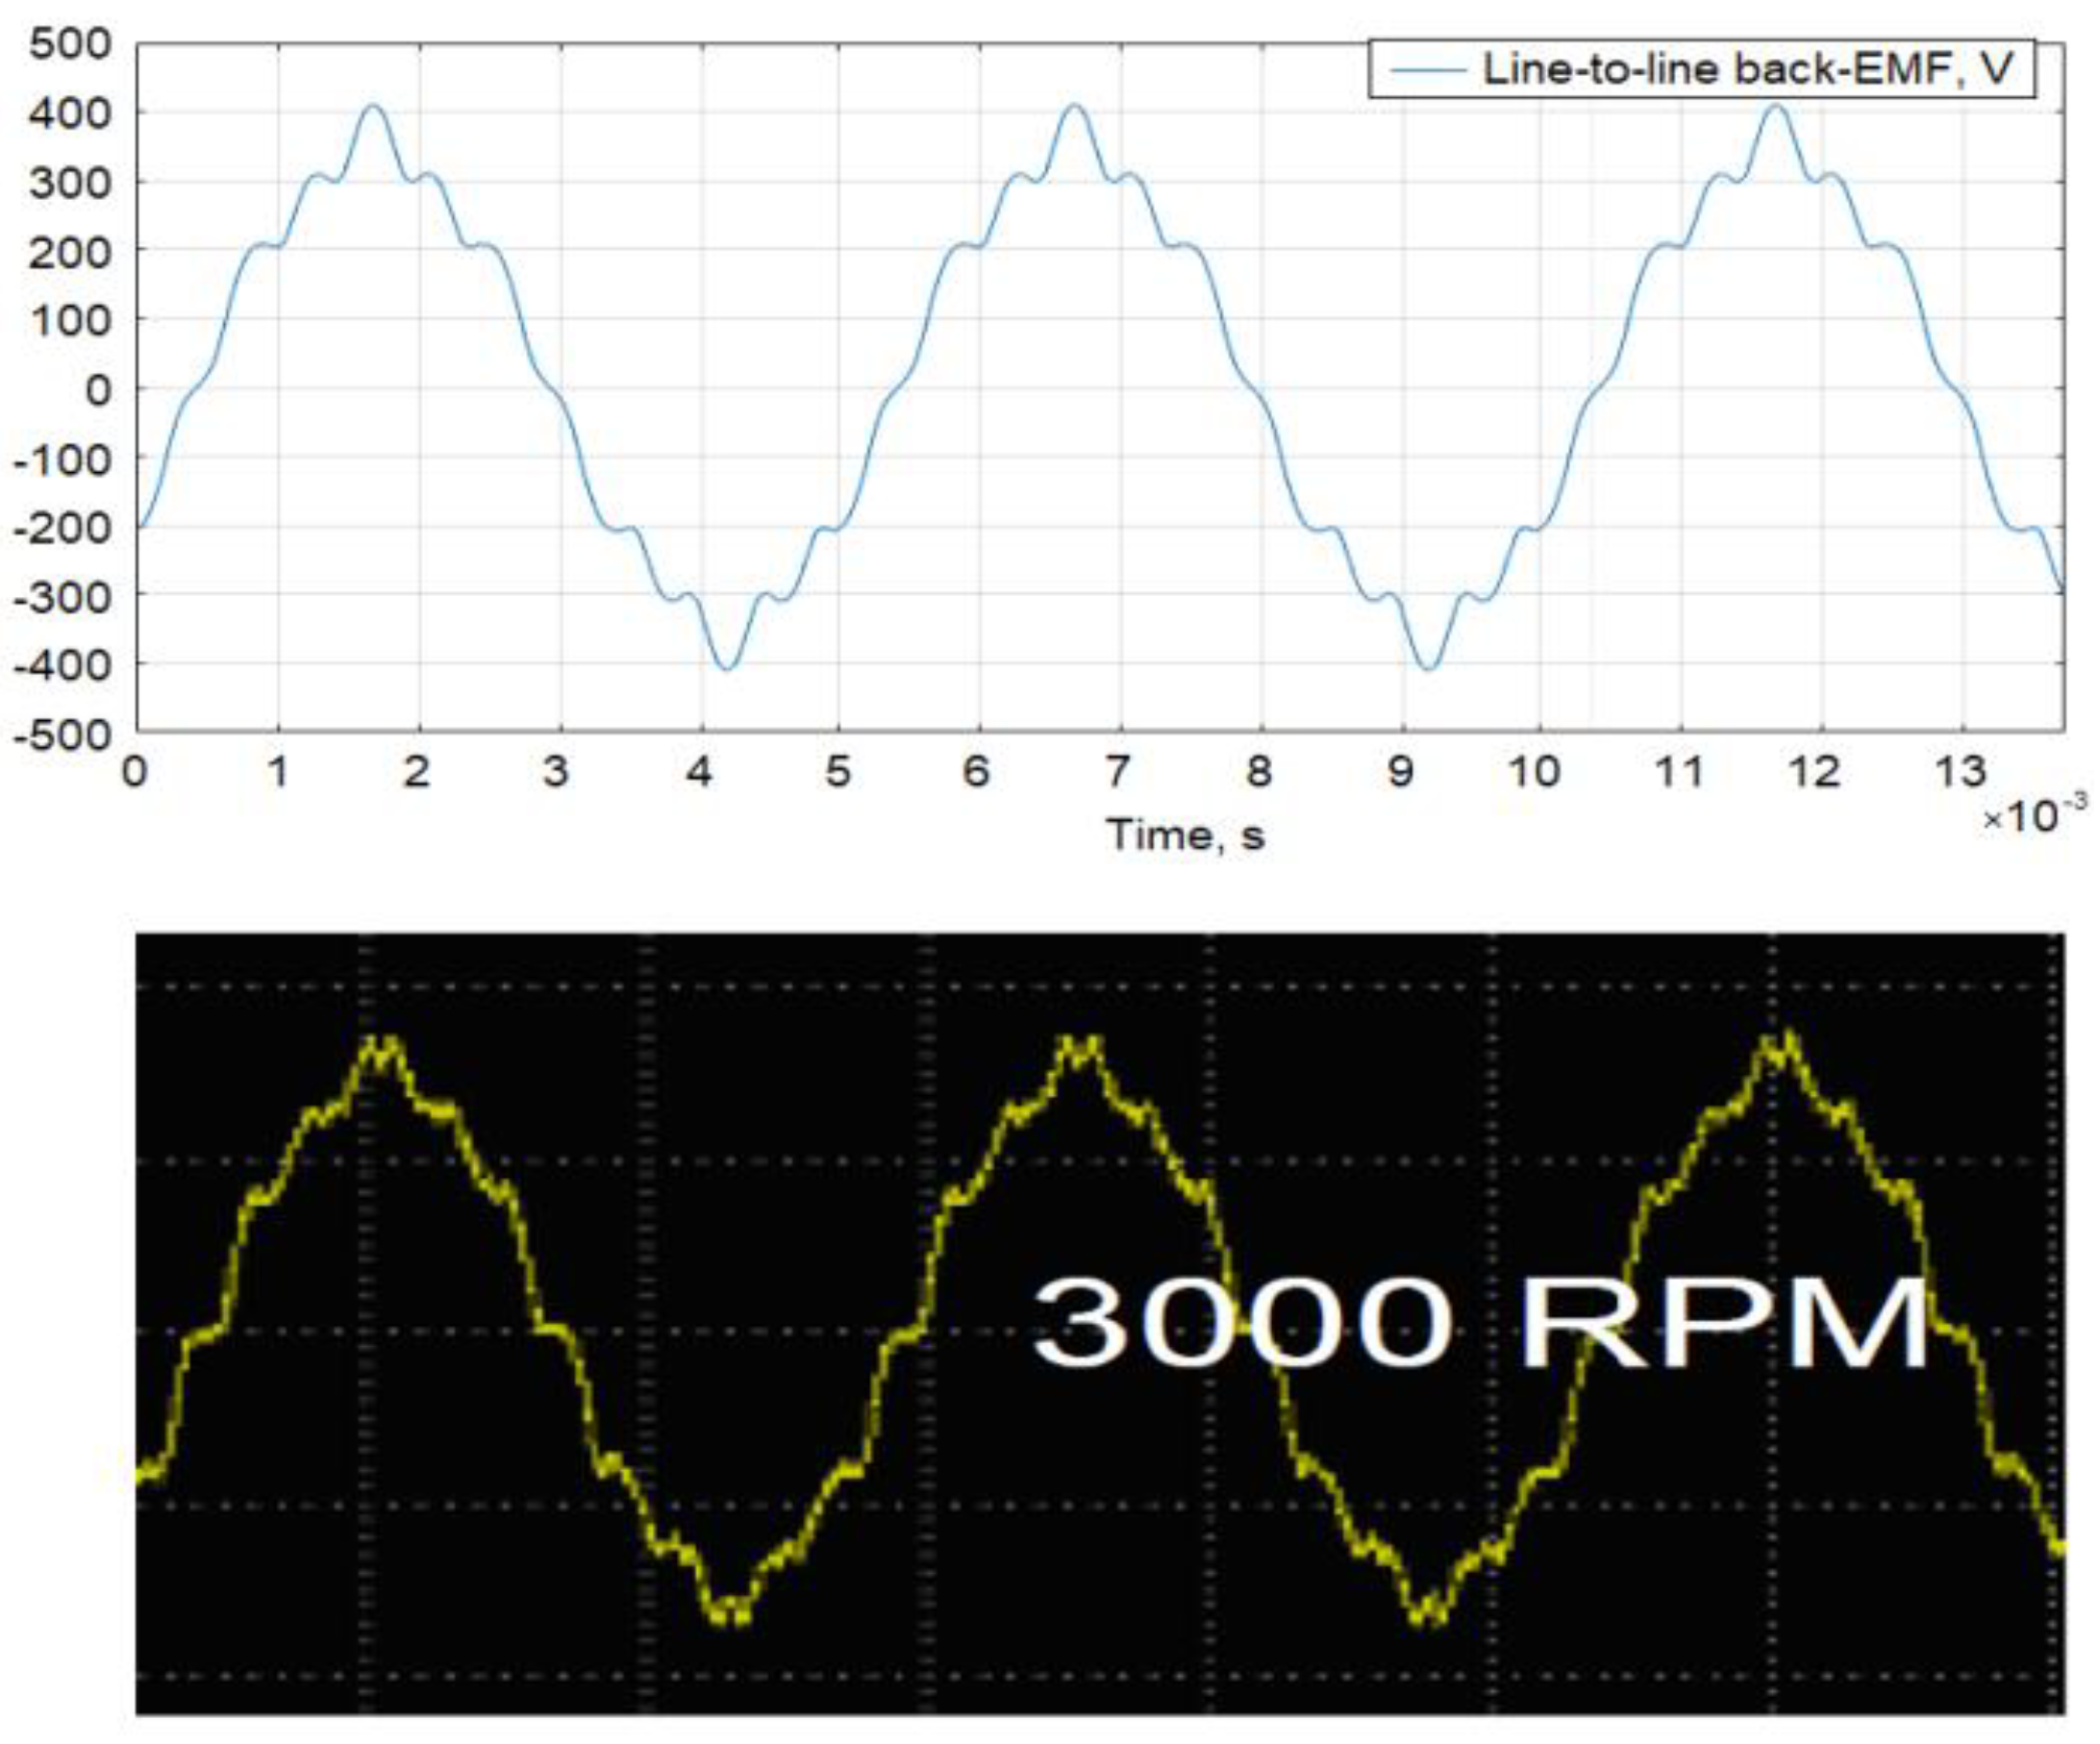
21]. Authors assumed that the PMs have the same temperature as the oil, therefore, the simulations are carried out for magnet temperatures of 25 °C and 80 °C. As can be seen, the experimental peak back-EMF characteristic is positioned exactly between the two simulated peak back-EMF lines. For lower speeds, the measured data are closer to simulation results corresponding to 25 °C while for higher speeds it is closer to the simulation results obtained for 80 °C. Comparison of the simulated and experimental back-EMF waveforms for 3000 rpm is depicted in
Figure 13, which shows good correlation between the simulated and measured data.
Figure 14 compares simulated and experimental torque curves. Measured torque versus rotor position curves are obtained from the experimental locked rotor test carried out for seven peak current values in the range of 50–250 A. Corresponding simulated torque versus advance angle curves are generated by d-q analysis of MotorAnalysis-PM for the same current values. It is observed that both simulated and measured torque curves follow the same trend with maximum values observed in the same range of advance angle. The distortions of the experimental torque curves are caused by the slotting since the torque is measured for stationary rotor with different rotor positions. For the simulated curves, the torque is measured with rotating rotor and, therefore, the slotting effect is not visible. The slight discrepancy between simulated and measured curves can be attributed to the change of the PM properties due to the variation of temperature during the laboratory test, while for the simulation a constant value of 80 °C is considered for the PM temperature.

 ,
, 


