Abstract
In this study, we tried to combine maximum power point trackers (MPPT) and «Extremum Seeking» in a single multi-parameter extremum seekeng system for orienting solar panels and draw attention to the problem of a deeper study of nonlinear adaptive control using appropriate methods for their analysis. MPPT controller becomes one of the extremum seeking loops, and as a result, the maximum power is achieved not only by searching for the optimal voltage value, but also due to the optimal angular position of the solar panel in Euclidean space, because the photocurrent depends on the angle of inclination of the Sun’s rays to the surface. The task of tuning extremum seeking loops becomes more analytically difficult, which is associated with nonlinear and multiply connected properties. This requires starting the solution from a simpler “linear” level. We applied the approach associated with the passage of modulating oscillations with a given frequency and amplitude through an open-loop system. This approach, which is generalized in this work at least for extremum seeking of the solar panels power, should be used for approximate calculations if there are no strict requirements for convergence and energy loss for the search. Research design is as follows: parametric identification of the current-voltage and volt-watt curves; obtaining the transfer function by the semi-automated sparse matrix method; reducing the order of the transfer function of coordinate electric drives by introducing a scaling factor. To the most important theoretical result, we attribute the property of the generalized amplitude of the solar panel power oscillations with multi-parameter control to be a combination of input modulating oscillations superimposed on the signals of the control integrators. Having revealed the relationship of their properties, it becomes possible to eliminate non-linearity from the system and operate only with the analytical relationship of the input modulating oscillations and the generalized oscillation of the controlled parameter. We attribute the prediction of the effect to one of the most interesting physical results, in which, for the same amplitude of modulating oscillations, the amplitudes of the photocurrent oscillations and the power of the solar panel at different angular positions will be generally different.
1. Some of the Most Important Aspects of the Problem
Non-classical control systems and methods for their study begin to play a significant role in the development of new solar cells orientation systems [1]. In this case, one often has to deal with nonlinear control methods, and sometimes questions arise about which methods to use for research. The orientation systems of solar cells perform a very specific function, which naturally imposes an imprint on the appearance of the entire energy complex. These features include the need to search for the point of maximum energy efficiency [2], fixation at this point and ensuring tracking in the inertial coordinate system when the maximum drift. This circumstance complicates the requirements for the control of coordinate electric drives and forces the use of some special control structures. These include, for example, perturbation-based extremum seeking.
On the basis of the simplest principles of extremum seeking [3], so-called MPPT-controllers, the development and research of which occupies a very large place in the scientific world. Thus, according to some bibliographic databases, over the past 15 years, about 4000 papers have been published on MPPT controllers, including brief reports, reviews, results of theoretical and experimental studies, discussion questions, and reports at conferences. From various sides, the elements of these works are generalized in reviews [3,4,5,6,7,8,9,10,11,12,13,14,15], analytical and experimental studies [16,17]. The number of data on MPPT-controllers continues to grow, up to the most exotic, associated with the use of artificial intelligence [6,9,13].
Orientation systems for solar panels are not inferior in the number of articles published on MPPT controllers. Since 2012, more than 4000 articles a year have been published. The most valuable information is concentrated in the reviews [5,18,19,20,21,22,23,24,25,26,27]. Such a huge number of publications is a certain problem in itself, but if we talk about the “technical side” of the issue, then the research directions of MPPT controllers and solar cell orientation systems do not fit together well. In our opinion, all MPPT controllers have one significant drawback: they are able to find the maximum power under limited conditions, namely, only by finding the “optimal resistance” of the electrical circuit where the load is connected, so that the current and voltage work gives the desired result [4]. In that case, if the solar panel is not oriented to the Sun, the maximum power generated also exists, but it is noticeably lower. From this it follows that there are, in fact, two extremum merged into one: First extremum is maximum irradiance (to reach it, you need to find the optimal angular position), and Second extremum is associated with the presence of maximum power on the volt-watt curve. We will not dwell on MPPT controllers in detail, because data we are interested in, in conjunction with what was said above, lies in the field of structure design principles, methods of analysis and synthesis of multiparameter systems of extremum seeking, but here, contrary to our desire, there is not much data on the orientation systems of solar cells.
Three large monographs [28,29,30] are devoted to presenting a special mathematical background to extremum seeking [28], to an extensive description of various applications [29], and to some special issues within the framework of stochastic control systems [30]. There are also some interesting works on the use of extreme control for laser complexes [31]. The formation of the angular position of the object, based on [28], is considered in [32].
Extremum seeking control systems have a number of special features:
- The requirements for the quality of transient processes are rarely imposed on closed search engines. The main requirement is the convergence to the minimum/maximum point as fast as possible (studied within the framework of asymptotic stability [28,33]), which is determined by the parameters of the extremal control loops, as well as by the amplitudes and frequencies of the modulating signals.
- The multiparameter system of extremum seeking has the properties of multiply connectedness and requires the use of nonlinear methods of analysis (some of them were mentioned in the annotation, as well as in [28]).
- Introduction to the system of a nonlinear element, which is difficult to reduce to a simple quadratic function with displacement along the axes of the abscissas and ordinates [34], increases the complexity of the exact analytical studies and does not allow them to be made by direct paths.
Multiparameter systems in this regard are much more complex and need a special approach. The perturbation-based extremum which is now at the forefront of the interests of researchers has not yet been used to orient solar cells, although it is one of the most well-developed structures of control systems. For example, the foundations for the study of multiparameter systems were obtained in [35] and [36]. Their results were for plants with constant parameters, which cannot be said about solar system orientation systems.
We accepted the hypothesis that, if we introduce a number of simplifying assumptions, and also consider the special structure of compensators, it becomes possible to open the system and calculate the amplitude of the modulating oscillations of the solar panel power. This amplitude is a common input for any number of extremum seeking loops. Further, if the influence of master integrators on the input modulating signal is minimized, then the system, being closed, can provide the allowable amplitudes of the azimuth and zenith drive movements and the convergence of the algorithm to the point of maximum energy efficiency. Hence, the determination of the amplitude of the solar panel power fluctuations, the calculation of the required amplitude of the signal at the output of the master integrator, as well as the frequency and amplitude of the input modulating signals is the task that we will consider next.
We list some of the problems that we had to face.
1. The problem of determining the parameters of the solar battery for calculating the current-voltage and voltage-watt curves. As will be shown in the theoretical section, from the mathematical description of the solar panel, when trying to make the volt-watt curve pass through three modes of operation [37] (short circuit point, maximum power and open circuit), the system of equations should help in solving this problem—it turns out to be formally insoluble without accepting certain simplifying conditions [38]. (This is one of the most important issues, incl. when developing control systems—how to calculate the most relevant reality parameters of the control object?). This problem can be circumvented by studying simpler laws in the region of extremum, for example, models of quadratic functions with regard to drift [28,34]. Simulation in SIMULINK was proposed in [39,40], but they are difficult to apply in practice. In [41], new assumptions were introduced based on the current fact that, under different regimes, one or another component that makes the system unresolvable does not affect numerical calculations. We also used this approach in our work.
2. Dynamic simulation of a solar panel. Most of the existing models describe static power modes of solar cells [42], or dynamic thermal modes [42,43], which complicates the study of dynamics. Using [44], one can construct an approximate dynamic model of a solar panel. Dynamic modeling is complicated by the fact that not all of the required additional data are available in the literature. Thus, in [44], the values of diode dynamic resistance Rd(V), diffusion capacitance Cd(V, ω) and transition capacitance Ct (V) were determined by the method of impedance spectroscopy. For simplicity, we took the averaged values from the data available in [44], and a simple calculation of the cutoff frequency showed that it is large enough to consider the solar panel as an inertia-free gain with a variable value of load resistance Rreg, which is the control channel MPPT controllers.
3. The problem of accurate analytical research. A reflection of this difficulty is the question of how to simplify the system for analytical and accurate research, or what methods to use for this. The transfer functions of objects of extreme control can have a high order (2, 3, ..., 8, etc.). It is not difficult to imagine what the order and bulkiness of exact analytical expressions will be.
If we used the methods of nonlinear identification of objects (recurrent polynomials, etc.), then the problem would not be simpler. This is easy to see because a linearization at the operating point would be required, which could also lead to a high order of the transfer function. To describe the entire nonlinear object by a linear link is generally impossible due to the extremes of the characteristics in static modes.
This problem becomes especially difficult when considering closed systems. Here this problem will be discussed in sufficient detail, since understanding its various aspects is important not only for understanding the difficulties of this theory, but also for evaluating its various parameters.
In part, the severity of the problem of accurate analysis is mitigated by the fact that the effects associated with complex non-linearities and high orders of the transfer function can be eliminated by introducing compensators into certain channels of extreme control [28].
4. General nonstationarity of system parameters and, as a result, locality of its configuration.
The problem of developing systems has another aspect that will also be important for us in the future. Namely, the variability of the amplitude of the photocurrent oscillation with a constant amplitude and frequency of the modulating signal. It is clear that such an effect, especially in the case when, when tuning the system, we operate with its frequency characteristics, cannot ensure the constant tuning of the parameters in the whole range of variation of the azimuth and zenith angles, at least due to the fact that with different combinations of initial and required rotation angles, the photocurrent amplitude will vary. In this case, it is possible to introduce an error into the modulated signal from the control integrator, which may lead to the impossibility of the system to switch to a new state. Finding a sufficiently effective algorithm to combat this phenomenon is still difficult. The corresponding problem will be considered by us in further work.
The list of problems could be continued, but we limited ourselves to those that are relevant to the main topic of this article. The main attempts to solve them, summarizing the above, are related to:
- with the construction of methods for calculating the parameters of the solar panel using elements of special functions (for example, the Lambert function);
- with accurate dynamic models on their basis that allow us to evaluate the dynamics of the reaction of voltage changes to changes in photocurrent when the angular position changes during modulation.
All these problems can be completely or partially solved in the scenario we propose, which will allow us to begin the study of complex nonlinear systems of extremum seeking in the framework of linear analysis by calculating the reference parameters of the modulating signals and then move on to more complex research methods.
The article is organized as follows; In Section 2, we look at theoretical aspects, basic formulas, and relations. Section 3 discusses the results of the calculations and the corollaries of them. In Section 4, we briefly describe possible discussion questions. Finally, the conclusions are set out in Section 5.
We now turn to the theoretical description of the solution to the problem.
2. Solar Battery—Multiparameter Object of Extremum Seeking Control. Parametric Identification of the Voltage-Current and Volt-Watt Characteristics of the Solar Panel in an Analytical Way
For the parametric identification of the volt-ampere and volt-watt characteristics of the solar panel in an analytical way, we settled on a single-diode equivalent circuit of the solar panel [41,45], which determines all further analytical calculations. This scheme is used in most studies [39]. A more detailed description of this circuit can be found in [46]. The diode determines the nonlinear properties of the I–V and V-P cell characteristics. Known two-diode [41] equivalent circuits are redundant. Diode models of higher orders [47] are used in global extremum search tasks for maximum power points.
In this statement of the problem, the solar panel is a current source, in parallel with which a diode D and a shunt resistor Rsh are connected, as shown in Figure 1 [46] (p. 40). Resistance Rs is the series resistance of each cell.
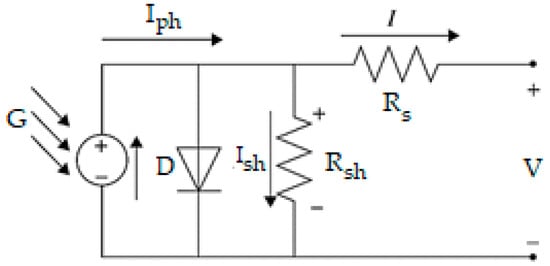
Figure 1.
Equivalent photocell circuit diagram.
An important point in the analysis of multiextremality is an indication of the dependence of the produced photocurrent on the magnitude of the radiation intensity GexH, falling onto the surface of the solar panel (and increases with increasing temperature of the solar cell):
where GexH—extraterrestrial solar radiation on the surface irradiance, Wt/m2; G0—irradiance at the standard test conditions (STC) (G0 = 1000 Wt/m2); —current growth factor versus temperature [39]; —difference between ambient temperature and temperature under standard test conditions (STC) = 25 °C.
From Equation (1) it can be seen that the ratio between GexH/G0 affects the production of photocurrent , i.e., if GexH = 0, the solar cell is inactive and produces neither current nor voltage. However, if light hits a solar cell, it generates a photocurrent Iph.
Using the first law of Kirchhoff it was established [45], that the current of the solar panel is a difference between photocurrent, and diode current . At STC the cell current is determined by the well-known dependence [41,45]:
where a priori constants: —photocurrent produced at a given angular position and the existing level of irradiance G, А; —electron charge, C; k—Boltzmann constant, ; T—cell temperature (at STC = 25 °C + 273 = 298 K).
Parameters determined by the results of experiments or analytical calculations:
—diode saturation current, А; —series resistance, Ohm; —shunt resistance, Ohm; n—ideality factor, for different types of semiconductors takes on values from n = 1.2...5 [39] (p. 2);
These parameters significantly affect the efficiency of the photocell and photovoltaic module. This expression determines the current-voltage characteristics and the input current of the solar battery (P = V × I), therefore, to calculate it, you need to know the parameters , , , n, etc.
Their accurate determination allows us to reflect the volt-ampere and volt-watt curves with the smallest root-mean-square error, which many researchers are striving for [41,48,49]. In [37], as well as in [41,46], these parameters are calculated based on the conditions that when modeling, a solar panel must accurately reflect the three characteristic modes of operation of a solar panel:
- Short-current mode (V = 0; I = Isc);
- Maximum power point mode (V = Vmp; I = Imp);
- Open-circuit mode (V = Voc; I = 0);
The modes of short-circuit and open-circuit are the boundary conditions when calculating the volt-ampere and volt-watt characteristics.
By substituting these conditions in Equation (2), we obtain a system with three transcendental equations [39,41]:
where —short circuit current, Аmpere; and —current and voltage at the point of maximum power, Аmpere and Volts, respectively; —open-circuit voltage, Volts.
This system of equation is an implicit transcendental equation and contains a number of parameters: Rs, Rsh, I0, etc., which should be as close as possible to those specified by the manufacturer of the solar panel. This requires finding the exact analytical solution to the system of Equation (3), which has not yet been discovered due to unsolvable recursive relations. Since in Equation (3) there are quantities of different orders, among them are small quantities, after neglecting which the task is simplified so much that its exact solution is possible. In this case, the first step in solving the problem is to accurately solve the simplified problem. It should be noted the peculiarity of this class of models, namely, that any simplifying assumption makes a system with 3–4 free parameters from the I–V characteristics and P–V characteristics. Thus, it becomes possible, due to the selection of these parameters, to ensure that the I–V and I–V characteristics pass near the characteristic modes, but these parameters will be far from those set by the manufacturer (see Appendix A). After analyzing the structure of the system of Equation (3), as well as the data provided in [41] in more detail, we came to the following conclusions:
- Difference between the photocurrent Iph and short-circuit current Isc, determined by the ratio through the value (Rs+Rsh)/Rsh [41], is 0.007–0.3%, therefore, it is permissible to take Iph = Isc.
- From this it follows that from the third expression of the system of Equation (3), we can get the formula for calculating the saturation current of the diode:
- Term can be decomposed into two components . Due to the fact that , it is permissible not to take into account the variable component . Difference between and = 0.108…8.805%, therefore, at the point of maximum power can be ignored.
- At the maximum power point, according to [50], voltage derivative versus current
This allows us to represent the system of Equation (3) taking into account (4) in the following form:
where we get:
Attention should be paid to the fact that the ideality factor n needs to be adjusted in such a way that the characteristic at the maximum power point is as close as possible to the true characteristic. It is clear that the smallest difference will be at n = nideal (this will be shown in more detail in Appendix A).
Obviously Rs > 0 and Rsh > 0. Solving Equations (6) and (7) as inequalities, we can find the range of variation of n at which these conditions are observed:
where W(−1,~)—negative branch of the Lambert function;
To calculate I–V or I–V characteristics in the indicated boundary conditions (between short-circuits and open-circuit modes), Equation (1) is transformed to the non-recursive form and expresses the direct dependence I–V (P–V, if multiply by V):
where W(0,~)—Lambert function with the main axis;
In the Results section, calculations by formulas (6)–(8) are presented, as well as I–V and P–V characteristics are calculated by formula (9).
Let us return to the question of the intensity of solar radiation. The extraterrestrial solar radiation GexH on the surface in the selected geographical location can be calculated as [46]:
where —extraterrestrial radiation, Wt/m2;
Calculate the incidence coefficient ξ for a surface oriented in any direction (in °s) [51]:
where θ is the slope of the surface measured from the horizontal plane; γ is the surface azimuth rotation angle, measured from south to the projection of the surface normal on the horizontal plane, positive or negative if oriented west or east from south; Θ, Γ—Topocentric elevation angle (TEA) (corrected) and Azimuth angle (AA) (eastward from N) of the Sun.
Investigate the function on the extremum on the standard intervals and . Rewrite Equation (11) in the form:
Partial derivatives for each of the adjustable coordinates of the drives θ and γ (Solving the system of these equations for θ and γ at intervals and , we obtain critical points θ = Θ and γ = Γ.):
To determine the nature of the extremum, we find the Sylvester coefficients [52]:
For θ = Θ and γ = Γ we get:
By Sylvester’s criterion [52]:
obviously, at the specified interval and . , and , so with equalities θ = Θ and γ = Γ such a position of the solar panel in space is the global maximum point for ξ on a typical interval.
In this case, the drive is considered to be oriented exactly at the Sun. When this condition ξ = 0, i.е., cos(ξ) = 1.
Assuming that the photocurrent component, depending on the level of the ratio of the current irradiance and irradiance at STC, fits well into the structure of Equation (1), rewrite it in the form:
The resulting formula characterizes the photocurrent generated by the solar panel, not only dependent on V, but also on , i.e., from the angular position of the panel in euclidean space.
From this it follows that the system for searching for the maximum power of a solar panel must be three-parameter, and . Now, we will consider the general principles of construction and synthesis of parameters of a multiparameter and multiply connected system of extremal control. The block diagram developed for our case is presented in Figure 2:
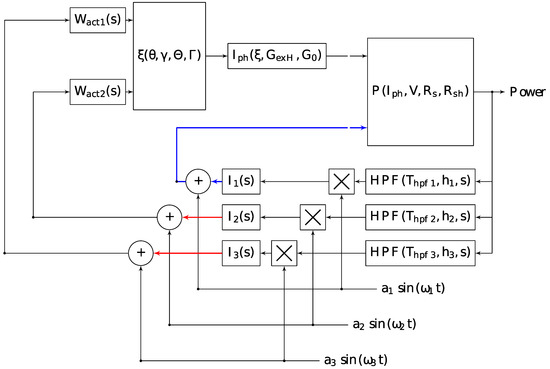
Figure 2.
General extremum seeking control structure for Sun tracking system. Red line is the place of “open” of a closed system. Blue line is the outline of the MPPT controller.
In our case, the perturbation based extremum seeking control system is included [28] (p. 4):
- Solar cell (nonlinear element with extreme characteristic);
- High-pass filter (HPFi);
- Demodulator multiplier;
- Master integrator Ii with gain ki;
- Modulating summator;
- Two high-speed coordinate electric drives Wact_i, tuned to a symmetrical optimum with an additional integral element for converting speed (rad/s) into a rotation angle (rad).
Various compensators are included in the master integrator or high-pass filter scheme [29]. Since the contours of the extremum seeking are implemented by software, we will change the position of the compensator, namely, we will install it after applying the modulating signal to the signal of the master integrator. Thus, before the signal is applied to the coordinate electric drives, the signal will pass through the specified compensator.
Dynamic compensator can be represented as a generalized inertial differentiating link [53]. This compensator may have any suitable structure. An acceptable structure should be understood in accordance with the recommendations for multiparameter systems of extremum seeking [28,29], such that it eliminates the influence of unstable (non-minimal phase) links, and the order of the numerator is less than the order of the denominator, i.e., transfer function if strictly proper.
In our case, the system is assumed to be stable, the coordinate electric drives are tuned to a symmetric optimum. The integrating element in the transfer function is designed to convert angular speed to the angular position:
where —a small non-compensable time constant (usually equal to the time constant of the voltage converter), is assumed to be 1–5 ms.
Formula (18) is the transfer function of the coordinate electric drive. It consists of a high-speed electric drive; tuned, it is a symmetrical optimum with a transfer function and integrator part , which convert speed (rad/s) into a rotation angle (rad). The input for the axis drive is the compensator signal , which we introduce as a corrective element in series with the transfer function of the coordinate electric drive in front of it (at the output of the integrator with the modulating signal) (Order 4 ensures correctness of the transfer function in accordance with the recommendations [28]):
where Thpf and h are time constant and high pass filter constant.
Formula (19) is the transfer function of the compensator. It consists of the denominator of a speed electric drive tuned to a symmetrical optimum , and the numerator has the form . The input for it is the signal of the control integrator, and the output, respectively, is the reference signal for the rotation angle.
After the abbreviations, we get the transfer function of the coordinate electric drive:
Transient process of transfer function is determined by the inverse Laplace transform as:
when the denominator degree order of the of the transfer function of the object is n ≥ 2 these functions have an extremum at the point t =, where is the time constant of the basic object of the first order (n = 1) transmitted to all other links. This means that if we find the derivative:
Furthermore, equating to , we decide for t, then we get:
Impulse characteristics according to Equation (21) coincide at t = T with = 0 only if the time constant is chosen according to Equation (23).
We reduce a high-order object to a low-order object (here we mean passing the transition function through a characteristic point for an object of a lower order). Adjustment, that is, bringing a high-order object to a lower object, is done by introducing an additional gain-scale factor for a low-order object that is determined by the formula:
And :
This gives a good similarity between the two objects only in the time domain (see Figure 3b). In the frequency domain, which determines the performance of the system of extremum seeking, the discrepancies will be especially noticeable in the high frequency range of the order of ω > 100 rad/s. Because these frequencies are not applicable for testing as reference signals, we will not take this fact into account, but let us take into account that in the areas of ω < 100 rad/s the frequency characteristics of the objects are approximately equal. Therefore, the adjustment of the system of extremum seeking for objects of higher order can be made on the basis of an analysis of a lower order object when these conditions are met (in our case, n = 4 → 2, see Figure 3a,b).
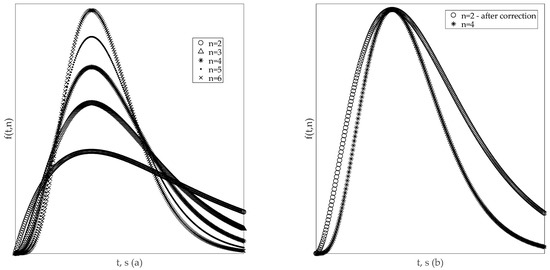
Figure 3.
Different impulse characteristics of (a), and impulse characteristics of n = 2 and n = 4 objects after corrections in time domain (b).
If we make system open-loop at the point between the output signal of the electric drive (angular positions) and the solar battery, we get an open-loop system, which is conveniently used to calculate the amplitude and frequency parameters of the modulating signals as follows.
Suppose that the angular influences on the position of the solar panel change with a strictly specified amplitude (They can be determined from technological or other requirements). Passing through the formed open circuit along the chain on Figure 4:

Figure 4.
Open-loop general system.
It can be seen that the output of the integrator will be a signal of some amplitude (weakened or amplified depending on the properties of the system and the structure of the compensators). In our system, it is assumed that the signal will weaken with increasing frequency.
When determining the amplitude of oscillations incidence coefficient ξ defined by the formula (12), it is convenient to decompose this equation into two components:
Investigate the produced oscillations and at the output of the corresponding term under the influence of the amplitude of the signal A.
Empirically, certain characteristic ranges were determined, which allow to determine the maximum and minimum fluctuations distributed along the chain on Figure 4.
These conditions for the first term of Equation (26) are determined by the formulas:
Calculation of similar produced oscillations for the second term is more difficult because it is parametrically dependent on a combination of 4 angles: 2 angles of the Sun Θ and Γ and 2 angles of rotation of the drive θ and γ. Table 1 lists these empirical conditions.

Table 1.
The conditions by which the lower and upper boundaries of oscillations of the second term of Equation (16) are calculated.
Change in the amplitude of oscillation incidence coefficient is determined by the formulas:
This formula is in good agreement with the results of mathematical modeling. As will be shown in Section 3, the surface of the amplitudes, depending on the different combination of the angles of the Sun and the angles of rotation of the coordinate electric drives, has a nontrivial topology, which determines the non-stationary properties of the entire system. Herein lies the detected effect: when overlaying modulating frequencies on the azimuth and zenith electric drives reference signals, the photocurrent runoff will not be a constant value with constant amplitudes and frequencies of the modulating signals.
The amplitude of photocurrent is determined by the following formulas:
To determine the amplitude of the voltage fluctuations at the output of the solar panel, we use the equivalent dynamic electric circuit, which is shown in Figure 5 [44] (pp. 1–2).

Figure 5.
Equivalent dynamic electrical circuit for photovoltaic (PV) module ([44]).
To reduce the analytical calculations, we used a semi-automated method for obtaining the transfer functions of an electrical circuit using sparse matrices. The method was published in the preprint [54] and was initially applied to chains with passive elements. It turned out that this approach can be used for circuits and with reactive elements, as well as to obtain the entire set of transfer functions describing the currents and voltages of an electrical circuit for all components included in the circuit. Note that the parameters CD, CT and Rd are unknown. The values of these parameters, obtained using impedance spectroscopy, are given in [44]. As will be shown, if the actual values of the capacitance CD, CT s and differential resistance Rd have approximately the same numerical order, then the solar panel can be represented in the form of a proportional link with an adjustable gain factor in the Iph→V transmission channel.
Each scheme is a directed or undirected graph. We collected the circuit in MicroCap to get the so-called “netlist”, which is presented in Table 2.

Table 2.
Netlist for scheme on Figure 4 from Microcap.
The sparse matrix method is as follows. Compiled matrix equation of the form [54]:
where A—reduced incidence matrix of an electrical circuit without a string corresponding to a zero node:
0,1—zero and identity matrices; M—source matrix, in which elements on the main diagonal are formed according to the principle “if the element is a current source, then 0, if the element is a voltage source or not a power source at all, then 1”;
N—matrix of passive and reactive resistances of elements;
e, v, i—unknown vectors of nodal potentials, voltages and currents on the elements; uis—vector of known values of voltages or supply currents (V or A).
From matrix Equation (33):
From the vector transfer function (35), the transfer function of the system from Iph to voltage V:
As calculations show, time constant of this transfer function at the level of 10−7 − 10−6, which allows us to represent the solar panel as a non-inertia gain from Iph to voltage V:
The boundary values of determine the range of oscillation (amplitude) of power at the output of the solar panel, taking into account the fluctuation of the photocurrent (The reference value should be selected by the values , and
Resistance should be assumed so that the maximum power output on the load is determined. A sign can only be positive. As a result, the effective value taking into account the required amplitude, is converted into an auxiliary control channel, through which all modern MPPT-controllers operate.
Consequently, the range of voltage variation will be determined using formulas (6), (7) and (32), (37) in this way:
Maximum and minimum power values at the current angular position of the solar panel and the resistance value Rreg:
Whence the amplitude of power fluctuations at the output of the solar panel during the operation of the system of extremum seeking:
Thus, we can calculate the amplitude of the power oscillation, which is the input signal for all three extremum seekeng loops (According to all known schemes [19,28], and also taking into account the option of opening the system adopted by us, the extreme control loop will include a high-pass filter, a modulating multiplier and a master integrator. The modulating multiplier is approximated by a proportional link, the gain of which is determined by the sign of the half-wave of the modulating signal). If we assume that the amplitude of the power oscillations is set, and the amplitude of the oscillations of the reference signal also has a specified value, we can calculate, based on some requirements, the frequency of the input modulating signal, which will give the desired power fluctuation, but will not greatly influence the amplitude of the modulating oscillation signal. This is quite consistent with the recommendations from [28] and from [29], according to which the amplitudes of oscillations should be chosen in such a way as to obtain small deviations of the output signal. When replacing and decomposing the following expression into real and imaginary parts (Note the similarity of the denominators of the transfer functions of the high-pass filter and the compensator . This simplified the calculations and allowed for accurate analytical studies.):
where —permissible according to technological limitations, the amplitude of oscillations of the end-effector of the corresponding optimizing channel of the system of extremum seeking. So, for example, for the control channel of the azimuthal and zenith positions of the solar panel, this is the permissible oscillation amplitude at the output of the corresponding coordinate actuators; h—tuning parameter of the high pass filter; ki—gain of master integrator.
We get:
Frequency response amplitude:
Equating:
where is calculated by the formula (47) power fluctuation; —oscillation amplitude at the output of master integrators.
Where we can get an expression for the frequency of the modulating signal ω, which provides a given level of power fluctuation / reference signal for the electric drive :
After all the transformations, we get a fairly universal structure of the control system, for which the final calculation of the amplitudes of the input modulating signals is as follows.
Assuming that the amplitude of the modulating signal at the output of a coordinate electric drive specified by the allowable technological requirements is strictly within acceptable limits, it can be assumed that another amplitude acts at its input with the frequency specified by the previously obtained formula (47), provided that the amplitude of the signal at the output of the corresponding control integrator does not introduce distorting noise in the main modulating signal.
Consequently, with the replacement of into (20) similar to formula (43) with help of formula (25) and decomposition into the real and imaginary part, we obtain:
Frequency response amplitude:
Equating:
where the amplitude of the input signal at the input of the drive is determined by the formula:
Substituting the expression (47) for a predetermined frequency into this formula, we obtain after all the simplifications:
Thus, if there are parameters available for the extremum seekeng loop, it is possible to calculate the required frequencies and amplitudes of the modulating signals, thus ensuring that the coarse but nonetheless sufficiently workable tuning and convergence without strict quality requirements, etc.
All of the above is summarized in the following computational algorithm, the results of calculations using which will be discussed in Section 4.
Thus, the general algorithm for studying the multiparameter system of extremum seeking power control of solar panels within the framework of the linear analysis presented is as follows:
- Having data ;;; calculate and resistances and by the formulas (4), (6) and (7). If necessary, adjust the ideality factor n in accordance with formulas (8).
- Select the year, season and date and calculate the azimuth and zenith angles using NREL MIDC SPA [51] or [55]. Select a pair of angles to simulate the transition from one angular position to another.
- Calculate the amplitude incidence coefficient ξ according to formulas (26)–(31).
- Calculate the amplitude of the photocurrent ΔIph by the formula (32).
- Calculate the voltage amplitude ΔV by formulas (38) and (39).
- Calculate the amplitude of the power ΔP by the formulas (40)–(42).
- Given the parameters of the circuits Thpf, h, ki, select the transfer function of the compensators in accordance with formula (19) and taking into account the reduction of a high-order object to a low-order object with formulas (25)
- Selecting the output amplitude of the oscillation signal of the master integrator for each of the extremum seeking loops, calculate the required frequency of the input modulating effects using the formula (47), which will provide the required amplitude of oscillations .
- Knowing the permissible amplitude of oscillations of angular electric drives, by the formula (52) calculate the necessary amplitudes of the main input modulating signals Ain.
- In the absence of satisfactory results on convergence at a given point, change the tuning parameters of Thpf, h, ki contours and repeat steps 7–10. You should strive to make them slightly different from each other in order to ensure that the modulating frequencies differ in accordance with the recommendations [28].
3. Results
In this section, we briefly discuss some of the results of the calculation, we present the main explanatory textual and illustrative materials, the results of modeling and calculation of the parameters are given in the corresponding tables and corresponding graphs.
As already noted, there are assumptions in which the calculation of volt-watt curves is greatly simplified. Namely, if the component is quite small. In this case, when solving the system of Equation (3) the details of the behavior of variable term are neglected, and it is possible to approximate expression (2) by a system of Equation (3).
Replacing by Equation (4), using initial data (see Table 3) from Equations (6) and (7) we obtained the exact values and , an then I0. Then we adjusted the value of the scale factor n (formula (8)).

Table 3.
I–V curve data (short circuit V = 0, I = Isc, open circuit V = Voc, I = 0, and the maximum power V = Vmp, I = Imp points; the slopes of the I–V curve at the open circuit and short circuit points) of several solar cells [41].
With a properly selected n (for which or P = Pmax (Under Pmax should understand the maximum power from manufacturer datasheet) volt-ampere and volt-watt curves, calculated by Equation (8), do not differ from datasheet, which is an “almost accurate” solution to this problem. It should be said that if we refuse to search for the exact solution of the system of Equation (3), then it becomes possible to have a whole class of solutions , and n, leading to the exact passage of the curves through the characteristic modes of operation. The change in current at such values of the parameters with a high of accuracy will still coincide with Equation (2). Table 4 shows the calculation results for a sample of solar panels borrowed from [41].

Table 4.
1-Diode/2-resistors circuit model parameter values from different solar cells (with data from [41]).
Figure 6 and Figure 7a–f shows the volt-ampere and volt-watt characteristics calculated by Equations (6)–(8), by which one can evaluate both the degree of similarity between the data taken from [41], and between the characteristic operating modes of these solar panels. It can be seen that the differences in the data from [41] and in our method are insignificant.
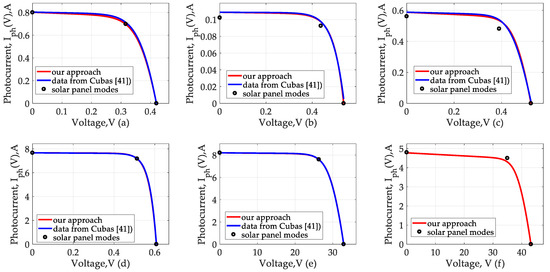
Figure 6.
Volt-ampere curves in range (a) Experiment 1, (b) Experiment 2, (c) Experiment 3, (d) Experiment 4, (e) Experiment 5, (f) Experiment 6.
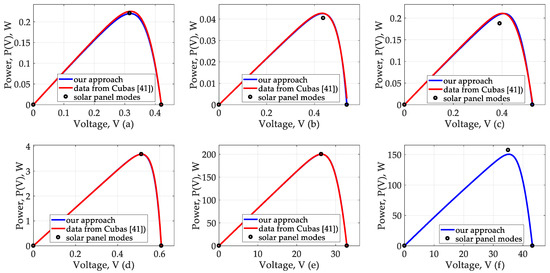
Figure 7.
Volt-watt curves in range (a) Experiment 1, (b) Experiment 2, (c) Experiment 3, (d) Experiment 4, (e) Experiment 5, (f) Experiment 6.
Results of calculations correlate well with the original curves. Results obtained above can be directly applied to the study of dynamic behavior in realistic models. These results will be used by us in the analysis of a number of specific effects below. We would like to make two comments. From formula (2) it follows that for certain values of the parameters included in this equation, P–V curve can be extremely suppressed. For example, with significant deviations of n from the values shown in Table 3, the maximum power value may differ from the datasheet by 50%–70%. We hope to conduct an experiment to test the stability of our solutions by attempting to compare the mathematical model with the actual model of a solar panel. Technically, this is quite feasible, however, it is advisable only in the development of new control systems. Another comment concerns the scope of the results obtained above. These results were obtained in neglect of the effects associated with the term . Such an approximation is quite sufficient for mathematical modeling and obtaining reference values of parameters, as will be shown later, if the voltage changes with a change in the photocurrent value almost instantaneously.
Using an online calculator (solar position algorithm (SPA)) [51,55], we obtained a set of Sun angles during July 15, 2019. These angles were then used to calculate the amplitudes of the signal oscillations as it passes through the open-loop system. These angles are shown in Table 5.

Table 5.
Topocentric elevation angle (TEA) (corrected) and Azimuth angle (AA) (eastward from N) in Chelyabinsk on July 15, 2019 from 8:00 AM to 8:00 PM according to NREL MIDC SPA.
Based on formulas (30) and (31), for the previously considered ranges of azimuth and zenith angles and the amplitudes of oscillations incidence coefficient ξ were calculated and are shown in Figure 8 (In order to build the surface of the second term, we took the angles of the Sun Θ = 45°, and Γ = 180°.)
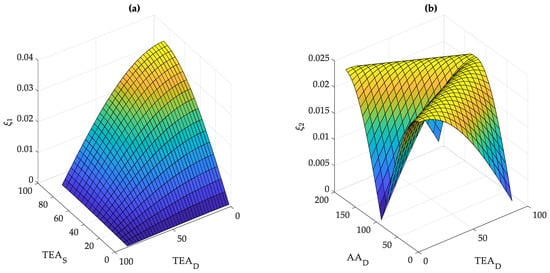
Figure 8.
First term of Equation (16) (a), and second term of Equation (16) (b).
It can be seen from the figures that with different combinations of azimuth and zenith angles, there is a change in the amplitudes of incidence coefficient ξ, which naturally leads to a change in the power amplitude during modulation during the daily tracking of the Sun. This means that the settings adopted for one group of angles probably cannot be accepted for another, since in this case, it is possible to lose the efficiency of the system. Figure 9 shows the amplitude surface Δξ with various combinations of angles of rotation of the coordinate electric drives at Θ = 45°, and Γ = 180°.
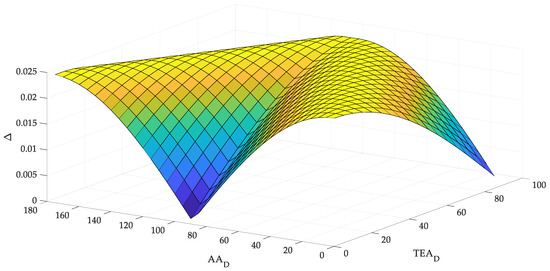
Figure 9.
General incidence coefficient amplitude deformation in the process of daily movement of the Sun.
Assuming that the oscillations of the input control signal are determined by some technological requirements, this means that the search oscillations of the angular position and resistance cannot exceed a certain value, and since there are no specific requirements in the literature, we will accept the rough assumption that the angular position varies with amplitude Asin_1 = Asin_2 = 1°. Depending on these values, we will further determine the required search frequencies of the modulating signals.
Having taken them, we calculate successively the magnitude of the incidence coefficient ξ. Let us select from Table 6 a pair of random angular states and give an estimate of the oscillation for three cases:

Table 6.
Allocated time intervals for modeling extremum seeking control systems in Chelyabinsk on July 15, 2019 from 8:00 AM to 8:00 PM according to NREL MIDC SPA.
- The original position is considered aligned. For this case, the reference signals and the angles of the Sun are the same.
- At the beginning of the motion, the angles of the Sun are changed, but the state of the system has not yet been changed. For this case, the angles of the Sun are equal to the final position, and the angles are set to the previous state.
- At the end of the transition to a new state, the angles of the Sun and the angles of installation again coincide.
The Table 7 (Column 1) presents the results of evaluating these amplitudes. It becomes obvious that the amplitude, according to which we set up the system of extremum seekeng, varies during the daily movement of the Sun.

Table 7.
Results of oscillation amplitude calculations.
However, you can pay attention to the fact that in most cases, the maximum amplitude is observed mainly in the event that the solar panel is not oriented towards the Sun.
If we assume that tuning by maximum amplitude is preferable, since in this case we will be able to minimize the maximum of the factors influencing the modulating signals, and in the process of moving to the point of maximum energy efficiency will only weaken, then in the future we should rely on the amplitudes calculated by formulas (30), (31) and according to Table 7 (Column 1) different current angles of the Sun and the reference signals for angular motion for coordinate drives.
Table 8 shows the amplitude values for this case.

Table 8.
Parameters and settings of extremum seeking loops.
Figure 10, Figure 11, Figure 12, Figure 13, Figure 14 and Figure 15 present the results of modeling the operation of a multiparameter extremum seeking control system for six samples of solar models taken from [41]. The settings for the systems were obtained by the method proposed by us and are summarized in Table 8.
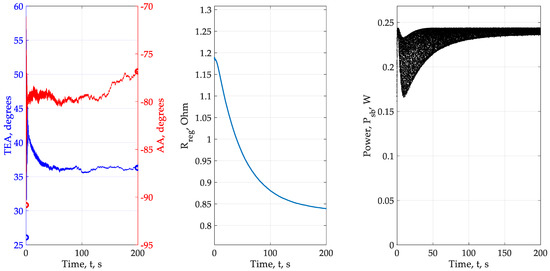
Figure 10.
Experiment No.1—Kennerud, 1969.
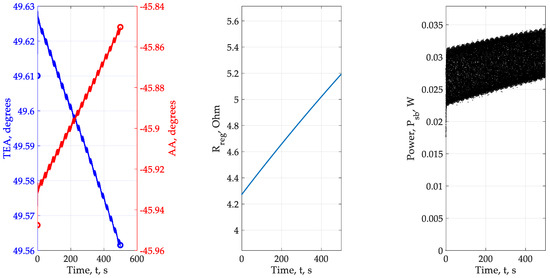
Figure 11.
Experiment No.2 – Charles (1), 1981.
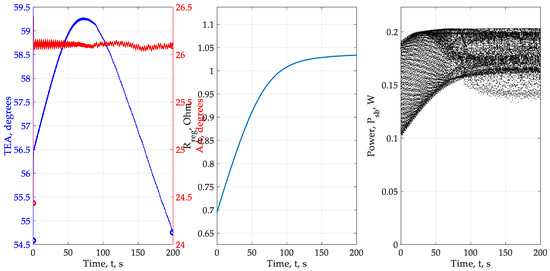
Figure 12.
Experiment No.3—Charles (2), 1981.
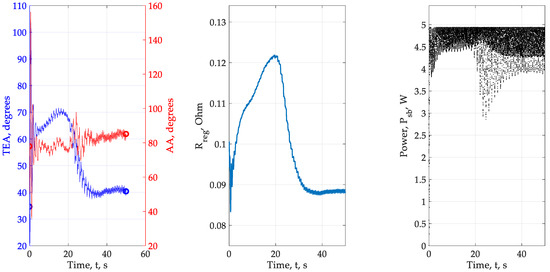
Figure 13.
Experiment No.4—Lo Brano, 2010.
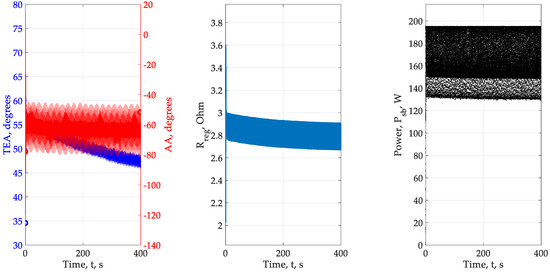
Figure 14.
Experiment No.5—Cubas, 2014.

Figure 15.
Experiment No.6—PSM-150, 2019.
Description of the results of the experiment No.1: The results of experiment No.1 are shown in Figure 10. Initial angular position: θ = 26.062° and γ = −90.849°. The required end position is θ = 34.56° and γ = −78.027°. The final angular position in accordance with the model θ ≈ 37° and γ ≈ −76°. The load resistance was ≈ 0.845 ohms. Power fluctuations are ≈ 0.01 Wt at a given level of 0.065 Wt.
Description of the results of the experiment No.2: The results of experiment No.2 are shown in Figure 11. Initial angular position: θ = 49.61° and γ = −45.947°. The required end position is θ = 54.56° and γ = −24.62°. The final angular position in accordance with the model θ ≈ 49° and γ ≈ −40°. The load resistance was ≈5 ohms. Power fluctuations are ≈ 0.005 W at a given level of 0.007 Wt. In this experiment, we observe what can be called a state of “stagnation.” Apparently, the parameters of the control loops and modulating signals were chosen in an unsuccessful way, as a result of which the rate of change of the angles is extremely low.
Description of the results of the experiment No.3: The results of experiment No.3 are shown in Figure 12. Initial angular position: θ = 54.58° and γ = 24.43°. The required end position is θ = 49.63° and γ = 45.77°. The final angular position in accordance with the model θ ≈ 54.5° and γ ≈ 26°. The load resistance was ≈ 1.025 ohms. Power fluctuations are ≈ 0.08 Wt at a given level of 0.05 Wt. A similar case with experiment 3.
Description of the results of the experiment No.4: The results of experiment No.4 are shown in Figure 13. Initial angular position: θ = 34.58° and γ = 77.88°. The required end position is θ = 26.079° and γ = 90.70°. The final angular position in accordance with the model θ ≈ 40° and γ ≈ 82°. The load resistance was ≈ 0.072 ohms. Power fluctuations are ≈ 2 Wt at a given level of 1 Wt. This is one of the most interesting cases since we were able to configure the system in such a way that it is “on the border of stability”. This is evidenced by the uncontrolled growth of TEA and load resistance Rreg in the period 0 < t < 20 s. The amplitude and frequency of the simulated oscillations turned out to be suitable in order to overcome the movement to an unstable state, as a result, the integrators accumulated the value of the control signal suitable for placing at the maximum power point.
Description of the results of the experiment No.5: The results of experiment No.5 are shown in Figure 14. Initial angular position: θ = 34.56° and γ = −78.88°. The required end position is θ = 42.62° and γ = −63.43°. The final angular position in accordance with the model θ ≈ 45° and γ ≈ −60°. The load resistance was ≈ 2.8 ohms. Power fluctuations are ≈ 65 Wt at a given level of 40 Wt.
Description of the results of the experiment No.6: The results of experiment No.6 are shown in Figure 15. Initial angular position: θ = 17.59° and γ = 102.63°. The required end position is θ = 9.51° and γ = 114.314°. The final angular position in accordance with the model θ ≈ 20.5° and γ ≈ 106.5°. The load resistance was ≈ 7.5 ohms. Power fluctuations are ≈ 30 Wt at a given level of 32 Wt.
This computational experiment (Figure 16) shows that some combinations of the angles of the coordinate electric drives are close to the condition ξ ≈ 1. In this situation, the system falls into a kind of “local minimum.” This is one example of loss of performance. This is especially noticeable in experiments No.2, No.3, where we observe the largest errors and deviations from these trajectories. Apparently, this is caused by the not entirely successful choice of parameters of the optimizing circuits, as well as the frequencies and amplitudes of the modulating signals.
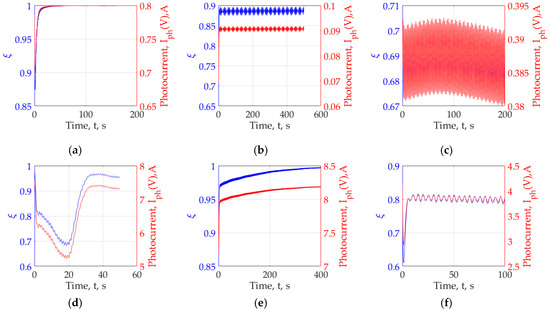
Figure 16.
Comparison of photocurrent amplitudes and incidence coefficient ξ for various experiments (No.1–6). (a) Experiment No.1, (b) Experiment No.2, (c) Experiment No.3, (d) Experiment No.4, (e) Experiment No.5, (f) Experiment No.6.
Figure 17 shows the angles of rotation of the azimuth and zenith electric drive, worked on the signals of master integrators. The only thing worth mentioning here is that almost all angular oscillations are performed with a given amplitude of ≈1°.
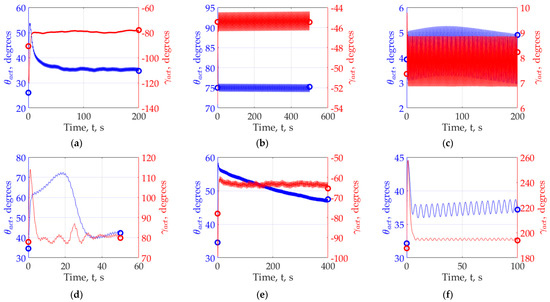
Figure 17.
Comparison of the amplitudes oscillations of the angles for various. (a) Experiment No.1, (b) Experiment No.2, (c) Experiment No.3, (d) Experiment No.4, (e) Experiment No.5, (f) Experiment No.6.
4. Discussion. Interpretation of the Results. Limitations of the Study in Question
The results obtained in the study made it possible to preliminarily study a multi-parameter system for searching for maximum power by means of the optimal orientation of a series of solar panels:
- In almost all experiments, the required parameters of the power fluctuation of the solar panel approximately correspond to the set. We cannot provide an arbitrary amplitude of oscillations of the coordinate electric drive, therefore, we chose a limitation, which, judging by the calculations, is satisfied and corresponds to the given = 1°. The influence of integrators on the input modeling signal is minimized so as to ensure convergence. In experiments 2 and 3, which turned out to be the least successful, we explain the main errors by the unsuccessful choice of the parameters of the optimization loops, amplitudes and frequencies of the modulating signals. The effect of convergence success depending on the power of the solar panel has so far been rejected, but requires additional verification, so the number of experiments needs to be increased from 6 to 20–25 and the power range of the solar panels expanded. It is required to find out how to choose the parameters of the high-pass filter and the integrator. So far, the problem is being solved for the already known or given parameters of the HPF and integrator.
- The effect of inconstancy in the amplitude of the fluctuation of the photocurrent and power, depending on the angular position of the solar panel and the angular position of the Sun in the chosen geographical location, shows that, provided the system is opened, multiplicity can be ignored. In other words, the adjustment of extremum seekeng loops can be done by “removing” nonlinearity from the system, leaving only the change in the effect itself.
- A new problem is highlighted from the previous paragraph. Our calculation shows that the effect varies over time. Consequently, adaptation of amplitudes and frequencies will be required. It is possible that the algorithm can be built on the basis of the presented calculations.
- Particular attention should be paid to restrictions. The number of parameters is limited to 3 (two angular positions and load resistance). Despite the fact that these are the main properties of the control object, additional non-linearities (for example, when expanding the number of adjustable coordinates) can complicate the calculation, because additional nonlinear interconnections appear in an open circuit.
- In general, the presented method can be extended to other nonlinearities, as well as the number of optimized parameters. You only need to learn how to correctly determine the amplitude of the fluctuations in the quantity coming to the extremum seekeng loops and to “remove” nonlinearity from the system (see point 3 of the Discussion section). We assume this is relevant for position-tracking systems of other classes.
5. Conclusions
In this study, an attempt was made to combine the “MPPT” and the classic “Extremum seeking” into a single principle of multi-parameter extremum seeking control of solar panels, as well as an approach to the linear analysis of such systems. Summing up most significant aspects of the study and the results, we came to the conclusion that the results of the parametric identification of the solar panel in an analytical way differ very little from the data of the solar panels taken from [41], although this required the removal of the “weakly perturbed” component from the system of Equation (3) to make it solvable. We obtained the equivalent transfer function of the solar panel, and its analysis showed that the solar panel can be considered as a proportional link. This helped us in the next stage, where we presented the system in an open-loop form (see Figure 4) and derived the generalized fluctuation in the solar panel power. This generalized amplitude of power oscillations of a solar panel with multi-parameter control is a combination of modulating input oscillations superimposed on the signals of control integrators. This means that by revealing the relationship between the properties of the generalized oscillations of the controlled parameter and the parameters of the input oscillations, it becomes possible to eliminate non-linearity from the system and use simpler analytical relationships between them. The results presented on this subject can thus be extended to other types of solar panels. In addition, the effect associated with a change in the angular position, in which for the same amplitude of modulating oscillations the amplitudes of the photocurrent oscillations and the solar panel power at different angular positions will generally differ, makes us turn to adaptive control algorithms and methods of their analysis as the most natural for this class of systems.
Although computational experiments have shown that there are no divergent results, not all of them can be called successful. So, the system in experiments No.2 and No.3 is generally in stagnation. We associate this with incorrectly selected parameters of high-pass filters and control integrators. We have reflected this debatable issue in the Discussions.
We conducted six experiments with different types of solar panels. This database has a small size and needs to be replenished using elements of the “Big Data” concept. This will clarify the ranges of parameters for various types of solar panels, refine the theoretical model and improve the quality of convergence.
When discussing the results in the broadest context, they, of course, cannot be called completely comprehensive. First of all, they open an important problem related to the development of new control systems for tracking systems for the Sun, namely, the creation and accurate analytical study of adaptive control systems. Our future work will be carried out in this direction.
Author Contributions
All the work presented in this paper was carried out by S.A.Y. under the supervision of K.I.M.
Funding
The reported study was funded by RFBR, project number 19-31-90156.
Conflicts of Interest
The authors declare no conflict of interest.
Appendix A
As an alternative, simpler method of calculation, consider the following. We assume that sufficiently large. Then, from system of Equation (3) it can be rewritten as:
where we can get the expression for the saturation current of the diode [39,41,45]:
which allows rewriting the system of Equation (3) in the form:
An exact analytical solution of the system of Equation (A3) without making some simplifying assumptions is impossible [41], even with the use of the apparatus of special functions. In the same paper [41], an attempt was made to obtain a solution using such simplifications. Following the same way, to solve the system of Equation (A3), we adopted several other assumptions:
- On the interval 0 ≤ V ≤ Vmp, the term in first equation of the system of Equation (A3) practically does not affect the calculations, so it is assumed to be zero. To calculate the resistances and , it is advisable to enter an additional point in the middle of and , namely (a graphic explanation is given in Figure A1 and Figure A2:This is done in order to correctly characterize the approximately linear nature of the change in the photocurrent with a change in voltage on the specified interval.
- In a sufficiently small-scale neighborhood of the peak power at the voltage of the second term V≈Vmp effect begins to show enough that it cannot be disregarded. This is important, i.e., leads to a specific law of change, on the basis of which the following assumption is made.
- On the section Vmp ≤ V ≤ Voc, the volt-watt curve is close to a quadratic law:where the scaling coefficient Kc is determined from the condition of equality of the 0 curve by Equation (A5) at the idle point :
Assumptions 2 and 3 in view of (57) and (58) allow us to write a new system of equations instead of the system of Equation (A3):
Solving this equation for Rs and Rsh and, we get:
As already noted, there are assumptions in which the calculation of volt-watt curves is greatly simplified. Namely, if the component in the range is quite small, and the change in the photocurrent in the range is close to a quadratic law (see Equation (2) and (7)). In this case, when solving the system of Equation (A3) the details of the behavior of when is neglected, and when is possible approximate expression (1) by a quadratic function (A5).
For an arbitrary value of the scale factor n, the volt-watt and volt-ampere curve, constructed by Equation (2), passed only through the idling and short-circuit conditions. This happens for the same reason that there are no exact solutions for , and from the system of Equation (A3).
Using this approach, we obtained other data, which are presented in Table A1.

Table A1.
1-Diode/2-resistors circuit model parameter values from different solar cells (with data from [41] and by alternative approach).
Table A1.
1-Diode/2-resistors circuit model parameter values from different solar cells (with data from [41] and by alternative approach).
| Reference | |||||
|---|---|---|---|---|---|
| Kennerud, 1969 | 2.06 × 10⁻⁶ | 2.98 | 5.25 × 10⁻⁶ | 0.208 | 1.37 |
| Charles, 1981 | 1.37 × 10⁻⁸ | 26.98 | 3.4 × 10⁻⁹ | 0.0385 | 1.2 |
| Charles, 1981 | 5.12 × 10⁻⁸ | 3.58 | 7.74 × 10⁻⁸ | 0.186 | 1.25 |
| Lo Brano, 2010 | 2.67 × 10⁻¹¹ | 1.045 | 3.99 × 10⁻¹⁰ | 3.52 | 1 |
| Cubas | 2.91 × 10⁻⁶ | 43.83 | 9.1 × 10⁻⁷ | 192.5 | 80 |
| PSM-150 | 1.55 × 10⁻⁵ | 116.7 | 2.13 × 10⁻⁶ | 147 | 115 |
Figure A1 shows the volt-watt characteristics of the solar panels from experiments No.1–3, constructed using an alternative approach.
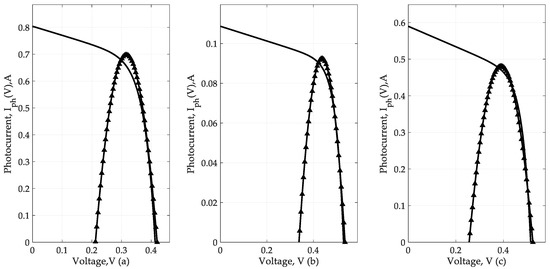
Figure A1.
Volt-ampere curves and their quadratic equivalent in range for first three experiments as an example of an alternative procedure. (a) Experiment No.1, (b) Experiment No.2, (c) Experiment No.3
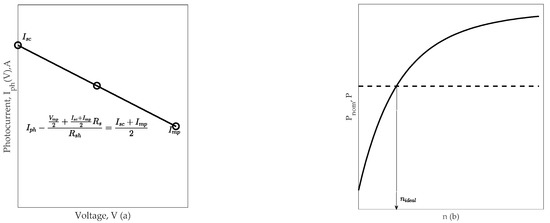
Figure A2.
(a) Plot of the volt-watt characteristic on the interval 0 ≤ V ≤ Vmp, (b) adjustment of the ideality factor.
References
- Krstic, M.; Ghaffari, A.; Seshagiri, S. Extremum seeking for wind and solar energy applications. In Proceedings of the 11th World Congress on Intelligent Control and Automation, Shenyang, China, 29 June–4 July 2014; pp. 6184–6193. [Google Scholar] [CrossRef]
- Demenkova, T.A.; Korzhova, O.A.; Phinenko, A.A. Modelling of algorithms for solar panels control systems. Procedia Comput. Sci. 2017, 103, 589–596. [Google Scholar] [CrossRef]
- Pakkiraiah, B.; Sukumar, G.D. Research survey on various MPPT performance issues to improve the solar pv system efficiency. J. Sol. Energy 2016, 2016, 1–20. [Google Scholar] [CrossRef]
- Esram, T.; Chapman, P.L. Comparison of photovoltaic array maximum power point tracking techniques. IEEE Trans. Energy Convers. 2007, 22, 439–449. [Google Scholar] [CrossRef]
- Sumathi, V.; Jayapragash, R.; Bakshi, A.; Akella, P.K. Solar tracking methods to maximize PV system output—A review of the methods adopted in recent decade. Renew. Sustain. Energy Rev. 2017, 74, 130–138. [Google Scholar] [CrossRef]
- Dogga, R.; Pathak, M.K. Recent trends in solar PV inverter topologies. Sol. Energy 2019, 183, 57–73. [Google Scholar] [CrossRef]
- Ahmad, R.; Murtaza, A.F.; Ahmed, H. Power tracking techniques for efficient operation of photovoltaic array in solar applications—A review. Renew. Sustain. Energy Rev. 2019, 101, 82–102. [Google Scholar] [CrossRef]
- Eltawil, M.A.; Zhaom, Z. MPPT techniques for photovoltaic applications. Renew. Sustain. Energy Rev. 2013, 25, 793–813. [Google Scholar] [CrossRef]
- Salam, Z.; Ahmed, J.; Merugu, B.S. The application of soft computing methods for MPPT of PV system: A technological and status review. Appl. Energy 2013, 107, 135–148. [Google Scholar] [CrossRef]
- Mohanty, P.; Bhuvaneswari, G.; Balasubramanian, R.; Dhaliwal, N.K. MATLAB based modeling to study the performance of different MPPT techniques used for solar PV system under various operating conditions. Renew. Sustain. Energy Rev. 2014, 38, 581–593. [Google Scholar] [CrossRef]
- Bendib, B.; Belmili, H.; Krim, F. A survey of the most used MPPT methods: Conventional and advanced algorithms applied for photovoltaic systems. Renew. Sustain. Energy Rev. 2015, 45, 637–648. [Google Scholar] [CrossRef]
- Rezk, H. A new MATLAB/Simulink model of triple-junction solar cell and MPPT based on artificial neural networks for photovoltaic energy systems. Ain Shams Eng. J. 2015, 6, 873–881. [Google Scholar] [CrossRef]
- Seyedmahmoudian, M.; Horan, B.; Kok Soon, T.; Rahmani, R.; Muang Than Oo, A.; Mekhilef, S.; Stojcevski, A. State of the art arti fi cial intelligence-based MPPT techniques for mitigating partial shading effects on PV systems—A review. Renew. Sustain. Energy Rev. 2016, 64, 435–455. [Google Scholar] [CrossRef]
- Verma, D.; Nema, S.; Shandilya, A.M.; Dash, K.S. Maximum power point tracking (MPPT) techniques: Recapitulation in solar photovoltaic systems. Renew. Sustain. Energy Rev. 2016, 54, 1018–1034. [Google Scholar] [CrossRef]
- Ram, J.P.; Babum, T.S.; Rajasekarm, N. A comprehensive review on solar PV maximum power point tracking techniques. Renew. Sustain. Energy Rev. 2017, 67, 826–847. [Google Scholar] [CrossRef]
- Johnson, M.C.; Brunton, S.L.; Kundtz, N.B.; Kutz, J.N. An extremum-seeking controller for dynamic metamaterial antenna operation. In Proceedings of the 2015 IEEE-APS Topical Conference on Antennas and Propagation in Wireless Communications (APWC), Turin, Italy, 7–11 September 2015; pp. 1220–1223. [Google Scholar] [CrossRef]
- Brunton, S.L.; Rowley, C.W.; Kulkarni, S.R.; Clarkson, C. Maximum Power Point Tracking for Photovoltaic Optimization Using Ripple-Based Extremum Seeking Control. IEEE Trans. Power Electron. 2010, 25, 2531–2540. [Google Scholar] [CrossRef]
- Mousazadeh, H.; Keyhani, A.; Javadi, A.; Mobli, H.; Abriana, K.; Sharifi, A. A review of principle and sun-tracking methods for maximizing solar systems output. Renew. Sustain. Energy Rev. 2009, 13, 1800–1818. [Google Scholar] [CrossRef]
- Hafez, A.Z.; Yousef, A.M.; Harag, N.M. Solar tracking systems: Technologies and trackers drive types—A review. Renew. Sustain. Energy Rev. 2018, 91, 754–782. [Google Scholar] [CrossRef]
- Lee, C.-Y.; Chou, P.-C.; Chiang, C.-M.; Lin, C.-F. Sun tracking systems: A Review. Sensors 2009, 9, 3875–3890. [Google Scholar] [CrossRef]
- Loschi, H.J.; Iano, Y.; Leon, J.; Moretti, A.; Conte, F.D.; Braga, H. A review on photovoltaic systems: Mechanisms and methods for irradiation tracking and prediction. Smart Grid Renew. Energy 2015, 6, 187–208. [Google Scholar] [CrossRef]
- Khalil, F.A.; Asif, M.; Anwar, S. Solar tracking techniques and implementation in photovoltaic power plants: A solar tracking techniques and implementation in photovoltaic power plants: A Review. Phys. Comput. Sci. 2017, 54, 231–241. [Google Scholar]
- Ya’u, M.J. A Review on solar tracking systems and their classifications. J. Energy Environ. Chem. Eng. 2017, 2, 46–50. [Google Scholar]
- Racharla, S.; Rajan, K. Solar tracking system—A review. Int. J. Sustain. Eng. 2017, 7038, 1–10. [Google Scholar]
- Hamid, A.R.; Azim, A.K.; Bakar, M.H. A review on solar tracking system. In Proceedings of the National Innovation and Invention Competition Through Exhibition (iCompEx’17), Jitra, Malaysia, 21–22 March 2017. [Google Scholar]
- Al-Rousan, N.; Isa, N.A.M.; Desa, M.K.M. Advances in solar photovoltaic tracking systems: A review. Renew. Sustain. Energy Rev. 2018, 82, 2548–2569. [Google Scholar] [CrossRef]
- Singh, R.; Kumar, S.; Gehlot, A.; Pachauri, R. An imperative role of sun trackers in photovoltaic technology: A review. Renew. Sustain. Energy Rev. 2018, 82, 3263–3278. [Google Scholar] [CrossRef]
- Ariyur, K.B.; Krstic, M. Real-Time Optimization By Extremum-Seeking Control; John Wiley & Sons: Hoboken, NJ, USA, 2003; p. 230. [Google Scholar]
- Chunlei, Z.; Ordonez, R. Extremum-Seeking Control and Applications; Springer: Cham, Switzerland, 2012; p. 209. [Google Scholar]
- Liu, S.-J.; Krstic, M. Stochastic Averanging and Stochastic Extremum Seeking; Springer: Cham, Switzerland, 2012; p. 226. [Google Scholar]
- Brunton, S.L.; Fu, X.; Kutz, J.N. Extremum-seeking control of a mode-locked laser. IEEE J. Quantum Electron. 2013, 49, 852–861. [Google Scholar] [CrossRef]
- Binetti, P.; Ariyur, K.B.; Krstic, M.; Bernelli, F. Control of formation flight via extremum seeking. In Proceedings of the American Control Conference, Anchorage, AK, USA, 8–10 May 2002; pp. 2848–2853. [Google Scholar]
- Nesic, D. Extremum seeking control: Convergence analysis. Eur. J. Control 2009, 15, 331–347. [Google Scholar] [CrossRef]
- Rastrigin, L.A. Contemporary Principles to Control Complex Objects; Mir Publishers: Moscow, USSR, 1983; p. 248. [Google Scholar]
- Rotea, M.A.; Lafayette, W. Analysis of multivariable extremum seeking algorithms. In Proceedings of the 2000 American Control Conference, Chicago, IL, USA, 28–30 June 2000; pp. 433–437. [Google Scholar]
- Walsh, G.C. On the application of multi-parameter extremum seeking control. In Proceedings of the 2000 American Control Conference, Chicago, IL, USA, 28–30 June 2000. [Google Scholar]
- King, D.L.; Boyson, W.E.; Kratochvil, J.A. Photovoltaic Array Performance Model; United States Department of Energy: Washington, DC, USA, 2004. [Google Scholar]
- Celik, A.N.; Acikgoz, N. Applied modelling and experimental verification of the operating current of mono-crystalline photovoltaic modules using four- and five-parameter models. Appl. Energy 2007, 84, 1–15. [Google Scholar] [CrossRef]
- Bellia, H. A detailed modeling of photovoltaic module using MATLAB. Nriag J. Astronomy Geophys. 2014, 3, 53–61. [Google Scholar] [CrossRef]
- Ferrari, S.; Lazzaroni, M.; Piurim, V. A computational intelligence approach to solar panel modelling. In Proceedings of the 2014 IEEE International Instrumentation and Measurement Technology Conference (I2MTC), Montevideo, Uruguay, 12–15 May 2014. [Google Scholar]
- Cubas, J.; Pindado, S.; Victoria, M. On the analytical approach for modeling photovoltaic systems behavior. J. Power Sources 2014, 247, 467–474. [Google Scholar] [CrossRef]
- Ulleberg, O. Stand-alone power systems for the future. Ph.D. Thesis, Norwegian University of Science and Technology, Trondheim, Norway, 1998; p. 225. [Google Scholar]
- Alam, M.S.; Alouani, A.T. Dynamic modeling of photovoltaic module for real-time maximum power tracking Dynamic modeling of photovoltaic module for real-time maximum power tracking. J. Renew. Sustain. Energy 2014, 2, 1–17. [Google Scholar]
- Johnson, J.; Schoenwald, D.; Kuszmaul, S.; Strauch, J.; Bower, W. Creating dynamic equivalent PV circuit models with impedance spectroscopy for arc fault modeling. In Proceedings of the 37th IEEE Photovoltaic Specialists Conference, Seattle, WA, USA, 19–24 June 2011; pp. 2328–2333. [Google Scholar]
- Bhatt, P.; Kumar, M.; Kant, P.C.; Pandey, M.K.; Tripathi, B. Optoelectronic modelling of perovskite solar cells under humid conditions and their correlation with power losses to quantify material degradation. Org. Electron. 2016, 39, 258–266. [Google Scholar] [CrossRef]
- Khatib, T.; Elmenreich, W. Modeling of Photovoltaic Systems Using MATLAB; Jon Willey and Sons: Hoboken, NJ, USA, 2016; p. 242. [Google Scholar]
- Moussa, I.; Khedher, A.; Bouallegue, A. Design of a Low-Cost PV Emulator Applied for PVECS electric. Electronics 2019, 8, 232. [Google Scholar] [CrossRef]
- Notton, G.; Cristofari, C.; Mattei, M.; Poggi, P. Modelling of a double-glass photovoltaic module using finite differences. Appl. Therm. Eng. 2005, 25, 2854–2877. [Google Scholar] [CrossRef]
- Wu, H. A maximum power point detection method for photovoltaic module based on lambert w function based on Lambert W function. Math. Problems Eng. 2018, 2018, 8. [Google Scholar] [CrossRef]
- Dunford, W.G.; Capel, A. Novel modeling method for photovoltaic cells. In Proceedings of the 2004 35th Annual IEEE Power Electronics Specialists Conference, Aachen, Germany, 20–25 June 2004; pp. 1950–1956. [Google Scholar]
- Reda, I.; Andreas, A. Solar Position Algorithm for Solar Radiation Applications (Revised). NREL/TP-560-34302. Golden (Colorado). Sol. Energy 2008, 76, 577–589. [Google Scholar] [CrossRef]
- Korn, G.A.; Korn, T.M. Mathematical Handbook for Scientists and Engineers. Definitions, Theorems, and Formulas for Reference and Review; Dover Publications, Inc.: New York, NY, USA, 2000. [Google Scholar]
- Liberzon, L.M.; Rodov, A.B. Extremum Seeking Control Systems; Energy publisher: Moscow, USSR, 1965; p. 162. [Google Scholar]
- Kapre, N.; DeHon, A. Parallelizing sparse Matrix Solve for SPICE circuit simulation using FPGAs. In Proceedings of the 2009 International Conference on Field-Programmable Technology, Sydney, NSW, Australia, 9–11 December 2009; pp. 190–198. [Google Scholar] [CrossRef]
- Sologubov, A.Y.; Kirpichnikova, I.M. Calculation of the parameters of the daily movement of the sun. contour maps of kinematic parameters. In Proceedings of the 2019 International Conference on Industrial Engineering, Applications and Manufacturing (ICIEAM), Sochi, Russia, 25–29 March 2019; pp. 1–6. [Google Scholar]
© 2019 by the authors. Licensee MDPI, Basel, Switzerland. This article is an open access article distributed under the terms and conditions of the Creative Commons Attribution (CC BY) license (http://creativecommons.org/licenses/by/4.0/).