Abstract
The paper provides an overview of ways to increase the strength of polymer products obtained by fused filament fabrication (FFF) technology. An algorithm for calculating the spiral toolpaths for the material deposition using multi-axis printing is proposed. The design of the five-axis device for spiral-shaped deposition of the material is shown. The description of the proposed printing method is given. The results of comparative three-point bend and compression tests are presented. The standard samples obtained in the usual way by FFF technology, as well as samples with 2, 4, 6, 8 and 10 reinforcing layers obtained by spiral deposition of the material were investigated. The description of the tests is given, the dependences of the strength of the products on the number of reinforcing layers are obtained. Conclusions about the influence of the layer deposition method on the strength of the products are formulated.
1. Introduction
Currently, the use of additive technologies (AT) for the production of final products is already quite common practice in some industries. First, various methods of layer-by-layer part production for specially prepared material have been used as a means of manufacturing complex objects, such as implants [1] or structural elements of the aircraft, designed on the basis of bionic design [2]. Whole modern production concepts based on AT are being developed [3]. Often the production is based on the Selective Laser Melting, SLM technology [1,4], based on the layer-by-layer sintering of powder material (usually metal powders). Other popular additive technology is fused filament fabrication (FFF). Its simplicity and low cost result in its widespread use for the manufacture of models and prototypes, as a tool for a hobby, as well as for the production of final products. The transition from “cut” to “printed” products raises the question of comparing their strength, especially for products, printed using FFF technology. It is related to the fact that due to the physical properties of polymeric materials, which are often used by this technology, when melting their macromolecules are stretched in the direction of flow, resulting in objects printed by the FFF method being characterized by anisotropy [5,6,7,8]. Test data comparison of samples printed from the most common acrylonitrile butadiene styrene (ABS) and polylactide (PLA) plastics with the results of samples being made, for example, with a screw extruder [9], does not speak in favor of 3D printing, if the load is applied not along, but across, the layers.
The first step to increase the strength of printed products is optimization of parameters and conditions of the process to obtain the greatest force of interlayer interaction [5,6,10]. This approach is used at the stage of technological preparation of production; its natural development is the use of specialized software [11], which allows us to track the defects of the 3D model that can adversely affect the strength properties of the product, and simulate the conditions of the process to select the optimal mode even before the printing process. Selection of the optimal temperature regime and layer thickness is of particular importance for ensuring strength [12,13]. Thus, tensile testing of specimens made of ABS plastic shows that optimization of the printing temperature increases the ultimate load by 25%, and reducing the layer thickness from 0.3 to 0.1 mm increases the ultimate load by almost half [13]. However, reducing the thickness of the layer significantly reduces print performance. In addition, the optimization of parameters does not solve the problem of anisotropy of products in the direction perpendicular to the area of construction (i.e., in the direction of the Z axis).
There are other ways to increase the strength of printed products, among which we can distinguish:
- using new polymer materials with outstanding physical and chemical properties in 3D printing, such as PEEK [14];
- using “reinforcing” elements obtained by extruding the same material (“Z-pinning”) in the structure of the product with incomplete filling of layers [15];
- slicing and printing of the object in curved layers instead of flat [16,17,18,19];
- multi-axis printing [20,21], including multi-axis printing of curved layers [22,23].
Multi-axis printing can provide advantages such as reducing the “stair step effect” on the surface and eliminating the need to print additional supporting structures to produce objects with overhanging elements. However, the most promising is the possibility of printing layers with a complex (different from the plane) form to improve the mechanical properties of the product, which was demonstrated in [23].
The purpose of this study is to increase the strength of products obtained using FFF 3D printing, to achieve what we propose as a new method of manufacturing, based on multi-axis printing.
2. Materials and Methods
One of the possible solutions to eliminate the problem of deterioration of the strength properties of the printed object in certain directions is its manufacture by applying the threads of the material in different directions. The most promising is the use of screw trajectories, as shown in Figure 1.
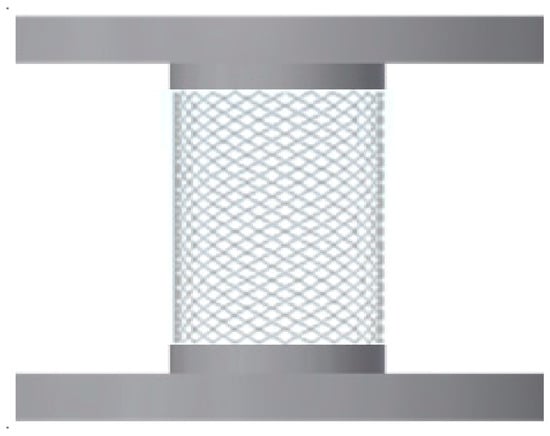
Figure 1.
Spiral winding of the material on the core.
For the software generation of the control G-code, implementing the above modes of 3D printer operation, it is necessary to calculate the coordinates of the toolpaths of the print head [24]. Consider the mode of construction with the deposition the multidirectional layers on the cylindrical part with radius r. Figure 2 shows the drawing of the infill line with length H with the beginning at point A0 with coordinates (X0, Y0, Z0) and the end at point A0’ with coordinates (X0’, Y0’, Z0’). The shape of the thread coming out of the nozzle is a circle in the section, but after touching the part, it becomes approximate in shape to a rectangle with rounded corners with a width WL and a height hL equal to the height of the print layer. The reference point is the center of the circle at the base of the cylinder at point O.
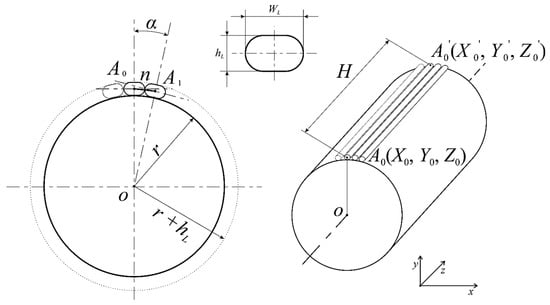
Figure 2.
Scheme of printing the revolved solid with the application of straight lines.
The number of filling lines in the layer calculation is made by the expression (1):
Then the calculated number of n’ lines is rounded to an integer n in the smaller direction n = [n’], and the resulting width of each line is calculated by the expression (2):
The angular step of the fill lines is then calculated:
Calculation of coordinates Ai of the beginning of each infill line is made by expressions:
The coordinates (Xi’, Yi’, Zi’) of Ai‘ endpoints of each line are calculated using the same expressions (4), but at Zi’ = H. When calculating, the points Ai and Ai‘ are entered into the array, and at the end of the loop is closed by adding the first point to the end of the array.
To be able to fill the layer not with straight lines (on the cylinder generatrix), but with a spiral, the beginnings of the lines (Ai) are determined in the same way as in the previous case, and the endings (Ai‘) – by the following expressions:
where β is the angle of inclination of the AiAi‘ line to the cylinder generatrix passing through the Ai point in the plane drawn through this generatrix tangentially to the lateral surface of the cylinder.
The layer number L of the part is calculated by dividing the required value of the radius of the cylinder R by the height of the layer hL:
Figure 3 shows a model of a cylinder divided into cylindrical layers. Each layer is a set of many spiral lines, the coordinates of which are determined by the formulas (4) and (5).
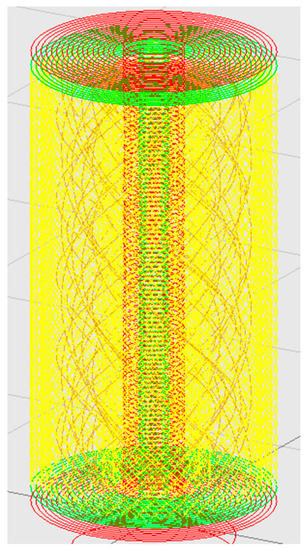
Figure 3.
Scheme of printing the revolved solid with the application of spiral lines.
The algorithm [25] presented in Figure 4 is proposed for automatic calculation of coordinates of Ai and Ai’ points of infill lines.
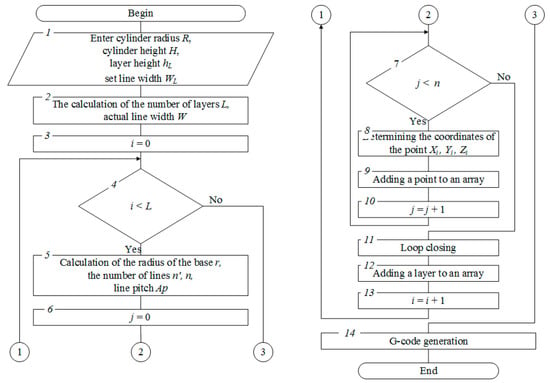
Figure 4.
The algorithm for calculating the coordinates of the start and end line points.
The input data required for the calculations are entered in block 1. In blocks 2 and 5 the calculation of the parameters of the filling lines according to the expressions 1, 2, 3 and 6 is performed. A loop starting with block 4 creates layer infill in which the lines themselves, with coordinates calculated from expressions 4 and 5, are created in the loop shown by blocks 7–10. Block 14 creates a control program (G-code).
To automatically calculate the trajectory of the print head, specialized software has been developed, which includes 3D model loading, choice of printing method and G-code toolpaths generation [26]. The program interface is presented on Figure 5.
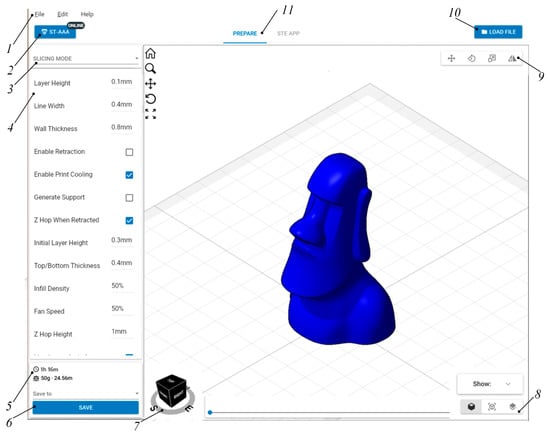
Figure 5.
G-code preparation program interface.
The program contains the following elements: 1—main menu, 2—switching printer profile menu, 3—select print mode, 4—print settings, 5—estimating time and material consumption, 6—save the print job, 7—view cube, 8—switching display mode, 9—editing mode panel, 10—model loading button, 11—switch to the print dashboard
For the manufacture of products using this technology the special design of the 3D printer is developed, with the possibility to rotate the product during the printing process. The kinematic scheme of the developed 3D printer is presented in Figure 6. The main processing modules are: 1—base; 2—bearing; 3—the upper frame; 4—vertical feed lead-screw; 5—vertical feed guide; 6—guide nut; 7—central bracket; 8—bevel worm gear reducer; 9—central console; 10—rotation shaft; 11—rotation worm gear reducer; 12—rotation cylindrical gear reducer; 13—working surface; 14—lead screw longitudinal feed; 15—printing head; 16—spool with a filament material; 17—printed model; M1—vertical pitch motor; M2—reducer bevel motor; M3—reducer of rotation motor; M4—longitudinal feed motor; M5—cross-feed motor; M6—material feeding motor.
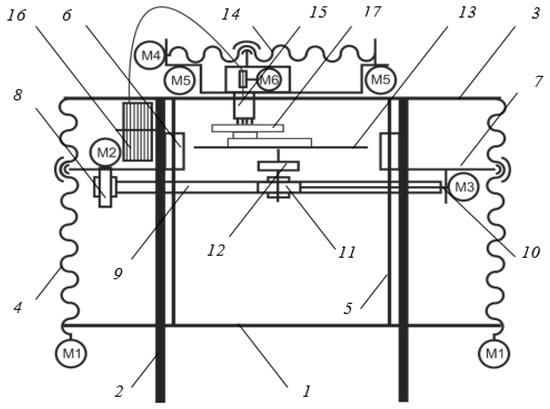
Figure 6.
The kinematic diagram of the designed 3D printer.
The design of the device, the scheme of which is shown in Figure 6, includes a tilt-turntable (Figure 7). It uses as a tilt reducer 1 worm gear to transmit the torque of the motor 2 fixed to the central bracket 3 by means of a flange 4 to the central console 5 fixed to the calipers 6 in order to tilt the working surface 7 at an angle up to 90°. The rotation is carried out through a kinematic chain from the motor 8 to the worm gear 9, the wheel of which is rigidly connected to the drive wheel of the cylindrical gearing 10, the rotating driven wheel fixed to one shaft with the working surface.
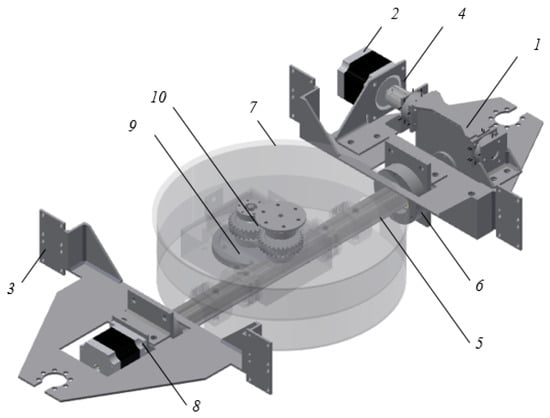
Figure 7.
Tilt-and-turn unit of the developed 3D printer.
An overview of the developed printer is shown in Figure 8.
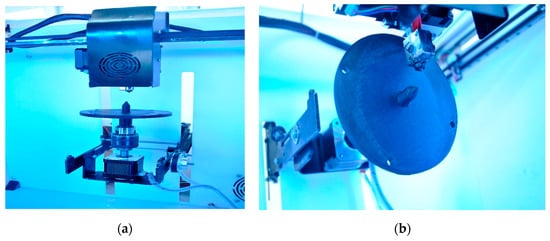
Figure 8.
The implementation option of the developed 3D printer with the build platform in orientation (a) for printing of the core; (b) for winding the material on the core.
Printing on this 3D printer is carried out in several stages. First, on the base 3, located parallel to the Z axis (Figure 9a), with the help of the print head 2, a supporting tooling 1 is applied in the likeness of a “raft” in conventional 3D printing, then (Figure 9b) by the method of conventional 3D printing, a core 4 of a cylindrical shape with a top repeating the shape of the product is built. The core can also be constructed according to the algorithm described in [27].
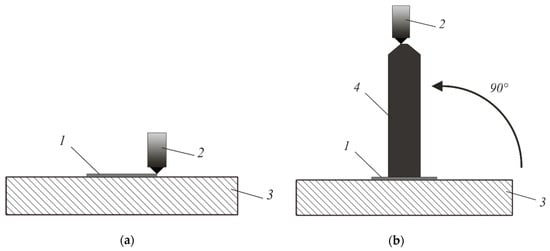
Figure 9.
Stages of 3D printing by the proposed method: (a) stage 1—deposition of the supporting equipment; (b) stage 2—print the base for the winding material.
Then (Figure 10a) the product is rotated parallel to the Y-axis and the remaining part of product 5 is created using the winding method. At the end, the product (Figure 10b) is separated from the supporting tooling built in the first stage.
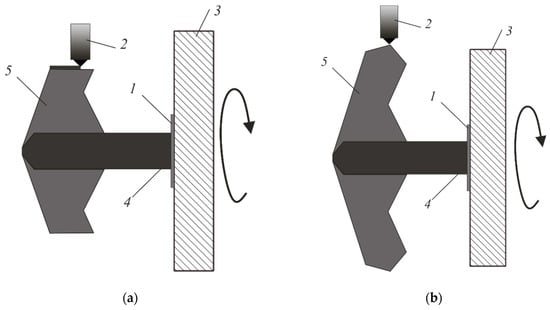
Figure 10.
Stages of 3D printing by the proposed method: (a) step 3—winding the material on the core; (b) step 4—completing the printing of the product.
In addition to the new mechanical properties of the obtained structure, in some cases it is characterized by an increased formation rate in comparison with flat layer-by-layer filling. This feature is well illustrated by a sample in the form of a long (l >> d) cylinder. In standard printing (Figure 11a), the nozzle moves along the chords of a circle in the cross section of the cylinder. The nozzle trajectory is a broken line of tightly stacked chords with a thickness of h = 0.4 mm (the thickness of the thread extruded from the nozzle), the length of each of which (in mm) is:
where d, mm is the diameter of the cylinder; αi = arccos 2 h/d is the central angle in the transverse section of the cylinder, based on the ends of the chord.
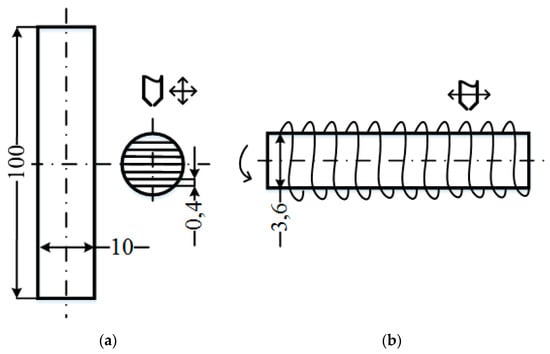
Figure 11.
Layer filling: (a) by standard 3D printing technology; (b) step 4—by winding the material on the core.
The time spent the print head to moving along this chord without an initial speed with acceleration a = 3000 mm/s2 to an operating speed v = 60 mm/s:
where L0 is the length of the acceleration path to operating speed, t0 is the acceleration time.
When filling the layer with a diameter of d = 10 mm with a thread with a thickness of 0.4 mm, the layer consists of 49 chords, including one chord equal to the diameter. The total time for filling a layer is defined as the sum of the time it takes to move along chords. The filling time of the entire volume of the reference cylinder (Figure 11a) is equal to the product of the filling time of the layer by the number of layers with a thickness h0 = 0.2 mm and is t1 = 2167.41 s (about 36 minutes).
On the other hand, the filling time in 5D printing (Figure 11b) is the sum of the core manufacturing time using the standard method t1 (315.23 s for the core with d = 3.6 mm diameter) and the thread winding time t2. Cylindrical layers with a thickness of h0 = 0.2 mm are wound onto the core one after another and consist of n turns, the length of each of which:
where di is the diameter of the cylindrical layer; Hi - helix pitch. The Hi/h ratio denotes the density of the threads in a turn. Diameter and pitch are related by the value of the helix angle φ, the tangent of which is tg φ = Hi/πdi.
Knowing the thickness of the thread h = 0.4 mm, the pitch Hi and the helix angle φ = 45° we can determine the number of turns and the length of the trajectory L2 of the nozzle. The filling time is determined by Equation (8) and for 16 layers it is t2 = 661.43 s. This, in total, with the core printing, gives about 18 minutes - almost twice as fast as printing the entire cylinder in a standard way.
3. Results and Discussion
The compression test samples (Figure 12a) and static bending (Figure 12b) were made of ABS plastic with melt temperature of 240 ± 1 °C with 100% infill. According to the technology of winding the material on the core for each type of test, five groups of samples with 2, 4, 6, 8 or 10 cylindrical 0.2 mm thick layers were obtained. In accordance with this standard 3D printing technology, cores of different diameters (the more layers, the smaller the diameter of the core), as well as samples completely made by standard technology for obtaining sample data were made; the thickness of the flat layer was 0.2 mm.
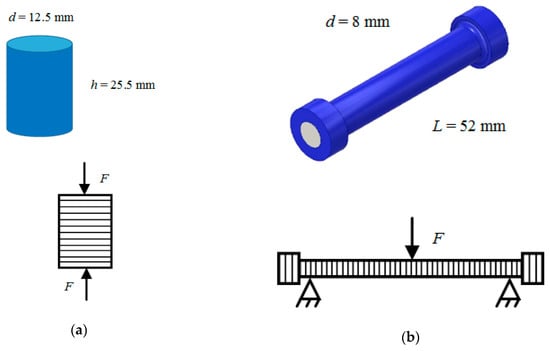
Figure 12.
Form and method of loading samples: (a) compression tests; (b) static bending tests.
The samples of the first type were tested on the universal test machine UT-02-0025 [28] for monotonic compression within about 25% of the sample height in accordance with the principle set out in the standard GOST 4651-2014 (ISO 604:2002) “Plastics. Compression test method” (Figure 13a). Figure 13b shows the samples after testing: on the left is the sample obtained by standard 3D printing, on the right is the sample obtained by winding two cylindrical layers on the core. The experiments are characterized by a load change rate equal to 120 N/s. The linear dimensions of the samples are determined using a caliper with a digital readout device of the ЧИЗ ШЦЦ-1-250 0.01 («220 volt» LLC, Moscow, Russia). The orientation of the test samples is shown in Figure 12a. When a compressive force is applied to the sample in the direction of laying the layers, the strength of the samples printed in a standard way is determined only by the strength of the interlayer interaction, regardless of the algorithm by which each layer is filled.
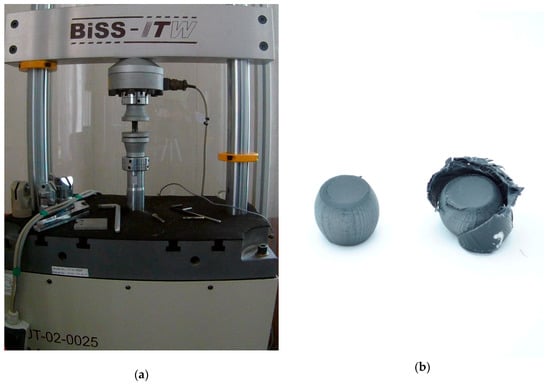
Figure 13.
Testing of cylindrical samples in compression: (a) installation; (b) samples after testing.
Figure 14 shows the diagrams obtained when testing reference materials and samples with two, six and 10 layers of wound material.
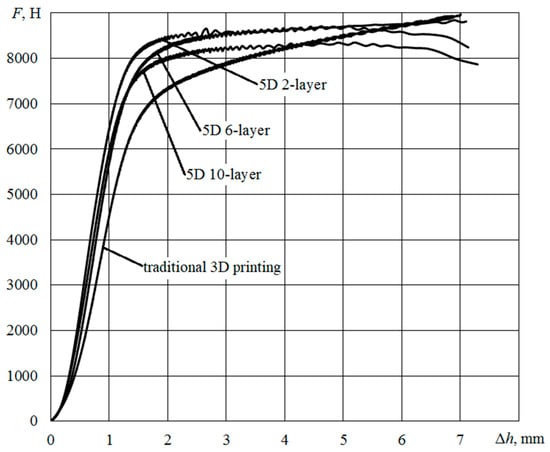
Figure 14.
Chart of compression of cylindrical samples.
Compression diagrams are characterized by a linear initial section with the values of the absolute deformation of the sample in height to 1.5 mm, the presence of an inflection point and an extended section of developed plasticity. The measured value of the absolute deformation Δh, and the load F in the inflection point, the calculated values of εs relative deformation and tension σ in compression at the point of inflection, and the calculated value of the modulus of elasticity Es are shown in Table 1. According to the standard, the modulus of elasticity is determined by two given values of the relative strain by the formula:
where σ2, σ1 is the compression stress at the strain value ε2 = 0.0025 and ε1 = 0.0005.

Table 1.
The results of the compression tests.
In the case of standard samples, no failure of the samples was observed, only their further shrinkage occurred. When testing samples with wound material, the strengthening layers were destroyed at the inflection point, after which the core printed by standard technology was flattened by analogy with standard samples. In the case of 5D samples with sufficiently thick cores (with two and four layers of winding), the destruction of the cores was also not achieved, unlike samples with thinner cores, which were destroyed by shifting the layers relative to each other, presumably due to the smaller contact area between the flat layers (Figure 13b).
Compression diagrams processing showed that with this type of loading, the presence of reinforcing cylindrical layers in the form of a material wound on the core contributes to some slowdown in the deformation process at the initial stage (before the destruction of the winding). Thus, the magnitude of the stress at the inflection point, at which the load growth rate drops sharply, for the standard sample was about 57 MPa, and for the 5D sample with two layers of winding about 66 MPa, with an increase in the number of cylindrical layers (and thus a decrease in the thickness of the core) reduced this value and shifted the linear portion towards the diagram of the standard sample.
The tests were compared with the model compression tests from the manufacturer [29]. The qualitative similarity of the obtained compression diagrams (Figure 14) with the exemplary and comparison of quantitative parameters (load F at the inflection point from 5442.9 to 6321.4 N, the tension σ = 49.3 MPa in average across the seven experiments, the modulus of elasticity Es = 1710 MPa) provide a basis to judge the correctness of the tests.
Samples of the second type were tested in the laboratory in accordance with the principle described in the standard GOST 4648-2014 (ISO 178:2010) “Plastics. Static bending test method”, in this case the samples were bent to their visible fracture with the fixation of the loading force at fracture without determining the behavior of the material during loading (Figure 15). Figure 16a shows the samples after testing: on the left is the sample obtained by standard 3D printing, on the right is the sample obtained by winding four cylindrical layers on the core. Figure 16b shows an enlarged view of the fracture place of 5D sample. The experiments are characterized by a distance between the supports equal to 47.20 mm. Measurement of the load at the time of failure was carried out using a mechanical general purpose dynamometer 5031-ДПУ-1-2 (Test instruments factory, LLC, Ivanovo, Russia). The linear dimensions of the samples are determined by means of a caliper with a digital device of the ЧИЗ ШЦЦ-1-250 0.01 (220 volt, LLC, Moscow, Russia). The orientation of the test specimens is shown in Figure 12b. With this test design, the critical load when testing samples printed in a standard way is determined only by the strength of the interlayer interaction. However, when testing samples with coiling, the critical load value will be determined not only by the interlayer interaction force, but also by the force that must be applied to fracture the coiled cylindrical layers.
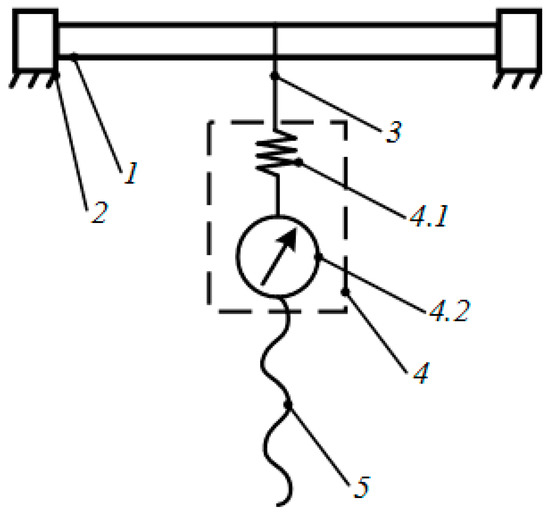
Figure 15.
Diagram of the setup for static bending tests of cylindrical samples: 1—sample; 2—supports; 3—cable connecting the sample and dynamometer; 4—dynamometer (4.1—elastic element, 4.2—reference device); 5—screw transmission.
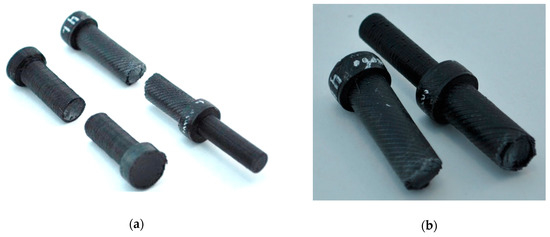
Figure 16.
Cylindrical samples after testing: (a) standard 3D printing sample (left) and 4-layer 5D printing sample (right); (b) enlarged view of the fracture place.
Four samples were tested for each number of layers. The values of the bending stress at fracture in each experiment were calculated from the fixed value of the bending force according to the formula:
The obtained values of the bending stress at fracture are averaged and shown in the diagram (Figure 17). The measured load values, standard deviation S and the calculated bending stress at fracture values are given in Table 2.
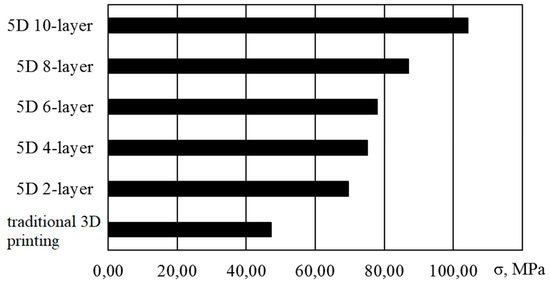
Figure 17.
Experimental values of bending stress at destruction of cylindrical samples.
Table 2.
Static bending test results.
The tests were compared with the static bending tests from the manufacturer [30], which used a sample length of about 60 mm with a rectangular cross section of 3 × 12.6 mm, the value of the critical bending force in seven experiments was about 100 N, and the bending stress at destruction was about 65.4 MPa.
Comparison of the test results of samples with the reinforcing layers winding both with the data obtained on samples with the same shape and size, and with the sample data shows that with this method of loading, an increase in the number of wound reinforcing layers leads to a uniform increase in the degree of resistance to destruction, and samples with a 10-layer winding of the material showed more than a twofold increase in strength compared to standard samples and a one-and-half increase in comparison with the sample tests.
4. Conclusions
The proposed technology allows us to produce FFF 3D-printing products of almost any shape (Figure 18), characterized by more uniform strength characteristics in different directions which, in particular, is expressed in a significant (up to 2.2 times) increase in bending strength compared to conventional 3D printing technology. Compressive strength in the area of small deformations is increased by 15%.
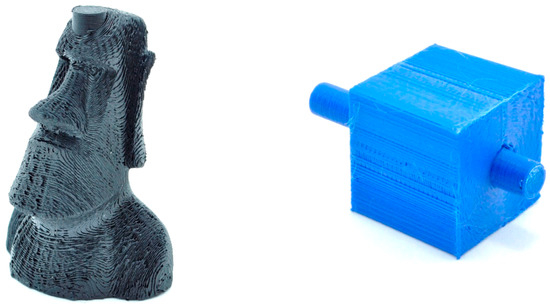
Figure 18.
Product samples obtained by spiral deposition of the material.
5. Patents
The special software developed for generation of the control program of the multi-axis 3D printer working on the presented technology is protected by the certificate of state registration of the computer program No. 2018662658 [26].
Author Contributions
3D-printer engineering and project administration, A.A.; electronics engineering and mathematical analysis, A.S.; software, I.G.; writing, review and editing and experimental investigation, I.T.; conceptualization and validation, A.D.; resources, A.M.; supervision, A.P. and Y.S.
Funding
This research was funded by Stereotech LLC, Volgograd State Technical University and Federal state budgetary institution “Fund of assistance to development of small forms of the enterprises in the scientific and technical sphere”, grant number 2425ГС2/21780, period from 03.04.2018 to 02.04.2019.
Acknowledgments
We thank Ripetsky A.V. and Zelenov S. V. (National Research University MAI) for their assistance in the development of algorithms for spiral material deposition.
Conflicts of Interest
The authors declare no conflict of interest.
References
- Lykov, P.A.; Baitimerov, R.M.; Panfilov, A.V.; Guz, A.O. The manufacturing of TiAl6V4 implants using selective laser melting technology. In Proceedings of the International Conference on Structural, Mechanical and Materials Engineering (ICSMME 2017), Seoul, Korea, 13–15 July 2017. [Google Scholar] [CrossRef]
- Airbus: Reimagining the Future of Air Travel. Available online: www.autodesk.com/customer-stories/airbus (accessed on 24 June 2019).
- Tomashev, V.P.; Shchelkonogov, A.E.; Oreshkina, N.S.; Zaitseva, T.A.; Zagrebina, E.S. Management of the industrial enterprise’s technological development of based on the use of additive manufacturing. In Proceedings of the World Congress on Engineering and Computer Science (WCECS 2018), San Francisco, CA, USA, 23–25 October 2018; pp. 741–746. [Google Scholar]
- Latipova, A.T.; Baitimerov, R.M. Gathering and Analysis of Experimental Data for Selective Laser Melting. In Proceedings of the Global Smart Industry Conference (GloSIC 2018), Chelyabinsk, Russia, 13–15 November 2018. [Google Scholar] [CrossRef]
- Alafaghani, A.; Qattawi, A.; Alrawi, B.; Guzman, A. Experimental Optimization of Fused Deposition Modelling Processing Parameters: A Design-for-Manufacturing Approach. Procedia Manuf. 2017, 10, 791–803. [Google Scholar] [CrossRef]
- Hambali, R.H.; Smith, P.; Rennie, A. Determination of the effect of part orientation to the strength value on additive manufacturing FFF for end-use parts by physical testing and validation via three-dimensional finite element analysis. Int. J. Mater. Eng. Innov. 2012, 3, 269–281. [Google Scholar] [CrossRef]
- Cuan-Urquizo, E.; Barocio, E.; Tejada-Ortigoza, V.; Pipes, R.B.; Rodriguez, C.A.; Roman-Flores, A. Characterization of the Mechanical Properties of FFF Structures and Materials: A Review on the Experimental, Computational and Theoretical Approaches. Materials 2019, 12, 895. [Google Scholar] [CrossRef] [PubMed]
- Banjanin, B.; Vladić, G.; Pál, M.; Balos, S.; Dramicanin, M.; Rackov, M.; Knežević, I. Consistency analysis of mechanical properties of elements produced by FFF additive manufacturing technology. Matéria (Rio de Janeiro) 2018, 23. [Google Scholar] [CrossRef]
- Sapozhnikov, S.B.; Leshkov, E.V.; Ivanov, M.A.; Yaroslavtsev, S.I.; Shcherbakov, I.A. Experimental and FEM short-term tensile strength assessment of U- and sharp V-notched specimens made of ductile material. PNRPU Mech. Bull. 2018, 2, 96–106. [Google Scholar] [CrossRef]
- Popescu, D.; Zapciu, A.; Amza, C.; Baciu, F.; Marinescu, R. FDM process parameters influence over the mechanical properties of polymer specimens: A review. Polym. Test. 2018, 69, 157–166. [Google Scholar] [CrossRef]
- Rabinskiy, L.N.; Ripetskiy, A.V.; Zelenov, S.V.; Kuznetsova, E.L. Analysis and monitoring methods of technological preparation of the additive production. J. Ind. Pollut. Control 2017, 33, 1178–1183. [Google Scholar]
- Jo, W.; Kwon, O.C.; Moon, M.W. Investigation of influence of heat treatment on mechanical strength of FDM printed 3D objects. Rapid Prototyping J. 2018, 24, 637–644. [Google Scholar] [CrossRef]
- Aliheidari, N.; Christ, J.; Tripuraneni, R.; Nadimpalli, S.; Ameli, A. Interlayer adhesion and fracture resistance of polymers printed through melt extrusion additive manufacturing process. Mater. Des. 2018, 156, 351–361. [Google Scholar] [CrossRef]
- Deng, X.; Zeng, Z.; Peng, B.; Yan, S.; Ke, W. Mechanical Properties Optimization of Poly-Ether-Ether-Ketone via Fused Deposition Modeling. Materials 2018, 11, 216. [Google Scholar] [CrossRef] [PubMed]
- Duty, C.; Failla, J.; Kim, S.; Smith, T.; Lindahl, J.; Kunc, V. Z-Pinning approach for 3D printing mechanically isotropic materials. Addit. Manuf. 2019, 27, 175–184. [Google Scholar] [CrossRef]
- Chakraborty, D.; Reddy, B.A.; Choudhury, A.R. Extruder path generation for Curved Layer Fused Deposition Modeling. Comput.-Aided Des. 2008, 40, 235–243. [Google Scholar] [CrossRef]
- Singamneni, S.; Roychoudhury, A.; Diegel, O.; Huang, B. Modeling and evaluation of curved layer fused deposition. J. Mater. Process. Technol. 2012, 212, 27–35. [Google Scholar] [CrossRef]
- Guan, H.W.; Savalani, M.M.; Gibson, I.; Diegel, O. Influence of Fill Gap on Flexural Strength of Parts Fabricated by Curved Layer Fused Deposition Modeling. Procedia Technol. 2015, 20, 243–248. [Google Scholar] [CrossRef]
- McCaw, J.; Cuan-Urquizo, E. Curved-Layered Additive Manufacturing of non-planar, parametric lattice structures. Mater. Des. 2018, 160, 949–963. [Google Scholar] [CrossRef]
- Gao, W.; Zhang, Y.; Nazzetta, D.C.; Ramani, K.; Cipra, R.J. RevoMaker: Enabling Multi-directional and Functionally-embedded 3D printing using a Rotational Cuboidal Platform. In Proceedings of the 28th Annual ACM Symposium on User Interface Software and Technology (UIST 2015), Charlotte, NC, USA, 11–15 November 2015; pp. 437–446. [Google Scholar] [CrossRef]
- Wulle, F.; Coupek, D.; Schäffner, F.; Verl, A.; Oberhofer, F.; Maier, T. Workpiece and Machine Design in Additive Manufacturing for Multi-Axis Fused Deposition Modeling. In Proceedings of the 27th Complex Systems Engineering and Development (CIRP 2017), Cranfield, UK, 10–12 May 2017; pp. 229–234. [Google Scholar] [CrossRef]
- Chen, L.; Chung, M.F.; Tian, Y.; Joneja, A.; Tang, K. Variable-depth curved layer fused deposition modeling of thin-shells. Rob. Comput. Integr. Manuf. 2019, 57, 422–434. [Google Scholar] [CrossRef]
- Xu, K.; Li, Y.; Chen, L.; Tang, K. Curved layer based process planning for multi-axis volume printing of freeform parts. Comput.-Aided Des. 2019, 114, 51–63. [Google Scholar] [CrossRef]
- Gushchin, I.A.; Avdeev, A.R.; Shvets, A.A.; Drobotov, A.V. Principles of creating a program for operating a 3D printing device using a three-dimensional model. VSTU News 2015, 173, 50–53. [Google Scholar]
- Shvets, A.A.; Drobotov, A.V.; Gushchin, I.A.; Avdeev, A.R. Manage 3D printer with additional degrees of freedom. VSTU News 2017, 204, 74–77. [Google Scholar]
- Avdeev, A.R.; Gushchin, I.A.; Drobotov, A.V.; Shvets, A.A.; Popov, A.Y. Calculation of the Trajectory of the Print Head of a 3D Printer with Additional Degrees of Freedom for Printing Cylindrical Products. RU Patent No. 2018662658 (computer program), 12 October 2018. [Google Scholar]
- Popov, A.Y.; Gushchin, I.A.; Drobotov, A.V. Model Preparation Algorithm for 3D Printing with Discrete Rotation. In Proceedings of the 2019 International Conference on Industrial Engineering, Applications and Manufacturing (ICIEAM 2019), Sochi, Russia, 25–29 March 2019. [Google Scholar] [CrossRef]
- 56317-14: Universal UT testing machines. Available online: www.kip-guide.ru/info/56317-14 (accessed on 24 June 2019).
- Protocol No. 3/С-REC ABS. Determination of Compression Characteristics of Plastics. Available online: rec3d.ru/images/certs/mater/zshatie%20ABS.pdf (accessed on 12 May 2019).
- Protocol No. 3/И-REC ABS. Determination of Bending Characteristics of Plastics. Available online: https://rec3d.ru/images/certs/mater/izgib%20ABS.pdf (accessed on 23 June 2019).


© 2019 by the authors. Licensee MDPI, Basel, Switzerland. This article is an open access article distributed under the terms and conditions of the Creative Commons Attribution (CC BY) license (http://creativecommons.org/licenses/by/4.0/).