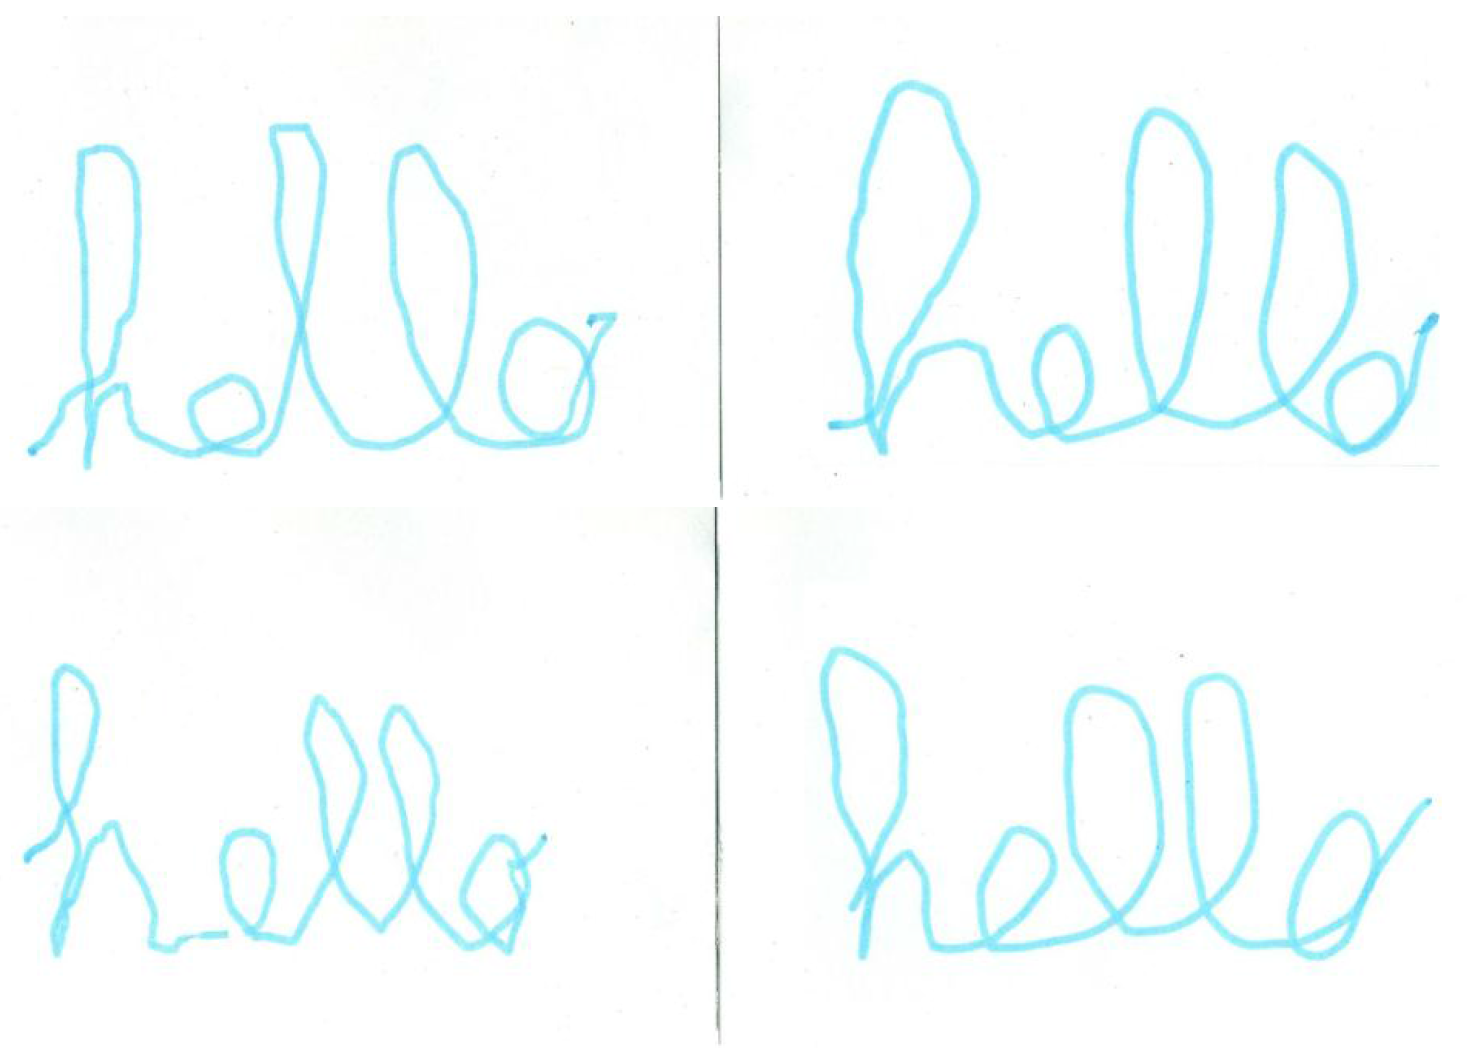
The objective of the following analysis is to study the haptic rendering of the bilateral system. Some qualitative observations have been made on the results of the two experimental sessions and need to be investigated. First, the proposed methodology will be presented. The results of the two experimental sessions will then be examined and compared in order to understand the impact of the haptic learning on the participants.
4.1. Methodology
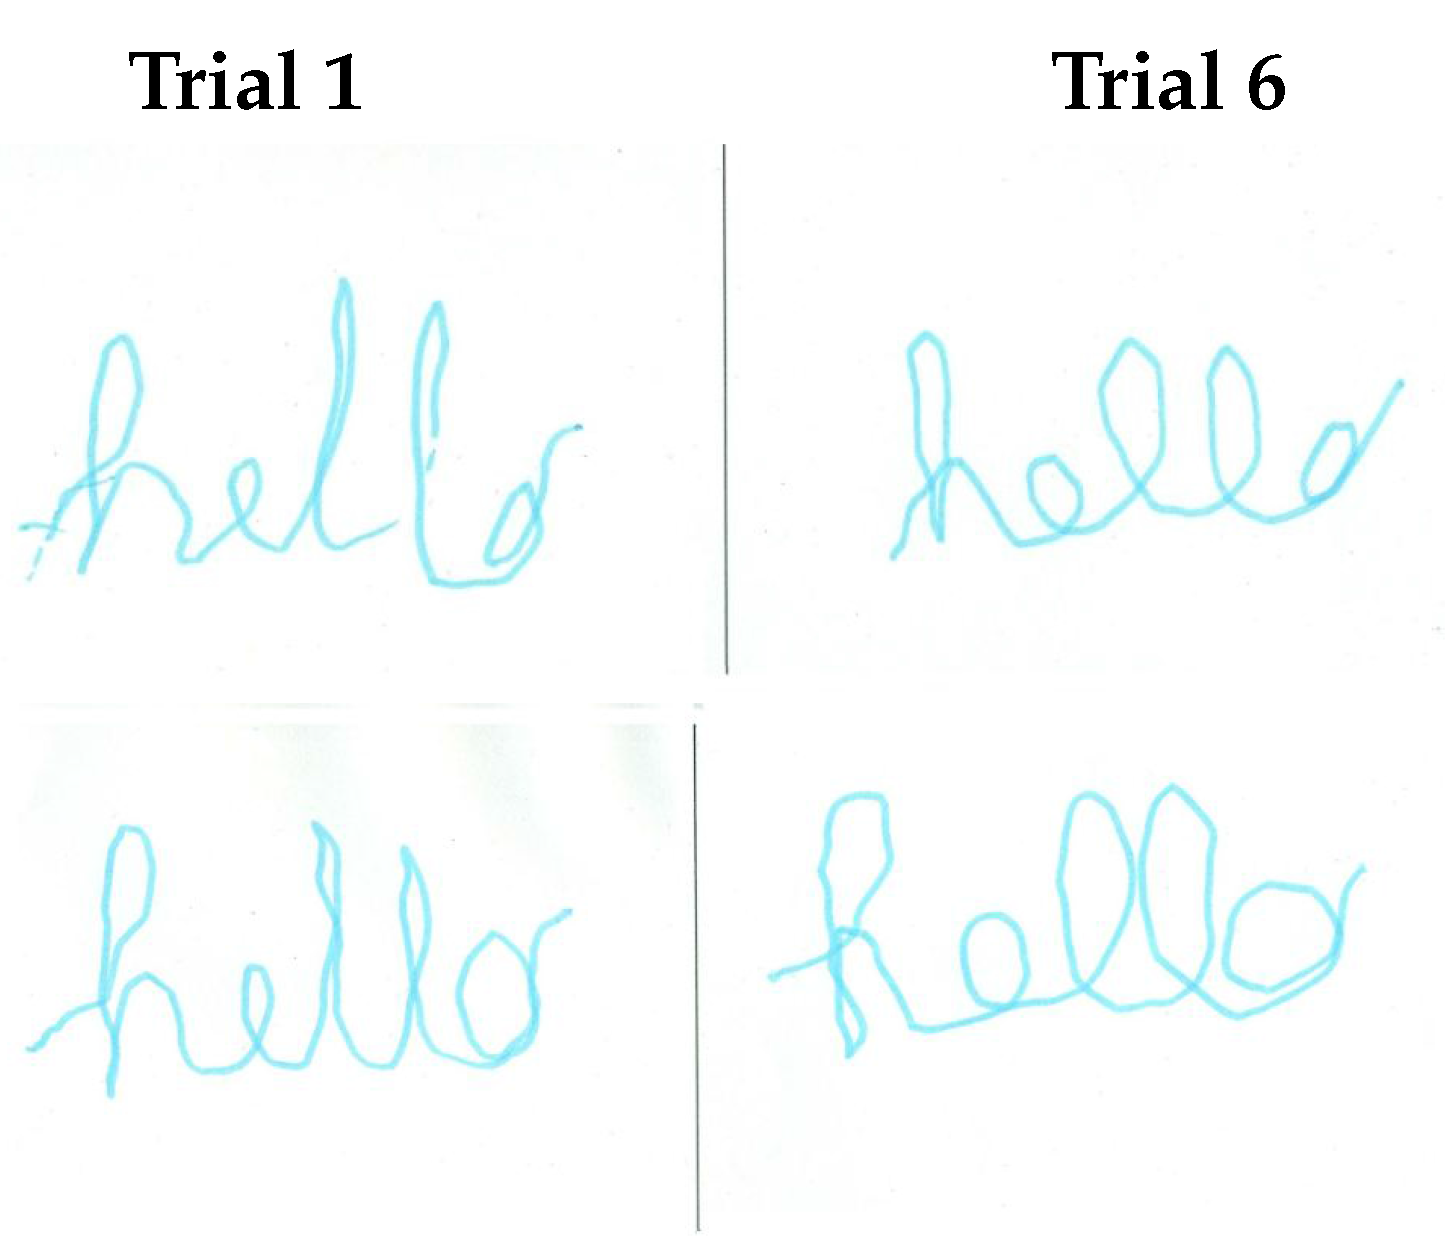
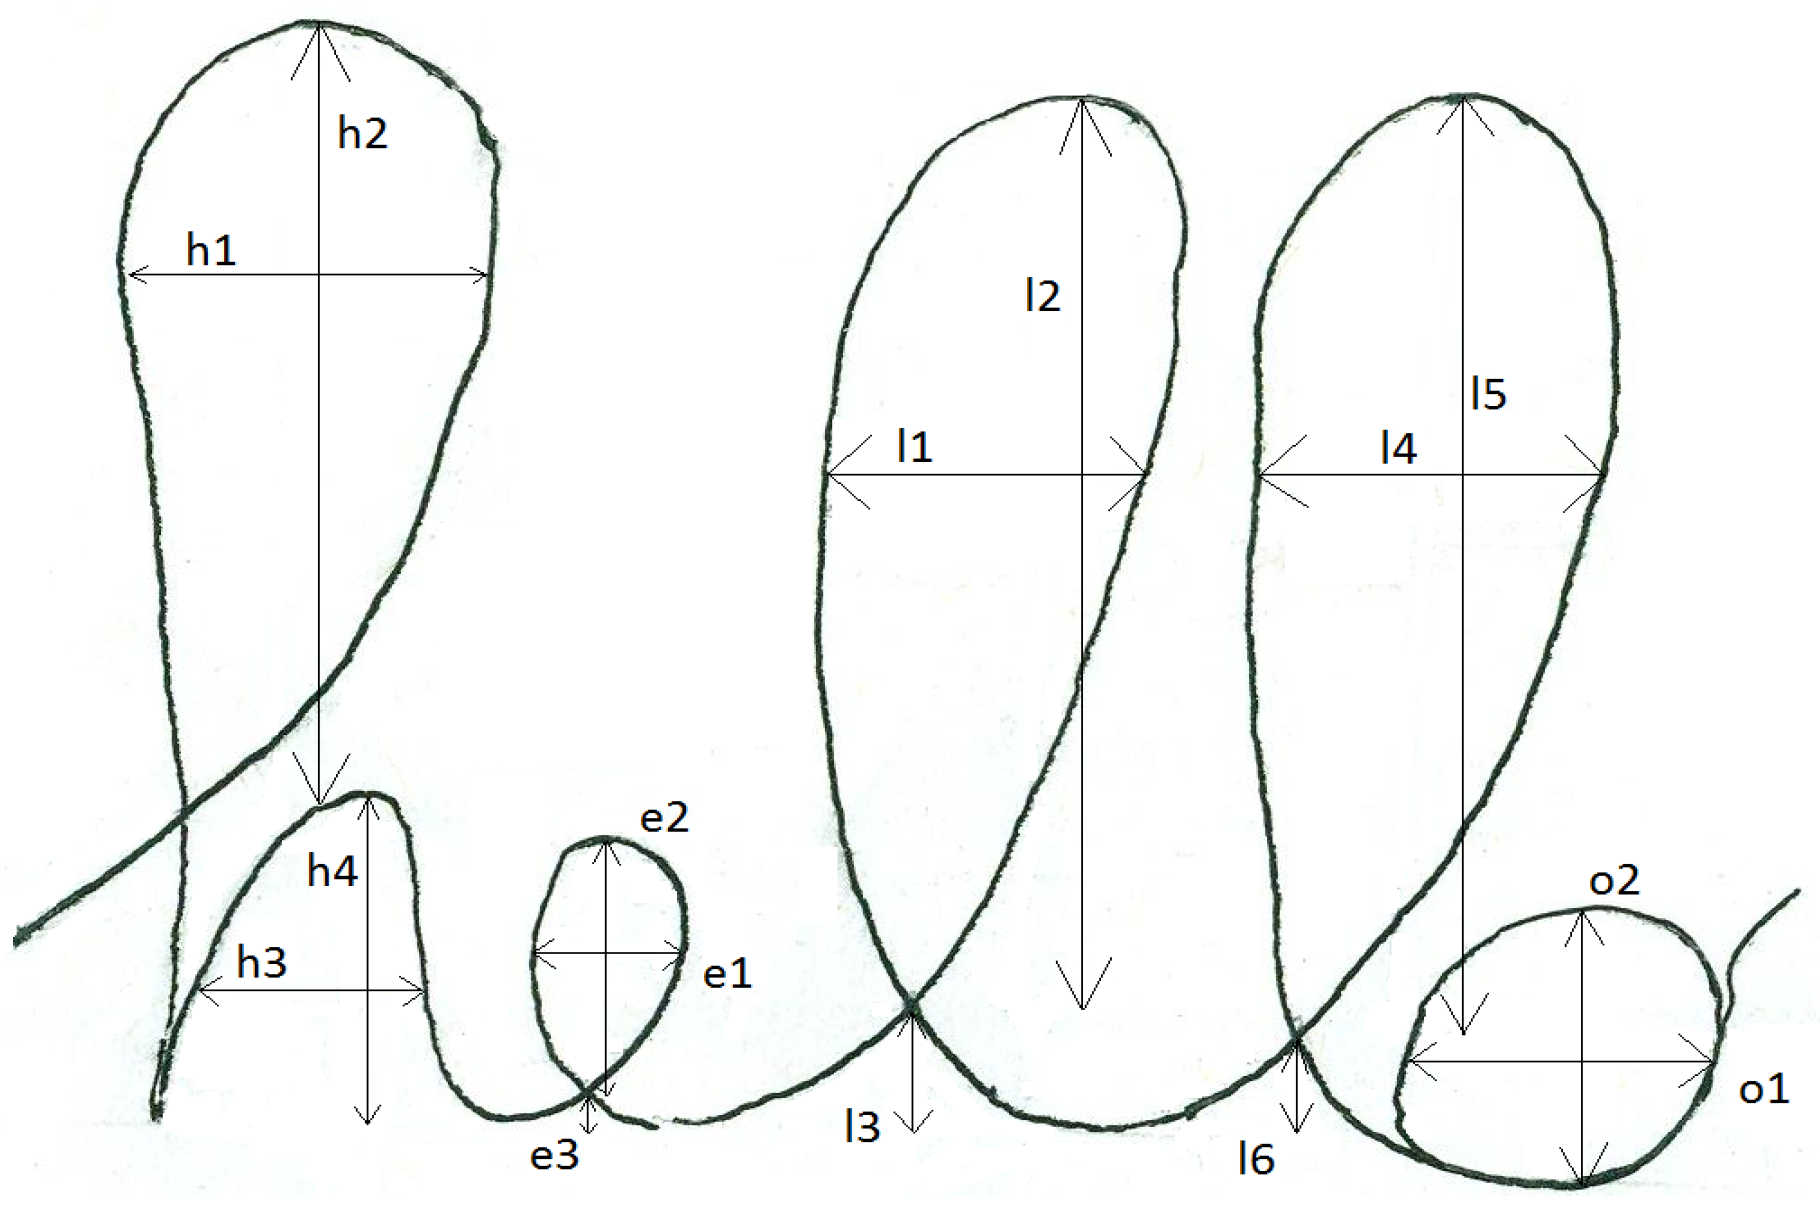
In order to study the subjects’ performances in a quantitative way, we need to define some measurable parameters. The goal is to examine mathematically the writing style of a person, trying not to complicate too much the analysis. It was decided then to consider 15 measures of distance, which have to be taken on the handwritten word
hello: four measurements for the letter
H, three for the
E and for the two
L and two for the
O, as shown in
Figure 5. The fifteen values have been chosen in a well-defined way. The distances
,
and
refer to the height of the intersection points with respect to the beginning and the end of the letter respectively for the
E and the two
L. The other twelve, instead, can be seen as the six couples of major and minor semi-axes of the six ellipses that compose the word hello: two for the letter
H, one for each of the other four letters. Even if it is an approximation, they represent a reasonable index of the shape, hence the style, of the handwritten letters. All distances are shown in
Figure 5. In this figure, the distances are measured on the model which has been taken to study the students’progress from the first to the last trial. The ideal
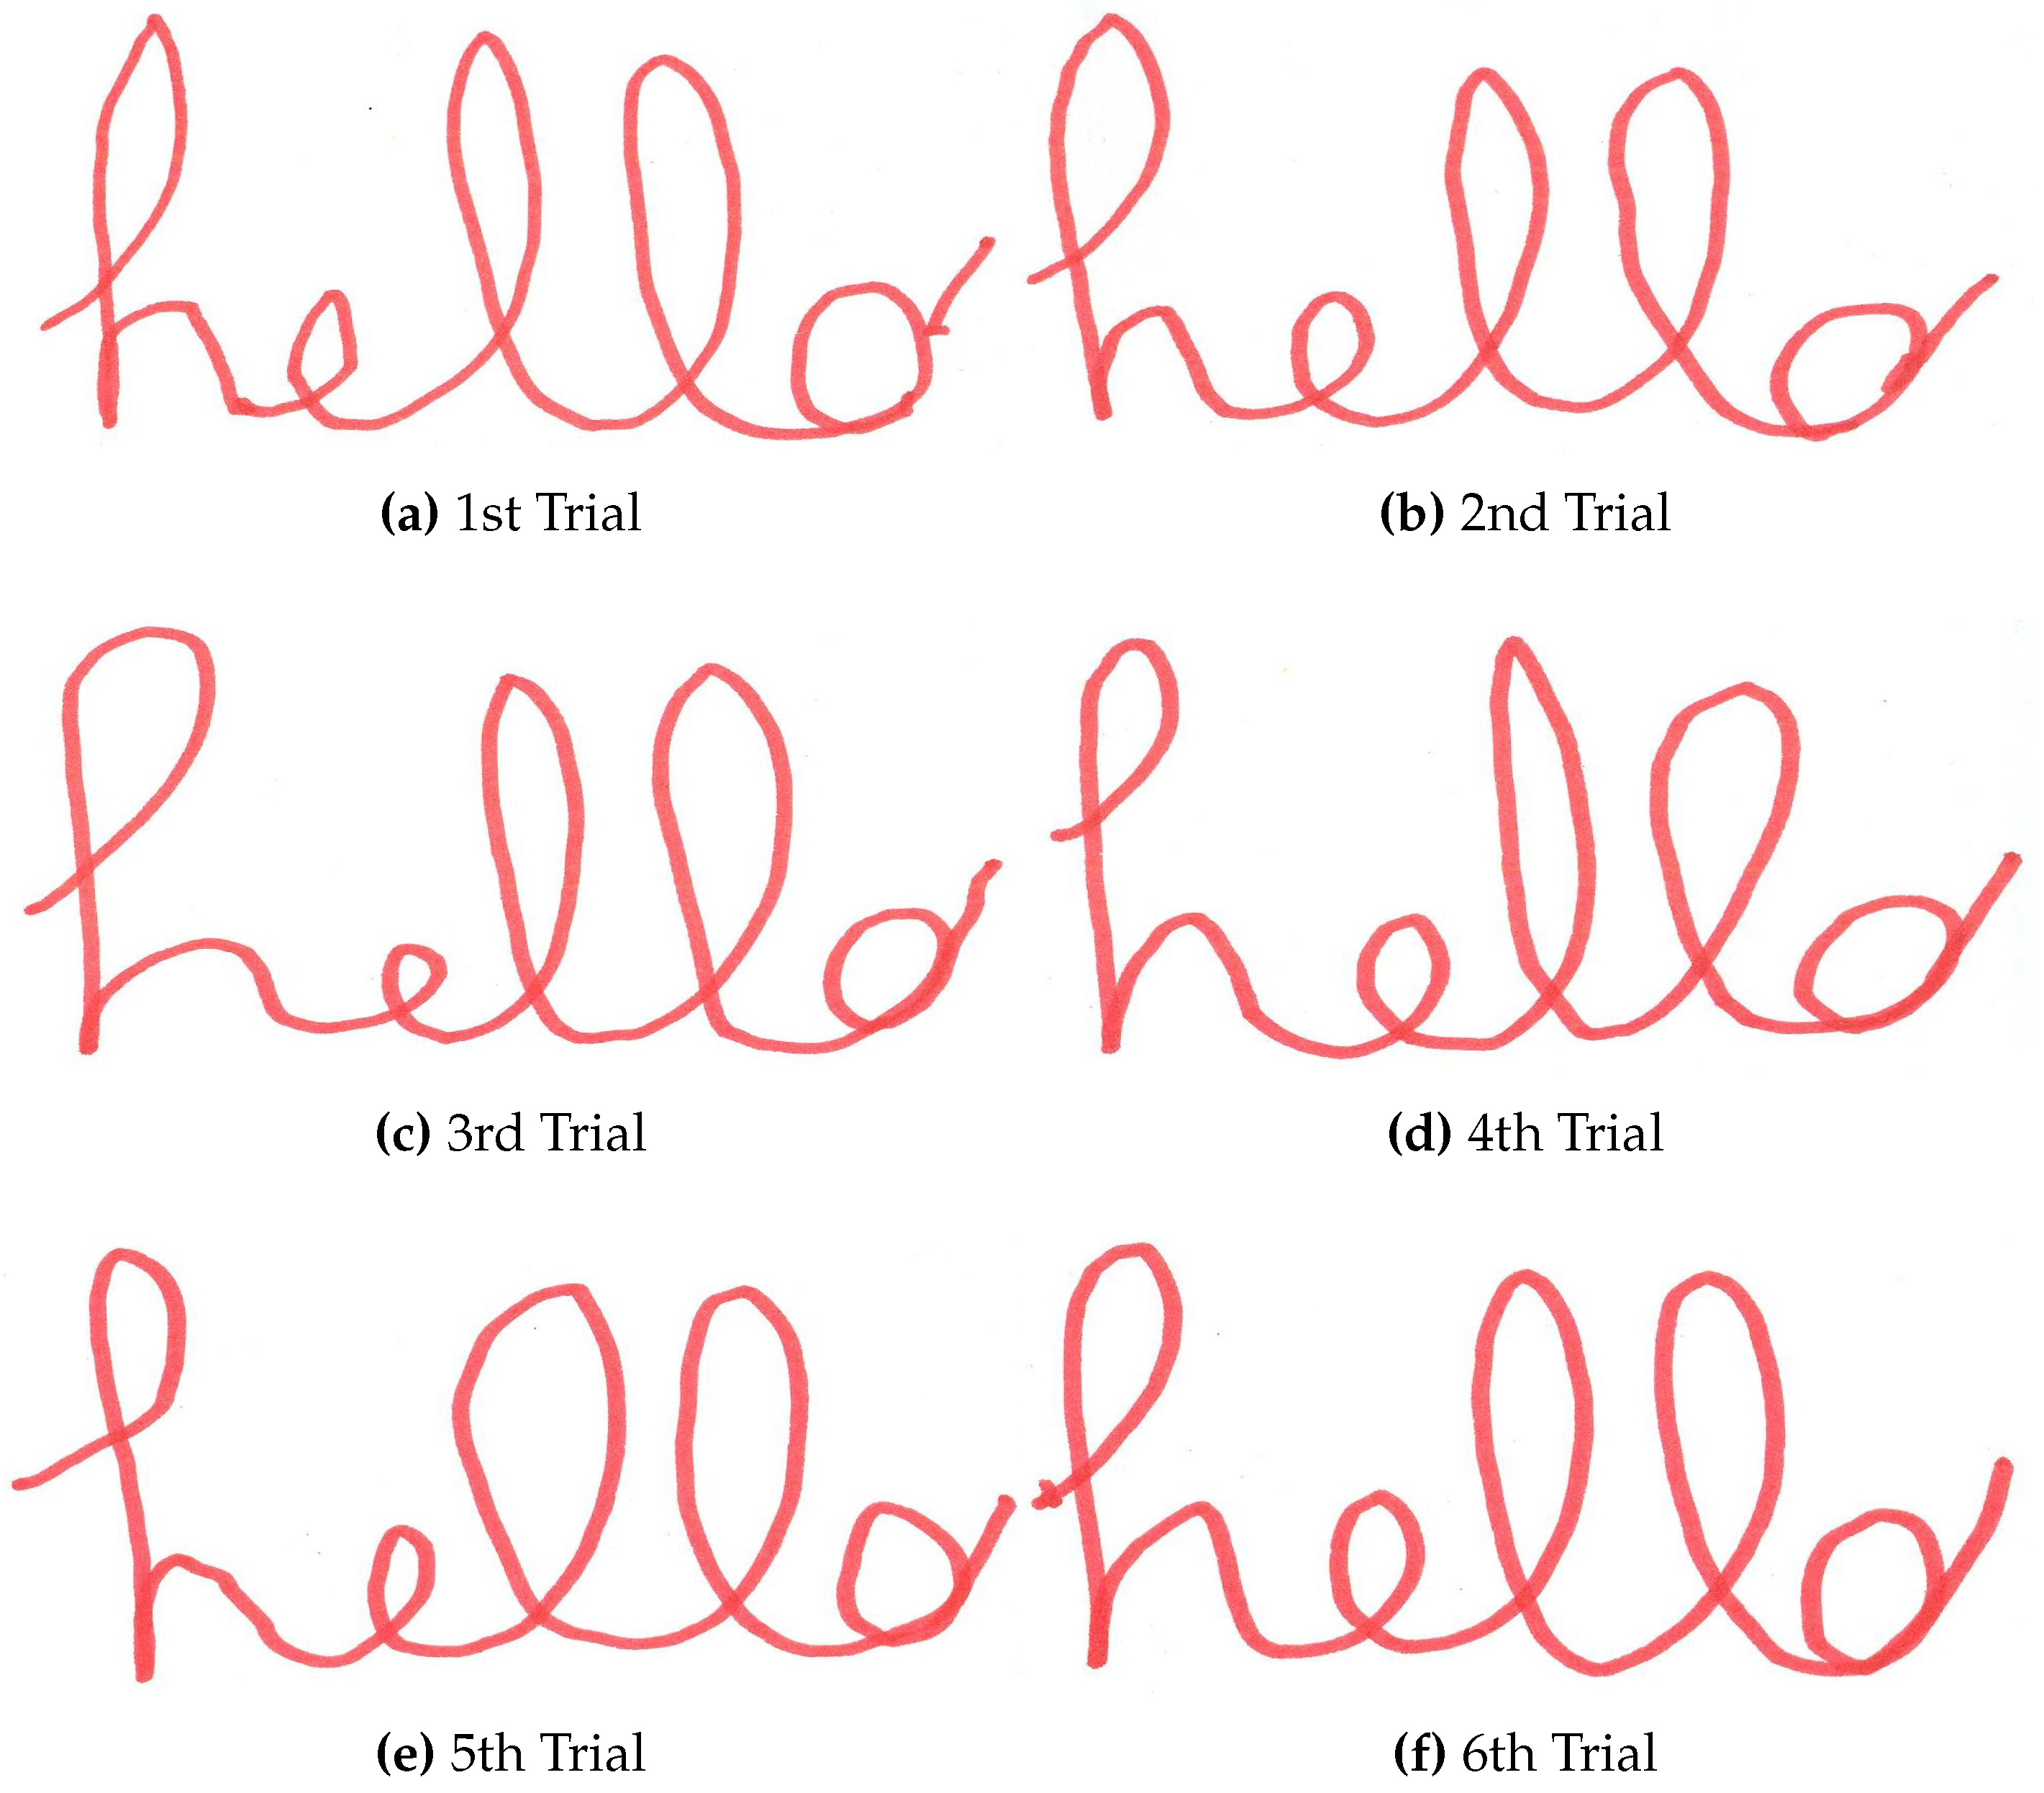
hello does not represent the perfect handwritten word. In the first session, it is the word written by the teacher, using the mechanism, in the way he wrote during the experiments. Note that the teacher did not change in the course of the experimental session. In other words, it represents the writing style to which, according to our qualitative observation, all the participants get used to write in the course of the test. This is a crucial point: what we want to study is not how well the students perform the test, but how close to the teacher they get while doing it. In the second session, the
shown in
Figure 5 represents the handwriting style that the participants were asked to reply. Similarly to the first experimental session, this model constitutes an approximation. In fact, it is assumed that the teacher wrote in the exact same way during the whole experimental session, which is humanly impossible. On the other hand, it is plausible to assume that the teacher used the same handwriting style. For this reason, we expect to get some relevant indications about the learning process of the students from this analysis.
Once the model to refer to is well defined, the analysis can be performed. At first, we measured the 15 distances in the model, thereby obtaining the reference values. Secondly, the measurements were taken on all the participants’ handwritten words of both the first and the second group. Afterwards, for each analyzed trial, we calculated the fifteen distance gaps noted
, as follows:
where
x represents the considered distance and
D a weighting coefficient. The equation is applied for each of the 15 distances, so
. The gap is the absolute value of the difference between the reference distance and the weighted distance value of the student. The total gap,
η, is then computed as the sum of all gaps, namely
The coefficient
D is the square root of the ratio between the model’s estimated occupied area,
, and the student’s estimated occupied area,
:
By occupied area it is meant the portion of space that the student needs to write the prescribed word. Both tests were performed on customized sheets. These sheets were divided into six frames, which were drawn to give to the students some writing limits, but still the word dimension changes from subject to subject. It is worth noting that, in the course of the first test, the teacher did not impose the word size. What the teacher did was to follow the subject’s movement, trying to correct and arrange it according to his/her writing style. If the subject were used to write small letters, the teacher didn’t impose any resizing. On the other hand, the teacher did transmit to the novice other peculiarities. In the considered case, i.e., according to the style of the teacher chosen for the experiment, the letter L did tend to be more rounded and its intersection point lower. Hence, what really matters is the proportion inside each of the letters of the word hello. This is the purpose of the scaling factor: in order to correctly compare these proportions, the words need to be properly scaled.
4.2. Haptic Test
Table 1 shows the distance gaps, calculated by means of Equation (17), between all the participants’ handwritten words and the
model. These gaps are calculated trial by trial and expressed in millimeters. In general, it can be observed how the distance gaps significantly decrease during the learning session for all participants. The mean distance gap decreased more than 40% at the end of the session. When analysing in more detail, one can notice that the evolution of the distance gaps changes according to the subject and does not decrease in a constant way. Consider for instance the second trial, which is the first one with the haptic learning. As it could be expected, its mean distance gap is 23% less than the mean distance gap of the first trial. This is the largest difference in the sequence and is an evidence of the relevance of the haptic rendering of the bilateral system. Yet, two out of eight subjects’ distance gap increased after the first guided trial. That may depend on a longer period of adaptation of the subjects to the haptic system or to the teacher’s handwriting fashion. Another insteresting consideration can be made about the last two rows of
Table 1, which contain the mean distance gaps and the associated standard deviations for all subjects, trial by trial. As it can be noticed, the mean value happens to increase in the fourth trial. This outcome depends very likely on the teacher, who decided to try reducing the haptic guidance on the subjects. On the other hand, that is not the case for all the subjects. For instance, subject 3’s haptic guidance was reduced in the third trial. Hence, the performance of each subject during the learning session,
i.e., from the second to the fifth trial, mainly depends on the haptic guidance provided by the teacher, who is free to modulate his/her external assistance according to the student’s needs.
Table 1.
The table shows the distance gaps between all participants to the haptic test and the model, trial by trial (mm). In bold, the data that are used for the statistical analysis.
Table 1.
The table shows the distance gaps between all participants to the haptic test and the model, trial by trial (mm). In bold, the data that are used for the statistical analysis.
| Subject | Trial 1 | Trial 2 | Trial 3 | Trial 4 | Trial 5 | Trial 6 |
|---|
| S. 1 | 8.510 | 5.283 | 3.141 | 6.202 | 4.612 | 4.601 |
| S. 2 | 12.911 | 6.463 | 6.651 | 8.812 | 6.987 | 7.373 |
| S. 3 | 9.812 | 5.407 | 7.095 | 5.070 | 6.166 | 5.810 |
| S. 4 | 5.582 | 4.084 | 4.606 | 3.601 | 5.105 | 3.745 |
| S. 5 | 13.244 | 17.741 | 9.473 | 14.507 | 9.180 | 7.682 |
| S. 6 | 11.397 | 8.152 | 7.434 | 9.837 | 7.826 | 5.978 |
| S. 7 | 14.620 | 9.156 | 7.359 | 8.242 | 6.849 | 6.909 |
| S. 8 | 7.069 | 7.381 | 6.144 | 6.659 | 7.023 | 6.562 |
| Mean | 10.393 | 7.958 | 6.488 | 7.866 | 6.719 | 6.083 |
| SD | 2.988 | 4.007 | 1.797 | 3.146 | 1.361 | 1.269 |
As it was stated in the introduction of this paper, the figure of the teacher is central in a direct interaction approach. It is the teacher who guides the students (here the subjects of the experimental session) and decides whether to apply a more effective haptic feedback or to let them try on their own. This choice is arbitrary and the teacher’s guidance may be different from student to student and depending on several aspects.
4.3. Blank Test
Table 2 shows the distance gaps, calculated by means of Equation (17), between all the participants’ handwritten words and the
model. These gaps are calculated trial by trial and expressed in millimeters.
Table 2.
The table shows the distance gaps between all participants to the blank test and the model, trial by trial (mm). In bold, the data that are used for the statistical analysis.
Table 2.
The table shows the distance gaps between all participants to the blank test and the model, trial by trial (mm). In bold, the data that are used for the statistical analysis.
| Subject | Trial 1 | Trial 2 | Trial 3 | Trial 4 | Trial 5 | Trial 6 |
|---|
| S. 1 | 4.038 | 4.449 | 4.402 | 5.076 | 5.104 | 5.918 |
| S. 2 | 5.565 | 6.100 | 4.800 | 7.099 | 5.900 | 6.378 |
| S. 3 | 8.689 | 7.605 | 7.596 | 7.201 | 8.268 | 7.469 |
| S. 4 | 7.765 | 6.188 | 8.127 | 8.213 | 7.411 | 7.709 |
| S. 5 | 7.588 | 7.720 | 7.529 | 7.057 | 7.400 | 7.314 |
| S. 6 | 7.681 | 6.079 | 5.934 | 6.988 | 7.745 | 5.235 |
| S. 7 | 5.068 | 4.828 | 5.446 | 5.502 | 5.672 | 6.221 |
| S. 8 | 4.936 | 6.102 | 8.788 | 7.064 | 8.002 | 6.545 |
| Mean | 6.416 | 6.134 | 6.578 | 6.775 | 6.9378 | 6.599 |
| SD | 1.595 | 1.074 | 1.534 | 0.940 | 1.120 | 0.792 |
Two main considerations can be immediately made. First, the distance gaps are much smaller for all participants starting from the very first trial. The most likely explanation is that the proposed task is quite easy for normal people. Second, there is no general improvement in the students’ performances and the mean distance gap is basically constant. In this sense, the most representative case is subject 5’s performance. For subject 7 and subject 1, the final trial is also the worst one. These subjects have probably lost their attention at the end of the experimental session. In general, the blank test participants appear to be capable of reproducing the model in an appreciable fashion, but they seem unable to improve their performances in the course of the experiment.
It is now interesting to compare the results of the two experimental sessions in order to better understand the contribution of the proposed bilateral system to the problem of the learning and the assessment of handwriting capabilities. For this reason, a statistical analysis is performed and presented in the next section.
4.4. Statistical Analysis
In order to compare methodologically the results of the two experimental sessions, a statistical analysis is proposed. The objective is to verify whether there is a significant difference in the handwriting style between the two groups of subjects and within these two groups, considering the performances at the beginning and at the end of the tests. Despite the limited number of subjects, some interesting results may be inferred.
The analysis within the two different groups is initially proposed. A suitable statistical test is the within subject one-way ANOVA, also known as repeated measures ANOVA, which allows to study related data sets. In our analysis and considering one experimental session at a time, the data set associated to each trial is related to all other data sets, because the same subjects are tested several times on the same “dependent variable”, here the distance gap.
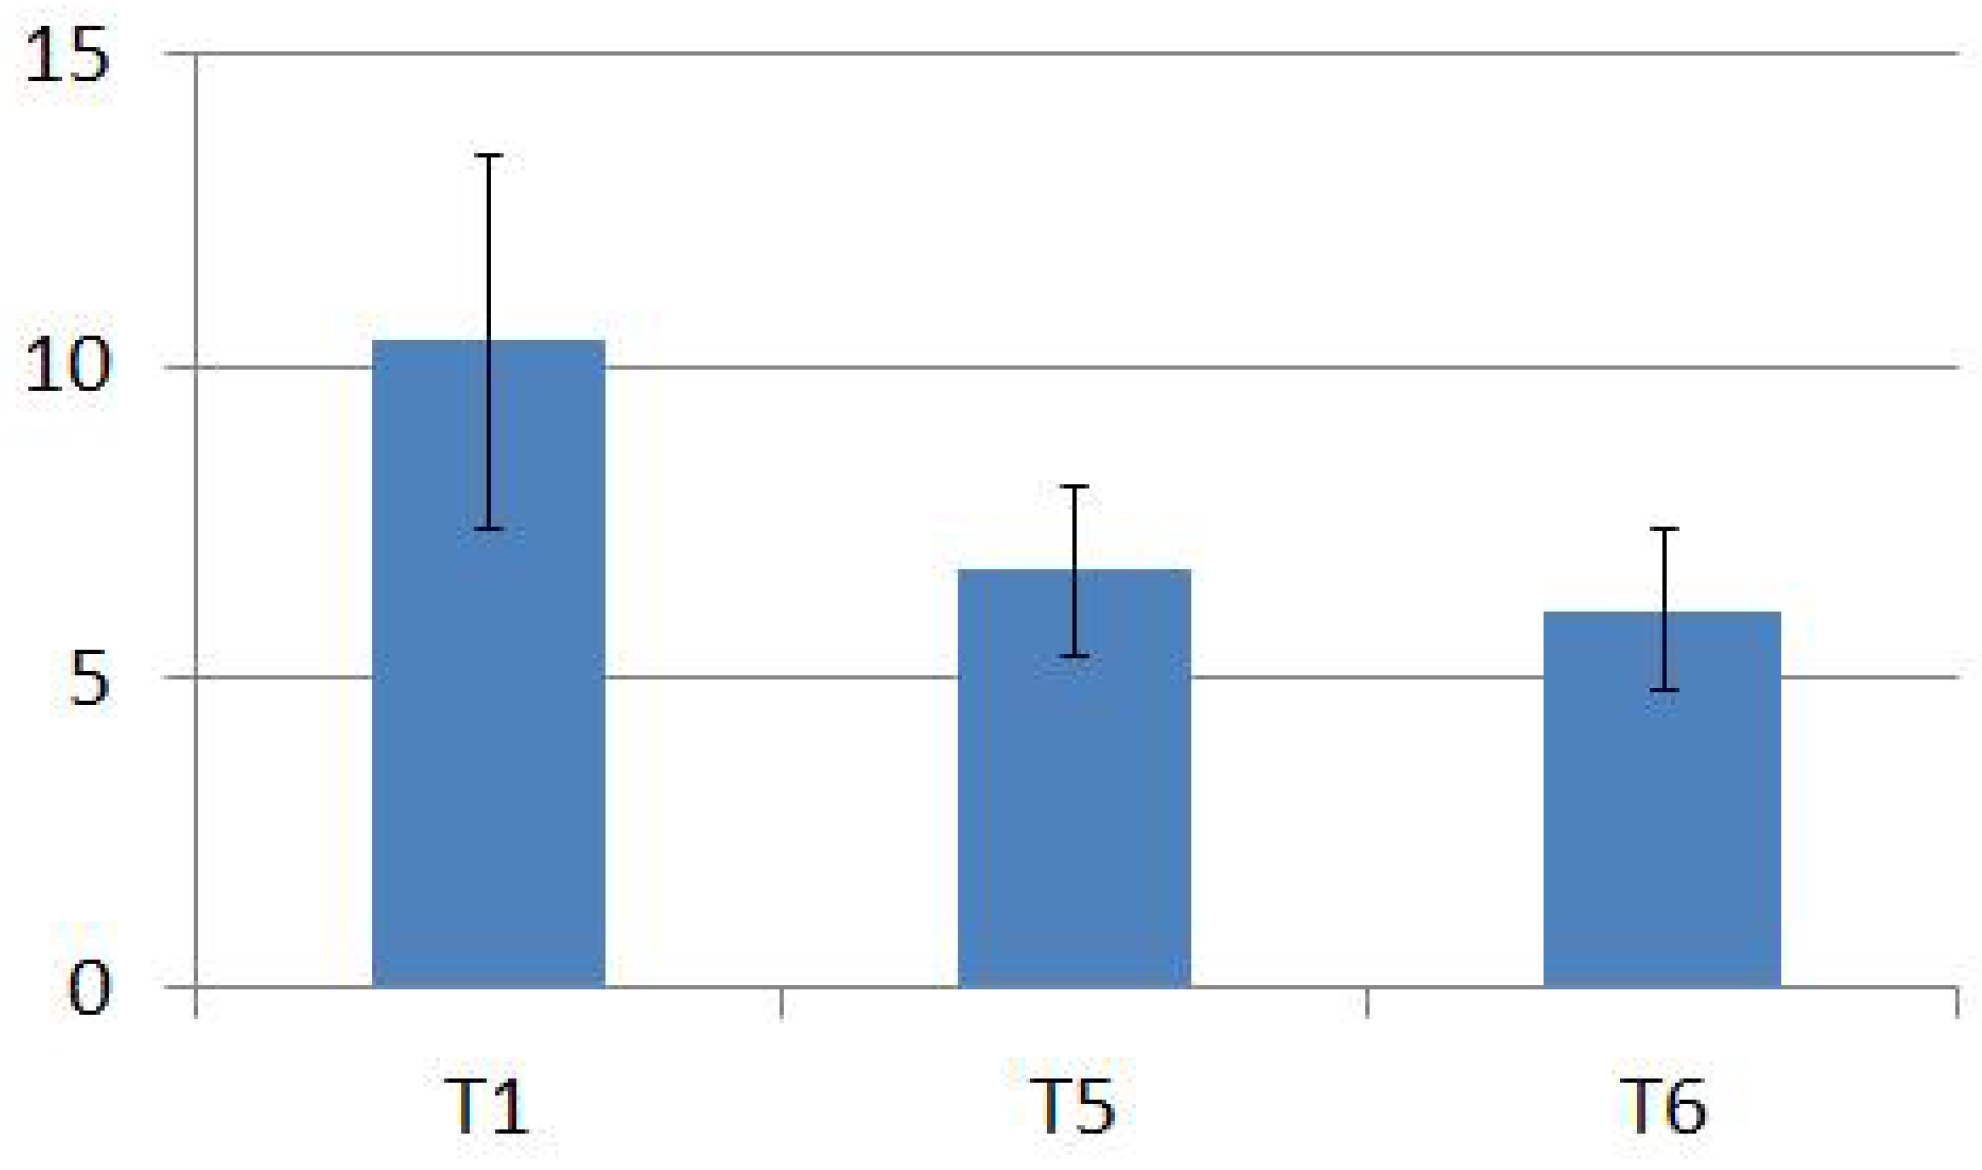
Consider first the haptic experimental session. It is interesting to compare the results of the first trial with those of the last trial of the learning session, that is the fifth trial of the test, and with those of the last trial of the test.
Figure 7 represents the mean distance gaps and the standard deviations for the data sets related to these trials. The repeated measures ANOVA performed on these data sets,
i.e., the first, the fifth and the sixth columns of
Table 1, rejects the null hypothesis, which states that all means are equal. More precisely, one can obtain
, which leads to a
p-value
. It is easily demonstrable that there is no statistically significant difference between means of the data sets related to the fifth (
mm) and the sixth trials (
mm). Hence, the mean distance gap of the first trial data set (
mm) does differ from the others. In other words, there is a statistically significant effect of the haptic learning on the handwriting style of the subjects of the first group.
Figure 7.
Mean distance gaps and standard deviations of all the subjects for the first, the fifth and the sixth trial of the haptic experimental session. The values are expressed in millimeters.
Figure 7.
Mean distance gaps and standard deviations of all the subjects for the first, the fifth and the sixth trial of the haptic experimental session. The values are expressed in millimeters.
Note that the variances of the three data sets are quite different, and so are the covariances that can be easily computed. Hence, the assumption of sphericity of the data may not be respected. Violation of sphericity makes a repeated-measures ANOVA test more likely to produce a false positive (a Type 1 error). A Mauchly’s sphericity test might be performed, but it is less efficient on small samples. Besides, an eventual correction to the degrees of freedom of the test, which would increase the p-value, will very unlikely change the final outcome of the test, since the p-value is extremely small.
Consider now the blank test. Since there is no haptic learning, the results measured at each trials of this experimental session are equally relevant.
Figure 8 represents the mean distance gaps and the standard deviations for every data set of the blank test. The repeated measures ANOVA performed on the data sets associated to all trials of the blank test,
i.e., all columns of
Table 2, accepts the null hypothesis, which states that all means are equal. More precisely, one can obtain
, which leads to a
p-value
. Hence, the simple repetition of the task with no haptic guidance does not engender any statistically significant effect on the handwriting style of the subjects of the second group.
Figure 8.
Mean distance gaps and standard deviations of all the subjects for every trial of the blank test. The values are expressed in millimeters.
Figure 8.
Mean distance gaps and standard deviations of all the subjects for every trial of the blank test. The values are expressed in millimeters.
Eventually, one can compare the results of the subjects of the two groups. For instance, it is interesting to study whether there is a statistically significant difference between the two groups at the beginning and at the end of the two experimental sessions. An independent two sample t-test is then performed twice as well as a 95% confidence intervals for the mean difference. First, it is found that the means of the data sets related to the first trial of both experimental sessions (haptic test: mm; blank test: mm) are statistically different (, ). Secondly, it is found that the mean of the data set associated to the last trial of the haptic test ( mm) is not significantly different from the mean of the data set associated to the last trial of the blank test ( mm) (, ). In other words, the subjects of the two groups write in different fashions at the beginning of their respective experimental sessions but, eventually, no significant difference is observable in their handwriting styles.
Note that, in both cases, an “equal sample size – equal variance” t-test is performed. Equality of the variances can be assessed by Levene’s test, which tests the null hypothesis that the population variances are equal. The Levene’s test performed on the first trial data sets provides a p-value . The Levene’s test performed on the last trial data sets provides a p-value . If the significant level is set equal to , which is the norm, it results that in both cases the null hypothesis is accepted (). Thus, there is no difference between the variances of the data sets and an equal variance t-test can be run.
4.5. Relevance of the Haptic Guidance
The statistical analysis presented in the previous section confirmed the first impressions based on a simple observation of the results. The subjects of the first group started writing using their own handwriting styles, which were more or less different from the teacher’s style, depending on the subject. They were told what to write, not how to do that. Hence, large distance gaps were measured at the very first trial of the session (1st column of
Table 1). During the haptic learning session, the teacher guided and corrected the subjects and so taught them to write in his personal fashion. At the end of the session, the subjects’ handwriting style was significantly closer to the teacher’s style, as proven by the statistical test (repeated measures ANOVA). In order to comprehend whether this result was due to the haptic learning, rather than the simple familiarization to the task, the same analysis was performed on the subjects of the second group, who participated to the blank test. These subjects were explicitly told how to write. As a consequence, the first trial distance gaps were much smaller. On the other hand, subjects’ handwriting style did not significantly change in the course of the session, as proven by the statistical test (repeated measures ANOVA). The subjects of the second group were able to perform the task well but, in absence of any haptic feedback, they could not improve their performances in the course of the session.
In conclusion, it was the haptic learning that allowed the subjects of the first group to get closer to the teacher’s handwriting style. The haptic guidance provided by the teacher did affect their handwriting style which became, at the end of the haptic learning, as close to the teacher’s style as the handwriting style of the subjects of the second group, as proven by the last statistical test (independent two-samples t-test). Unconsciously, the subjects of the first group changed their handwriting style after only four guided trials.
These results show how effective the haptic guidance can be in the context of collaboration between two people. Supported by statistical analysis, it can be finally stated that the bilateral teleoperation system composed of two haptic devices allows the transmission of skills in a rapid and effective way. Therefore, it can be very helpful for the learning process of a person. On the other hand, the final outcome of the learning process depends directly on the teacher, on his/her capability and knowledge. The teacher is to be skilled, because he/she has to literally guide the student. That is what was meant by saying that the figure of the teacher was going to get back to a central role in the learning process.
The haptic device is conceived to be small, simple, portable and easily usable. Yet it is capable of producing an important haptic force, not too high but absolutely sufficient for the demanded task. A practical application, for the haptic device, is distance learning. The teacher and the student do not need to be at the same place, not even in the same city. The student could even work at home, with the possibility of practicing on his/her own and being periodically evaluated by the teacher who follows him/her from a distance.
