1. Introduction
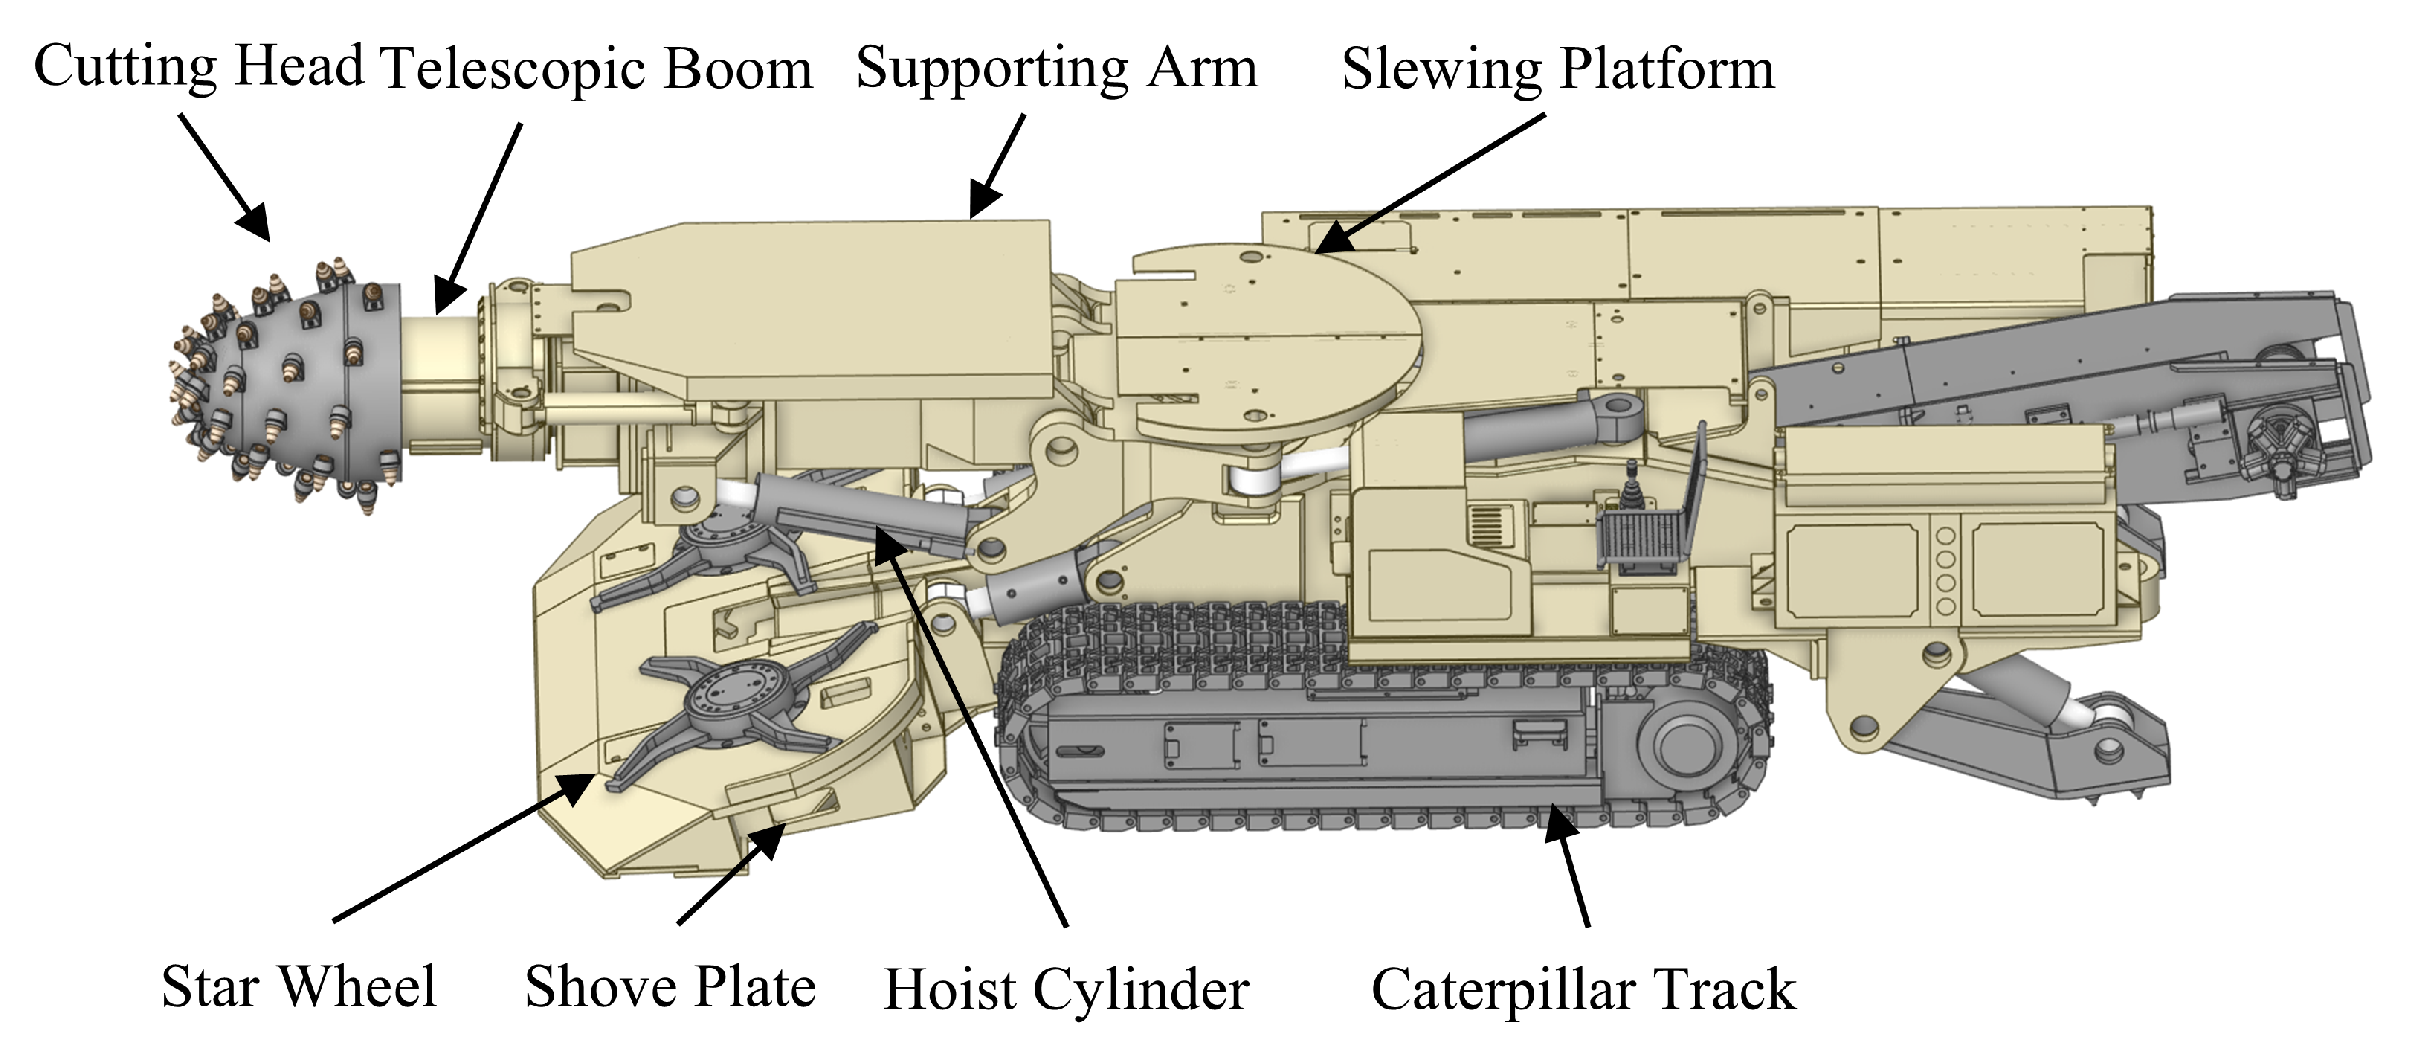
With depleting near-surface deposits and growing demand for energy and materials, underground excavation remains crucial for sustainable resource supply. Roadheaders, typically featuring a boom-type configuration (
Figure 1), play a key role in underground development. These machines commonly use cylindrical cutting heads, which perform well in soft to medium-hard rocks. However, their efficiency drops sharply in hard rock due to accelerated pick wear, resulting in high operational costs and limited applicability. Improving hard rock cutting efficiency while minimizing tool wear remains a pressing challenge.
Various approaches have been proposed to address this issue. For instance, laser-assisted rock-breaking [
1] and water jet-assisted cutting [
2,
3] have been explored to enhance cutter performance. Combined methods, such as abrasive water jet–pick systems [
4], have also been investigated. While these auxiliary techniques can improve cutting efficiency, they often involve complex setups, high energy consumption, and integration difficulties with existing cutter heads. This motivates the pursuit of more robust, cost-effective purely mechanical solutions. Optimizing cutter installation and geometry has been shown to improve fragmentation efficiency in conventional systems [
5]. Recent studies on specially-shaped cutters have further demonstrated that geometric optimization can significantly enhance the rate of penetration and suppress mechanical vibrations in complex formations [
6,
7].
Purely mechanical improvements rely on effectively exploiting rock fragmentation mechanisms. According to Griffith’s brittle failure criterion [
8], rock tensile strength is much lower than compressive strength, typically by a factor of eight. Undercutting techniques leverage this difference to promote tensile failure, which is inherently more energy-efficient than the compressive failure mode of conventional drag picks. Tool wear is also closely linked to rock properties; for example, the Cerchar abrasivity index (CAI) is widely used to predict cutter lifespan [
9].
Extensive studies have analyzed the performance of conventional disc cutters. Wear mechanisms, cutter morphology, and kinematic behavior have been investigated through experiments and numerical models [
10,
11,
12,
13,
14,
15,
16,
17,
18]. In terms of predictive modeling, advanced data-driven methods using hybrid machine learning models such as SVR with meta-heuristic optimization have been applied to predict cutting forces with high accuracy [
19]. Regarding cutting mechanics, numerical investigations into vibrational cutting have highlighted the quasi-periodic fluctuations in stress states and crack propagation patterns during rock breakage [
20]. Furthermore, to address the challenge of optimizing cutting efficiency, research has focused on the refinement of undercutting techniques, including the application of multi-ridge curve-shaped PDC cutters and innovative geometries [
21].
In parallel with geometric optimizations, the Oscillating Disc Cutter (ODC), also known as the Actuated Disc Cutter (ADC) [
22], has emerged as a promising solution for hard rock excavation. Kinematic models [
23], discrete element simulations [
24], and experimental studies [
25,
26,
27] confirm its potential to reduce cutting forces and improve fragmentation. However, most existing studies on ODC have not thoroughly investigated the combined effects of motion parameters and tool geometric parameters on cutting performance. Furthermore, regarding numerical simulations of ODC, the obtained force–time curves often fail to reflect the characteristic periodic motion of the cutter, specifically where the cutting force should drop to zero during each oscillation cycle when the cutter disengages from the rock. Consequently, a systematic analysis of key motion parameters, including eccentricity, oscillation frequency, and feed rate, and their influence on Specific Energy (
) and cutting force is still lacking, as existing numerical methods often struggle to capture the combined effects of high strain rate deformation, large-scale fragmentation, and periodic loading characteristic of ODC operation.
To address these challenges, this study presents a comprehensive investigation:
(1) An ODC kinematic model is established and cutting trajectories are obtained via MATLAB R2024b. A coupled SPH–FEM model is developed and validated against experiments and theoretical predictions. (2) The advantages of eccentric oscillating disc cutting over conventional undercutting are quantified, focusing on cutting force and Specific Energy reduction. (3) The effects of eccentricity, oscillation frequency, and feed rate on cutting forces and energy consumption are systematically analyzed, revealing underlying non-linear mechanisms. (4) The findings provide theoretical and practical guidance for optimizing ODC motion parameters, supporting high-efficiency underground excavation.
2. Theoretical Modelling of Oscillating Disc Cutter
This chapter presents the kinematic and dynamic modeling of the Oscillating Disc Cutter (ODC) and its rock-cutting performance. A dynamic framework is established to capture both feed motion and eccentric rotation, considering cutter eccentricity, feed velocity, and oscillation frequency. To quantify the interaction between these parameters, the dimensionless feed–oscillation ratio and eccentric ratio are introduced. Cutter–rock contact mechanics are complex; here, the contact length is calculated from the cutting trajectory and contact angle, accounting for cutting depth, rock strength, and friction. Cutting efficiency is evaluated via specific energy, and the combined analytical kinematic model and SPH–FEM simulation provide a solid basis for optimizing ODC motion parameters.
2.1. Kinematic Model
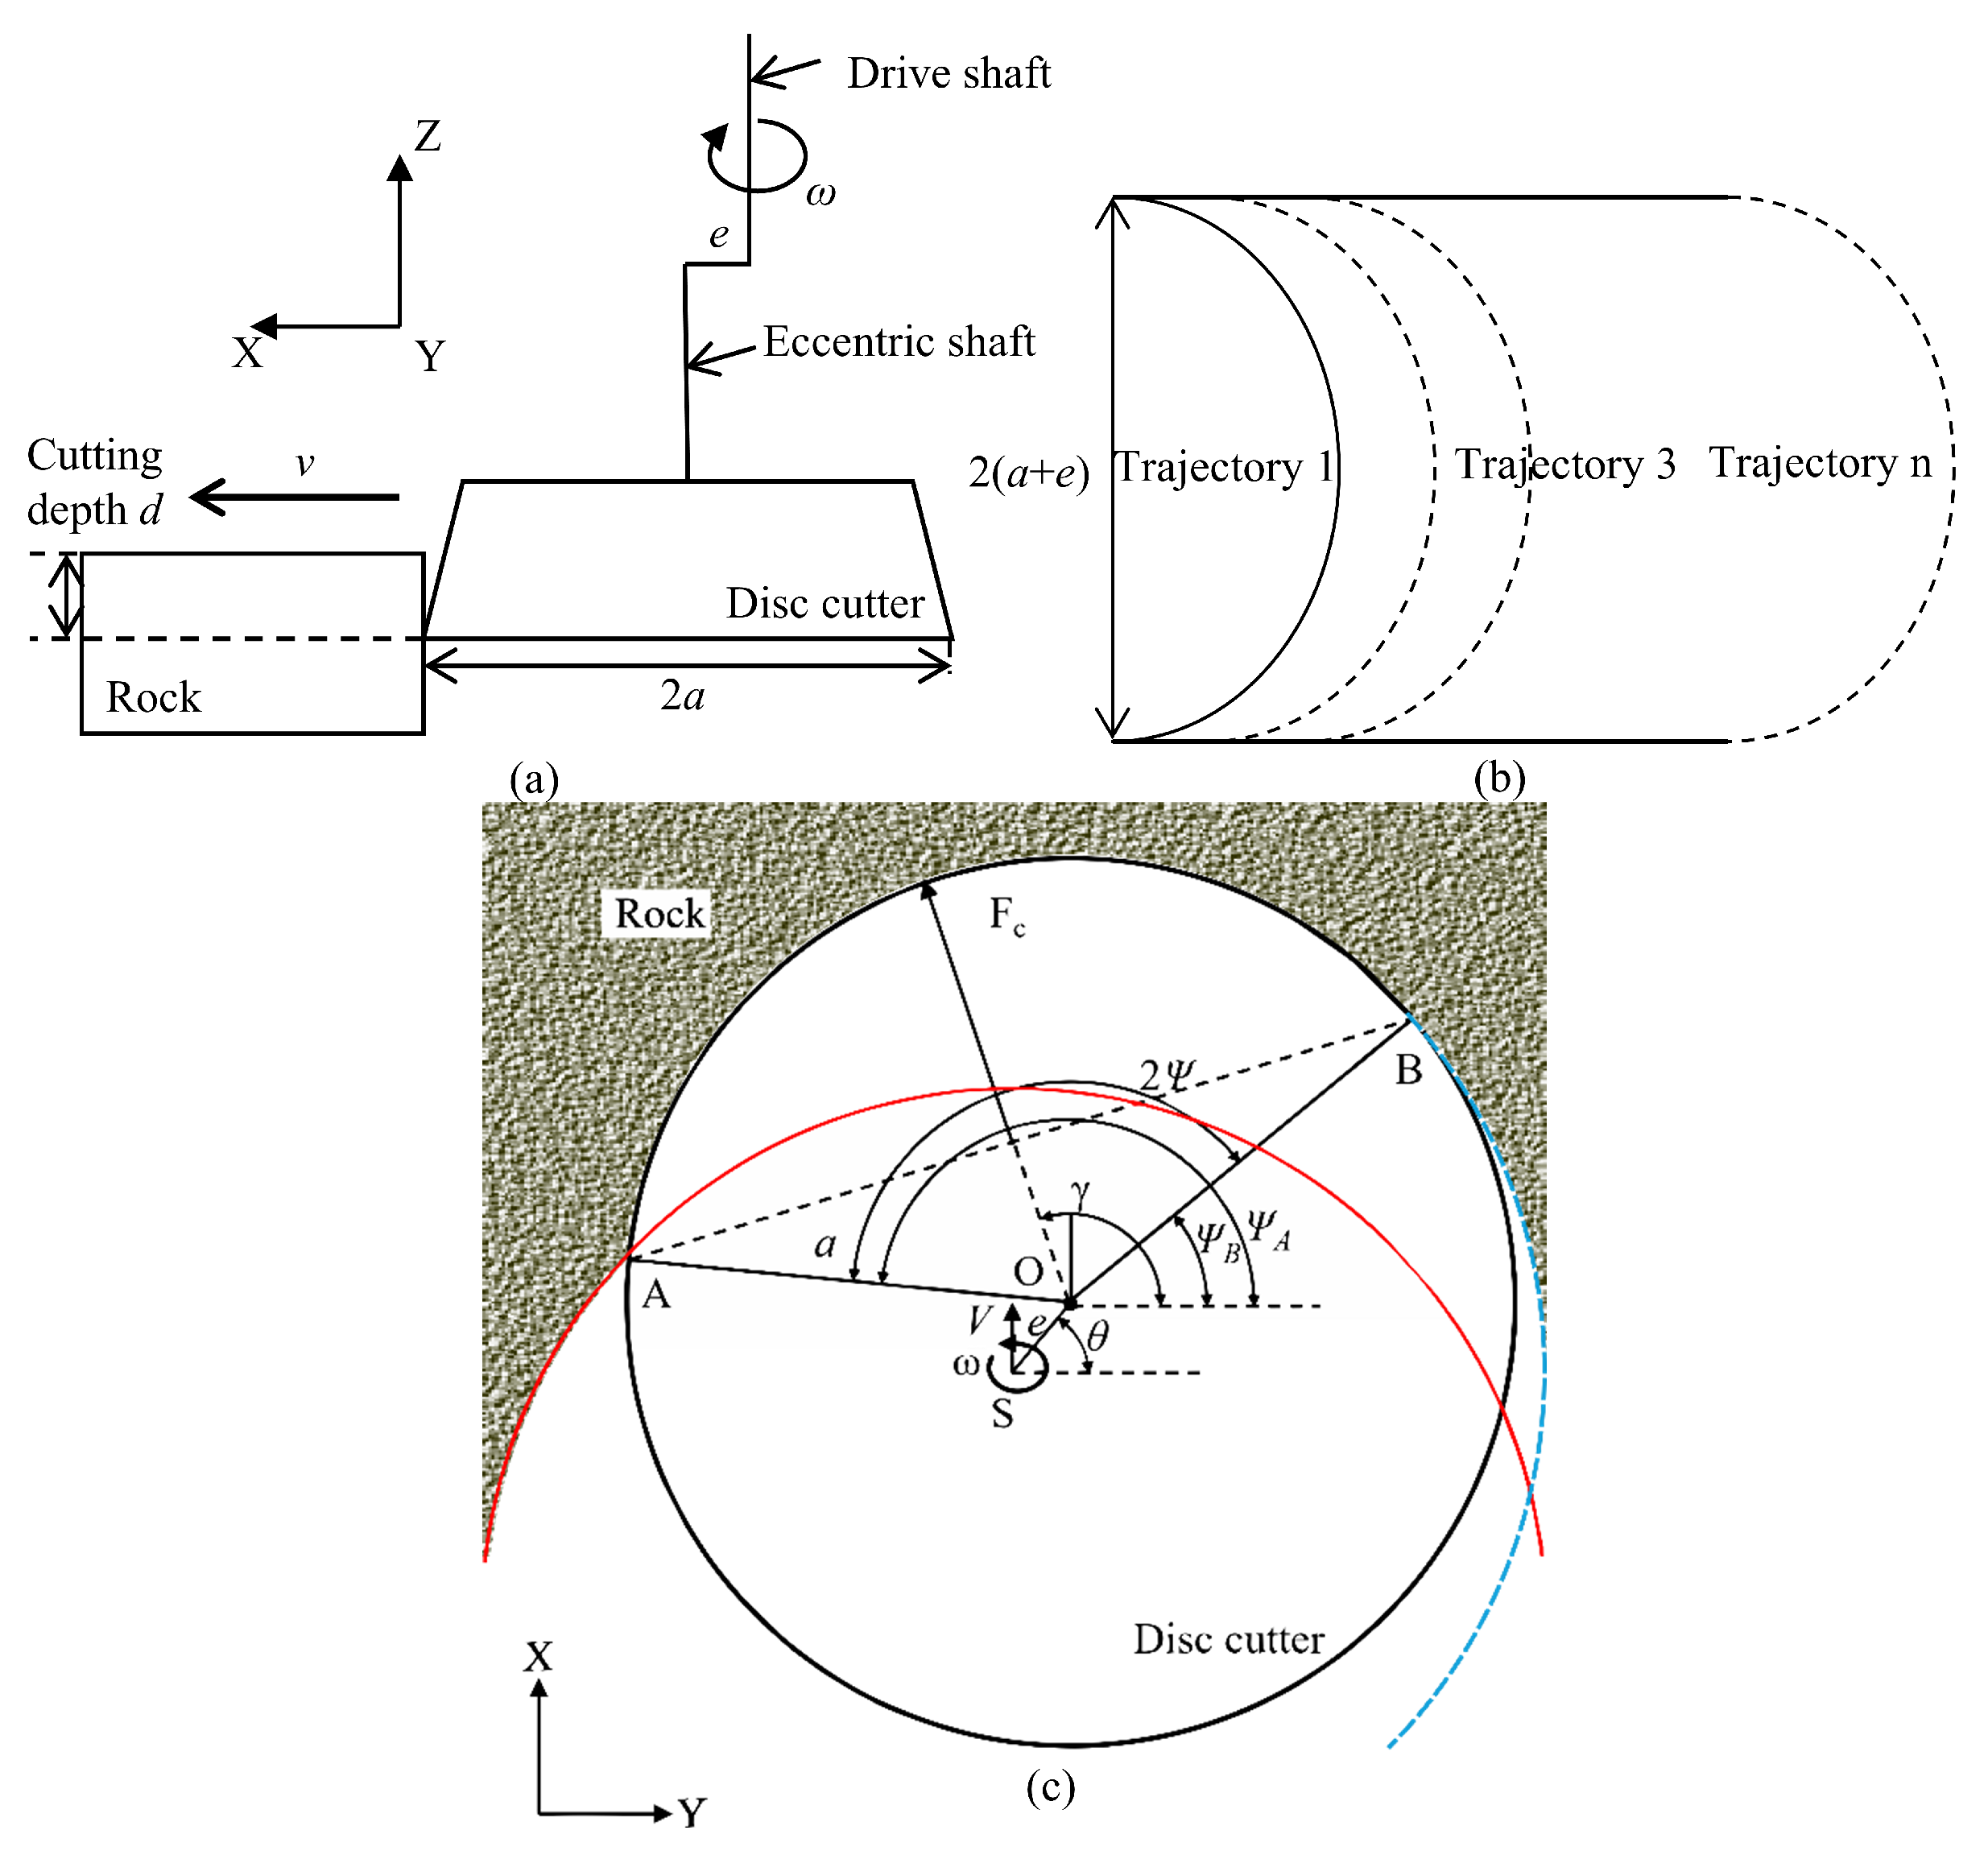
Figure 2a shows the ODC cutterhead motion schematic. The X-axis defines the cutting direction, the Y-axis the lateral direction, and the Z-axis the rotational direction. Here,
e denotes the eccentricity (mm) between the rotation center and the geometric center of the cutterhead;
is the angular velocity (rad/s);
f the rotational frequency (Hz) corresponding to
;
v the feed rate (mm/s);
a the cutterhead radius (mm); and
d the cutting depth (mm).
The ideal groove generated by the cutter has a width of
and depth
d (
Figure 2b). Cutter motion combines feed translation and eccentric rotation.
Figure 2c illustrates the planar cutting trajectory: the red line represents the previous cut, and the blue dashed line the current path. Arc segment
indicates the cutter–rock contact region, where
is the half contact angle (rad) and
,
are the angular positions (rad) of points
A and
B, respectively.
S is the drive shaft,
O the eccentric shaft, and
the instantaneous orientation (rad) of the eccentric shaft. The motion of
O is described by:
2.2. Simulation Parameter Design
This study investigates the effects of cutter eccentricity
e, feed velocity
v, and oscillation frequency
f on cutting performance.
Table 1 lists the simulation parameters. The core ranges of these operational parameters are designated based on existing laboratory setups [
22] and the engineering constraints of current excavation machinery (e.g., the 60 Hz industrial capability limit of the KOMATSU MC51 miner). Specifically, the recommended eccentricity range (1–5 mm) and frequency range (30–60 Hz) are bounded by both cutting physics and structural safety thresholds. An eccentricity below 1 mm or a frequency below 30 Hz provides negligible dynamic fracturing enhancement. Conversely, an eccentricity exceeding 5 mm under high-frequency oscillation has been experimentally observed in our laboratory tests to induce severe structural vibrations and bearing damage. Therefore, while 1–5 mm serves as the main operational range, extended cases up to 7 mm (S19–S20) are strategically integrated as boundary control groups to fully elucidate the degradation of mechanical reliability under excessive eccentricity. Using Equation (
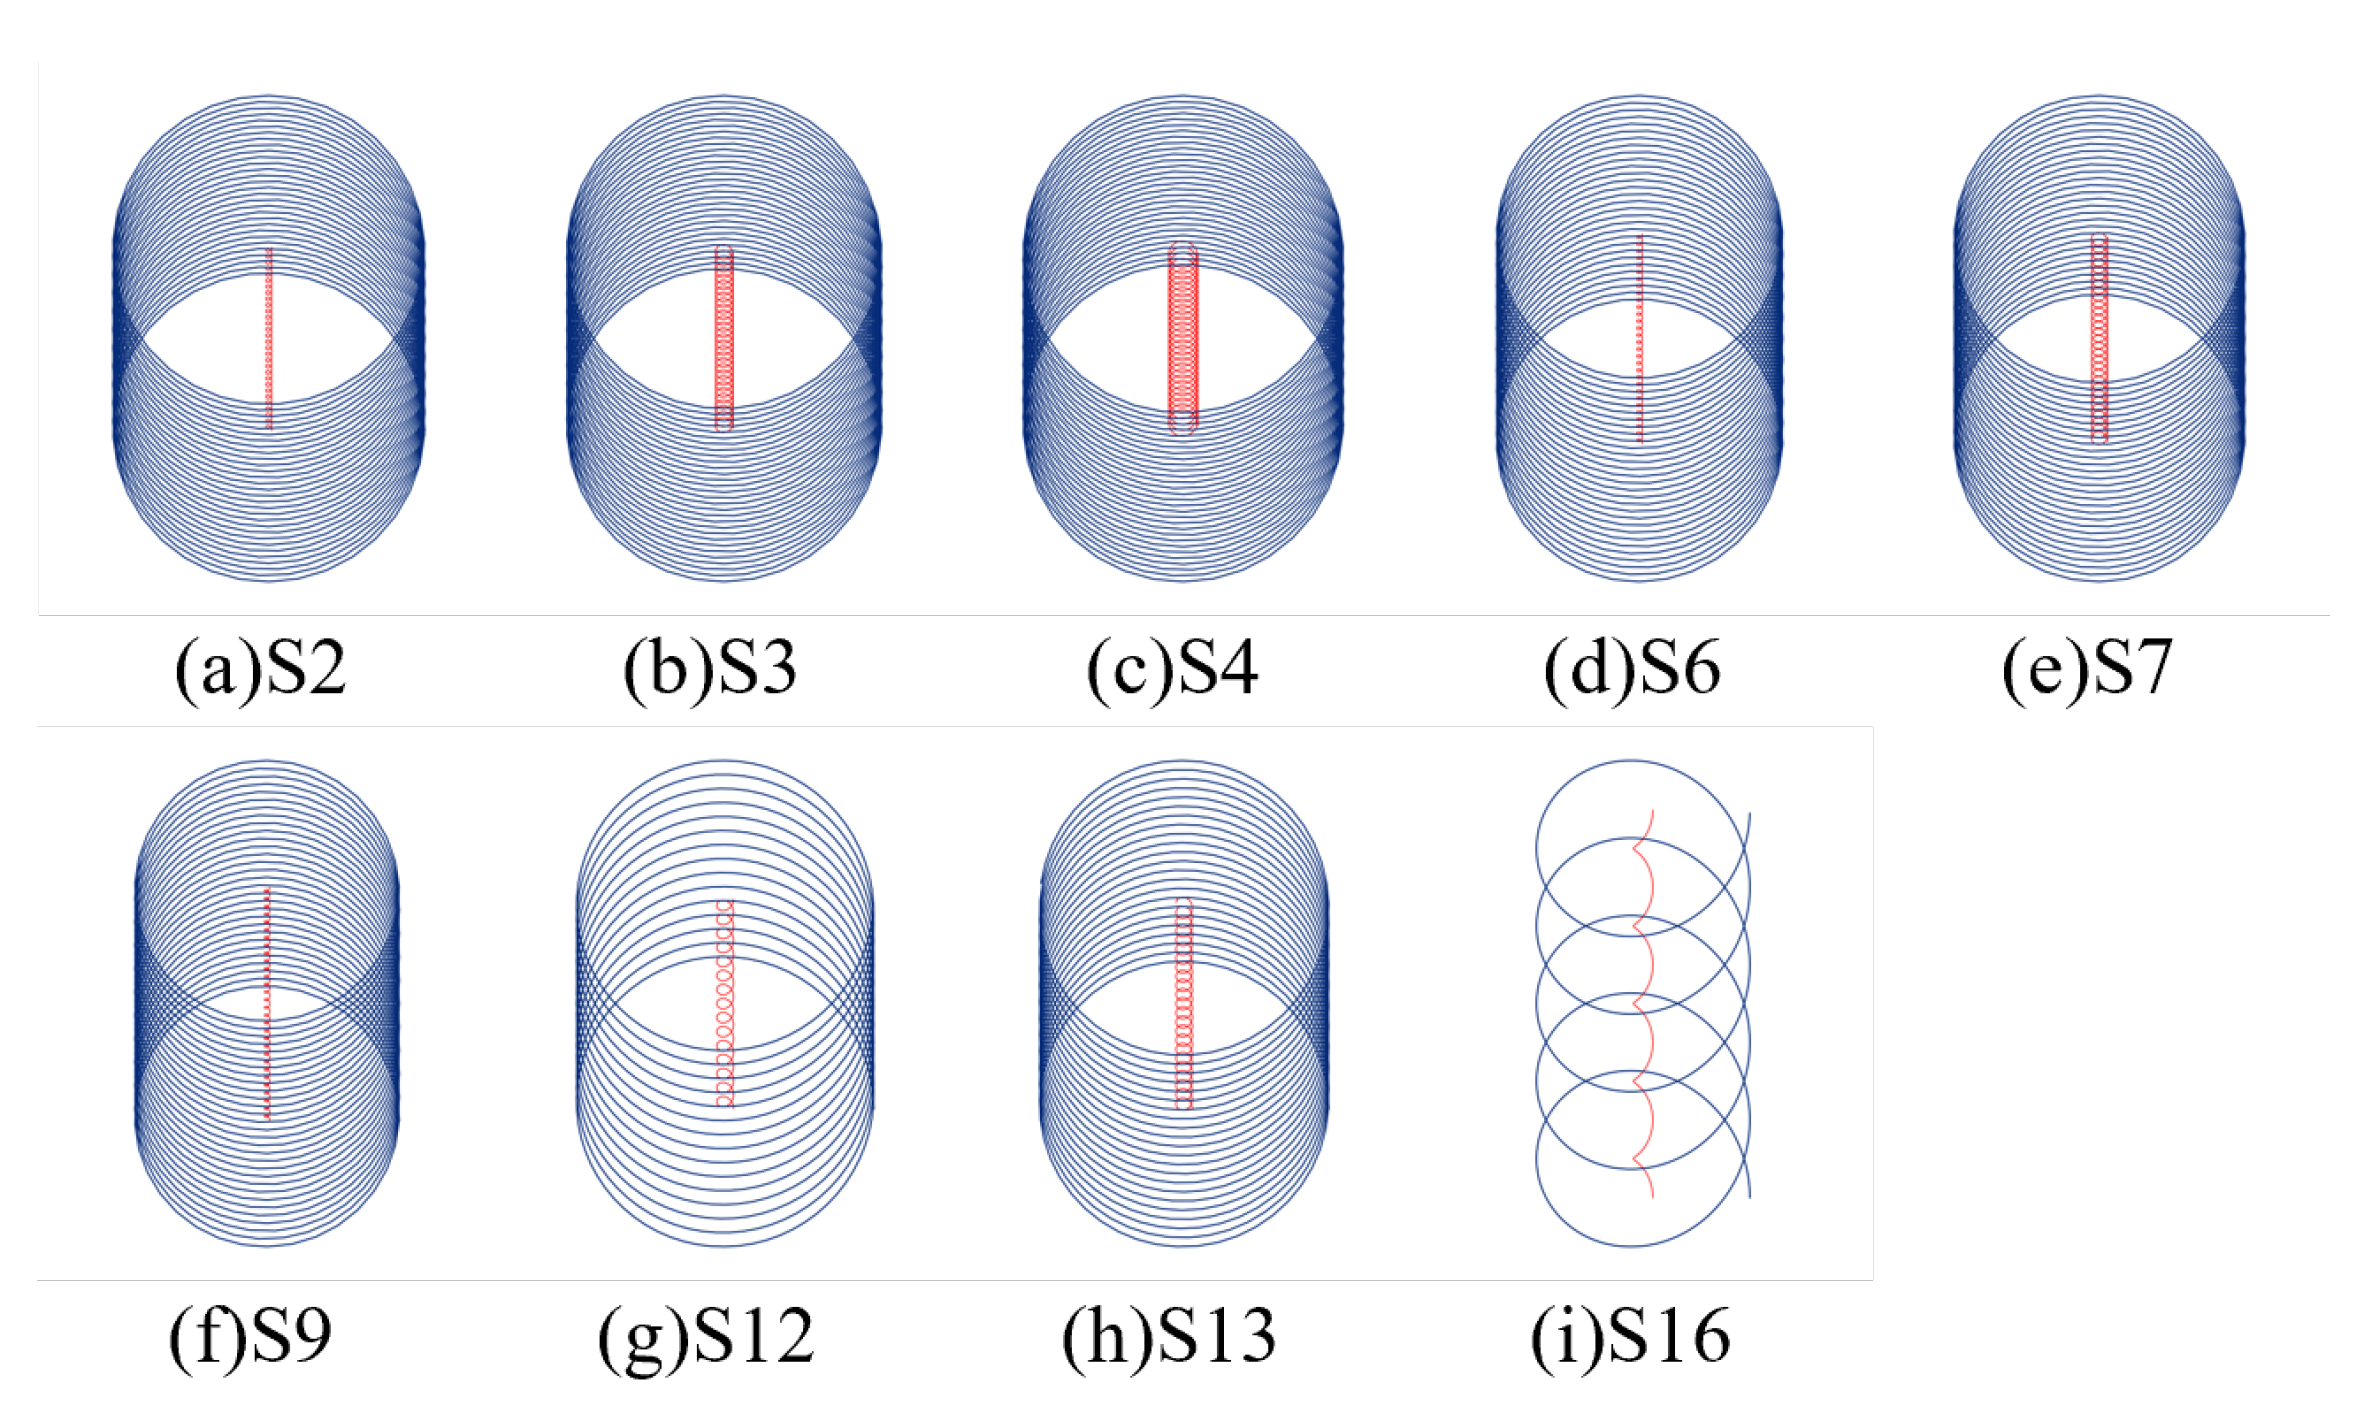
1), cutter trajectories under different conditions are obtained (
Figure 3).
When
, the cutter behaves like conventional undercutting with continuous contact. For
, the cutter periodically separates from the rock each oscillation, generating an impact cutting effect (
Figure 3i). In this study,
is primarily kept in the range
to ensure intermittent contact and effective impact cutting, whereas a continuous-contact baseline case with
(S16) is intentionally included to provide a direct performance contrast between continuous and impact cutting modes.
To characterize relative motion, the eccentric ratio
and feed–oscillation ratio
are defined as:
When
, the cutter behaves like conventional undercutting with continuous contact. For
, the cutter periodically separates from the rock each oscillation, generating an impact cutting effect (
Figure 3i). In this study,
is kept in the range
to ensure intermittent contact and effective impact cutting.
2.3. Disc–Rock Contact
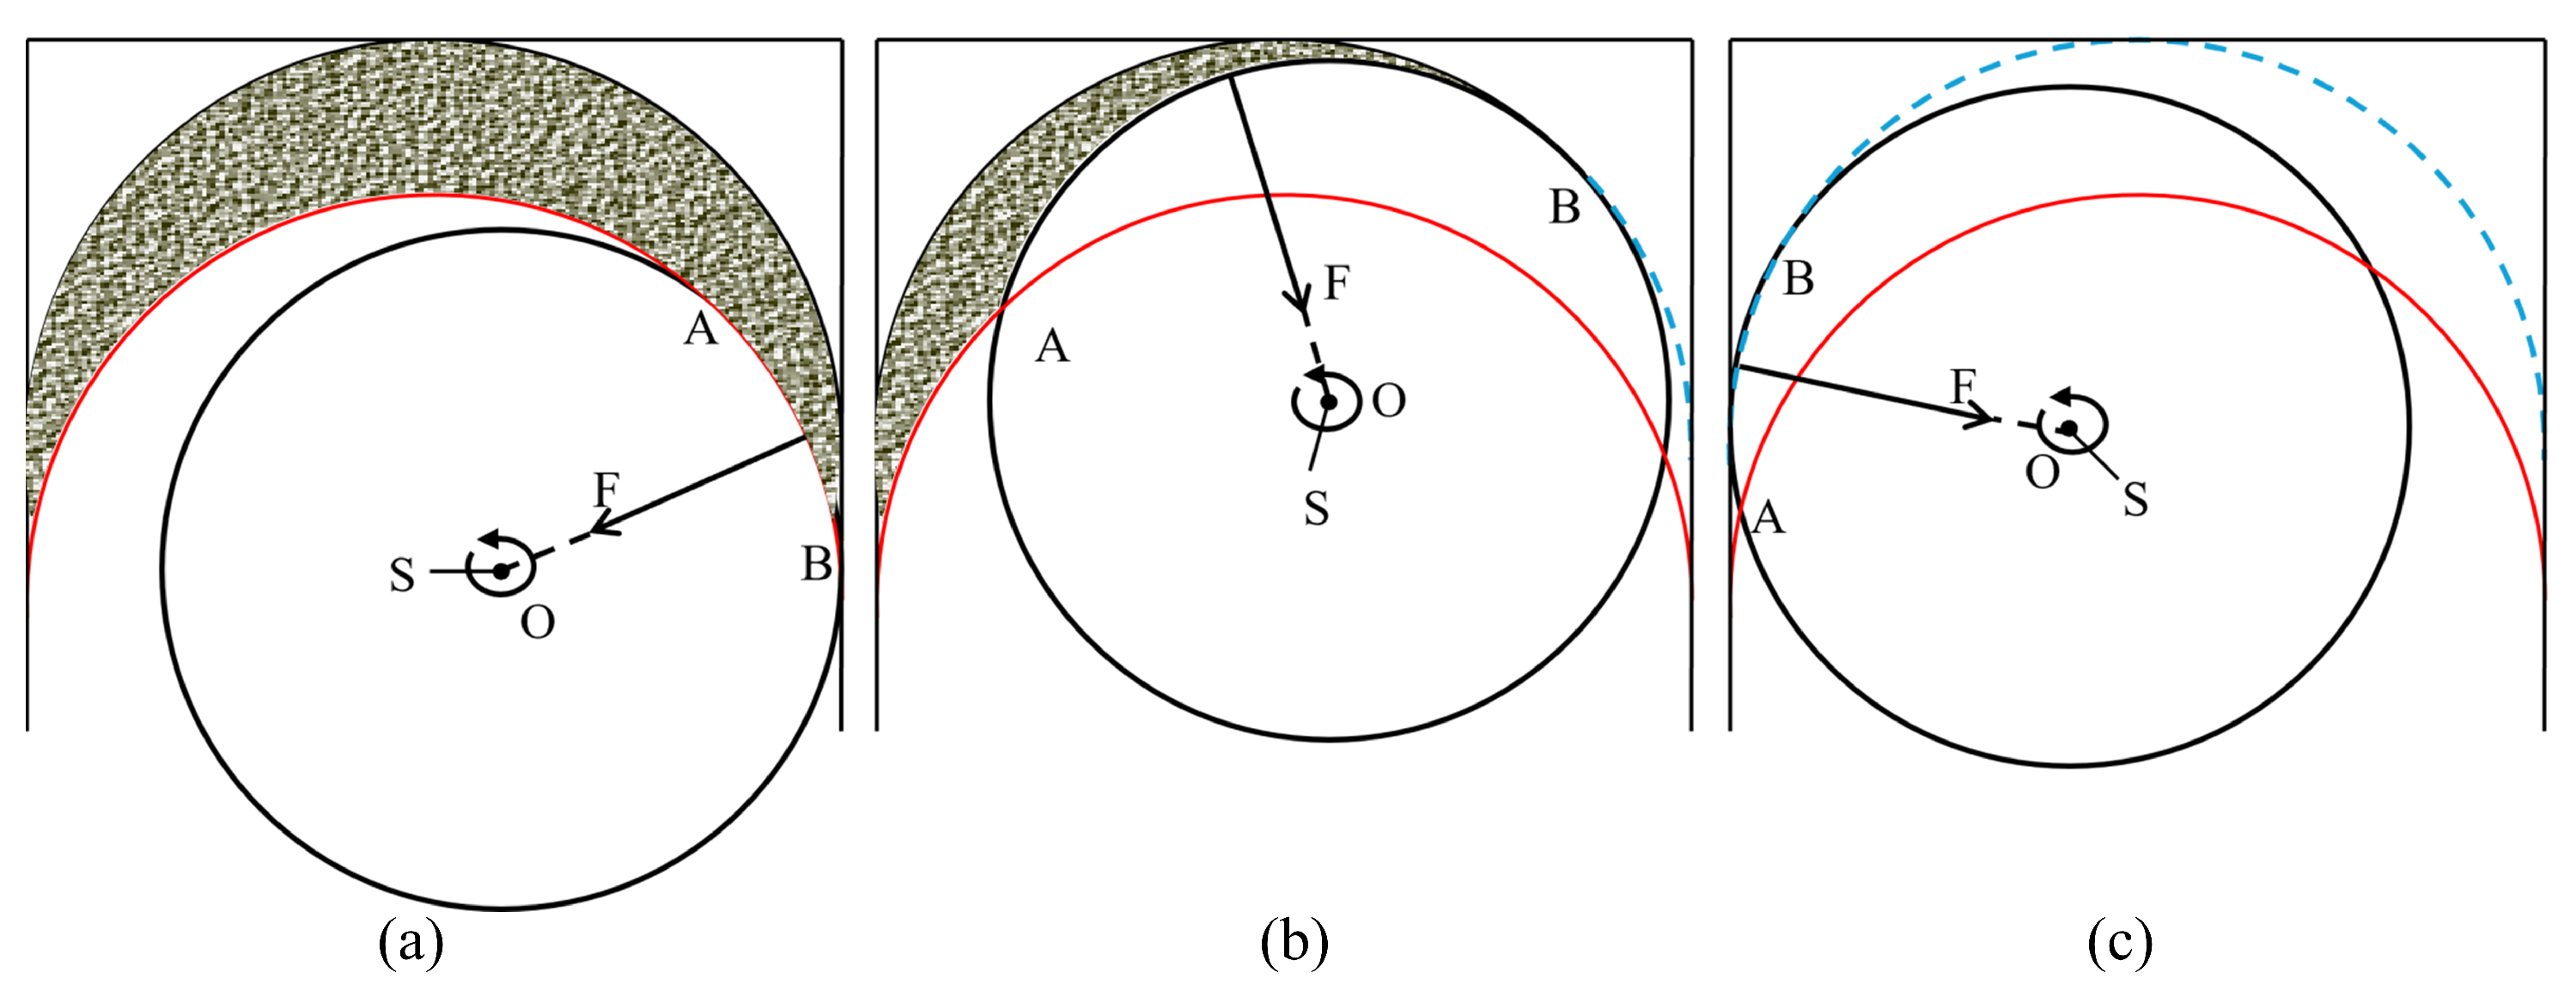
Figure 4 illustrates the contact mechanics between the disc cutter and rock substrate during a single oscillation cycle. Initially, the cutter engages the profile generated in the preceding cycle (red line,
Figure 4a). As rotation proceeds, the contact arc length monotonically increases (
Figure 4b). Point A marks the initial engagement position on the previous trajectory, while point B denotes the separation position, characterized by the tangency of the velocity vector to the cutter edge. When the velocity vector points inward relative to the rock surface, the contact on the leading side ceases. Consequently, some cutter segments detach while the active cutting zone shifts, forming a new profile (blue line,
Figure 4c).
The instantaneous cutting force is determined by the contact angle
and orientation
. As shown in
Figure 2c, these angles are derived from the angular positions of points A and B:
where point A on the current path corresponds to point B from the previous cycle due to the periodicity of the cutter motion.
The geometric configuration of the rock surface is determined by the trajectory of point B, where the contact length depends on the post-cut rock geometry:
The instantaneous coordinates of point B are expressed as:
where the disc rotation center
and the eccentric phase
. Furthermore, any point on the disc edge can be represented as:
where
denotes the position of the edge point corresponding to the angular coordinate
.
2.4. Forces Acting on Disc
For small contact areas, the interaction force between the cutter and rock
F follows the model in [
23]:
(1) it acts near the contact center toward the disc; (2) its magnitude is proportional to the chord length
; (3) it scales with rock strength
, defined as
where
d is the cutting depth,
is the specific energy,
ℓ is the wear-plane width,
is the contact stress, and
is the friction coefficient (
[
28]). Here,
represents the rock’s uniaxial compressive strength (UCS).
The interaction forces in the radial, tangential, and normal directions are:
where
(
kN for the selected parameters).
For a small feed–oscillation ratio
and small eccentricity
e, the contact angle can be approximated as [
23]:
The corresponding simplified cutting forces become:
This simplified approach assumes and , providing a local approximation of the contact forces. It does not account for non-linear fragmentation, large-scale rock failure, high strain rates, or actual rock removal. For accurate simulation across varying cutting parameters, particularly under high-efficiency impact cutting (), a coupled SPH–FEM model is necessary.
2.5. Specific Energy
Specific energy () is a primary metric for evaluating rock-cutting performance, defined as the energy consumed per unit volume of rock removed. It quantifies the intrinsic efficiency of the fragmentation process: a higher value indicates excessive energy dissipation and lower mechanical efficiency, whereas a lower signifies an optimized cutting regime with superior energy performance.
For the oscillating disc cutter (ODC), the cutting force and instantaneous velocity fluctuate periodically. To ensure mathematical and physical rigor, the
in the numerical simulation is formulated by integrating the continuous mechanical work over the effective cutting time:
where
is the specific energy expressed in Megajoules per cubic meter (MJ/
);
W is the total mechanical work done by the cutter;
and
denote the instantaneous rolling force (kN) and cutting velocity (mm/s) at time
, respectively;
t is the cumulative cutting time (s); and
V represents the volume of the excavated rock material (
). The scaling factor
is applied to convert the energy density from kN·mm/
to the standard unit of MJ/
. In practical post-processing, the continuous integral in Equation (
11) is numerically evaluated using the trapezoidal rule based on the discrete force-displacement data points.
The volume of the removed rock, V, is calculated by , where w represents the numerical model thickness (or cutter width) in mm, and A is the total fractured cross-sectional area (). In the SPH framework, the damaged area A is precisely quantified by tracking and accumulating the total area of SPH particles that have reached complete damage () and detached from the intact rock matrix. This particle-based tracking approach ensures an accurate evaluation of energy efficiency during the dynamic fragmentation process. This parameter serves as the objective function for optimizing ODC operational parameters in the subsequent analysis.
3. SPH–FEM Computational Method for Rock Cutting
3.1. SPH-FEM Computational Algorithm
LS-DYNA provides several numerical methods for high-velocity dynamic simulations, including the erosion-based Lagrangian finite element method (FEM) and Smoothed Particle Hydrodynamics (SPH). The Lagrangian FEM is computationally efficient but loses accuracy under large mesh distortions typical of rock fragmentation. Erosion criteria can reduce mesh distortion effects but may cause unphysical mass and energy loss in the cutting zone.
SPH is a mesh-free Lagrangian method originally developed by Gingold and Monaghan (1977) [
29]. It represents the continuum as a set of interacting particles, each carrying mass, momentum, and stress, and serving as an interpolation point. Field quantities
are approximated using kernel smoothing:
where
W is the Cubic Spline kernel,
h is the smoothing length, and
,
are the mass and density of particle
j. The smoothing length is
, with
the initial particle spacing and
k usually between 2.0 and 3.0.
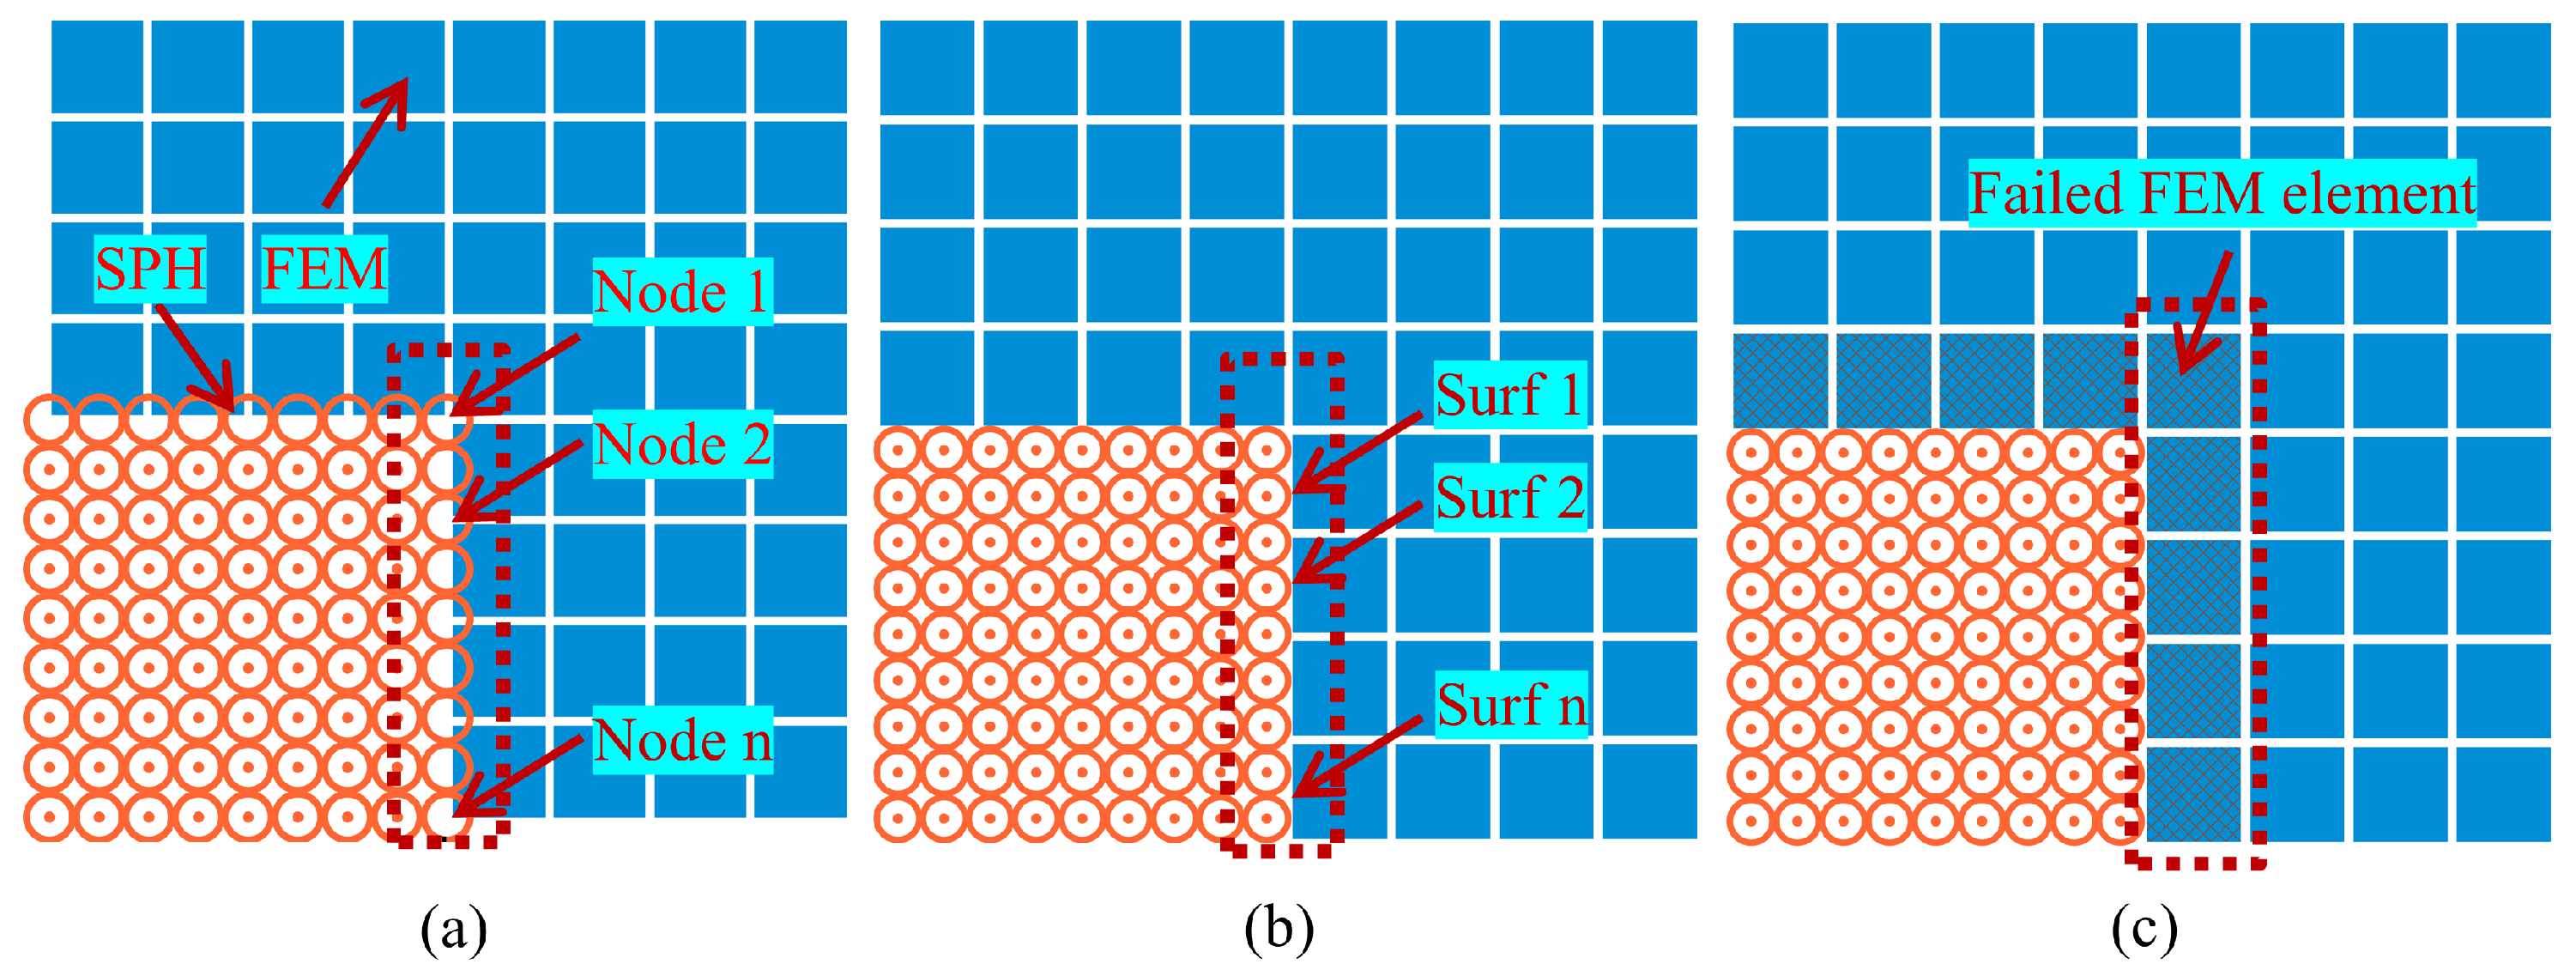
To combine accuracy and efficiency, a hybrid SPH-FEM strategy is used. FEM handles small-deformation regions such as the cutter body and far-field rock, while SPH captures large-strain fracture zones. The main coupling strategies for this hybrid approach are summarized in
Figure 5 and detailed as follows [
30]:
Tied or constrained coupling: nodes or boundary constraints ensure force and displacement continuity.
Node-to-surface contact: SPH particles interact with FEM surfaces, suitable for impact and penetration.
Adaptive conversion: failed FEM elements are converted to SPH particles to model fracture evolution.
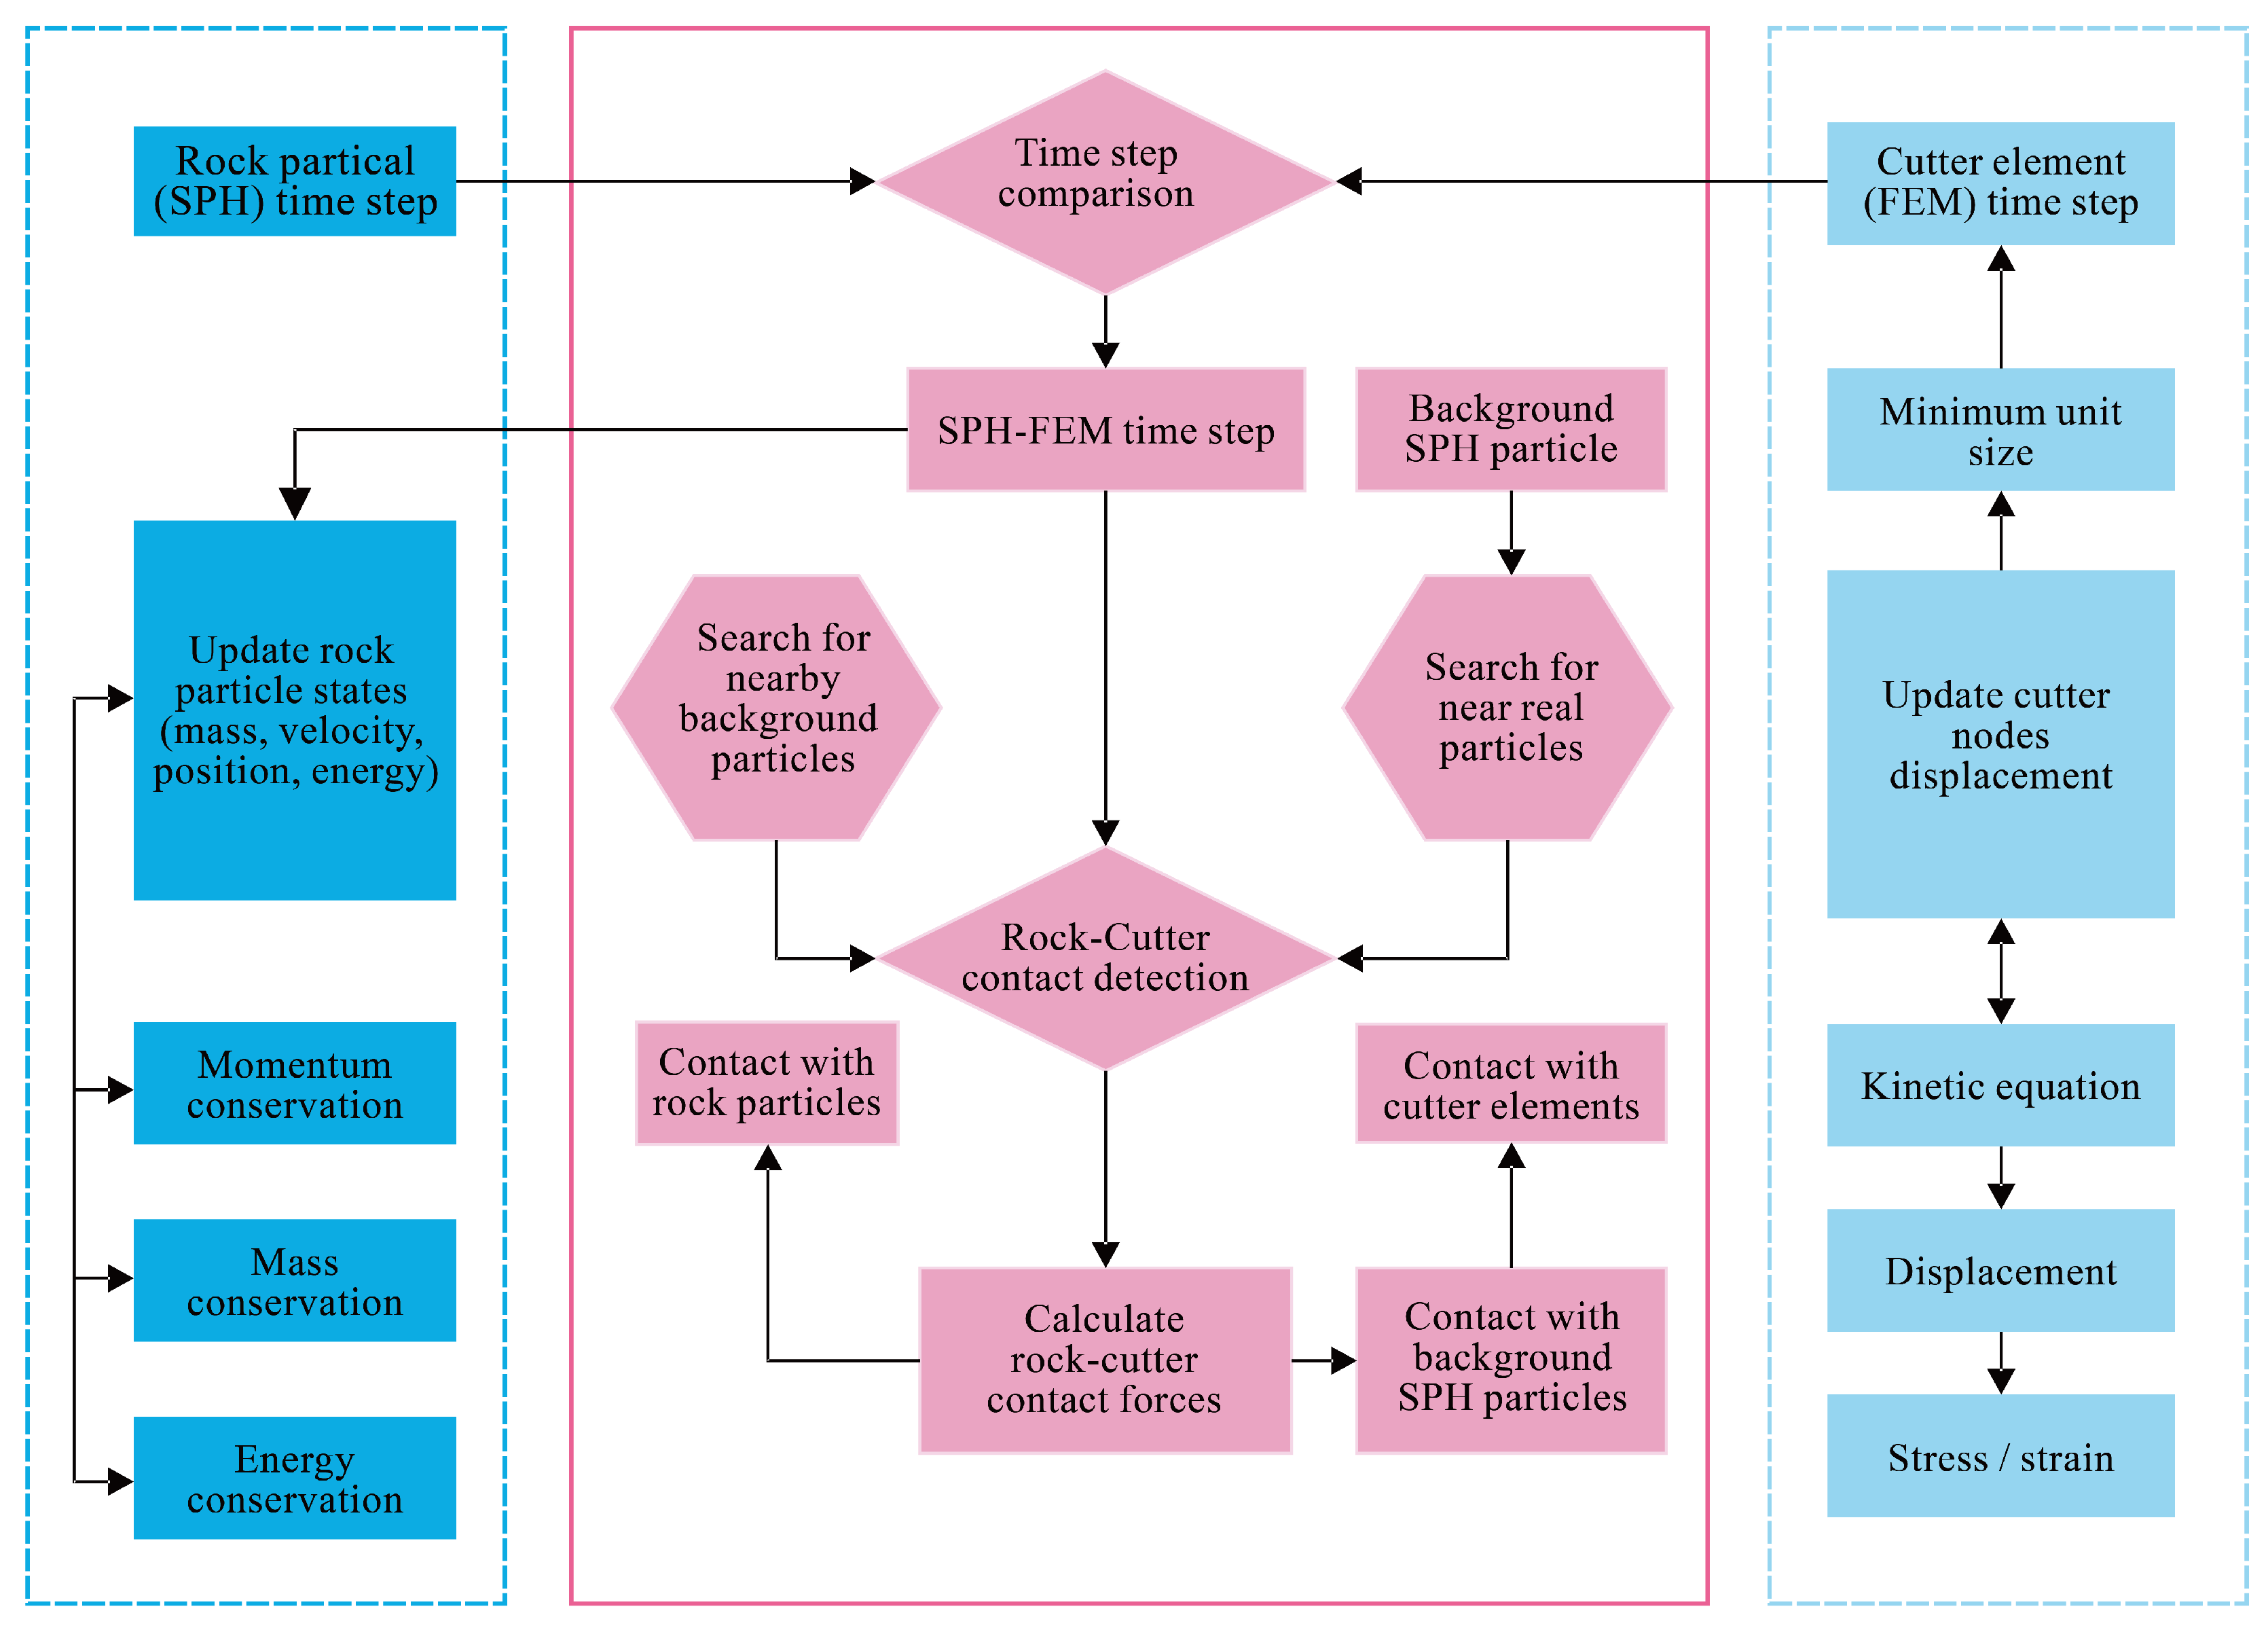
In this study, node-to-surface contact is used to model the ODC-rock interaction, allowing force and velocity exchange between the SPH cutting zone and the FEM cutter. The overall framework is shown in
Figure 6.
3.2. Rock Properties and Constitutive Model
LS-DYNA provides multiple constitutive models for simulating rock behavior under cutting, including Johnson–Holmquist–Concrete (JHC) [
31], Johnson–Holmquist–Ceramics (JH-2) [
32], Riedel–Hiermaier–Thoma (RHT) [
33], and Continuous Surface Cap Model (MAT-CSCM) [
34]. These models capture nonl-inear behavior of brittle materials under high strain rates and confining pressures.
The JHC model is suitable for quasi-brittle materials like rock and concrete. It accounts for strain-rate effects, pressure-dependent strength, and damage evolution. Compared with other models, JHC balances computational efficiency with the ability to simulate fracture and fragmentation, making it ideal for oscillating disc cutter simulations.
Other models have specific advantages: JH-2 is tailored for ceramics; RHT uses three strength surfaces (elastic, failure, residual) with a damage-based softening law; MAT-CSCM effectively handles cyclic loading with plastic volumetric compaction and shear dilation.
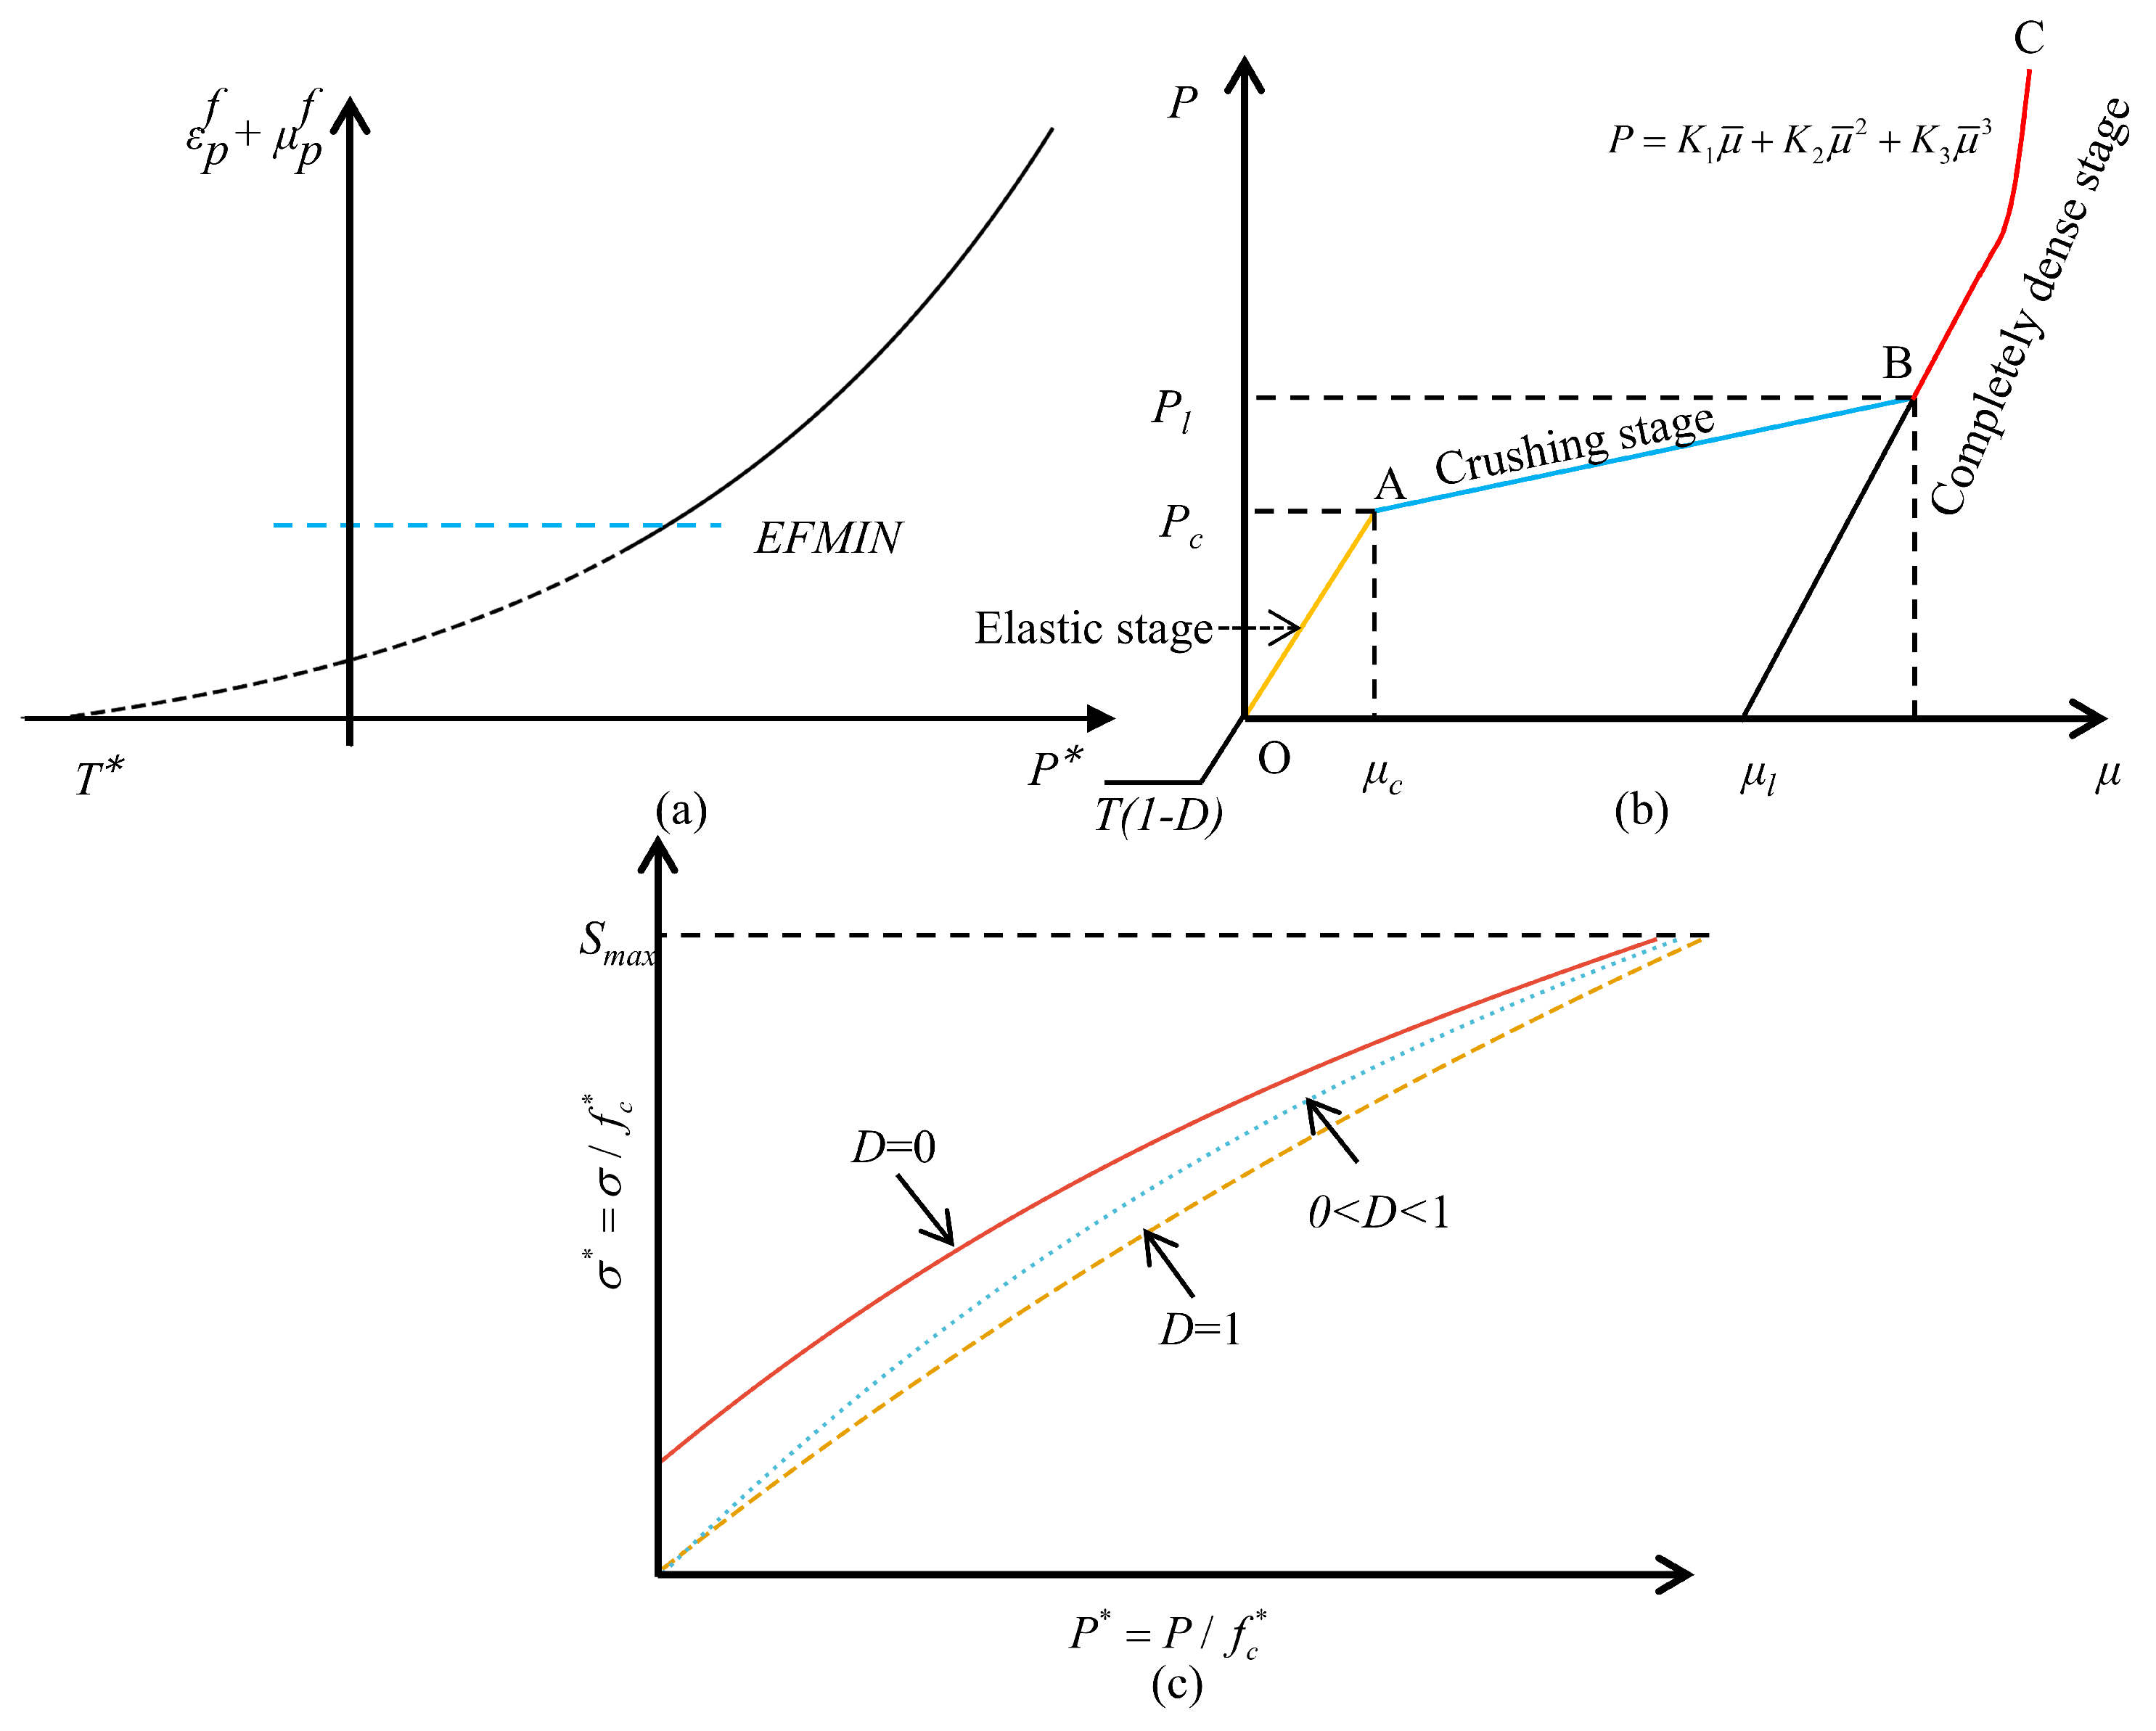
The JHC model consists of three key components: the strength model, the damage model, and the equation of state (EOS), as illustrated in
Figure 7.
Yield surface equation, as shown in Equation (
13):
Here, A is normalized cohesion, B the pressure hardening coefficient, normalized pressure, C the strain rate coefficient, normalized strain rate, and D the damage parameter.
Equation of State (EOS), as shown in Equation (
14):
where
K is bulk modulus,
volumetric strain,
and
are transition points, and
.
Damage evolution, as shown in Equation (
15):
where
is the increment of plastic strain,
the fracture strain, which depends on pressure and strain rate.
indicates complete failure.
In simulations, red sandstone with a uniaxial compressive strength of 26.45 MPa is used. Tensile strength is estimated empirically:
where
k is 0.05–0.15 for brittle materials.
3.3. Simulation Setup
The ODC process is simulated in LS-DYNA using the coupled SPH-FEM approach. The disc cutter is modeled as a rigid body using the *MAT-RIGID keyword due to its significantly higher stiffness compared to the rock. The rock is represented with the Johnson-Holmquist Concrete (JHC) model (*MAT-JOHNSON-HOLMQUIST-CONCRETE).
3.3.1. Geometry and Meshing
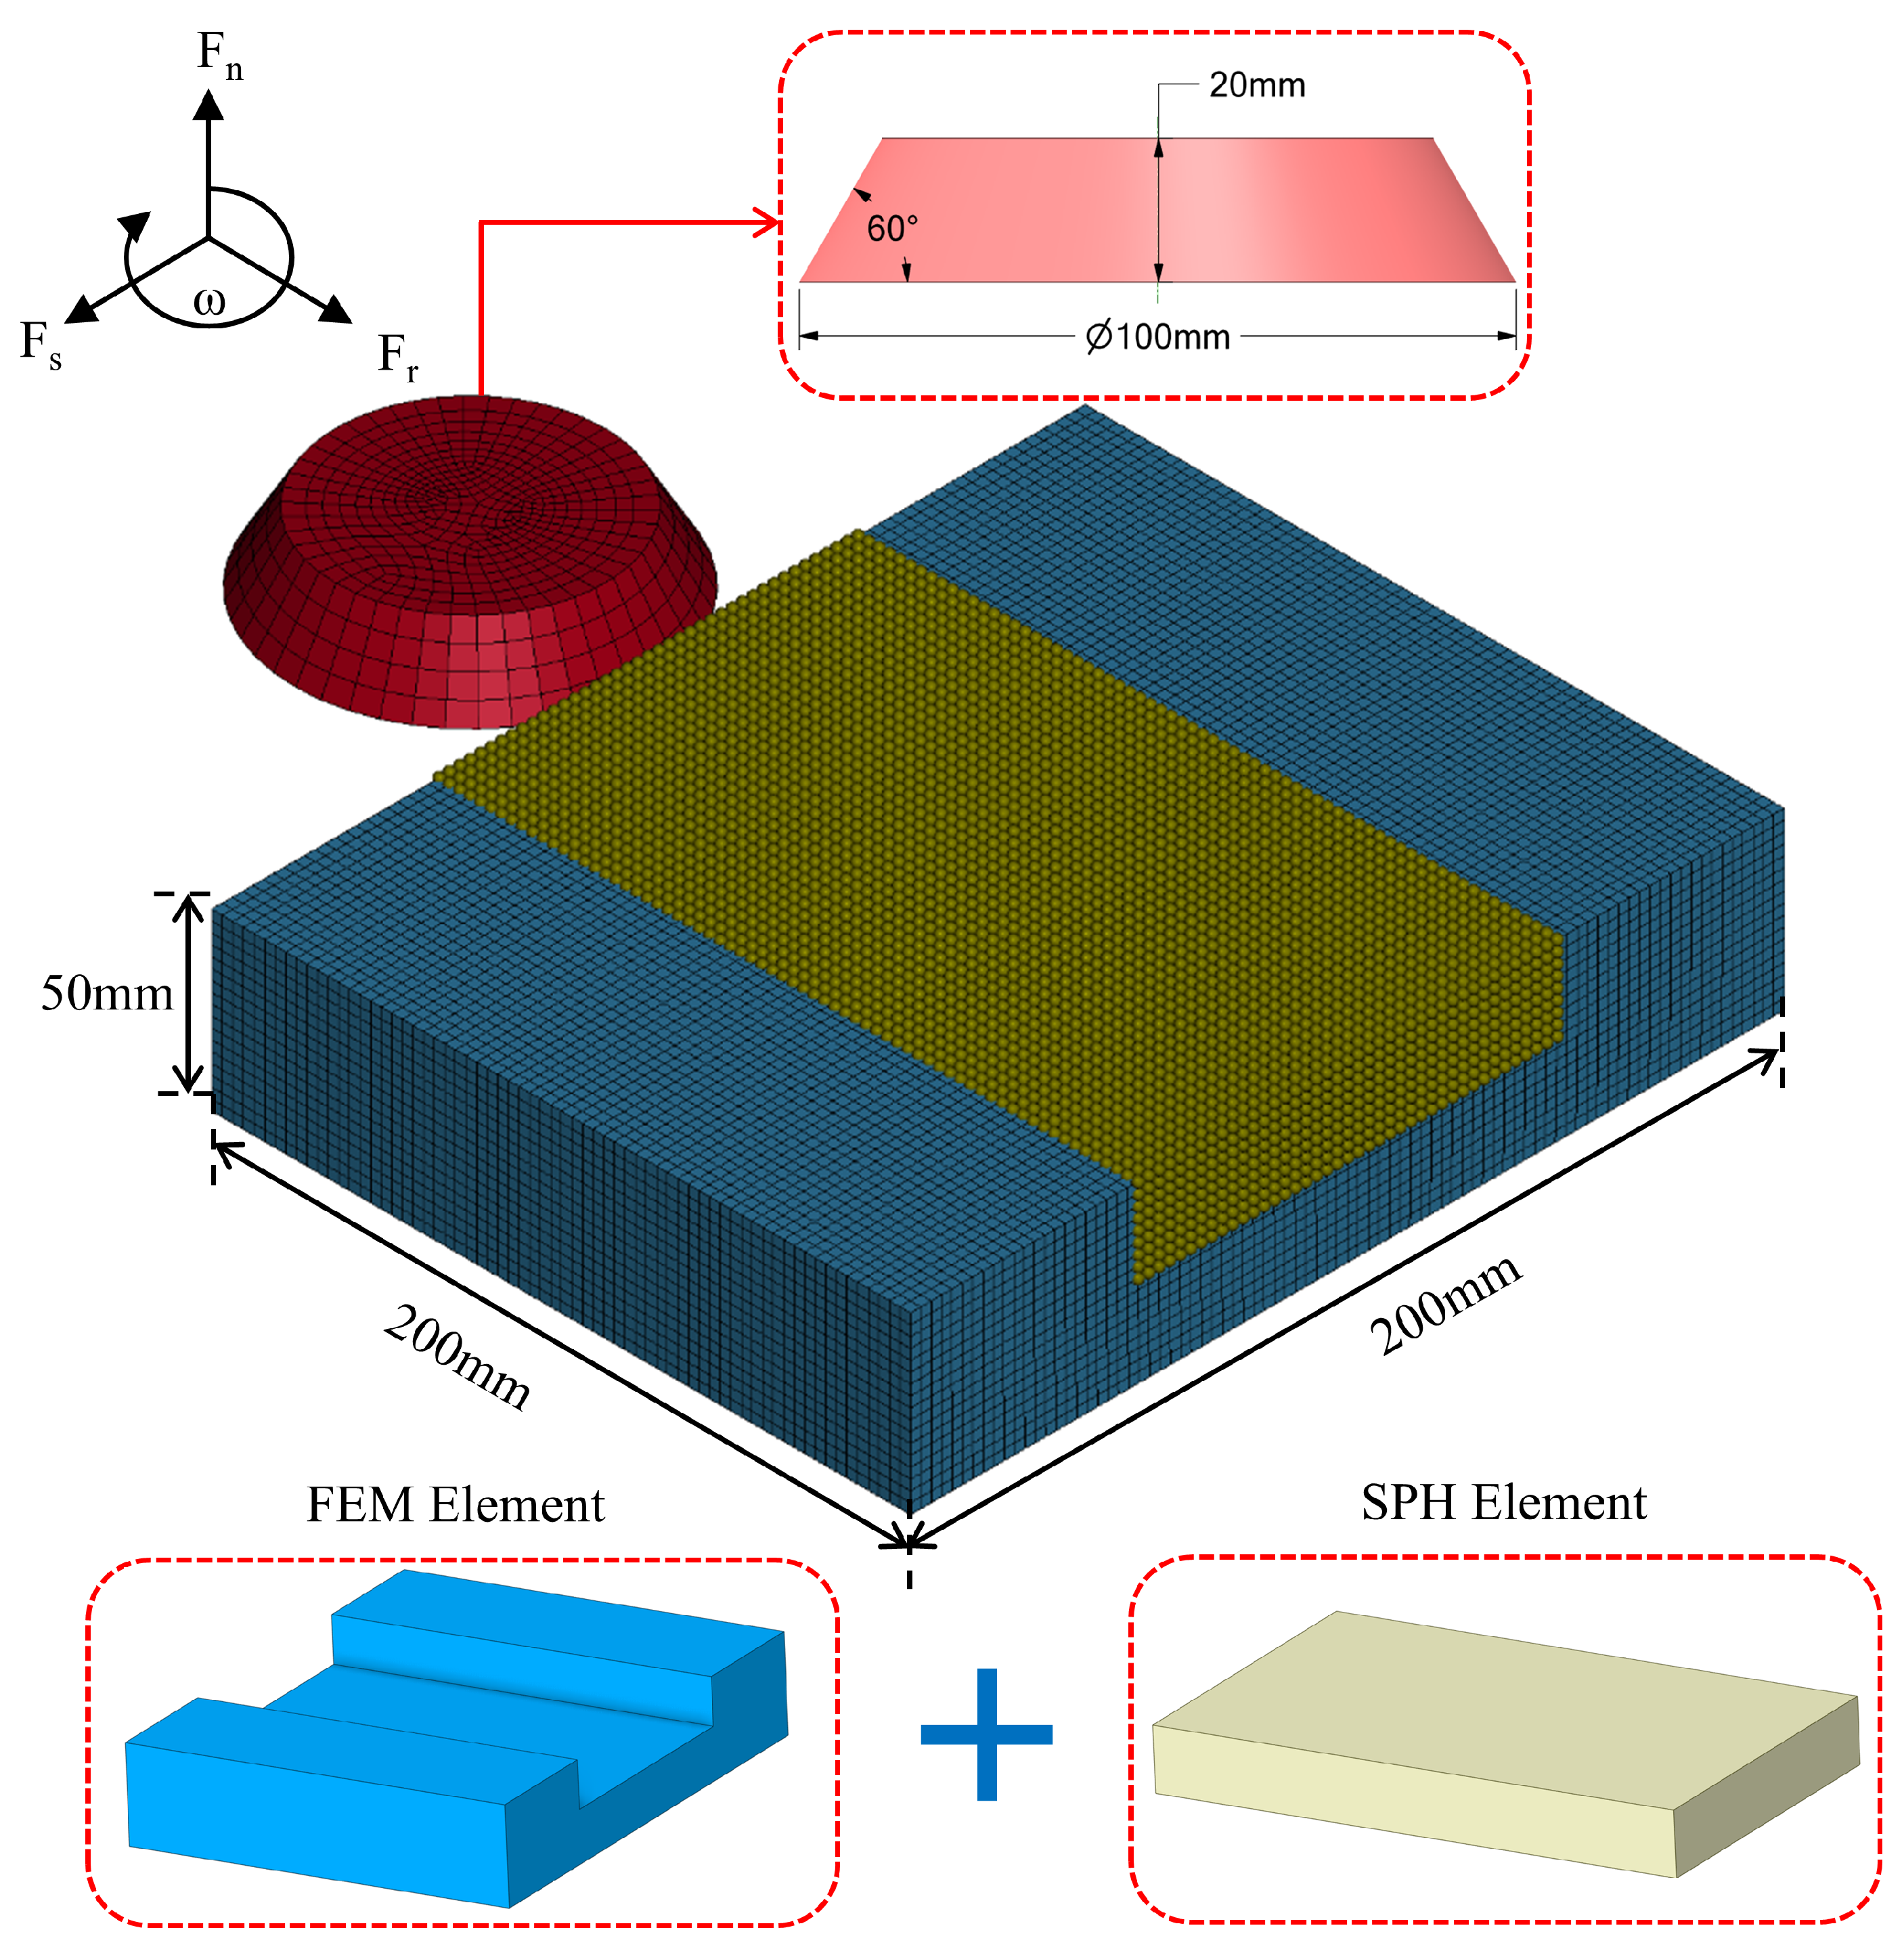
The rock specimen is modeled as a block measuring 200 mm × 200 mm × 50 mm. The disc cutter has a diameter of 100 mm, a height of 20 mm, and a wedge angle of 60°, as shown in
Figure 8. To minimize boundary effects, the SPH domain is applied locally, extending roughly twice the cutting depth in depth and twice the cutter diameter in width.
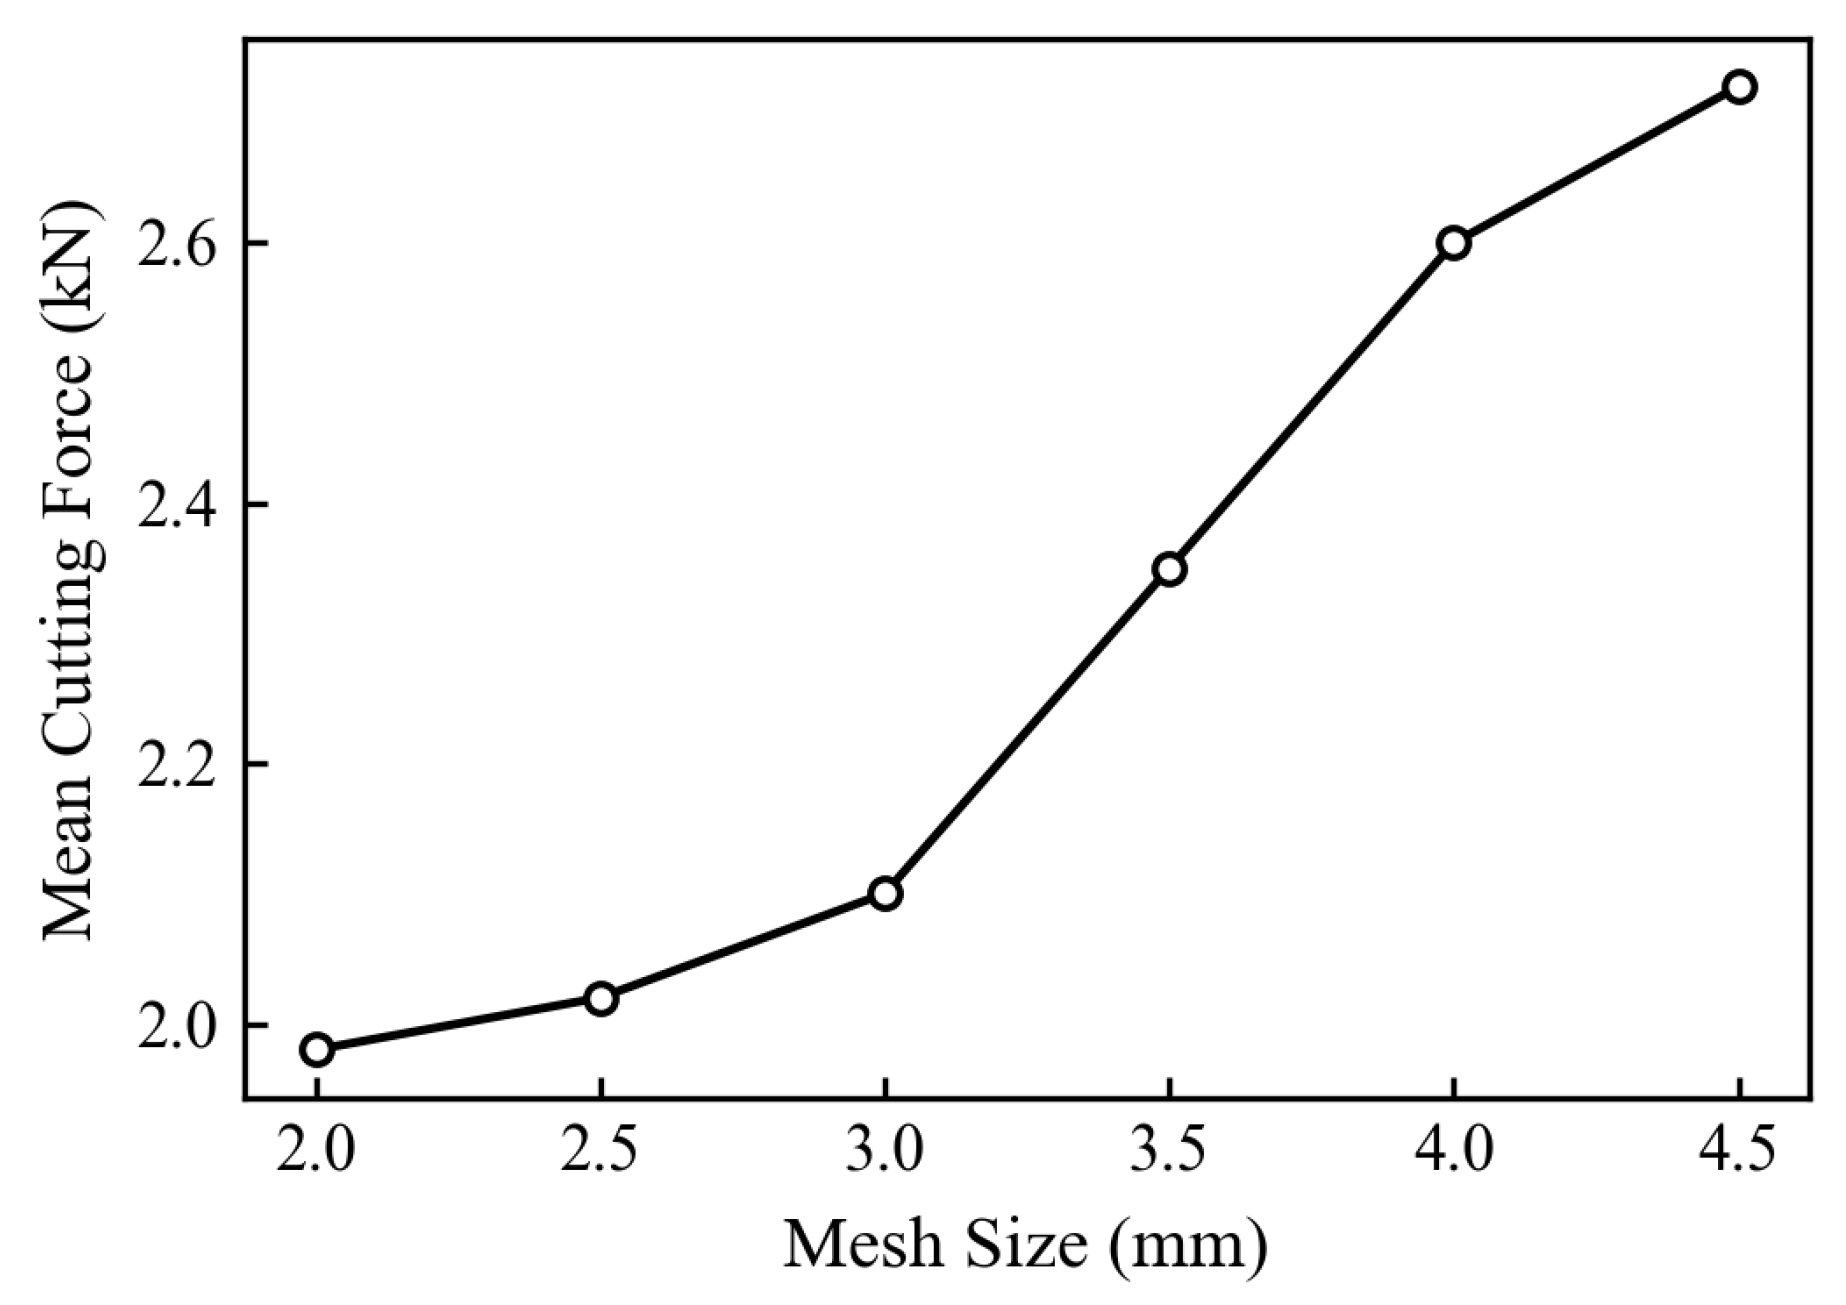
The rock is discretized using a swept mesh with 3 mm elements. To justify this resolution, a mesh sensitivity analysis was performed by varying the element size from 4.5 mm to 2.0 mm. As illustrated in
Figure 9, the mean cutting force converges as the mesh size decreases. Although further refinement to 2.5 mm and 2.0 mm slightly improves accuracy, the computational time exceeds 24 h per simulation, presenting a significant efficiency bottleneck. Balancing computational precision and resource availability, a 3 mm element size was selected as the optimal resolution, providing sufficient fidelity for rock fragmentation and damage while maintaining acceptable solver performance. The rigid cutter uses a coarser 6 mm mesh to reduce computational cost, as its deformation is negligible. The meshed model is illustrated in
Figure 8.
3.3.2. Boundary Conditions and Contact
To mitigate artificial boundary effects, the *BOUNDARY_NON_REFLECTING keyword is applied to the lateral and bottom outer faces of the FEM rock domain. This formulation functions as an impedance-matching viscous absorber that effectively dissipates incoming dilatational and shear stress waves, preventing them from reflecting back into the fragmentation zone. Given that the rock specimen dimensions provide a vast geometric buffer relative to the single-cut depth, the reflection coefficient at the boundaries is mathematically minimized near zero, thereby eliminating boundary interference on crack development. All rock surfaces are further appropriately constrained in terms of non-propagating degrees of freedom using *BOUNDARY_SPC_SET, except the top surface and the contact area with the disc, to prevent undesired rigid-body movement. Interaction between the cutter and rock is modeled using automatic node-to-surface contact, allowing realistic separation and force transfer during cutting. The friction coefficient between the disc and rock is set to 0.14, based on experimental data for rock-steel sliding [
36]. Sensitivity analyses performed by varying the friction coefficient across a representative range revealed a negligible impact on the macro-cutting forces. Because the cutter is modeled as a rigid body, the cutting resistance is heavily dominated by the progressive micro-damage of the rock matrix rather than interface friction. While the friction coefficient would play a more pronounced role if tool wear and surface roughness degradation were considered, progressive wear is beyond the scope of this rigid-body study.
To evaluate numerical efficiency, the model (approx. 75,000 total elements) was solved on a computing node with an Intel Core i5-14600KF CPU and 32 GB RAM. Computations were fully accelerated across all 14 cores using the LS-DYNA MPP single-precision solver. A representative simulation of a rock domain required approximately 12 h of wall-clock time, demonstrating highly acceptable efficiency and viability for industrial applications.
3.4. Calibration and Validation of the HJC Model
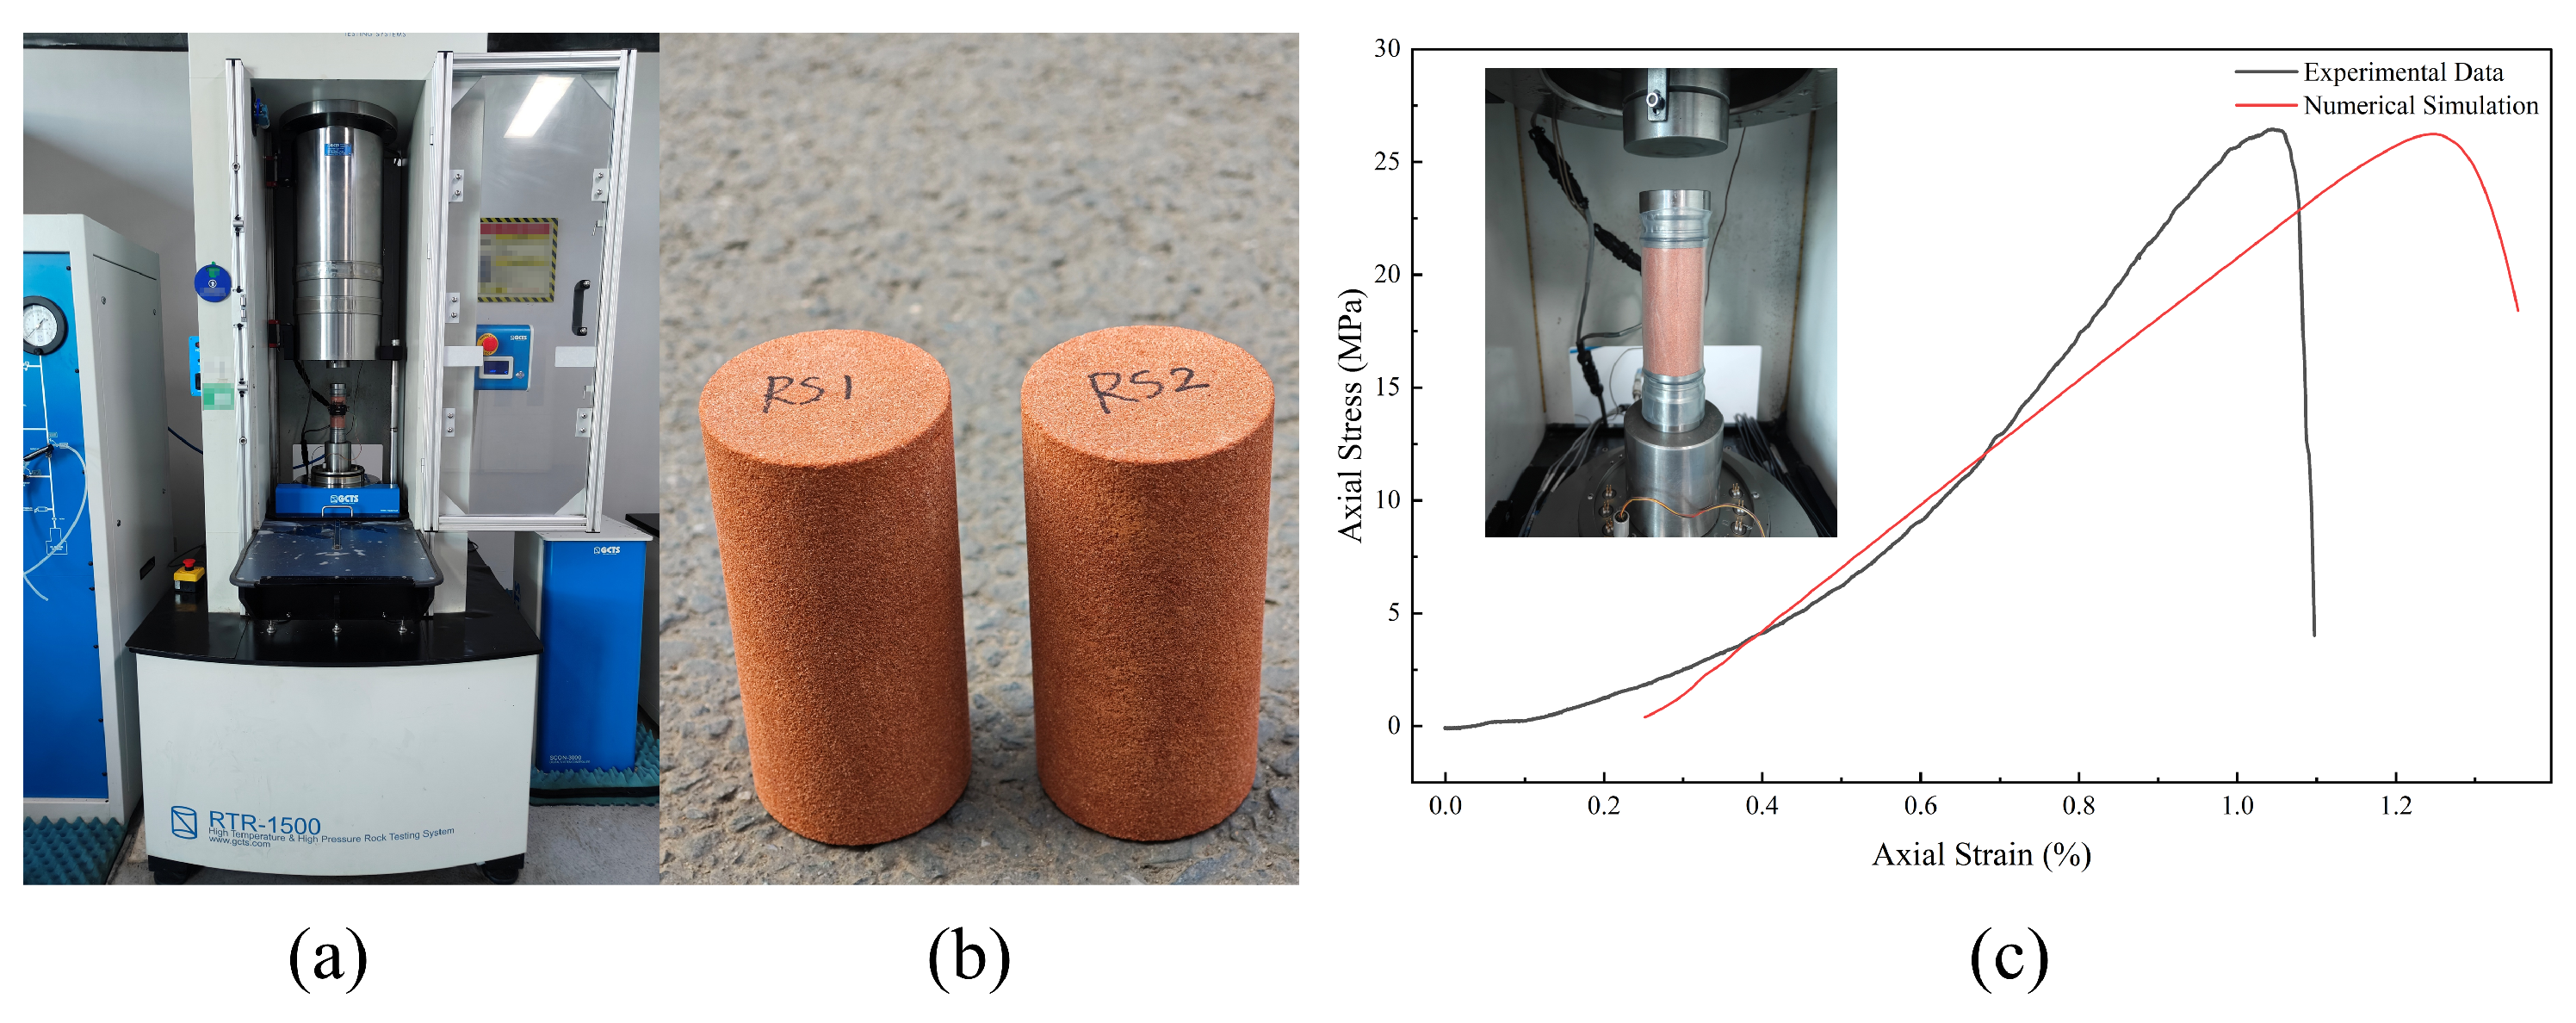
To ensure the predictive accuracy of the numerical framework, the Holmquist–Johnson–Cook (HJC) model parameters were calibrated and validated through uniaxial compressive strength (UCS) tests. Standard cylindrical sandstone specimens (50 mm diameter, 100 mm height) were prepared and loaded at a displacement rate of 0.5 mm/min to approximate quasi-static conditions. The experimental setup and the rock specimens are illustrated in
Figure 10a and
Figure 10b, respectively.
Figure 10c compares the experimental stress–strain curves with those obtained from the SPH simulations. The comprehensive parameters of the HJC model were initially referenced from previous literature on similar sandstone [
37]. Then, a trial-and-error calibration procedure was performed by repeatedly running simulations until the numerical stress–strain curve matched the experimental results. The final, fully calibrated constitutive parameters of the HJC model employed in this study are comprehensively summarized in
Table 2. The numerical results accurately capture the constitutive transition from linear elastic deformation to peak failure. The average experimental UCS is 26.45 MPa, while the simulation predicts a peak strength of 26.23 MPa, yielding a relative error of only 0.84%. Furthermore, the predicted elastic modulus matches the experimental observations closely, confirming the reliability of the calibrated material constants.
The physico-mechanical properties derived from the UCS results are summarized in
Table 3. These validated parameters serve as the fundamental input for the subsequent ODC numerical simulations.
4. Numerical Simulation Results and Discussion
4.1. Validation of the Simulation Model
The coupled SPH–FEM model is validated to ensure its accuracy in simulating the oscillating disc cutter (ODC) rock cutting process. Validation is performed using two complementary approaches: comparison with experimental measurements of cutting forces and rock fragmentation, and verification against analytical predictions based on the rock properties and cutter geometry.
4.1.1. Experimental Validation
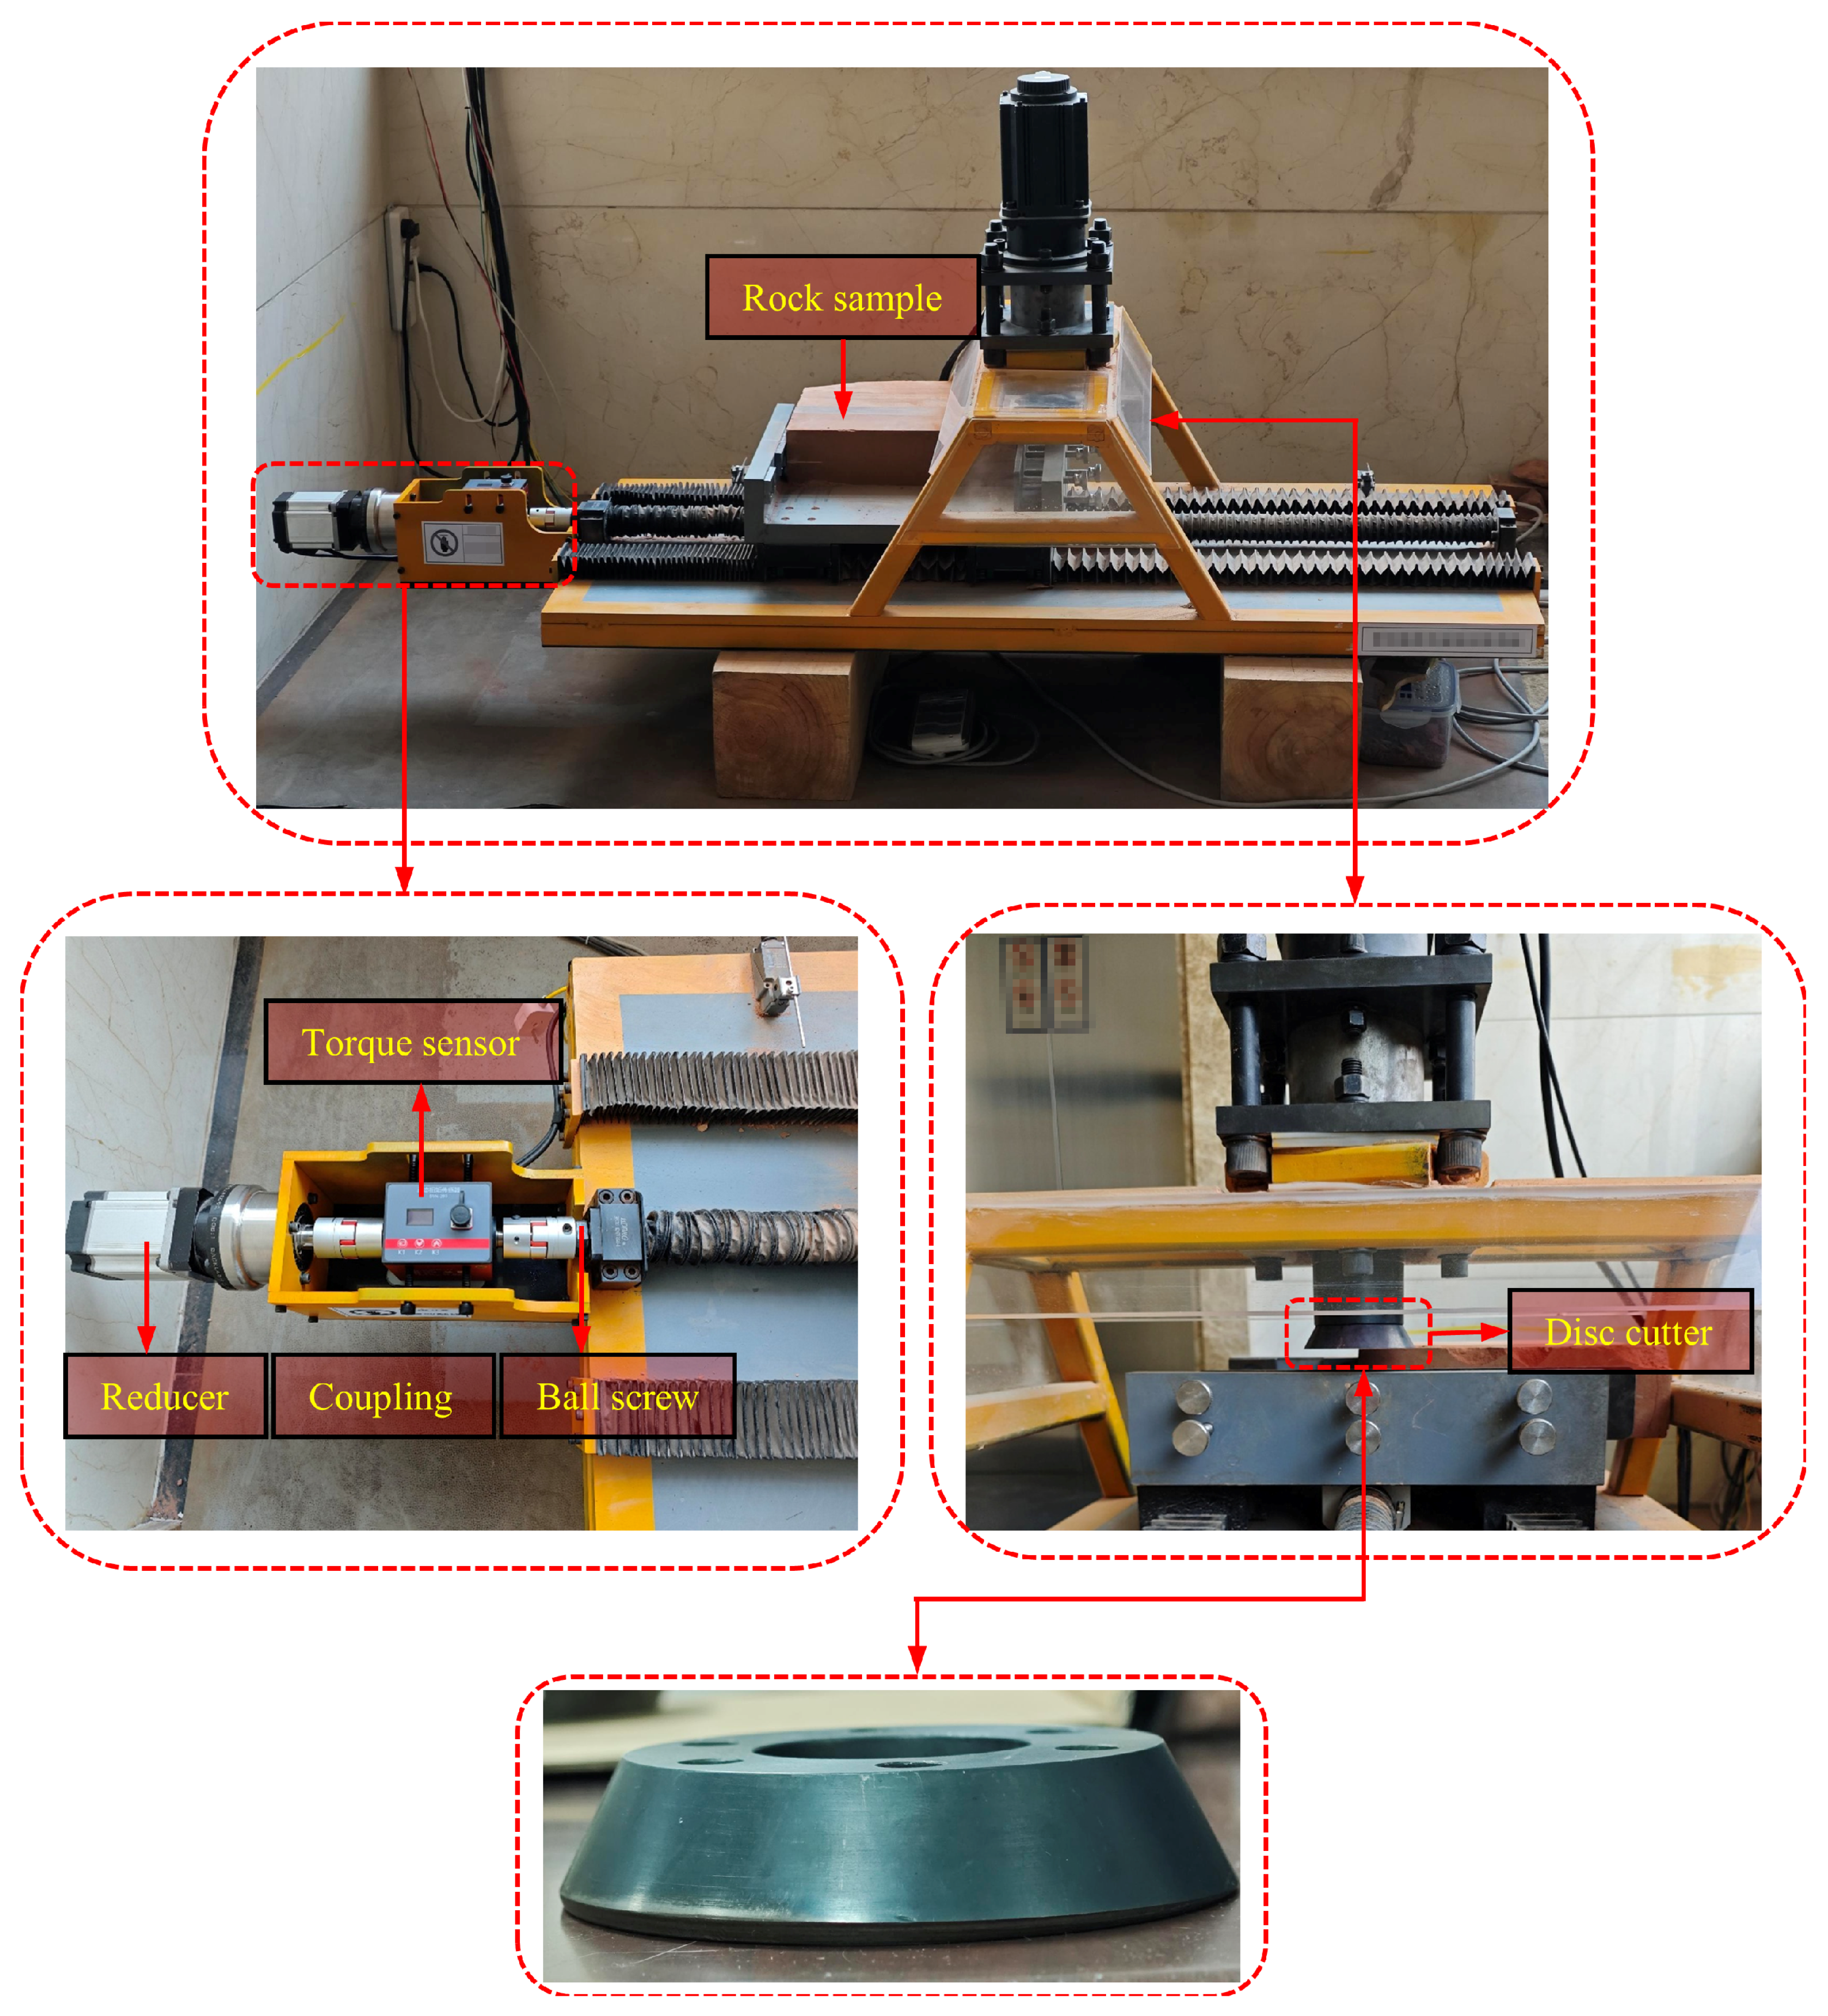
To verify the numerical model’s accuracy in describing the ODC rock-breaking process, the experimental setup shown in
Figure 11 was constructed using a self-developed high-stiffness Linear Cutting Machine (LCM). Rock properties (
Table 3) and cutter kinematics were kept consistent with the simulation. The continuous linear feeding of the rock specimen was precisely regulated by an AC servo motor-driven ball screw feed system. Meanwhile, the cutter oscillation was driven by a heavy-duty servo motor with an operational speed range of 250–1200 RPM. A high-precision DYN-200 dynamic torque sensor (0–5 N·m range,
full-scale accuracy) was utilized alongside a National Instruments (NI) data acquisition system, operating at a sampling frequency of 5 kHz to capture the rapid force fluctuations induced by the ODC action. Each cutting scenario was repeated three times on parallel tracks to mitigate stochastic uncertainty from rock heterogeneity, ensuring a combined measurement uncertainty within
%.
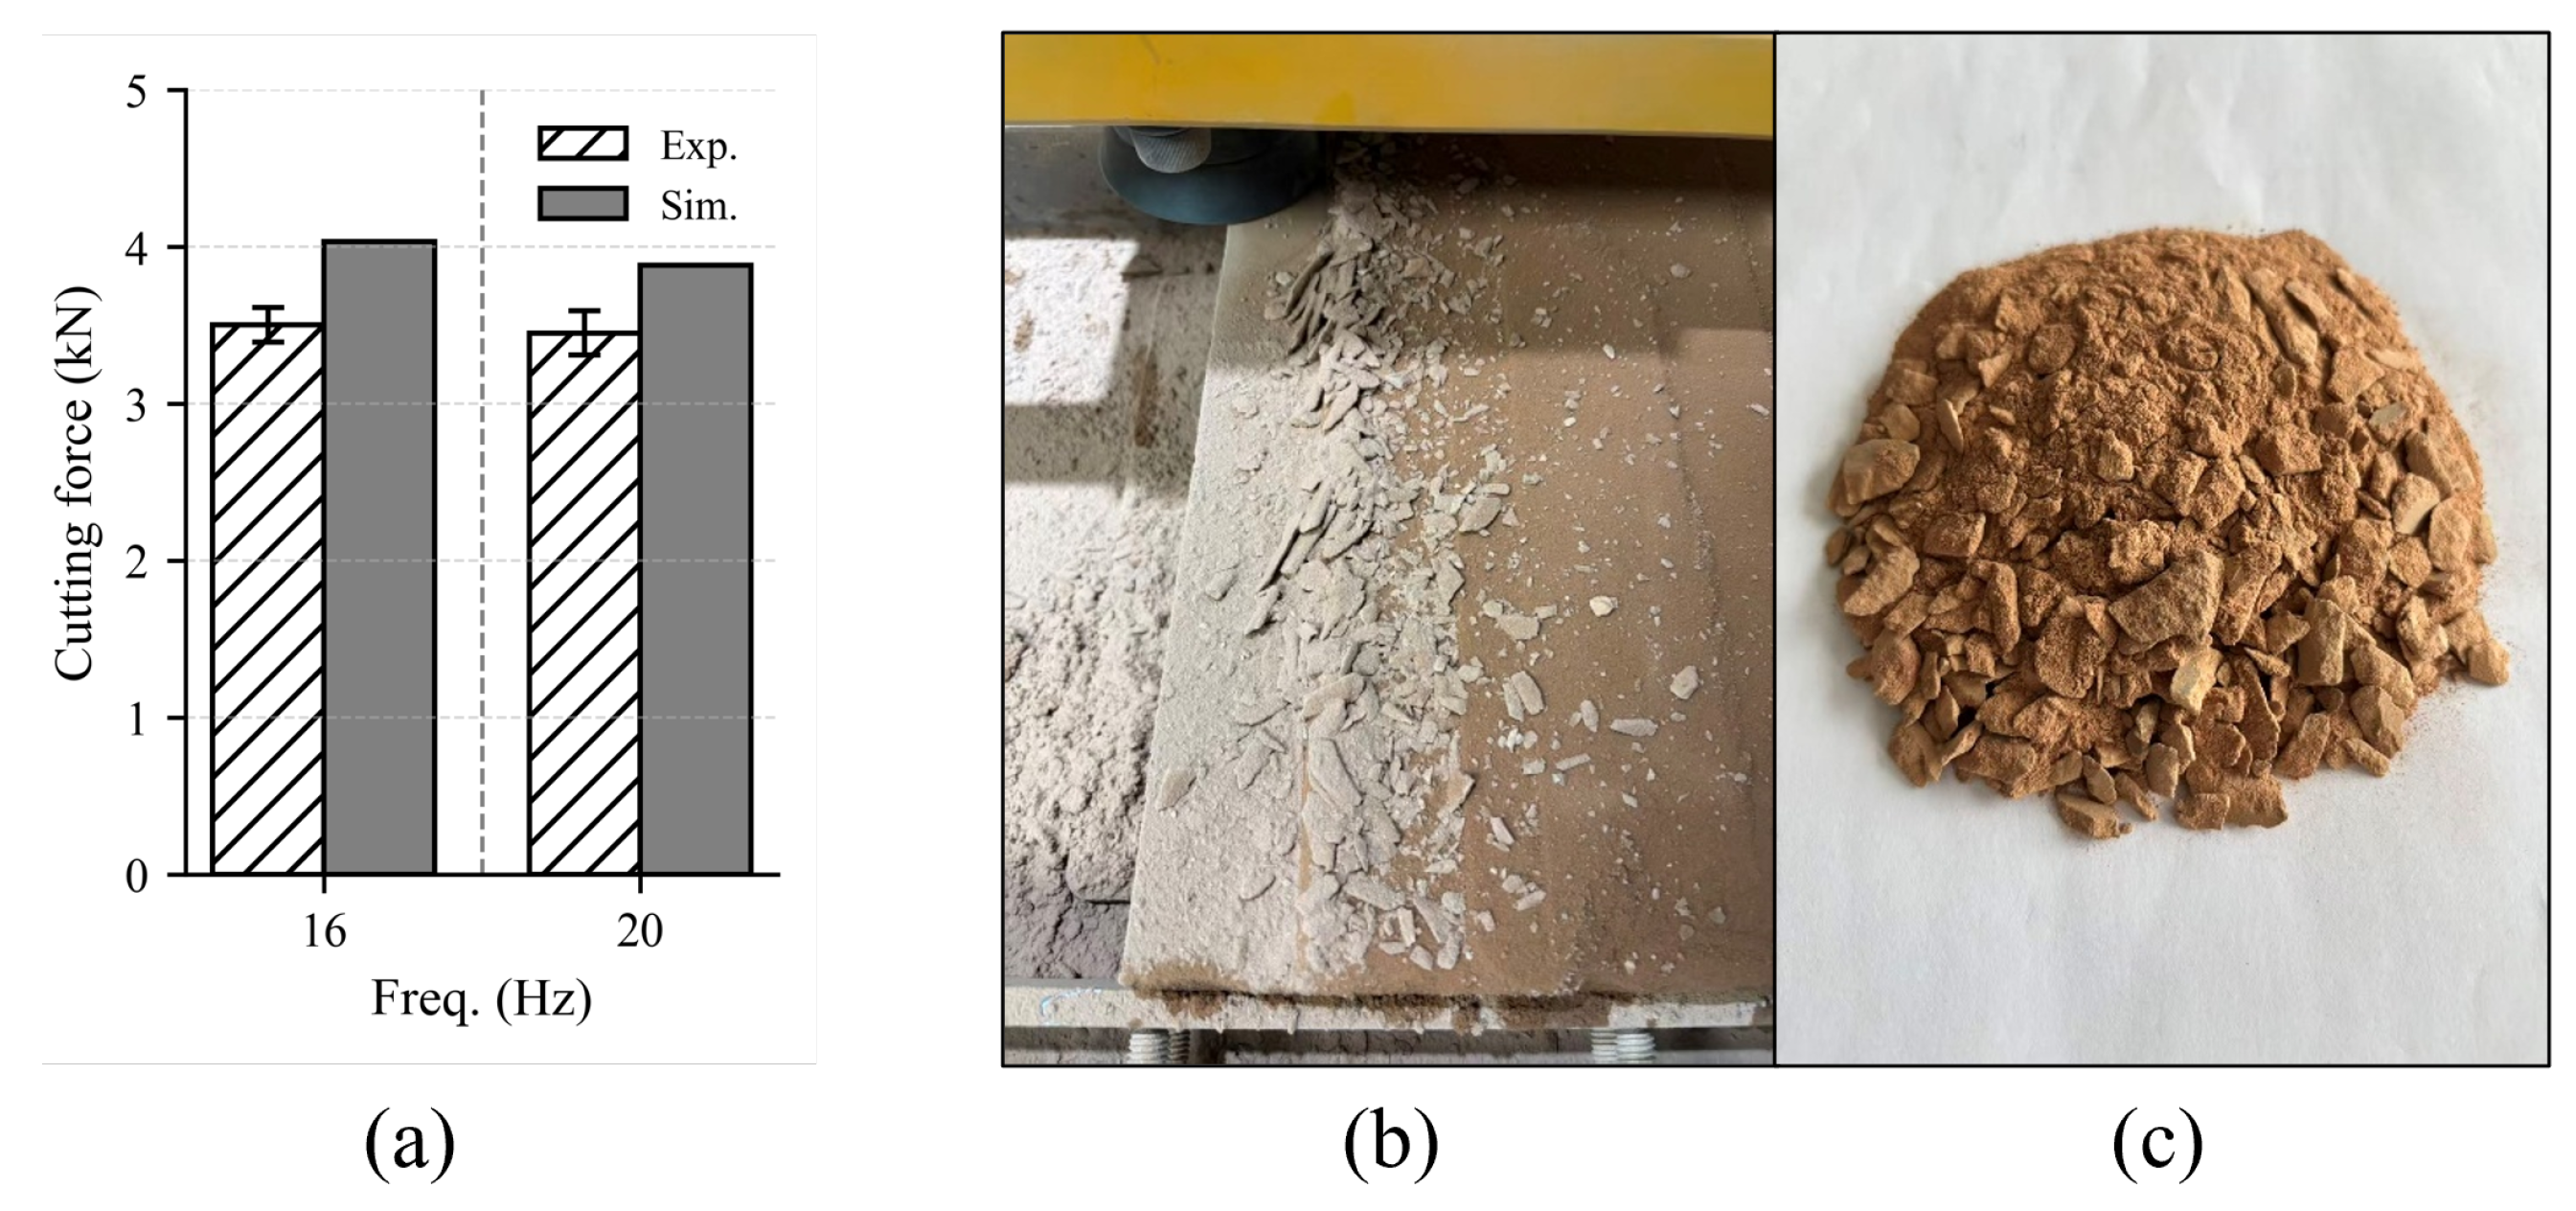
To evaluate the model’s performance with experimental variability considered, the cutting forces are reported as mean ± standard deviation based on the three repetitive tests. As shown in
Figure 12a, at
Hz, the experimental cutting force is
kN, while the simulated force is 4.03 kN (15.14% error). At
Hz, the experimental force is
kN against the simulated value of 3.88 kN (12.46% error). These minor discrepancies are primarily due to the stochastic heterogeneity of natural rock and the idealized HJC parameters. Despite this, the consistent force trends confirm the robustness of the numerical model.
Qualitative validation is supported by chip morphology (
Figure 12b,c). The experimental chips exhibit distinct brittle fracture, consisting of fine powder and large-scale flakes. The SPH simulation effectively replicates this fragmentation pattern through particle separation and crack coalescence, confirming that the numerical approach correctly represents the rock fragmentation mechanism under ODC action.
4.1.2. Theoretical Comparison
The physical consistency of the SPH–FEM model was further benchmarked against analytical solutions. Using the properties of the red sandstone, the theoretical mean rolling force (
) was calculated from Equation (
10) and compared with simulation results (
) in
Table 4. The simulation exhibits excellent agreement with predictions, showing a maximum deviation of 16.8% and an average error of 8.89%.
The discrepancies stem from two factors: (1) Analytical models rely on idealized piecewise linear approximations, neglecting non-linear phenomena like strain rate-dependent yielding and detailed fracture mechanics captured by the HJC model. (2) The analytical approach is quasi-static, while the SPH–FEM model fully accounts for dynamic loading effects and inertial forces. These dynamic factors are particularly evident at higher oscillation velocity ratios (), where dynamic effects are most pronounced.
4.2. Damage Zone
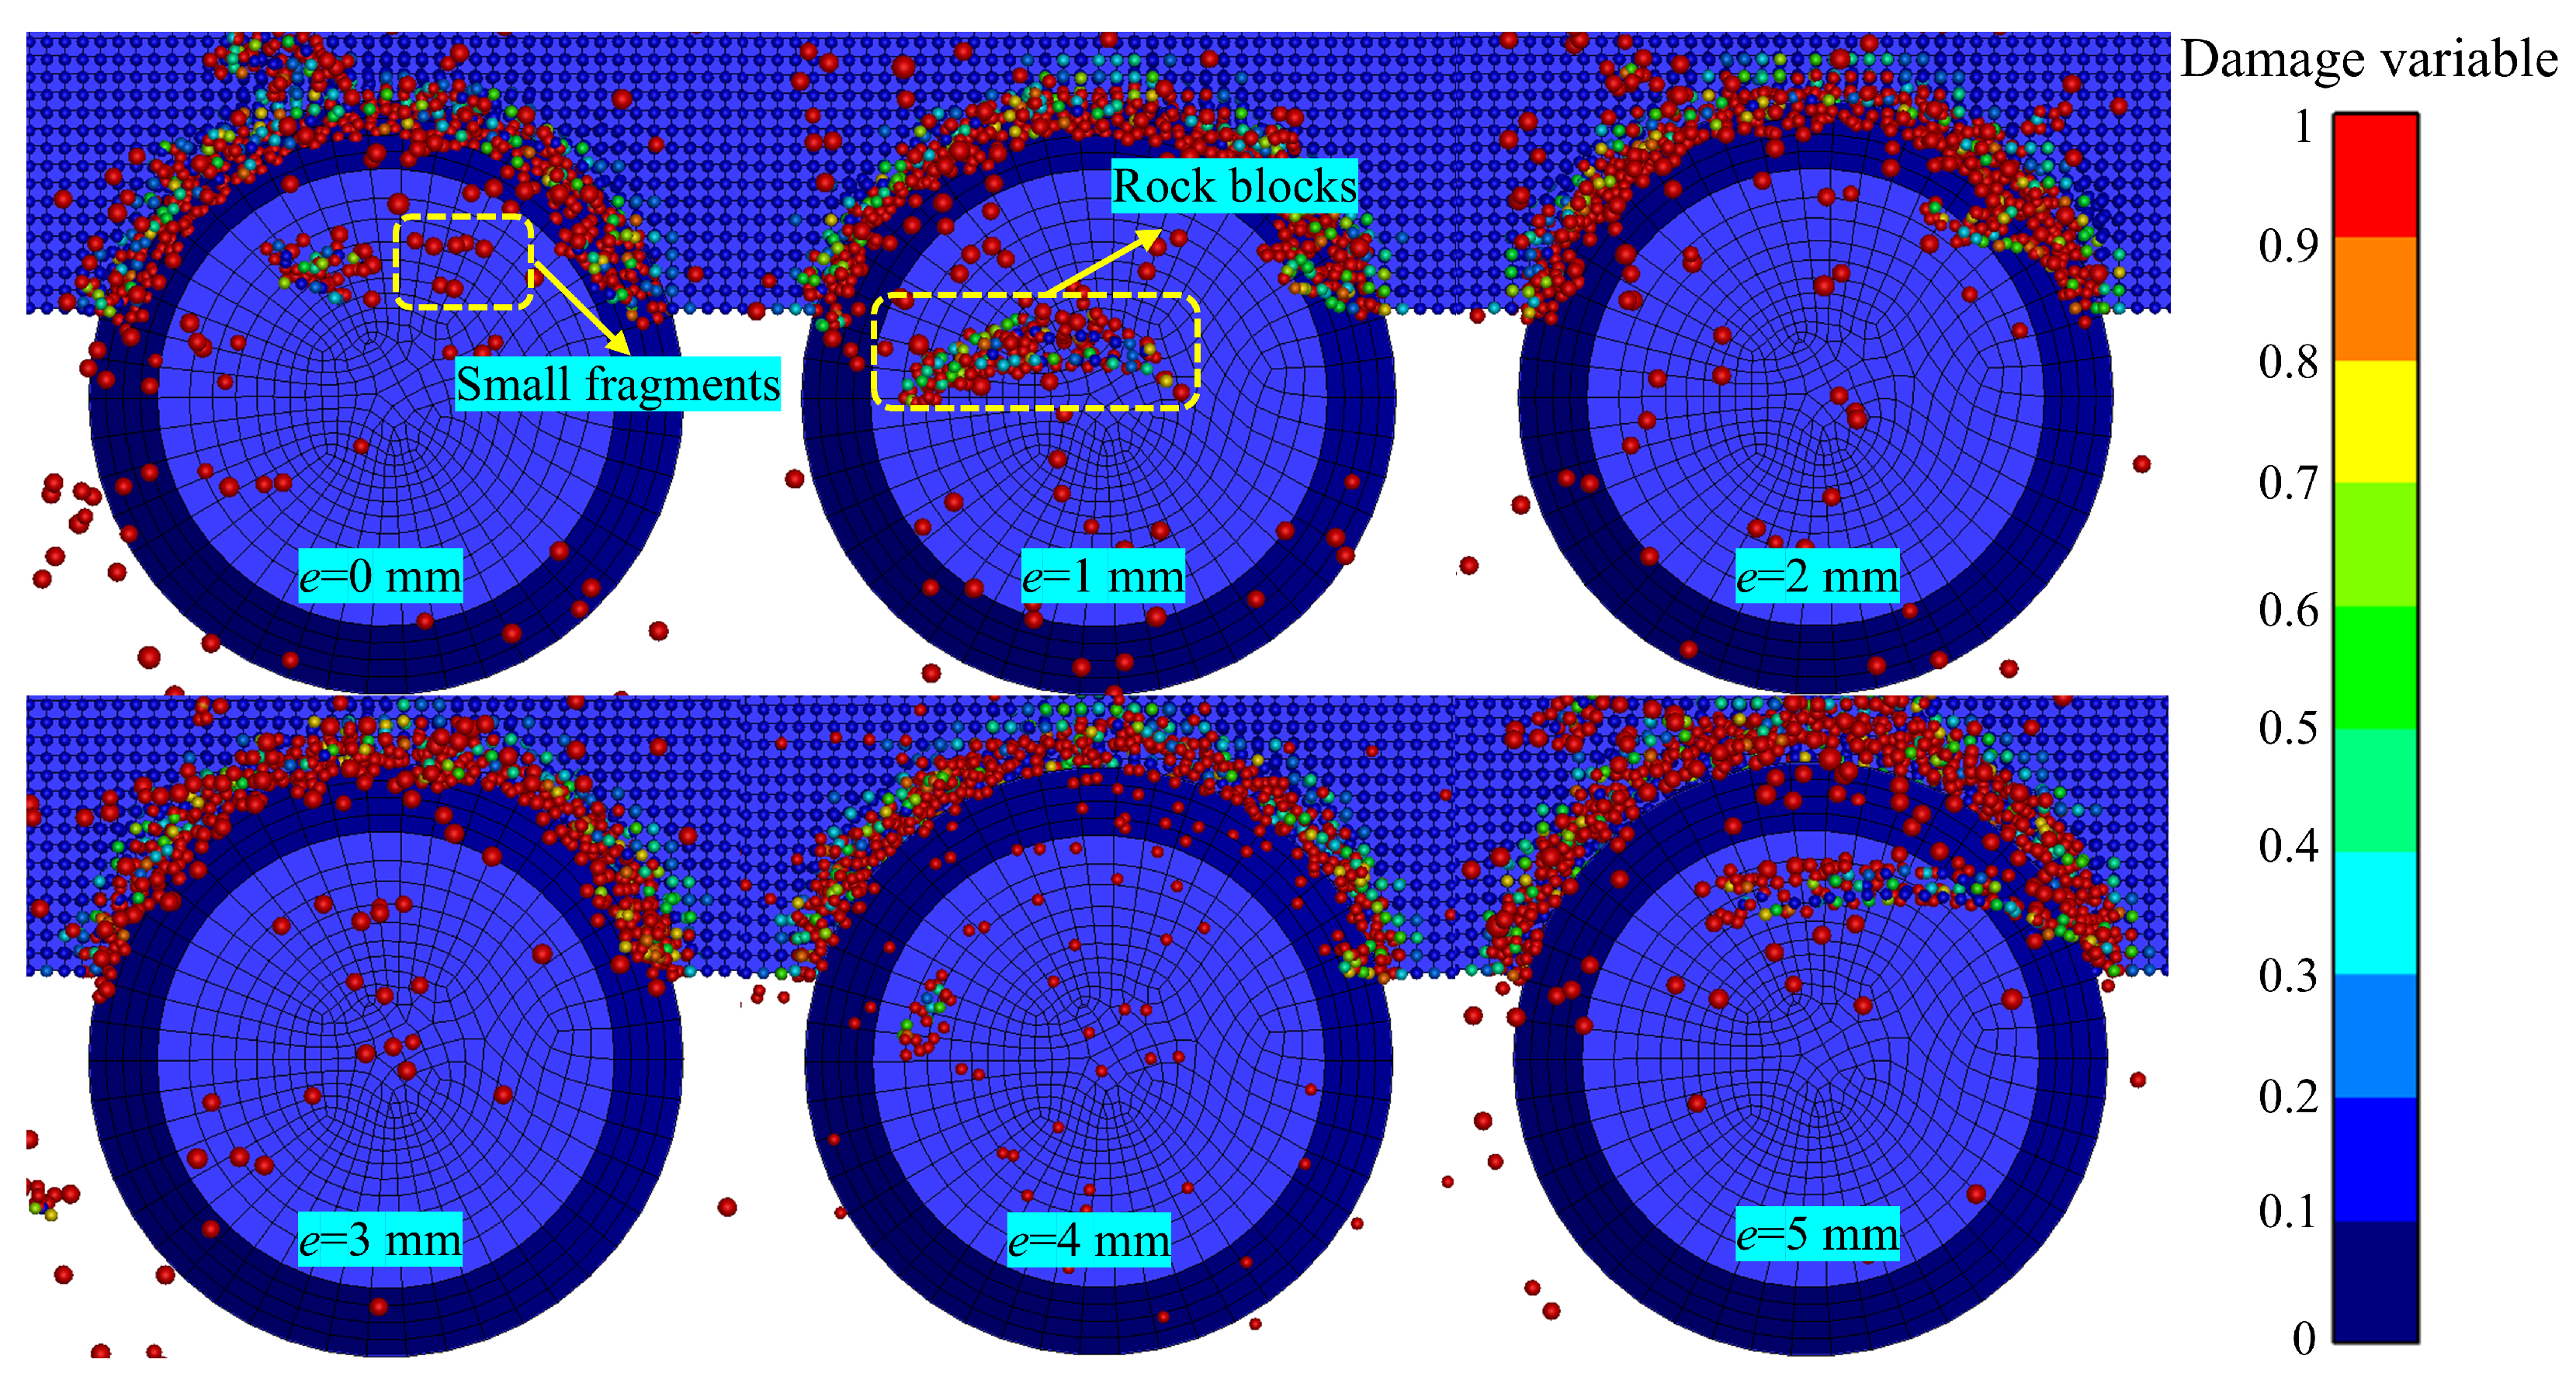
Figure 13 shows the distribution of the damage parameter
D for eccentricities
to 5 mm. In the HJC model,
indicates intact rock, and
indicates complete failure.
The simulation resolves multi-scale fragmentation: fine SPH particles represent small debris, and coalesced failure zones form larger rock blocks. At
mm and
mm, these coalesced zones isolate significant rock segments. As
e increases, the damage zone expands both laterally and vertically, consistent with the theoretical trajectory
(
Section 2.1). This expansion quantifies the increased rock volume removed per oscillation, confirming the efficiency of the ODC in enhancing fragmentation.
4.3. Comparison Between Conventional and Eccentric Cutting
To evaluate the influence of disc eccentricity on rock-breaking efficiency, a comparative analysis was performed between the conventional cutting mode (
mm) and the eccentric cutting mode (
mm) under identical operating parameters (
mm/s,
Hz).
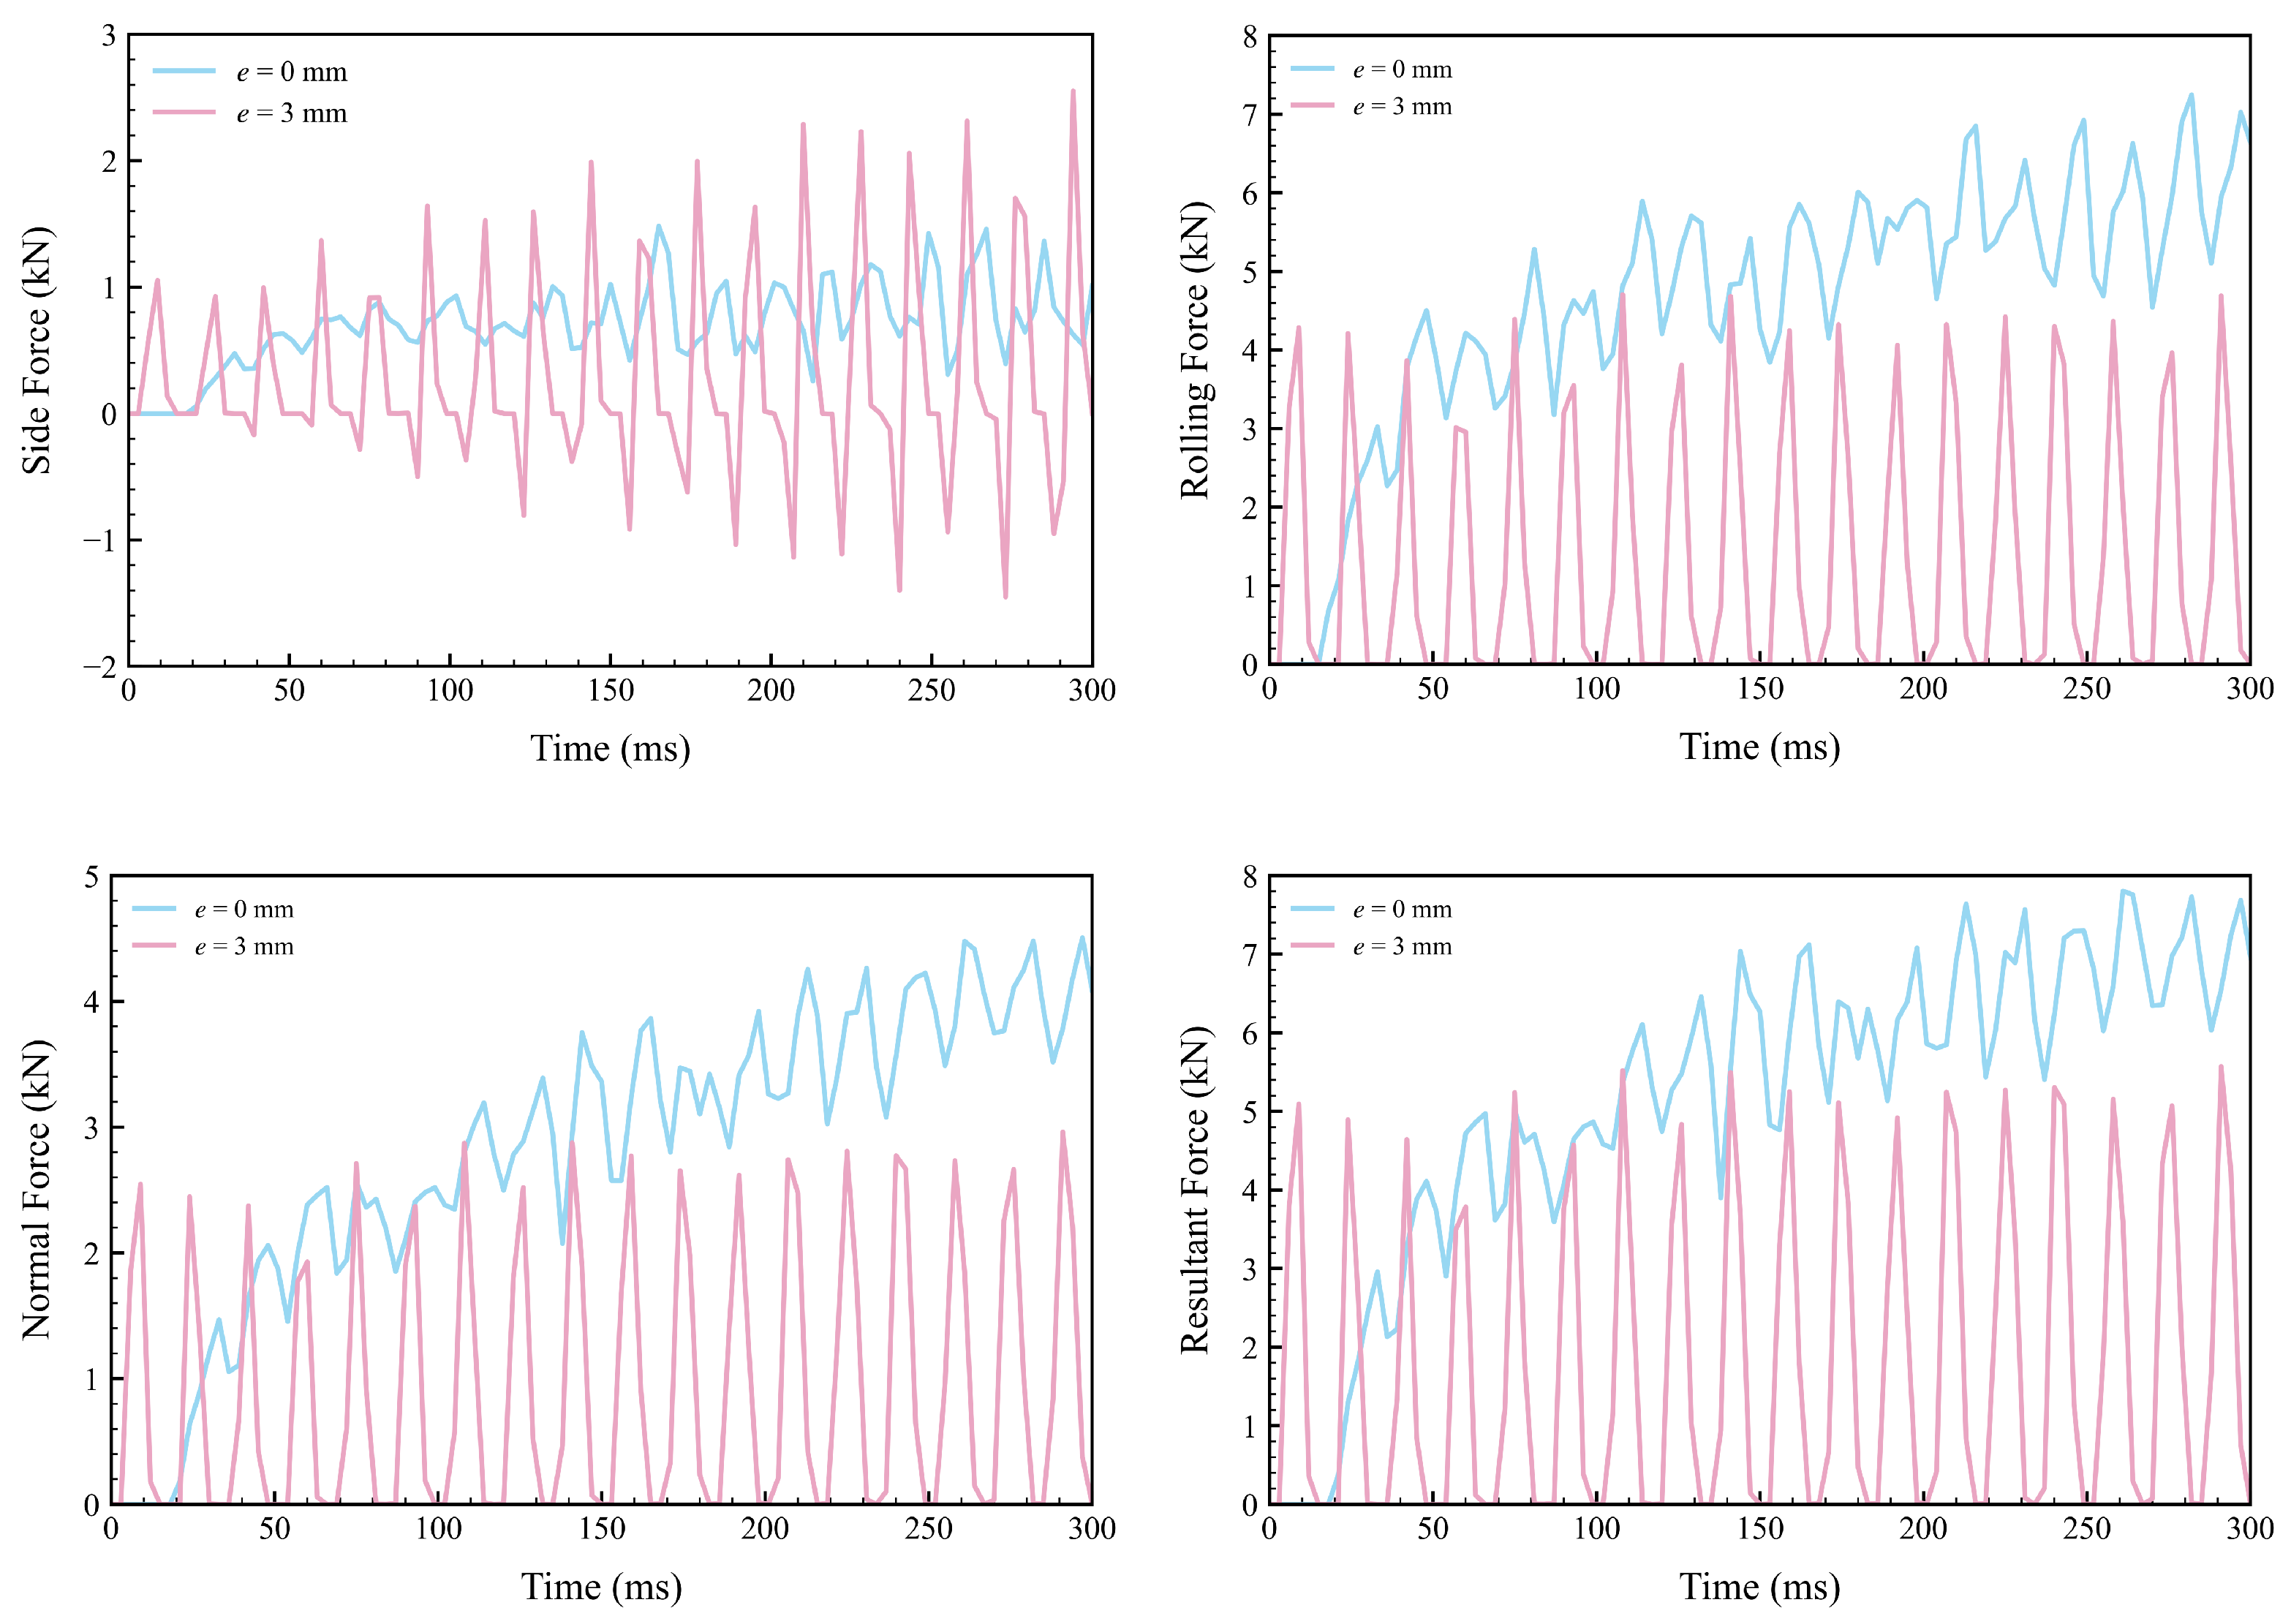
Figure 14 illustrates the dynamic cutting force profiles over time, while
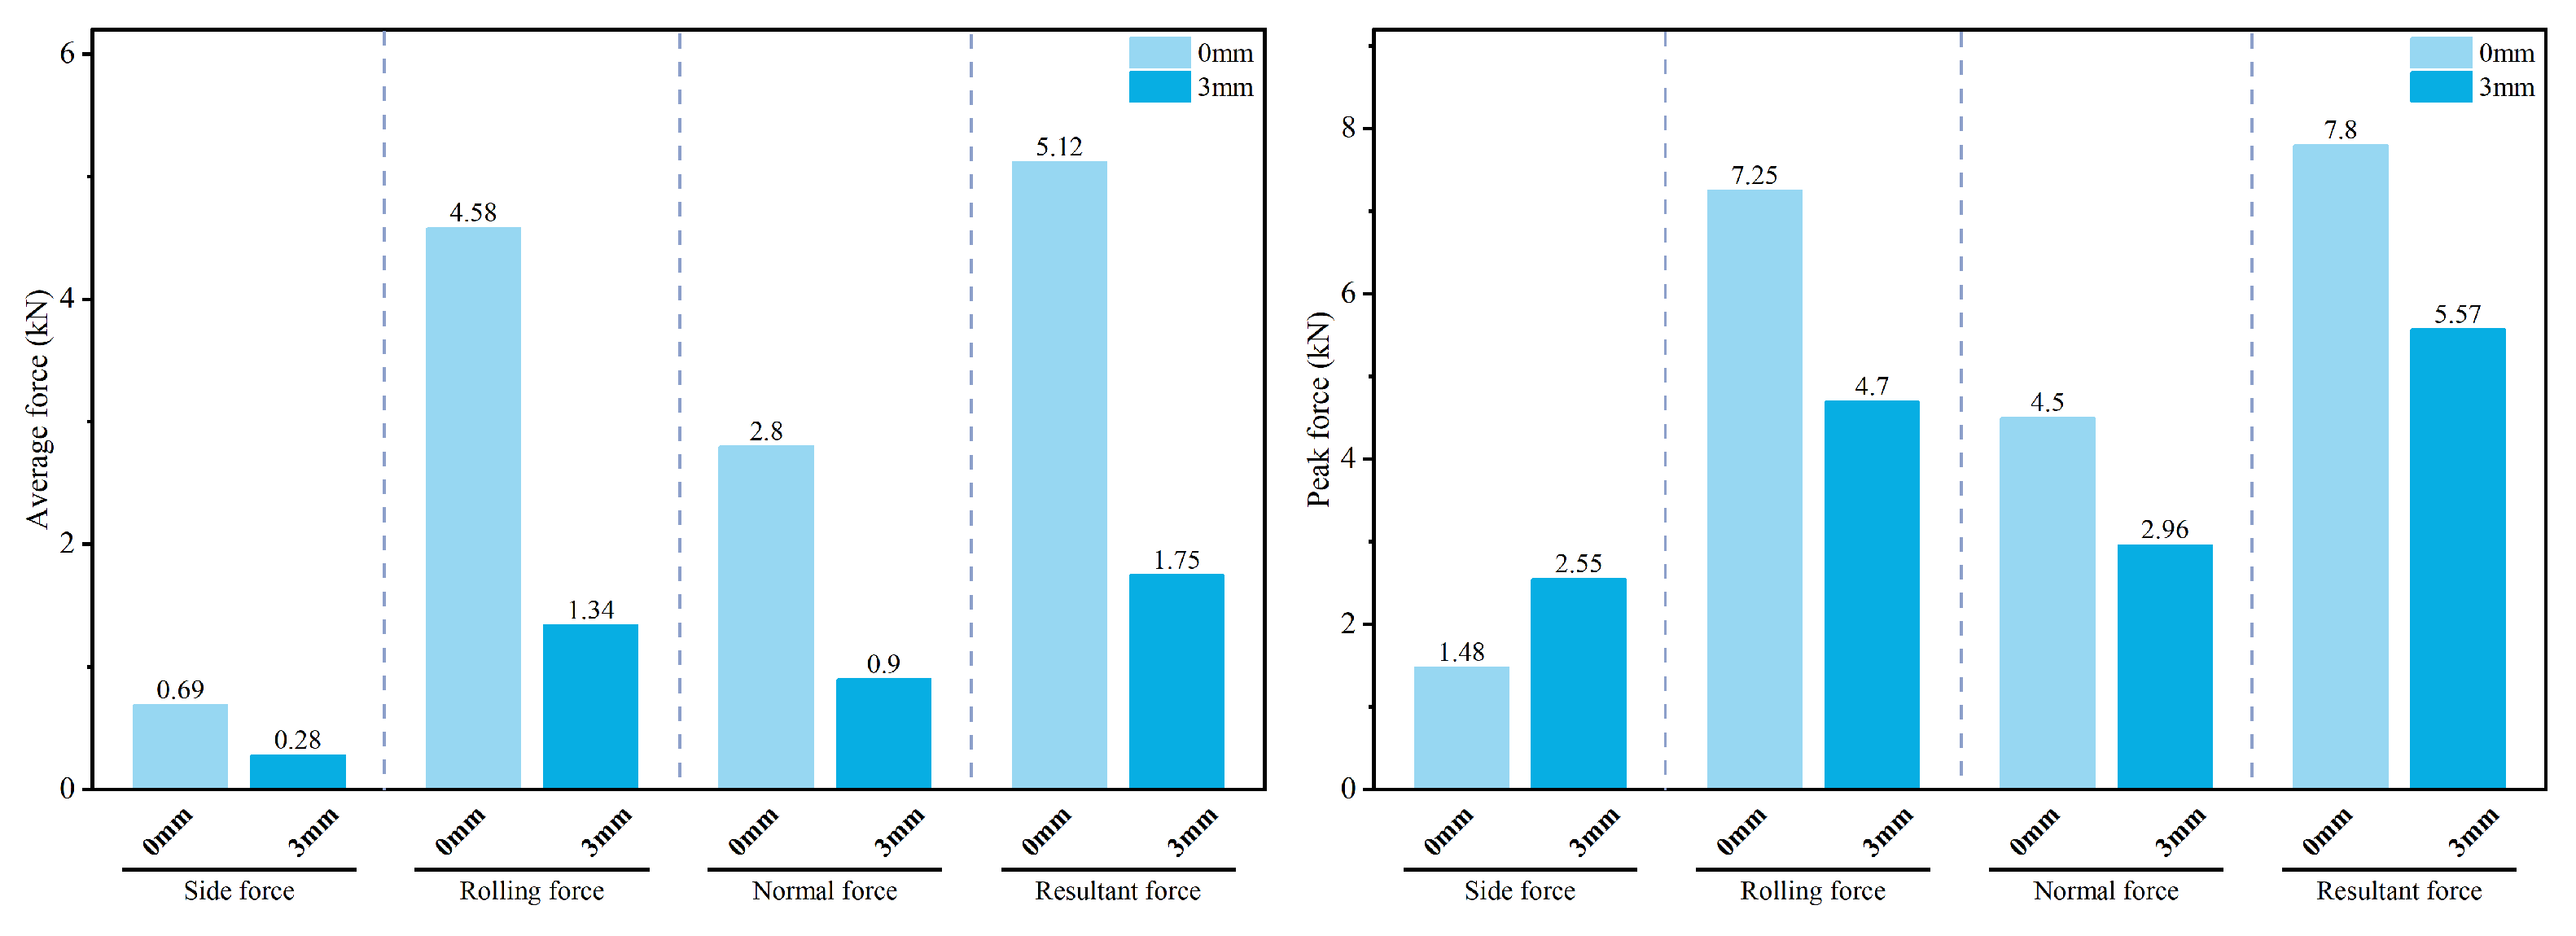
Figure 15 provides a quantitative comparison of the average and peak force components.
For the conventional disc cutter, the continuous contact with the rock matrix leads to a steady accumulation of cutting forces. The rolling force reaches a maximum peak of 7.25 kN and maintains a high mean value of 4.58 kN. This sustained force profile indicates that the conventional drive system must continuously exert a substantial load to overcome the compressive strength of the rock and sustain steady-state penetration.
In contrast, the eccentric disc alters the continuous cutting process into a sequence of high-frequency dynamic impacts. As depicted in
Figure 14, the force profiles exhibit distinct, periodic pulses. Owing to the periodic retraction of the cutter blade within each eccentric cycle, the cutting forces drop to near-zero levels, effectively suppressing continuous load accumulation. Consequently, the average resultant force is significantly reduced by approximately 66% (from 5.12 kN to 1.75 kN), accompanied by substantial decreases in the average rolling and normal forces. Interestingly, while the peak resultant force decreases by 29%, the peak side force increases from 1.48 kN to 2.55 kN. This phenomenon is attributed to the intense lateral impact induced by the eccentric trajectory as the cutter re-engages and penetrates the rock matrix.
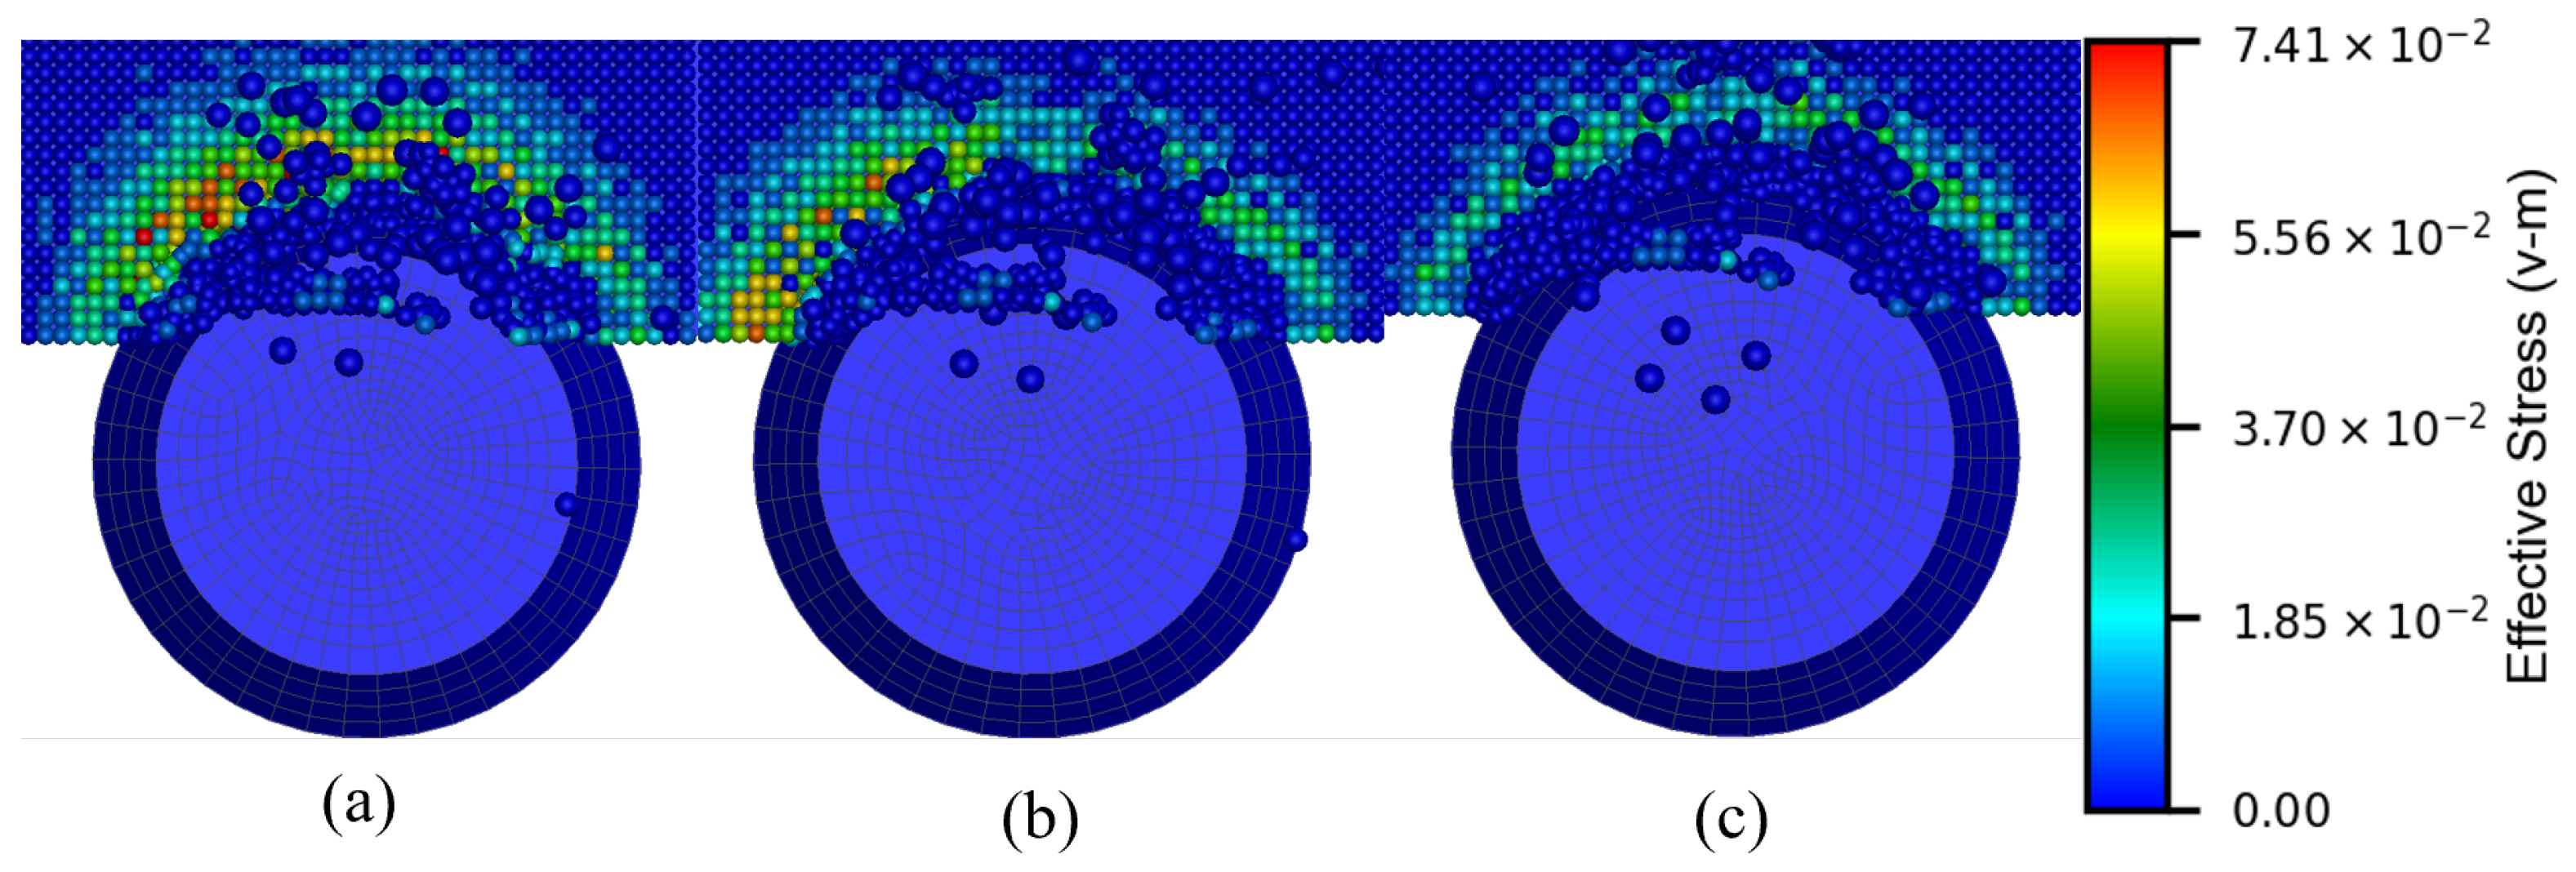
The fundamental mechanism underlying this force reduction lies in the transition from quasi-static continuous crushing to dynamic pulse-induced fracturing. To further elucidate this rock-breaking mechanism, the dynamic evolution of the equivalent stress field (von Mises stress) during a single impact-unloading cycle is presented in
Figure 16.
As illustrated, the rock fragmentation process can be distinctly categorized into three sequential phases. Initially, during the peak loading phase (
Figure 16a), a high-intensity stress concentration zone forms directly beneath the cutter tip, denoting severe localized strain and damage initiation. As the cutter progresses further (
Figure 16b), this stress field broadens and radiates outward, driving the rapid propagation of micro-cracks through the rock matrix. Subsequently, during the unloading phase (
Figure 16c), the localized stress field dramatically dissipates and relaxes as macroscopic rock fragmentation occurs and fragments detach.
This cyclical sequence of damage accumulation, stress redistribution, and stress relaxation prevents the formation of a compacted crushed core beneath the cutter. By eliminating persistent friction and allowing the strain energy to reset periodically during the retraction phase, the eccentric disc mode achieves superior rock fragmentation while dramatically mitigating the average tool force and energy consumption.
4.4. Effect of Eccentricity on Cutting Forces
The eccentricity (e) is a primary design parameter governing the oscillation kinematics and the resulting tool–rock interaction. In this section, all simulations were conducted at a constant oscillation frequency of 60 Hz and a cutting depth of 8 mm.
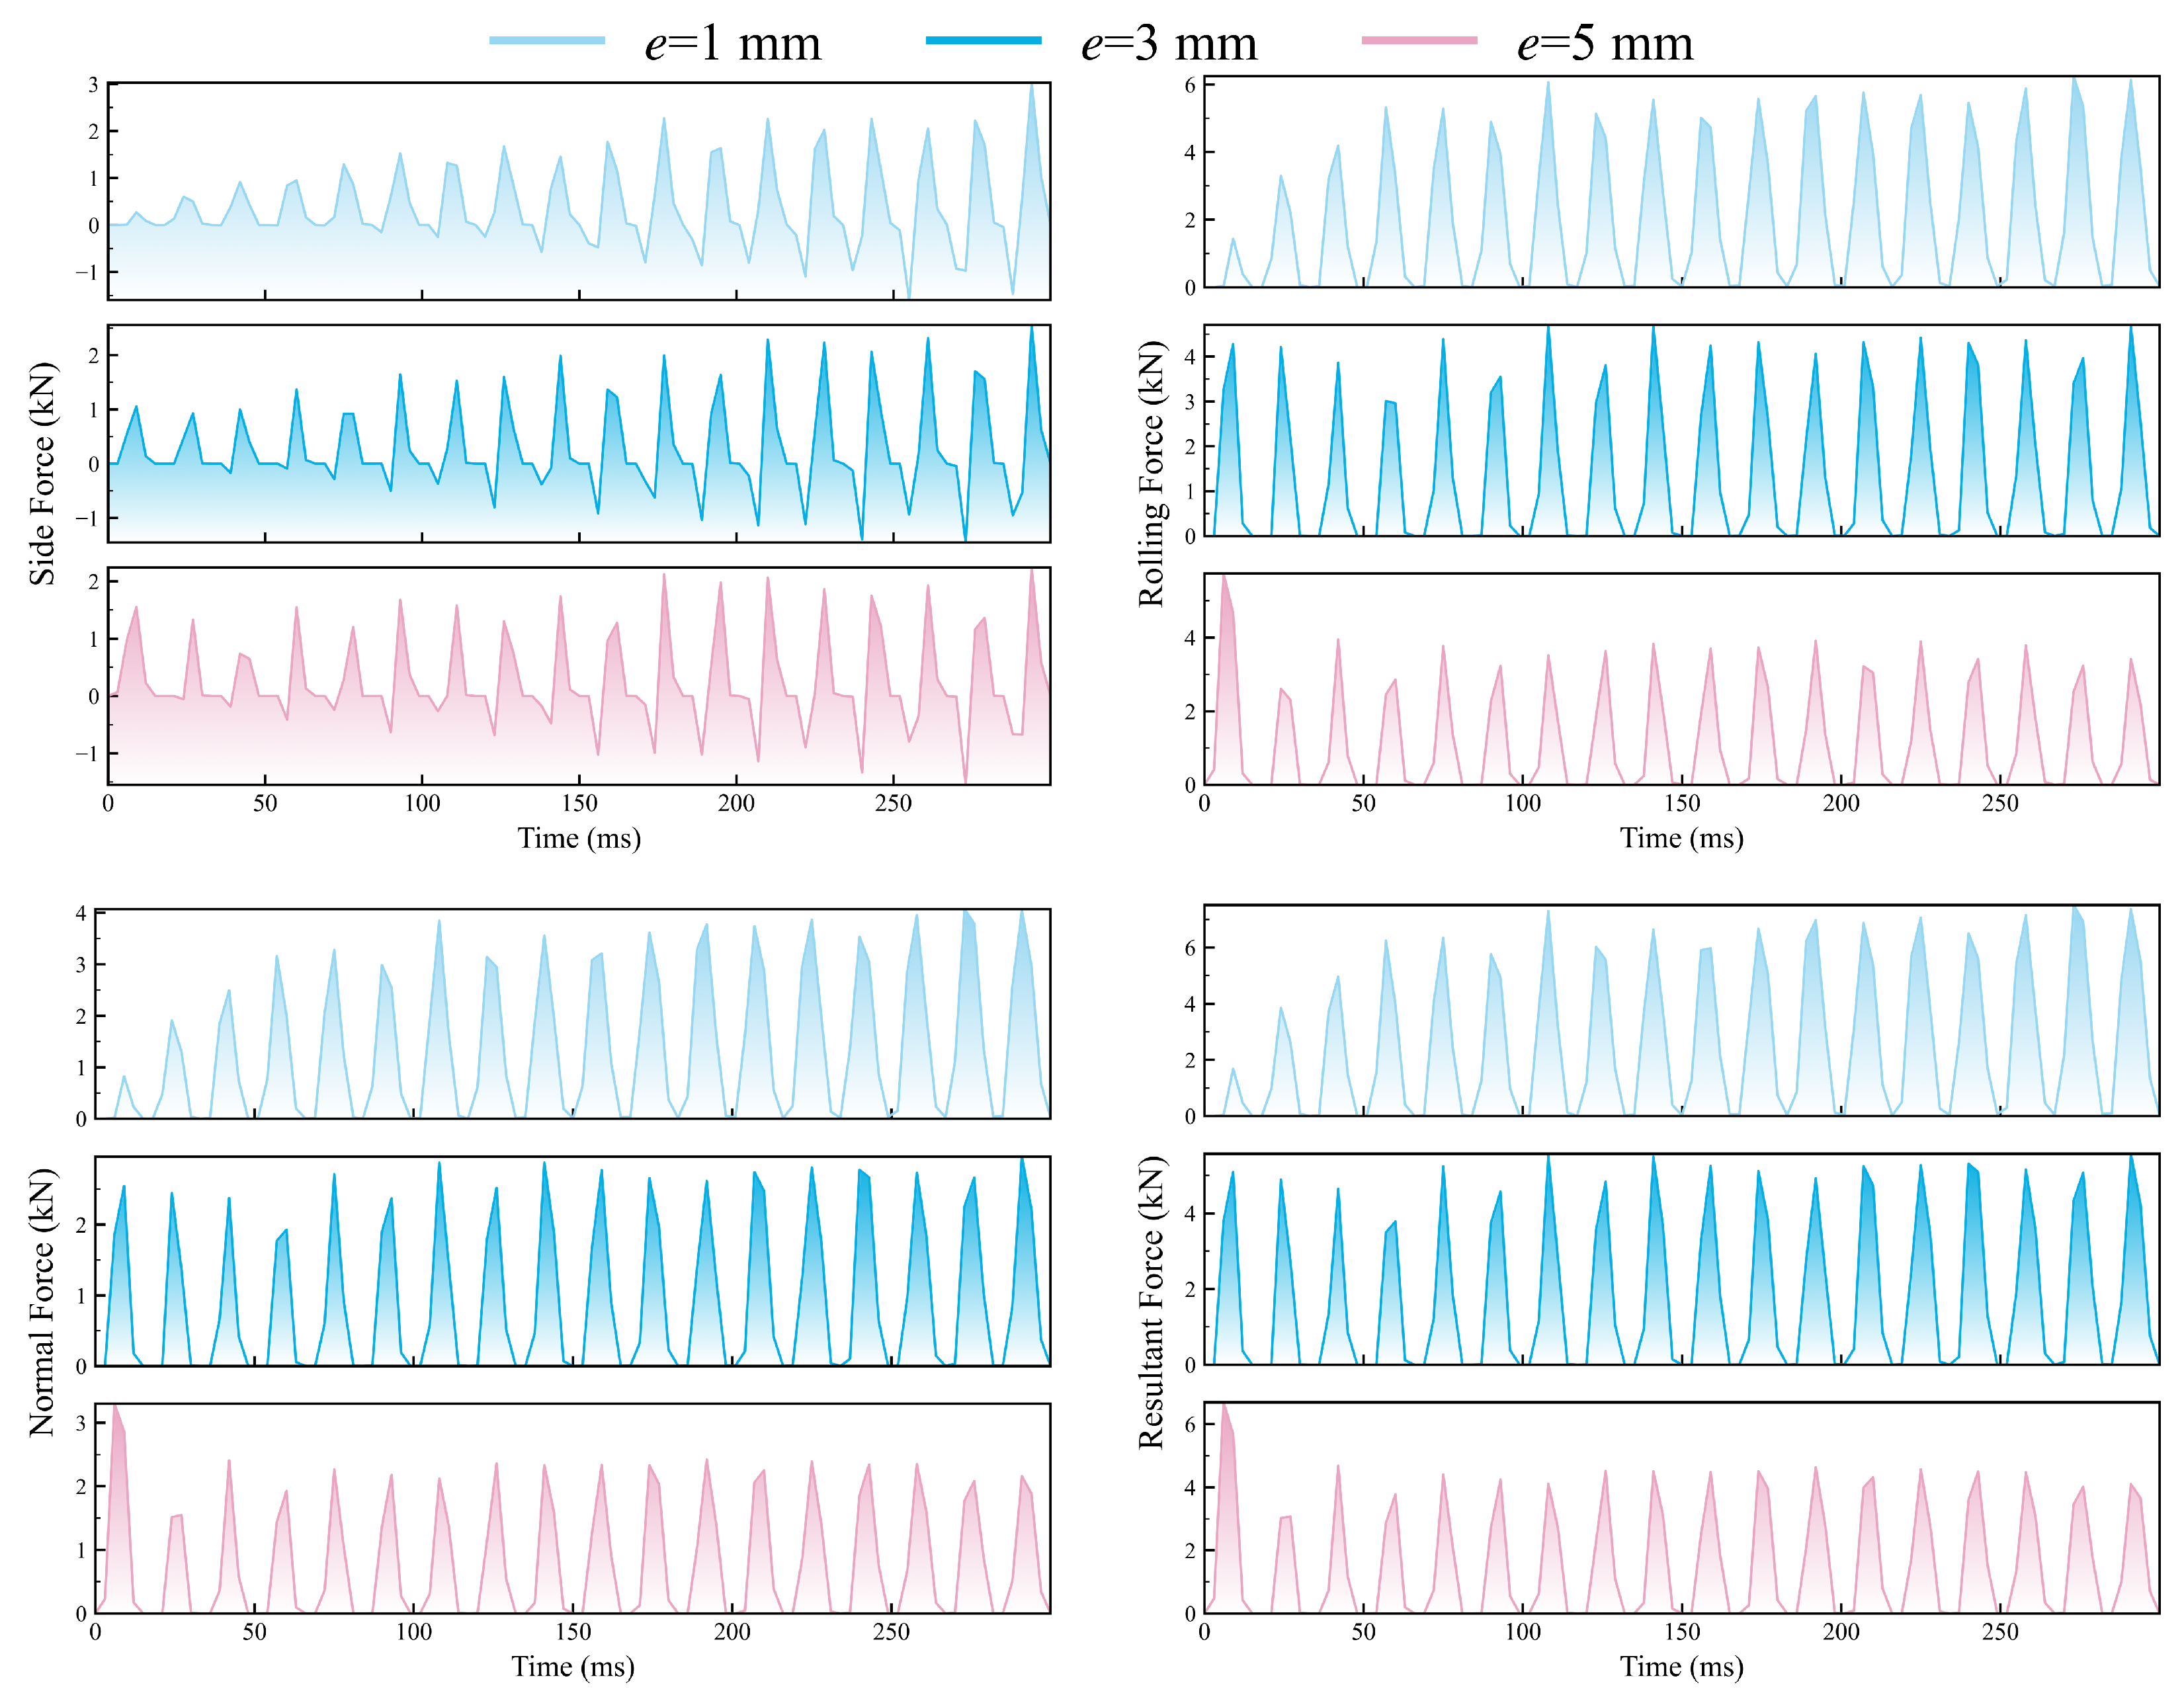
Figure 17 illustrates the triaxial force time histories under varying eccentricities. At
Hz and
mm/s, all force components exhibit distinct periodic oscillations with a cycle of approximately 16.7 ms, which is consistent with the excitation frequency. This periodicity confirms that the eccentric motion successfully introduces alternating “loading–unloading” phases within each cycle, effectively suppressing the continuous accumulation of resistive loads.
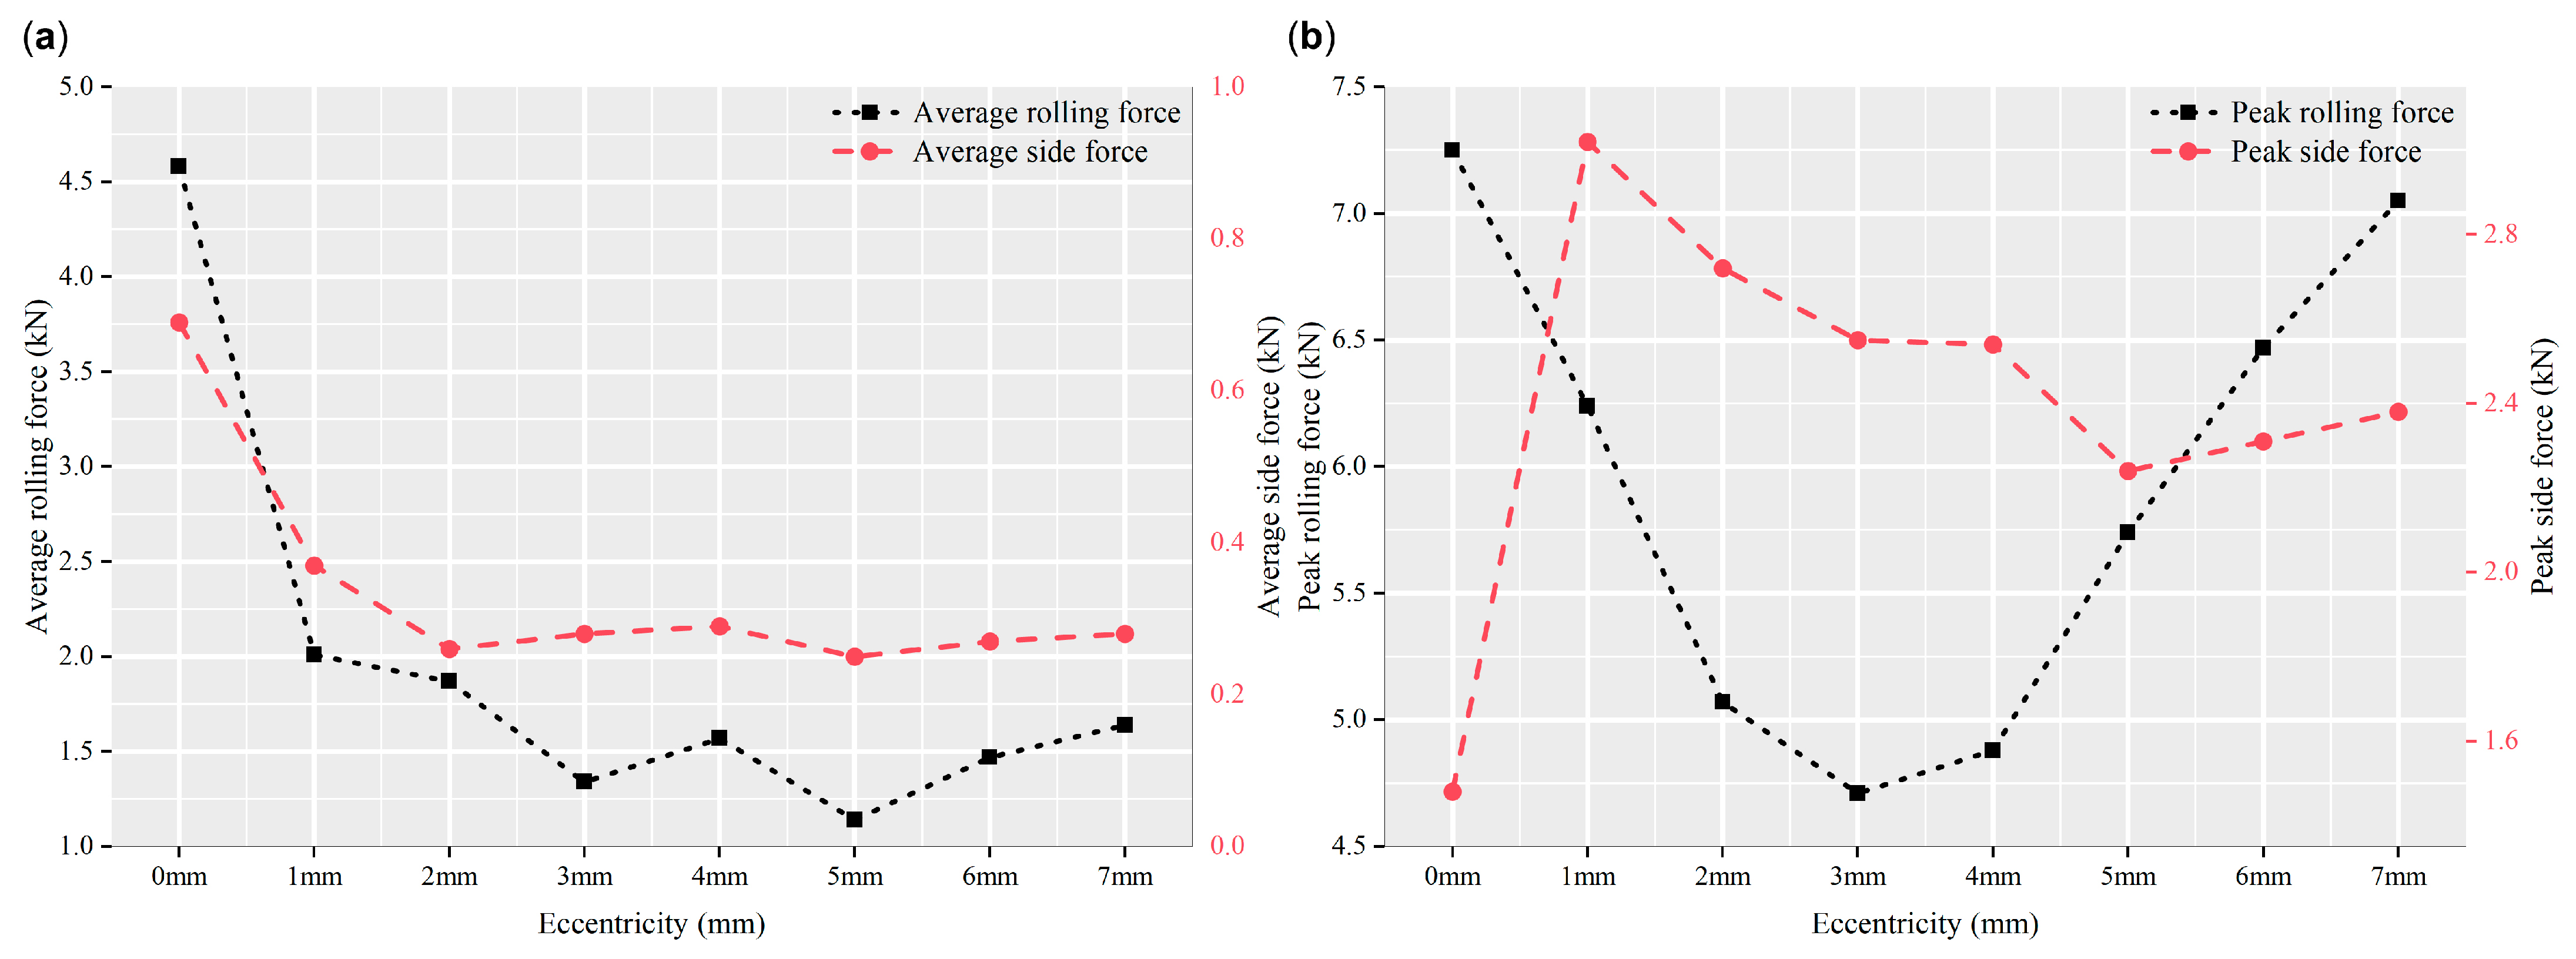
The variation in average loads is summarized in
Figure 18a. The average rolling force exhibits a non-monotonic trend, decreasing significantly from 4.58 kN (
mm) to a minimum of 1.14 kN at
mm, followed by a slight rebound. This indicates that an optimal eccentricity substantially reduces the energy required for continuous penetration. Similarly, the average side force drops sharply from 0.69 kN to 0.37 kN at
mm and stabilizes around 0.3 kN thereafter. For the ODC configuration in this study, the minimum average resultant force is achieved at
mm, representing a 39.53% reduction compared to the non-eccentric baseline.
The peak load characteristics in
Figure 18b reveal a more complex mechanical trade-off. The peak rolling force initially decreases to a minimum of 4.71 kN at
mm but increases sharply as
e expands further. This U-shaped trend highlights two competing mechanisms: for
mm, the benefits of intermittent cutting dominate, leading to a negative correlation between eccentricity and peak load; however, for
mm, the increased tool engagement angle and inertial effects become dominant, resulting in a positive correlation and higher instantaneous loads. In contrast, the peak side force reaches a maximum of 2.72 kN at
mm, suggesting that excessive eccentricity can exacerbate lateral vibrations despite lowering the average load.
The force waveforms in
Figure 17 further elucidate this transition. At
mm, the forces remain quasi-continuous with low amplitudes. At
mm, the smooth periodic oscillations represent an optimal balance between impact intensity and energy reduction. At
mm, the waveforms become sharper and more impulsive, reflecting stronger transient impacts caused by the increased retraction distance and re-engagement velocity. These results demonstrate that while eccentricity enhances fragmentation efficiency by modulating the tool–rock contact arc and shear rate, the selection of
e must be carefully optimized to avoid excessive peak loads.
4.5. Effect of Feed Rate on Cutting Forces
The feed rate (v) is a critical operational parameter that determines the volume of rock removed per unit time and the resulting tool–rock interaction intensity. In this section, the cutting force characteristics are analyzed across a range of feed rates (120 to 180 mm/s) at a constant eccentricity of 3 mm ().
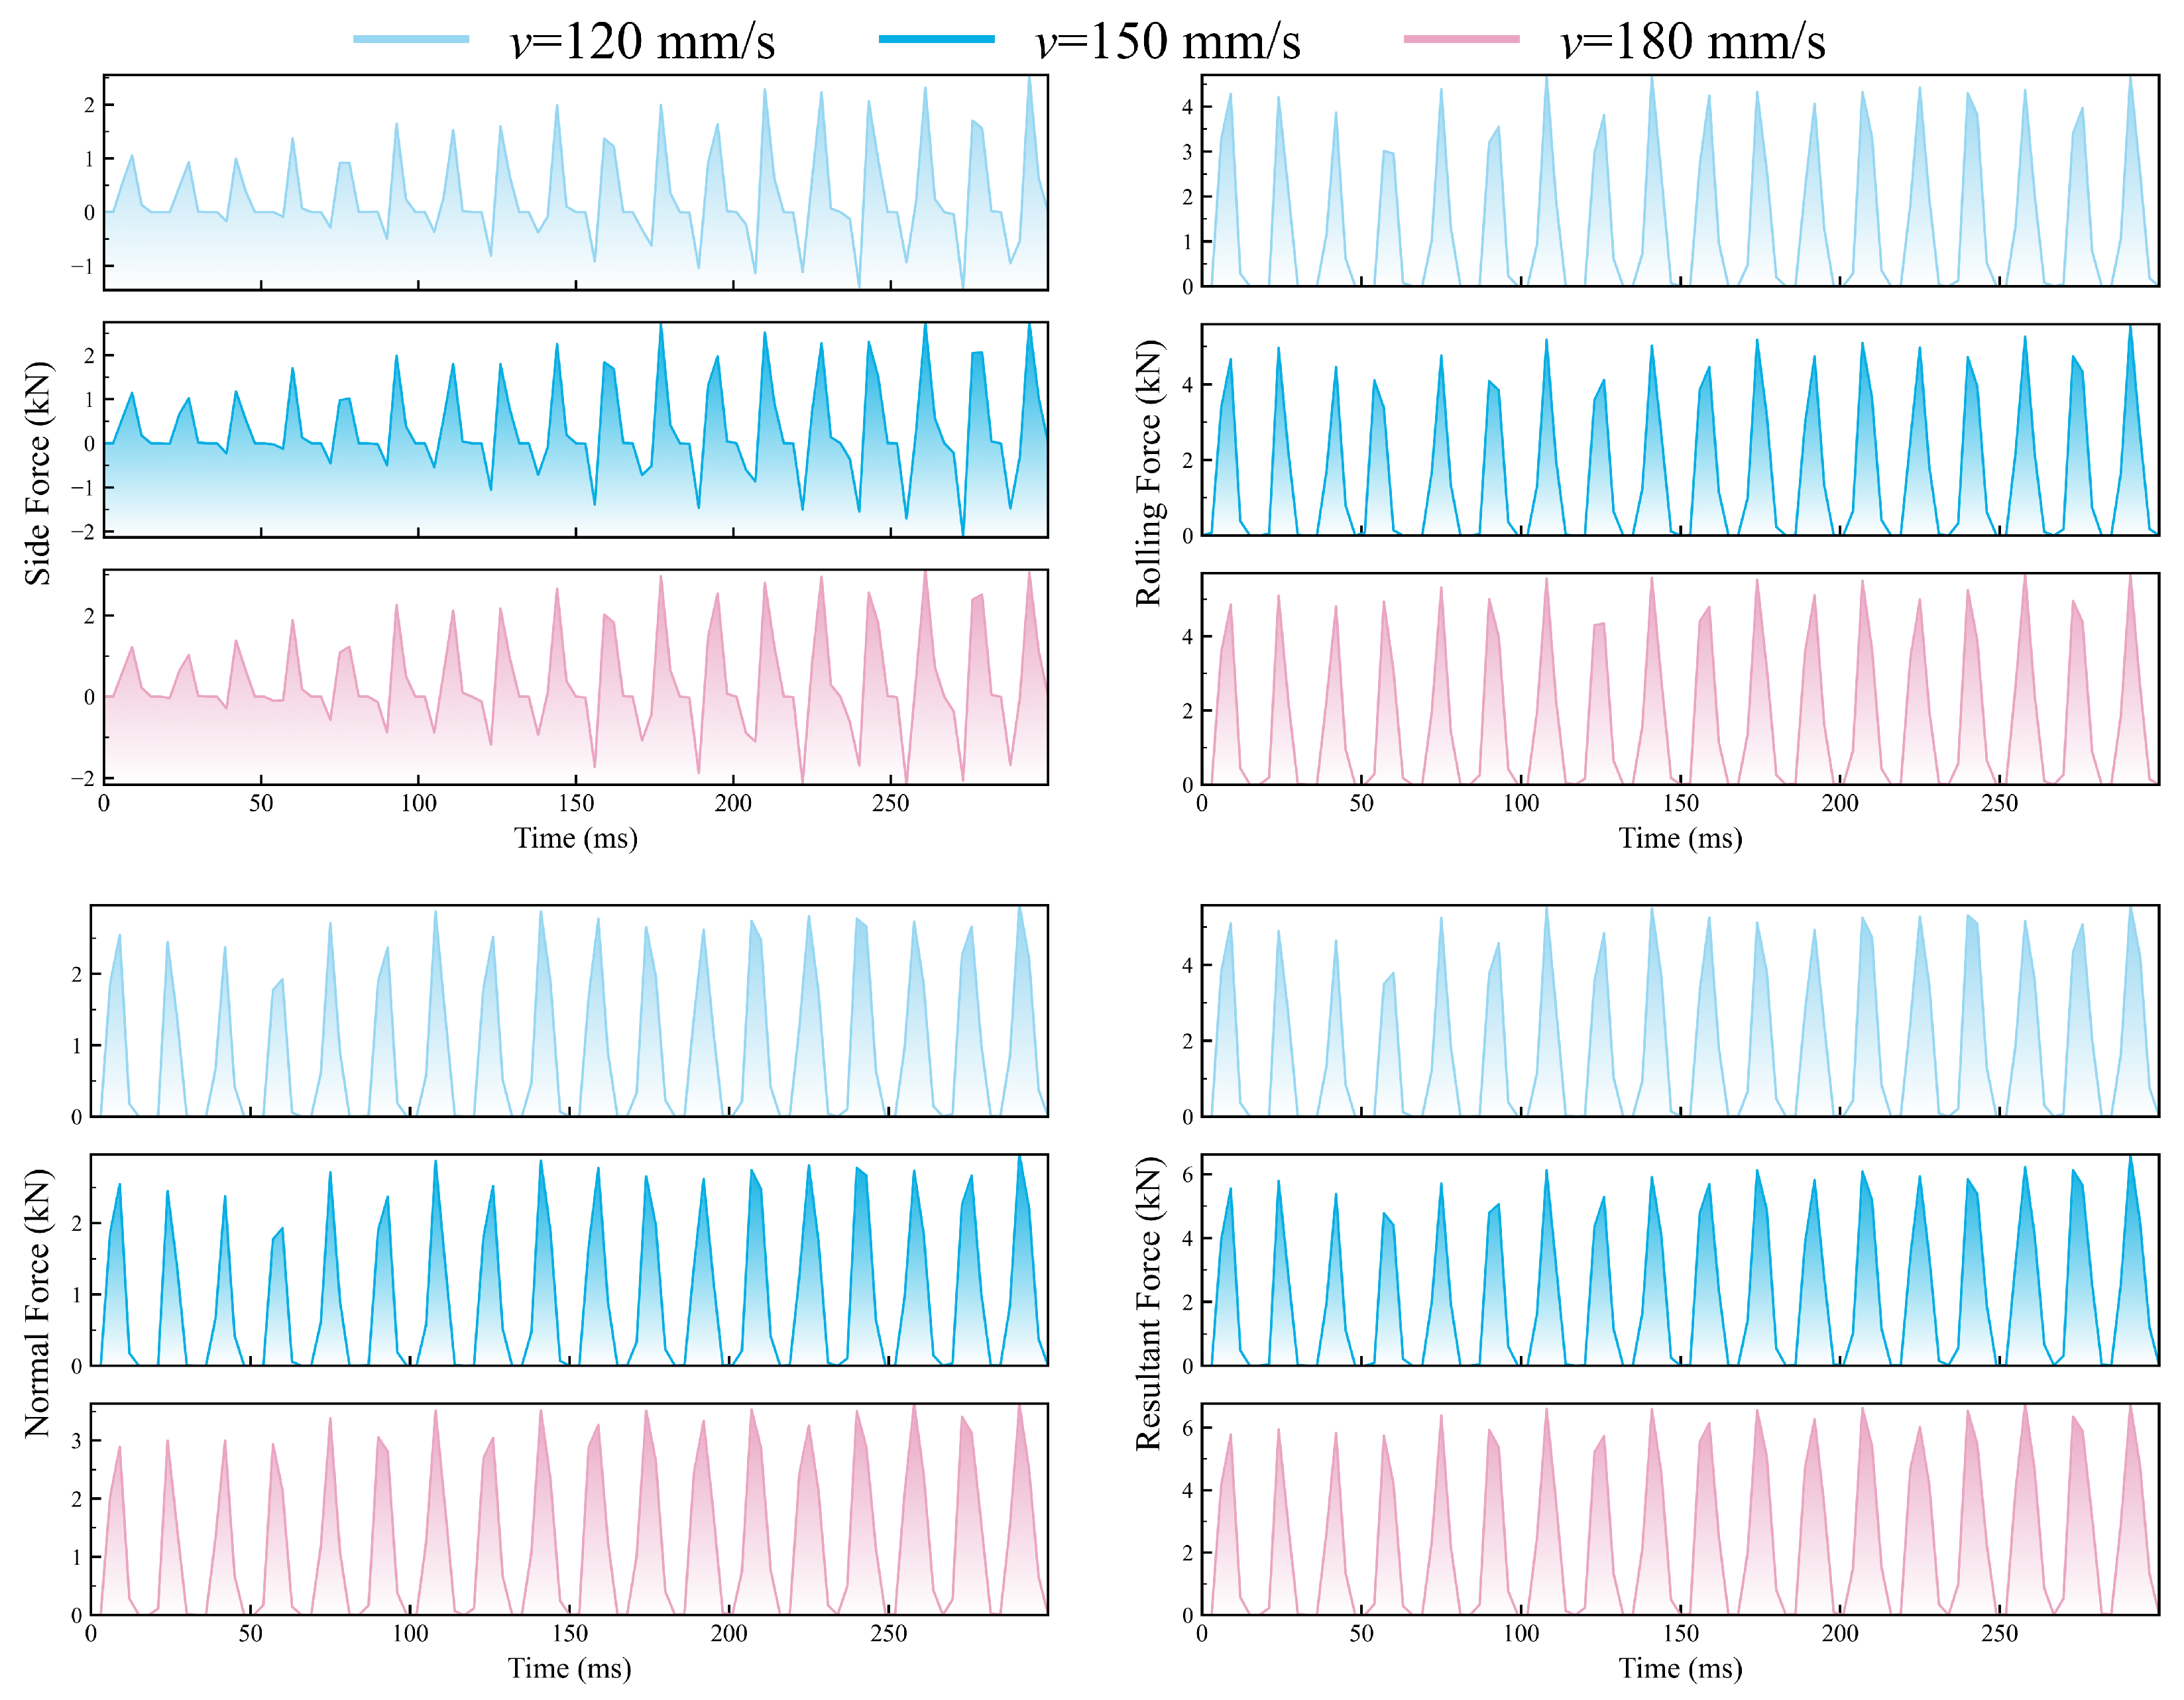
Figure 19 illustrates the force time histories at different feed rates. The amplitude of force fluctuations increases significantly with
v, with the most pronounced oscillations observed at 180 mm/s. This intensification is primarily due to the increased rock volume encountered by the cutter per oscillation cycle, which elevates the impulse required for fragmentation. Furthermore, higher feed rates reduce the time available for stress relaxation in the rock mass, leading to more abrupt force transitions during the loading–unloading phases.
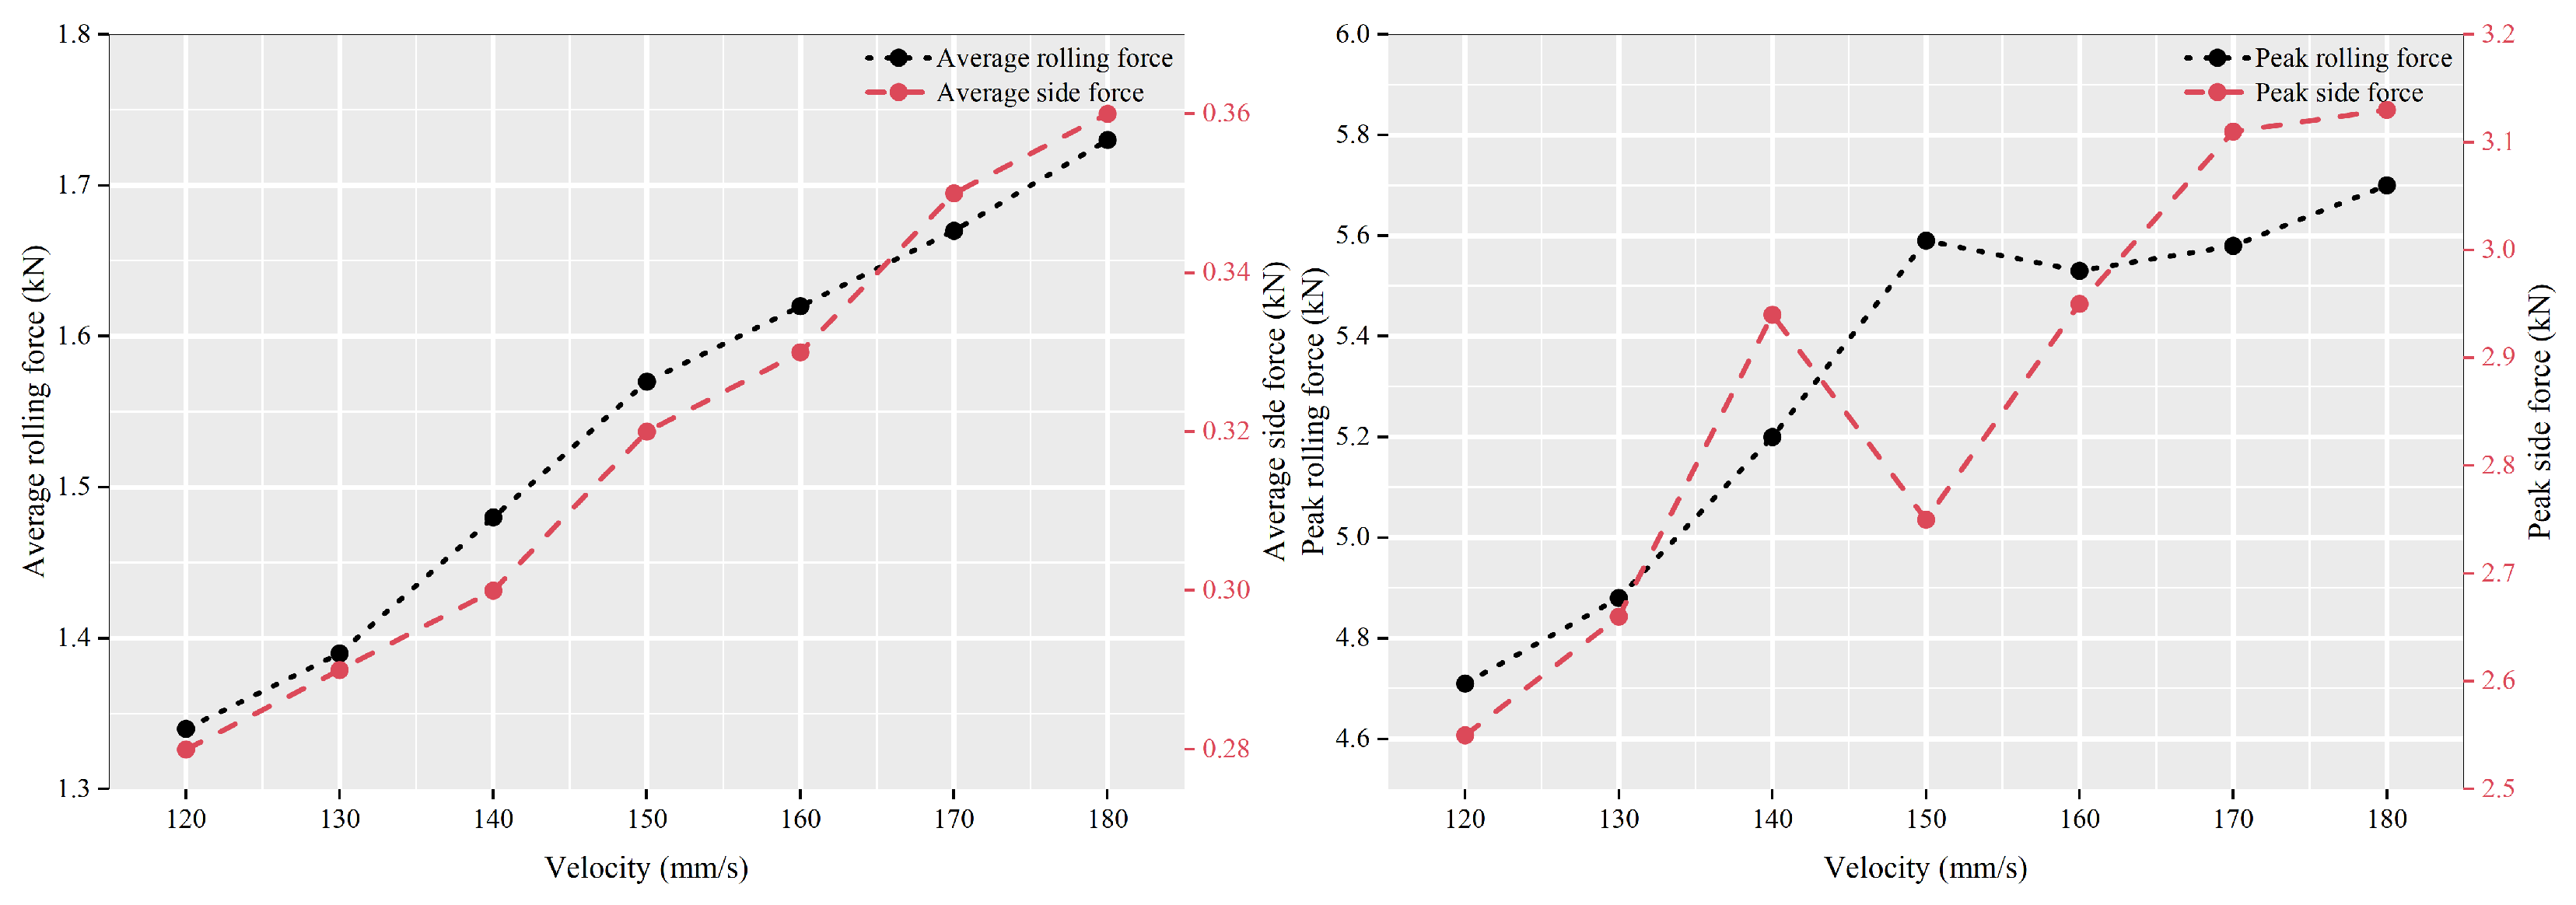
The variation in average and peak forces is summarized in
Figure 20. As shown in the left panel, both average rolling and side forces exhibit a consistent upward trend as the feed rate increases. This is a direct consequence of the increased mechanical work required to process a larger volume of rock within a given timeframe. Quantitatively, when
v increases from 120 mm/s to 180 mm/s, the average rolling force increases by 29.10%, the normal force by 36.67%, and the side force by 28.57%.
Similarly, the right panel of
Figure 20 shows that the peak forces rise with the feed rate. This increase is attributed to the intensified impact energy during the re-engagement phase. At higher feed rates, the cutter enters the rock with a larger instantaneous depth of cut, resulting in higher contact pressure and friction at the tool–rock interface.
While increasing the feed rate improves the area of excavation per unit time, the concomitant rise in peak loads poses risks to tool durability and system stability. High peak forces accelerate wear on the cutter edge and may induce harmful vibrations in the drive system. Therefore, the selection of an optimal feed rate must balance the requirement for high productivity with the mechanical limits of the cutting equipment and the specific fracture toughness of the rock.
4.6. Effect of Oscillation Frequency on Cutting Forces
The oscillation frequency (f) is a key kinetic parameter that governs the periodicity of the tool–rock loading cycles. This section examines the influence of frequency (30 Hz to 60 Hz) on cutting performance at a constant eccentricity of 3 mm.
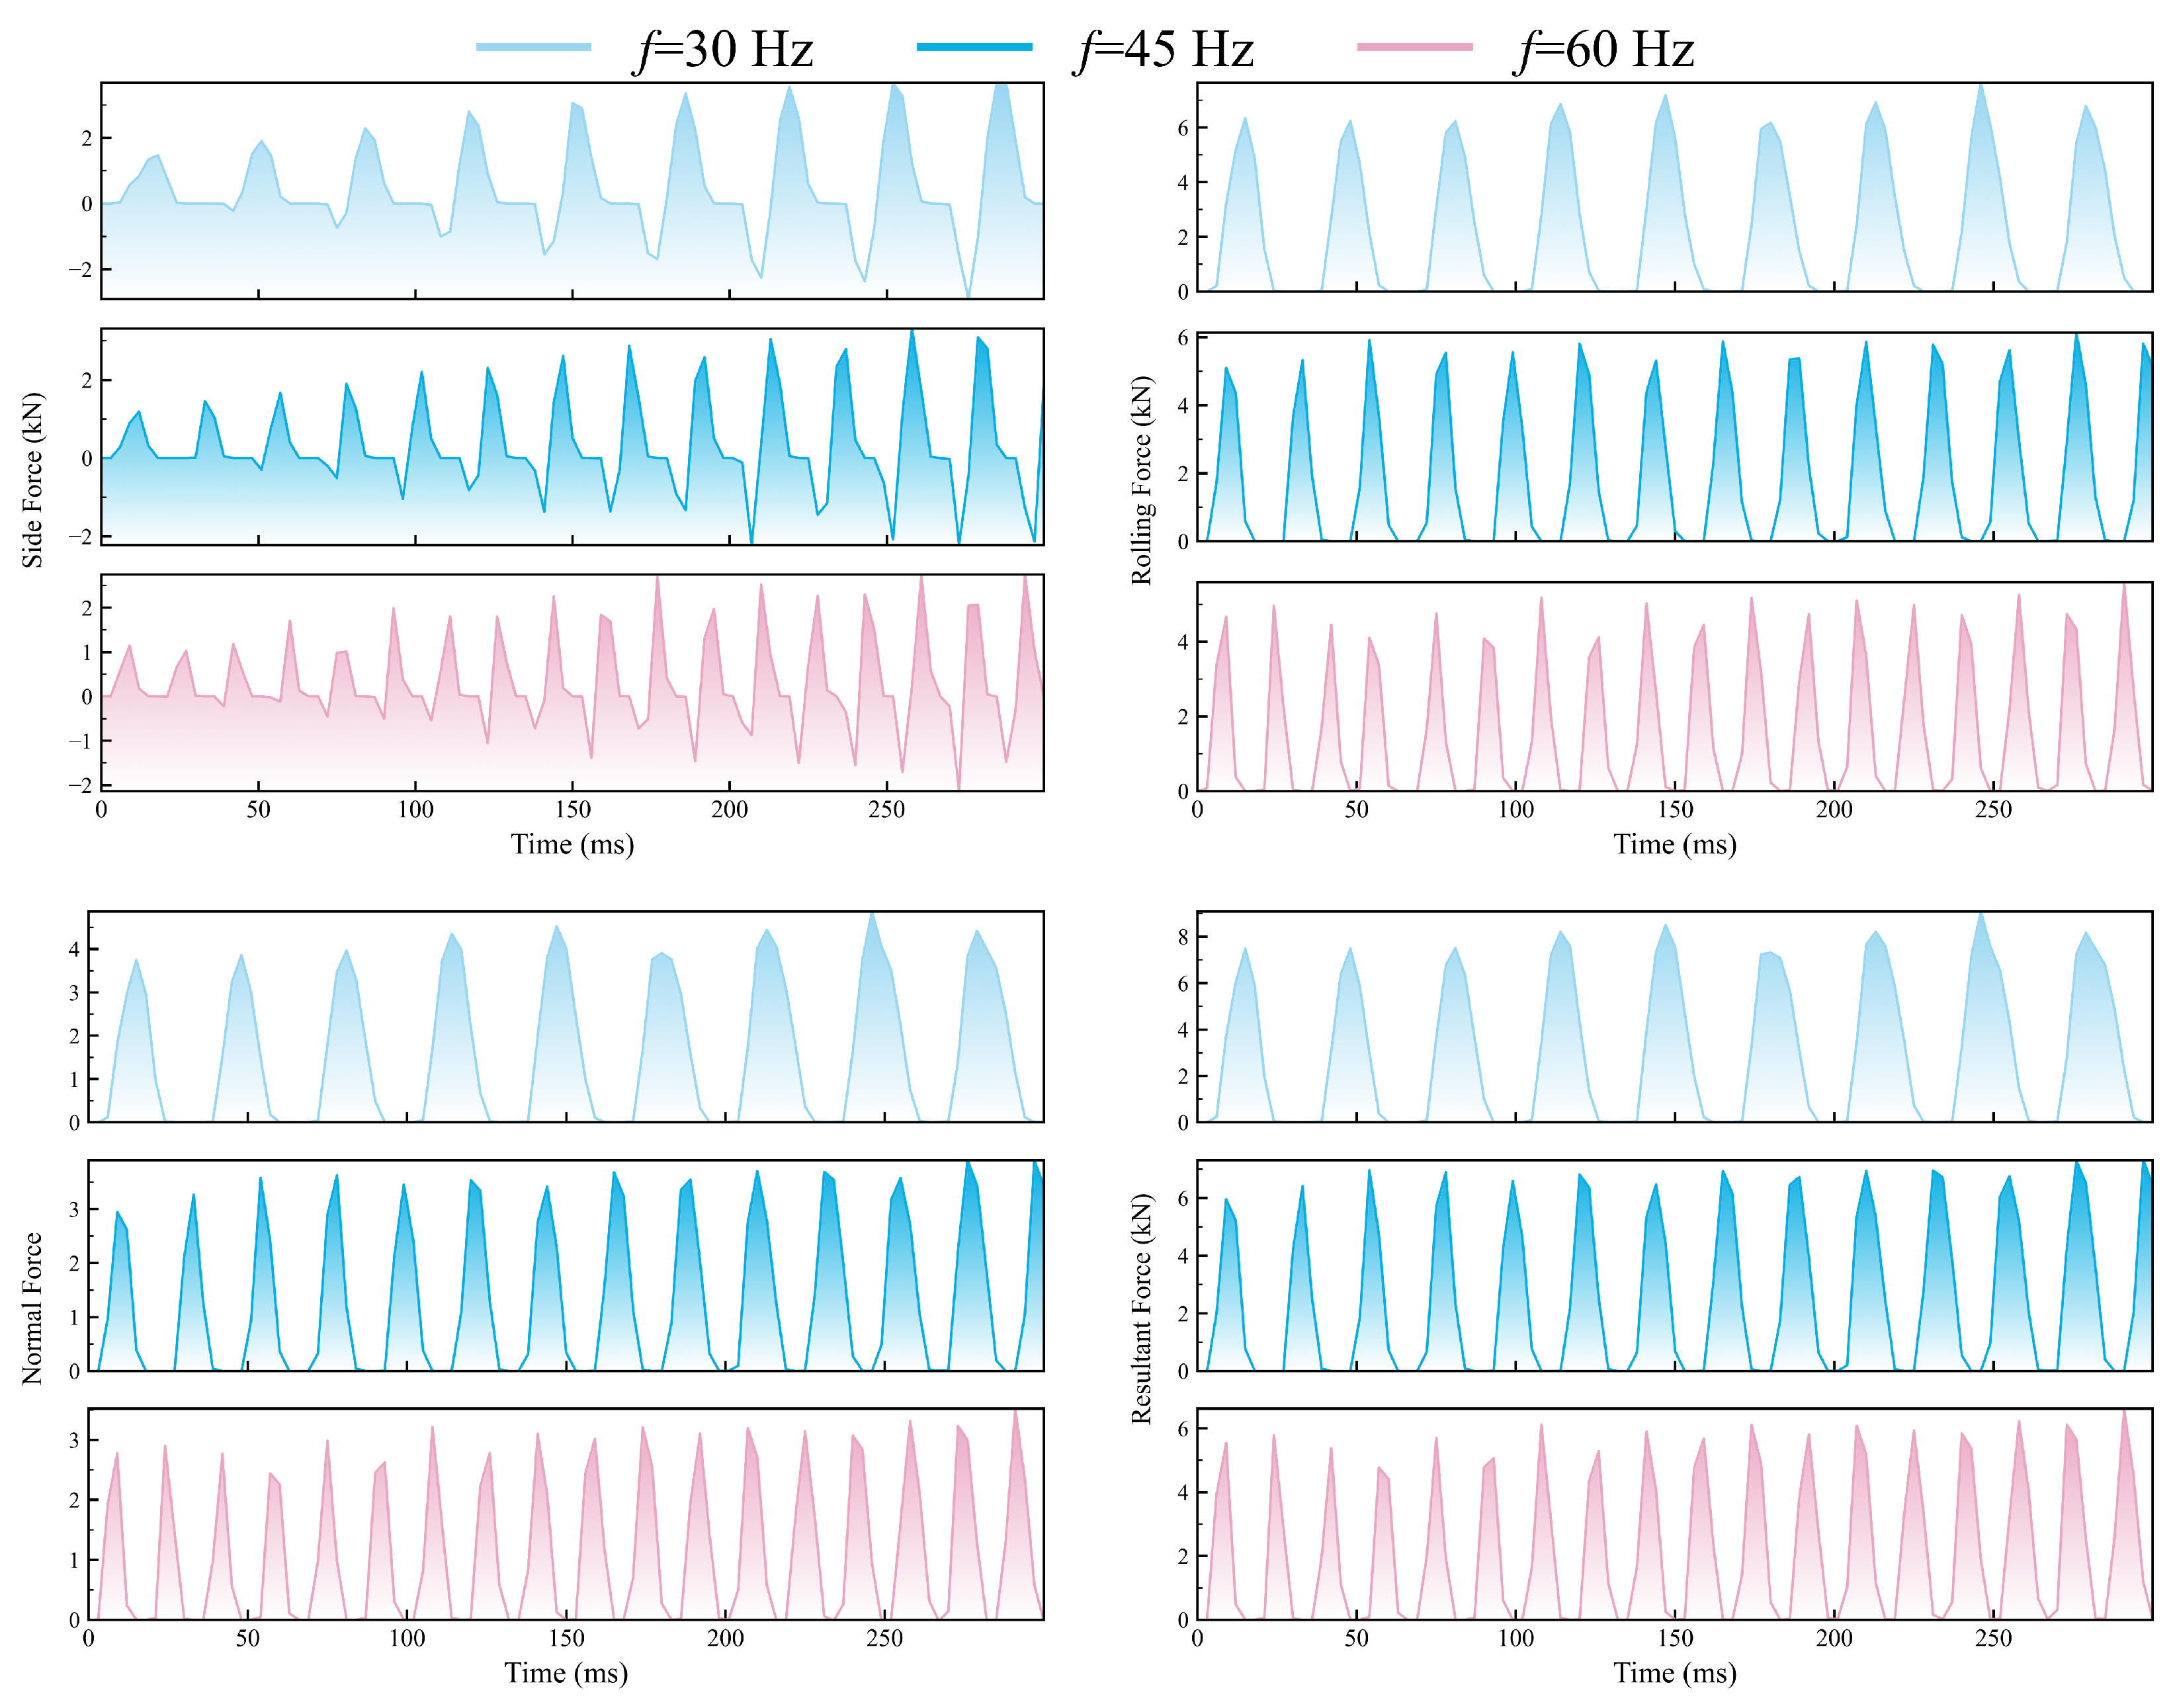
Figure 21 illustrates the time-domain evolution of the force components. The force profiles exhibit a pulsating periodicity synchronized with the oscillation cycle, confirming the intermittent contact mechanism. As the frequency increases, the density of force peaks rises, while the “valleys” between pulses consistently drop to near-zero, indicating effective tool–rock separation. Notably, the peak amplitudes at 60 Hz are visibly lower than those at 30 Hz, suggesting that higher frequencies effectively attenuate the instantaneous impact intensity by reducing the depth of engagement per individual oscillation cycle.
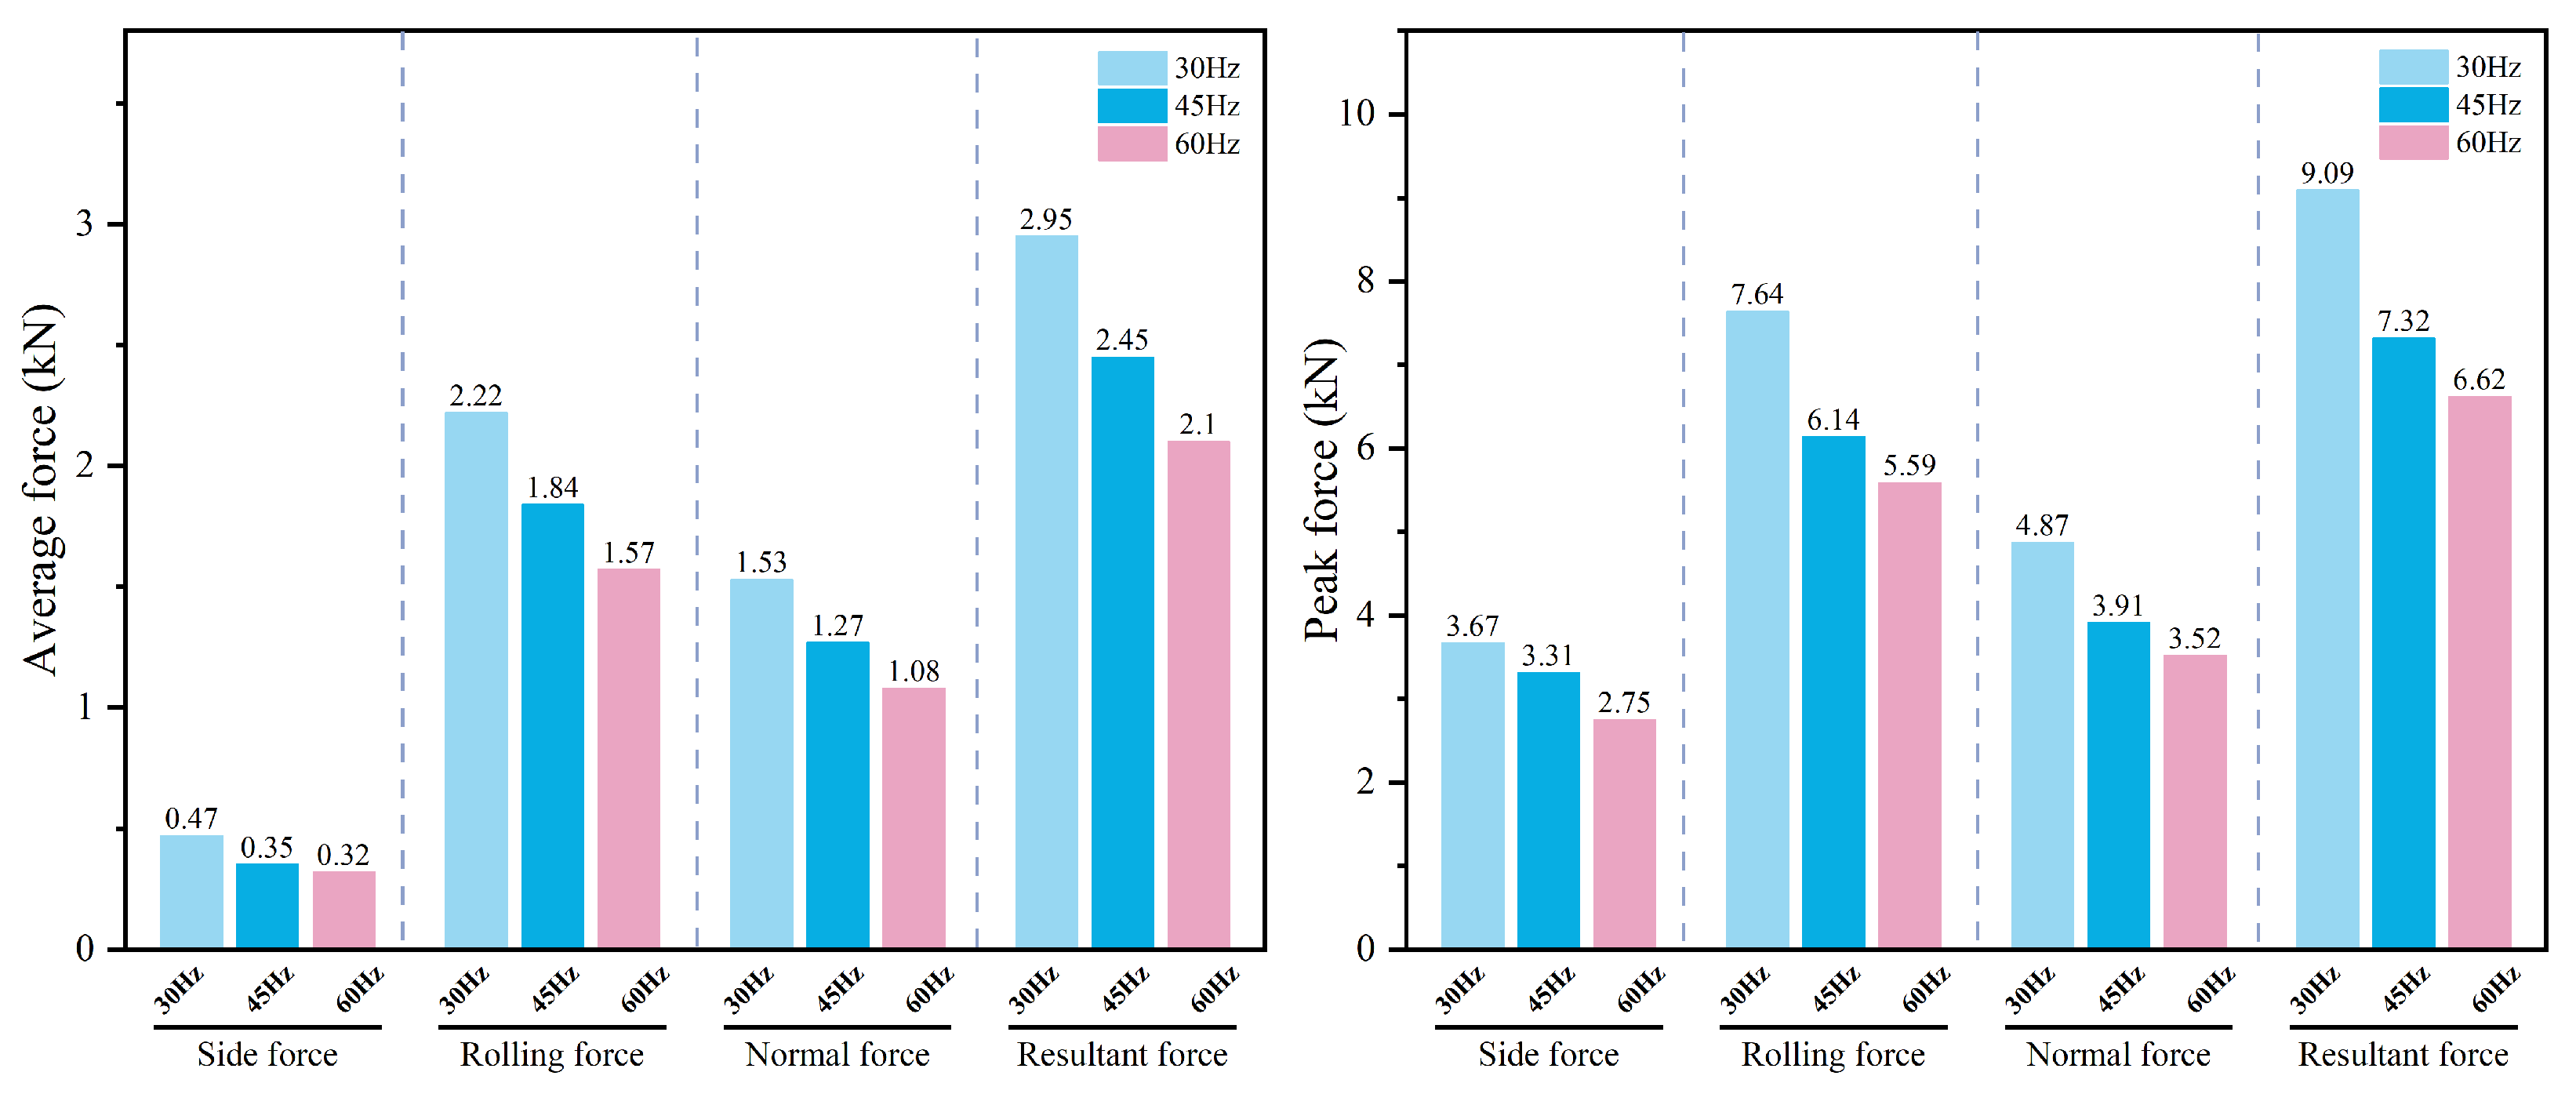
As shown in
Figure 22, both average and peak forces exhibit a consistent monotonic decrease as
f increases from 30 Hz to 60 Hz. Quantitatively, the average rolling force decreases by 29.3% (from 2.22 kN to 1.57 kN), and the average normal force drops by 29.4% (from 1.53 kN to 1.08 kN). This leads to a substantial reduction in the average resultant force from 2.95 kN to 2.10 kN. The peak loads (Right Panel) show an even more pronounced reduction in absolute magnitude; for instance, the peak resultant force drops sharply from 9.09 kN to 6.62 kN, representing a total decrease of 2.47 kN. This trend indicates that high-frequency oscillation effectively “smooths out” force fluctuations, shifting the process toward a more stable cutting regime.
The observed reduction in cutting forces is attributed to two primary mechanisms. First, the shortened contact duration in each high-frequency cycle prevents the cumulative buildup of quasi-static resistance. Second, the increased frequency enhances vibration-assisted fracturing. The rapid repetitive loading accelerates damage accumulation and promotes micro-crack propagation, thereby lowering the energy threshold required for chip formation. Consequently, optimizing the oscillation frequency serves as an effective strategy to minimize mechanical load and extend tool life.
4.7. Specific Energy Consumption
Specific Energy (
) serves as a primary metric for evaluating rock-cutting efficiency. According to Equation (
11), it is calculated based on the triaxial cutting forces and the volume of rock removed during the process.
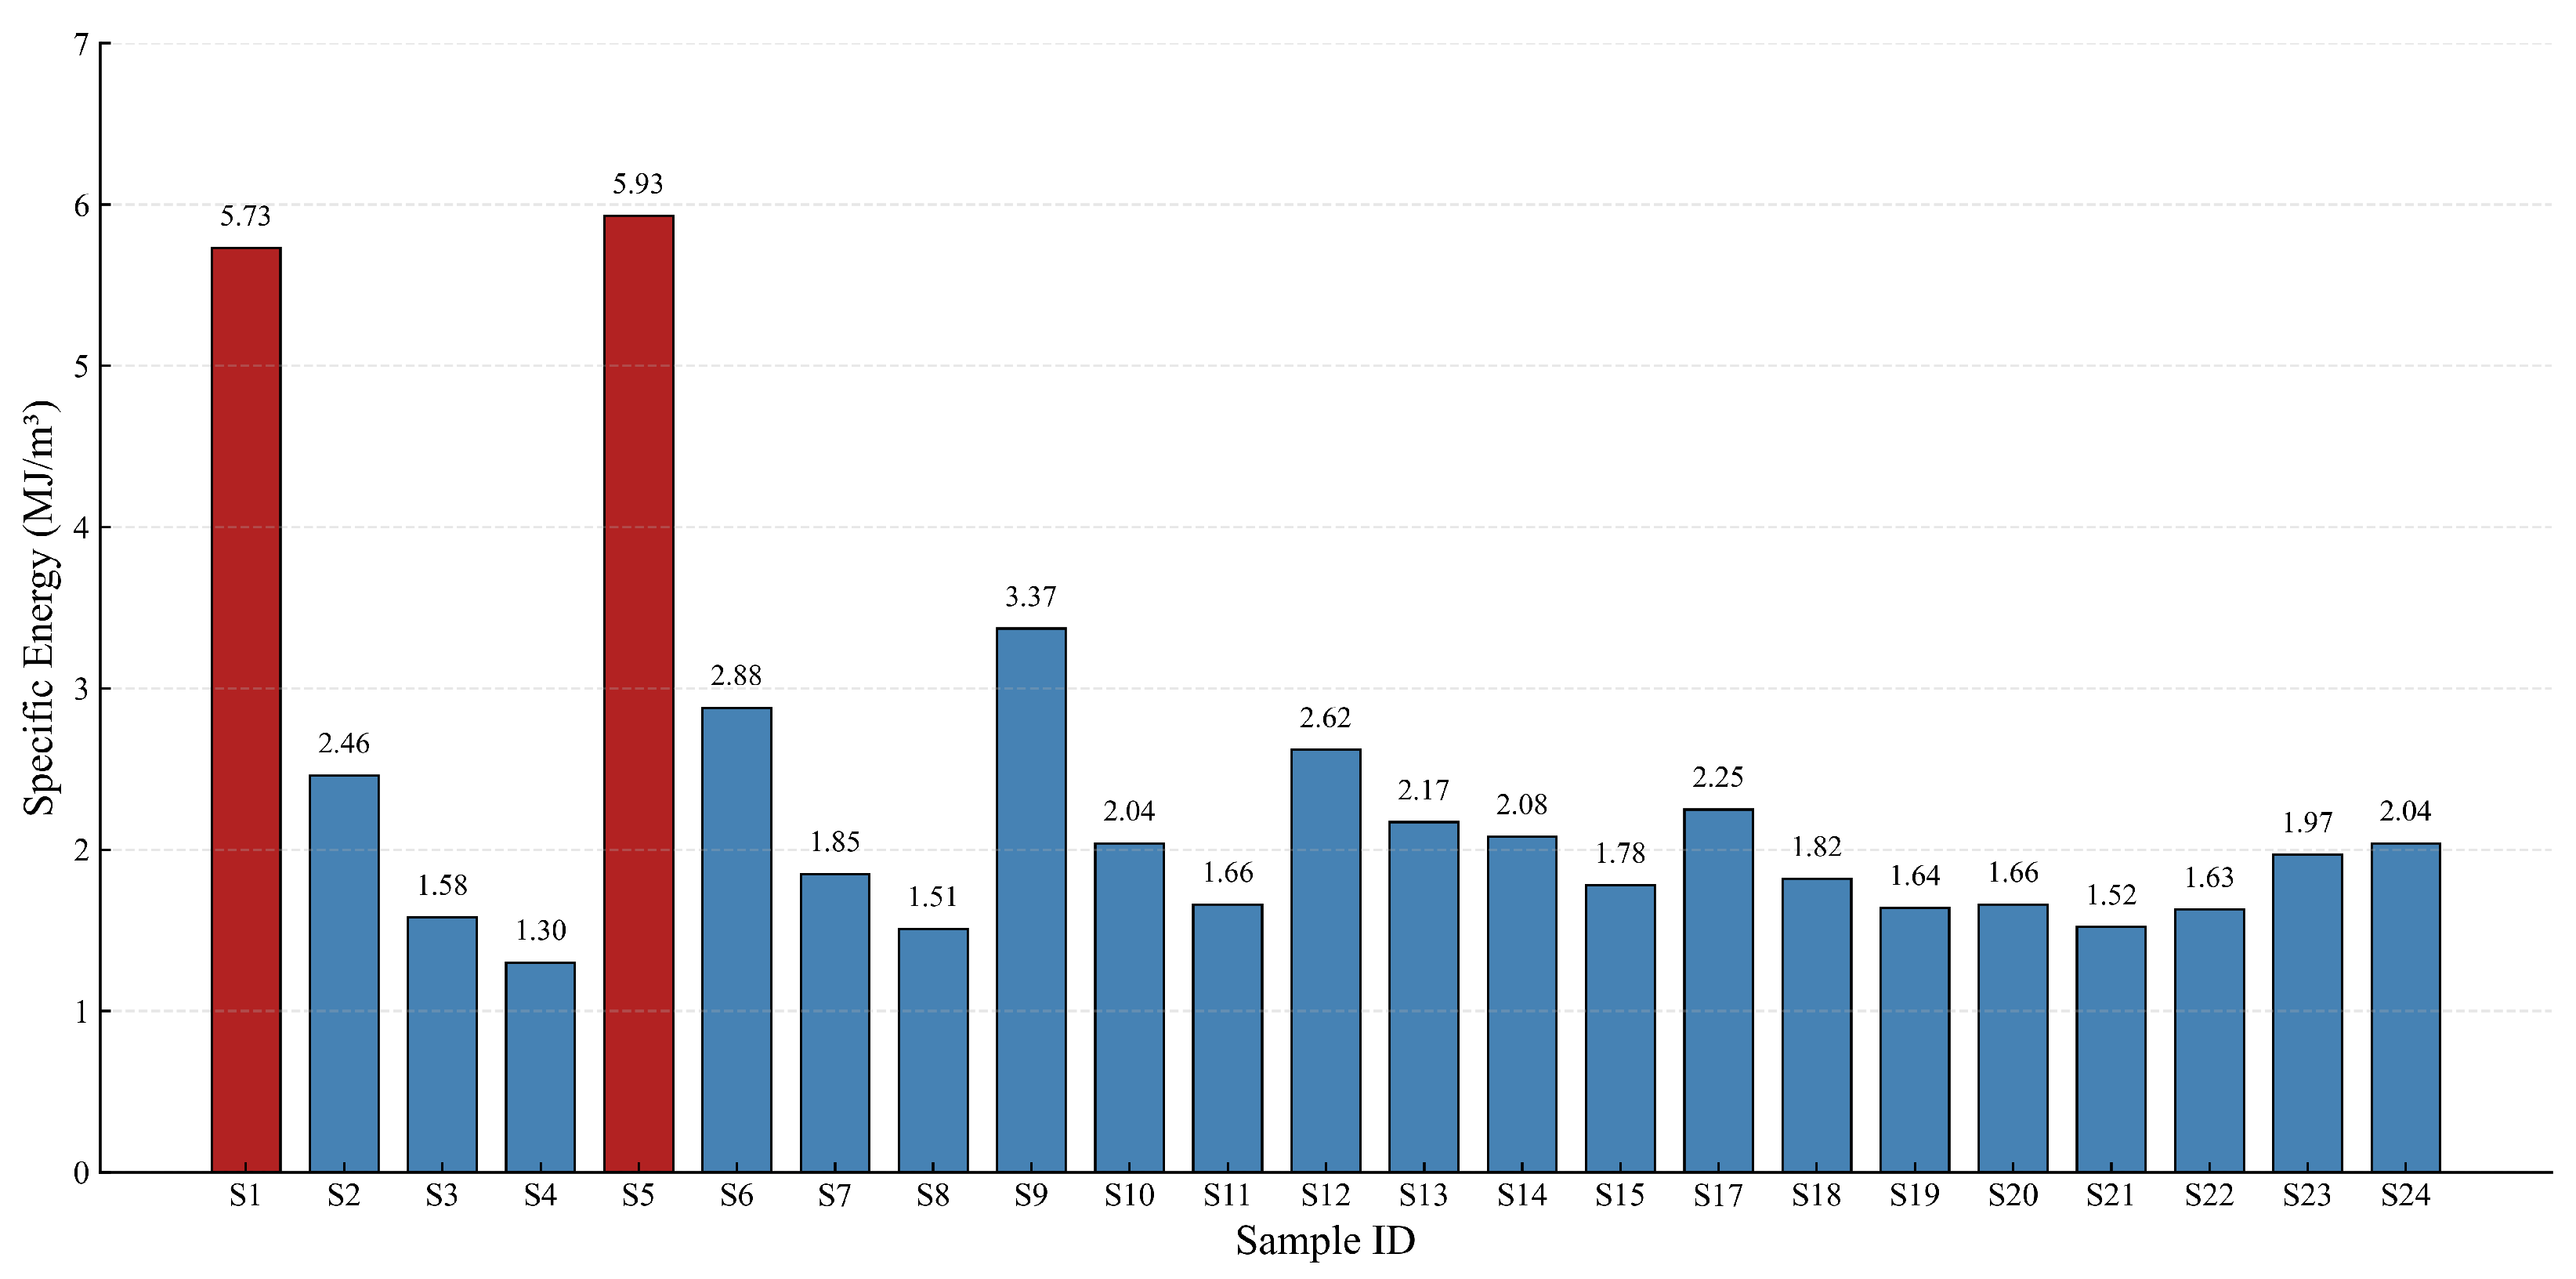
Figure 23 presents the
values across various simulation conditions, illustrating the coupled effects of eccentricity (
e), feed rate (
v), and oscillation frequency (
f).
The results demonstrate that the introduction of an eccentric cutter significantly improves cutting efficiency compared to conventional steady cutting. The baseline samples representing the non-eccentric disc ( mm), S1 and S5, exhibited the highest values, peaking at 5.73 and 5.93 , respectively. In contrast, the for eccentric cutting conditions ( mm) was concentrated in a significantly lower range, primarily between 1.30 and 3.37 . The minimum of 1.30 was achieved by Sample S4 ( mm, mm/s, Hz), representing an energy reduction of approximately 78.08% compared to the maximum non-eccentric consumption (S5).
Parametric analysis confirms that the specific energy consumption is strongly dependent on the cutter’s dynamic parameters, with eccentricity being the dominant factor. For eccentric conditions ( mm), generally decreases as e increases. This trend suggests that larger eccentric displacements enhance the periodic impact, which facilitates rock failure and minimizes the resistive cutting work. The most efficient performance was consistently observed at higher eccentricity settings (e.g., S4, S23, and S22).
The relationship between feed rate (v) and is observed to be non-linear. Optimal efficiency occurs within the low-to-moderate range of 120–140 mm/s. However, a significant efficiency penalty is incurred when the feed rate exceeds 150 mm/s, suggesting that excessively high feed rates diminish the effectiveness of the vibration-assisted mechanism and cause the process to revert toward inefficient continuous crushing. Finally, the oscillation frequency (f) also played a critical role; higher frequencies of 45 Hz and 60 Hz consistently yielded lower values than the 30 Hz configuration. This highlights the necessity of maintaining a sufficiently high oscillation rate to ensure frequent energy transfer and efficient crack propagation within the rock medium. Due to the high computational overhead inherent to SPH–FEM simulations, exploring a global mathematical optimum via continuous evolutionary algorithms was practically prohibitive. Instead, a systematic grid search was implemented across the physically viable parametric space. The identified optimal combination (, corresponding to the operational parameters of Sample S4) represents a highly robust localized optimum that satisfies the dual constraints of physical cutting efficiency and numerical convergence stability.
5. Discussion
The numerical model presented in this study provides a baseline for understanding rock fragmentation under oscillatory cutting. However, it is necessary to consider the impact of its underlying assumptions. Treating the cutter as a rigid body and the rock mass as a homogeneous medium allows us to isolate the governing physical mechanisms, yet these simplifications deviate from field conditions where progressive tool wear and geological discontinuities, such as joints and bedding planes, dominate the cutting process. Without accounting for these factors, numerical models tend to underestimate the cutting resistance and miscalculate the fracture propagation paths, often leading to overly optimistic predictions of energy efficiency and tool life. These discrepancies are particularly pronounced in fractured rock masses, where localized stress concentrations at joints can significantly alter the mechanical response compared to a homogeneous continuum.
To further position the performance of the ODC, its mechanical behavior should be compared with other advanced rock-cutting technologies reported in the literature. Technologies such as undercutting disc cutters actively exploit the low tensile strength of rock but often struggle in deep geological strata where high confining pressures dominate. In contrast, the ODC leverages high-frequency oscillation to directly break up the highly compacted zone ahead of the cutter tip under confinement. Compared to oscillating picks, which suffer from severe localized tip wear and asymmetric loading, the ODC retains the structural advantage of a rotatable disc, allowing continuous friction to be uniformly distributed along the entire cutter circumference. Furthermore, compared to hybrid cutting systems (such as laser- or water-jet-assisted mechanical cutting), although these auxiliary technologies can effectively reduce the required mechanical cutting forces, the substantial energy consumption inherent to operating the auxiliary systems themselves cannot be neglected. Consequently, the ODC presents a purely mechanical, robust, and significantly more energy-efficient solution for scaling up to heavy-duty TBM and roadheader applications.
Beyond numerical simplifications, the industrial adoption of ODC technology faces critical engineering challenges. First, high-frequency eccentric excitation inevitably generates severe dynamic counter-forces. Robust shock-absorption systems are essential to isolate these vibrations, protecting the TBM cutterhead and main bearings from fatigue failure. Second, although the oscillation mechanism increases auxiliary power, this energy penalty is substantially offset by the drastic reduction in primary TBM thrust and torque, yielding a net energy saving per excavated volume. Lastly, continuous operation up to 60 Hz poses severe cyclic fatigue risks to cutter shafts and bearing raceways. Mitigating these risks requires utilizing fatigue-resistant alloys with surface hardening, optimizing component geometries to minimize stress concentrations, and adopting modular designs for rapid in-situ replacement.
To address these limitations, parallel research tracks are underway. First, a Vision-to-Physics (V2P) framework utilizes real tunnel images to reconstruct heterogeneous SPH rock models with realistic joint networks, capturing stochastic in-situ fracturing. Second, a machine vision-based trajectory planning and motion control system enables real-time ODC parameter optimization under varying geological conditions. Regarding scale effects, direct extrapolation of force reduction from a single-cutter laboratory scale to full-scale TBM operations introduces complexities such as multi-cutter stress interference and macro-structural rock mass joint spacing. While the fundamental impulse-unloading mechanism remains valid at larger scales, the precise percentage of energy savings may fluctuate depending on the cutter arrangement and confining pressures encountered on an actual cutterhead. These advancements provide a robust mechanical framework guiding next-generation TBM and roadheader development. Future work will focus on validating the integrated SPH-FEM model and control algorithms against full-scale in-situ cutting experiments to ensure precise calibration against complex rock mass behavior and scale-dependent phenomena.
6. Conclusions
In this study, the kinematic characteristics and rock-cutting performance of the oscillating disc cutter (ODC) were comprehensively analyzed using an integrated SPH–FEM numerical framework and experimental validation. The main conclusions are summarized as follows:
A high-fidelity SPH–FEM coupled model was established to simulate the dynamic rock-breaking process of the ODC. The model’s reliability was rigorously validated through a dual-track approach, demonstrating quantitative consistency with both analytical solutions (average error of 8.89%) and LCM experimental data (relative error within 15.14%), confirming the framework’s capacity to accurately capture complex fragmentation mechanisms and force fluctuations.
Compared to conventional disc cutters, the ODC significantly attenuates cutting resistance across all spatial dimensions, with average rolling, side, and normal forces reduced by approximately 70.9%, 59.4%, and 67.9%, respectively. This dramatic reduction is a direct consequence of the intermittent “loading–unloading” cycles introduced by the eccentric motion, which prevents the continuous accumulation of resistive loads and enhances excavation efficiency.
Parametric analysis reveals that increasing eccentricity (1 mm to 5 mm) and oscillation frequency (30 Hz to 60 Hz) further reduces the average cutting force by 39.53% and 28.81%, respectively. By optimizing for minimum specific energy, an optimal combination () was identified, achieving a peak energy reduction of 78.08% compared to conventional non-eccentric methods. This provides a definitive theoretical basis for the structural design and operational optimization of ODC systems.
Author Contributions
Conceptualization, B.Y.; methodology, Y.Z.; software, Y.Z.; validation, H.L.; formal analysis, H.L.; investigation, Z.L.; resources, Z.F.; data curation, Z.L.; writing—original draft preparation, Y.Z.; writing—review and editing, B.Y. and Y.Z.; visualization, Z.F.; supervision, B.Y.; funding acquisition, B.Y. All authors have read and agreed to the published version of the manuscript.
Funding
This research was funded by the Taiyuan University of Science and Technology Scientific Research Initial Funding (Grant No. 20252092) and the Datong City Science and Technology Achievement Transformation Project (Grant No. 2025055). The APC was funded by the Taiyuan University of Science and Technology.
Institutional Review Board Statement
Not applicable.
Informed Consent Statement
Not applicable.
Data Availability Statement
The data presented in this study are available on request from the corresponding author.
Acknowledgments
The authors would like to thank the College of Mechanical Engineering at Taiyuan University of Science and Technology for providing the computational resources and research environment.
Conflicts of Interest
Author Zhibin Li and Zhipeng Fang employed by Weishi Heavy Industry Co., Ltd. The remaining authors declare that the research was conducted in the absence of any commercial or financial relationships that could be construed as a potential conflict of interest. The funders had no role in the design of the study; in the collection, analyses, or interpretation of data; in the writing of the manuscript; or in the decision to publish the results.
Abbreviations
The following abbreviations are used in this manuscript:
| ADC | Actuated Disc Cutter |
| FEM | Finite Element Method |
| JHC | Johnson–Holmquist–Cook |
| LCM | Linear Cutting Machine |
| ODC | Oscillating Disc Cutter |
| RHT | Riedel–Hierholzer–Thoma |
| SPH | Smoothed Particle Hydrodynamics |
| TBM | Tunnel Boring Machine |
References
- Ahmadi, M.; Erfan, M.; Torkamany, M.; Safian, G. The effect of interaction time and saturation of rock on specific energy in ND:YAG laser perforating. Opt. Laser Technol. 2011, 43, 226–231. [Google Scholar] [CrossRef] [Scilit]
- Han, W.; Fu, J.; Luo, X.; Guo, L.; Xia, Y.; He, S. A New Linear Cutting Experimental Machine for Disc-Cutter Rock Breaking with High-Pressure Water Jets Assisted. KSCE J. Civ. Eng. 2023, 27, 2666–2675. [Google Scholar] [CrossRef] [Scilit]
- Liu, S.; Cui, Y.; Chen, Y.; Guo, C. Numerical research on rock breaking by abrasive water jet-pick under confining pressure. Int. J. Rock Mech. Min. Sci. 2019, 120, 41–49. [Google Scholar] [CrossRef] [Scilit]
- Ciccu, R.; Grosso, B. Improvement of Disc Cutter Performance by Water Jet Assistance. Rock Mech. Rock Eng. 2014, 47, 733–744. [Google Scholar] [CrossRef] [Scilit]
- Xiao, J.; Liu, F.; Yang, M.; Ji, Z.; Ke, W.; Xia, Y. Experimental study on the influence of installation angle on rock-cutting characteristics of SBM inclined cutter. Bull. Eng. Geol. Environ. 2026, 85, 118. [Google Scholar] [CrossRef] [Scilit]
- Liu, W.; Liu, Z.; Li, R.; Wang, G.; Zhang, K. Rock cutting and ROP improving mechanism of specially-shaped PDC cutter in hard brittle granite. J. Braz. Soc. Mech. Sci. Eng. 2026, 48, 140. [Google Scholar] [CrossRef] [Scilit]
- Zhu, X.; Deng, K.; Liu, W.; Li, R.; Wang, G. Numerical simulation on rock-breaking performance of PDC cutter in heterogeneous glutenite formation. J. Braz. Soc. Mech. Sci. Eng. 2026, 48, 277. [Google Scholar] [CrossRef] [Scilit]
- Cai, M. Practical Estimates of Tensile Strength and Hoek–Brown Strength Parameter mi of Brittle Rocks. Rock Mech. Rock Eng. 2010, 43, 167–184. [Google Scholar] [CrossRef] [Scilit]
- Kalhori, H.; Bagherpour, R.; Tudeshki, H. Wear Prediction of Rock Drill Bits Based on Geomechanical Properties of Rocks. Arab. J. Sci. Eng. 2024, 49, 8629–8642. [Google Scholar] [CrossRef] [Scilit]
- Zhang, X.; Jiang, H.; Tian, M.; Li, H.; Chen, H. Rock cutting performance and wear characteristics of undercutting disc cutter: Based on experiment and DEM. Wear 2023, 528–529, 204976. [Google Scholar] [CrossRef] [Scilit]
- Lin, F.; Feng, X.T.; Liu, Y.; Li, S.; Tong, T.; Su, X. Exploring hard-rock cutting performances by a master–slave follow-up disc cutter. J. Rock Mech. Geotech. Eng. 2025, 17, 7966–7979. [Google Scholar] [CrossRef] [Scilit]
- Stopka, G.; Kotwica, K. Estimation of excavation forces in conditions of a complex cutting trajectory with asymmetrical disc tools in DEM method. Tunn. Undergr. Space Technol. 2023, 142, 105439. [Google Scholar] [CrossRef] [Scilit]
- Hajivand Dastgerdi, R.; Salimi, M.; Wichtmann, T.; Malinowska, A. Peridynamic modeling of rock cutting under a TBM disc cutter using LS-DYNA. Simul. Model. Pract. Theory 2025, 143, 103146. [Google Scholar] [CrossRef] [Scilit]
- Li, H.; Du, E. Simulation of rock fragmentation induced by a tunnel boring machine disk cutter. Adv. Mech. Eng. 2016, 8, 1687814016651557. [Google Scholar] [CrossRef] [Scilit]
- Fu, J.; Xia, Y.; Zhang, L.; Lin, L.; Zhang, X.; Zhao, S. Failure analysis on the fracture of disc cutter in EPB shield machine. Eng. Fail. Anal. 2020, 108, 104341. [Google Scholar] [CrossRef] [Scilit]
- Lin, L.; Xia, Y.; Mao, Q.; Zhang, X. Experimental Study on Wear Behaviors of TBM Disc Cutter Ring in Hard Rock Conditions. Tribol. Trans. 2018, 61, 920–929. [Google Scholar] [CrossRef] [Scilit]
- Choi, S.O.; Lee, S.J. Numerical study to estimate the cutting power on a disc cutter in jointed rock mass. KSCE J. Civ. Eng. 2016, 20, 440–451. [Google Scholar] [CrossRef] [Scilit]
- Acaroglu, O.; Erdogan, C. Stability analysis of roadheaders with mini-disc. Tunn. Undergr. Space Technol. 2017, 68, 187–195. [Google Scholar] [CrossRef] [Scilit]
- Zhou, J.; Liu, Z.; Li, C.; Du, K.; Khandelwal, M. Interpretable Machine Learning for Predicting Cutting Force of Tunnel Boring Machine: A Study on SVR With Meta-Heuristic Optimization. Int. J. Numer. Anal. Methods Geomech. 2025, 49, 4412–4435. [Google Scholar] [CrossRef] [Scilit]
- Liu, Z.; Wu, Z.; Wang, X.; Li, Q.; Zhang, S. Numerical investigation on rock breakage patterns and stress state of disk cutter during vibrational cutting. J. Braz. Soc. Mech. Sci. Eng. 2026, 48, 158. [Google Scholar] [CrossRef] [Scilit]
- Zhu, X.; Li, R.; Liu, W.; Wang, G.; Zhang, K. Analysis of Rock-Breaking Mechanism and Drillstring Dynamics of an Innovative Multi-Ridge-Curve-Shaped PDC Cutter. Arab. J. Sci. Eng. 2023, 48, 16587–16605. [Google Scholar] [CrossRef] [Scilit]
- Dehkhoda, S.; Detournay, E. Rock Cutting Experiments with an Actuated Disc. Rock Mech. Rock Eng. 2019, 52, 3443–3458. [Google Scholar] [CrossRef] [Scilit]
- Kovalyshen, Y. Analytical model of oscillatory disc cutting. Int. J. Rock Mech. Min. Sci. 2015, 77, 378–383. [Google Scholar] [CrossRef] [Scilit]
- Karekal, S. Oscillating Disc Cutting Technique for Hard Rock Excavation. In Proceedings of the 47th U.S. Rock Mechanics/Geomechanics Symposium, San Francisco, CA, USA, 23–26 June 2013. ARMA-2013-56. [Google Scholar]
- Dehkhoda, S.; Detournay, E. Mechanics of Actuated Disc Cutting. Rock Mech. Rock Eng. 2017, 50, 465–483. [Google Scholar] [CrossRef] [Scilit]
- Dehkhoda, S.; Hill, B. Clearance angle and evolution of depth of cut in actuated disc cutting. J. Rock Mech. Geotech. Eng. 2019, 11, 644–658. [Google Scholar] [CrossRef] [Scilit]
- Xu, R.; Dehkhoda, S.; Hagan, P.C.; Oh, J. Evaluation of cutting fragments in relation to force dynamics in actuated disc cutting. Int. J. Rock Mech. Min. Sci. 2021, 146, 104850. [Google Scholar] [CrossRef] [Scilit]
- Zhong, Z.; Zhu, K.; Tang, J.; Liu, X.; Li, Z. Intelligent Prediction of Cutting Depth and Parameter Optimization in Abrasive Waterjet Cutting. Rock Mech. Rock Eng. 2026, 59, 3793–3820. [Google Scholar] [CrossRef] [Scilit]
- Gingold, R.A.; Monaghan, J.J. Smoothed particle hydrodynamics: Theory and application to non-spherical stars. Mon. Not. R. Astron. Soc. 1977, 181, 375–389. [Google Scholar] [CrossRef] [Scilit]
- Yang, C.; Hassani, F.; Zhou, K.; Zhang, Q.; Wang, F.; Gao, F.; Topa, A. Numerical investigation of TBM disc cutter cutting on microwave-treated basalt with an unrelieved model. Arch. Civ. Mech. Eng. 2022, 22, 147. [Google Scholar] [CrossRef] [Scilit]
- Holmquist, T.J.; Johnson, G.R.; Cook, W.H. A Computational Constitutive Model for Concrete Subjected to Large Strains, High Strain Rates and High Pressures. In Proceedings of the 14th International Symposium on Ballistics; National Defence Research Establishment: Stockholm, Sweden, 1993; Volume 2, pp. 591–600. [Google Scholar]
- Johnson, G.R.; Holmquist, T.J. An improved computational constitutive model for brittle materials. AIP Conf. Proc. 1994, 309, 981–984. [Google Scholar] [CrossRef] [Scilit]
- Riedel, W.; Thoma, K.; Hiermaier, S.; Schmolinske, E. Penetration of Reinforced Concrete by BETA-B-500 Numerical Analysis using a New Macroscopic Concrete Model for Hydrocodes. In Proceedings of the 9th International Symposium on Interaction of the Effects of Munitions with Structures, Berlin-Strausberg, Germany, 3–7 May 1999; pp. 315–322. [Google Scholar]
- Murray, Y.D. Users Manual for LS-DYNA Concrete Material Model 159; Technical Report; Federal Highway Administration: Washington, DC, USA, 2007. [Google Scholar]
- Heydari, M.; Farrokh, E.; Khoshrou, S.H. Parameter determination of Johnson–Holmquist–Cook constitutive model and calibration for Indiana Limestone. Geomech. Geophys. Geo-Energy Geo-Resour. 2024, 10, 122. [Google Scholar] [CrossRef] [Scilit]
- Gaffney, E.S. Measurements of Dynamic Friction Between Rock and Steel; Technical Report; Defense Nuclear Agency (DNA): Washington, DC, USA, 1976. [Google Scholar]
- Ling, T.L.; Wu, S.F.; Liu, D.S.; Liang, S.F.; Li, C.; Ma, J.H. Determination of Holmquist-Johnson-Cook model parameters for sandstone. J. China Coal Soc. 2018, 43, 2211–2216. [Google Scholar] [CrossRef]
Figure 1.
Configuration of a boom-type roadheader.
Figure 1.
Configuration of a boom-type roadheader.
Figure 2.
Cutting process of the ODC: (a) motion schematic, (b) ideal groove, (c) cutting trajectory (the red solid line represents the previous cut, and the blue dashed line represents the current path).
Figure 2.
Cutting process of the ODC: (a) motion schematic, (b) ideal groove, (c) cutting trajectory (the red solid line represents the previous cut, and the blue dashed line represents the current path).
Figure 3.
Cutting trajectory of the eccentric disc cutter.
Figure 3.
Cutting trajectory of the eccentric disc cutter.
Figure 4.
Decomposition of the single-cycle cutter–rock contact process (the red solid line represents the previous cut, and the blue dashed line represents the current path).
Figure 4.
Decomposition of the single-cycle cutter–rock contact process (the red solid line represents the previous cut, and the blue dashed line represents the current path).
Figure 5.
SPH-FEM coupling method: (a) tied or constrained coupling at the interface nodes; (b) node-to-surface contact; (c) element-based adaptive conversion from FEM to SPH.
Figure 5.
SPH-FEM coupling method: (a) tied or constrained coupling at the interface nodes; (b) node-to-surface contact; (c) element-based adaptive conversion from FEM to SPH.
Figure 6.
SPH-FEM contact algorithm flow.
Figure 6.
SPH-FEM contact algorithm flow.
Figure 7.
Constitutive model of Johnson–Holmquist–Concrete material: (
a) yield surface; (
b) equation of state; (
c) damage evolution [
35].
Figure 7.
Constitutive model of Johnson–Holmquist–Concrete material: (
a) yield surface; (
b) equation of state; (
c) damage evolution [
35].
Figure 8.
Meshed geometry of the disc cutter and rock specimen.
Figure 8.
Meshed geometry of the disc cutter and rock specimen.
Figure 9.
Mesh sensitivity analysis.
Figure 9.
Mesh sensitivity analysis.
Figure 10.
Uniaxial compression test for HJC model calibration: (a) test equipment; (b) rock specimens; (c) comparison of experimental and numerical stress–strain curves.
Figure 10.
Uniaxial compression test for HJC model calibration: (a) test equipment; (b) rock specimens; (c) comparison of experimental and numerical stress–strain curves.
Figure 11.
Experimental setup of the Linear Cutting Machine (LCM).
Figure 11.
Experimental setup of the Linear Cutting Machine (LCM).
Figure 12.
Validation of the ODC numerical model: (a) mean cutting forces comparison; (b) snapshots of cutting process; (c) collected rock chips.
Figure 12.
Validation of the ODC numerical model: (a) mean cutting forces comparison; (b) snapshots of cutting process; (c) collected rock chips.
Figure 13.
Damage zone evolution under varying eccentricities.
Figure 13.
Damage zone evolution under varying eccentricities.
Figure 14.
Cutting force curves for and mm.
Figure 14.
Cutting force curves for and mm.
Figure 15.
Comparison of average and peak forces.
Figure 15.
Comparison of average and peak forces.
Figure 16.
Evolution of von Mises stress field within a single eccentric cutting cycle: (a) peak loading, (b) damage propagation, and (c) stress relaxation.
Figure 16.
Evolution of von Mises stress field within a single eccentric cutting cycle: (a) peak loading, (b) damage propagation, and (c) stress relaxation.
Figure 17.
Force time histories under different eccentricities ( mm/s).
Figure 17.
Force time histories under different eccentricities ( mm/s).
Figure 18.
Comparison of average and peak cutting forces as a function of eccentricity ( mm/s).
Figure 18.
Comparison of average and peak cutting forces as a function of eccentricity ( mm/s).
Figure 19.
Force time histories under varying feed rates ().
Figure 19.
Force time histories under varying feed rates ().
Figure 20.
Comparison of average and peak cutting forces at different feed rates ().
Figure 20.
Comparison of average and peak cutting forces at different feed rates ().
Figure 21.
Force time histories under different oscillation frequencies ().
Figure 21.
Force time histories under different oscillation frequencies ().
Figure 22.
Statistical comparison of average and peak forces across different frequencies ().
Figure 22.
Statistical comparison of average and peak forces across different frequencies ().
Figure 23.
Specific energy () under different simulation parameters (Red and blue colors represent conventional and oscillating disc cutters, respectively).
Figure 23.
Specific energy () under different simulation parameters (Red and blue colors represent conventional and oscillating disc cutters, respectively).
Table 1.
ODC Dynamic Conditions.
Table 1.
ODC Dynamic Conditions.
| Sample | e (mm) | v (mm/s) | f (Hz) | | |
|---|
| S1 | 0 | 120 | 60 | 0 | – |
| S2 | 1 | 120 | 60 | 0.02 | |
| S3 | 3 | 120 | 60 | 0.06 | |
| S4 | 5 | 120 | 60 | 0.1 | |
| S5 | 0 | 150 | 60 | 0 | – |
| S6 | 1 | 150 | 60 | 0.02 | |
| S7 | 3 | 150 | 60 | 0.06 | |
| S8 | 5 | 150 | 60 | 0.1 | |
| S9 | 1 | 180 | 60 | 0.02 | |
| S10 | 3 | 180 | 60 | 0.06 | |
| S11 | 5 | 180 | 60 | 0.1 | |
| S12 | 3 | 150 | 30 | 0.06 | |
| S13 | 3 | 150 | 45 | 0.06 | |
| S14 | 5 | 150 | 30 | 0.1 | |
| S15 | 5 | 150 | 45 | 0.1 | |
| S16 | 5 | 400 | 10 | 0.1 | |
| S17 | 2 | 120 | 60 | 0.04 | |
| S18 | 4 | 120 | 60 | 0.08 | |
| S19 | 6 | 120 | 60 | 0.12 | |
| S20 | 7 | 120 | 60 | 0.14 | |
| S21 | 3 | 130 | 60 | 0.06 | |
| S22 | 3 | 140 | 60 | 0.06 | |
| S23 | 3 | 160 | 60 | 0.06 | |
| S24 | 3 | 170 | 60 | 0.06 | |
Table 2.
Comprehensive reconciled HJC constitutive model parameters for the sandstone specimen.
Table 2.
Comprehensive reconciled HJC constitutive model parameters for the sandstone specimen.
| Category | Parameter Name | Symbol | Amount | Unit |
|---|
| Basic properties | Density | | 2325 | kg |
| | Quasi-static uniaxial compressive strength | | 26.45 | MPa |
| | Maximum tensile hydrostatic pressure | T | 5.0 | MPa |
| | Shear modulus | G | 4.6 | GPa |
| Strength parameters | Normalized cohesive strength | A | 0.32 | – |
| | Normalized pressure hardening coefficient | B | 1.70 | – |
| | Pressure hardening index | N | 0.78 | – |
| | Strain rate coefficient | C | 0.012 | – |
| | Maximum normalized limit strength | | 4.0 | – |
| Pressure parameters (EOS) | Volumetric pressure at crushing point | | 25.0 | MPa |
| | Volumetric strain at crushing point | | 0.0017 | – |
| | Pressure at compaction point | | 75.0 | MPa |
| | Volumetric strain at compaction point | | 0.012 | – |
| | Pressure constant 1 | | 83.0 | GPa |
| | Pressure constant 2 | | −95.0 | GPa |
| | Pressure constant 3 | | 90.0 | GPa |
| Damage properties | Minimum plastic strain at failure | | 0.0045 | – |
| | Damage parameter 1 | | 0.012 | – |
| | Damage parameter 2 | | 1.0 | – |
Table 3.
Basic physico-mechanical properties of the sandstone specimen.
Table 3.
Basic physico-mechanical properties of the sandstone specimen.
| Parameter | Symbol | Value | Unit |
|---|
| Density | | 2325 | kg/ |
| Young’s modulus | E | 12.5 | GPa |
| Poisson’s ratio | | 0.36 | – |
| Uniaxial compressive strength | | 26.45 | MPa |
Table 4.
The error between theoretical values and simulated values.
Table 4.
The error between theoretical values and simulated values.
| Case | | | (kN) | (kN) | Error (%) |
|---|
| 1 | 0.02 | | 2.01 | 2.29 | 12.2 |
| 2 | 0.06 | | 1.34 | 1.32 | 1.52 |
| 3 | 0.1 | | 1.14 | 1.03 | 10.7 |
| 4 | 0.02 | | 2.35 | 2.56 | 8.2 |
| 5 | 0.06 | | 1.57 | 1.48 | 6.08 |
| 6 | 0.1 | | 1.33 | 1.15 | 15.7 |
| 7 | 0.02 | | 2.75 | 2.81 | 2.14 |
| 8 | 0.06 | | 1.73 | 1.62 | 6.79 |
| 9 | 0.1 | | 1.46 | 1.25 | 16.8 |
| Disclaimer/Publisher’s Note: The statements, opinions and data contained in all publications are solely those of the individual author(s) and contributor(s) and not of MDPI and/or the editor(s). MDPI and/or the editor(s) disclaim responsibility for any injury to people or property resulting from any ideas, methods, instructions or products referred to in the content. |