Article

Surface-Resolved Multiphysics Modeling and Analysis of Current-Carrying Wear in Slip Rings Under Eccentric Runout

1
Sichuan Development International Commercial Spaceport Co., Ltd., Xichang 615000, China
2
SWJTU-Leeds Joint School, Southwest Jiaotong University, Chengdu 611756, China
*
Author to whom correspondence should be addressed.
Machines 2026, 14(6), 674; https://doi.org/10.3390/machines14060674

Submission received: 8 May 2026 / Revised: 2 June 2026 / Accepted: 5 June 2026 / Published: 9 June 2026
(This article belongs to the Section Friction and Tribology)

Abstract

Slip ring–brush assemblies are widely used in satellite mechanisms to transmit power and signals across rotating interfaces. Under authentic space environments—vacuum, radiation-dominated thermal exchange, and long-duration operation—the coupled effects of mechanical contact dynamics, electrical conduction, intermittent separation, and arcing can accelerate wear and degrade reliability. This paper presents a surface-resolved multiphysics model for multi-track slip rings with staggered brushes. The ring surface is discretized on a circumferential–axial grid and endowed with correlated 3D roughness, enabling interference-based asperity contact. Brush normal dynamics (mass–spring–damper) convert runout and micro-vibration into normal-force ripple and separation events. Electrical conduction is modeled by a parallel admittance network combining pressure-dependent micro-contact conduction and an event-based arc channel activated by separation, opening velocity, and current density with stochastic ignition. A 2D thermal model with ADI integration accounts for Joule/friction heating, radiative cooling, and optional hub conduction. Wear evolves via an Archard-type mechanical term and an arc-energy-driven erosive term. A FAST–MACRO multiscale scheme (20 s FAST, 100 h MACRO with periodic recalibration) enables tractable long-horizon wear prediction while preserving arc statistics. Baseline simulations for a 28 V bus demonstrate rare but nonzero arc activity and predict spatially non-uniform wear at the micrometer scale after 100 h.

1. Introduction

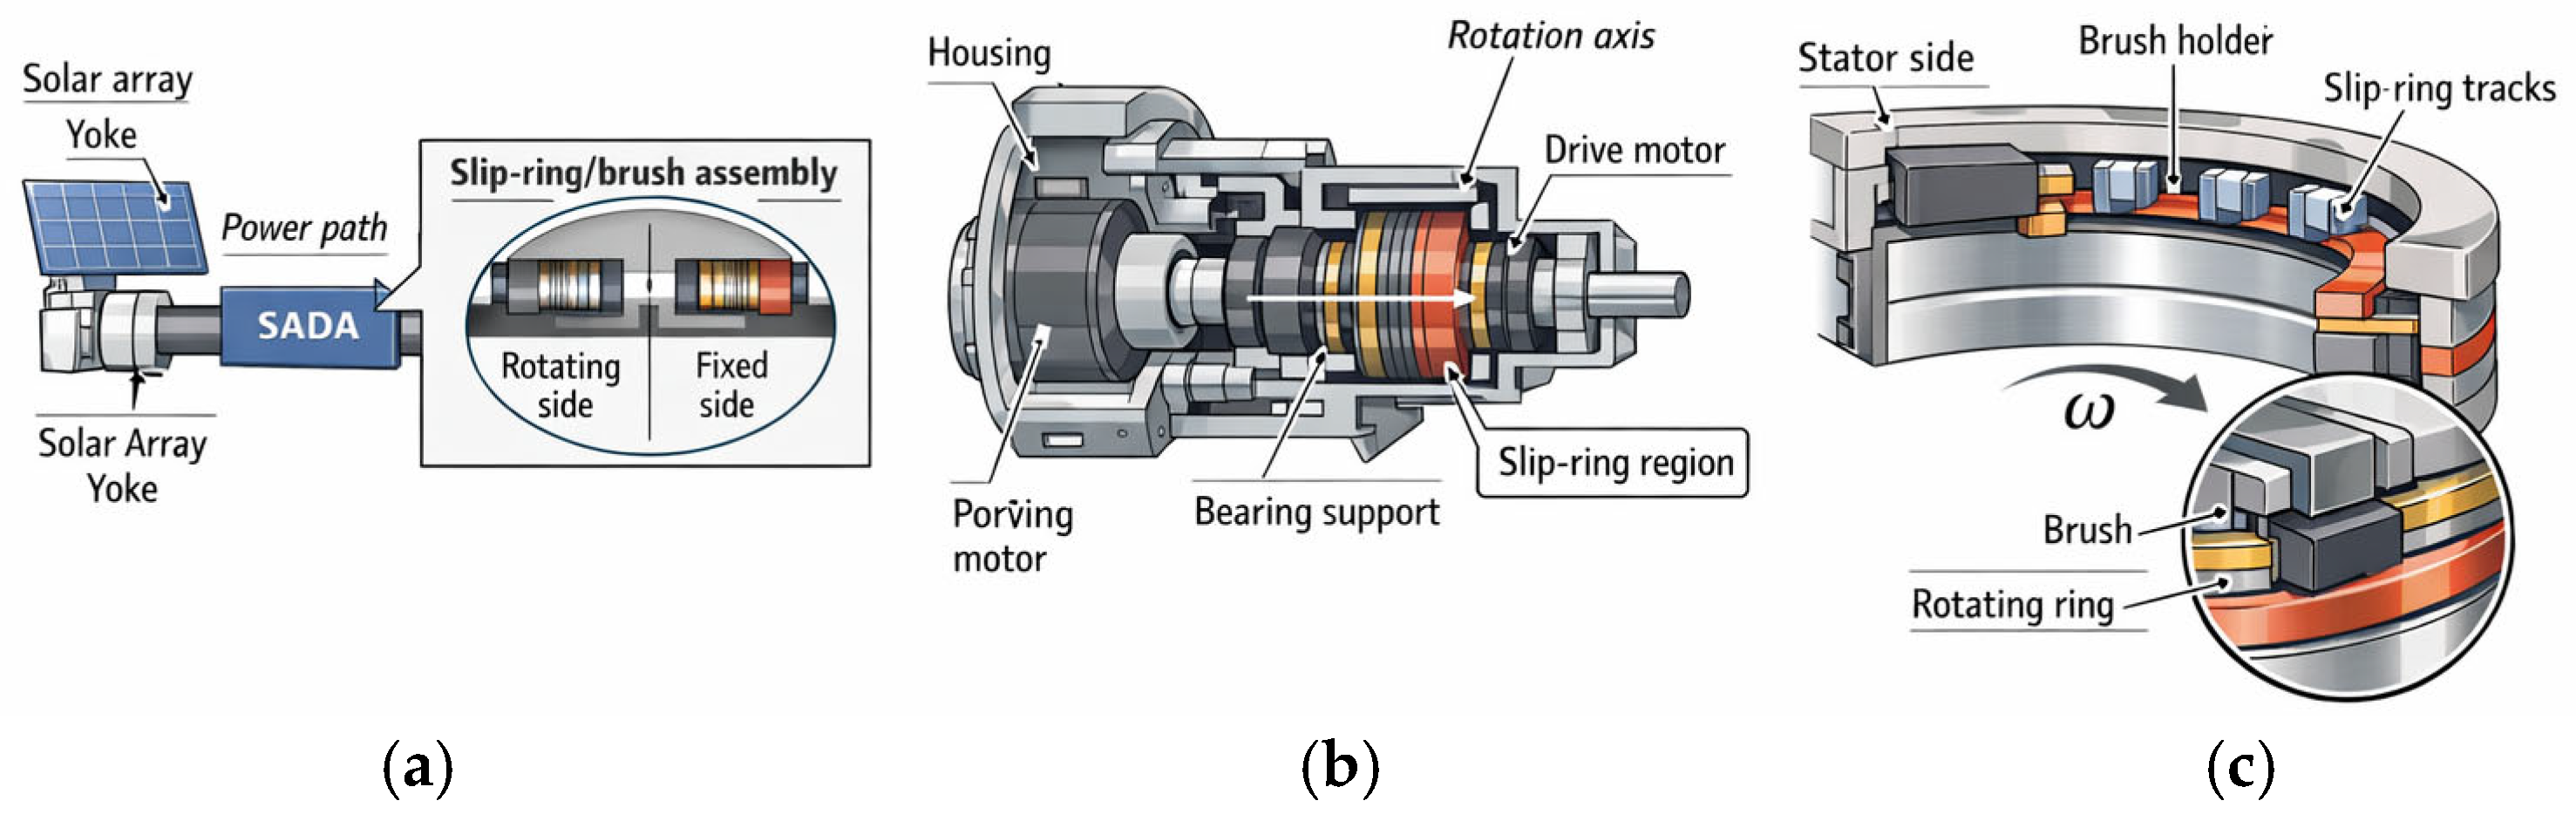
Slip rings are widely used in satellite mechanisms to transfer power and signals across rotating interfaces, particularly in Solar Array Drive Assemblies/Mechanisms (SADA/SADM), which slowly rotate solar arrays to maintain optimal illumination [1], as shown in Figure 1. However, SADA systems operate under extremely harsh conditions, which pose significant challenges to their service reliability. Common disturbances in SADA systems include bearing imperfections, gear-train excitations, and micro-vibrations, all of which can modulate contact forces and excite the normal dynamics of the brushes. These effects have been recognized as important sources of micro-vibration and disturbance torque [2]. In parallel, electrical hazards such as vacuum arcs, discharge faults, and arc-related DC faults can cause rapid material erosion, debris generation, and cascading failures at the satellite power-system level [3,4,5,6]. To mitigate these risks, various component-level developments have been reported, including slip-ring test assemblies designed to improve high-voltage withstand capability [7] and design optimizations aimed at reducing deep dielectric charging under irradiation [8,9].
From a tribological perspective, current-carrying sliding contacts differ fundamentally from purely mechanical interfaces because friction and wear are strongly coupled with electrical conduction and localized Joule heating [10,11,12]. Wu et al. [13] systematically reviewed the friction and wear behavior of conductive slip rings operating in harsh environments, including vacuum, humidity, and corrosive conditions, and emphasized that multi-domain coupling and lifetime prediction remain major challenges. Huang et al. [14] highlighted the coupled mechanical–electrical damage and its spatiotemporal non-uniformity. Material-based approaches, such as laser-cladded Cu–TiC coatings, have been reported to improve current-carrying wear resistance; however, arc erosion and thermal damage remain key limiting factors under elevated current densities [15]. Yang et al. [16] demonstrated that magnetron-sputtered NbSe2 films can simultaneously provide metal-like conductivity and low friction under vacuum current-carrying conditions, highlighting the importance of developing lubrication materials specifically for space sliding electrical contacts. In vacuum environments, debris further amplifies the operational risk, because particle adhesion on insulating surfaces can distort local electric fields and reduce flashover voltage. To address this issue, a particle-trap strategy has been proposed to mitigate flashover degradation in conductive slip rings [17]. In addition, manufacturing and assembly quality can significantly influence contact stability. Accordingly, a machine-vision-based method has been developed to measure and control conductive brush angles in precision slip rings [18]. Chen et al. [19] further proposed a vision-aided brush alignment assembly system for precision conductive slip rings, showing that brush–ring alignment accuracy directly affects dynamic contact resistance, reliability, and service lifetime. Qian et al. [20] showed that simulation-driven assembly optimization can improve resistance fluctuation, angular repeatability, and transmission stability in conductive slip rings. Space-oriented component studies have also reported finite-angle multichannel slip-ring configurations and discussed their associated structural constraints [21,22].
Additional evidence from failure analyses of wind-turbine slip-ring connectors indicates that coupled mechanical loading and environmental exposure can drive severe degradation mechanisms, such as stress-corrosion cracking, thereby highlighting the importance of lifetime-oriented assessment [23]. From the modeling perspective, classical electrical contact theory explains why electrical conduction is governed by real contact spots and the associated constriction resistance rather than by the nominal contact area [24], while rough-surface contact theory provides a statistical framework for describing micro-contact load sharing on nominally flat interfaces [25]. Building on this view, Jonckheere et al. [26] proposed that in multi-contact interfaces, local separation gaps at the micrometer scale may trigger arc transfer and create additional electrical spots, thereby modifying the equivalent interface resistance and producing nonlinear, hysteretic conduction behavior. Wear evolution is commonly described using Archard-type relations that link wear to normal load and sliding distance [27]. In vacuum environments, the absence of convective cooling and the altered surface-film chemistry impose additional constraints on lubrication and contact stability, as discussed in foundational studies of vacuum electrical contacts [28]. Experimental investigations of sliding electrical contacts have further demonstrated that wear and resistance stability are highly sensitive to contact parameters and dynamic excitation, indicating that vibration and other disturbances can significantly influence contact resistance and wear behavior [29,30,31].
It is worth noting that analogous problems involving electrified sliding contact under dynamic separation have also been investigated in other transportation applications [32]. For example, arc-induced ablation and thermal degradation of sliding materials have been studied in pantograph–catenary systems [33]. Pan et al. [34] modeled transient pantograph–catenary arcing in electrical sectioning overlaps and showed that arc evolution and heat transfer are governed by coupled electromagnetic, aerodynamic, and thermal effects. Yu et al. [35] further demonstrated that arc duration, contact gap, and current intensity strongly influence the arc temperature field, highlighting the risk of localized overheating in electrified contact interfaces. Under a complete dynamic separation process, phase-change melting of the contact wire can be described using a multiphysics framework incorporating Joule heating, thermal conduction, radiation, and latent-heat effects, while the liquid-phase area is strongly influenced by separation distance, current intensity, and crosswind conditions [36]. The effects of structural parameters on pantograph–catenary interaction and dynamic performance have also been quantified [37], and data-driven approaches based on time–frequency dual-domain learning have been developed for dynamic performance prediction [38]. In addition, studies of conductor rail systems with electric shoegear, considering track irregularities, have further shown how mechanical excitation can affect current-collection stability and contact forces [39]. Although these systems differ from slip rings, they collectively highlight a broader engineering reality: dynamic separation and multi-domain coupling can induce both mechanical and electrical damage, and therefore should be represented consistently in numerical modeling.
Although these studies provide valuable experimental evidence and design guidance, the numerical modelling of multi-domain factors for satellite slip rings still has several shortcomings. In particular, the eccentric effects (runout harmonics and micro-vibration) that can trigger both mechanical wear (via normal-force ripple) and electrical wear (via separation-driven current localisation and arcing) have not been fully investigated. This paper addresses the gap by developing a multiphysics model that resolves coupled contact, conduction, thermal transport, arcing, and wear on the ring surface, and by applying it to a systematic case suite. The contributions can be summarised as follows:
(1) A surface-resolved slip-ring model is established, incorporating a θ–z discretization with correlated three-dimensional roughness and evolving wear, as well as multi-track/brush staggering and brush mass–spring–damper dynamics under runout excitation.
(2) A local electro–thermal–wear coupling model is developed, in which pressure-dependent micro-contact conduction and event-based arcing are integrated with vacuum heat transfer.
(3) A FAST–MACRO multiscale simulation strategy is implemented to preserve the short-time statistics of separation and arcing while enabling efficient prediction of long-term wear evolution over a 100 h service horizon.

2. Multiphysics Modelling of SADA Slip Ring

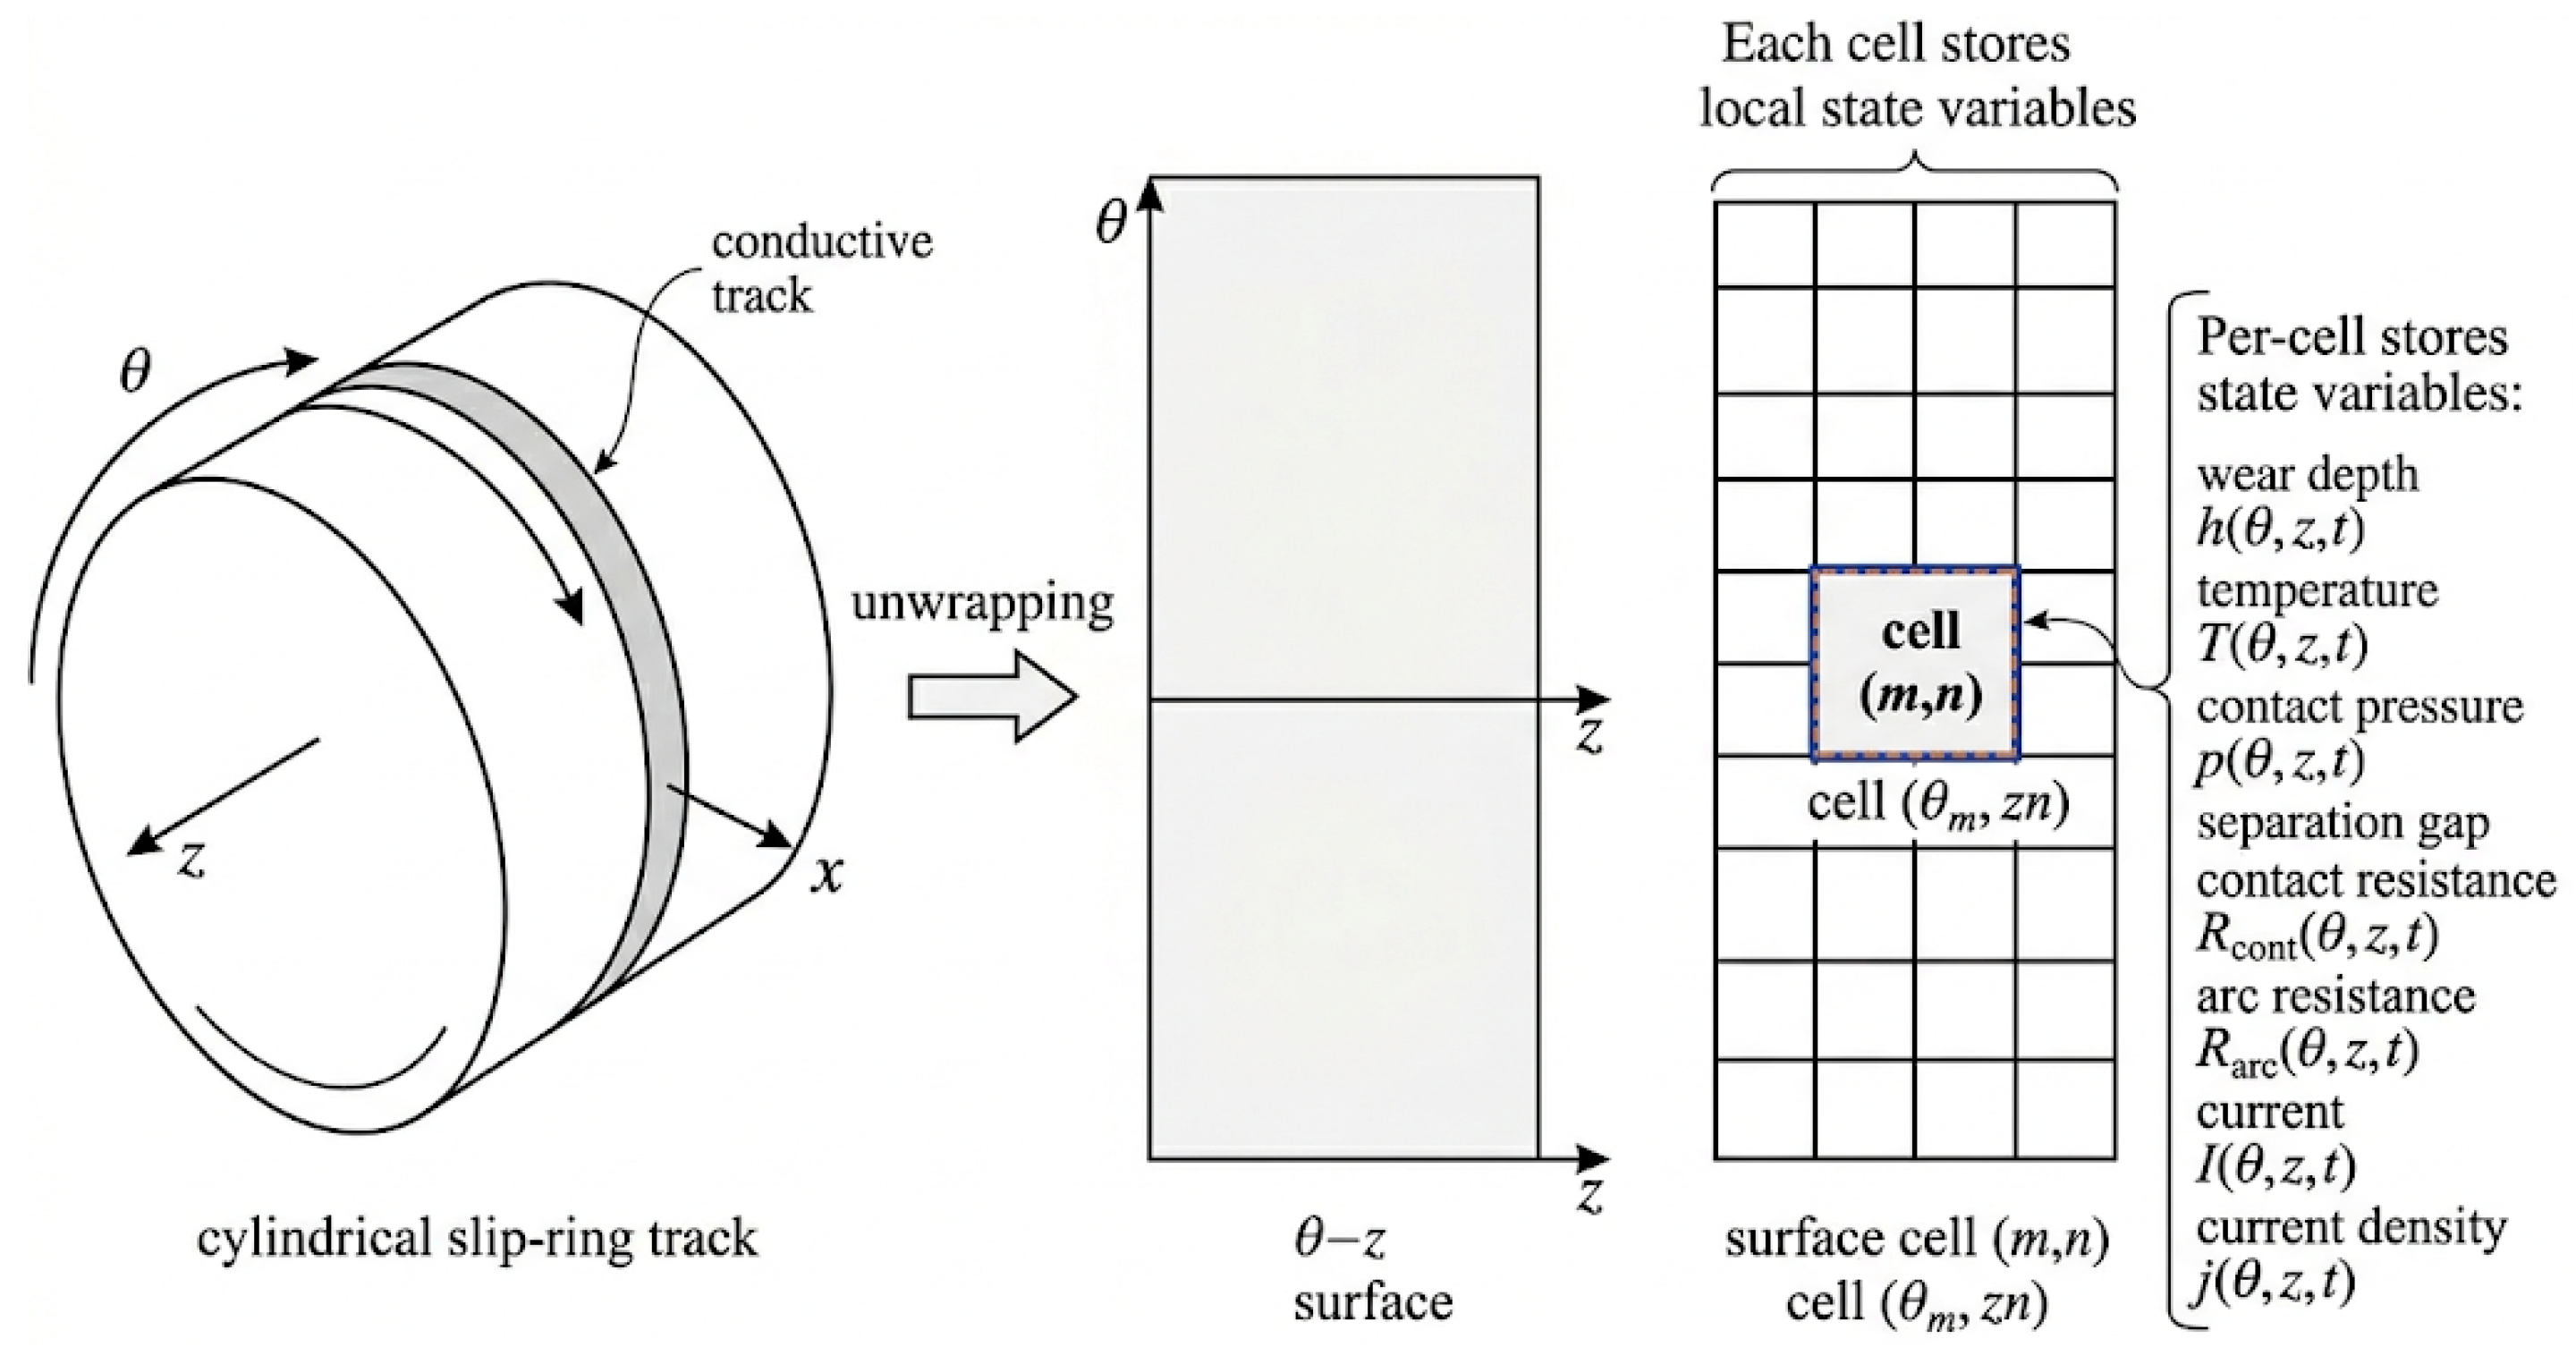
A satellite SADA slip-ring/brush assembly is used to transfer electrical power and signals across the rotating interface between the spacecraft bus and the solar array [40]. The interface usually consists of multiple concentric conductive tracks (rings), with several brushes assigned to each track to ensure redundancy and maintain stable current transmission. During service, the brushes are subjected to normal-force fluctuations caused by bearing imperfections, shaft eccentricity (runout), gear-train disturbances, and micro-vibration. These disturbances periodically vary the brush–ring clearance and may lead to intermittent separation. In vacuum, such separation can induce current localization and local Joule heating and, under severe conditions, may even trigger vacuum arcs, while the lack of convective cooling makes local hot spots more difficult to dissipate [18,41]. As wear accumulates, the surface geometry gradually changes, which in turn alters the separation behavior and forms a multi-domain feedback loop. Against this background, the aim of the present model is to predict, over a mission-relevant timescale, how disturbance-driven separation interacts with surface-resolved contact, electrical conduction and arcing, vacuum thermal transport, and wear evolution, and how these coupled processes affect degradation indicators such as maximum wear depth, peak temperature, equivalent resistance, and arc activity. In the configuration considered here, a 28 V satellite power bus feeds multiple conductive tracks, and each track is contacted by several brushes arranged with circumferential staggering and axial offsets. The ring surface is represented in the circumferential coordinate theta ∈ [0, 2π) and axial coordinate z ∈ [−W/2, W/2]. Figure 2 summarises the coordinate system, discretisation and the above state variables, which are used throughout Section 2, Section 3 and Section 4. Each conductive track is parameterised by circumferential coordinate θ [ 0 , 2 π) and axial coordinate z [ W i / 2 , W i / 2 ] , where W i is the track width and Ri is the track radius. The surface is discretised into an N θ   ×   N z mesh (Figure 2), which enables spatial localisation of contact, current and heat. In the discretised surface grid shown in Figure 2, for each surface cell ( θ ,   z ) , the model has the following features:
  • Geometry and contact: roughness height r(θ, z), wear depth h(θ, z, t), local gap g(θ, z, t), and contact pressure p(θ, z, t);
  • Electrical: micro-contact conductance G cont ( θ ,   z ,   t ) , arc conductance G arc ( θ ,   z ,   t ) , and arc state χ arc ( θ ,   z ,   t ) ;
  • Thermal and sources: temperature T   ( θ ,   z ,   t ) and heat fluxes q J ( θ ,   z ,   t ) (Joule), q F ( θ ,   z ,   t ) (friction), and q arc ( θ ,   z ,   t ) (arc).

2.1. Coupling Structure of the Multiphysics Problem

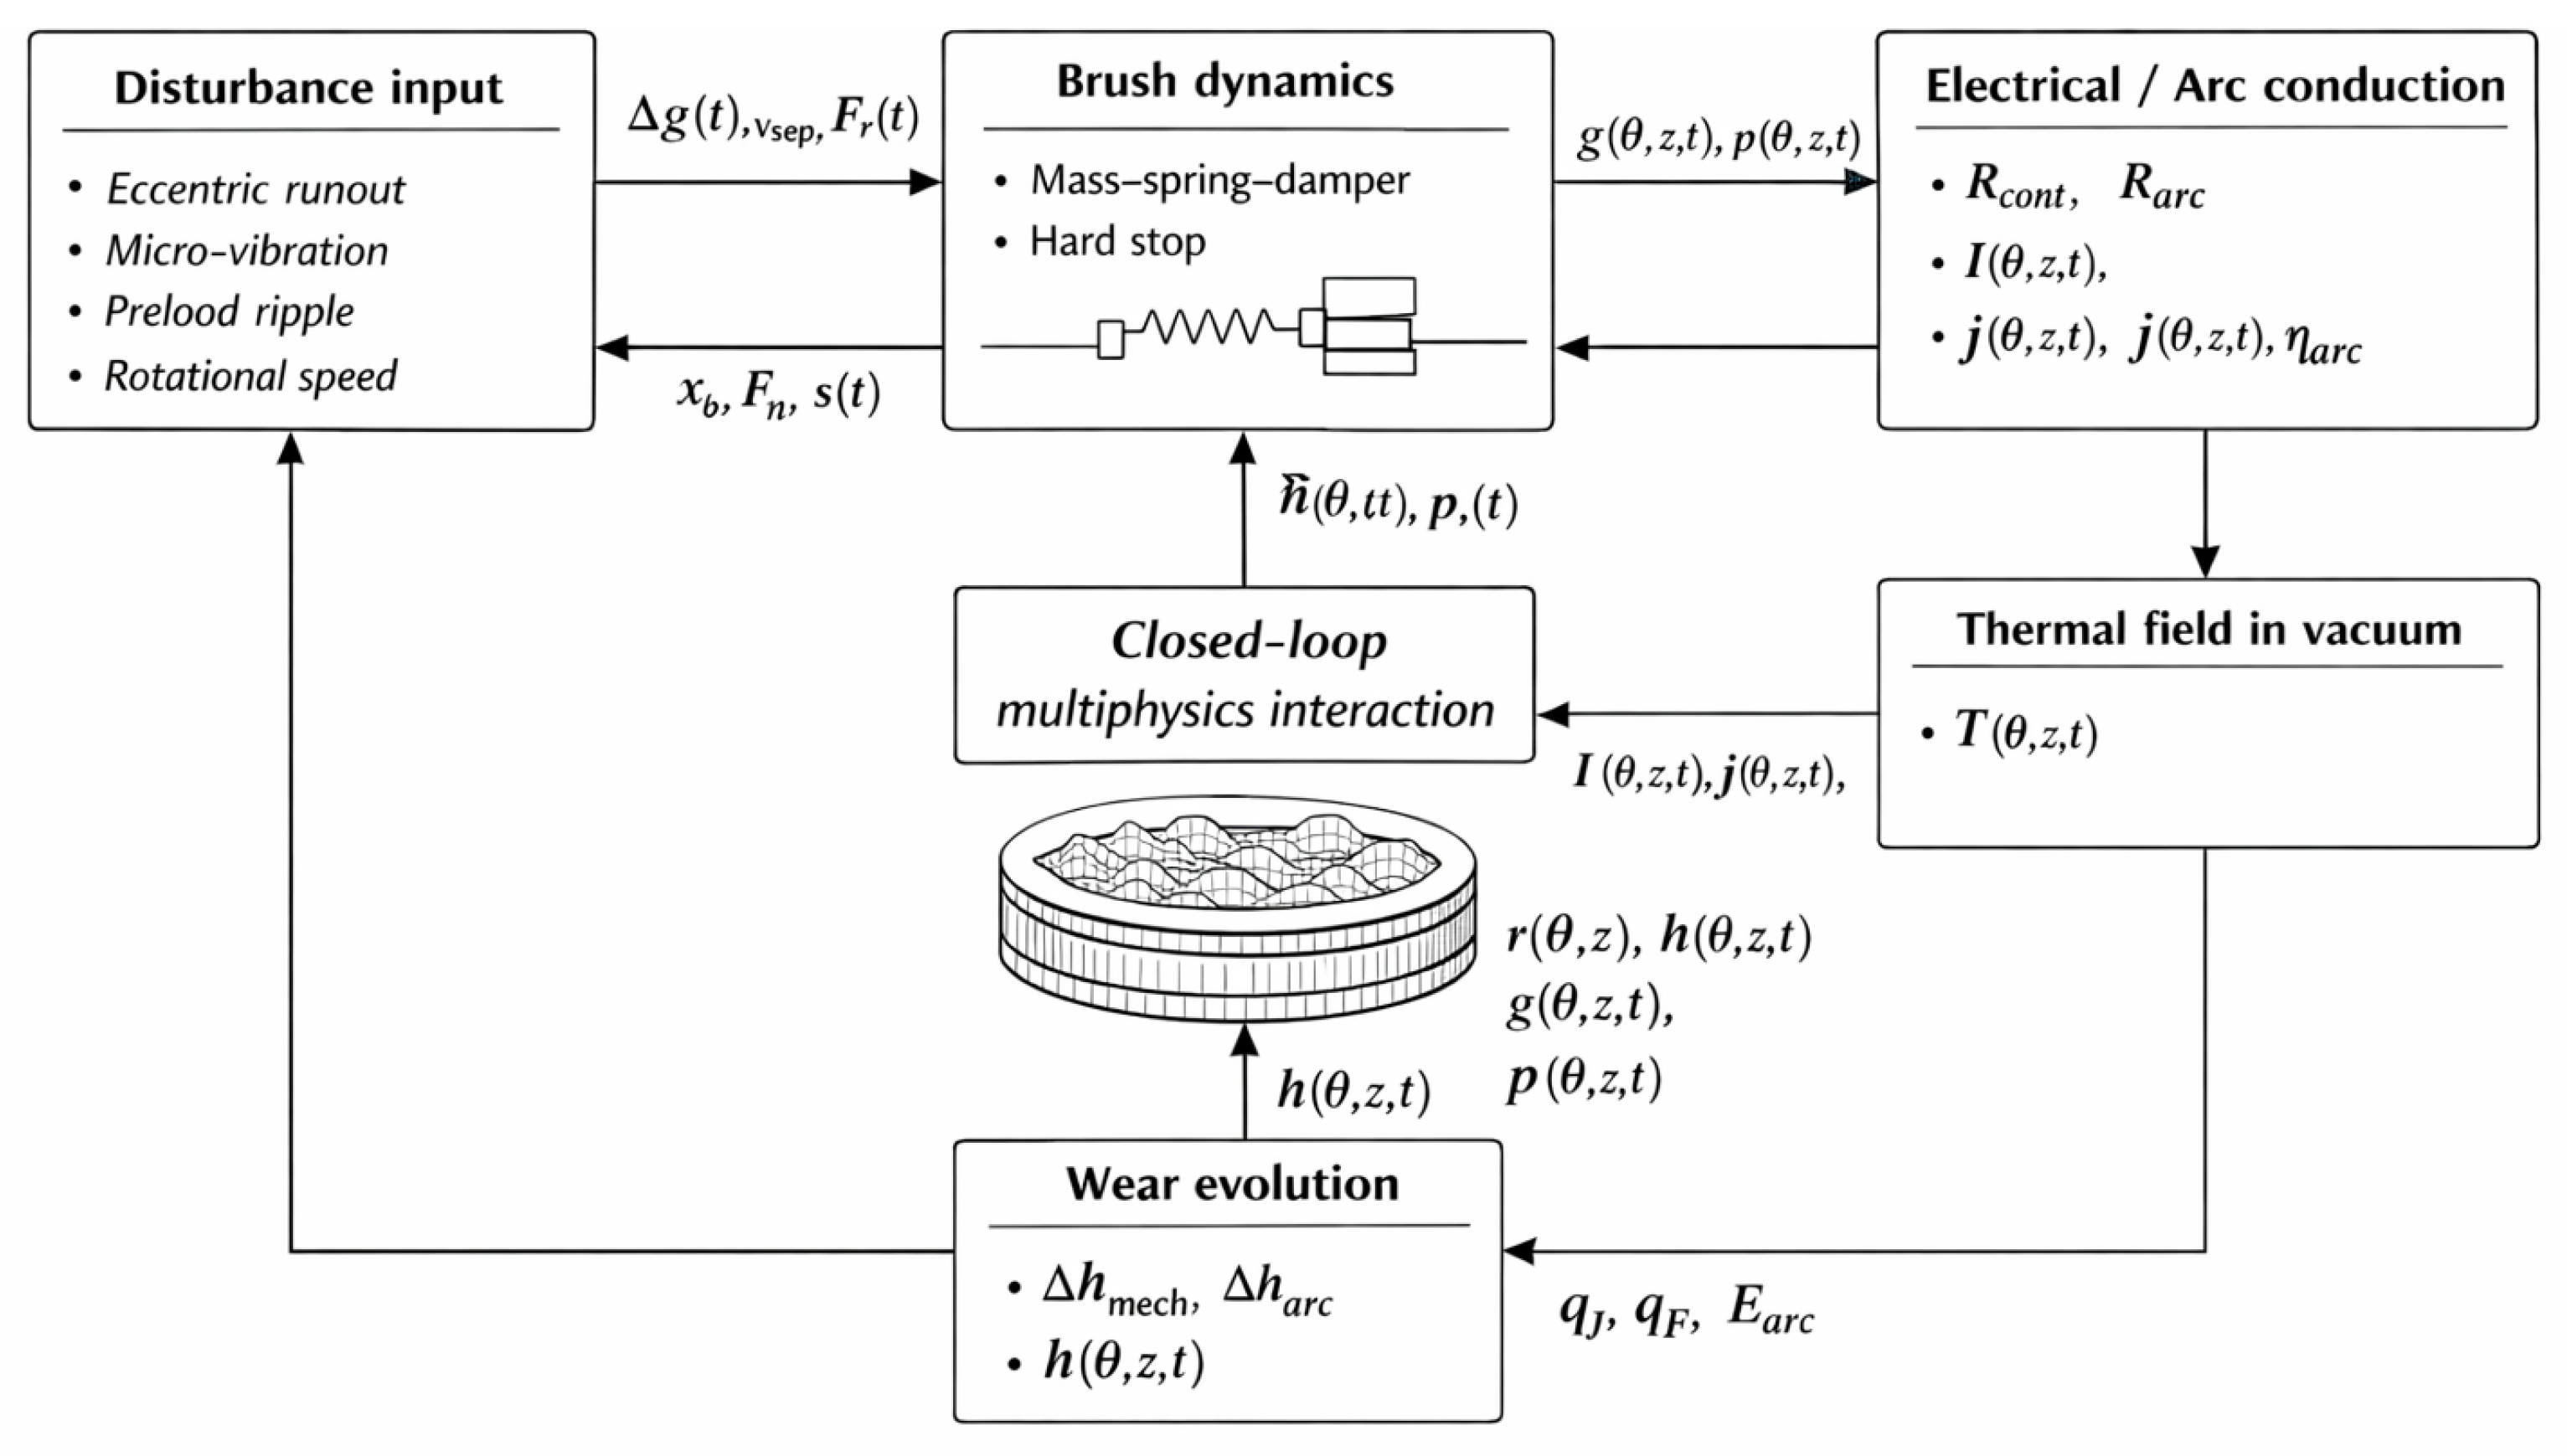
The slip-ring degradation problem is inherently coupled, as shown in Figure 3, and can be treated as a closed-loop interaction. This section summarizes the coupled mechanical–electrical–thermal–wear model consistent with the MATLAB 2025a implementation. Key variables are defined on each track i and surface point (θ, z). The detailed coupling relationships are summarized as follows:
  • Disturbance → separation: runout and vibration generate clearance modulation Δg(t), producing intermittent separations;
  • Separation + brush dynamics → contact localisation: brush normal dynamics determines whether the brush follows the disturbance or loses contact, thus shaping the gap g and pressure field p(θ, z, t);
  • Contact localisation → conduction localisation: p(θ, z, t) controls real contact area and G cont ( θ ,   z ,   t ) , thereby redistributing current density j(θ, z, t);
  • Local current + separation → arcing: when separation occurs and current density is sufficiently high, arcs will be ignited, adding G arc ( θ ,   z ,   t ) and intense local heating;
  • Electrical/friction/arc heating → thermal field: q J ( θ ,   z ,   t ) , q F ( θ ,   z ,   t ) , and q arc ( θ ,   z ,   t ) drive the temperature rise, while vacuum cooling is dominated by radiation (and optional hub conduction);
  • Thermal field → properties and wear: temperature affects resistivity and hardness (and thus changes wear coefficients), accelerating degradation;
  • Wear → geometry feedback: h(θ, z, t) modifies the local geometry and gap, changing future contact performance, conduction and arc eligibility.

2.2. Governing Formulations in the Coupling System

(1) Surface coordinates and state variables
For each slip-ring track iii, the contact surface is described on a cylindrical surface using the circumferential coordinate θ [ 0 , 2 π ) and the axial coordinate z [ W i / 2 , W i / 2 ] , where W i is the axial width of track i. The track radius is denoted by R i . The surface is discretized into cells of size Δ θ × Δ z , so that the area of one surface cell is
Δ A i = R i Δ θ Δ z
At each surface point Δ θ × Δ z and time t, the main field variables are: h i ( θ , z , t ) : wear depth; T i ( θ , z , t ) : surface temperature; p i ( θ , z , t ) : normal contact pressure; g i ( θ , z , t ) : local separation gap; I i ( θ , z , t ) : local current carried by the cell. In addition, the ring surface contains a prescribed roughness field r i ( θ , z ) , where r i is the asperity height relative to the mean surface.
(2) Runout and micro-vibration disturbance
The normal gap seen by brush b on track i is modulated by eccentric runout and micro-vibration. The runout-induced radial displacement is written as
Δ g i , b ( t ) = e i , 1 cos ( ω t + ϕ i , 1 θ b ) + e i , 2 cos ( 2 ( ω t + ϕ i , 2 θ b ) ) + A v , i sin ( 2 π f v , i t + ϕ v , i )
where e i , 1 is the first-harmonic runout amplitude of track i; e i , 2 is the second-harmonic runout amplitude; ω is the angular speed of the ring; ϕ i , 1 and ϕ i , 1 are the runout phases; θb is the circumferential location of brush b; Av,i is the micro-vibration amplitude; fv,i is the micro-vibration frequency; ϕv,i is the micro-vibration phase. The term −θb means that staggered brushes experience different phases of the same runout field. This disturbance enters the brush clearance and is a primary trigger for separation events that enable arc ignition in the event-based model.
(3) Brush normal dynamics with preload and constraints
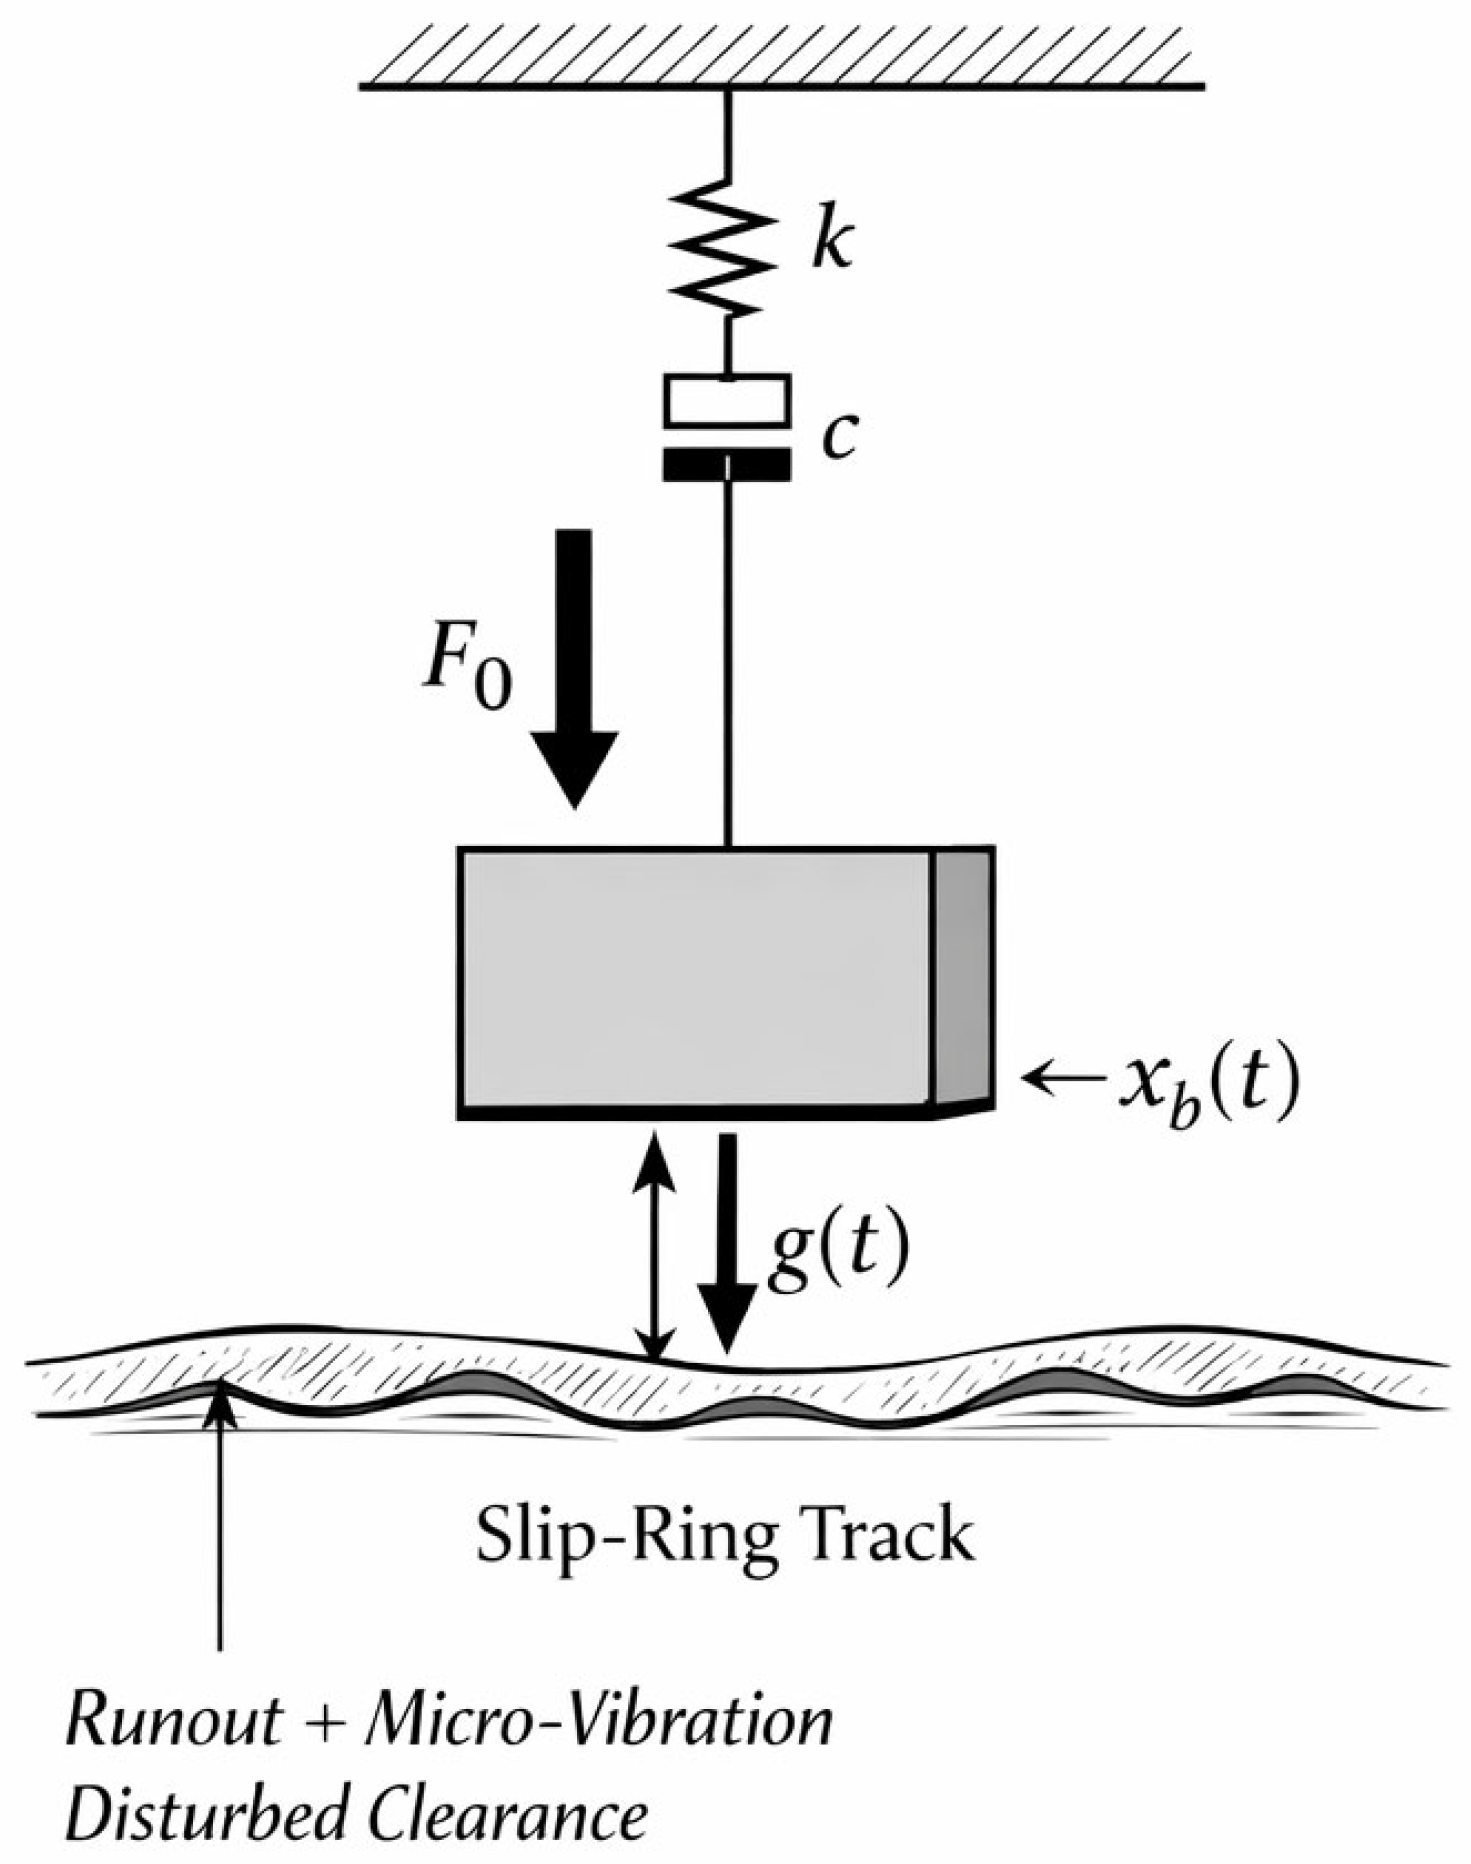
Each brush b is modelled as a single-DOF normal oscillator (Figure 4):
m b x ¨ b + c b x ˙ b + k b x b = F 0 , b + F r , b ( t ) F N , b ( t ) F stop , b ( t )
where m b , c b , k b are brush mass/damping/stiffness, F 0 , b is preload, F N , b ( t ) is contact reaction from the surface pressure field, and F stop , b ( t ) enforces stroke limits and prevents numerical divergence. The unilateral condition implies F N , b ( t ) 0   g b 0 and F N , b × g b = 0 . F r , b ( t ) is an optional external ripple term. The preload ripple is introduced to represent small periodic force modulation:
F r , b ( t ) = A F , b sin ( 2 π f F , b t + ϕ F , b )
where A F , b is the preload ripple amplitude; f F , b is the ripple frequency; ϕ F , b is the ripple phase.
(4) Effective separation and asperity interference
Let c 0 , i be the nominal mean clearance between brush b and track i in the undeformed state. The mean-plane separation for brush b is
s i , b ( t ) = c 0 , i x b ( t ) Δ g i , b ( t )
Because wear removes material from the ring surface, the local effective separation becomes
s i , b e f f ( θ , z , t ) = s i , b ( t ) + h i ( θ , z , t )
The local asperity interference is then defined as
δ i , b ( θ , z , t ) = max ( 0 , r i ( θ , z ) s i , b e f f ( θ , z , t ) )
Here, δ i , b is nonzero only when the asperity peak protrudes beyond the current local gap.
(5) Surface-resolved contact pressure
The local contact pressure is formulated using a Hertz-type asperity-interference relation. This treatment follows the classical rough-surface contact concept, in which local load is generated only when asperity interference occurs and the load–interference relation follows a nonlinear Hertzian form [42]. The local contact pressure generated by brush b is described by a Hertz-type interference law:
p i , b ( θ , z , t )   =   K c , i δ i , b ( θ , z , t ) 3 2 ,   0 p i , b p max , i
where K c , i is an equivalent contact stiffness parameter for track i, p max , i is a pressure cap introduced for numerical stability. If multiple brushes act on the same track, the total pressure is
p i ( θ , z , t ) = b B i p i , b ( θ , z , t )
where B i denotes the set of brushes contacting track i.
The normal reaction force on brush b is obtained by surface integration over its footprint Ωb:
F N , b ( t ) = Ω b p i , b ( θ , z , t )   d A ( θ m , z n ) Ω b p i , b m , n ( t ) Δ A i
(6) Local gap and contact-state indicators
The geometric gap between the brush mean plane and the rough surface is
g i , b ( θ , z , t ) = max ( 0 , s i , b e f f ( θ , z , t ) r i ( θ , z ) )
If more than one brush overlaps the same cell, the cell-level gap is taken as the minimum of all candidate gaps:
g i ( θ , z , t ) = min b B i   g i , b ( θ , z , t )
This definition reflects that the smallest local gap dominates contact recovery and arc susceptibility. To characterize contact quality, two ratios are commonly used in the simulation: the micro-contact ratio, defined as the fraction of footprint cells with p > 0; the effective contact ratio, defined as the fraction of time or cells satisfying a prescribed force or contact threshold.
(7) Electrical contact conduction
Regarding the temperature-dependent resistivity, the bulk resistivity of the conducting material depends on temperature:
ρ i ( T ) = ρ 0 , i 1 + α ρ , i ( T T 0 )
where ρ 0 , i is the resistivity at reference temperature T 0 ; α ρ , i is the temperature coefficient of resistivity. This relation allows the local electrical resistance to increase as the contact temperature rises. In electrical contacts, the actual current-carrying area is governed by microscopic contact spots rather than by the nominal brush footprint [24,29]. Regarding the pressure-dependent micro-contact radius, the equivalent micro-contact radius is expressed as
a i ( θ , z , t ) = a 0 , i p i ( θ , z , t ) p 0 , i 1 / 3
where a 0 , i is a reference contact radius; p 0 , i is a reference pressure. Regarding the constriction and film resistance, the constriction resistance is
R c , i ( θ , z , t ) = ρ i ( T i ) 2 a i ( θ , z , t )
In addition to constriction resistance, a film or interface resistance is introduced to account for surface films, contamination, and incomplete metallic contact. Since higher pressure generally improves the real contact condition and reduces interfacial resistance, the film resistance is expressed as a pressure-dependent phenomenological term:
R f , i ( θ , z , t ) = R f 0 , i Δ A i p i ( θ , z , t ) p 0 , i γ i
where R f 0 , i is the reference film area resistance; γ i controls pressure sensitivity. The local contact-channel resistance is
R c o n t , i ( θ , z , t ) = R c , i ( θ , z , t ) + R f , i ( θ , z , t )
If p i ( θ , z , t ) = 0 , the contact channel is treated as open and R c o n t , i = .
Thus, Equations (13)–(17) describe a local electrical contact model in which temperature affects the material resistivity, while contact pressure affects the effective micro-contact radius and film resistance.
(8) Arc conduction model
Previous studies on multi-contact electrical interfaces have shown that local separation gaps can trigger arc transfer and modify the equivalent interface resistance, leading to nonlinear and hysteretic electrical behavior [26]. In vacuum electrical contacts, arc initiation and erosion are also strongly related to local separation, current concentration, contact material, and surface condition [28]. Therefore, arcing is allowed only when a cell is separated but still sufficiently close, and when the local opening process satisfies the event criteria. In its simplest form, the arc eligibility condition is
g min , i g i ( θ , z , t ) g max , i ,   g ˙ i ( θ , z , t ) v sep , i m i n
where g min , i is the minimum arc-eligible gap; g max , i is the maximum arc-eligible gap; g ˙ i is the local opening velocity; v sep , i m i n is the minimum opening velocity for separation-triggered arcing. This condition represents the physical assumption that arc events are associated with transient opening rather than with fully closed contact or large, electrically inactive gaps [26]. The arc-channel resistance is modeled as
R a r c , i ( θ , z , t ) = R 0 , i + k g , i   g i ( θ , z , t )
where R 0 , i is the base arc resistance; k g , i is the gap sensitivity coefficient. Equation (19) provides a simplified electrical representation of the increased impedance of a longer arc path and allows local separation to be coupled with the equivalent electrical network. The gap-dependent form is consistent with the physical observation that vacuum arc characteristics, including arc voltage and resistance, are affected by the contact gap [43]. To represent rare-event arcing, a stochastic ignition model is used. The ignition probability over one time step Δt is
p i g n , i = 1 exp [ λ i ( g i , j i ) Δ t ]
where λ i ( g i , j i ) is the local ignition rate, typically increasing when the gap is smaller and the current density is larger. A convenient normalized form is
λ i ( g i , j i ) = λ 0 , i ( 1 g i * ) p g , i ( j i * ) p j , i
with
g i * = g i g min , i g max , i g min , i ,   j i * = j i j r e f , i
where λ 0 , i is the reference ignition rate, p j , i and p g , i are sensitivity exponents, j r e f , i is a reference current density. The dependence on g i and j i reflects the assumption that smaller separation gaps and stronger current concentration increase the likelihood of arc activation. This assumption is consistent with reported observations that vacuum arc ignition and erosion are strongly influenced by current conditions, material properties, and local contact state [44]. Equations (20)–(22) are introduced as a numerical closure for long-term wear simulation. They do not aim to describe detailed plasma formation, cathode spot dynamics, or arc-column evolution. Instead, they represent the increased probability of intermittent arc activation under small-gap, high-current-density, and opening-contact conditions.
(9) Parallel-admittance electrical network and current distribution
The local contact and arc admittances are
G c o n t , i ( θ , z , t ) = 1 R c o n t , i ( θ , z , t ) ,   G a r c , i ( θ , z , t ) = 1 R a r c , i ( θ , z , t )
The total local admittance is
G i ( θ , z , t ) = G c o n t , i ( θ , z , t ) +   G a r c , i ( θ , z , t )
The equivalent resistance of the whole track is obtained from all active cells in parallel:
R e q , i ( t ) = ( θ m , z n ) Ω i G i m , n ( t ) 1
where Ωi is the union of all active footprint cells on track i. For a commanded track current I c m d , i and bus voltage V bus , the effective current is limited by electrical compliance:
I e f f , i ( t ) = min I c m d , i , V b u s R e q , i ( t )
The local cell current is then distributed in proportion to admittance:
I i ( θ , z , t ) = I e f f , i ( t ) G i ( θ , z , t ) Ω i G i ( θ , z , t )
Finally, the local current density is
j i ( θ , z , t ) = | I i ( θ , z , t ) | Δ A i
(10) Thermal model under vacuum
Since convective cooling is absent in vacuum, heat removal is mainly represented by radiative cooling and optional conduction to the hub structure. This treatment is consistent with the thermal characteristics of vacuum electrical contacts and current-carrying sliding interfaces, where localized Joule heating, frictional heating, and arc-related thermal input may dominate the interface temperature rise [26,35]. The thermal problem is solved on the ring surface in the circumferential direction s i = R i θ and the axial direction z. The governing equation is
T i t = α i 2 T i s i 2 + 2 T i z 2 + q J , i + q F , i + q a r c , i q r a d , i q h u b , i C i a r e a
where: α i = k i / ( ρ i c p , i ) is the thermal diffusivity; k i is thermal conductivity; ρ i is density; c p , i is specific heat; C i a r e a = ρ i c p , i t eff , i is the area heat capacity; t eff , i is the effective thermal thickness. The heat-source terms are as follows:
The Joule heating can be expressed by
q J , i ( θ , z , t ) = I i ( θ , z , t ) 2 R e f f , i ( θ , z , t ) Δ A i
with
R e f f , i ( θ , z , t ) = 1 G i ( θ , z , t )
The frictional heating is
q F , i ( θ , z , t ) = μ i ( T i ) p i ( θ , z , t ) v i
where μ i ( T i ) is the temperature-dependent friction coefficient; v i   =   ω R i is the sliding speed.
The radiative cooling can be expressed by
q r a d , i = ϵ i σ T i 4 T r e f , i 4
where ϵ i is emissivity; σ is the Stefan–Boltzmann constant; T ref , i is the radiation sink temperature.
The Hub conduction sink is
q h u b , i = h c , i T i T hub , i
where h c , i is an effective hub-conduction coefficient; T hub , i is the hub reference temperature.
(11) Mechanical wear and electrically assisted erosive wear
The mechanical wear component is formulated based on the classical Archard sliding-wear relation, in which the wear volume is commonly assumed to be proportional to the normal load and sliding distance and inversely related to the material hardness [45]. In the present surface-resolved formulation, the normal load is represented by the local contact pressure acting on a surface cell, and the sliding distance during one time step is v i t . To account for thermal softening at elevated temperature, the hardness is treated as a temperature-dependent quantity. Similar modifications have been introduced in Archard-type wear models by replacing constant hardness with temperature- or time-dependent hardness to improve high-temperature wear prediction [46]. Therefore, the mechanical wear increment is written in local depth form as:
Δ h m e c h , i ( θ , z , t ) = k w , i ( T i ) p i ( θ , z , t ) H i ( T i ) v i Δ t
where k w , i ( T i ) is the wear coefficient; H i ( T i ) is the temperature-dependent hardness of the worn material. In the present model, H i ( T i ) represents the reduction in material resistance to plastic deformation caused by thermal softening. When material-specific high-temperature hardness data are available, H i ( T i ) can be calibrated from experiments; otherwise, it may be treated as an engineering softening function with a prescribed lower-bound hardness to avoid nonphysical values. The temperature dependence of the wear coefficient is modeled as
k w , i ( T i ) = k w 0 , i 1 + β w , i ( T i T 0 )
where k w 0 , i is the reference wear coefficient; β w , i is its temperature sensitivity. As for the electrically assisted/arc erosive wear, the fraction of local electrical dissipation flowing through the arc channel is
η a r c , i ( θ , z , t ) = G a r c , i ( θ , z , t ) G i ( θ , z , t )
The local electrical energy dissipated during one time step is
E i ( θ , z , t ) = I i ( θ , z , t ) 2 R e f f , i ( θ , z , t ) Δ t
The arc-attributed energy is
E a r c , i ( θ , z , t ) = η a r c , i ( θ , z , t )   E i ( θ , z , t )
A severity weighting is used to reflect the fact that erosive arc damage increases with current density and gap:
w i ( θ , z , t ) = min w max , j i ( θ , z , t ) j r e f , i c g , i + g i ( θ , z , t ) g m a x , i
where w max is a cap on current-density weighting; j r e f , i is the reference current density; g m a x , i is a gap-weight offset. The arc erosive wear volume is then
Δ V a r c , i ( θ , z , t ) = k a r c , i η e f f , i w i ( θ , z , t ) E a r c , i ( θ , z , t )
where k a r c , i is the arc erosion coefficient; η e f f , i is the fraction of arc energy converted into material removal. The corresponding wear depth increment is
Δ h a r c , i ( θ , z , t ) = Δ V a r c , i ( θ , z , t ) Δ A i
Therefore, total wear evolution is
h i ( θ , z , t + Δ t ) = h i ( θ , z , t ) + Δ h m e c h , i ( θ , z , t ) + Δ h a r c , i ( θ , z , t )

3. FAST–MACRO Multiscale Strategy

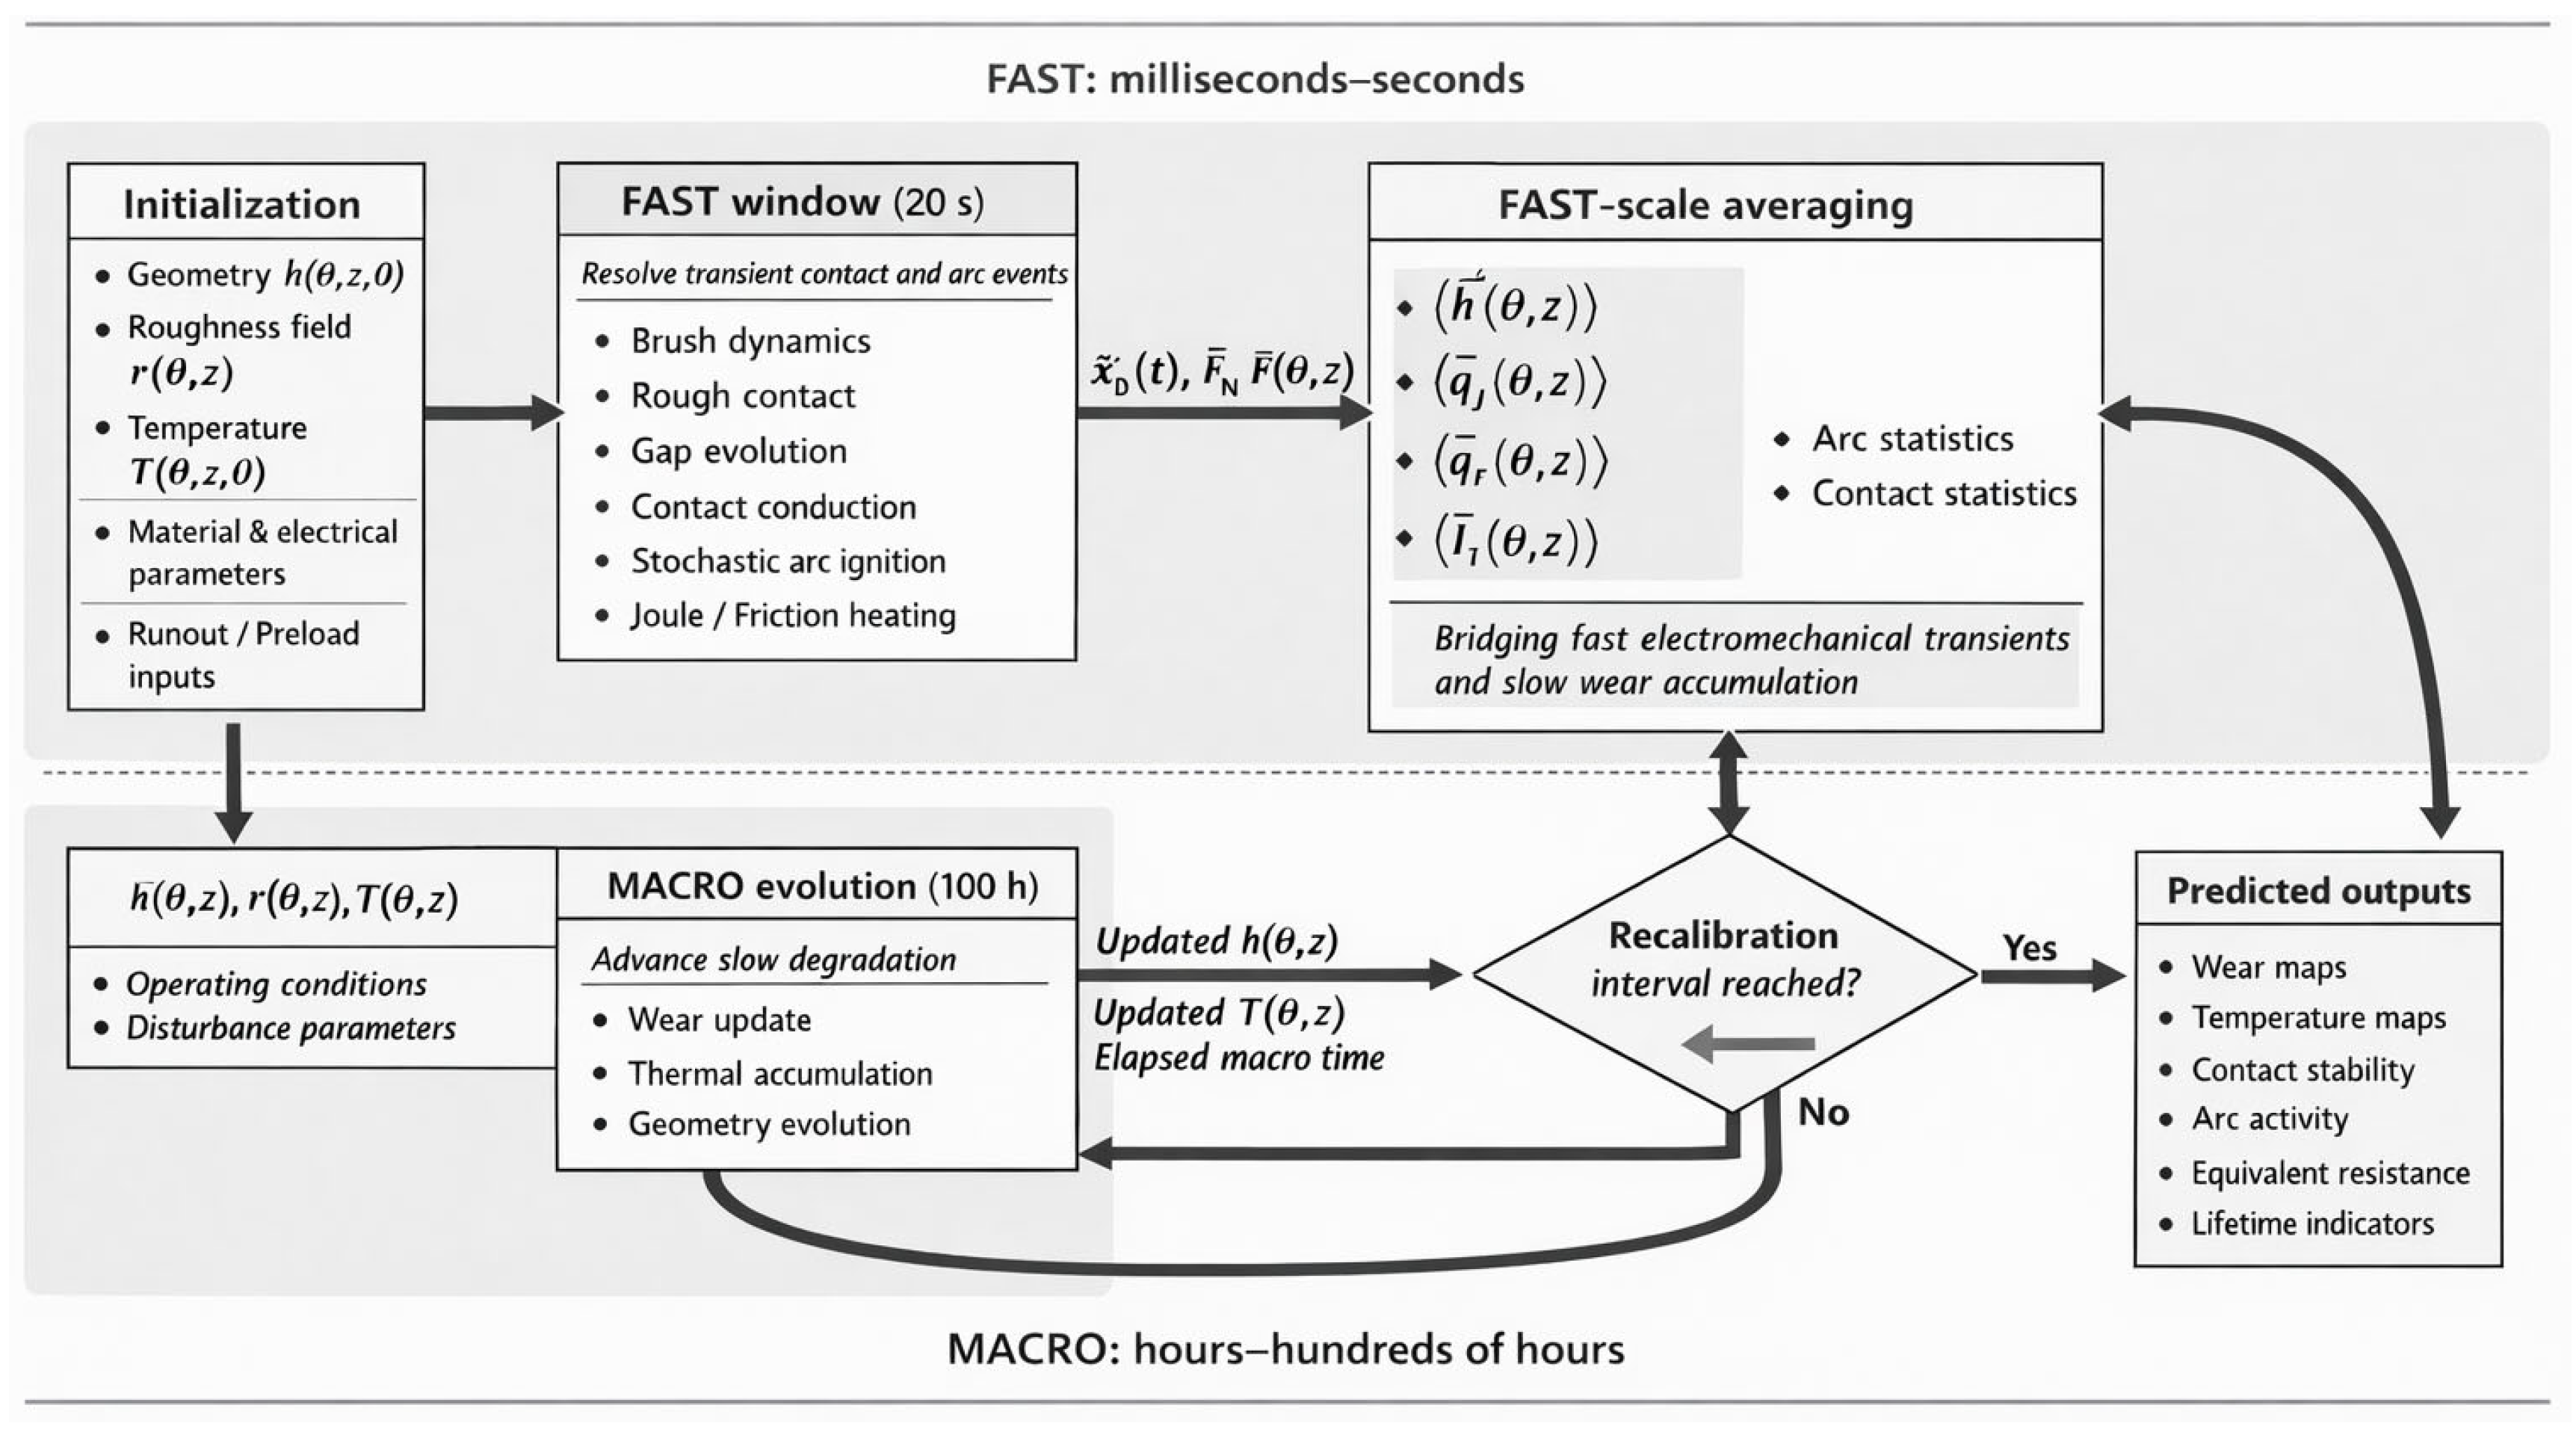
The coupled slip ring–brush problem inherently involves strongly separated time scales. On the one hand, brush vibration, contact opening/closure, current redistribution, and stochastic arc ignition evolve on the order of microseconds to seconds. On the other hand, wear accumulation and geometry evolution occur over tens to hundreds of hours. Direct time integration of the full electromechanical-thermal-wear system over the entire service horizon with the smallest stable time step would therefore be computationally prohibitive. To address this difficulty, a two-timescale FAST–MACRO strategy (as shown in Figure 5) is adopted.
The numerical simulation was implemented in MATLAB. The simulation procedure consists of initialization, FAST-scale transient calculation, MACRO-scale wear update, and periodic recalibration. First, the surface roughness, initial wear depth, temperature field, brush positions, and operating parameters are initialized on the ( θ z ) surface grid. During each FAST window, the brush normal dynamics, local gap, asperity interference, contact pressure, electrical admittance, current distribution, stochastic arc ignition, heat generation, and instantaneous wear increment are updated sequentially with a time step of 1 ms. The FAST-window averaged wear-rate and heat-source fields are then transferred to the MACRO stage to advance the long-term wear and temperature evolution. The FAST simulation is periodically re-executed using the updated surface geometry to recalibrate the contact, electrical, thermal, and wear fields.
The motivation for the timescale separation is to let Δ t f denote the small time step required to resolve dynamic contact and arc events. In the present model, Δ t f is selected to capture: the normal vibration of the brush, the runout- and micro-vibration-induced gap modulation, the intermittent transition between contact conduction and arc conduction, the short-time variation in Joule and frictional heat generation. If such a step size were used over the full wear horizon T M , the total number of steps would be approximately T M / Δ t f , which is far beyond practical computational limits for parametric studies. However, the wear field h ( θ , z , t ) changes only slightly during one short dynamic window. This observation motivates a multiscale decomposition in which the fast contact and electrical processes are resolved over a short window, while the slow wear evolution is advanced using averaged quantities.
(1) FAST Window
In the FAST scale, the full coupled model is solved over a short time interval T f , typically chosen to cover multiple revolutions of the ring and enough disturbance cycles to obtain statistically stable contact and arc behavior. In the present study, the FAST window is
T f = 20   s
Within this window, the model resolves: brush dynamics; rough-surface interference contact; local gap evolution; pressure-dependent contact conduction; stochastic arc ignition and extinction; current redistribution; transient heat generation. At the end of the FAST simulation, the following surface-resolved averaged quantities are extracted for each track iii:
h ˙ i ( θ , z ) = 1 T f t 0 t 0 + T f h ˙ i ( θ , z , t )   d t
q J , i ( θ , z ) = 1 T f t 0 t 0 + T f q J , i ( θ , z , t ) d t
q F , i ( θ , z ) = 1 T f t 0 t 0 + T f q F , i ( θ , z , t )   d t
where h ˙ i ( θ , z , t ) is the instantaneous total wear rate; q J , i is the local Joule heat flux; q F , i is the local frictional heat flux. These averaged fields serve as effective slow-scale inputs to the MACRO evolution.
(2) MACRO Evolution
On the MACRO scale, the wear field is updated using the averaged wear rate obtained from the FAST window. For a macro time step Δ t M , the geometry update is written as
h i n + 1 ( θ , z ) = h i n ( θ , z ) + h ˙ i ( θ , z ) Δ t M
where h i n ( θ , z ) is the wear depth at macro step n; h i n + 1 ( θ , z ) is the updated wear depth after one macro increment. In the present implementation, the total simulation horizon is 100 h, while the macro step is much larger than the FAST time step. The MACRO step is therefore used to evolve only the slow variables, primarily: the wear depth h i ( θ , z ) , and the long-term temperature trend T i ( θ , z ) , if thermal accumulation is retained. The thermal field in the MACRO stage is advanced using the averaged heat sources,
q i ( θ , z ) = q J , i ( θ , z ) + q F , i ( θ , z )
so that the temperature evolution remains consistent with the local energetic loading accumulated during the FAST stage.
(3) Periodic Recalibration
A key assumption of the multiscale strategy is that the contact state does not change drastically within one macro step. This assumption is valid only if the wear increment during that interval is sufficiently small. To preserve accuracy, the FAST simulation is periodically re-executed using the updated geometry h i ( θ , z ) . This recalibration updates: the local contact pressure distribution, the gap field, the current density distribution, the arc statistics, the averaged heat and wear source terms.
If T recal denotes the recalibration interval, the algorithm proceeds as follows:
Step 1. initialize geometry, temperature, and rough surface state;
Step 2. run one FAST simulation over Tf;
Step 3. compute h ˙ i , q J , i , and q F , i ;
Step 4. advance the MACRO model over Trecal using Equations (48) and (49);
Step 5. update the worn geometry and repeat the FAST simulation on the new surface;
Step 6. continue until the target service horizon is reached.
This periodic recalibration ensures that the evolving wear topography continuously feeds back into the fast electromechanical processes, thereby maintaining the closed-loop nature of the model.

4. Simulation Case Suite and Metrics

The overall simulation procedure is introduced in this section together with the case suite and evaluation metrics. First, the geometric parameters and operating conditions of the slip-ring system are defined, including the ring radius, brush width, sliding speed, current, contact force, and eccentric runout amplitude. Based on these inputs, the surface-resolved contact pressure distribution is calculated under different eccentric runout conditions. The pressure-dependent electrical contact model is then used to determine the local current distribution and contact resistance. Subsequently, the mechanical and electrical responses are coupled with the thermal model to obtain the temperature field at the sliding interface. Finally, the local mechanical wear and electrically assisted erosive wear are evaluated according to the calculated pressure, current density, temperature, and sliding distance. The resulting output variables, including contact pressure, current density, temperature rise, and wear depth, are then analyzed and discussed in Section 5.
Table 1 lists the baseline parameter set used in the present study, and these values were selected to represent a high-reliability satellite slip-ring operating condition rather than a single proprietary hardware design. The chosen bus voltage, current levels, ring geometry, preload, roughness amplitude, runout harmonics, and thermal boundary parameters place the system in a physically meaningful regime characterized by stable current transfer, rare but non-zero arc activity, and measurable wear accumulation over the 100 h horizon. Accordingly, the baseline case serves as a controlled reference state from which the influence of geometric disturbance and contact force can be separated without introducing unnecessary parameter coupling.
Table 2 summarizes the exact simulation case suite used to interrogate the coupled effects of geometric disturbance and contact force. In the runout sweep, the first-harmonic runout, second-harmonic runout, and micro-vibration amplitude were varied together as (e1, e2, Av) = (4, 1.5, 0.5), (8, 2.5, 1.5), (12, 4, 3), (16, 5, 4), (20, 7, 5), (24, 8, 6), and (30, 10, 8) µm, while the preload P0 was fixed at 36 N. In the preload sweep, the preload was varied as 28, 32, 36, 40, 44, 48, and 52 N, while the geometric excitation was fixed at the baseline values e1 = 12 µm, e2 = 4 µm, and Av = 3 µm. In addition, an optional runout–preload interaction grid was defined using runout scale factors s = 0.50, 0.75, 1.00, 1.25, and 1.50 together with preload levels P0 = 28, 34, 40, 46, and 52 N, corresponding to e1 = 12s µm, e2 = 4s µm, and Av = 3s µm.

5. Results and Discussion

5.1. Baseline Wear Evolution and Track-Wise Degradation Mechanism

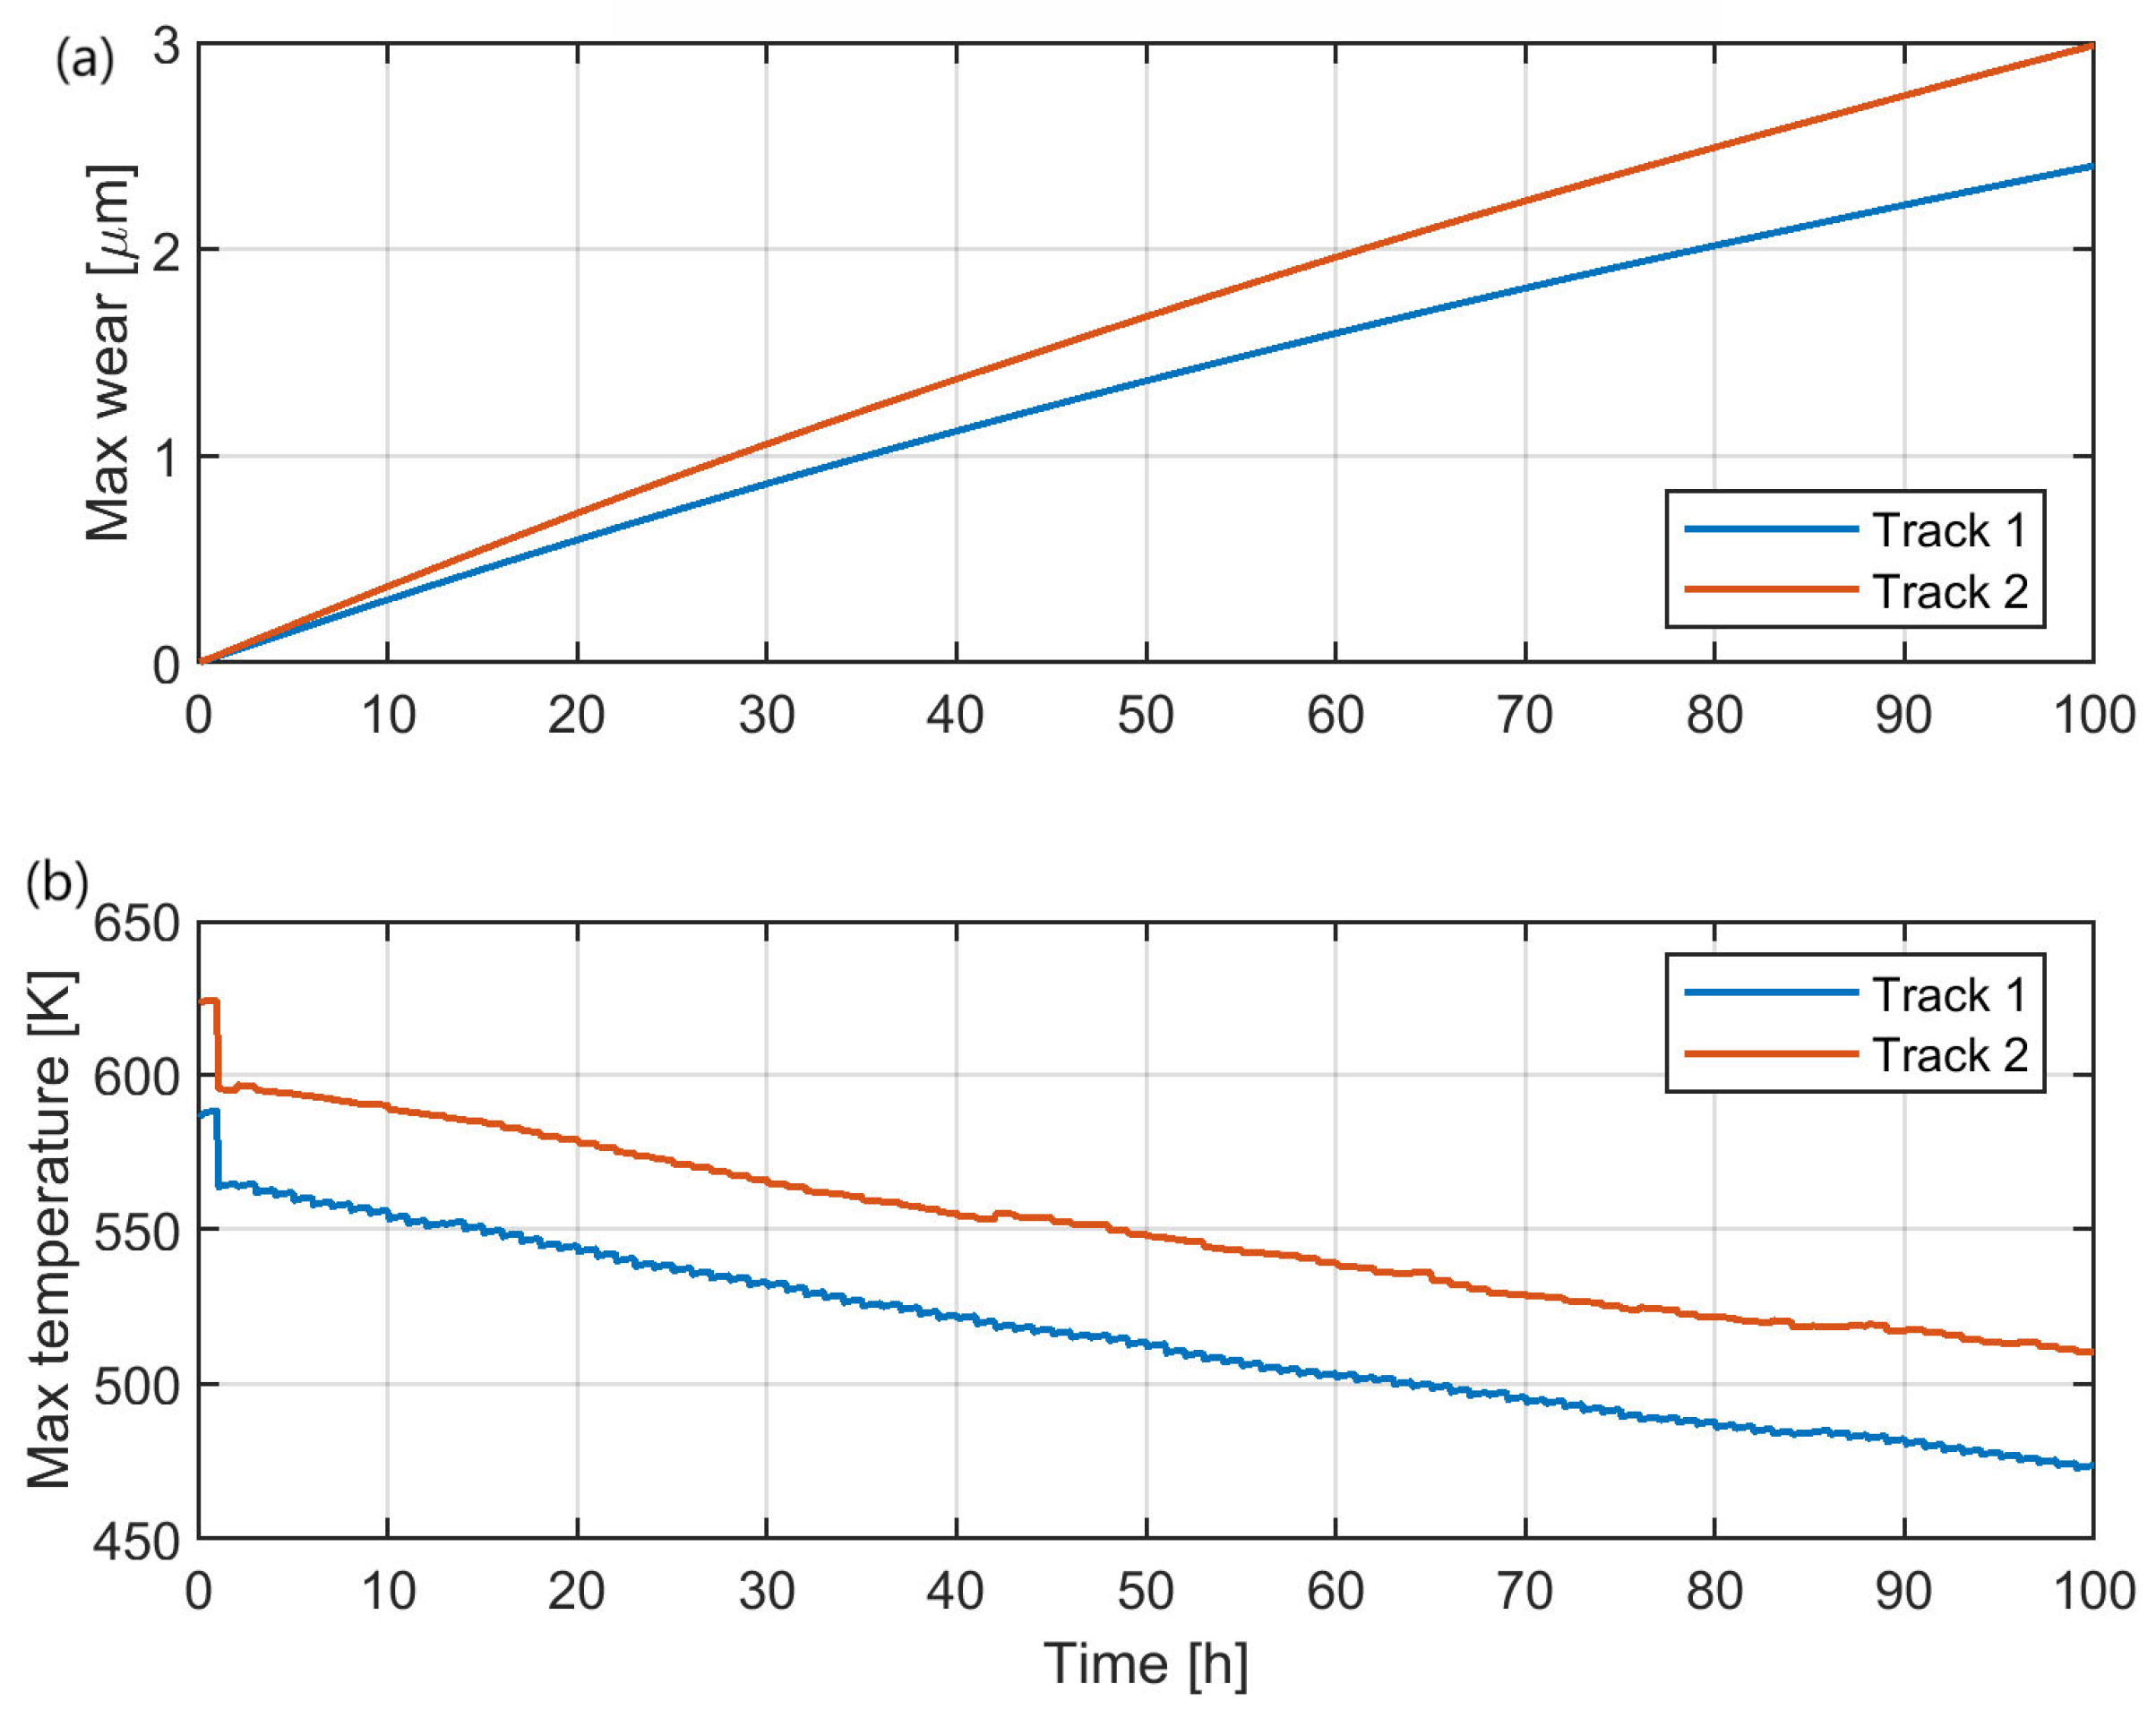
To clarify the degradation characteristics under the reference operating condition, the baseline evolution of wear, temperature, contact state, and energy dissipation is first examined. Figure 6 presents the baseline evolution of the maximum wear depth and maximum temperature for the two tracks. As shown in Figure 6a, wear increases progressively over the entire 100 h period, but the two tracks do not evolve in the same manner. Track 2 accumulates more wear than Track 1 and reaches about 3 μm after 100 h, whereas the wear depth of Track 1 remains noticeably lower. This difference indicates that the two tracks cannot be regarded as simple repetitions of an identical contact condition, even though they are part of the same SADA slip-ring assembly.
Figure 6b shows that the temperature histories also differ systematically. In both tracks, the temperature rises at the beginning and then gradually decreases rather than diverging, suggesting that the interface remains in a bounded weak-arc regime instead of developing into runaway discharge. The gradual cooling accompanied by continued wear accumulation implies a running-in process, during which the contact patches, heat partition, and local geometry progressively adjust under long-term sliding.
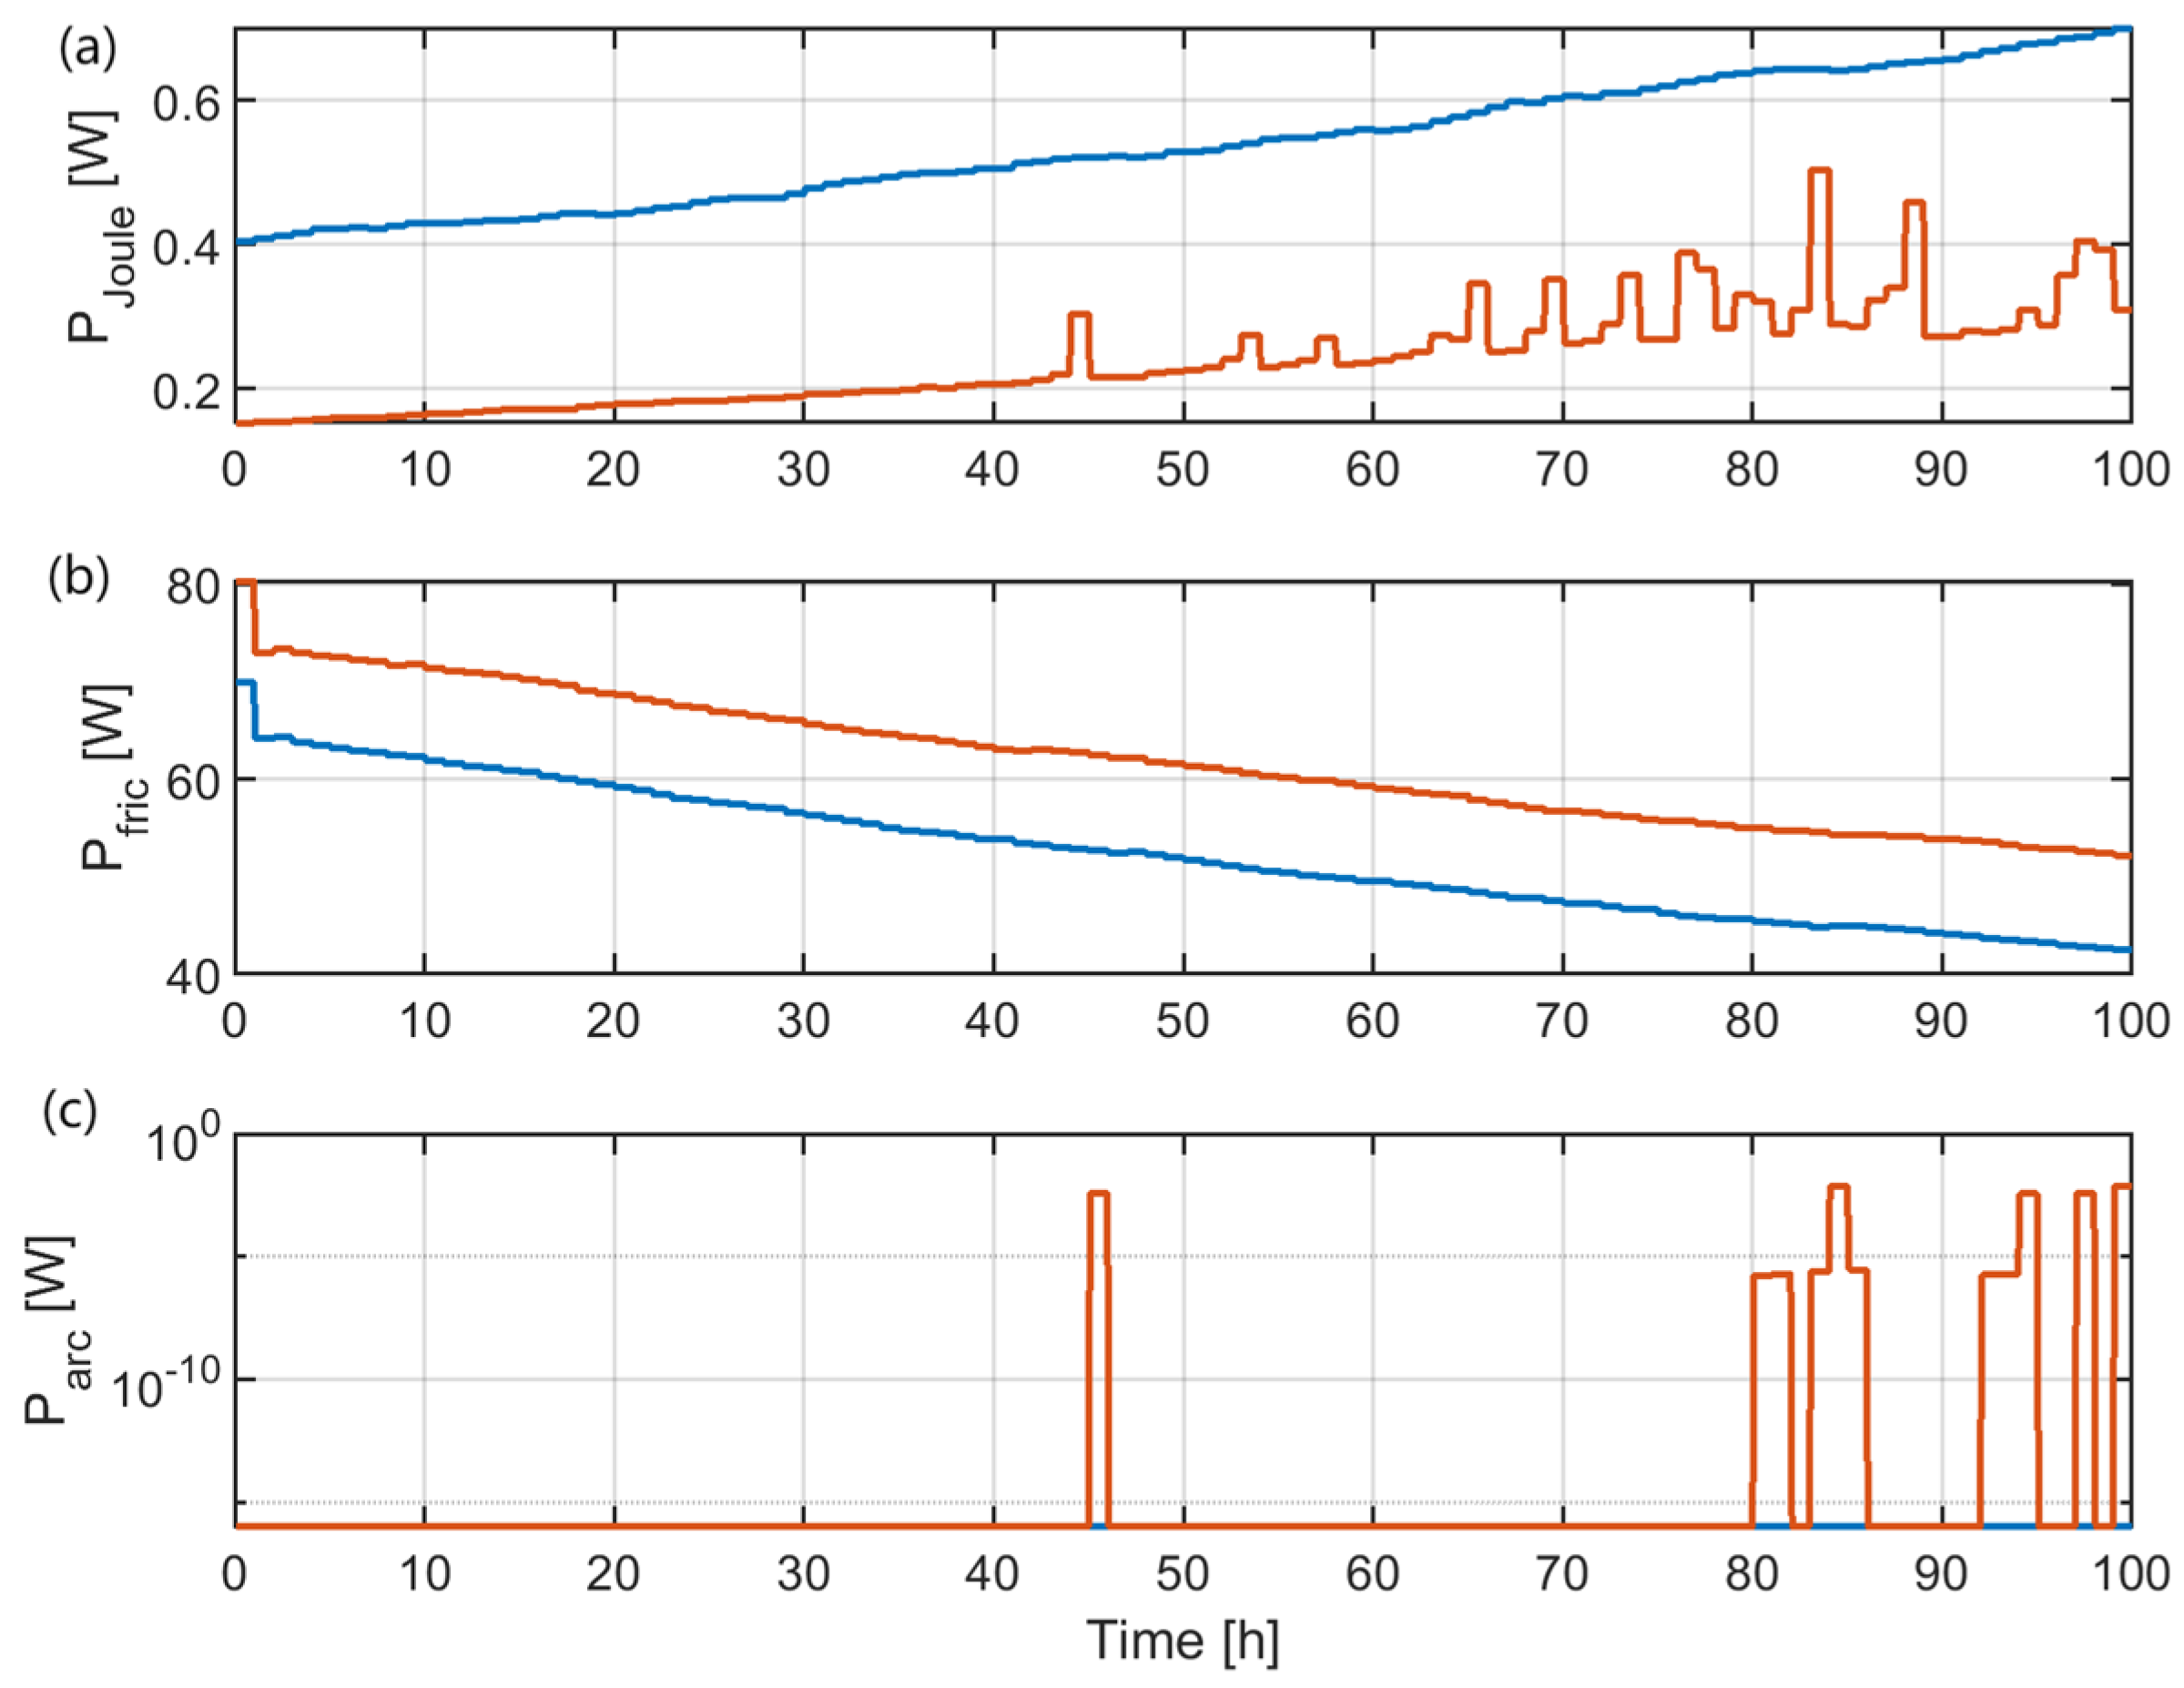
The energetic origin of this difference is illustrated in Figure 7. As shown in Figure 7a, Track 1 sustains the larger Joule heating budget over most of the simulation, indicating stronger continuous electrical conduction. By contrast, Figure 7b shows that Track 2 experiences the higher frictional power throughout the 100 h period. Therefore, from the perspective of average energy input, the track with greater electrical loading is not the one with greater mechanical dissipation.
Figure 7c further reveals the intermittent nature of the electrical contribution. Arc power remains negligible for most of the operation, but repeated spikes appear in Track 2 during the later stage, whereas Track 1 stays close to the baseline level. This suggests that the larger final wear of Track 2 cannot be explained by Joule heating alone. Instead, it is more reasonably attributed to the combination of a higher mechanical wear budget and more frequent localized electrical amplification events. In other words, the overall wear tendency is primarily controlled by mechanical sliding, whereas electrical intermittency determines where damage becomes concentrated and how rapidly local degradation accelerates once separation occurs.
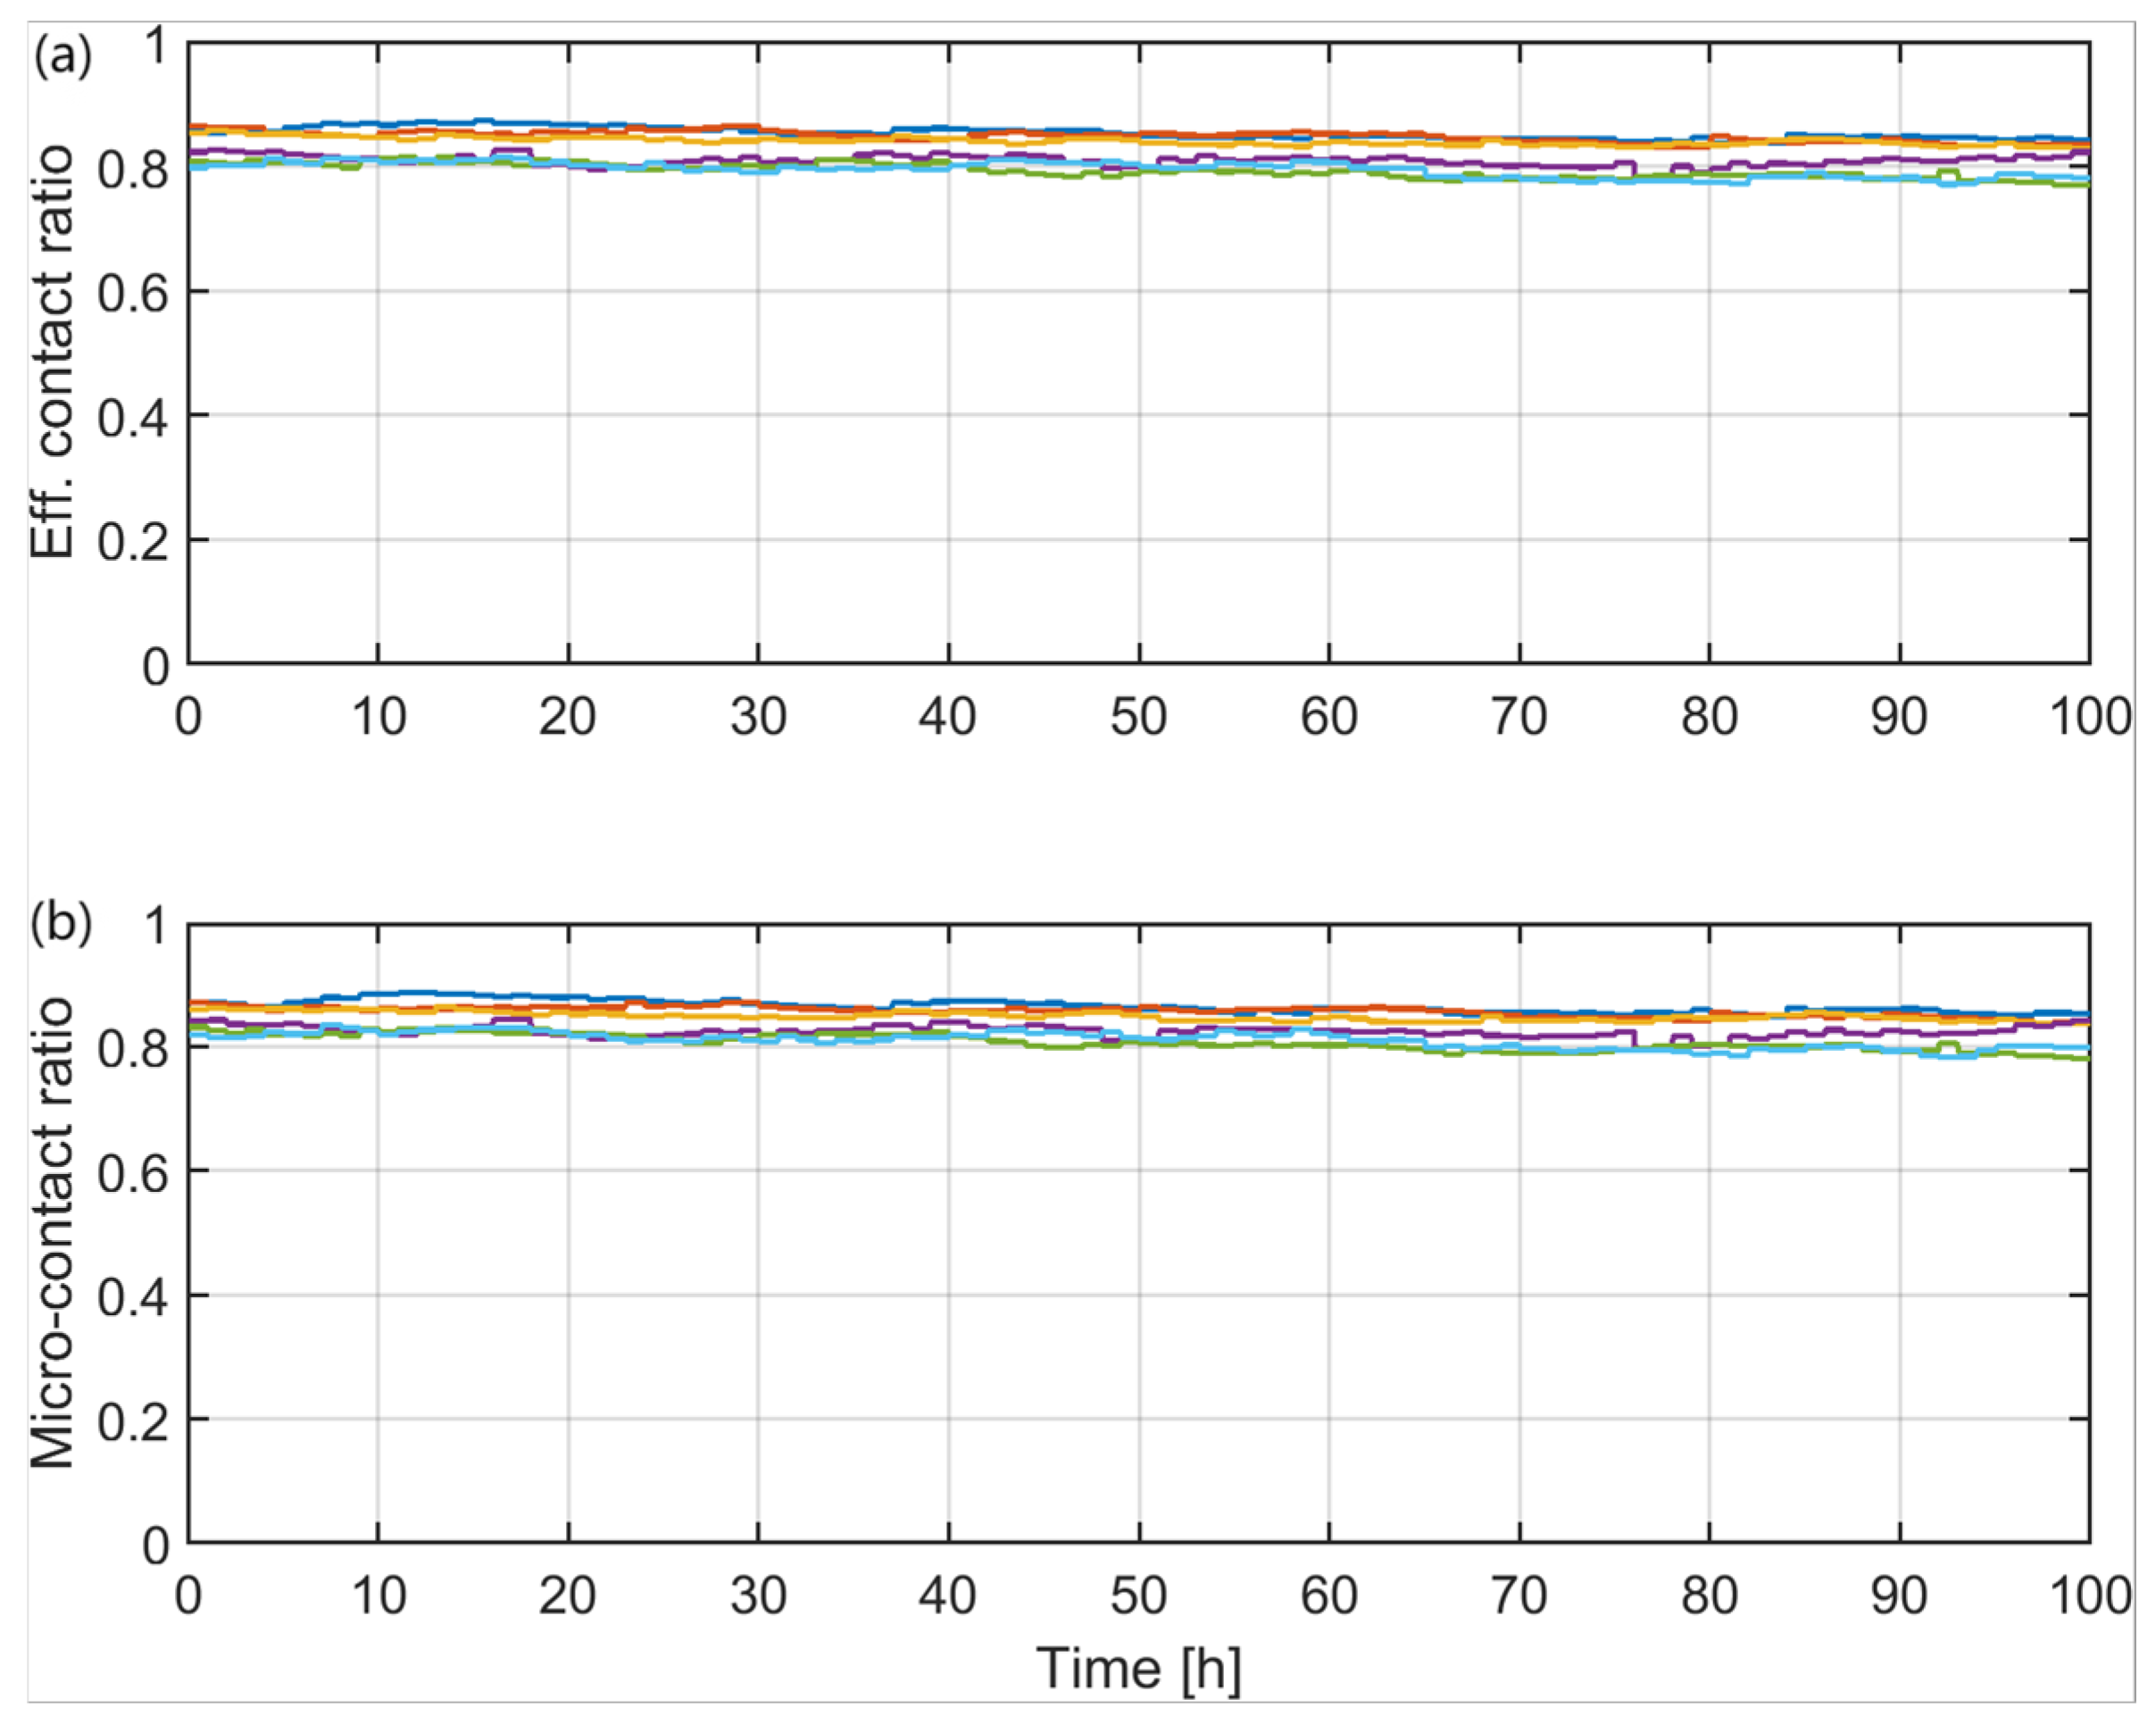
The contact-state histories in Figure 8 provide further support for this interpretation. Both the effective contact ratio and the micro-contact ratio remain well above zero throughout the simulation, indicating that the system does not enter a persistent open-gap state. However, neither ratio remains close to unity. Instead, both tracks undergo repeated local contact loss and recovery during operation. The averaged contact ratios show only minor differences between the two tracks, suggesting that the more severe degradation of Track 2 is not caused by a complete breakdown of contact, but rather by repeated local instabilities whose cumulative effects are gradually manifested through higher frictional loading and intermittent arc spikes.
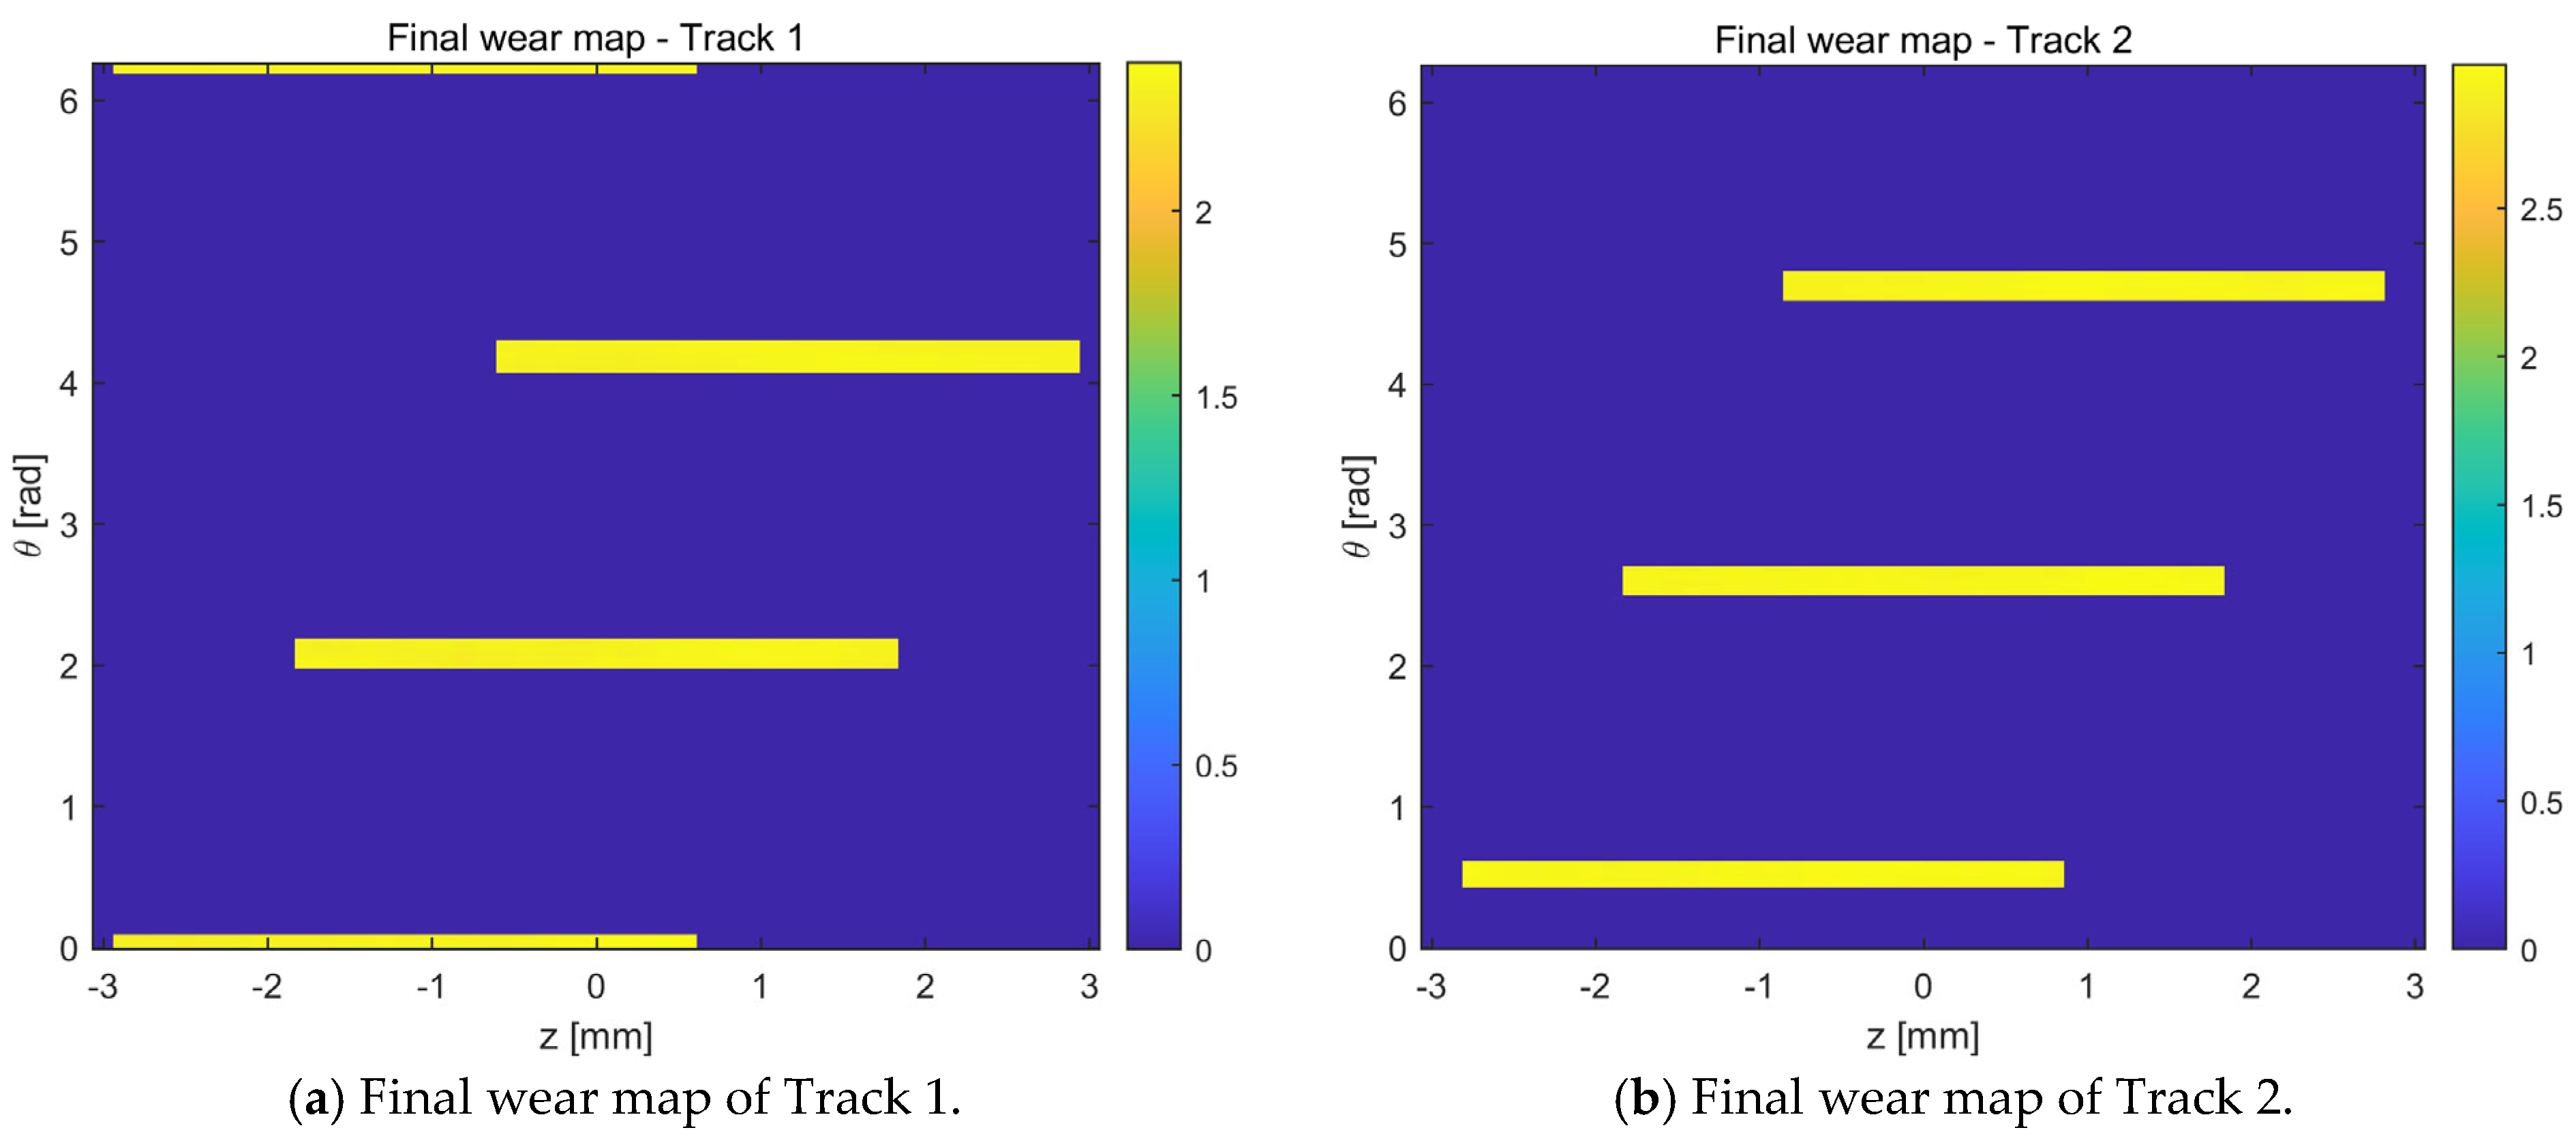
The final spatial distributions in Figure 9 make the above mechanism visible. Figure 9a shows the final wear map for Track 1, while Figure 9b shows the corresponding map for Track 2. The predicted wear distribution shows spatial localization in discrete circumferential bands associated with the repeated brush footprints, suggesting that the degradation process may exhibit surface-resolved characteristics under the assumed operating conditions. More importantly, Track 2 reaches a higher local wear level than Track 1, consistent with the time-history evidence in Figure 6 and Figure 7.
Taken together, the simulation results in Figure 6, Figure 7, Figure 8 and Figure 9 suggest that the baseline operating point belongs to a high-reliability weak-arc regime: wear remains bounded, temperature remains controlled, contact is intermittent but not unstable, and arc activity is rare rather than persistent. At the same time, the results clearly demonstrate that the degradation mechanism is not purely mechanical and not purely electrical. Mechanical sliding sets the average wear budget, while electrical intermittency acts as a localization and amplification mechanism.
It should be noted that the wear maps in Figure 9 are theoretical morphology predictions obtained from the proposed numerical model. Since direct experimental validation using profilometer measurements, SEM observations, or EDX surface mapping has not yet been conducted in the present study, these maps should be interpreted as qualitative and mechanistic predictions of surface-resolved wear localization rather than as experimentally validated wear morphologies. Therefore, the results are used mainly to reveal the relative difference between tracks and the possible spatial localization tendency of wear under the assumed operating conditions.

5.2. Detailed Effect of Runout on Wear Evolution and Contact Performance

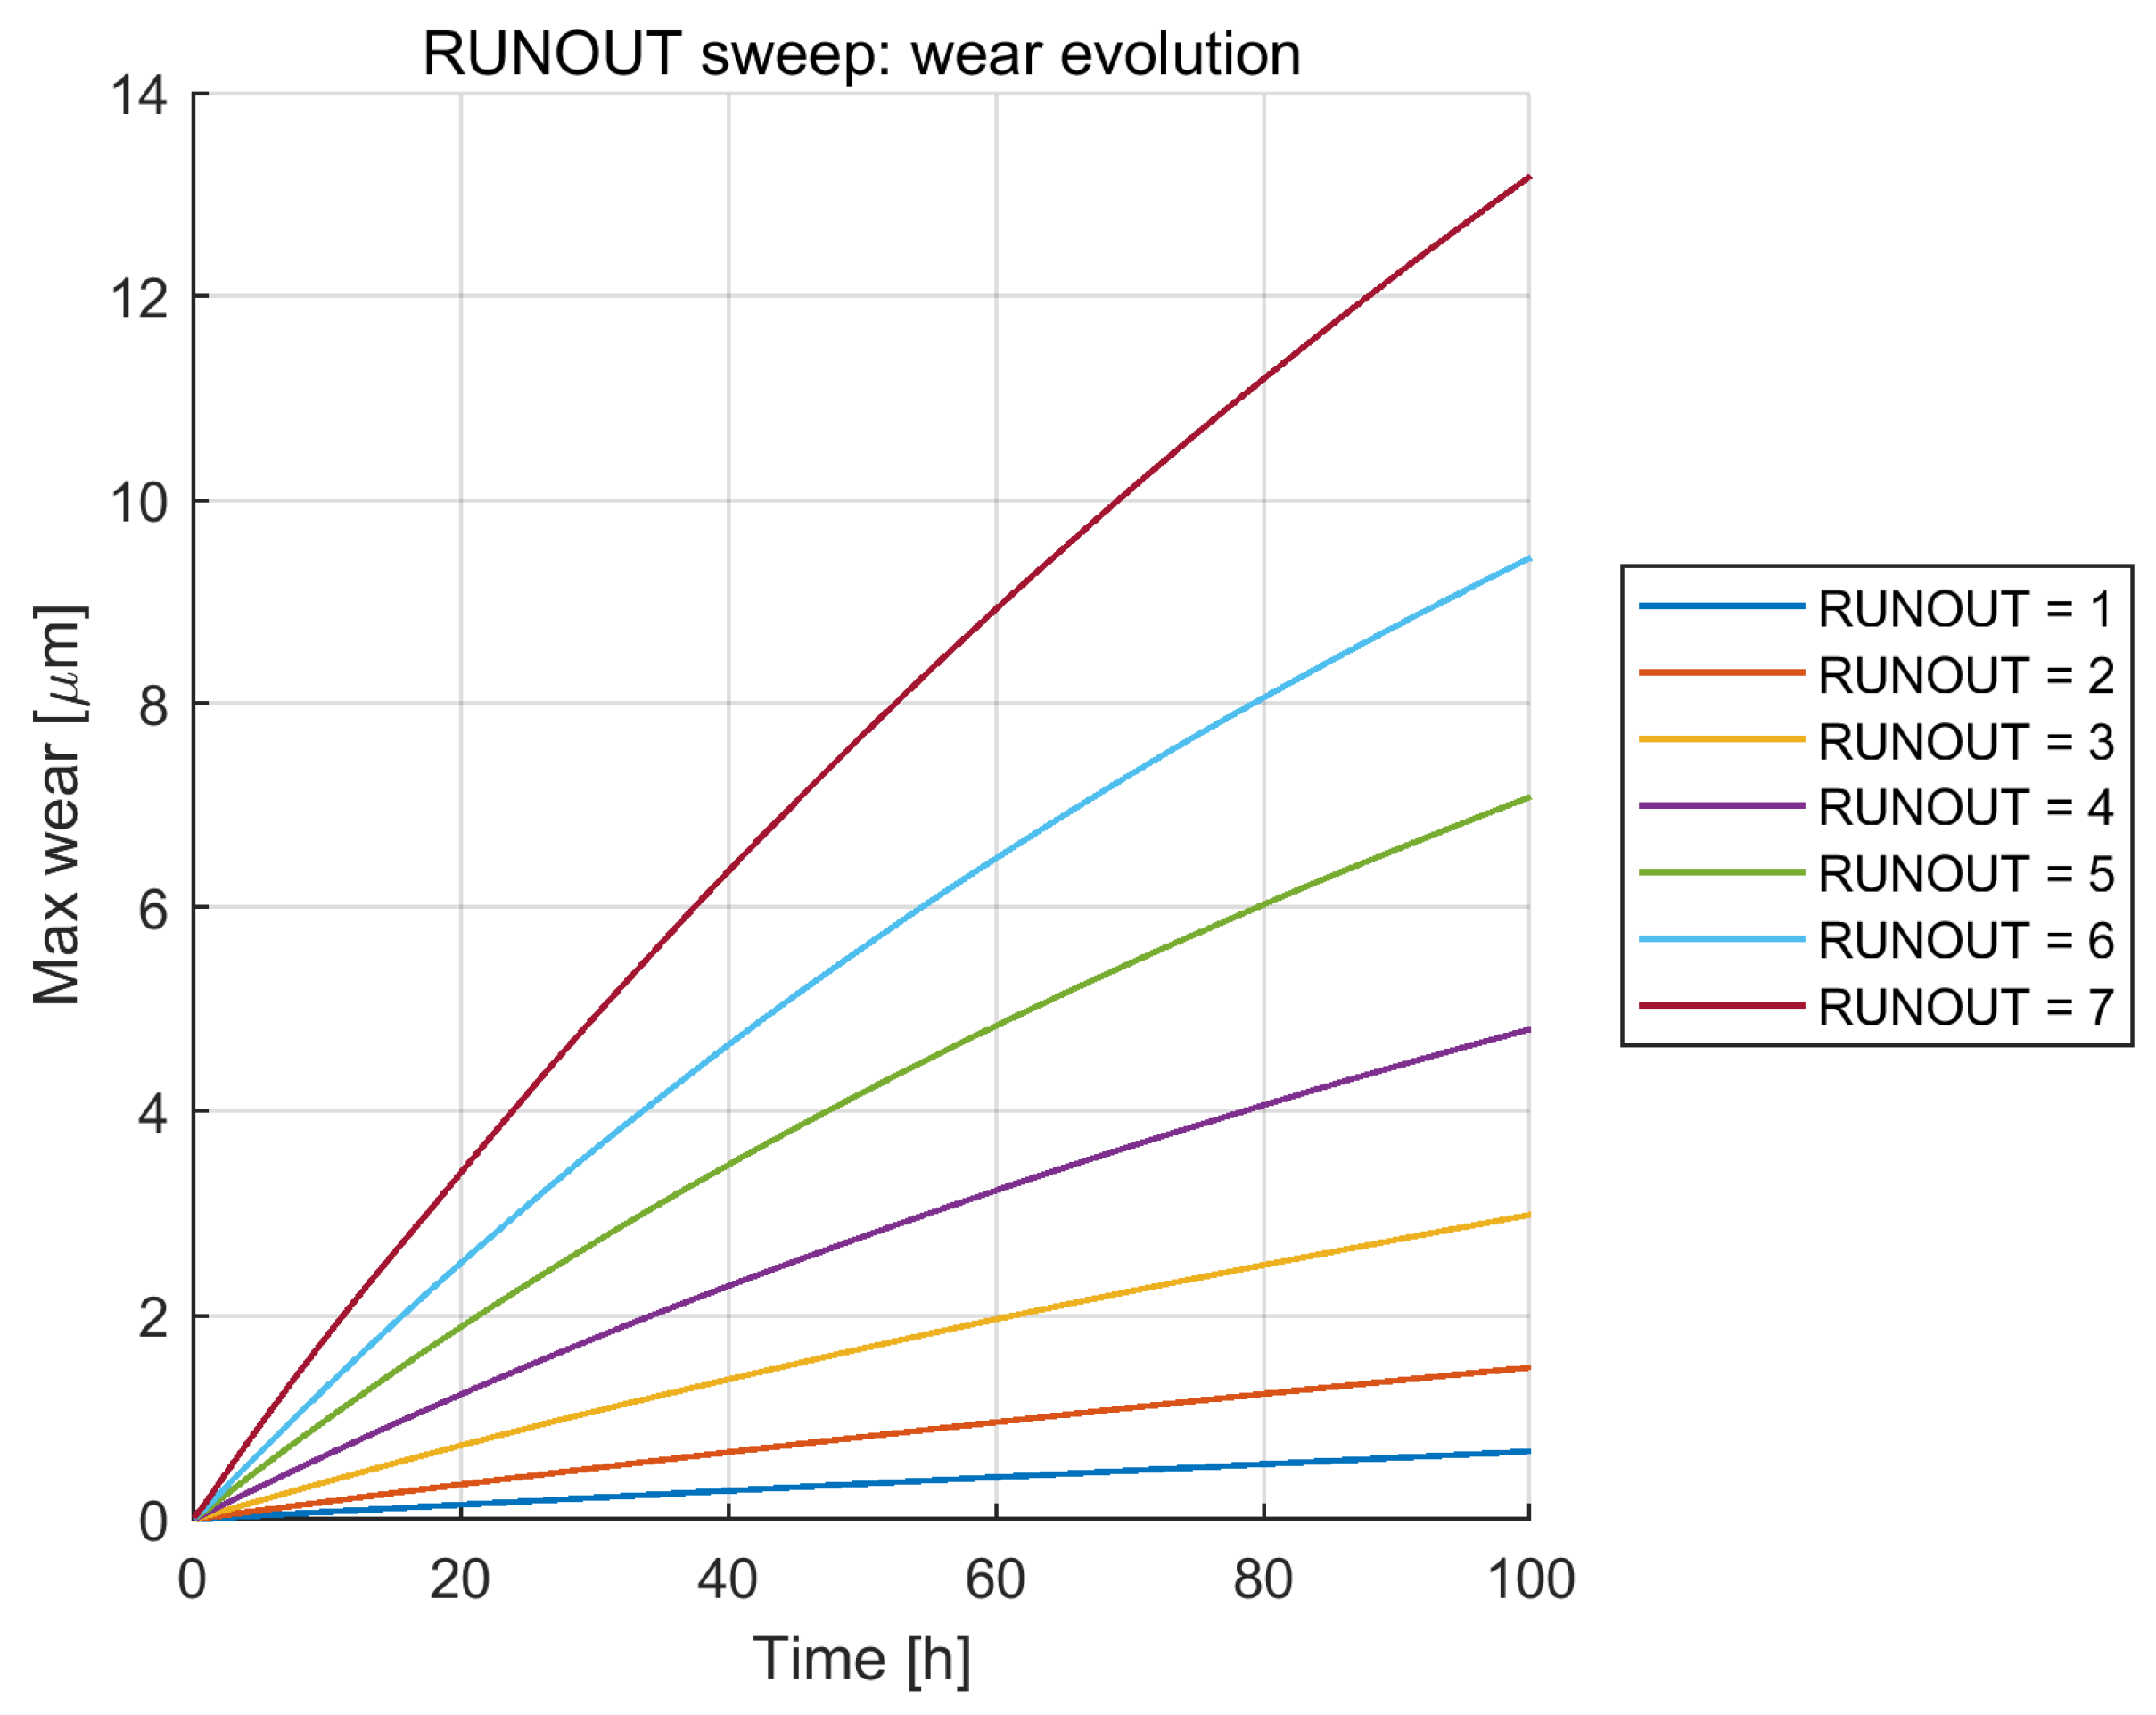
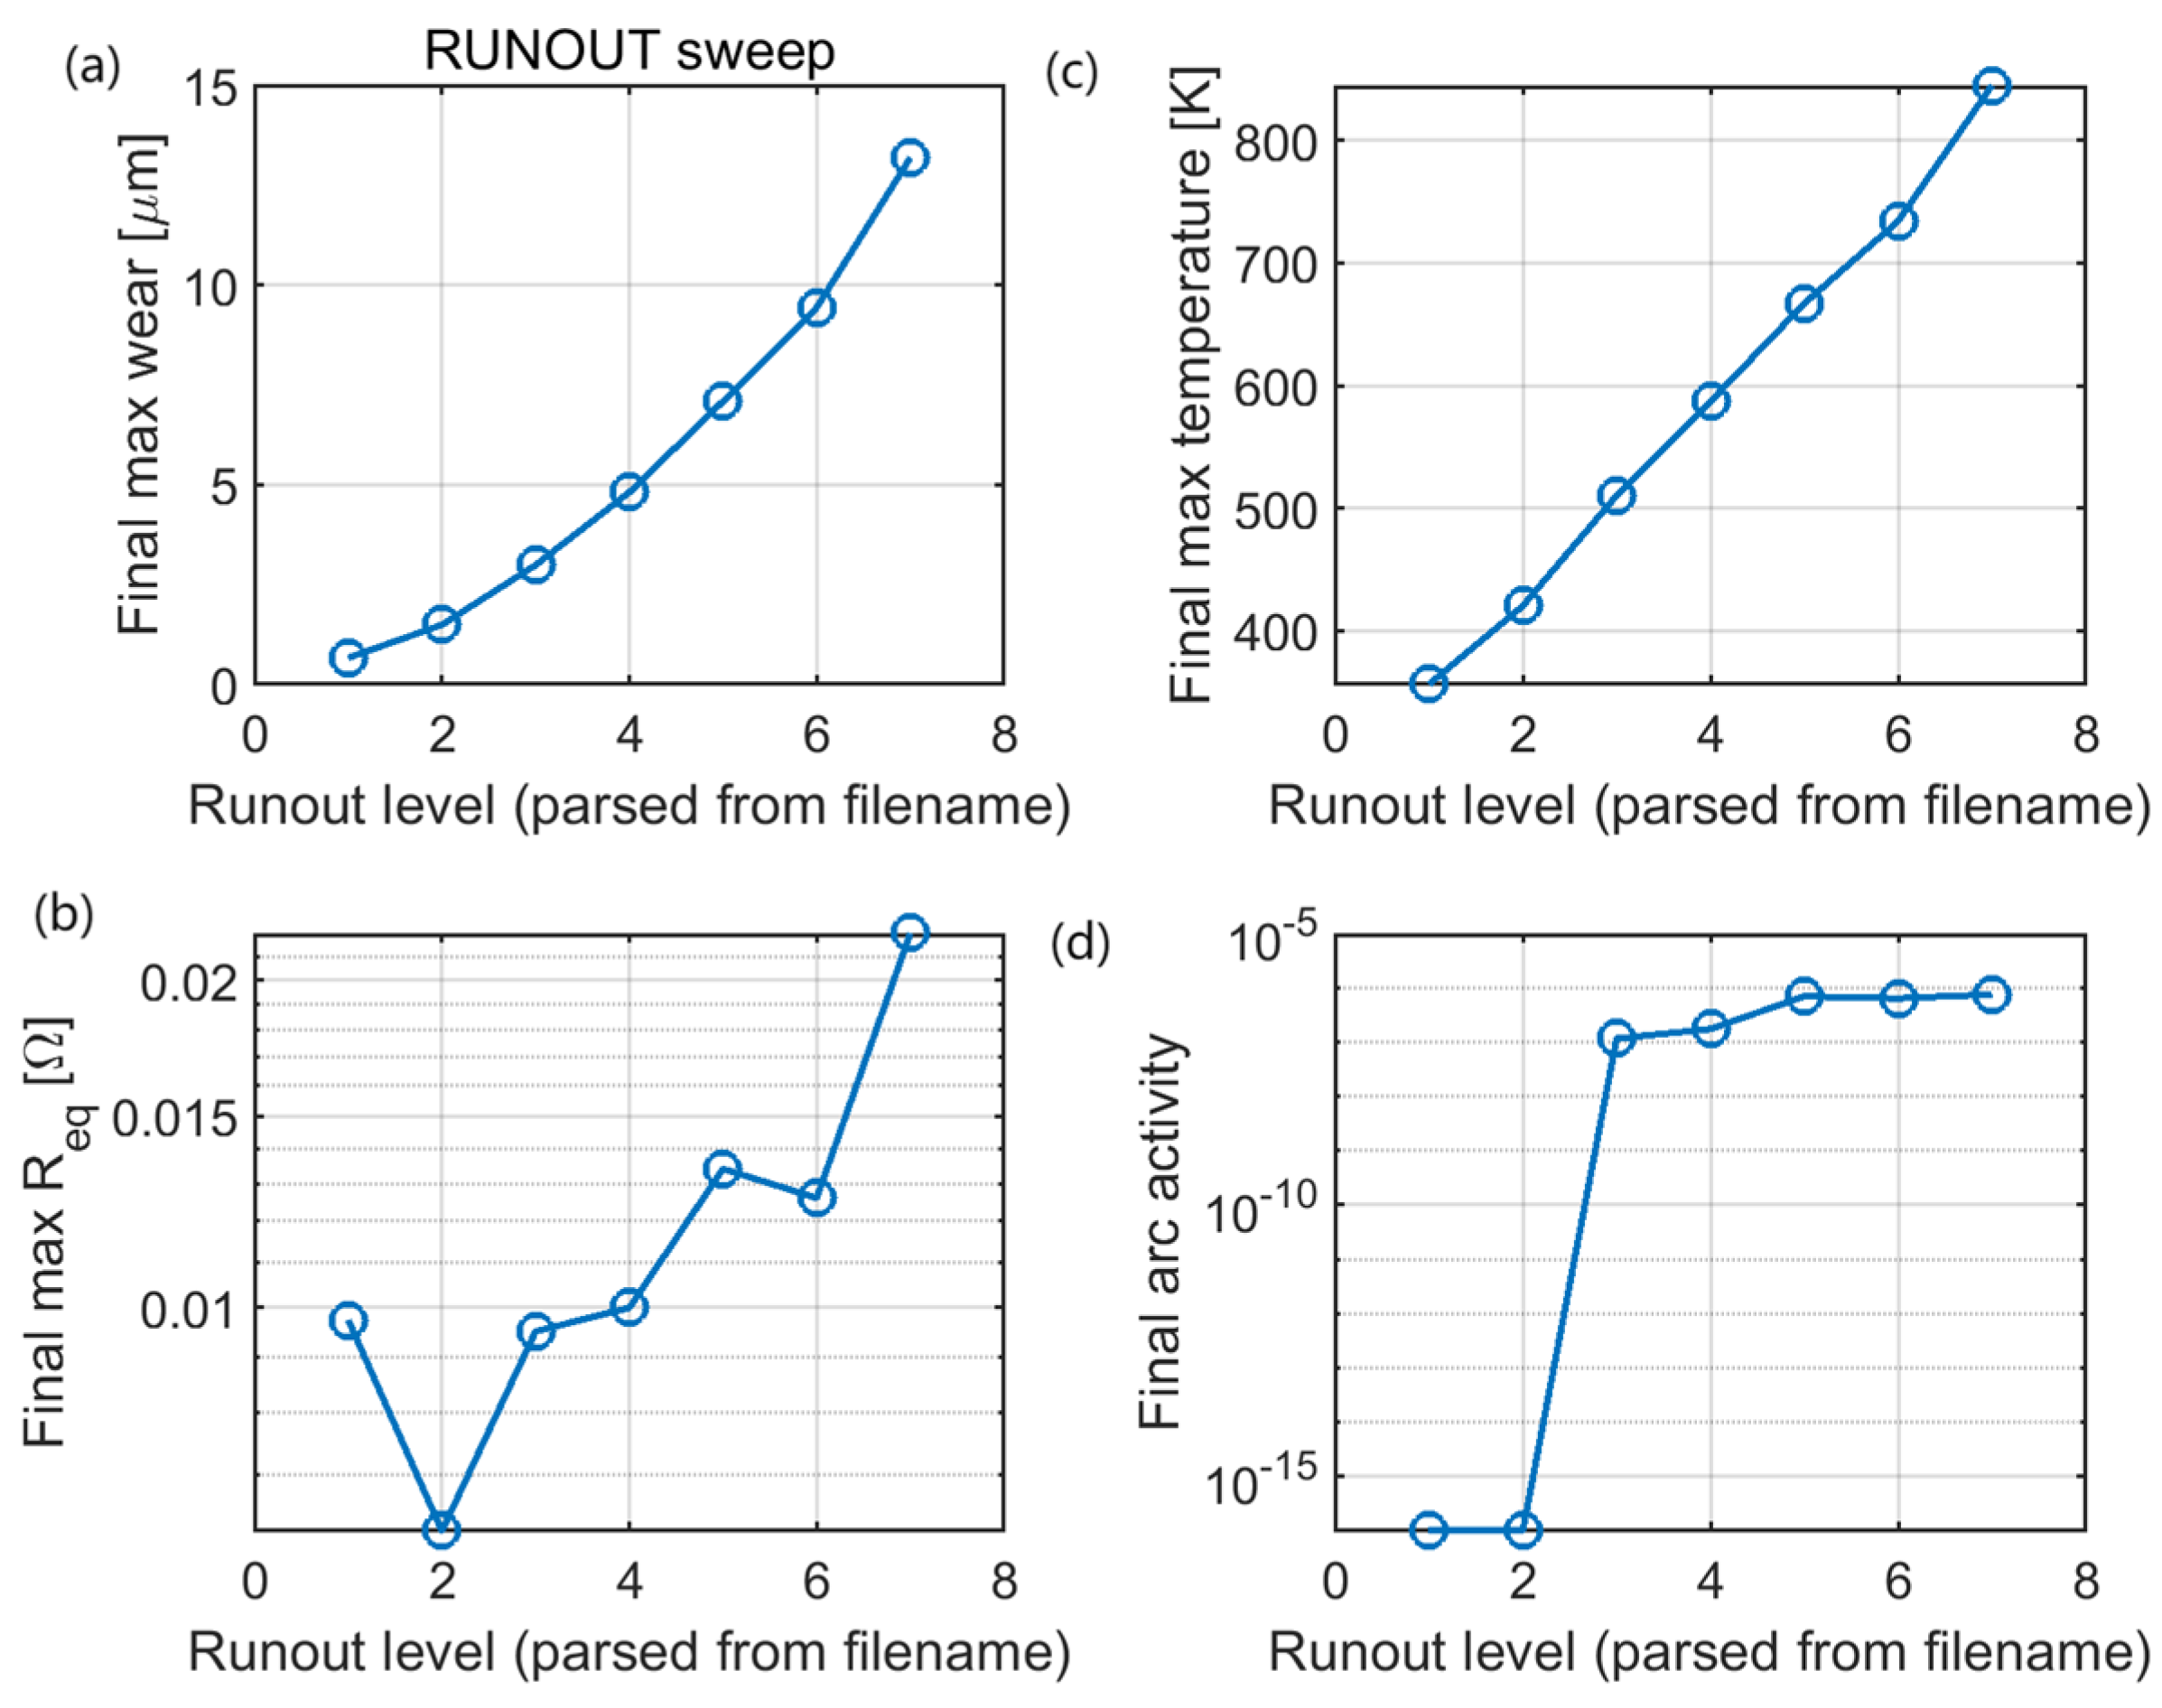
After establishing the baseline degradation behavior, the influence of runout is examined to clarify how geometric disturbance affects wear evolution and contact performance. The effect of runout is summarized in Figure 10. Among the parameters investigated in the present study, runout is the most influential factor. Figure 10 shows that increasing the runout level causes a strong increase in final wear, final temperature, and arc activity. The final maximum wear rises from less than 1 μm at the lowest runout level to more than 13 μm at the highest level, while the final maximum temperature increases from about 340 K to above 800 K. This is not a mild sensitivity; it is a regime transition.
A key scientific observation from Figure 10 is that the response is not purely linear. The resistance and arc-activity panels indicate that there is a threshold-like change as runout increases from the low-contact-loss regime to the repeated-separation regime. At very low runout, the interface remains close to full contact and arc activity is effectively absent. Once the runout exceeds a moderate level, local gap modulation becomes large enough to produce systematic micro-separation, current crowding, and repeated arc eligibility, after which wear and temperature accelerate rapidly.
The high-temperature response under large runout also indicates that thermal softening should be considered in long-term wear and life prediction. Previous studies have shown that Archard-type wear models can be improved by incorporating temperature- or time-dependent hardness, especially under elevated-temperature operating conditions [46,47]. In addition, experimental calibration of wear coefficients, hardness evolution, and worn profiles has been used to improve the reliability of wear and life prediction models [48]. Therefore, in the revised model, the constant hardness in the local Archard-type wear equation is replaced by a temperature-dependent hardness H i ( T i ) . This modification allows the local mechanical wear rate to increase when the interface temperature rises and provides a more reasonable basis for high-temperature wear prediction.
For life estimation, the present framework should be further calibrated using material-specific high-temperature data. More accurate lifetime prediction would require experimentally measured temperature-dependent hardness, high-temperature wear coefficients, and vacuum current-carrying wear data. Surface profilometry and post-test microstructural characterization can also be used to calibrate H i ( T i ) and the arc-erosion coefficient, thereby improving quantitative prediction of long-term wear morphology.
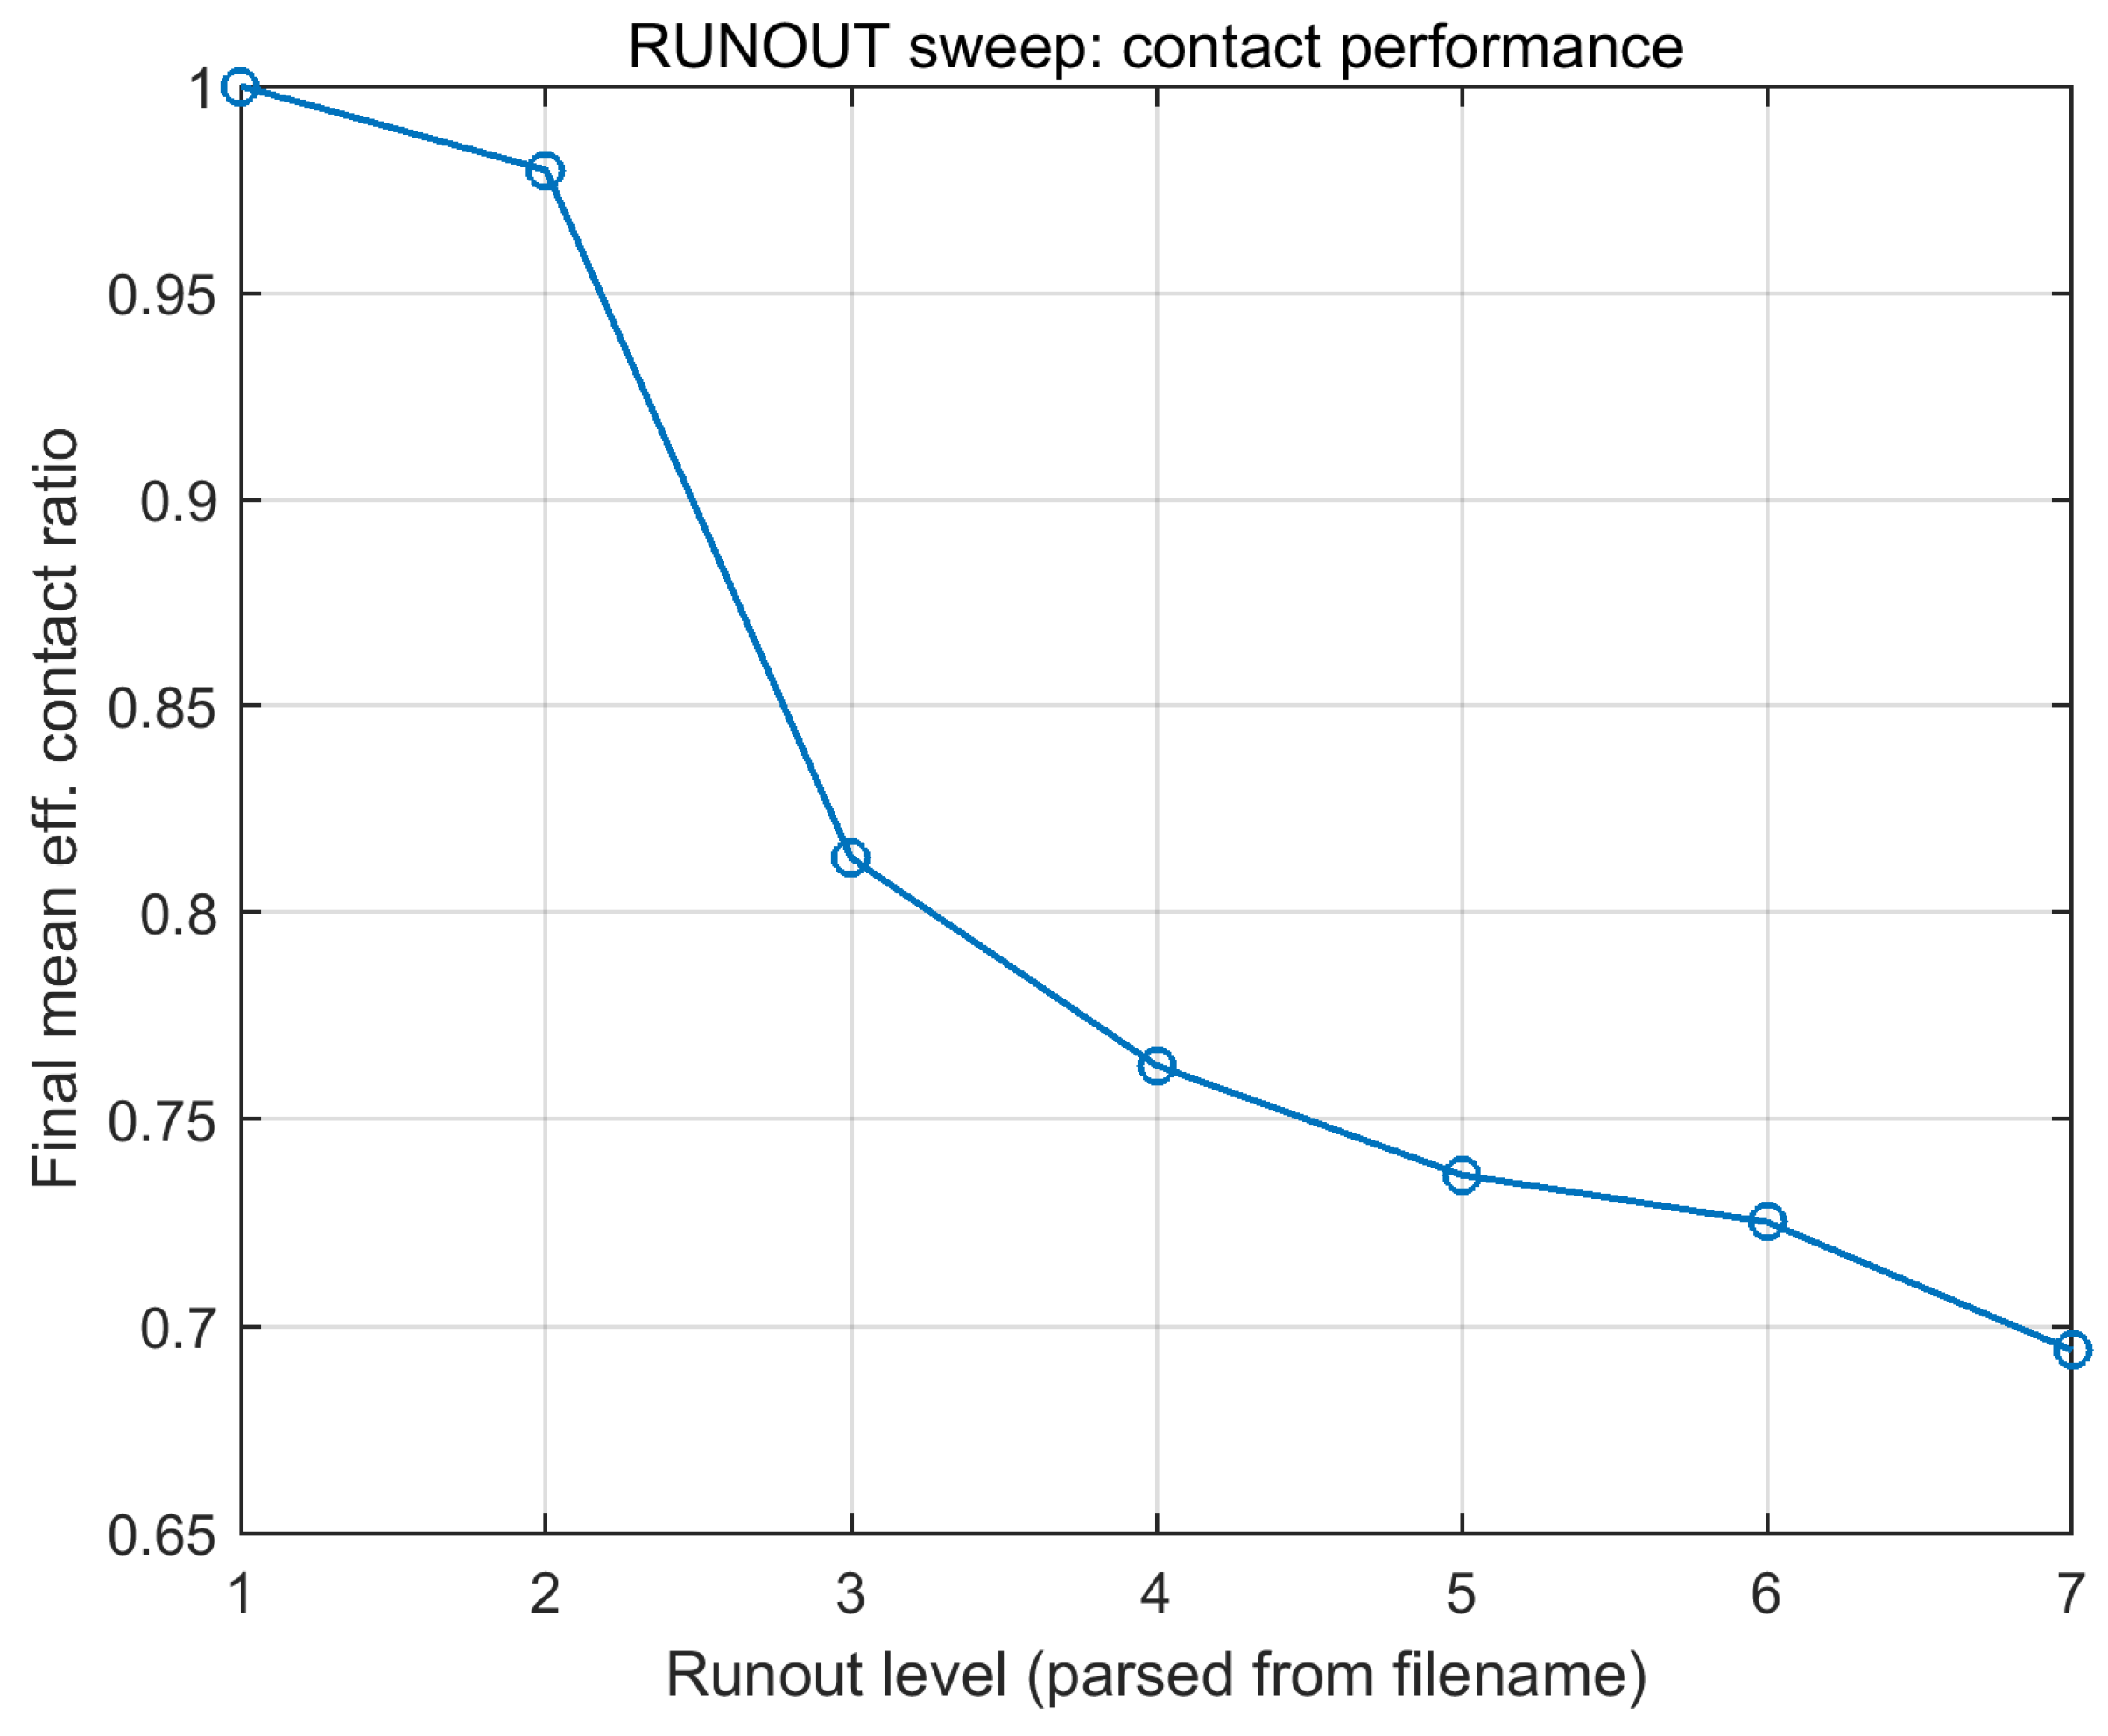
Figure 11 explains why the wear amplification is so strong. The final mean effective contact ratio decreases almost monotonically from approximately 1.0 at the lowest runout level to below 0.70 at the highest runout level. Thus, runout does not merely perturb an otherwise intact contact interface; it progressively converts the system from nearly continuous sliding into a state with frequent local opening and imperfect current transfer. This contact degradation is the key enabler for electrically assisted wear amplification.
The temporal trajectories in Figure 12 further show that the influence of runout is cumulative. Under small runout, the wear curves remain shallow over the full 100 h horizon. Under large runout, the curves separate early and continue to diverge, meaning that runout changes not only the final damage level but also the degradation rate itself. The widening gap between the curves indicates that higher runout magnifies the coupling between mechanical contact loss and long-term geometry evolution.
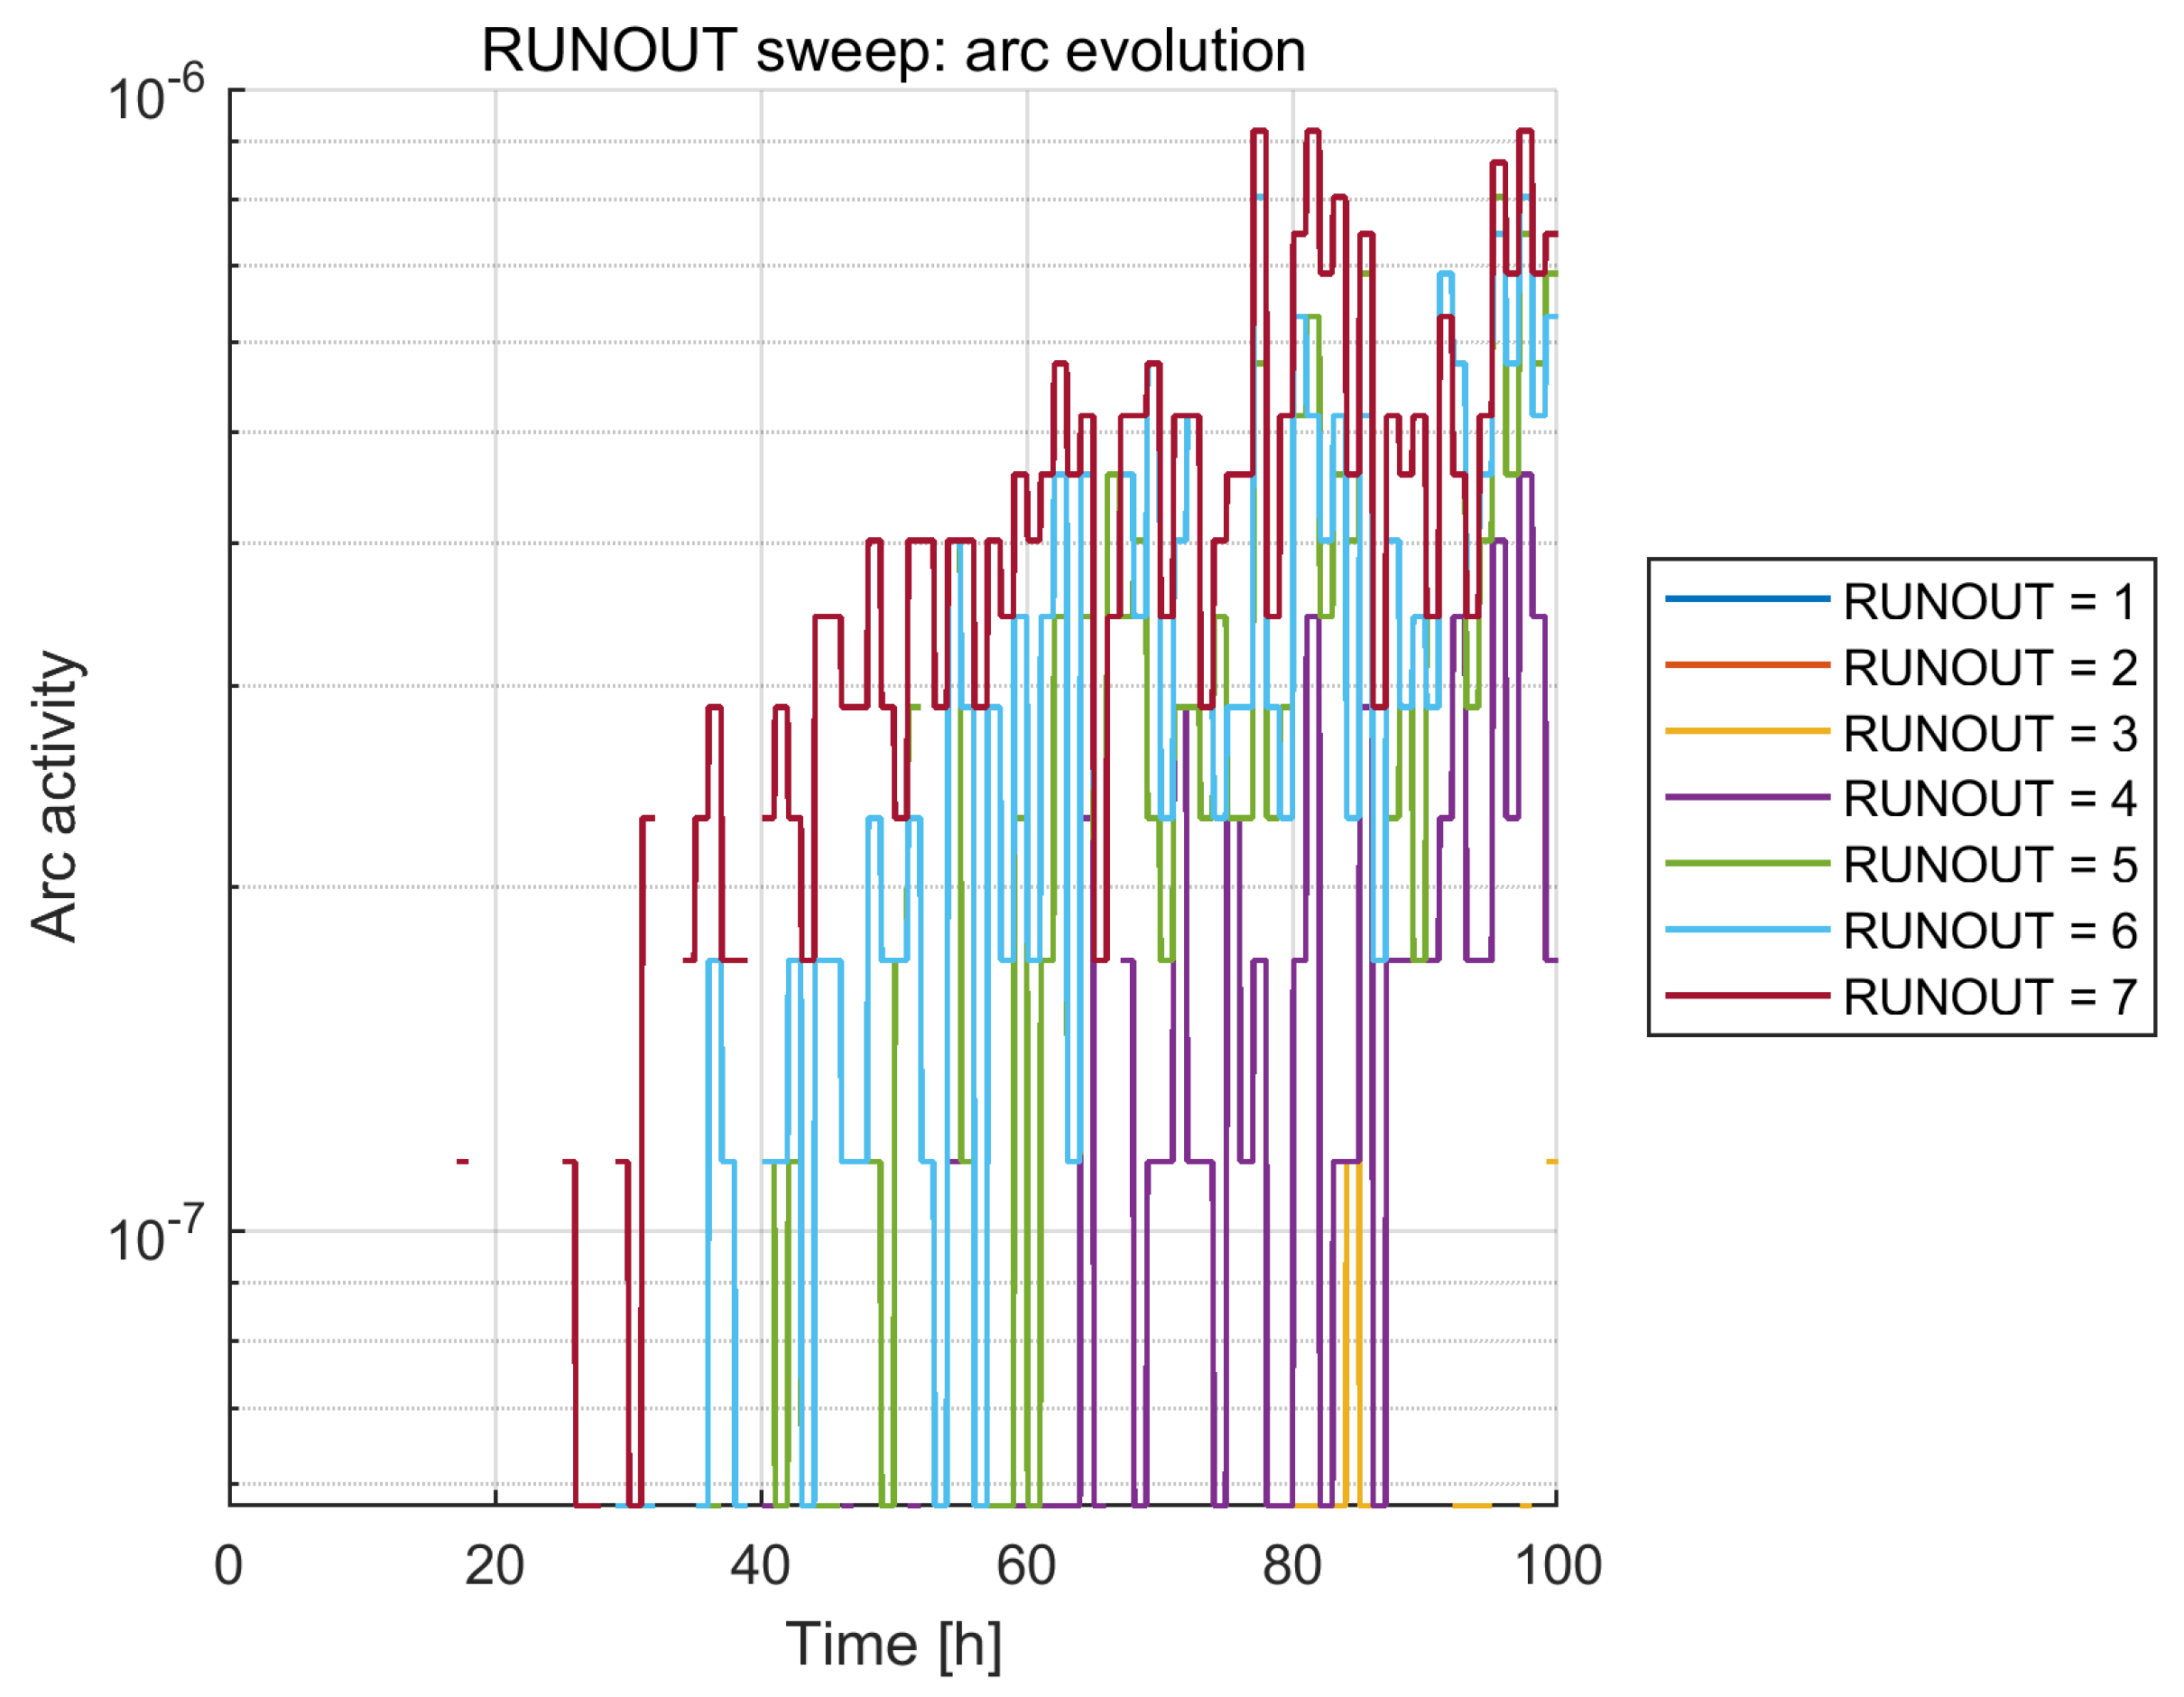
Figure 13 confirms that electrical intermittency emerges primarily in the later stage of the simulation and becomes more frequent as runout increases. This delayed activation is physically meaningful: the early stage is dominated by running-in and bounded contact adaptation, whereas the later stage reflects geometry feedback, where accumulated wear makes some regions more susceptible to repeated opening and arc ignition. Thus, runout should be interpreted not only as an external disturbance but also as a trigger for a self-reinforcing degradation pathway once sufficient geometry change has accumulated.
In addition, metallurgical degradation may also contribute to the accelerated damage under high-runout conditions. Previous studies on vacuum electrical contacts and current-carrying sliding interfaces have shown that localized heating, contact separation, surface condition, and arc erosion can strongly affect contact degradation [26]. Under vacuum conditions, the absence of convective cooling makes local hot spots more difficult to dissipate, while intermittent arc events can introduce highly localized thermal input. These effects may promote diffusion-assisted adhesion, micro-welding, local melting and resolidification, thermal softening, and microstructural changes in the near-surface layer [49].
In the present simulations, the high-runout cases show a maximum temperature above 800 K, suggesting that metallurgical effects may become more pronounced when contact instability and arc activity are intensified. Such processes can modify the real contact area, local hardness, adhesion strength, surface-film state, and electrical constriction behavior, thereby further influencing current localization and wear accumulation. However, diffusion kinetics, micro-welding formation and rupture, phase transformation, and detailed melting are not explicitly resolved in the present model. Their effects are considered indirectly through temperature-dependent material parameters, including electrical resistivity, wear coefficient, and hardness.

5.3. Detailed Effect of Preload on Wear Evolution and Contact Performance

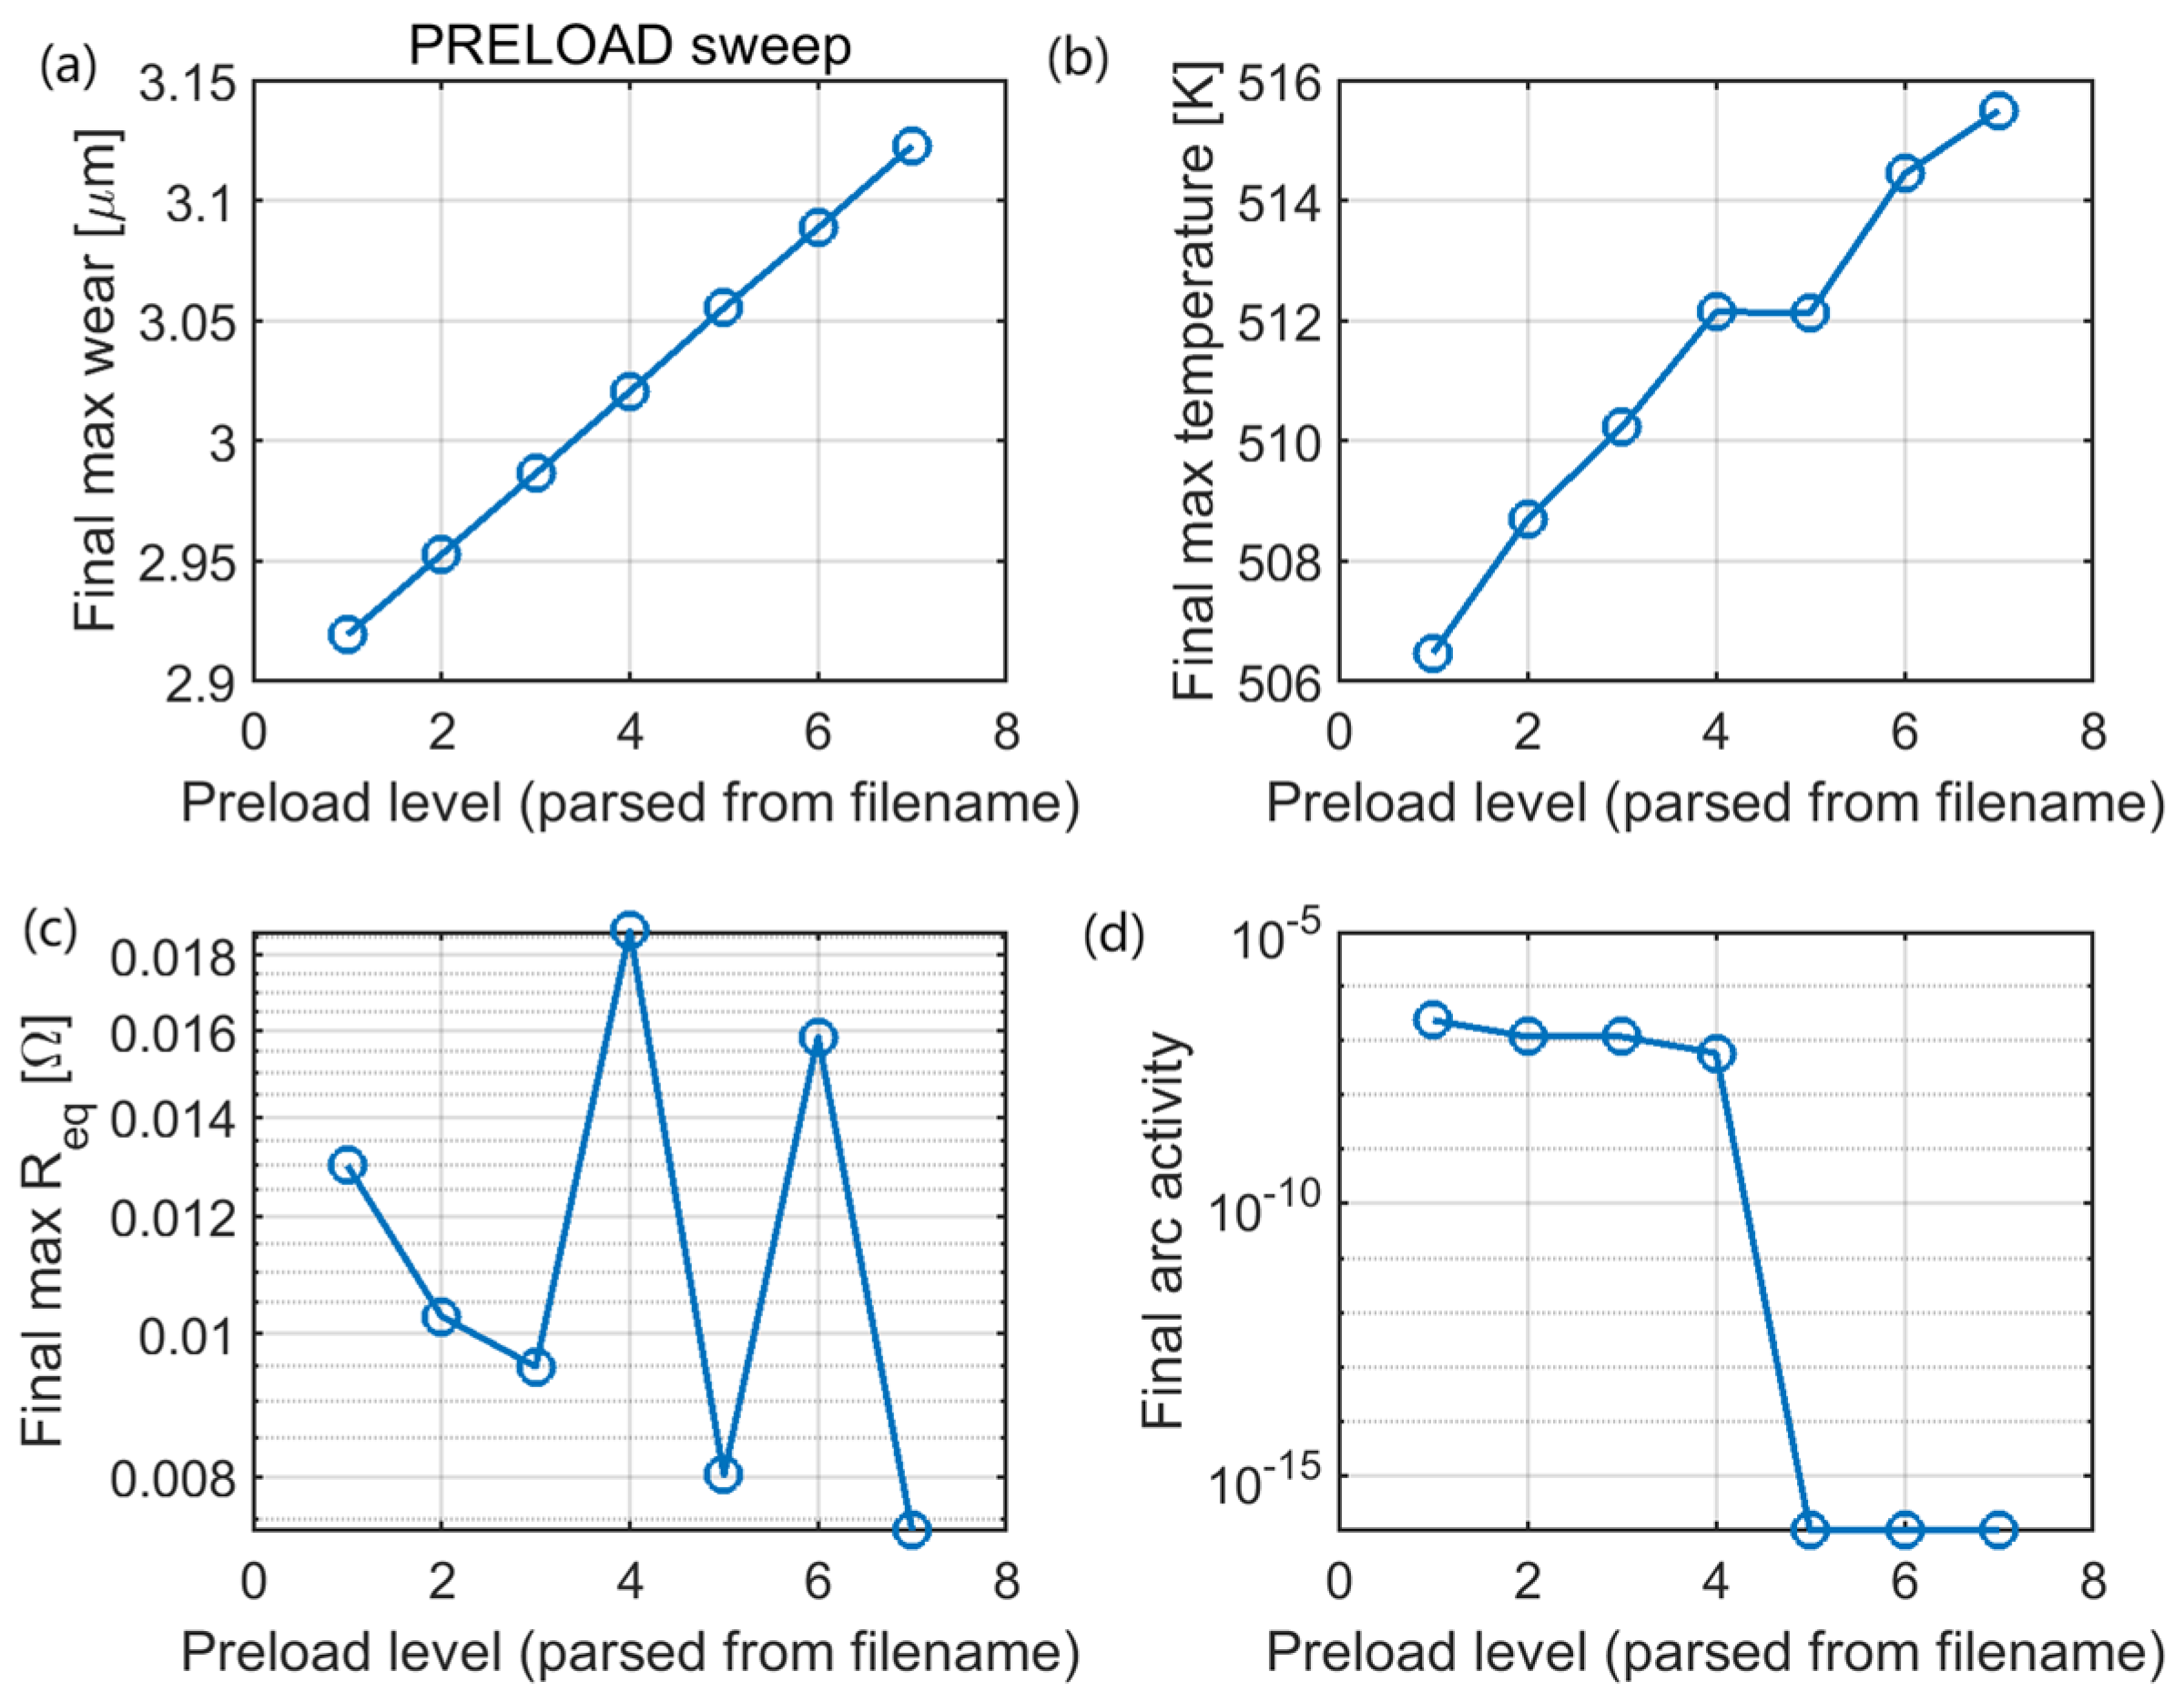
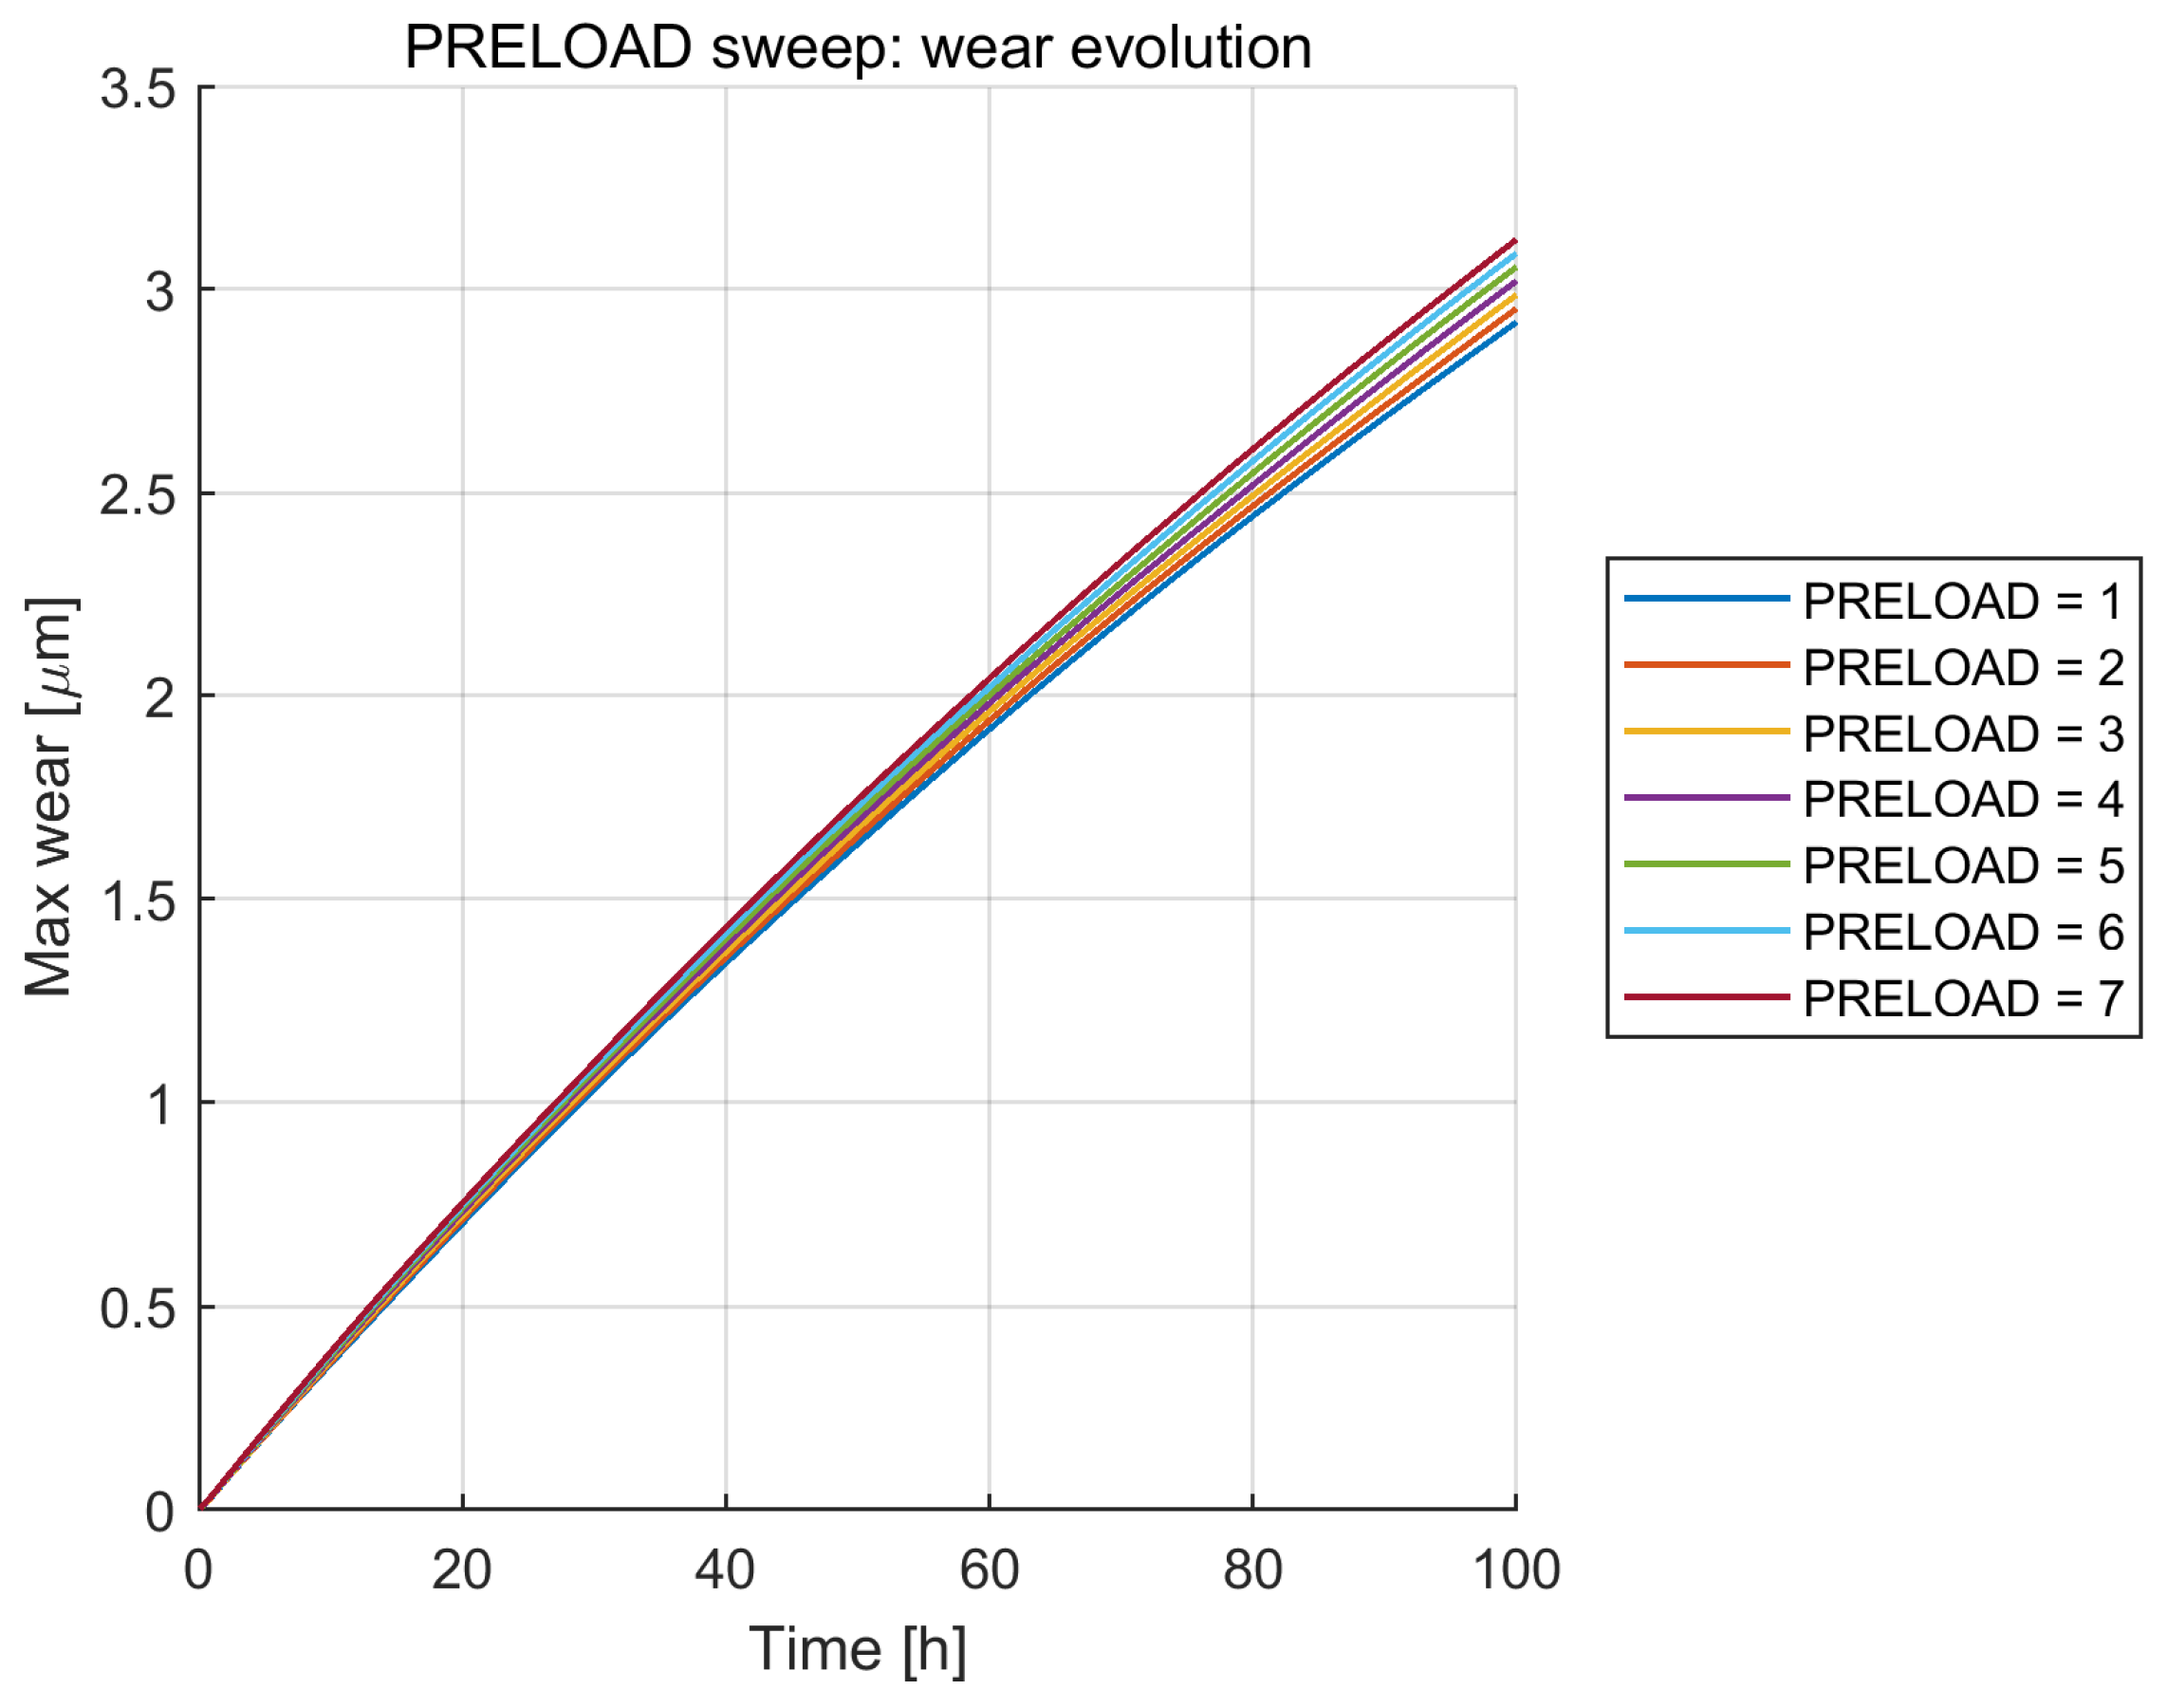
After clarifying the dominant role of runout, the preload effect is further examined in terms of wear evolution and interface stability. The preload sensitivity, shown in Figure 14, Figure 15, Figure 16 and Figure 17, differs qualitatively from the runout sensitivity. As shown in Figure 14, increasing preload leads to only a modest rise in final wear and temperature. Across the investigated preload range, the final maximum wear remains within a narrow band around 3 μm, while the final maximum temperature increases by only a few kelvin. This indicates that preload is not the primary factor controlling damage severity within the present operating range.
At the same time, Figure 14 also shows that preload has a pronounced stabilizing effect on contact behavior. The final arc activity decreases sharply and nearly vanishes once the preload exceeds a moderate level. This suggests that preload should be understood mainly as a contact-stabilization parameter rather than a direct driver of wear acceleration. By suppressing separation, a higher preload reduces the electrical amplification pathway, although it also introduces a modest mechanical penalty through the increased normal load.
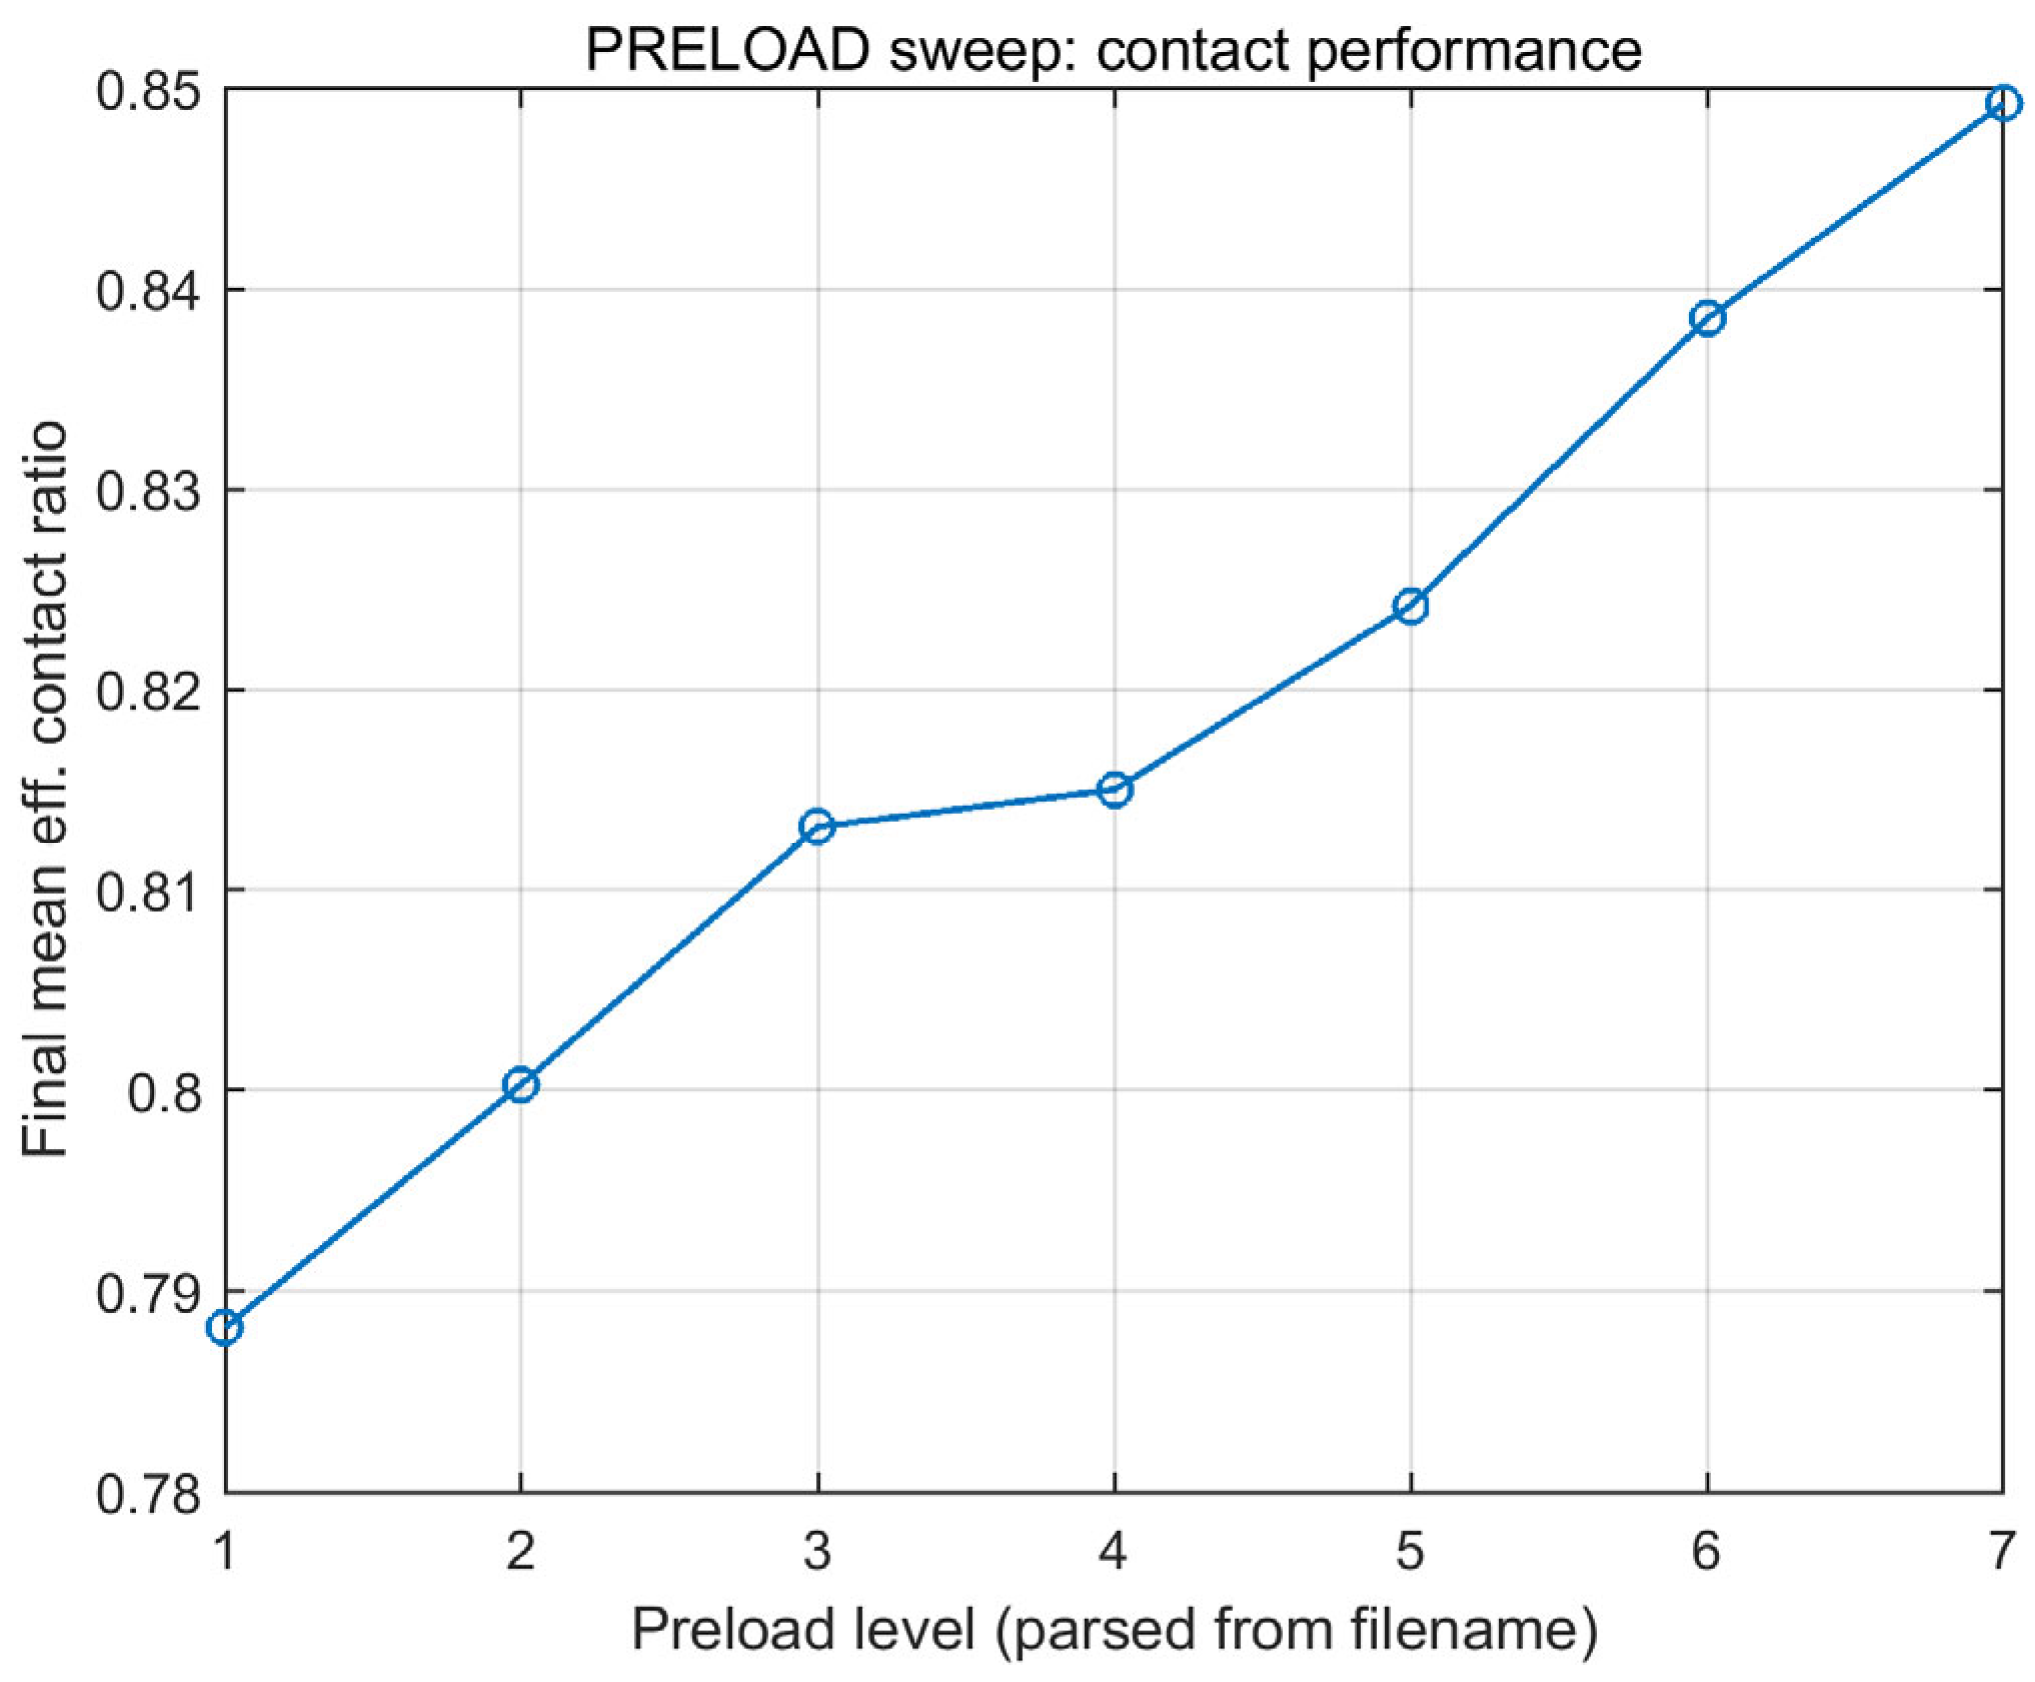
Figure 15 makes this stabilization effect explicit. The final mean effective contact ratio rises steadily with increasing preload, from below 0.79 at the lowest preload level to nearly 0.85 at the highest level. Compared with the strong runout dependence in Figure 11, this trend is smoother and more monotonic. Therefore, preload acts as a control knob for contact continuity: higher preload improves interface stability, but with diminishing returns once the contact ratio approaches saturation.
The wear evolution curves in Figure 16 further show that preload affects the entire degradation history only weakly. All curves remain closely clustered over the 100 h horizon. This result is important because it demonstrates that a moderate increase in preload does not fundamentally change the wear mode. Instead, preload fine-tunes the balance between contact stabilization and frictional penalty. In practical terms, this means that preload can be used to improve reliability without paying a disproportionately large wear cost, provided that the preload remains within a realistic design interval.
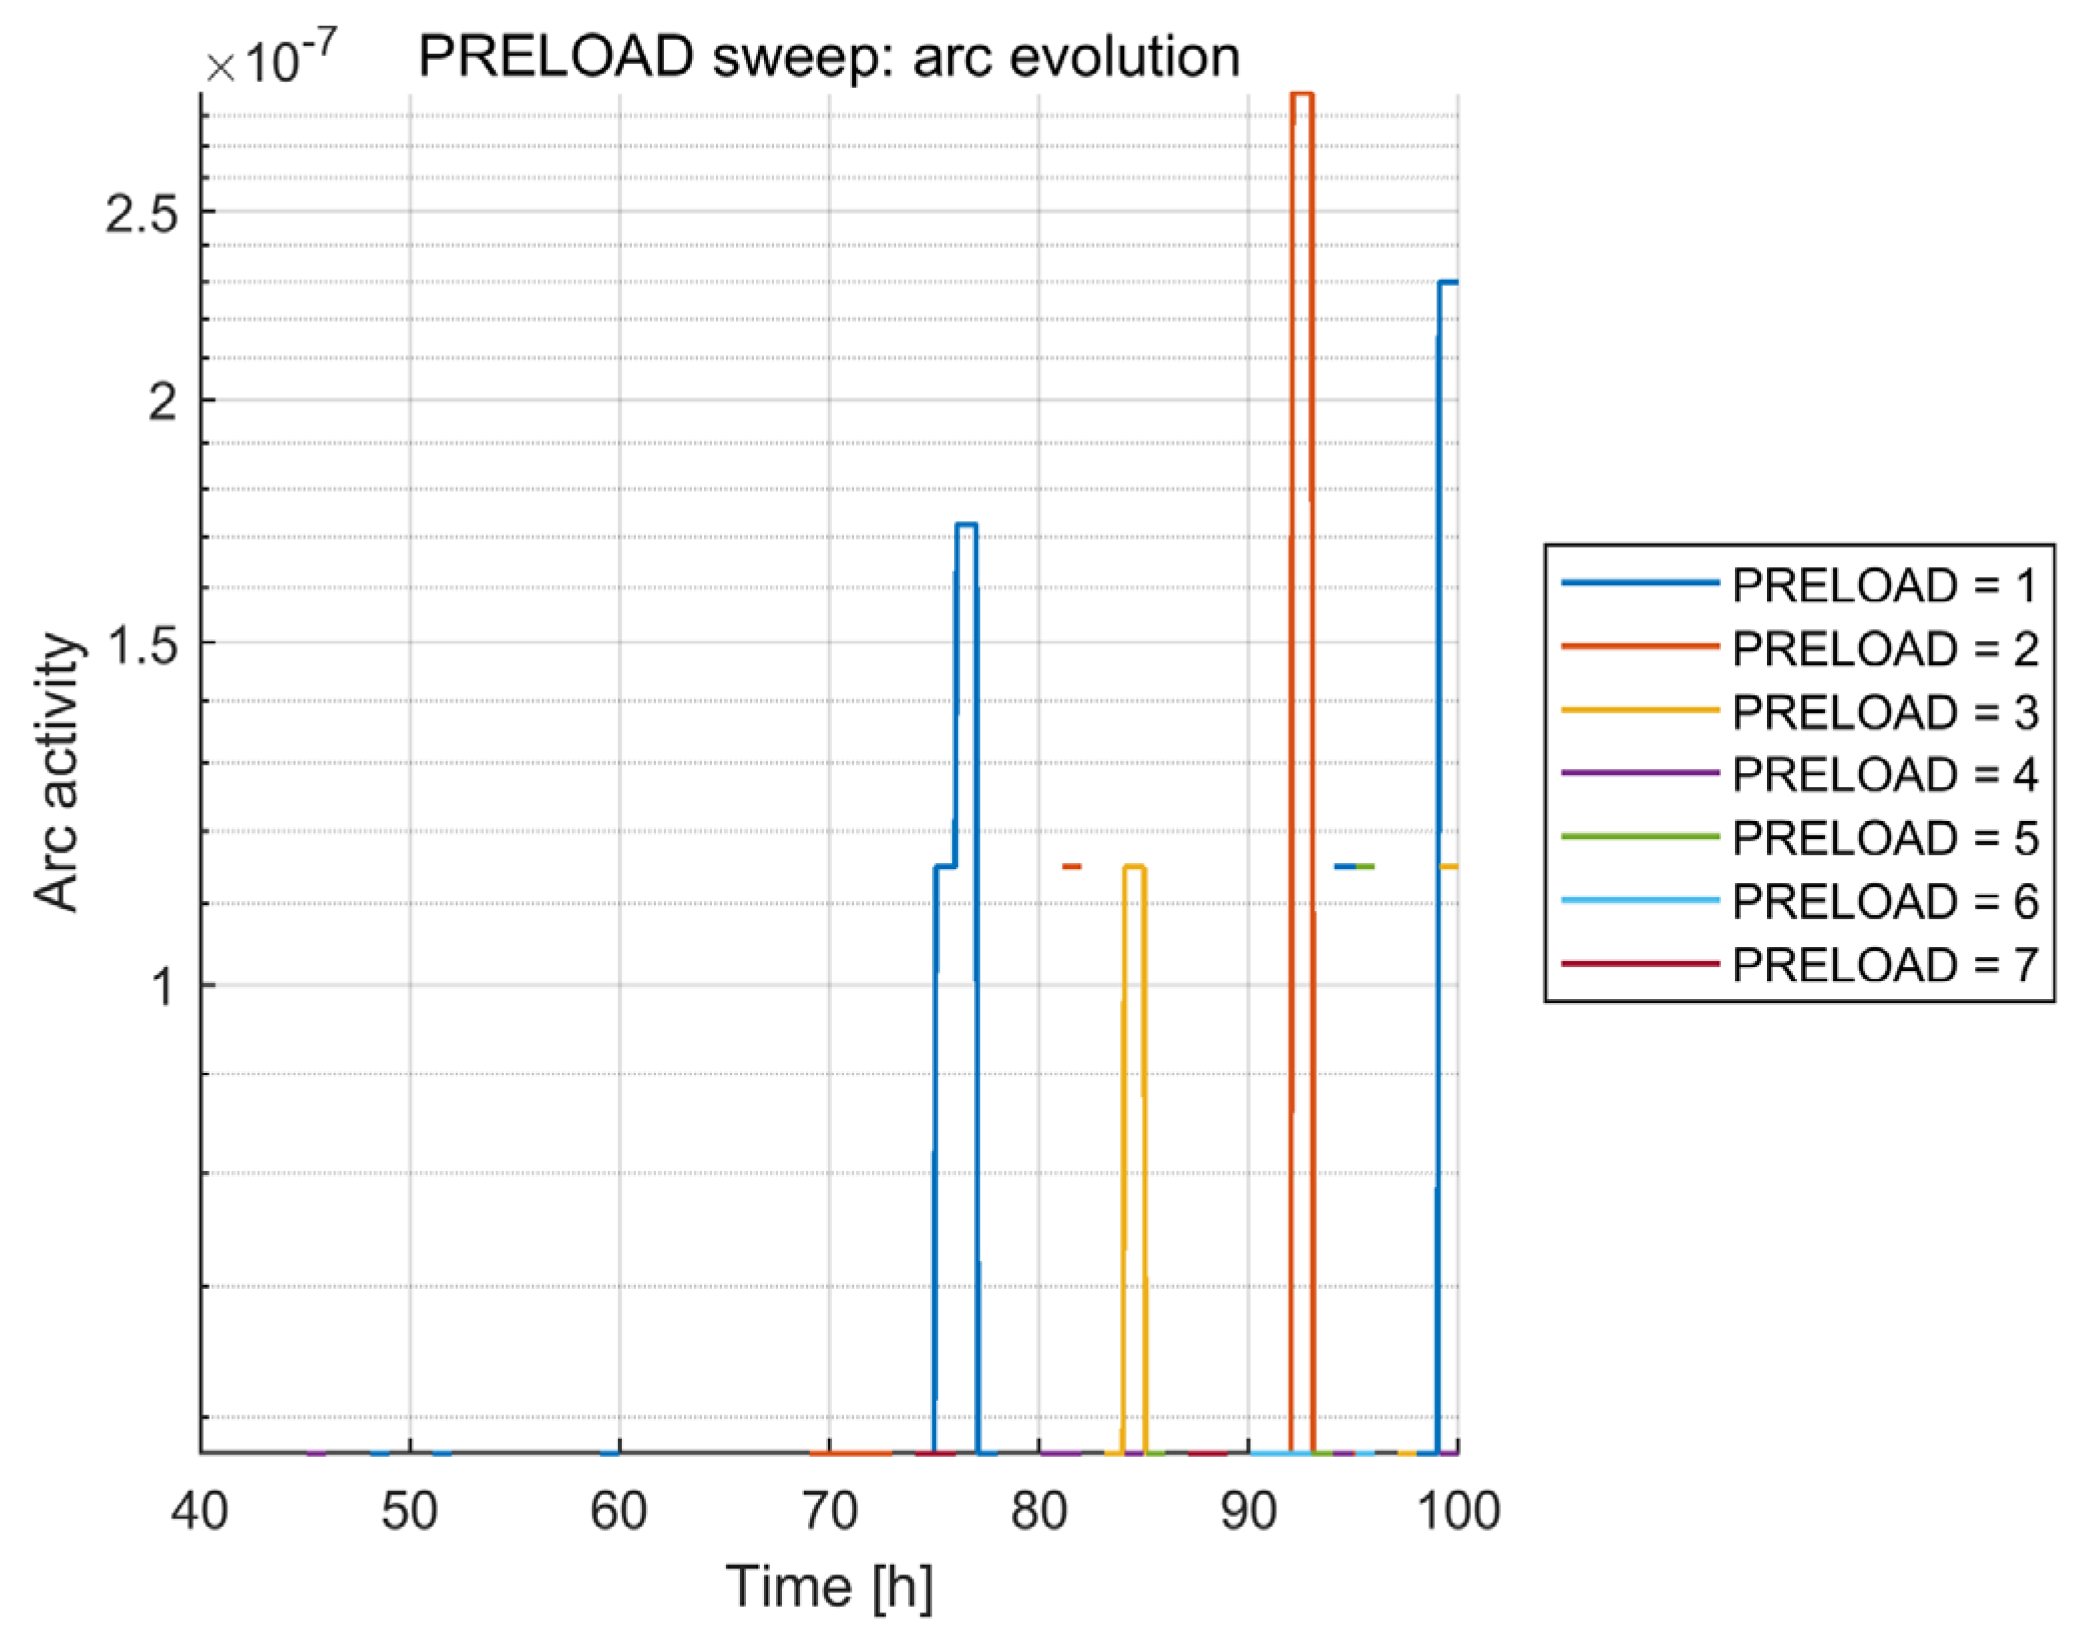
Figure 17 shows that the electrical benefit of preload is strongest in the weak-contact regime. At low preload, arc activity appears earlier and more frequently. At higher preload, the arc curves collapse toward the numerical floor, indicating that the interface remains sufficiently closed that the separation-assisted arc pathway is effectively suppressed. Therefore, preload mainly influences wear indirectly, by modifying the probability of entering the arc-assisted degradation mode.

6. Conclusions

This study developed a surface-resolved multiphysics framework for satellite SADA slip-ring degradation by explicitly coupling runout-driven separation, brush normal dynamics, rough-surface contact, electrical current redistribution, rare-event arcing, vacuum thermal transport, and long-term wear evolution. The FAST–MACRO strategy made it possible to retain the transient electromechanical physics that control local damage initiation while still resolving the slow geometry evolution over the 100 h service horizon. The main findings can be summarized as follows:
(1) Under the baseline operating condition, the model predicts a bounded weak-arc regime rather than catastrophic discharge. The two tracks do not evolve identically: one track exhibits a higher continuous electrical loading, whereas the other develops a larger frictional wear budget together with stronger intermittent arc amplification. This demonstrates that the degradation pathway of a SADA slip-ring interface cannot be inferred from average current level alone. Instead, the final wear state is governed by the combined action of contact stability, energy partition, and local geometry feedback.
(2) The runout study shows that geometric disturbance is the dominant control parameter in the present design space. Increasing runout progressively reduces contact continuity, increases the probability of repeated separation, and amplifies both electrical intermittency and wear localization. Once runout exceeds the mild-contact-loss range, the coupled system undergoes a threshold-like transition toward accelerated degradation, characterized by higher temperature, larger resistance variation, and rapidly increasing wear. This result identifies runout suppression as the most effective route for improving long-term SADA reliability.
(3) By contrast, preload primarily acts as a stabilizing parameter. A larger preload improves contact continuity and suppresses arc activity, but it only produces a modest increase in global wear within the investigated interval. Therefore, preload tuning should be interpreted as a means of reliability optimization rather than a dominant wear driver. The results further indicate that there exists a practically useful preload window in which contact stability is improved significantly while the frictional wear penalty remains limited.

Author Contributions

Conceptualization, D.Z. and Y.S.; methodology, Y.S.; software, Y.S.; formal analysis, Z.Y.; investigation, Z.Y.; resources, D.Z.; data curation, Y.S.; writing—original draft preparation, D.Z.; writing—review and editing, Y.S.; visualization, Z.Y.; supervision, D.Z.; project administration, D.Z.; funding acquisition, D.Z. All authors have read and agreed to the published version of the manuscript.

Funding

This work was supported by the National Natural Science Foundation of China (No. 52477129, U2468230), the China State Railway Group Co., Ltd. (No. L2025G002), the Sichuan Science and Technology Program (No. 2026YFHZ0062), Fundamental Research Funds for the Central Universities 2682026GH020.

Data Availability Statement

The original contributions presented in this study are included in the article. Further inquiries can be directed to the corresponding author.

Acknowledgments

During the preparation of this work, the authors used ChatGPT/GPT-5.2 in order to improve the readability and language of the manuscript. After using this tool, the authors reviewed and edited the content as needed and take full responsibility for the content of the published article.

Conflicts of Interest

Author Dehai Zhang was employed by the company Sichuan Development International Commercial Spaceport Co., Ltd. The remaining authors declare that the research was conducted in the absence of any commercial or financial relationships that could be construed as a potential conflict of interest.

References

  1. Galatis, G.; Guo, J.; Buursink, J. Development of a solar array drive mechanism for micro-satellite platforms. Acta Astronaut. 2017, 139, 407–418. [Google Scholar] [CrossRef]
  2. Zhu, S.-Y.; Li, D.-X.; Lei, Y.-J. Disturbance mechanism of the solar array drive system on spacecraft. Mech. Syst. Signal Process. 2022, 165, 108306. [Google Scholar] [CrossRef]
  3. Meng, Y.; Zhang, E.; Zhang, D.; Zhu, X.; Zhu, H.; Li, A. Fast Arc Detection Technology Based on Fractal Dimension for SADA Slip Ring in Satellite Power System. Energies 2024, 17, 1093. [Google Scholar] [CrossRef]
  4. Meng, Y.; Zhang, D.; Wang, C.; Liu, Z.; Zhu, L.; Li, A. Modeling and Analysis of Non-Linear Phenomena of Satellite Power System in Space Environment and Hazard-Risk Evaluations. Electronics 2022, 11, 1756. [Google Scholar] [CrossRef]
  5. Yang, L.; Li, P.; Huang, Y.; Zhou, Q.; Luo, X.; Deng, C.; Xu, P.; Liu, Y.; Zhang, Q. Investigation of tribological and electrical behavior of CARB-processed multilayer Cu/Ag composites for spatial conductive slip rings. Wear 2026, 595, 206693. [Google Scholar] [CrossRef]
  6. Abdelemam, A.; Zeineldin, H.; Al-Durra, A.; El-Saadany, E.M. Interharmonic Current Differential Protection Scheme for Converter-based Hybrid AC/DC Microgrids. Prot. Control Mod. Power Syst. 2025, 10, 5. [Google Scholar] [CrossRef]
  7. Avino, F.; Gaffinet, B.; Bommottet, D.; Howling, A.; Furno, I. Slip Ring Test Assembly With Increased Breakdown Voltage Limit for High-Voltage Bus Satellites. IEEE Aerosp. Electron. Syst. Mag. 2020, 35, 32–36. [Google Scholar] [CrossRef]
  8. Wang, J.; Liu, R.; Xiao, R.; Ping, A.; Liu, J.; Zhang, M.; Li, Q. Optimized Design of Slip Ring Assembly for Aerospace to Reduce Deep Dielectric Charging. IEEE Trans. Nucl. Sci. 2022, 69, 915–924. [Google Scholar] [CrossRef]
  9. Pashaei, M.; Kauhaniemi, K.; Laaksonen, H.; Hatziargyriou, N. Development of Virtualized Centralized Protection and WAMPAC Systems: A Review. Prot. Control Mod. Power Syst. 2025, 11, 1. [Google Scholar] [CrossRef]
  10. Zhou, Y.; Zhu, R.; Zuo, X.; Xie, W. Tribo-electrical behaviors of CNTs-MoS2/Cu composites under sliding electrical contact with brass. Tribol. Int. 2023, 180, 108207. [Google Scholar] [CrossRef]
  11. Gao, G.; Fu, R.; Wang, Q.; Chen, J.; Qian, P.; Zeng, J.; Weng, X.; Li, H.; Yang, Z.; Wang, H.; et al. Progress on current-carry friction and wear and prediction models: A review. Friction 2025, 14, 9441151. [Google Scholar] [CrossRef]
  12. Li, S.; Yang, X.; Kang, Y.; Li, Z.; Li, H. Progress on Current-Carry Friction and Wear: An Overview from Measurements to Mechanism. Coatings 2022, 12, 1345. [Google Scholar] [CrossRef]
  13. Wu, H.; Zhao, X.; Li, W.; Li, Y.; Pan, T.; Yang, W.; Li, X. Research Status and Progress on the Current-Carrying Friction and Wear Performance of Conductive Slip Rings in Harsh Environments. Coatings 2025, 15, 1347. [Google Scholar] [CrossRef]
  14. Huang, Q.; Song, C.; Liu, Z.; Hou, X.; Pang, X.; Sun, C.; Lu, H.; Wang, S.; Zhang, Y. Research progress on the characteristics of current-carrying tribology in electrical transmission. Space Sol. Power Wirel. Transm. 2024, 1, 37–47. [Google Scholar] [CrossRef]
  15. Cheng, S.; Zhou, Y.; Zuo, X. Current-Carrying Wear Behavior of Cu–TiC Coatings Obtained Through High-Speed Laser Cladding on Conductive Slip Rings of 7075 Aluminum Alloy. Metals 2025, 15, 688. [Google Scholar] [CrossRef]
  16. Yang, Y.; Pei, L.; Zhang, H.; Feng, K.; Ju, P.; Duan, W.; Ji, L.; Li, H.; Liu, X.; Zhou, H.; et al. Magnetron sputtering NbSe2 film as lubricant for space current-carrying sliding contact. Friction 2022, 11, 383–394. [Google Scholar] [CrossRef]
  17. Yang, Y.; Mu, H.; Yao, Y.; Li, H.; Niu, G.; Liu, C.; Qian, Z. Particle traps constructed on the insulator of conductive slip rings for surface flashover mitigation under particle adhesion. AIP Adv. 2024, 14, 055216. [Google Scholar] [CrossRef]
  18. Li, J.; Li, J.; Wang, X.; Tian, G.; Fan, J. Machine Vision-Based Method for Measuring and Controlling the Angle of Conductive Slip Ring Brushes. Micromachines 2022, 13, 447. [Google Scholar] [CrossRef]
  19. Chen, X.; Wang, Y.; Sheng, Y.; Yu, C.; Yang, X.; Xi, J. Vision-Aided Brush Alignment Assembly System for Precision Conductive Slip Rings. Machines 2022, 10, 393. [Google Scholar] [CrossRef]
  20. Qian, Z.; Han, C.; Li, N.; Tian, G.; Li, J.; Wu, H. Hollow-Type Integrated Assembly Design and Performance Validation of Conductive Slip Rings via Simulation-Driven Optimization. Machines 2025, 13, 415. [Google Scholar] [CrossRef]
  21. Zhang, Y.; Meng, L.; Liu, M. Finite Angle Multichannel Space Slip Ring Design. IOP Conf. Ser. Earth Environ. Sci. 2019, 252, 022108. [Google Scholar] [CrossRef]
  22. Zhang, Y.; Meng, L.; Liu, M. Fatigue Analysis and Optimization of a Conductive Slip Ring with Finite Angle of Rotation. IOP Conf. Ser. Earth Environ. Sci. 2019, 252, 022107. [Google Scholar] [CrossRef]
  23. Ramírez, E.I.; Figueroa, C.G.; Romero, J.L.; Ramos, E.; Schouwenaars, R.; Ortiz, A. Stress corrosion cracking of the slip-ring connectors of a 2 MW wind turbine. Eng. Fail. Anal. 2022, 141, 106732. [Google Scholar] [CrossRef]
  24. Holm, E.; Williamson, J.B.P.; Holm, R. Electric Contacts: Theory and Application; Springer: Berlin/Heidelberg, Germany, 2013. [Google Scholar]
  25. Greenwood, J.; Williamson, J. Contact of Nominally Flat Surfaces. Proc. R. Soc. Lond. Ser. A 1966, 295, 300–319. [Google Scholar] [CrossRef]
  26. Jonckheere, B.; Bouzerar, R.; Ait Mohamed, S.; Bausseron, T. Electrical arc transfer in a multi-contact interface. Sens. Actuators A Phys. 2022, 335, 113215. [Google Scholar] [CrossRef]
  27. Archard, J.F. Contact and Rubbing of Flat Surfaces. J. Appl. Phys. 1953, 24, 981–988. [Google Scholar] [CrossRef]
  28. Przybyszewski, J.S. A Review of Lubrication of Sliding and Rolling Element Electrical Contacts in Vacuum; National Aeronautics and Space Administration: Washington, DC, USA, 1968.
  29. Persson, B.N.J. On the Electric Contact Resistance. Tribol. Lett. 2022, 70, 88. [Google Scholar] [CrossRef]
  30. Poljanec, D.; Kalin, M.; Kumar, L. Influence of contact parameters on the tribological behaviour of various graphite/graphite sliding electrical contacts. Wear 2018, 406–407, 75–83. [Google Scholar] [CrossRef]
  31. Turel, A.; Slavič, J.; Boltežar, M. Electrical contact resistance and wear of a dynamically excited metal–graphite brush. Adv. Mech. Eng. 2017, 9, 168781401769480. [Google Scholar] [CrossRef]
  32. Liu, S.; Wang, Q.; Luo, Y. A review of applications of visual inspection technology based on image processing in the railway industry. Transp. Saf. Environ. 2019, 1, 185–204. [Google Scholar] [CrossRef]
  33. Tian, R.; Wang, S.-J.; Lu, M.; Li, J. Study on the Ablation of Slide Plate by Pantograph–Catenary Arc Based on Pantograph Slide Material. Infrastructures 2025, 10, 276. [Google Scholar] [CrossRef]
  34. Pan, L.; Wang, X.; Yuan, Y.; Xing, T.; Chen, L. Transient Arcing Characteristics of the Pantograph–Catenary System in Electrical Sectioning Overlaps. Infrastructures 2026, 11, 17. [Google Scholar] [CrossRef]
  35. Yu, X.; Su, Y.; Song, M.; Yang, J.; Song, L.; Wang, Z.; Liu, Y.; Wei, C.; Cheng, Y. Simulation of Pantograph–Catenary Arc Temperature Field in Urban Railway and Study of Influencing Factors on Arc Temperature. Infrastructures 2025, 10, 237. [Google Scholar] [CrossRef]
  36. Wang, X.; Song, Y.; Wang, X.; Duan, F.; Liu, Z. Study on Phase-Change Melting Characteristics of Rigid Catenary Wires under Dynamic Separation Process. Transp. Saf. Environ. 2026, 8, tdag002. [Google Scholar] [CrossRef]
  37. Xing, T.; Wang, X.; Pan, L.; Song, Y.; Zhang, D.; Yu, Q. Effect of Structural Parameters on Pantograph–Catenary Interaction Performance in High-Speed Railways. Infrastructures 2026, 11, 88. [Google Scholar] [CrossRef]
  38. Wang, X.; Song, Y.; Yang, H.; Wang, H.; Lu, B.; Liu, Z. A time-frequency dual-domain deep learning approach for high-speed pantograph-catenary dynamic performance prediction. Mech. Syst. Signal Process. 2025, 238, 113258. [Google Scholar] [CrossRef]
  39. Wang, X.; Liu, Z.; Song, Y.; Jin, W.; Xu, Z.; Xiong, J.; Zhou, S. Dynamic Characteristics of Electric Shoegear and Conductor Rail System Considering the Track Irregularities. IEEE Trans. Instrum. Meas. 2023, 72, 7504813. [Google Scholar] [CrossRef]
  40. Wei, D.; Zhu, L.; Wu, J.; Tong, Z.; Xia, S.; Lin, J. 3-D Simulation Study on Deep Dielectric Charging Characteristics of Satellite Slip Ring Assembly. IEEE Trans. Plasma Sci. 2023, 51, 3384–3391. [Google Scholar] [CrossRef]
  41. Si, C.; Zheng, D.; Sun, S.; Wang, D.; Xu, W. Physical model of electrical contact friction for wear failure analysis and prediction of aerospace slip rings. Eng. Fail. Anal. 2026, 186, 110526. [Google Scholar] [CrossRef]
  42. Jackson, R.L. Stochastic Contact Theories: Other Theories Based on the Greenwood-Williamson Model. In Encyclopedia of Tribology; Wang, Q.J., Chung, Y.-W., Eds.; Springer: Boston, MA, USA, 2013; pp. 3299–3306. [Google Scholar]
  43. Xiu, S.X.; Liu, S.Q.; Yang, J.W.; Shen, Y.T.; Guo, M.Q.; Zhu, D.J. Study on arc characteristics and influencing factors of cup-shaped axial magnetic field contact at different gap distances. Vacuum 2024, 220, 112849. [Google Scholar] [CrossRef]
  44. Liu, S.; Bo, X.; Liu, Z.; Geng, Y. Investigation of vacuum arc ignition characteristics and erosion morphology microstructure characteristics of CuCr55 electrode contact materials. AIP Adv. 2024, 14, 085203. [Google Scholar] [CrossRef]
  45. Reichelt, M.; Cappella, B. Large scale multi-parameter analysis of wear of self-mated 100Cr6 steel—A study of the validity of Archard’s law. Tribol. Int. 2021, 159, 106945. [Google Scholar] [CrossRef]
  46. Kang, J.H.; Park, I.W.; Jae, J.S.; Kang, S.S. A study on a die wear model considering thermal softening: (I) Construction of the wear model. J. Mater. Process. Technol. 1999, 96, 53–58. [Google Scholar] [CrossRef]
  47. Kang, J.H.; Park, I.W.; Jae, J.S.; Kang, S.S. A study on die wear model considering thermal softening (II): Application of the suggested wear model. J. Mater. Process. Technol. 1999, 94, 183–188. [Google Scholar] [CrossRef]
  48. Wilkus, M.; Polak, S.; Gronostajski, Z.; Kaszuba, M.; Rauch, Ł.; Pietrzyk, M. Modelling of the die wear in the hot forging process using the archard model. Comput. Methods Mater. Sci. 2014, 26, 311–321. [Google Scholar] [CrossRef]
  49. Wei, X.; Yu, D.; Sun, Z.; Yang, Z.; Song, X.; Ding, B. Arc characteristics and microstructure evolution of W–Cu contacts during the vacuum breakdown. Vacuum 2014, 107, 83–89. [Google Scholar] [CrossRef]
Figure 1. SADA context and representative imagery: (a) schematic showing the location of the slip-ring/brush assembly in the SADA power path; (b) SADM; (c) slip ring and brushes.
Machines 14 00674 g001
Figure 2. Coordinate definition and θ–z surface discretization for a conductive track. The per-cell state variables used subsequently are listed here.
Machines 14 00674 g002
Figure 3. Coupled mechanical–electrical–thermal–wear interaction. Disturbance-driven separations modulate brush dynamics and rough contact; contact and arc conduction set heat sources; vacuum thermal transport updates temperature; wear updates geometry and closes the loop.
Machines 14 00674 g003
Figure 4. Brush normal dynamics (per brush): mass–spring–damper with preload, disturbed clearance due to eccentric runout/micro-vibration, and resulting normal reaction and gap.
Machines 14 00674 g004
Figure 5. FAST–MACRO strategy: 20 s high-fidelity windows provide averaged heat and wear-rate maps; 100 h macro evolution advances wear and temperature with periodic recalibration.
Machines 14 00674 g005
Figure 6. Baseline evolution of maximum wear depth and maximum temperature for Tracks 1 and 2 over 100 h: (a) maximum wear depth; (b) maximum temperature.
Machines 14 00674 g006
Figure 7. Baseline evolution of (a) Joule heating power, (b) frictional power, and (c) arc power for the two tracks. The blue and red lines represent Track 1 and Track 2, respectively.
Machines 14 00674 g007
Figure 8. Baseline evolution of (a) effective contact ratio and (b) micro-contact ratio for all brushes over 100 h.
Machines 14 00674 g008
Figure 9. Baseline surface-resolved wear maps after 100 h, showing track-dependent localization.
Machines 14 00674 g009
Figure 10. RUNOUT sweep: (a) final maximum wear; (b) final maximum temperature; (c) final equivalent resistance; (d) final arc activity.
Machines 14 00674 g010
Figure 11. RUNOUT sweep: final mean effective contact ratio, showing progressive contact degradation with increasing runout.
Machines 14 00674 g011
Figure 12. RUNOUT sweep: wear-evolution curves over 100 h.
Machines 14 00674 g012
Figure 13. RUNOUT sweep: evolution of arc activity over 100 h. The Runout 1 and Runout 2 cases did not generate arc activity, and their values were zero throughout the simulation.
Machines 14 00674 g013
Figure 14. PRELOAD sweep: (a) final maximum wear; (b) final maximum temperature; (c) final equivalent resistance; (d) final arc activity.
Machines 14 00674 g014
Figure 15. PRELOAD sweep: final mean effective contact ratio, showing improved contact stability at larger preload.
Machines 14 00674 g015
Figure 16. PRELOAD sweep: wear-evolution curves over 100 h.
Machines 14 00674 g016
Figure 17. PRELOAD sweep: evolution of arc activity over 100 h.
Machines 14 00674 g017
Table 1. Baseline parameter set used in the simulations.
CategoryParameterValue (Baseline)
ElectricalBus voltage28 V
Command currents IcmdTrack 1: 10 A; Track 2: 6 A
Runoute1/e2 (per track)12 µm/4 µm
Micro-vibration amplitude A v /freq. f v 3 µm/80 Hz
Brushmb, kb, cb (per brush)0.02 kg; 5 × 10⁵ N/m; 450 N·s/m
Preload P0 (per brush)36 N (+1.2 N ripple)
ContactClearance c0; Kc; pmax1.0 µm; 9 × 10¹⁴; 120 MPa
RoughnessRMS σ; correlation lengths0.40 µm; (θ: 12, z: 10) cells
Electrical contactρ0, αρ2.4 × 10⁻⁸ Ω·m; 0.0034 1/K
Film area resistance Rf0_area6 × 10−8 Ω·m2
Arc eventsgmingmax; vsep,min0.8–60 µm; 5 µm/s
R0, kgap10 Ω; 6 × 10⁵ Ω/m
Arc ignitionλ0; powers2 × 10−2 1/s; (gap: 1.2, j: 2.0)
Thermalε; teff; hub sink0.55; 1.5 mm; enabled
MultiscaleFAST/MACRO20 s @1 ms; 100 h @300 s; recalib 1 h
Table 2. Simulation case families, varied parameters, and parameter levels.
Case FamilyVaried Parameter(s)Exact Levels
BaselineNoneReference condition in Table 1
Runout sweepe1, e2, and vibration amplitude (preload fixed at 36 N)(4, 1.5, 0.5), (8, 2.5, 1.5), (12, 4, 3), (16, 5, 4), (20, 7, 5), (24, 8, 6), (30, 10, 8) µm
Preload sweepBrush preload P0 (runout fixed at e1 = 12 µm, e2 = 4 µm, Av = 3 µm)28, 32, 36, 40, 44, 48, 52 N
Disclaimer/Publisher’s Note: The statements, opinions and data contained in all publications are solely those of the individual author(s) and contributor(s) and not of MDPI and/or the editor(s). MDPI and/or the editor(s) disclaim responsibility for any injury to people or property resulting from any ideas, methods, instructions or products referred to in the content.