1. Introduction
Pumping stations serve as the foundation platform for large-scale fluid machinery, and their structural dynamic characteristics directly govern the operational stability and service life of the installed pump units. As critical components of water transfer infrastructure, large-scale pumping stations play an indispensable role in cross-regional water allocation, flood control, and enhancing the climate resilience of water supply systems [
1,
2,
3]. In China, the pronounced spatial and temporal heterogeneity of water resources presents formidable challenges to environmental and economic sustainability. The region south of the Yangtze River accounts for only 38% of the nation’s arable land yet possesses over 80% of its total water resources, whereas the Huang–Huai–Hai Basin, encompassing 40% of the cultivated land area, holds merely 8% of the water resources [
4]. This fundamental geographic disparity has driven the extensive development of pumping station infrastructure to safeguard water supply security and long-term socio-economic sustainability. Since the 1960s, China has commissioned major water transfer initiatives, including the Jiangsu Water Transfer Project, the Luanhe–Tianjin Water Diversion Project, and the Yellow River to Qingdao Project. Most notably, the Eastern and Middle Routes of the South-to-North Water Transfer Project have established an extensive water supply network traversing four major river basins. By the second half of 2024, the Eastern Route alone had conveyed over 7 billion cubic meters of water, delivering vital resources to recipient regions and benefiting tens of millions of inhabitants [
5,
6,
7]. Despite these substantial societal benefits, the safe and stable operation of such pumping stations remains critically dependent on the vibration behavior of the pump foundation system. Structural vibrations in low-head vertical pumping stations pose a significant threat to the operational safety and long-term durability of both the pump house structure and the supported pump units, with the potential to induce fatigue damage, accelerate component wear, and curtail the service life of critical fluid machinery elements.
In water conveyance systems, pumping stations serve as core nodes for water delivery, and the structural integrity of their foundations directly affects the reliability and operational efficiency of the installed fluid machinery. Large-scale vertical pumping stations, characterized by their compact layout, operational flexibility, and favorable hydraulic performance, are extensively deployed in low-head, high-discharge applications [
8,
9]. This configuration typically employs a wet-chamber design comprising a massive underwater concrete block foundation and an above-ground powerhouse superstructure, with the vertical pump units mounted directly on the block foundation. As water transfer projects trend toward ever-larger capacities, individual unit ratings continue to escalate, rendering vibration-induced structural response an increasingly critical constraint on long-term infrastructure reliability [
10]. Excessive vibration not only disrupts normal pump operation but also threatens the durability of fluid machinery components through mechanisms including structural fatigue of the foundation, progressive misalignment of pump shafts, efficiency degradation, and, in severe cases, catastrophic mechanical failure. Field observations indicate that numerous large pumping stations worldwide have experienced abnormal vibration episodes, with several facilities operating under enforced load restrictions due to resonance-induced vibration amplification. Such incidents have resulted in substantial economic losses and have compromised the long-term resilience of critical water infrastructure [
11,
12].
The core of pumping station dynamic characteristic analysis involves obtaining natural frequencies, mode shapes, and damping ratios through modal analysis, thereby comparing them with excitation frequencies to assess resonance risk. Zeng et al. [
13] proposed a resonance risk assessment method combining unsteady CFD, modal work approach, and harmonic response analysis, and applied it to a storage pump impeller to quantitatively determine natural frequencies and resonance amplitudes. Xia et al. [
14] established a combined analytical, CFD, and FEM model to investigate the natural mode splitting of a rotating pump-turbine runner, revealing the relationship between diametrical mode components and blade count. Chen and Gao [
15] identified modal parameters of the Jiangdong Pumping Station through stochastic subspace identification, enhanced frequency domain decomposition, and least squares complex frequency domain methods, revealing local resonance risks induced by unit aging through finite element analysis. Two principal approaches exist for obtaining modal parameters: numerical simulation and experimental testing. In numerical simulation, the finite element method has become the predominant tool. Ye et al. [
16] established a hybrid model combining lumped parameters, finite element method, and boundary element method for an axial piston pump, calculating pump vibration and validating the model through experimental modal analysis. Li et al. [
17] developed ANSYS simulation and concentrated-mass models for a four-stage centrifugal-pump rotor system, validating the benchmark role of the finite element method in modal analysis through a comparative study. Early investigations often employed simplified beam or two-dimensional plane models, which, although capable of estimating fundamental frequencies, were inadequate for capturing the vibration behavior of complex spatial structures. Jiang et al. [
18] established a full-scale fluid–structure interaction model of a five-stage centrifugal pump and analyzed vibration modes at blade passing frequencies, revealing the mechanisms of resonant noise generation and propagation. With advances in computational capability, three-dimensional solid models have been progressively adopted. High-fidelity models incorporating details such as the powerhouse framework, floor slabs, columns, and conduits have significantly enhanced computational accuracy. Noun et al. [
19] established a high-fidelity three-dimensional fluid–structure interaction model of a turbopump and employed large eddy simulation combined with structural dynamic analysis, effectively improving the computational accuracy of flow-induced vibration predictions. Shang et al. [
20] established a three-dimensional fluid–structure interaction model of a pump-turbine and analyzed runner deformation and stress distribution under complex operating conditions, validating the accuracy of numerical simulations.
The accuracy of finite element simulations is critically contingent upon mesh discretization and boundary condition specification. An excessively coarse mesh tends to overestimate structural stiffness, leading to artificially elevated natural frequencies, whereas an overly refined mesh incurs prohibitive computational cost and may introduce numerical ill-conditioning. Fuenmayor et al. [
21] investigated discretization errors in finite element modal analysis and proposed an h-adaptive mesh optimization method, demonstrating the critical influence of element size on the accuracy of natural frequency calculations. Considering the geometric complexity of pumping station structures, tetrahedral elements are widely adopted for their superior adaptability. To ensure computational reliability, mesh quality is rigorously controlled during generation, with the element quality metric maintained above 0.8, thereby satisfying the mesh quality requirements for dynamic analysis [
22]. Conducting a mesh independence study to identify a discretization scheme that balances accuracy and computational efficiency is therefore a prerequisite for obtaining physically meaningful simulation results.
Complementing numerical simulations, experimental investigation constitutes another essential methodology for characterizing the true dynamic behavior of structures and provides a critical foundation for validating and calibrating numerical models. Early research primarily employed in situ vibration testing, placing accelerometers at key pump house locations to monitor operational vibration responses and identify frequency components through spectral analysis. As early as 1978, Lees and Haines [
23] conducted field tests on a large boiler feed pump, using accelerometers at bearings to monitor vibrations and spectral analysis to reveal complex vibration patterns. With technological advancements, ambient excitation and impact hammer methods have been introduced for structural dynamic characterization to avoid interference from artificial excitation with the structure’s true dynamic state. Minette et al. [
24] investigated the dynamic behavior of an electrical submersible pump using hammer excitation and experimental modal analysis, successfully identifying its natural frequencies and damping characteristics under operational conditions. Roig et al. [
25] investigated modal testing of a disk-shaft structure using hammer and transient excitation methods in both air and water, demonstrating the reliability of these excitation techniques under operating conditions. For large-scale axial-flow pumping stations, Qin et al. [
26] conducted modal identification on a pumping station structure using the Enhanced Frequency Domain Decomposition and Stochastic Subspace Identification methods, and compared the results with finite element analysis, validating the reliability of experimental modal identification. Laboratory model tests have also been employed to study structural dynamic characteristics and to explore the effects of boundary conditions and soil–structure interaction. Cui et al. [
27] conducted geotechnical centrifuge model tests with wave-absorbing boundaries to investigate the effects of boundary materials on ground-borne vibrations, revealing that Duxseal significantly influences the dynamic response of soil. Zangeneh et al. [
28] conducted full-scale vibration tests on a portal frame bridge and calibrated a three-dimensional soil–structure finite element model, analyzing the influence of soil–structure interaction on dynamic response and revealing the significant contribution of surrounding soil to system damping. Field experiments, however, are often constrained by sensor quantity limitations and environmental noise, making it difficult to comprehensively capture higher-order modes, while model tests face challenges in similarity ratio design. Consequently, the complementary and mutually validating combination of numerical simulation and experimental investigation has become a standard research paradigm in studies of pumping station dynamic characteristics.
Resonance verification, based on the identified structural free vibration characteristics, constitutes a critical step in evaluating vibration safety. Traditionally, this verification relies on comparing excitation frequencies with natural frequencies. It should be recognized that the frequency separation check is the standard first-tier screening procedure stipulated in design codes (e.g., NB 35011-2016 [
29]), which requires that the difference between the structural natural frequency and the forcing frequency, divided by either frequency, exceeds a specified threshold. This criterion, while practically effective and widely adopted, does not explicitly incorporate excitation force amplitude, modal participation factors, or the spatial distribution of excitation forces. As noted by Mitseas and Beer [
30], if the excitation force acts at a nodal point of a mode, even exact frequency coincidence may not induce significant response, and accurate prediction of peak responses requires consideration of modal participation beyond simple frequency comparison. Furthermore, the resonance risk of higher-order modes is frequently underestimated in conventional checks. Although the vibration energy of higher-order modes is typically low, these modes can still be excited under broadband excitation conditions, and energy transfer to higher frequencies can exacerbate stress levels, as demonstrated by Weidemann et al. [
31]. To address these limitations, more advanced resonance quantification methods have been proposed in recent studies. Tamura et al. [
32] treated modal participation factors as a spatial vector to incorporate the spatial distribution of excitation. Bayani et al. [
33] developed quantified frequency-domain metrics combining frequency proximity and mode shape similarity. Moutevelis et al. [
34] utilized participation factors of complex frequency variables to locate oscillation sources and trace their spatial propagation. These advanced methods represent a direction for future refinement beyond the scope of the present code-based screening framework.
For pumping station structures, excitation sources span a wide frequency range from several hertz to several hundred hertz. Moreover, the upper powerhouse features large spans and relatively low stiffness, resulting in densely distributed higher-order modes. Consequently, the possibility of higher-order modes being excited cannot be overlooked. Zeng et al. [
35] conducted experimental and computational studies on a parallel pumping system and found that large-amplitude vibrations occur when intrinsic pump frequencies fall into the broadband excitation range, highlighting the risk of mode excitation under wide-frequency excitations. Taking the impeller blade passage frequency as an example, its typical range is 10–25 Hz, whereas the first 50 natural frequencies of the pump house structure may already span this entire range. If only the first 10 or 20 modes are considered, critical resonance risks may be overlooked. Yu et al. [
36] employed the dynamic mode decomposition method to study rotor–stator interaction in a centrifugal pump, revealing the dominant frequencies and modal evolution characteristics of pressure pulsations, and highlighting the importance of analyzing higher harmonic modes under complex excitations. Therefore, extending the resonance verification range to higher-order modes is essential for comprehensively evaluating the vibration safety of pumping station structures.
Considering the current state of research, although significant progress has been made in studying the dynamic characteristics of pumping station structures, several critical issues warrant urgent attention. First, refined modeling of soil–structure interaction remains inadequate, particularly for large-scale vertical pumping stations where the underwater portion has considerable embedment depth. The contact state between the sidewalls and the backfill soil depends on the vibration amplitude and direction. Different contact assumptions yield substantial discrepancies in calculated natural frequencies, and determining which contact model most accurately represents actual conditions requires further investigation. Senjuntichai et al. [
37] established a dynamic soil–structure interaction model of a circular foundation embedded in multi-layered saturated soil and analyzed the influence of different permeability boundary conditions and embedment depths on vertical vibration responses, revealing that contact condition assumptions significantly affect calculation results. Ying et al. [
38] proposed a non-local contact method within the Smoothed Particle Hydrodynamics framework to model soil–structure interactions and validated it through benchmark problems, revealing that different contact assumptions significantly influence calculated earth pressure distributions and failure mechanisms. Second, the resonance risk of higher-order modes is generally underestimated. Current design specifications typically require verification of only the first few low-order modes; however, recent vibration measurements at several pumping stations have documented resonance phenomena involving higher-order modes with concerning frequency. Duan et al. [
39] established a high-fidelity finite element model of a bladed disk and investigated the effects of mistuning on forced response in high-frequency ranges, revealing that resonance risks in higher modes are often underestimated and can lead to significant vibration amplification. Third, the integrated analysis of vibration source identification and resonance verification requires further development. Existing studies often conduct vibration source analysis and structural modal analysis separately, performing only frequency comparisons during resonance verification without establishing a correlation between the spatial distribution of excitation forces and structural mode shapes. Wang et al. [
40] proposed a diagnostic framework combining multi-condition vibration testing and improved Operational Transfer Path Analysis to identify dominant vibration sources and quantify transmission paths in a combine harvester, revealing the coupling between excitation sources and structural responses. Therefore, it is necessary to conduct targeted analyses of local modes based on specific excitation application locations and to systematically assess the resonance risk associated with higher-order modes.
Based on the foregoing analysis, this study focuses on a typical large-scale vertical pumping station within the Jiangsu Water Transfer Project, conducting systematic research on three key aspects: natural vibration characteristic analysis, boundary condition impact assessment, and resonance risk verification. First, a three-dimensional solid finite element model is established, encompassing the upper powerhouse framework, floor slabs at various elevations, underwater conduits, intermediate piers, side piers, and a specified extent of backfill soil. A mesh independence analysis is performed to determine a discretization scheme that balances accuracy and computational efficiency. Second, four computational schemes are designed to systematically investigate the influence patterns of soil participation and contact conditions on natural frequencies, thereby identifying the boundary conditions that most closely approximate actual site conditions. Third, the frequencies of three principal excitation sources—rotational frequency at rated speed, blade passage frequency, and rotor–stator interaction frequency—are calculated and compared with the first 50 natural frequencies of the pump house for resonance verification, identifying potential risk zones. For the blade passage frequency, the calculation range is further extended to the 400th mode to systematically assess the resonance risk of higher-order modes.
The main contributions of this study are threefold. First, the refined simulation of boundary conditions compares the effects of bonded contact and normal contact on natural vibration characteristics, revealing the underlying mechanism of contact nonlinearity and transcending the limitations of traditional fixed or free boundary assumptions. Second, the systematic assessment of higher-order mode resonance risk extends the verification range from the conventional first 50 modes to the 400th mode, confirming that no substantial resonance risk exists for the blade passage frequency even at high mode orders. This demonstrates that for the present pumping station, the code-specified first-50-mode verification is sufficient to capture critical resonance risks. Third, the comprehensive verification of multi-source excitation frequencies simultaneously considers three distinct excitation sources—mechanical rotational frequency, blade passage frequency, and rotor–stator interaction frequency—establishing a complete resonance verification framework that spans low to high frequency ranges and directly informs the vibration-safe design of pump foundation systems for fluid machinery applications.
The remainder of this paper is organized as follows.
Section 2 elaborates on the finite element modeling methodology and numerical procedures for the pumping station, including model development, mesh generation strategy, and boundary condition specification. It then compares the free vibration characteristics of the pump house under four boundary condition scenarios, analyzes the effects of soil participation and different contact conditions on natural frequencies, and presents the first ten mode shapes of the structure.
Section 3 calculates the three principal excitation frequencies, namely the rotational frequency, the blade passage frequency, and the rotor–stator interaction frequency, and conducts resonance verification in accordance with relevant design codes. For the blade passage frequency, the analysis is extended from the first 50 modes to the 400th mode to assess potential high order resonance risks.
Section 4 summarizes the principal conclusions of the study and outlines directions for future research.
2. Computational Model and Analysis of Natural Vibration Characteristics
2.1. Research Object and Calculation Model
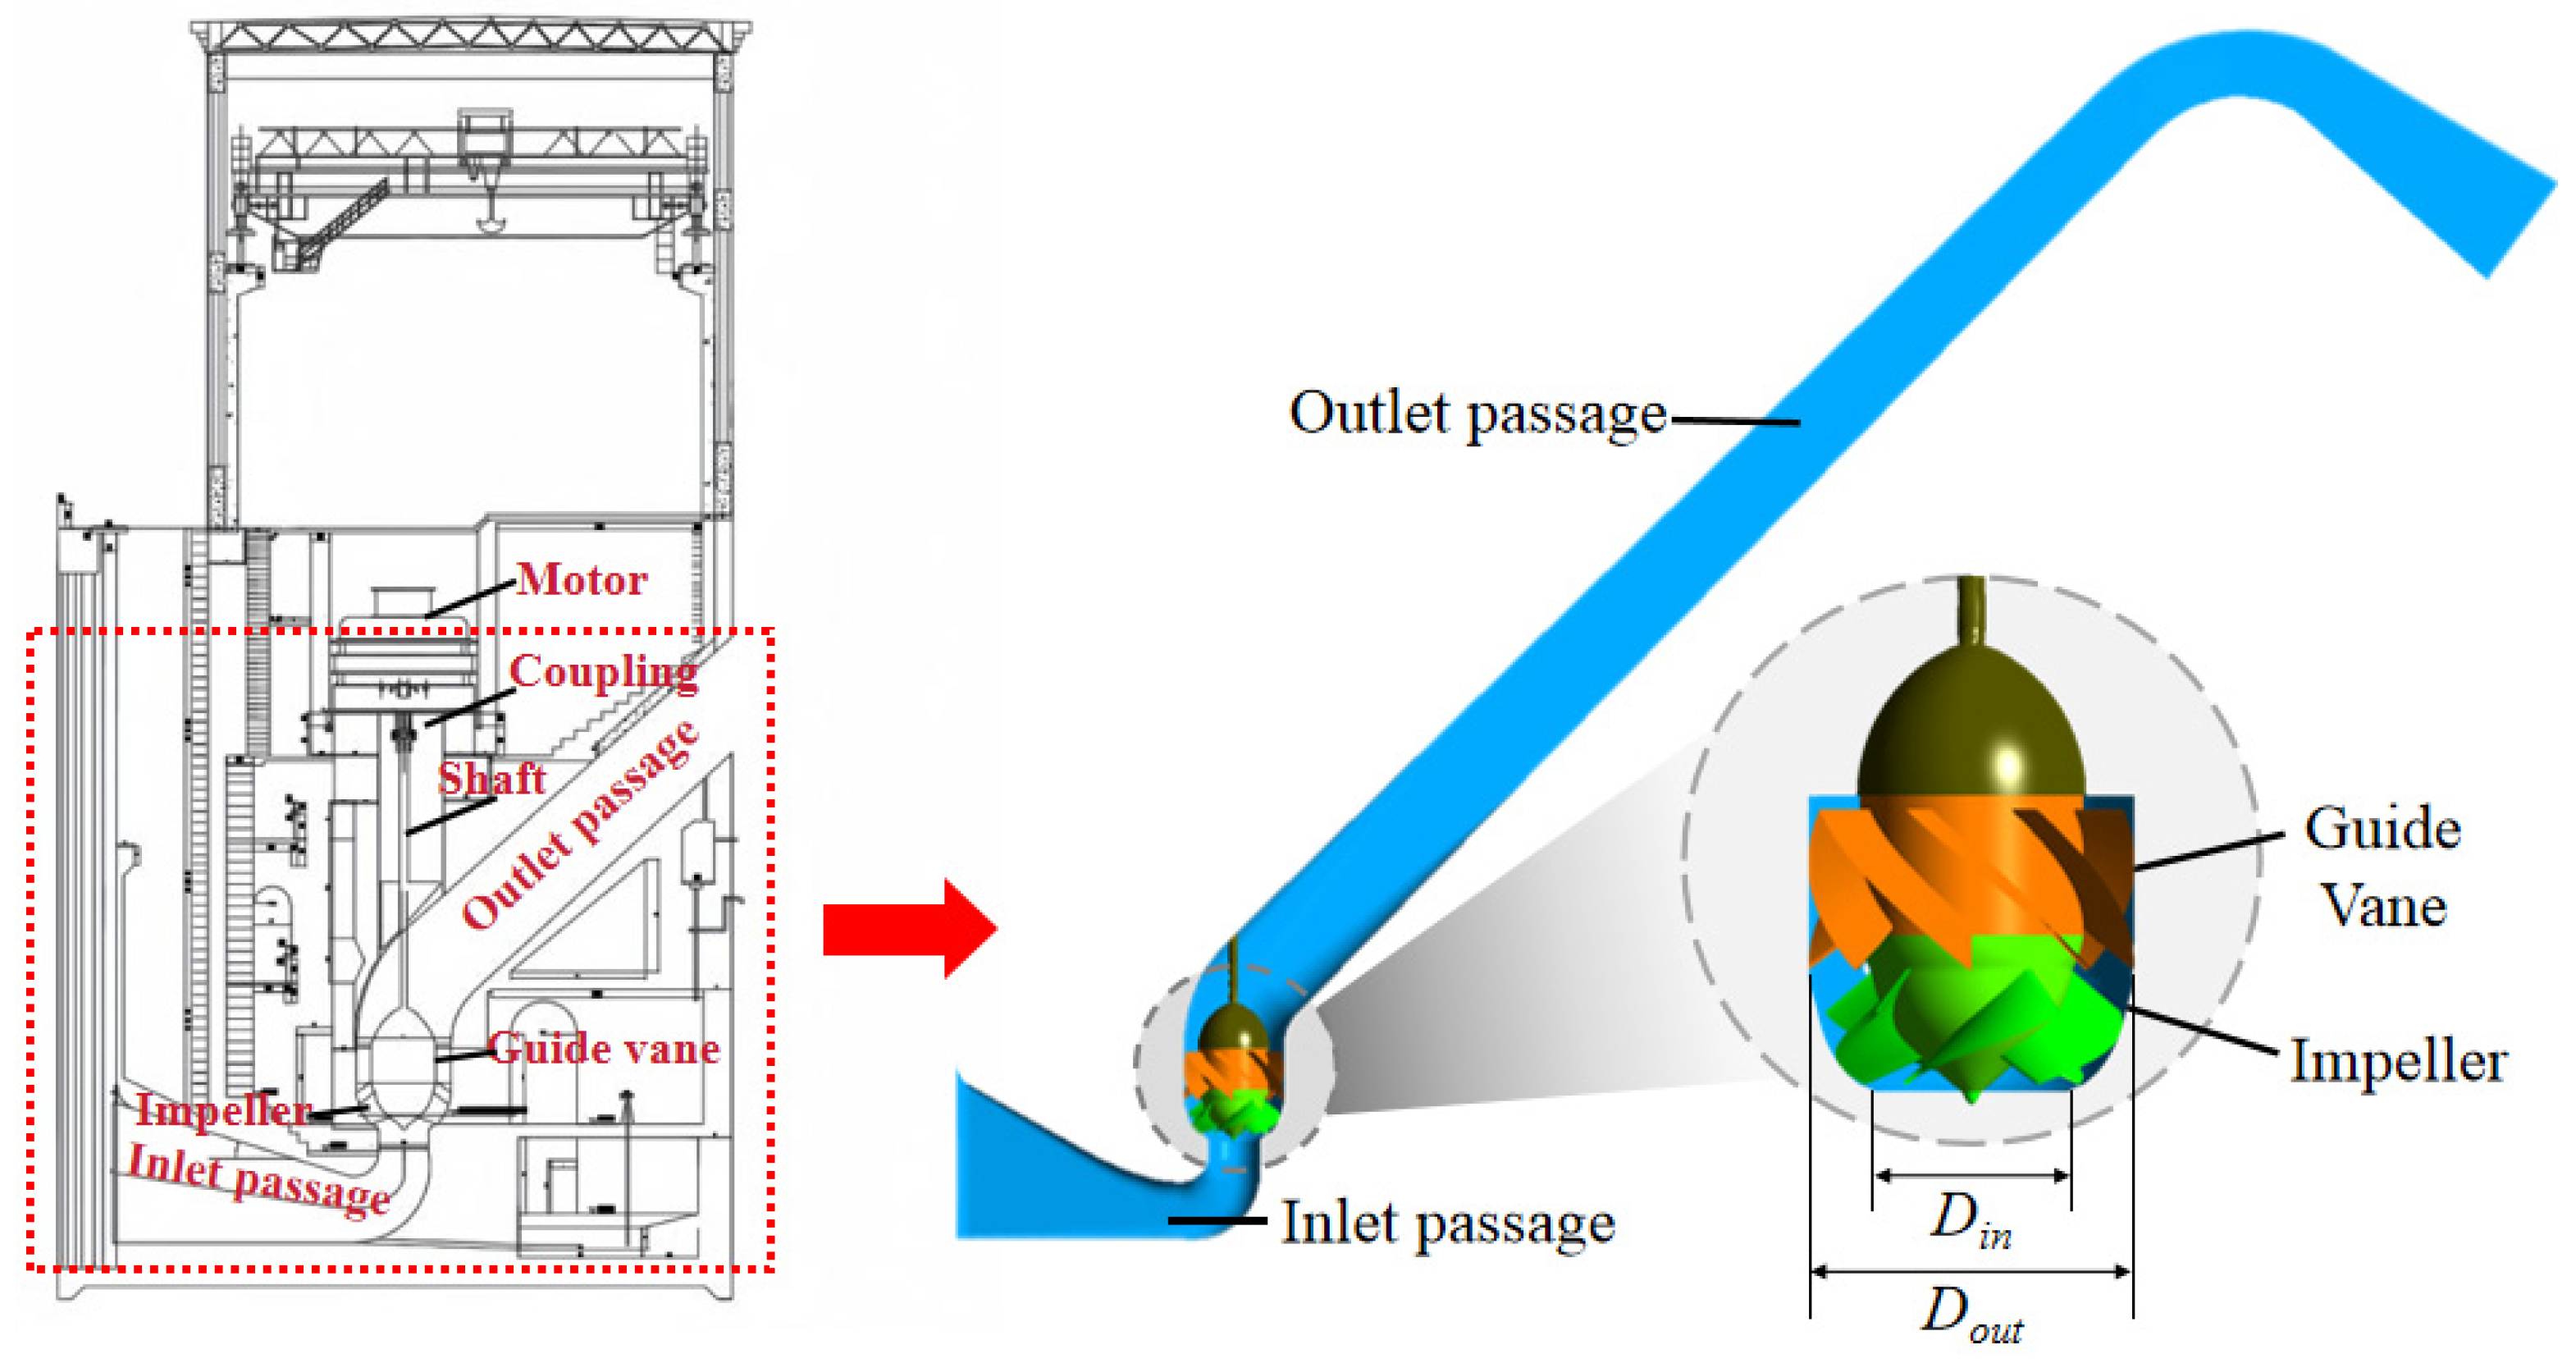
The subject of this study is a typical large-scale vertical pumping station within the Jiangsu Province Water Diversion Project. The station is designed to accommodate eight units of non-adjustable pull-out mixed-flow pumps, each with a flow rate of 13.8 m
3/s and a head of 17.5 m. From upstream to downstream, each pump unit comprises an inlet conduit, an impeller, guide vanes, and an outlet conduit. The impeller has an inlet diameter
Din of 1.33 m and an outlet diameter
Dout of 2.27 m. The total installed capacity is 2.48 × 10
4 kW. The underwater section of the main pump house measures 15 m in length and 40 m in width. The pump house adopts a vertical block-foundation structure, as illustrated in the cross-sectional view in
Figure 1.
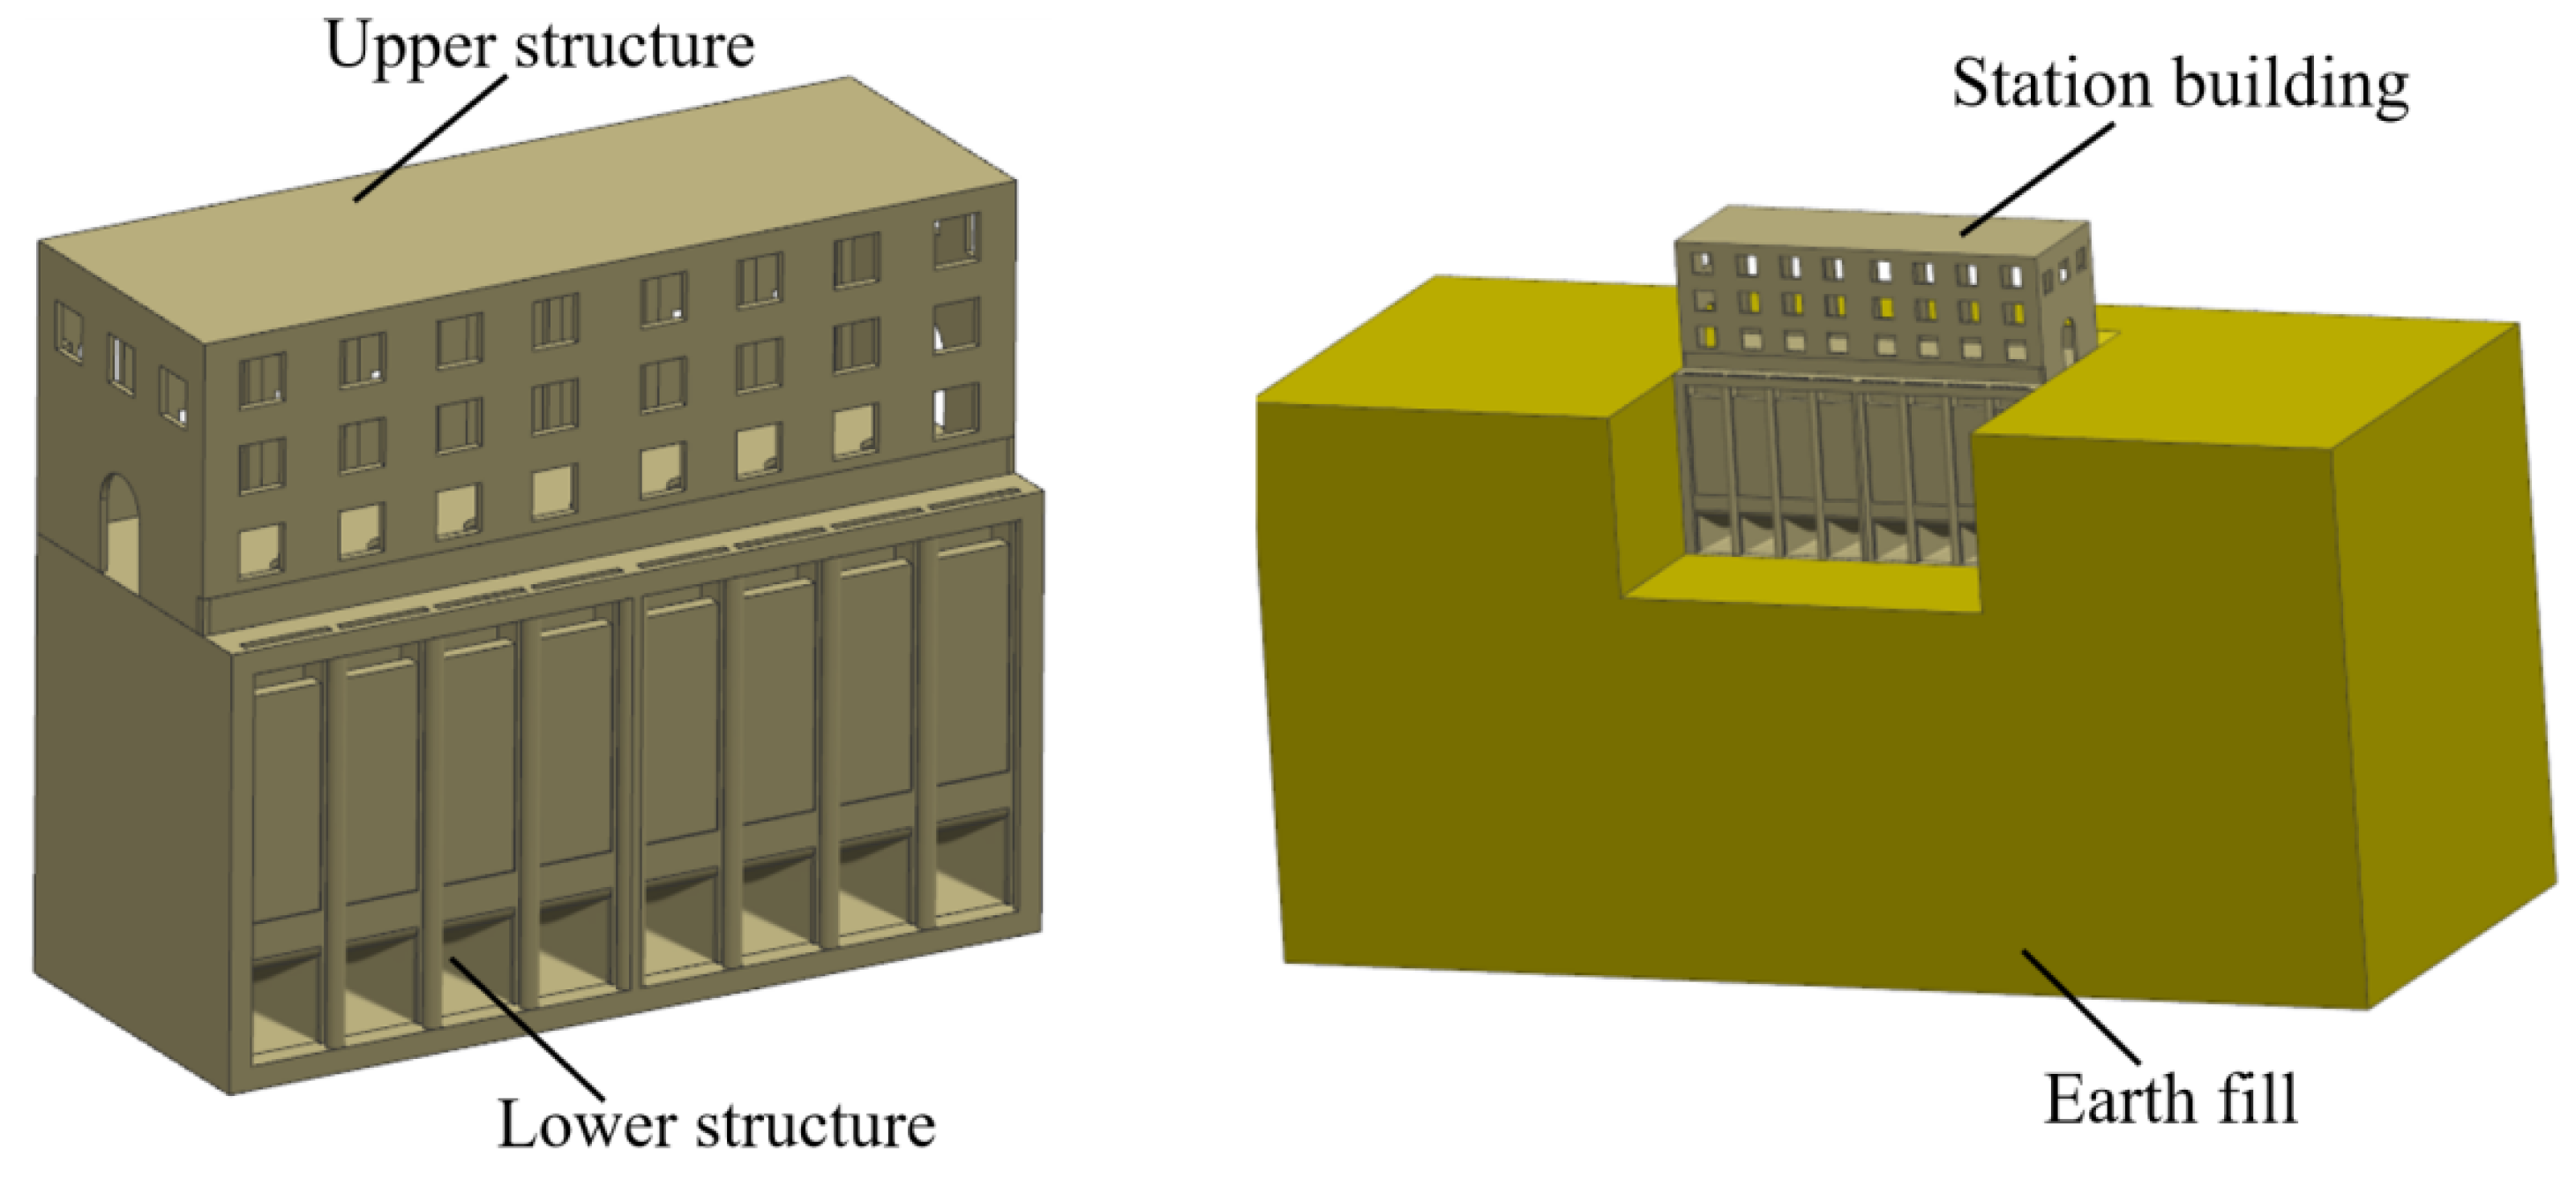
To accurately simulate the structural behavior of the pumping station, a three-dimensional solid finite element model is developed. The model comprises the upper plant frame, floor slabs at various levels, underwater conduits, intermediate piers, side piers, and a specified extent of surrounding backfill soil. The direction of flow is defined as the
X-axis, the span direction of the pump house as the
Y-axis, and the vertical direction as the
Z-axis. The three-dimensional finite element model of the pump house and backfill soil is shown in
Figure 2.
The primary structures are constructed with C30 concrete. The backfill soil and foundation are modeled as cohesive soil. The specific material parameters are listed in
Table 1.
It should be noted that the pump units themselves are not explicitly meshed as detailed structural components in the finite element model. Instead, the mass of each pump unit—including the impeller, shaft, motor, and associated auxiliary structures—is represented as a concentrated mass element applied at the corresponding mounting location on the pump foundation. This simplification is standard practice in the dynamic analysis of pumping station structures, where the primary interest lies in the global dynamic characteristics of the foundation system rather than in the local dynamics of the pump assembly. The concentrated mass approach captures the inertial contribution of the pump unit to the structural response while avoiding the prohibitive computational cost of fully resolving the pump geometry.
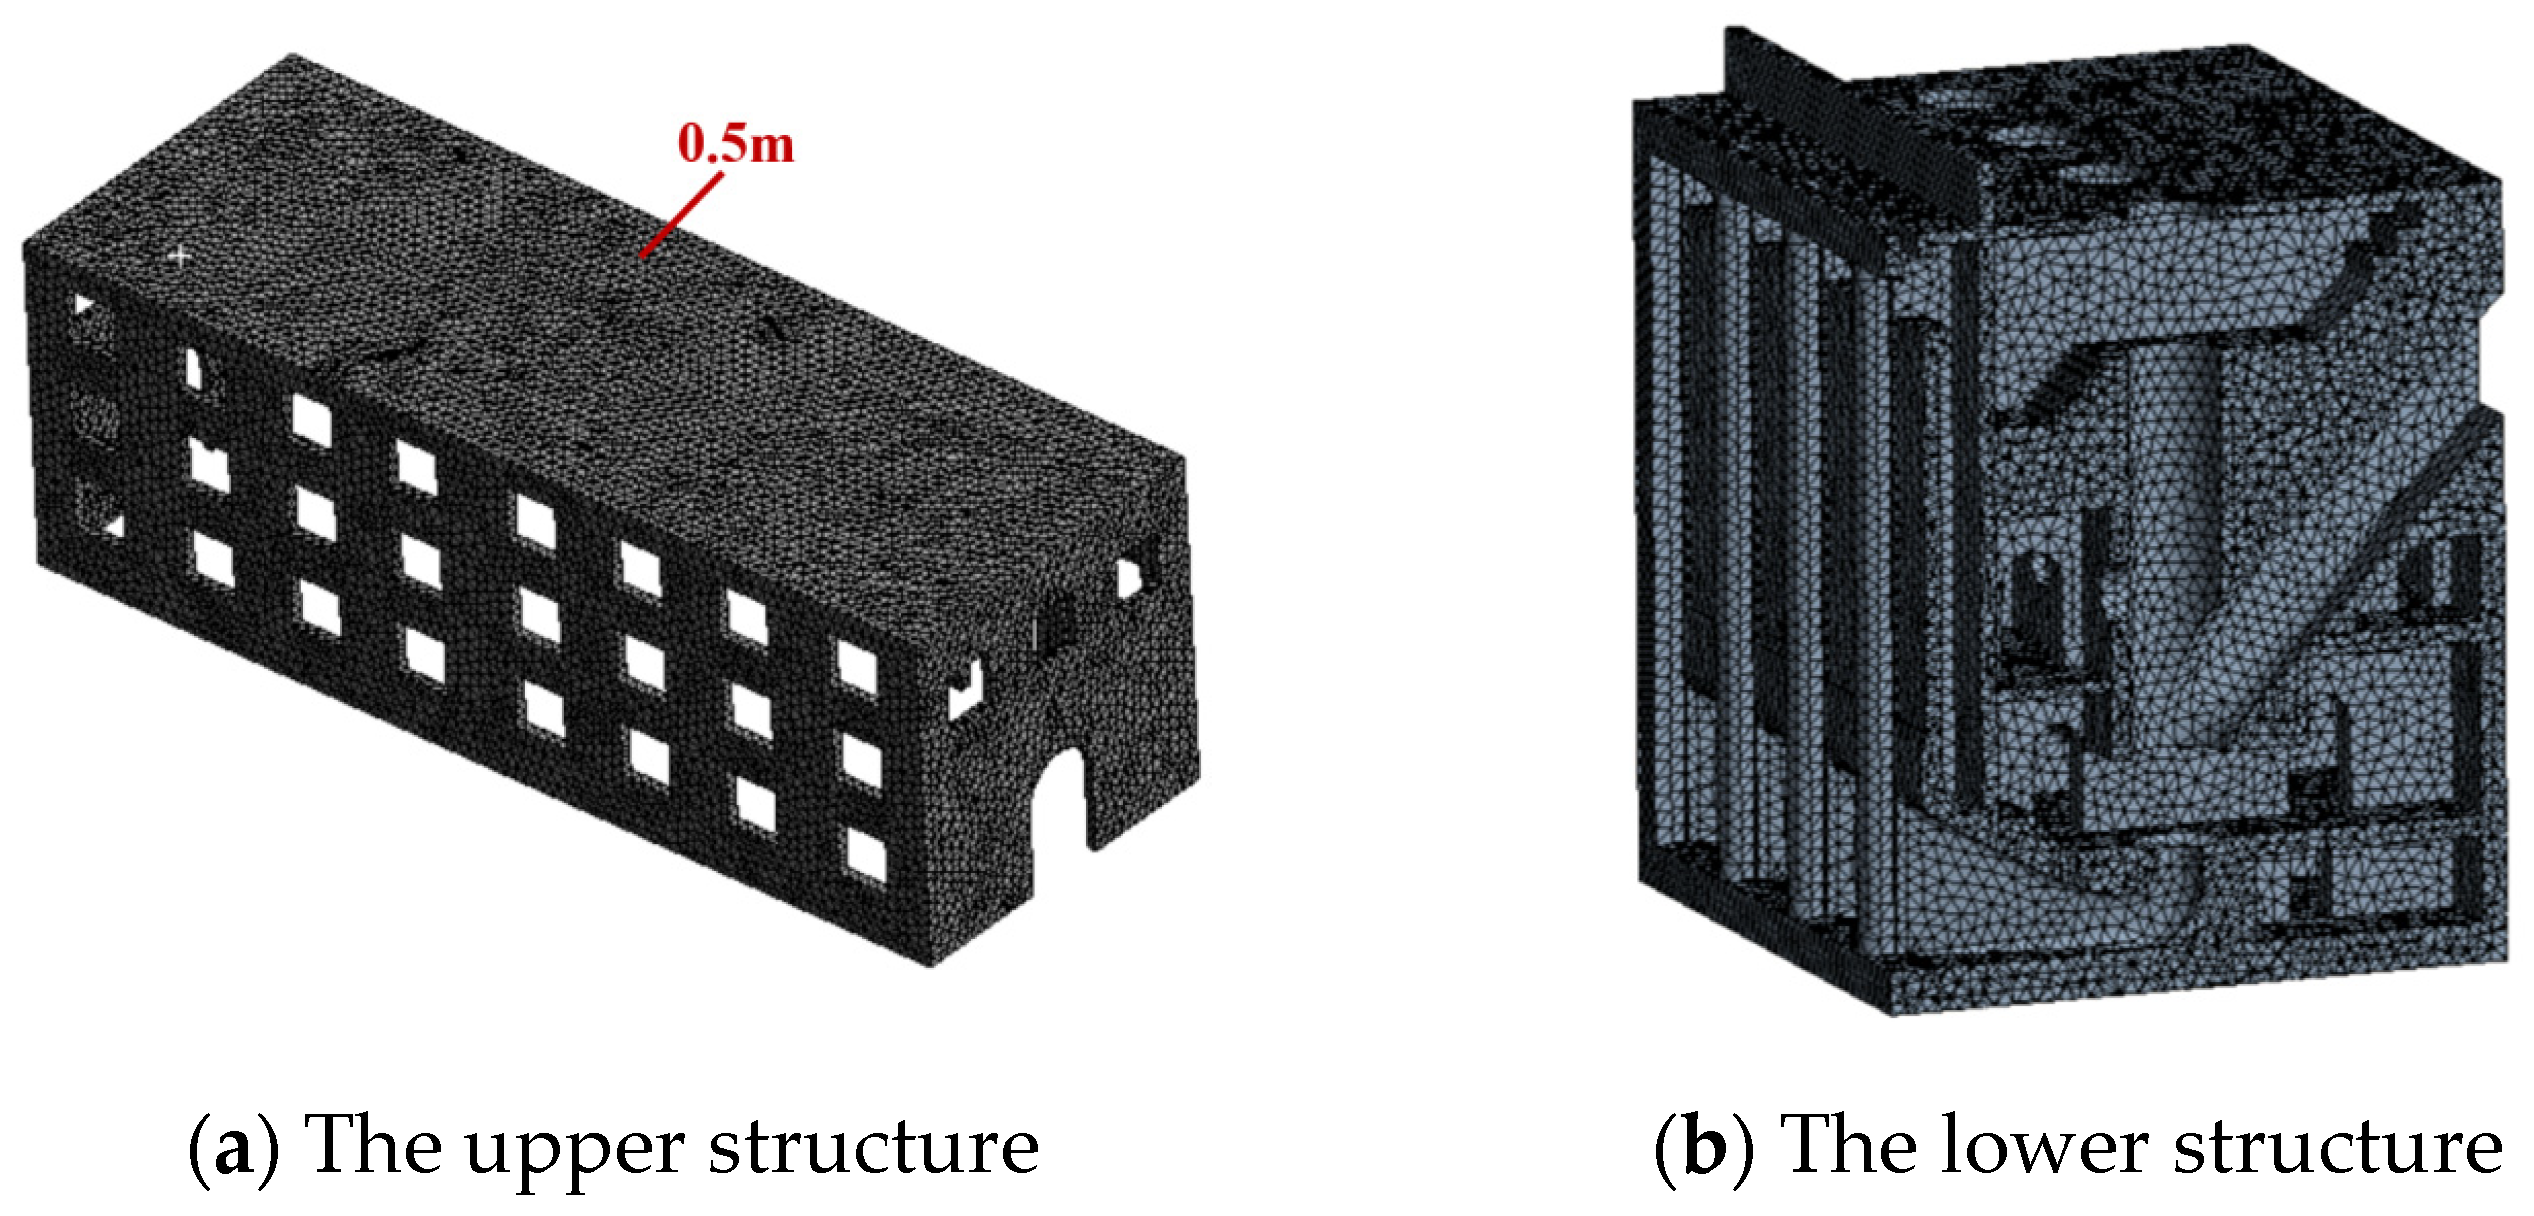
In finite element simulations, the meshing method and mesh quality are critical to the accuracy of the analysis results. It is generally accepted that as mesh density increases, the results become more reliable until further refinement no longer significantly affects the computational outcomes. Therefore, conducting a mesh independence analysis is essential. This study focuses on a large-scale vertical pumping station, the main body of which is a cast-in-place concrete structure. To ensure stability and precision in both mesh generation and subsequent calculations, the entire pump house structure is discretized using tetrahedral meshes. Meshes at corners and edges are generated automatically using the software’s default settings. The mesh independence analysis is performed on the concrete components. A schematic diagram of the mesh division is shown in
Figure 3.
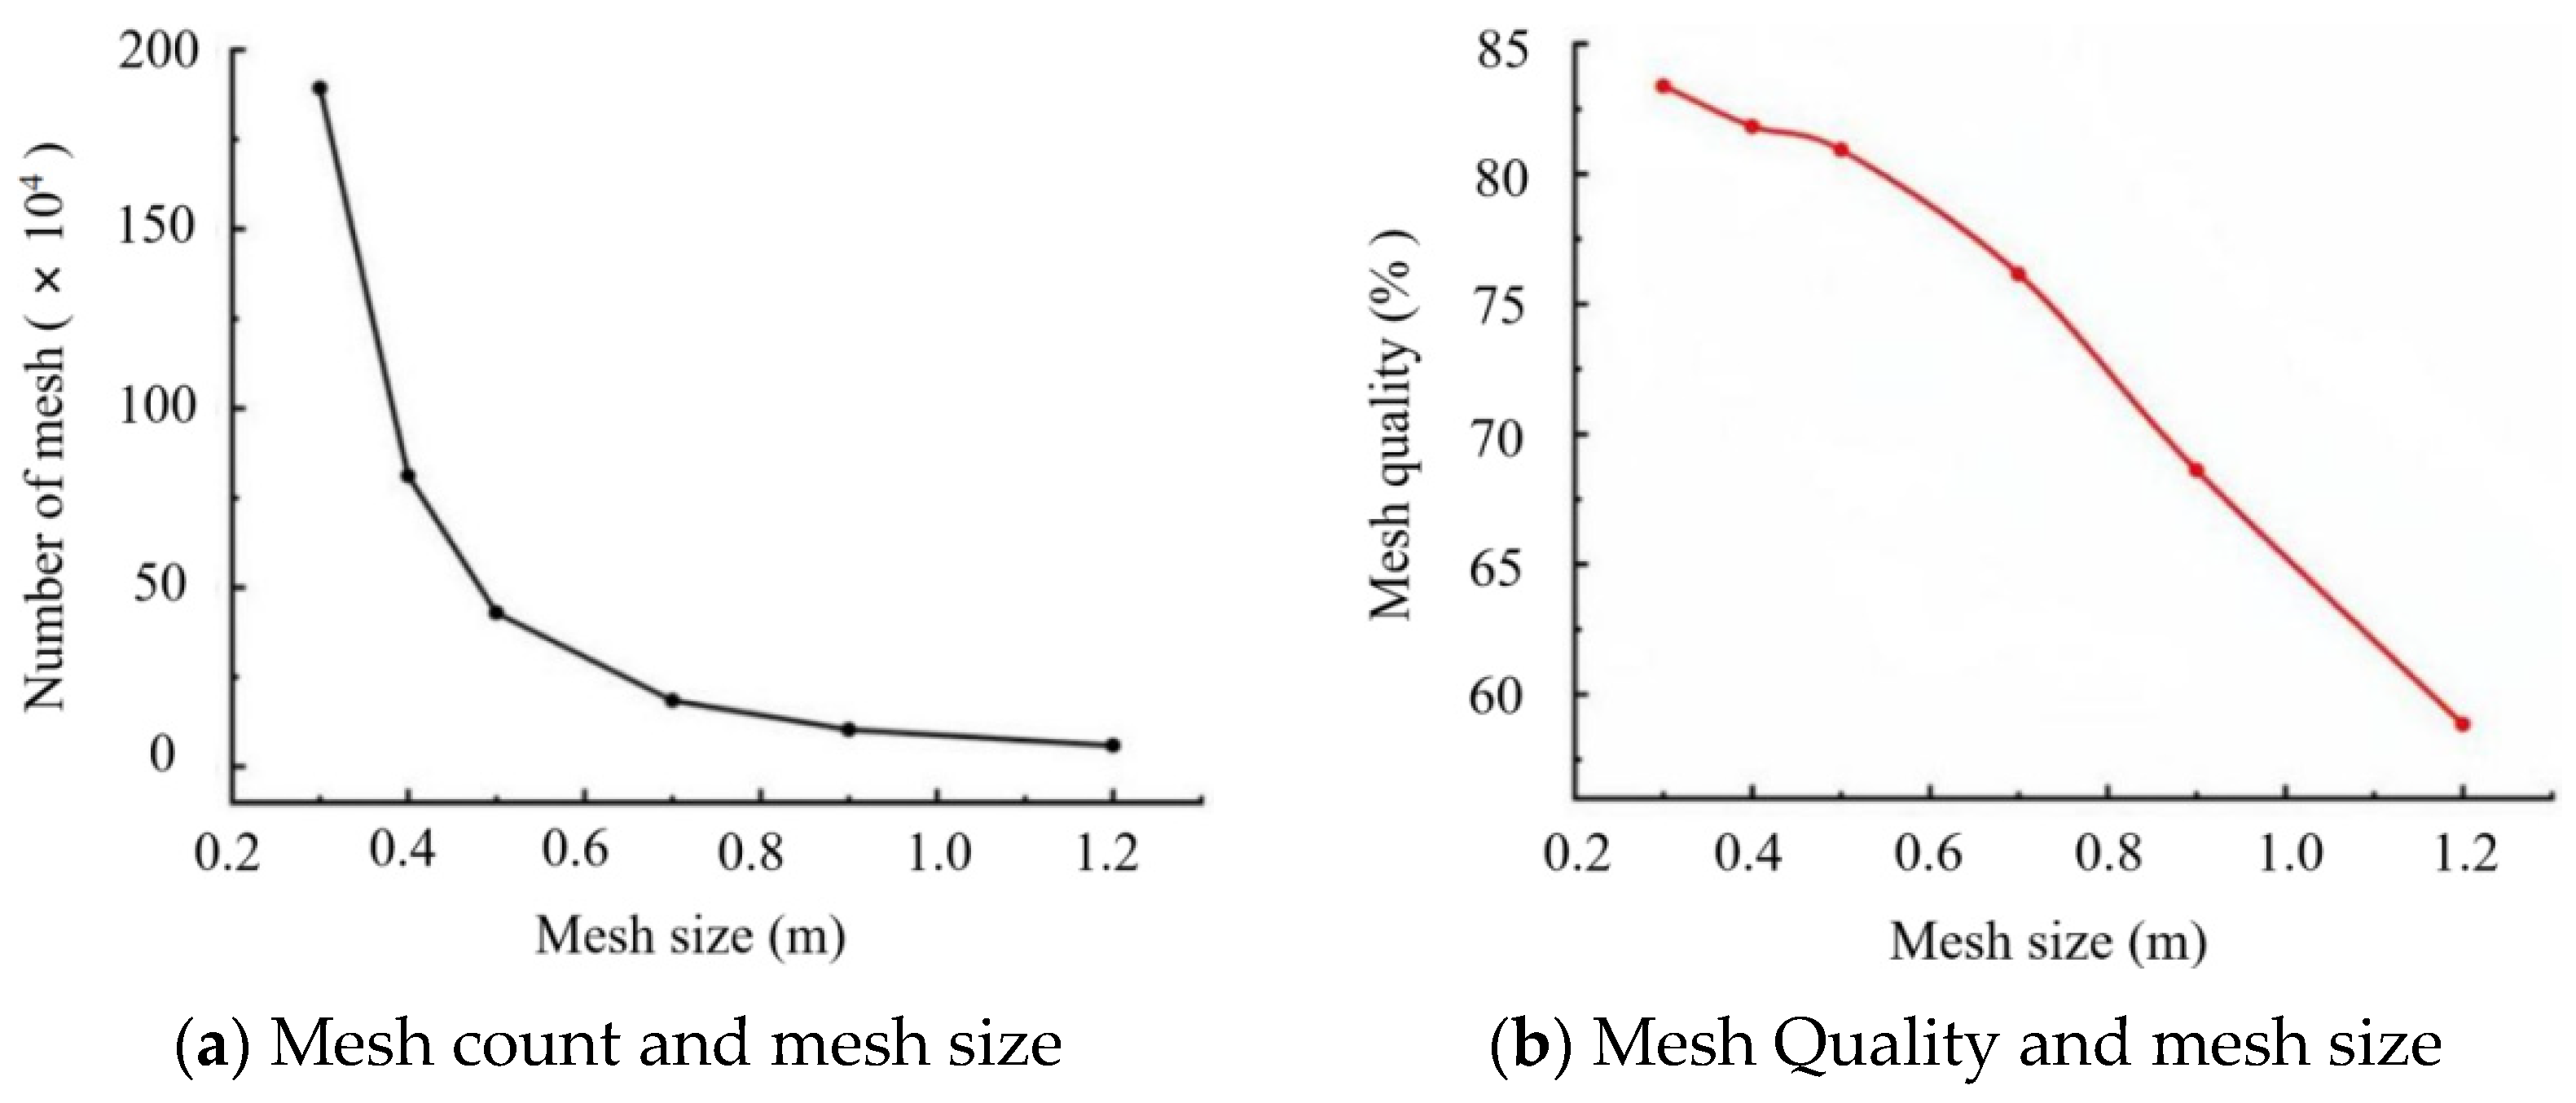
The mesh generation is performed using Workbench Mesh, with the element type specified as SOLID186. The entire pump house structure is discretized using tetrahedral elements. Fixed supports are applied at the base of the structure, while normal displacement constraints are imposed on the lower parts of the pump house. The mesh independence analysis is conducted without considering the participation of soil vibration. Global mesh sizes are set to 1.2 m, 0.9 m, 0.7 m, 0.5 m, 0.4 m, and 0.3 m, corresponding to mesh counts of 59,692, 103,512, 184,615, 429,544, 812,121, and 1,894,222, respectively. The relationship between mesh quality and mesh size is illustrated in
Figure 4a.
Element Quality is selected as the metric for evaluating mesh quality. This metric is based on the ratio of the actual element volume to its edge length, with values ranging from 0 to 1. In the study of the natural vibration characteristics of the pump house, mesh quality is considered good when the Element Quality value exceeds 0.8. Following mesh generation, the obtained Element Quality values are 0.588, 0.686, 0.762, 0.809, 0.818, and 0.833 for the respective mesh sizes. As shown in
Figure 4b, when the mesh size is less than 0.5 m, all Element Quality values are greater than 0.8, indicating good mesh quality.
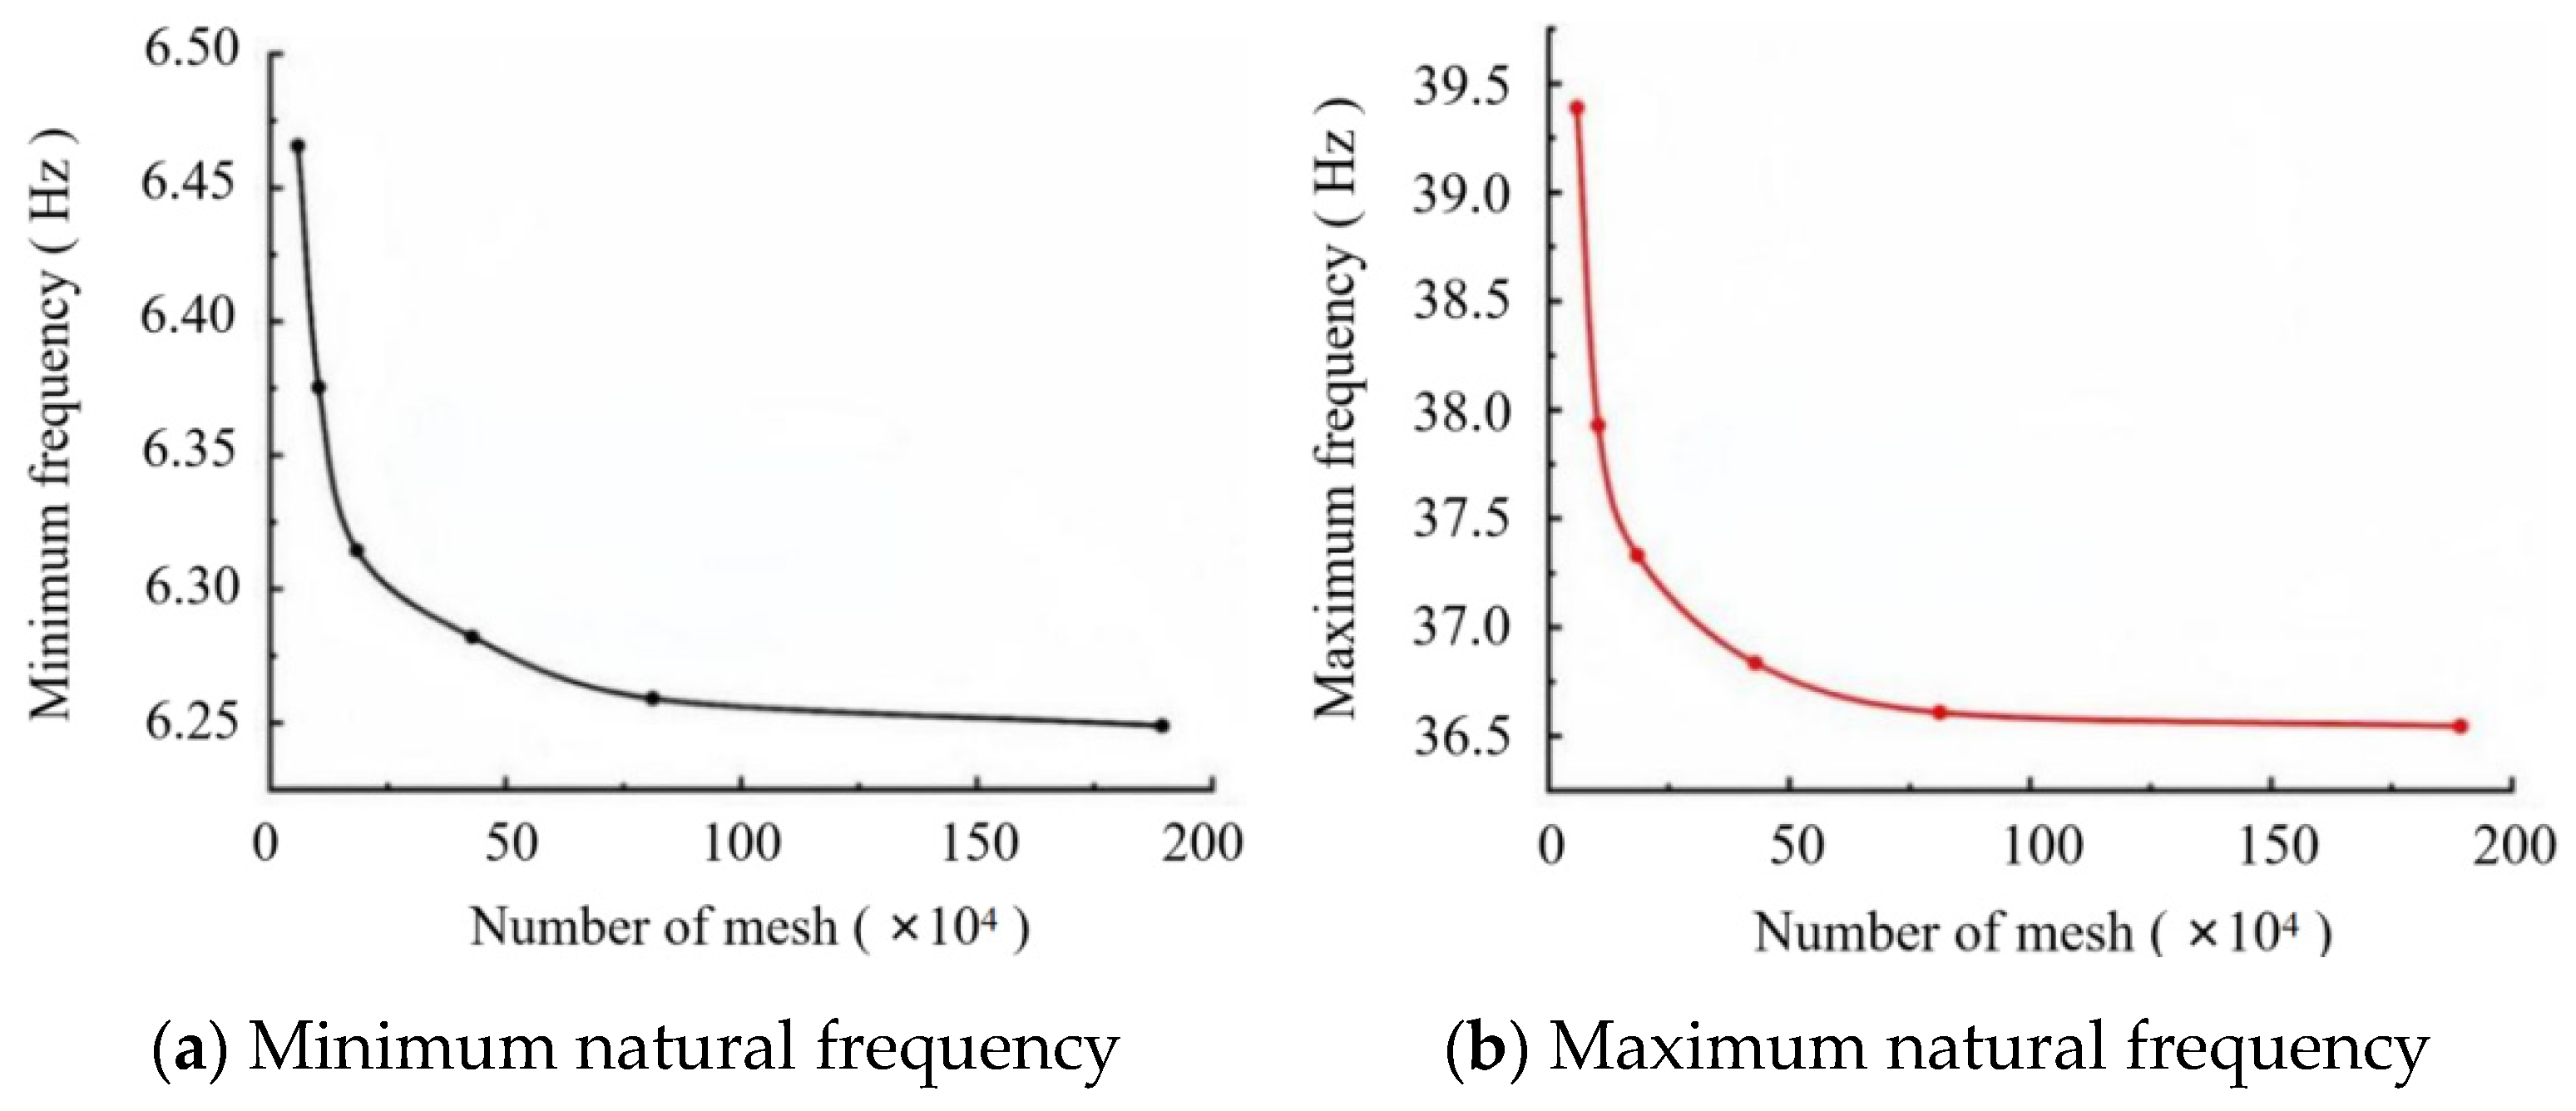
The modal analysis is performed using the Block Lanczos iteration method to extract the first 50 modes. The minimum and maximum natural frequencies among the calculated modes are used as reference parameters for evaluating the influence of mesh density on the computational results in the mesh independence analysis. It is generally considered that the mesh density meets the discretization criteria when further refinement leads to negligible changes in both the minimum and maximum natural frequencies.
Figure 5 illustrates the variation in the minimum and maximum natural frequencies with increasing mesh density. The relative difference in the minimum and maximum natural frequencies between Mesh Scheme 4 and Mesh Scheme 5 are 0.367% and 0.616%, respectively. Between Mesh Scheme 5 and Mesh Scheme 6, these relative differences are 1.63‰ and 1.75‰, respectively. It is observed that the relative differences in both the minimum and maximum natural frequencies between Scheme 5 and Scheme 6 are very small, indicating that both schemes meet the mesh independence criteria. In the calculation of structural vibration characteristics, the number of mesh elements significantly impacts computational time and memory requirements. Furthermore, the improvement in mesh quality from Scheme 5 to Scheme 6 is only 0.016. Therefore, to enhance computational efficiency, a global mesh size of 0.4 m, corresponding to 812,000 elements (Mesh Scheme 5), is ultimately selected.
2.2. Boundary Condition
In investigating the natural vibration characteristics of the pump house structure, the constraint imposed by the surrounding soil is taken into account, as different constraint conditions may influence the modal analysis results. To enhance the accuracy of the modal analysis, the selection of appropriate boundary conditions is particularly important. Based on the positional relationship between the pump house and the soil, four computational schemes are considered, involving scenarios both with and without the participation of backfill soil vibration. Different boundary conditions are applied in each scheme for the analysis.
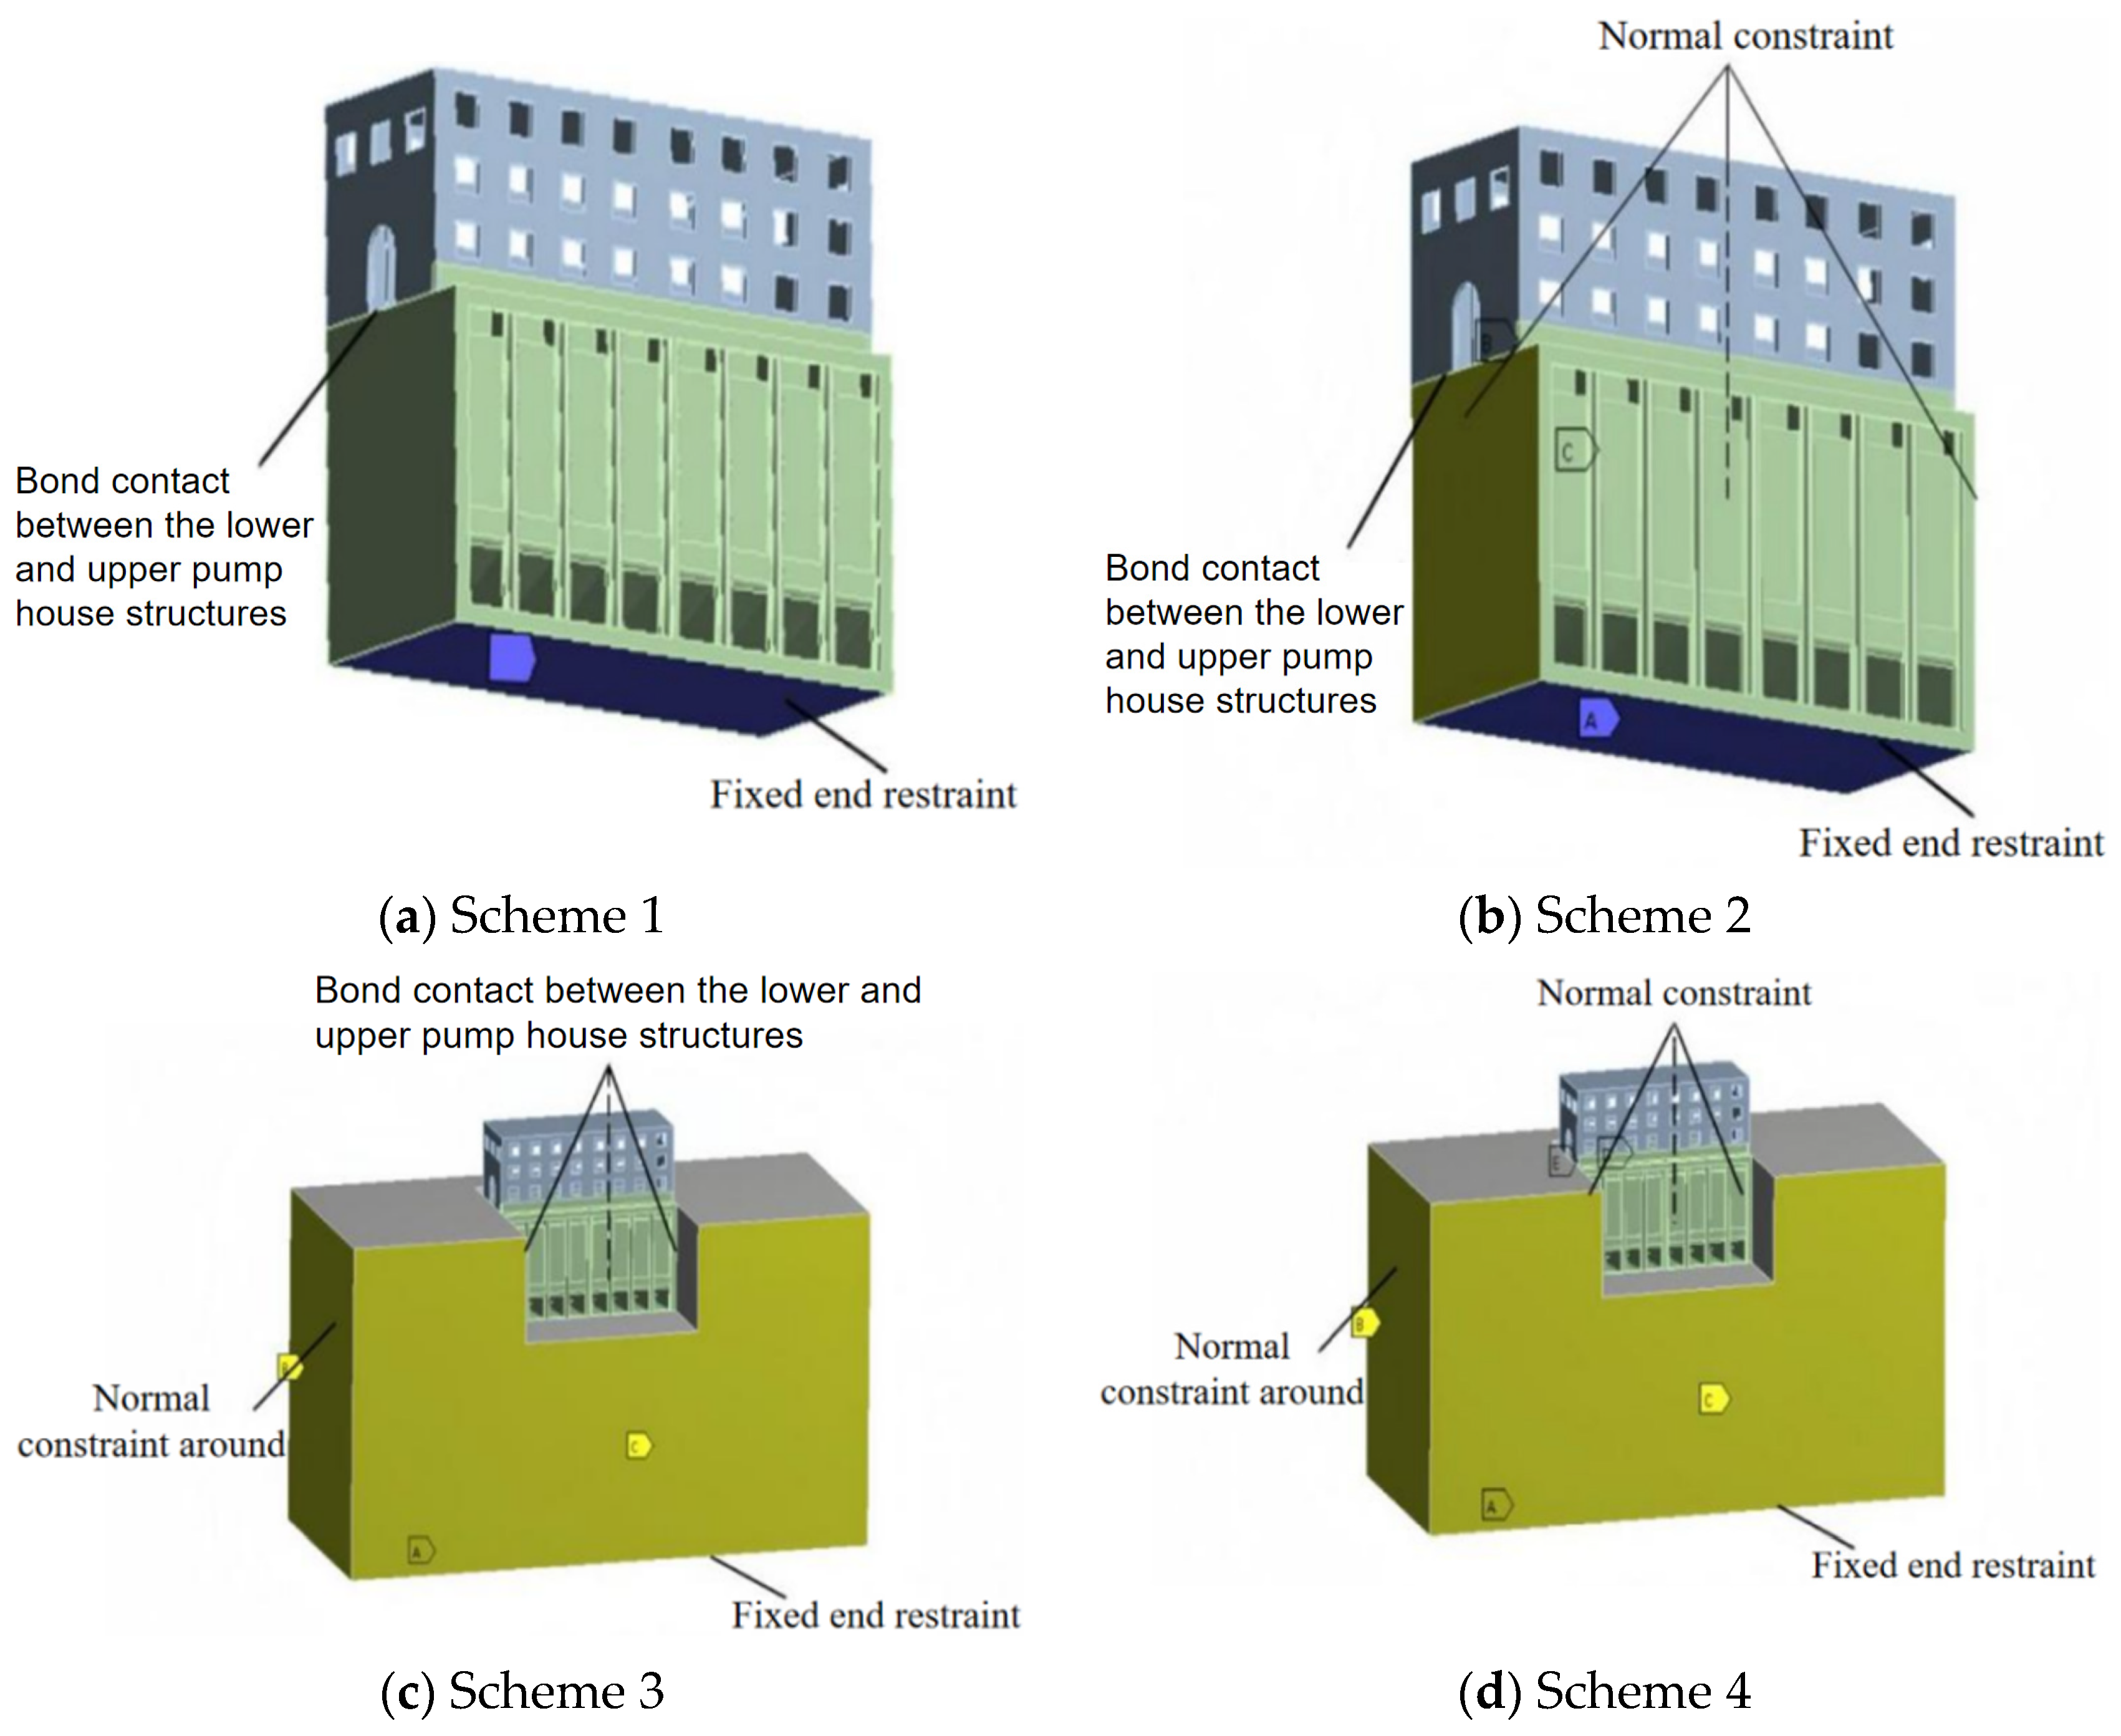
(1) Scheme 1: An integrated model of the pump house is established, excluding the participation of soil vibration. The lower and upper pump house structures are connected through bonded contact at their interface. A fixed end restraint is applied at the base of the pump house, while the surrounding boundaries are set as free boundaries with no constraints. A schematic diagram of the boundary conditions for Scheme 1 is shown in
Figure 6a.
(2) Scheme 2: The overall model configuration is identical to that in Scheme 1, excluding the participation of soil vibration. The upper and lower structures of the pump house are connected through bonded contact. A fixed end restraint is applied at the base of the pump house. To account for the presence of the embankment behind the lower part of the pump house, frictionless supports—which impose constraints only in the surface-normal direction while permitting free in-plane sliding—are applied to the rear and both side surfaces of the lower pump house. A schematic diagram of the boundary conditions for Scheme 2 is shown in
Figure 6b.
(3) Scheme 3: An integrated model of the entire pump house structure and the backfill soil is established, with the soil participating in vibration. The bottom of the soil is fixed, and frictionless supports (constraining only the surface-normal direction) are applied to its four lateral sides. The side walls of the lower pump house are bonded to the backfill soil, and the lower pump house is connected to the upper pump house through bonded contact. A schematic diagram of the boundary conditions for Scheme 3 is shown in
Figure 6c.
(4) Scheme 4: The overall model configuration is identical to that in Scheme 3, with the soil participating in vibration. A fixed constraint is applied to the bottom surface of the soil domain. Frictionless supports, which impose constraints only in the surface-normal direction while permitting free in-plane sliding, are applied to the four lateral surfaces of the soil domain, representing the far-field boundaries of the truncated soil region. The lower and upper pump house structures are connected through bonded contact at their interface. To account for the presence of the embankment behind the lower pump house, frictionless supports are applied to the rear and both side surfaces of the lower pump house at the soil–structure interface, where the pump house walls are in contact with the backfill soil. This treatment permits normal compressive stress transmission while allowing relative tangential sliding, which is physically consistent with the embedded condition of the pump house. A schematic diagram of the boundary conditions for Scheme 4 is shown in
Figure 6d.
The contact treatment adopted in Scheme 4—hard contact in the normal direction with allowance for tangential sliding—is consistent with established approaches for modeling soil–structure interfaces in finite element analyses of hydraulic and geotechnical structures [
41,
42,
43]. This decoupling of normal and tangential interface behavior is physically more representative of actual backfill–structure interaction than a perfectly bonded contact assumption, and constitutes the physical basis for selecting Scheme 4 as the most representative among the four computational schemes considered.
In the above descriptions, the following boundary conditions are implemented in ANSYS Workbench 2022 R2. Frictionless Support imposes a zero-displacement constraint solely in the direction normal to the selected surface, while the two in-plane tangential directions remain entirely unconstrained. Physically, it is equivalent to a frictionless contact interface: compressive normal stresses are transmitted across the surface, and relative tangential sliding is freely permitted without shear resistance. This treatment is applied to the lateral soil boundaries in Schemes 3 and 4, and to the rear and side surfaces of the lower pump house in Schemes 2 and 4. Bond Contact, applied at the interface between the lower and upper pump house structures in all four schemes, enforces zero relative displacement in all directions, thereby rigidly connecting the two structural components.
Note: The height of the soil domain beneath the pump house is set to twice the height of the underwater section of the pump house. The width of the soil domain on both lateral sides of the underwater section is taken as equal to the width of the pump house. The upstream and downstream extents of the soil domain are also each taken as equal to the width of the pump house. The elevation of the top surface of the soil on both lateral sides is consistent with the elevation of the top of the underwater section of the pump house.
2.3. Results of Structural Natural Vibration Characteristics
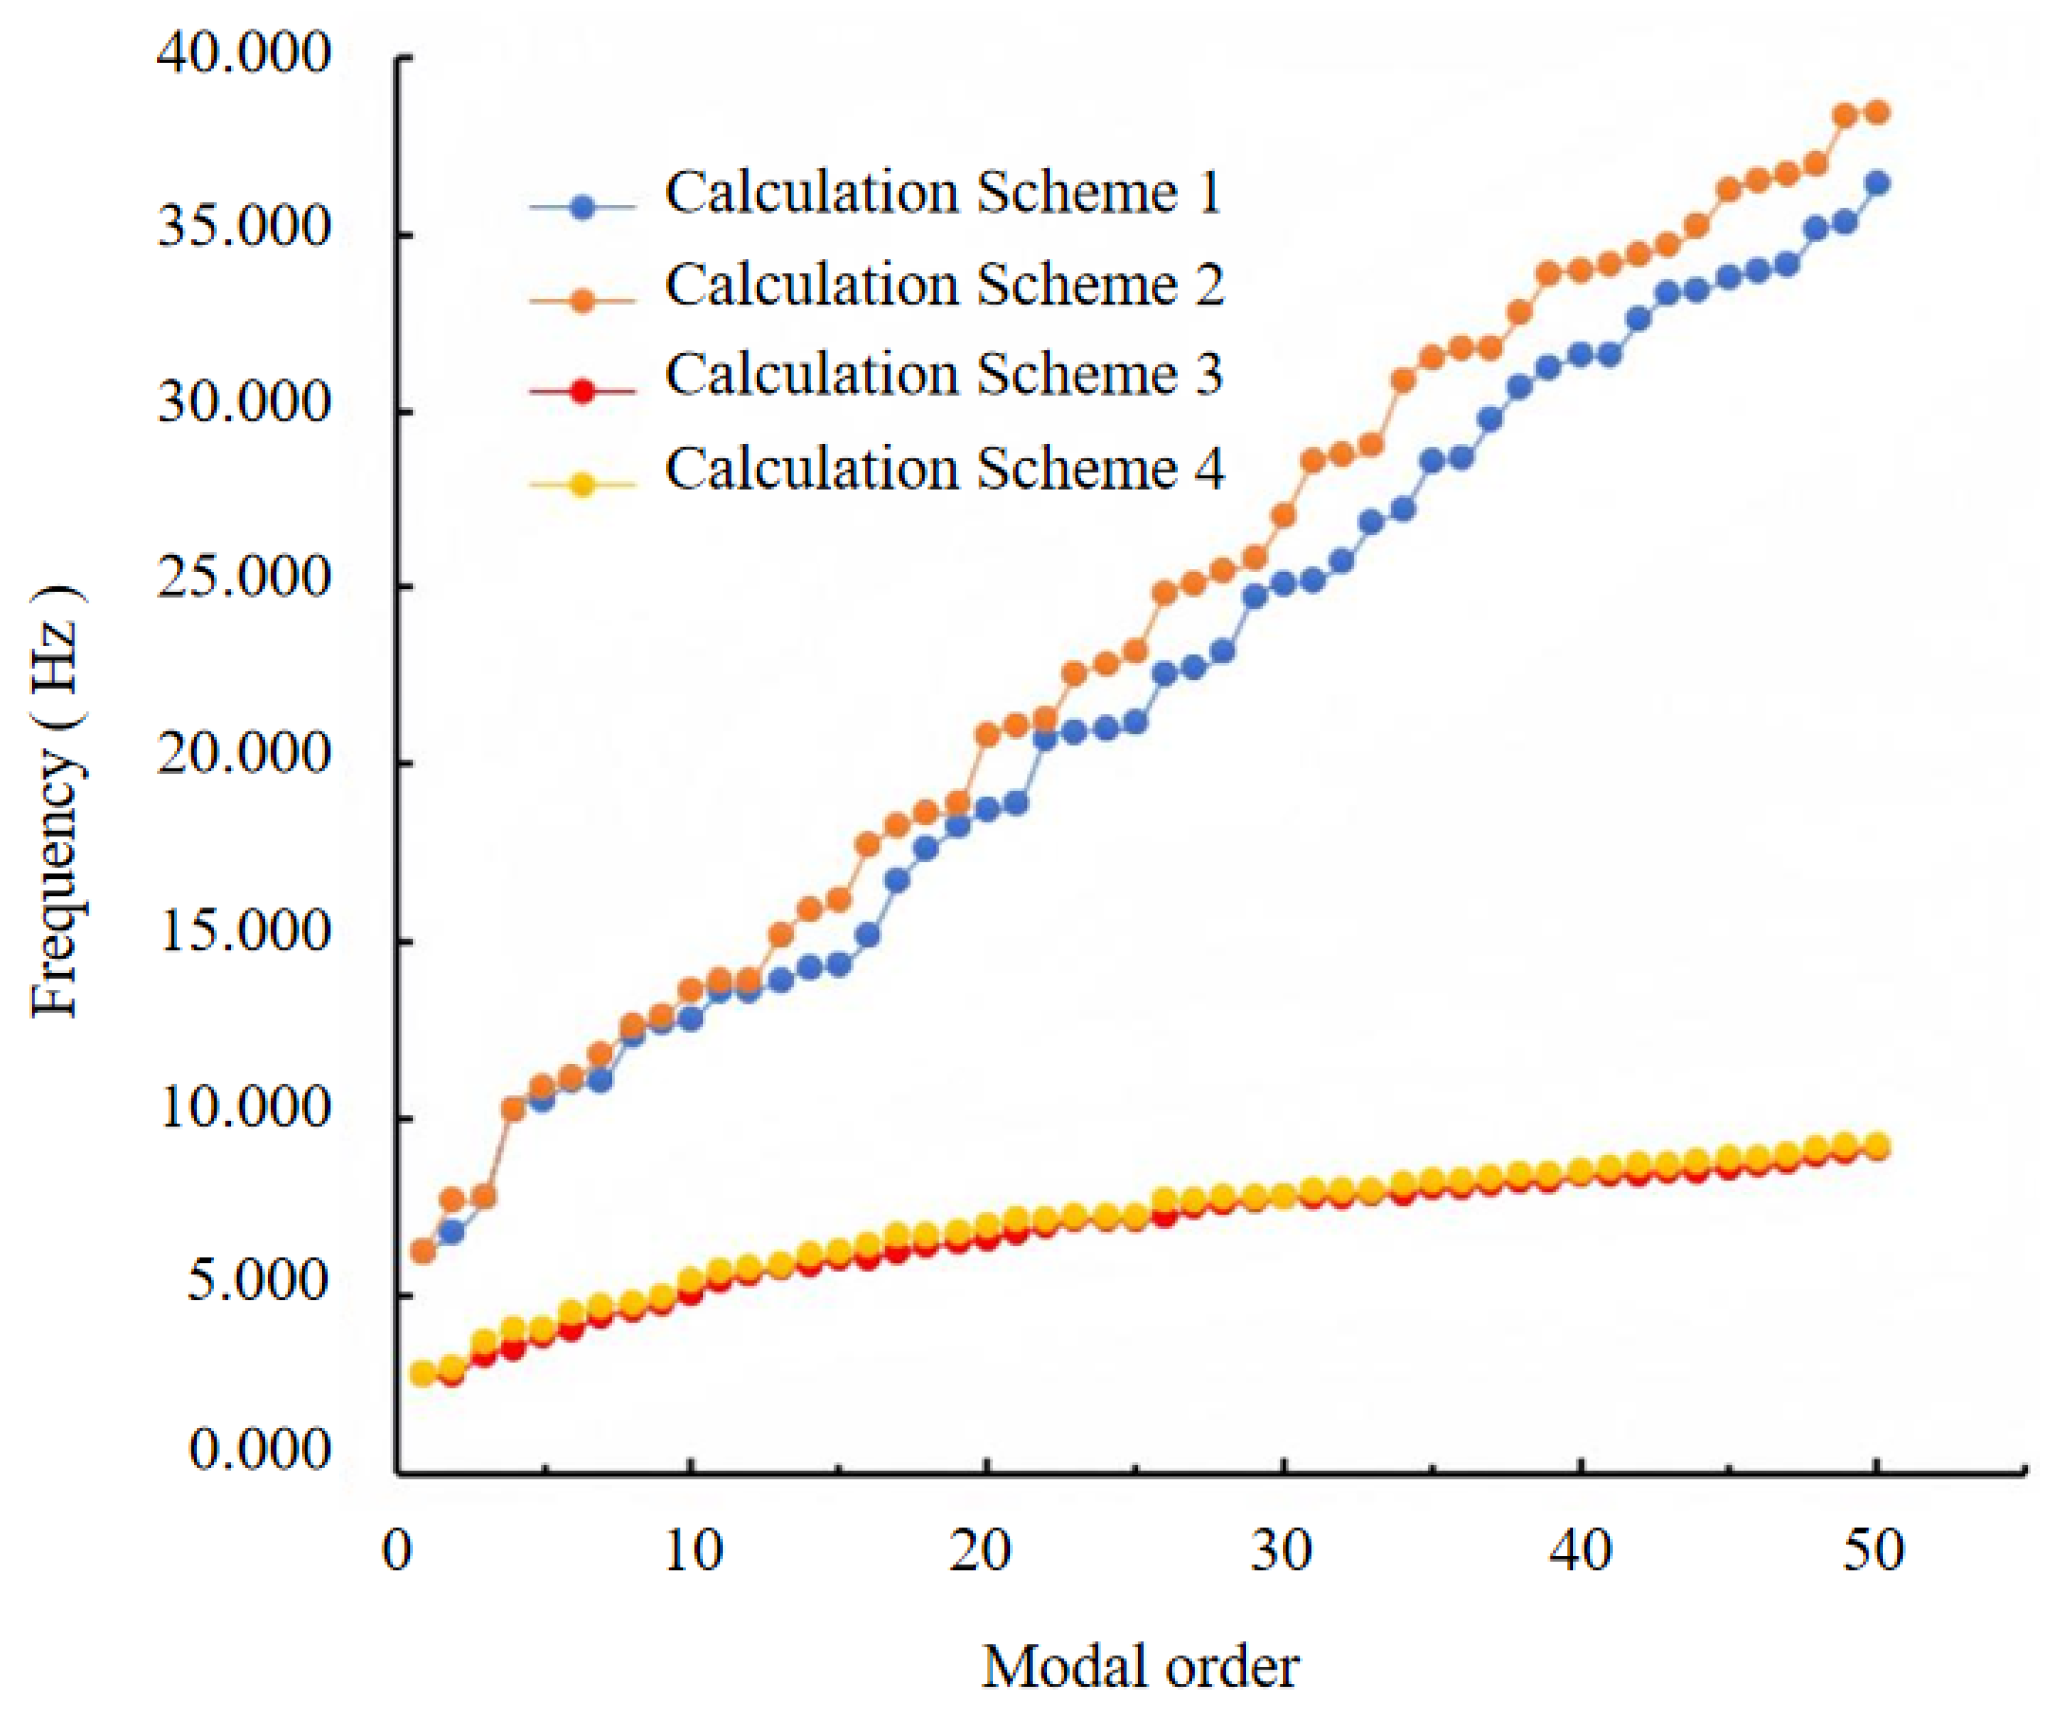
In the modal analysis, the first 50 modes for the four schemes are obtained using the Block Lanczos iteration method. Based on the computational results, the first 50 natural frequencies for each scheme are listed in
Table 2. Additionally, the modal curves for the first 50 modes of each scheme are plotted in
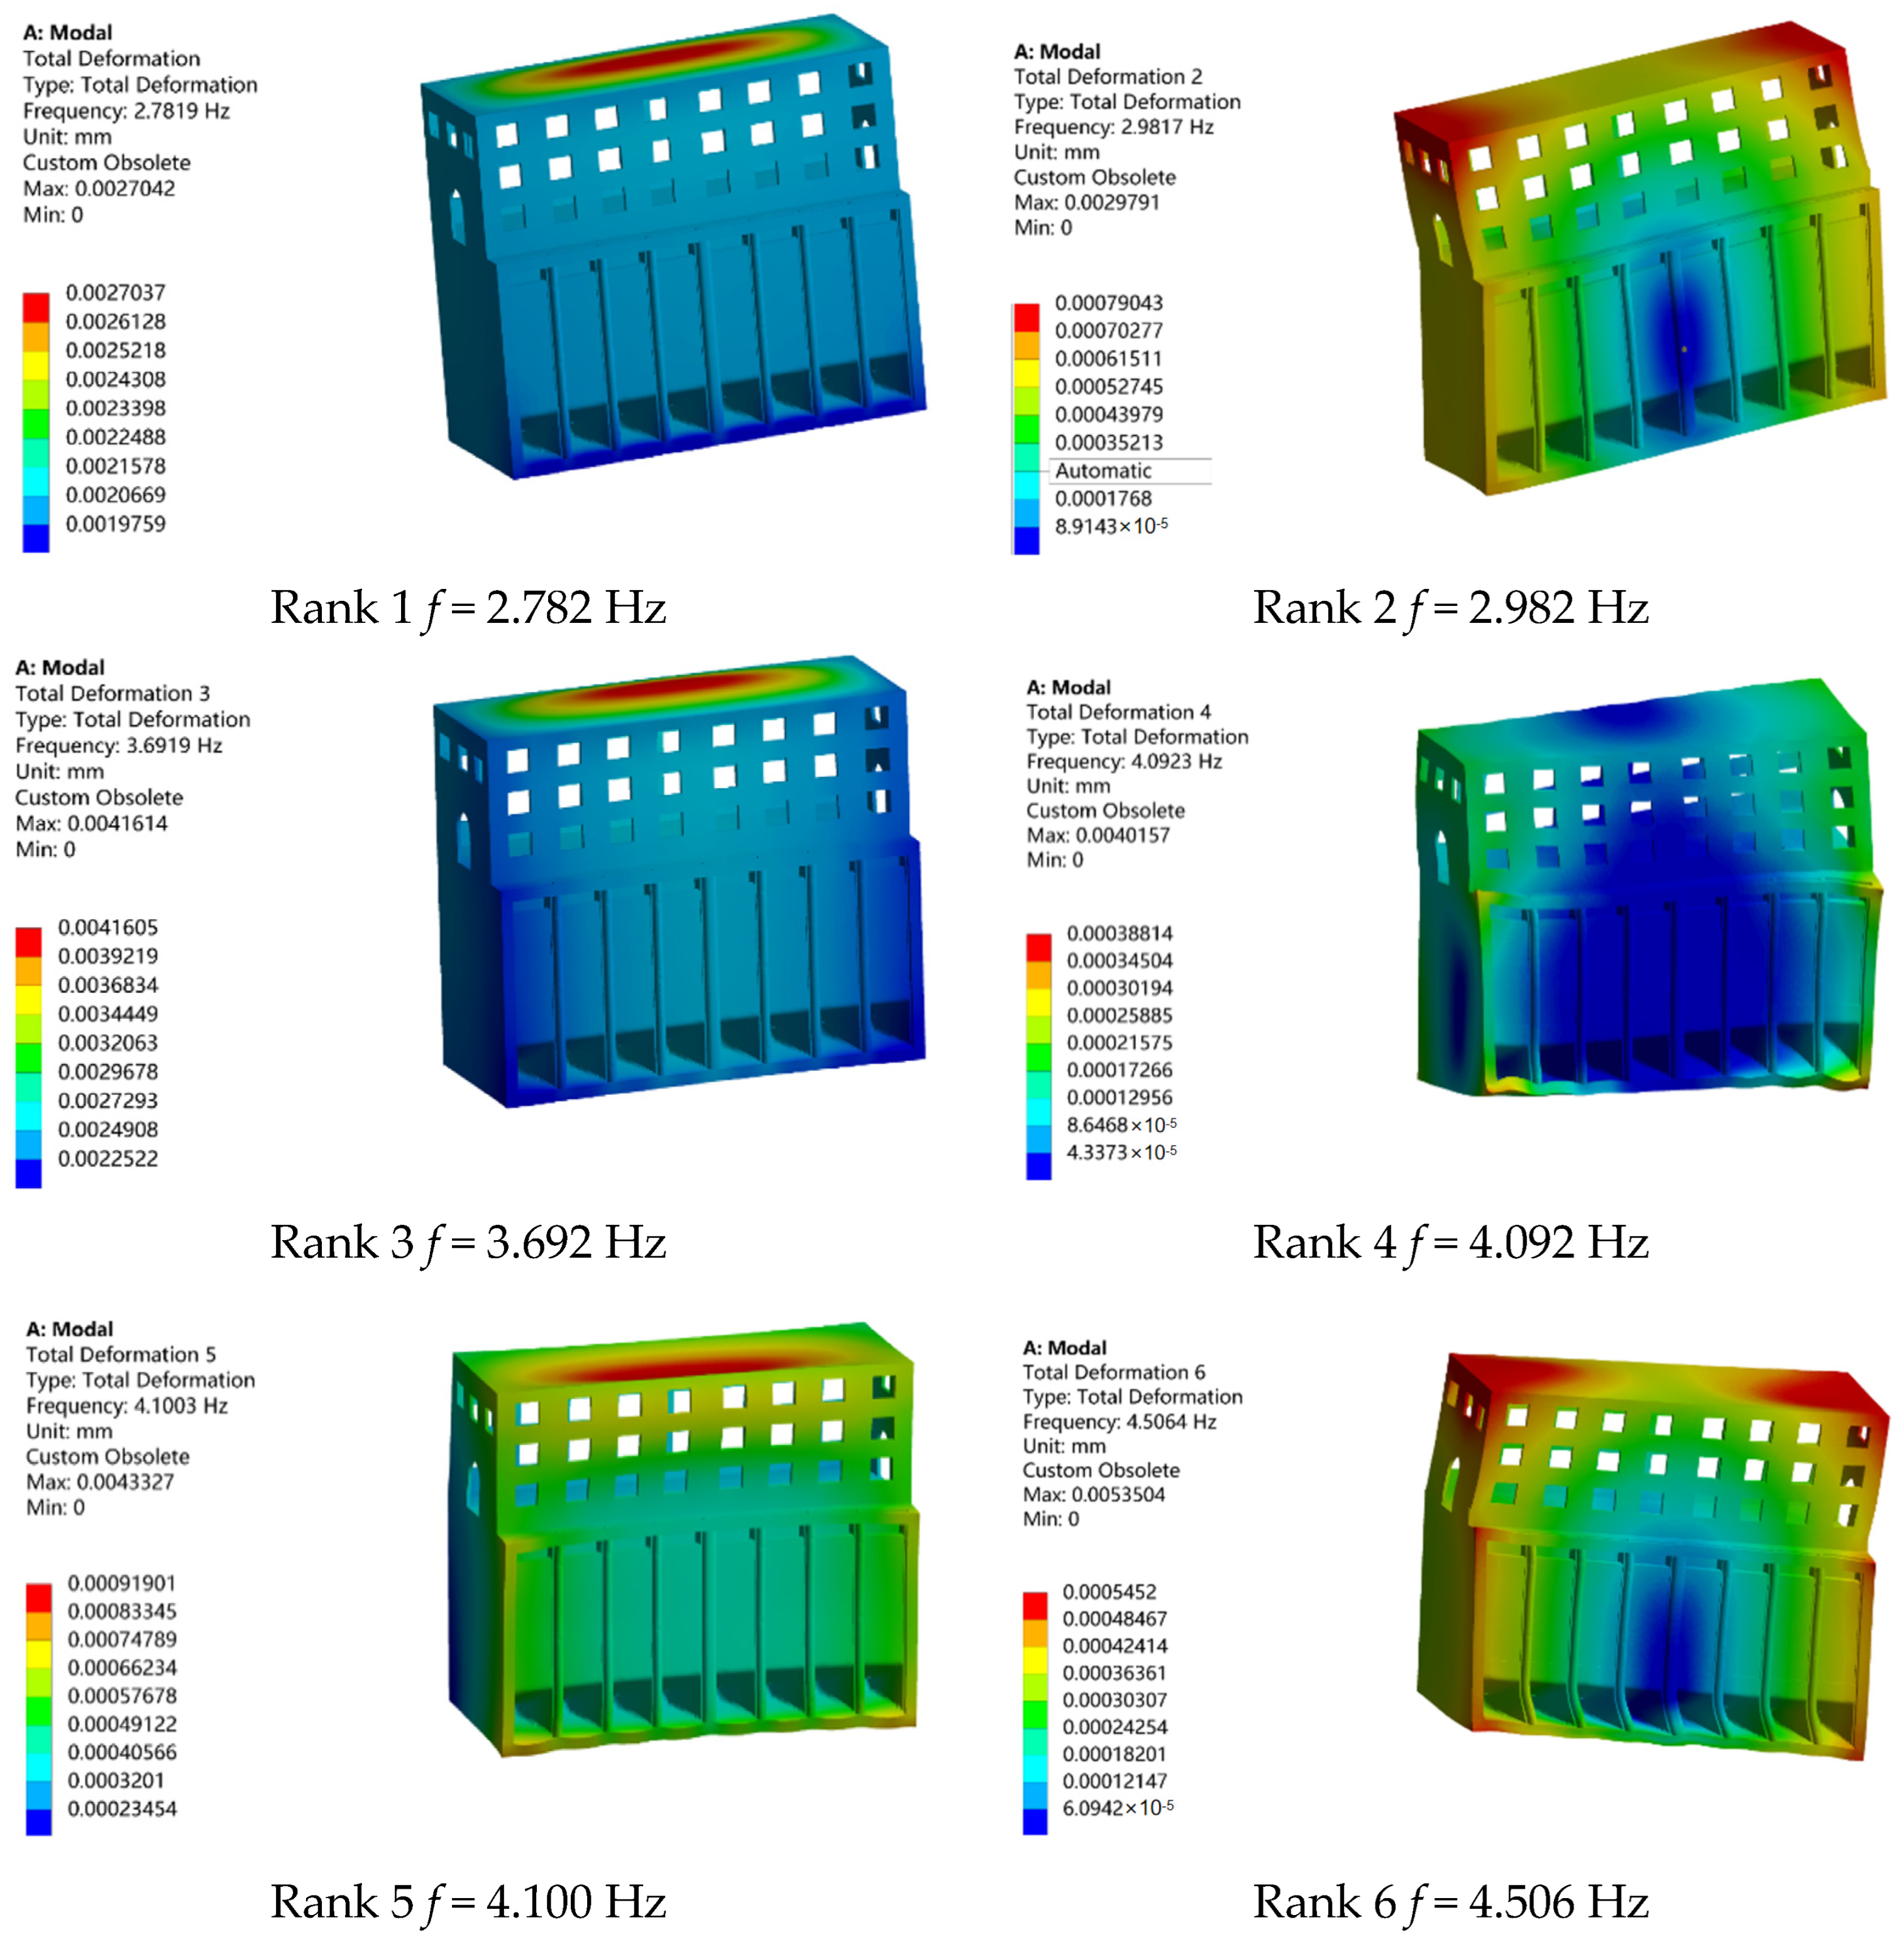
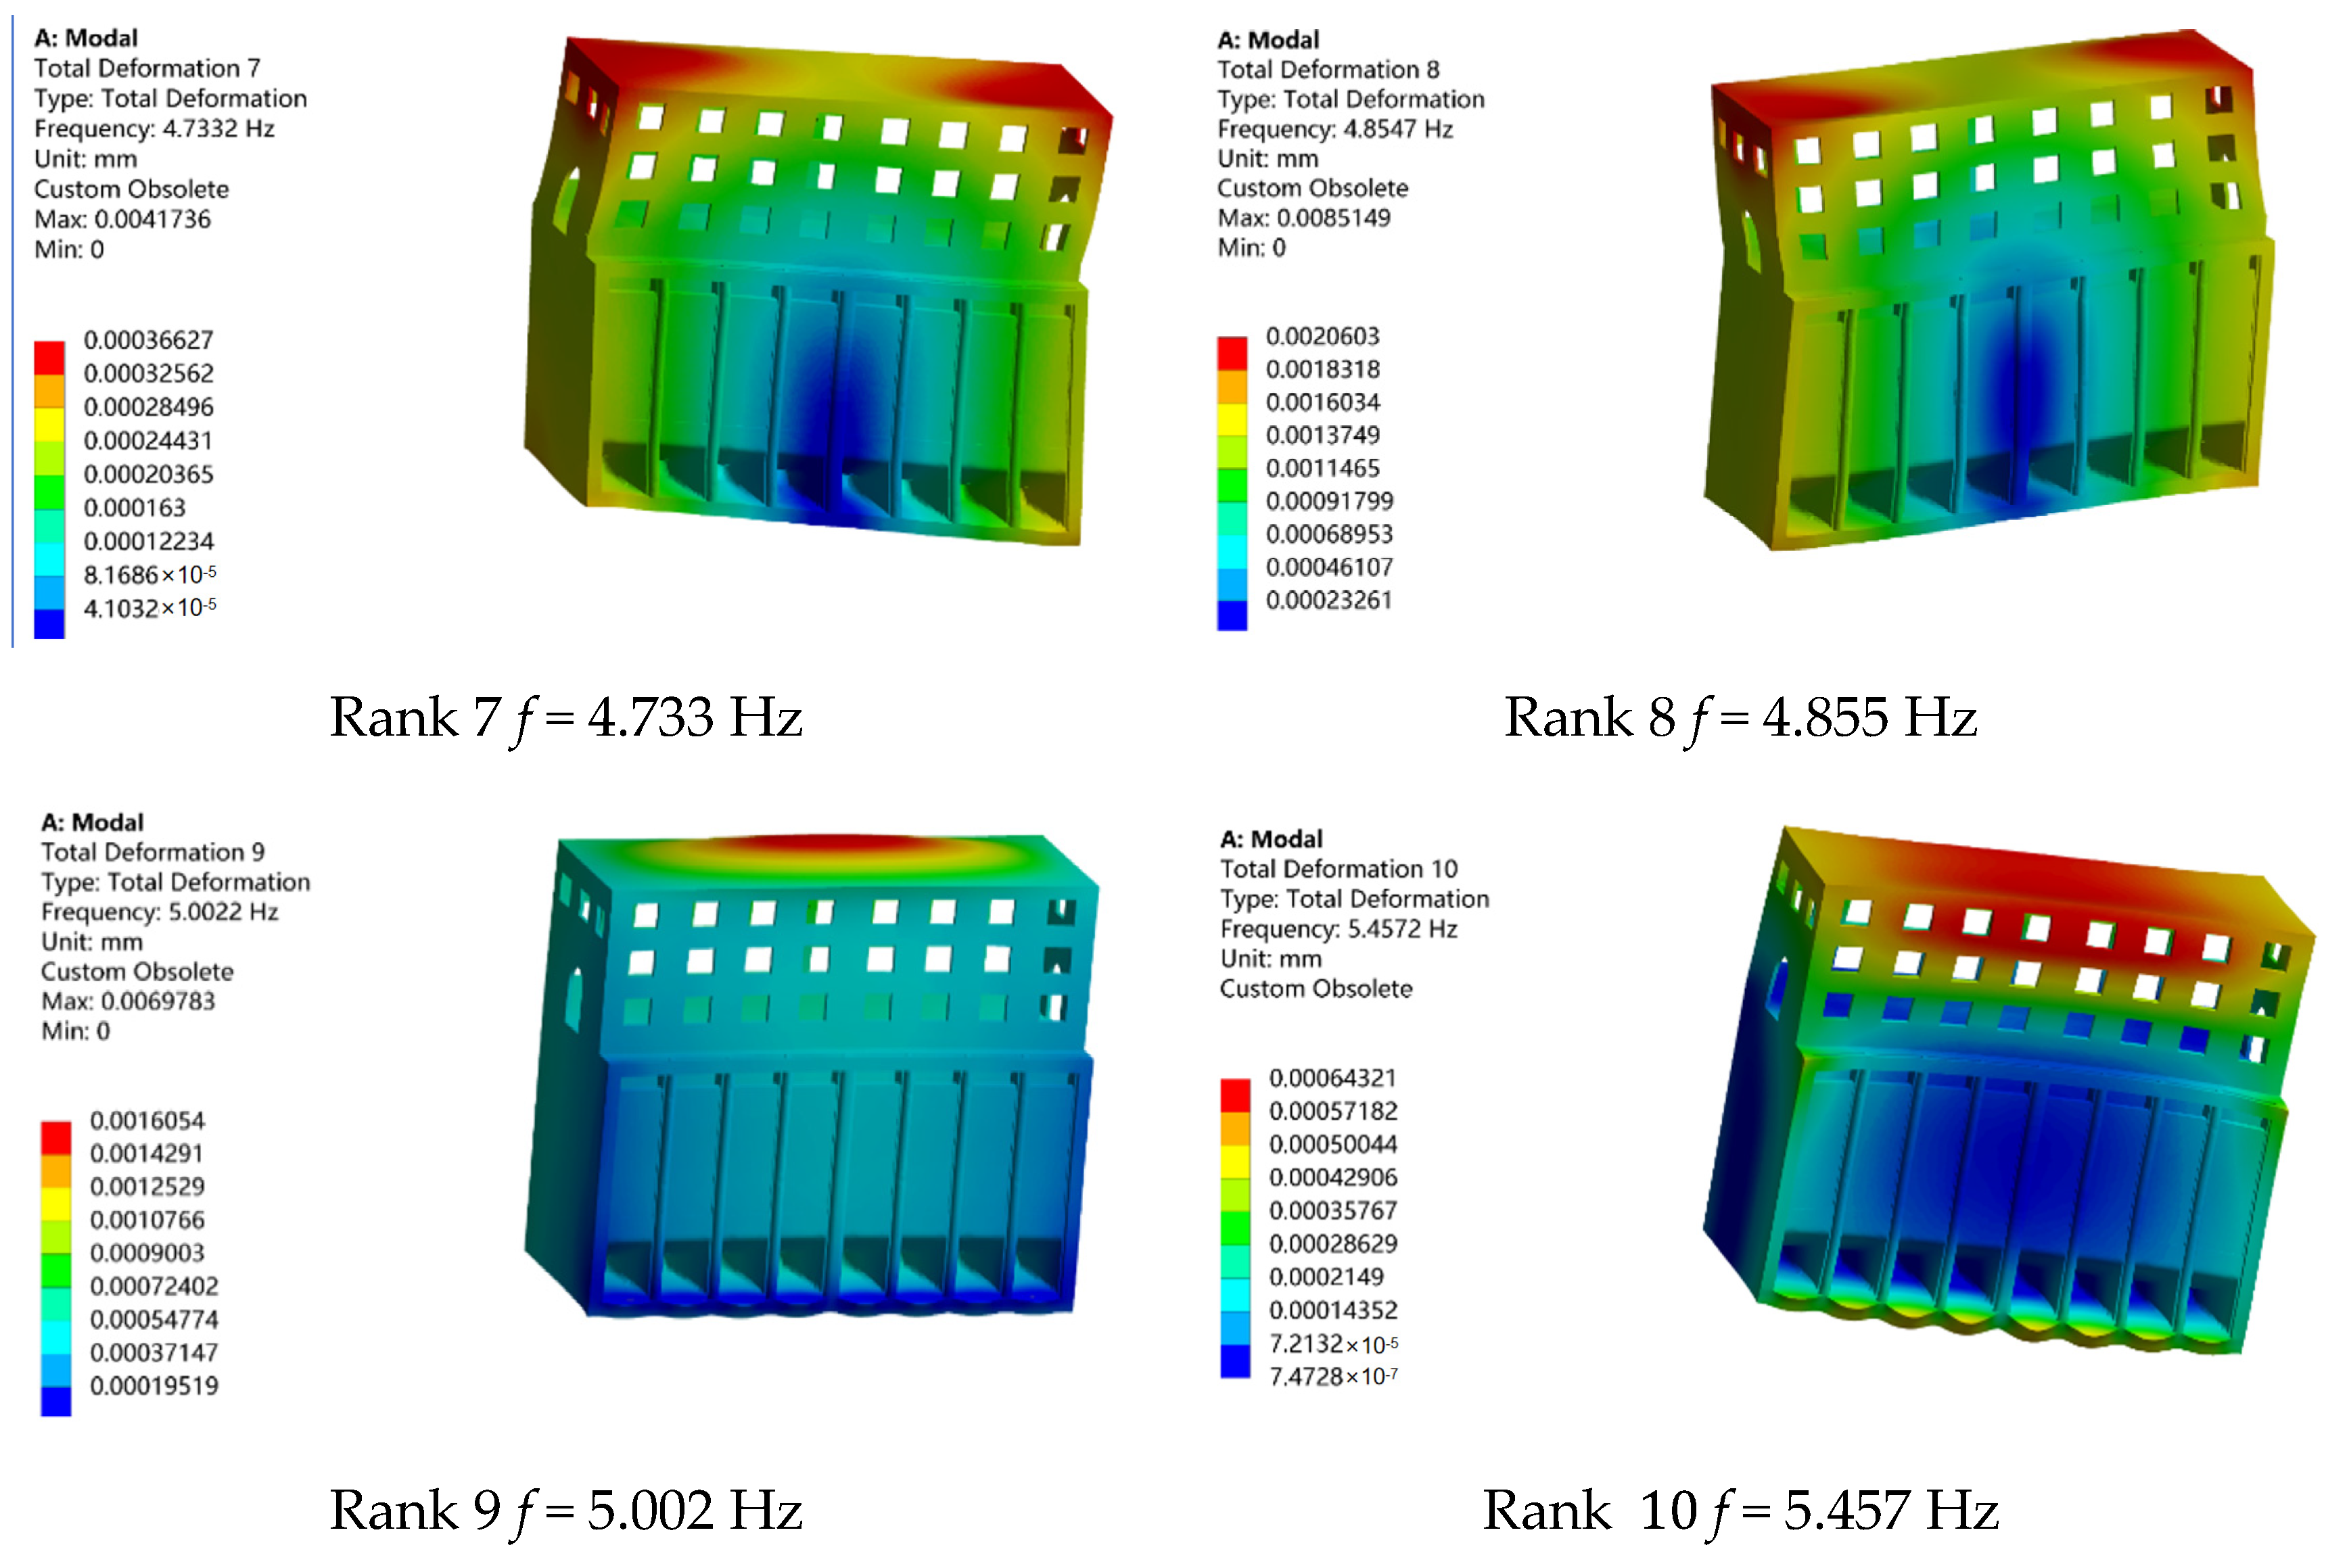
Figure 7, and the first ten modes of the optimal scheme are extracted and presented in
Figure 8.
Figure 7.
Modal natural frequencies of the four computational schemes (Schemes 1–4) for the first 50 modes. (The plotted frequency values are listed in
Table 2, and the corresponding resonance verification results are presented in
Table 3).
Figure 7.
Modal natural frequencies of the four computational schemes (Schemes 1–4) for the first 50 modes. (The plotted frequency values are listed in
Table 2, and the corresponding resonance verification results are presented in
Table 3).
Table 2.
The first 50 natural frequencies of each scheme.
Table 2.
The first 50 natural frequencies of each scheme.
| Rank | Scheme 1 | Scheme 2 | Scheme 3 | Scheme 4 |
|---|
| 1 | 6.281 | 6.293 | 2.779 | 2.782 |
| 2 | 6.824 | 7.705 | 2.809 | 2.982 |
| 3 | 7.795 | 7.807 | 3.375 | 3.692 |
| 4 | 10.294 | 10.307 | 3.566 | 4.092 |
| 5 | 10.567 | 10.941 | 3.913 | 4.100 |
| 6 | 11.059 | 11.139 | 4.045 | 4.506 |
| 7 | 11.071 | 11.806 | 4.494 | 4.733 |
| 8 | 12.383 | 12.627 | 4.599 | 4.855 |
| 9 | 12.751 | 12.875 | 4.791 | 5.002 |
| 10 | 12.800 | 13.660 | 5.117 | 5.457 |
| 11 | 13.639 | 13.921 | 5.481 | 5.713 |
| 12 | 13.655 | 13.945 | 5.639 | 5.786 |
| 13 | 13.931 | 15.203 | 5.828 | 5.903 |
| 14 | 14.303 | 15.893 | 5.926 | 6.157 |
| 15 | 14.381 | 16.157 | 6.091 | 6.266 |
| 16 | 15.139 | 17.698 | 6.126 | 6.431 |
| 17 | 16.733 | 18.254 | 6.252 | 6.710 |
| 18 | 17.626 | 18.598 | 6.419 | 6.752 |
| 19 | 18.228 | 18.865 | 6.550 | 6.813 |
| 20 | 18.765 | 20.799 | 6.651 | 6.996 |
| 21 | 18.912 | 21.077 | 6.811 | 7.186 |
| 22 | 20.747 | 21.272 | 6.987 | 7.203 |
| 23 | 20.903 | 22.514 | 7.149 | 7.258 |
| 24 | 21.043 | 22.808 | 7.189 | 7.286 |
| 25 | 21.137 | 23.225 | 7.212 | 7.314 |
| 26 | 22.510 | 24.823 | 7.231 | 7.692 |
| 27 | 22.711 | 25.126 | 7.544 | 7.708 |
| 28 | 23.188 | 25.450 | 7.660 | 7.796 |
| 29 | 24.754 | 25.789 | 7.730 | 7.810 |
| 30 | 25.078 | 27.016 | 7.804 | 7.830 |
| 31 | 25.224 | 28.525 | 7.845 | 7.953 |
| 32 | 25.688 | 28.683 | 7.859 | 7.971 |
| 33 | 26.785 | 28.983 | 7.925 | 8.014 |
| 34 | 27.205 | 30.843 | 7.927 | 8.147 |
| 35 | 28.502 | 31.441 | 8.053 | 8.263 |
| 36 | 28.630 | 31.727 | 8.124 | 8.270 |
| 37 | 29.688 | 31.756 | 8.223 | 8.331 |
| 38 | 30.658 | 32.691 | 8.269 | 8.437 |
| 39 | 31.178 | 33.807 | 8.291 | 8.484 |
| 40 | 31.542 | 33.896 | 8.421 | 8.559 |
| 41 | 31.561 | 34.049 | 8.454 | 8.605 |
| 42 | 32.540 | 34.363 | 8.486 | 8.680 |
| 43 | 33.258 | 34.604 | 8.538 | 8.698 |
| 44 | 33.336 | 35.171 | 8.584 | 8.787 |
| 45 | 33.727 | 36.170 | 8.671 | 8.877 |
| 46 | 33.924 | 36.430 | 8.708 | 8.894 |
| 47 | 34.070 | 36.604 | 8.797 | 8.982 |
| 48 | 35.051 | 36.892 | 8.986 | 9.202 |
| 49 | 35.293 | 38.272 | 9.124 | 9.242 |
| 50 | 36.351 | 38.383 | 9.192 | 9.272 |
Table 3.
Resonance check between natural frequencies and excitation frequencies.
Table 3.
Resonance check between natural frequencies and excitation frequencies.
| Natural Frequency fself (Hz) | Excitation Frequency fstir (Hz) |
|---|
| 4.917 | 24.583 | 196.667 |
|---|
| Rank | Numerical Value | Separation Ratio |
|---|
| 1 | 2.782 | | | |
| 2 | 2.982 | | | |
| 3 | 3.692 | | | |
| 4 | 4.092 | 16.772 | | |
| 5 | 4.100 | 16.610 | | |
| 6 | 4.506 | 8.351 | | |
| 7 | 4.733 | 3.738 | | |
| 8 | 4.855 | 1.267 | | |
| 9 | 5.002 | 1.733 | | |
| 10 | 5.457 | 10.986 | | |
| 11 | 5.713 | 16.187 | | |
| 12 | 5.786 | 17.675 | | |
| 13 | 5.903 | | | |
| 14 | 6.157 | | | |
| 15 | 6.266 | | | |
| 16 | 6.431 | | | |
| 17 | 6.710 | | | |
| 18 | 6.752 | | | |
| 19 | 6.813 | | | |
| 20 | 6.996 | | | |
| 21 | 7.186 | | | |
| 22 | 7.203 | | | |
| 23 | 7.258 | | | |
| 24 | 7.286 | | | |
| 25 | 7.314 | | | |
| 26 | 7.692 | | | |
| 27 | 7.708 | | | |
| 28 | 7.796 | | | |
| 29 | 7.810 | | | |
| 30 | 7.830 | | | |
| 31 | 7.953 | | | |
| 32 | 7.971 | | | |
| 33 | 8.014 | | | |
| 34 | 8.147 | | | |
| 35 | 8.263 | | | |
| 36 | 8.270 | | | |
| 37 | 8.331 | | | |
| 38 | 8.437 | | | |
| 39 | 8.484 | | | |
| 40 | 8.559 | | | |
| 41 | 8.605 | | | |
| 42 | 8.680 | | | |
| 43 | 8.698 | | | |
| 44 | 8.787 | | | |
| 45 | 8.877 | | | |
| 46 | 8.894 | | | |
| 47 | 8.982 | | | |
| 48 | 9.202 | | | |
| 49 | 9.242 | | | |
| 50 | 9.272 | | | |
(1) By comparing the schemes without soil participation (Schemes 1 and 2) with those including soil participation (Schemes 3 and 4), it is evident that natural frequencies at each mode order are significantly lower when soil participates in vibration. This indicates that soil participation substantially influences the natural vibration characteristics of the pump house. This is because the elastic modulus of the soil is only 1.3 GPa (as listed in
Table 1), which is significantly smaller than the 30 GPa elastic modulus of concrete, resulting in the soil having much lower stiffness than concrete. When backfill soil participates in vibration, the increase in overall system mass outweighs the increase in overall stiffness, leading to a significant reduction in natural frequencies. Therefore, the natural frequencies of each order in calculation Schemes 3 and 4 are significantly lower than those in Schemes 1 and 2.
(2) In contrast to Schemes 1 and 2 without backfill soil participation in vibration, the natural frequencies of each order in Scheme 2, which has normal constraints applied around the pump house, range from 6.293 Hz to 38.383 Hz. These values are all higher than the frequency range of 6.281 Hz to 36.351 Hz for Scheme 1, a ground-level powerhouse with free boundaries around the pump house. Specifically, the relative differences for the first 15 modes range from 0.13% to 12.91%, with a few modes (e.g., modes 2, 7, 10, and 13–15) exceeding 5%. For modes 16 to 35, the differences range from 5% to 15%, and for the last 15 modes, they range from 5% to 10%. This indicates that, in the absence of soil–structure interaction, boundary conditions exert a discernible influence on the natural frequencies of the pump house. The effect is relatively minor for the first 15 and last 15 modes, but more pronounced for modes 16 to 35. Overall, under conditions without soil participation, the influence of boundary conditions on the vibration characteristics exhibits a trend of initially increasing, then slightly decreasing, and eventually stabilizing as the modal order progresses.
(3) Comparing Schemes 3 and 4, both of which consider backfill soil participation in vibration, the bottom of the backfill soil is fixed and the surroundings have normal constraints in both schemes. The two schemes differ primarily in the contact conditions between the pump house and the backfill soil: Scheme 3 employs bonded contact, which enforces zero relative displacement, while Scheme 4 applies normal constraints allowing tangential free sliding. The comparison of calculation results shows that the natural frequencies of each order in Scheme 4 range from 2.782 Hz to 9.272 Hz, all slightly higher than those in Scheme 3, which range from 2.779 Hz to 9.192 Hz. The differences for the first 10 modes are within 0–15%, for modes 11–25 about 5%, and for the last 25 modes about 2%. This indicates that, when backfill soil participates in vibration, different contact conditions applied to the same model exert a measurable influence on the natural frequencies of the pump house. The effect is relatively significant on the first 10 modes, while being negligible on the last 25 modes. Overall, under conditions with soil participation, the influence of boundary conditions on the vibration characteristics exhibits a trend of rapidly increasing, then gradually decreasing, and eventually stabilizing as the modal order progresses.
Considering actual conditions, the pump house maintains close contact with the surrounding soil during vibration, while relative sliding may occur at the soil–structure interface. This physical behavior is consistent with the contact treatment adopted in Scheme 4 and with established interface modeling practice in soil–structure interaction analysis [
40,
41,
42]. Therefore, among the four computational schemes evaluated, Scheme 4 is considered the most physically representative for the purposes of this analysis. All subsequent calculations adopt the full configuration of Scheme 4 as the boundary condition.
Considering the above calculation results and actual conditions, Scheme 4 is selected as the optimal scheme. The first ten modes of the pump house in Scheme 4 are shown in
Figure 8.
Figure 8.
First ten mode shapes of the pump house structure (Scheme 4).
Figure 8.
First ten mode shapes of the pump house structure (Scheme 4).
(1) The upper walls of the pumping station are relatively thin and constrained only by corbel columns, so the fundamental frequency is very low, with vibration beginning at 2.782 Hz.
(2) Due to the support provided by the surrounding backfill soil and the stable block-foundation structure of the pump house, the substructure exhibits high stiffness, resulting in minimal vibration of the underwater portion of the pump house at low-order frequencies.
(3) The above-water part of the pump house structure, especially the top roof, is slender and has a large spatial span. As a result, even at low natural frequencies, vibration occurs at the roof center, with relatively large amplitudes also occurring on both sides of the roof.
4. Conclusions
The dynamic behavior of pumping station foundations directly governs the operational stability and service life of large-scale vertical fluid machinery, yet the resonance risks associated with higher-order structural modes and soil–structure interaction effects remain inadequately characterized in current design practice. This study addresses this gap through a high-fidelity three-dimensional finite element model of a large-scale vertical pumping station foundation system, incorporating the powerhouse superstructure, submerged concrete substructure, and surrounding backfill soil. Modal analysis under four boundary condition scenarios and resonance verification extended to the 400th mode yield the following principal conclusions.
(1) The participation of backfill soil in structural vibration exerts a dominant influence on the natural frequencies of the pump foundation system. When soil–structure interaction is explicitly incorporated, the computed natural frequencies across all modal orders are substantially lower than those obtained under fixed-base assumptions. Comparative analysis further indicates that the contact treatment permitting normal load transfer with tangential sliding—as adopted in Scheme 4 and consistent with established interface modeling practice—yields frequency predictions that lie between the extremes of fully bonded and fully free interface assumptions. This reduction in natural frequencies arises from the significantly lower elastic modulus of the backfill soil relative to concrete, which results in a proportionally greater increase in overall system mass than in system stiffness. Consequently, dynamic analyses that neglect soil participation may considerably overestimate structural natural frequencies and fail to identify critical resonance conditions in the lower frequency range.
(2) The upper powerhouse structure exhibits the highest susceptibility to vibration excitation among all structural components of the pumping station. Due to the large span and relatively low stiffness of the roof slab and the limited lateral restraint provided by the corbel columns, vibration initiates at a fundamental frequency as low as 2.782 Hz, with significant modal displacements concentrated at the roof center and along the roof edges. In contrast, the underwater concrete substructure, restrained by the surrounding backfill soil and characterized by its massive block-foundation configuration, displays considerably higher stiffness and experiences minimal vibratory response in the low-order modes.
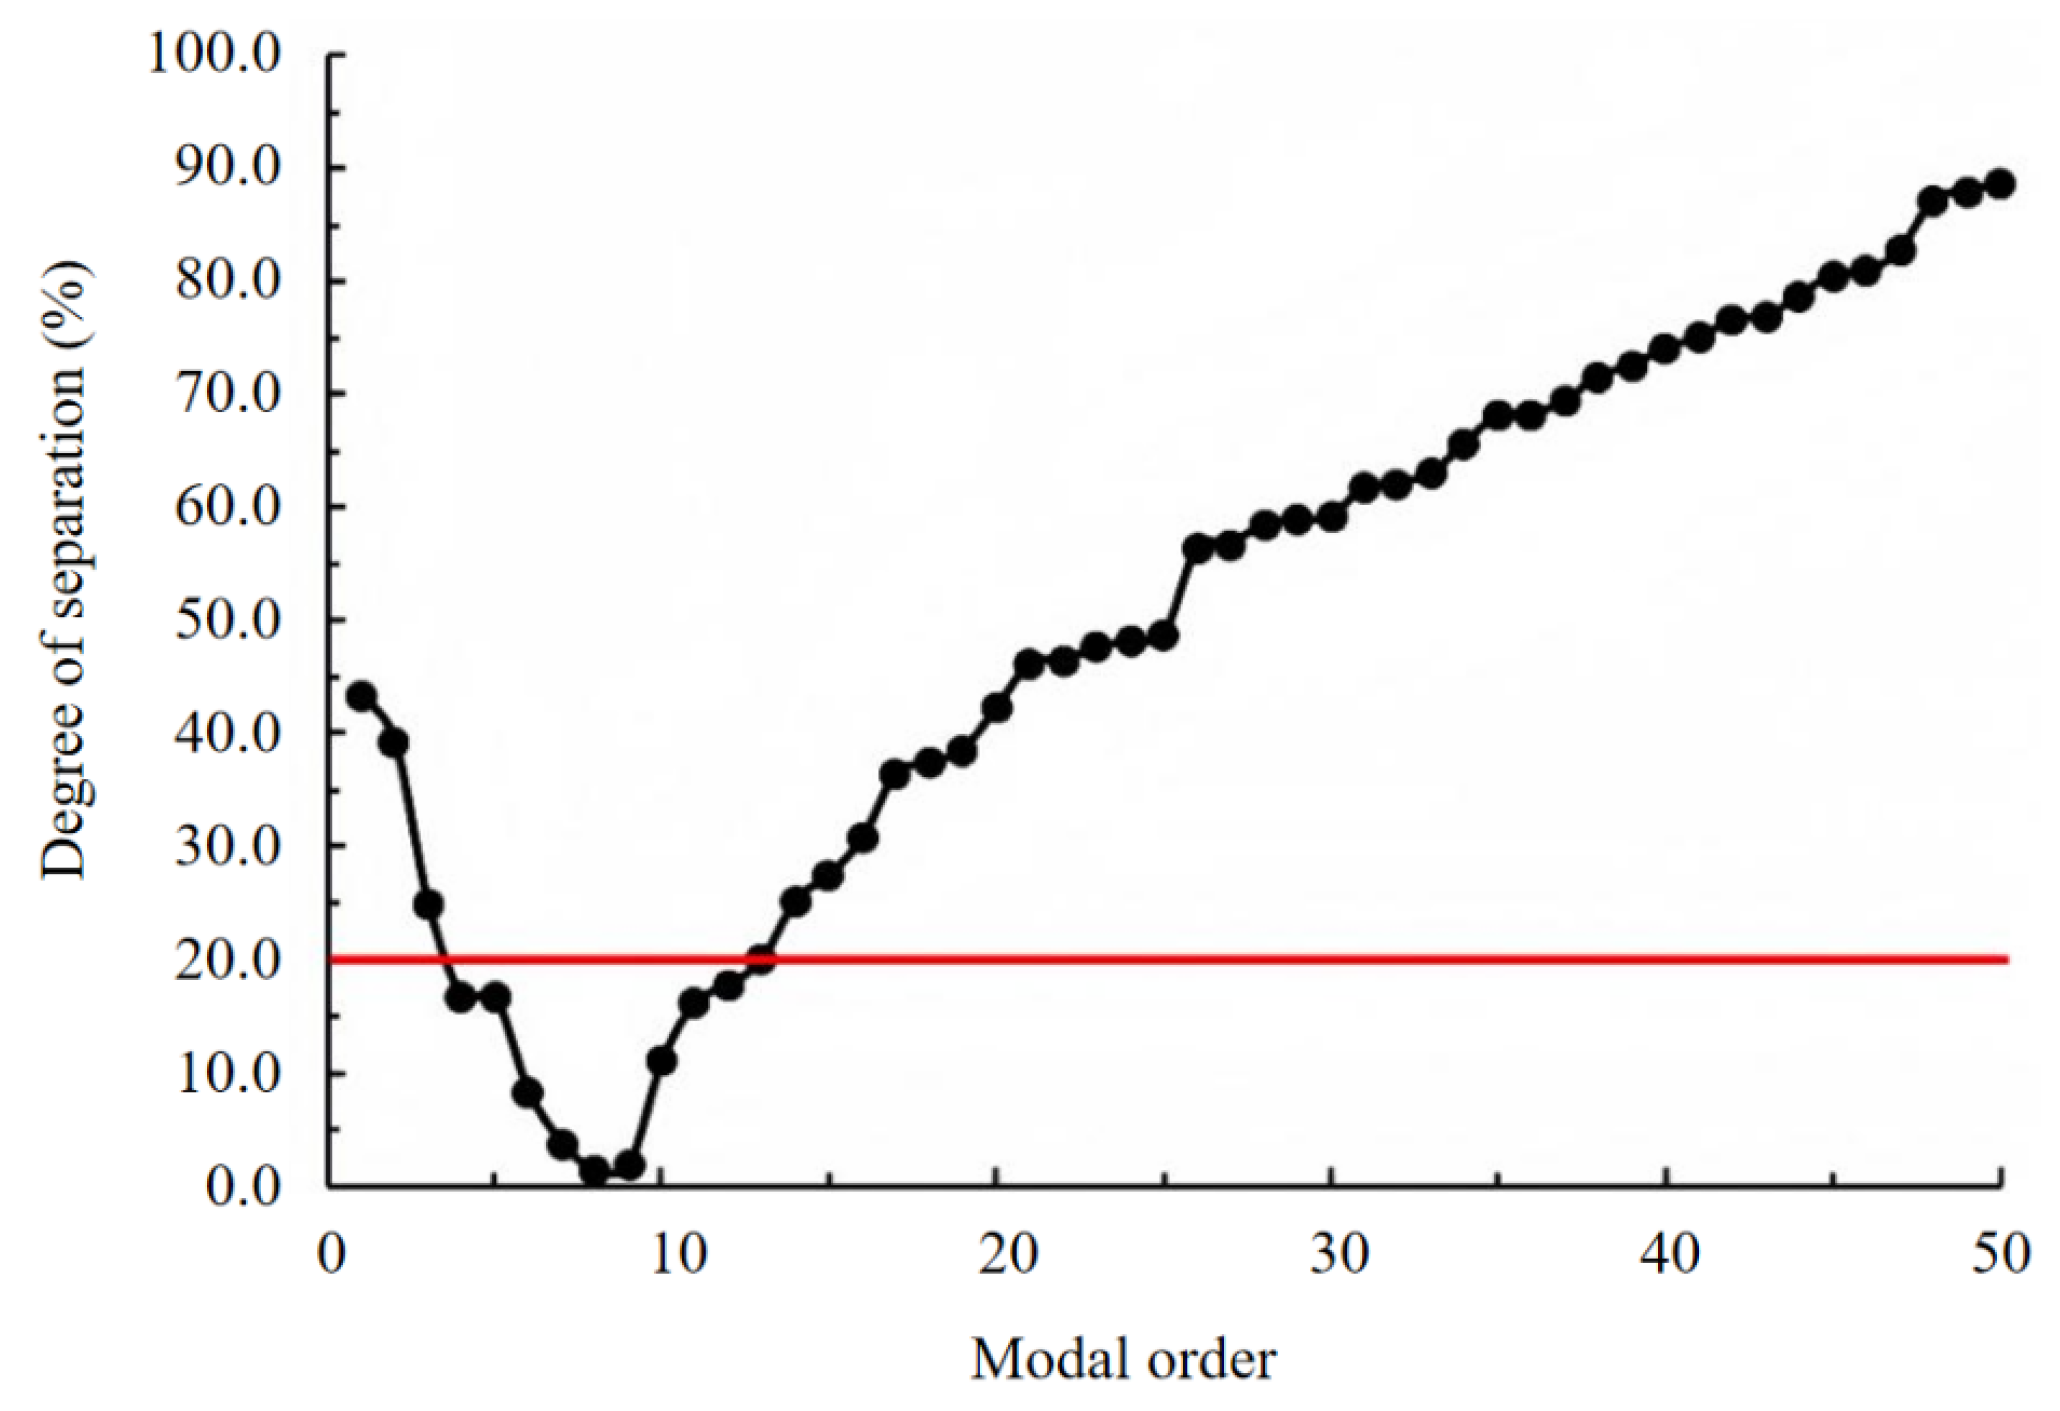
(3) Resonance verification against the rotational frequency of 4.917 Hz indicates that modes 4 through 12 exhibit separation margins below the 20% safety threshold stipulated by the design code. However, the separation margin increases rapidly with modal order, exceeding the safe limit beyond mode 12 and rendering resonance at this excitation frequency unlikely under normal operating conditions. For the rotor–stator interaction frequency of 196.667 Hz, separation margins relative to all analyzed natural frequencies exceed 95%, and the approach to the 20% critical threshold would require exceedingly high modal orders, making resonance practically implausible.
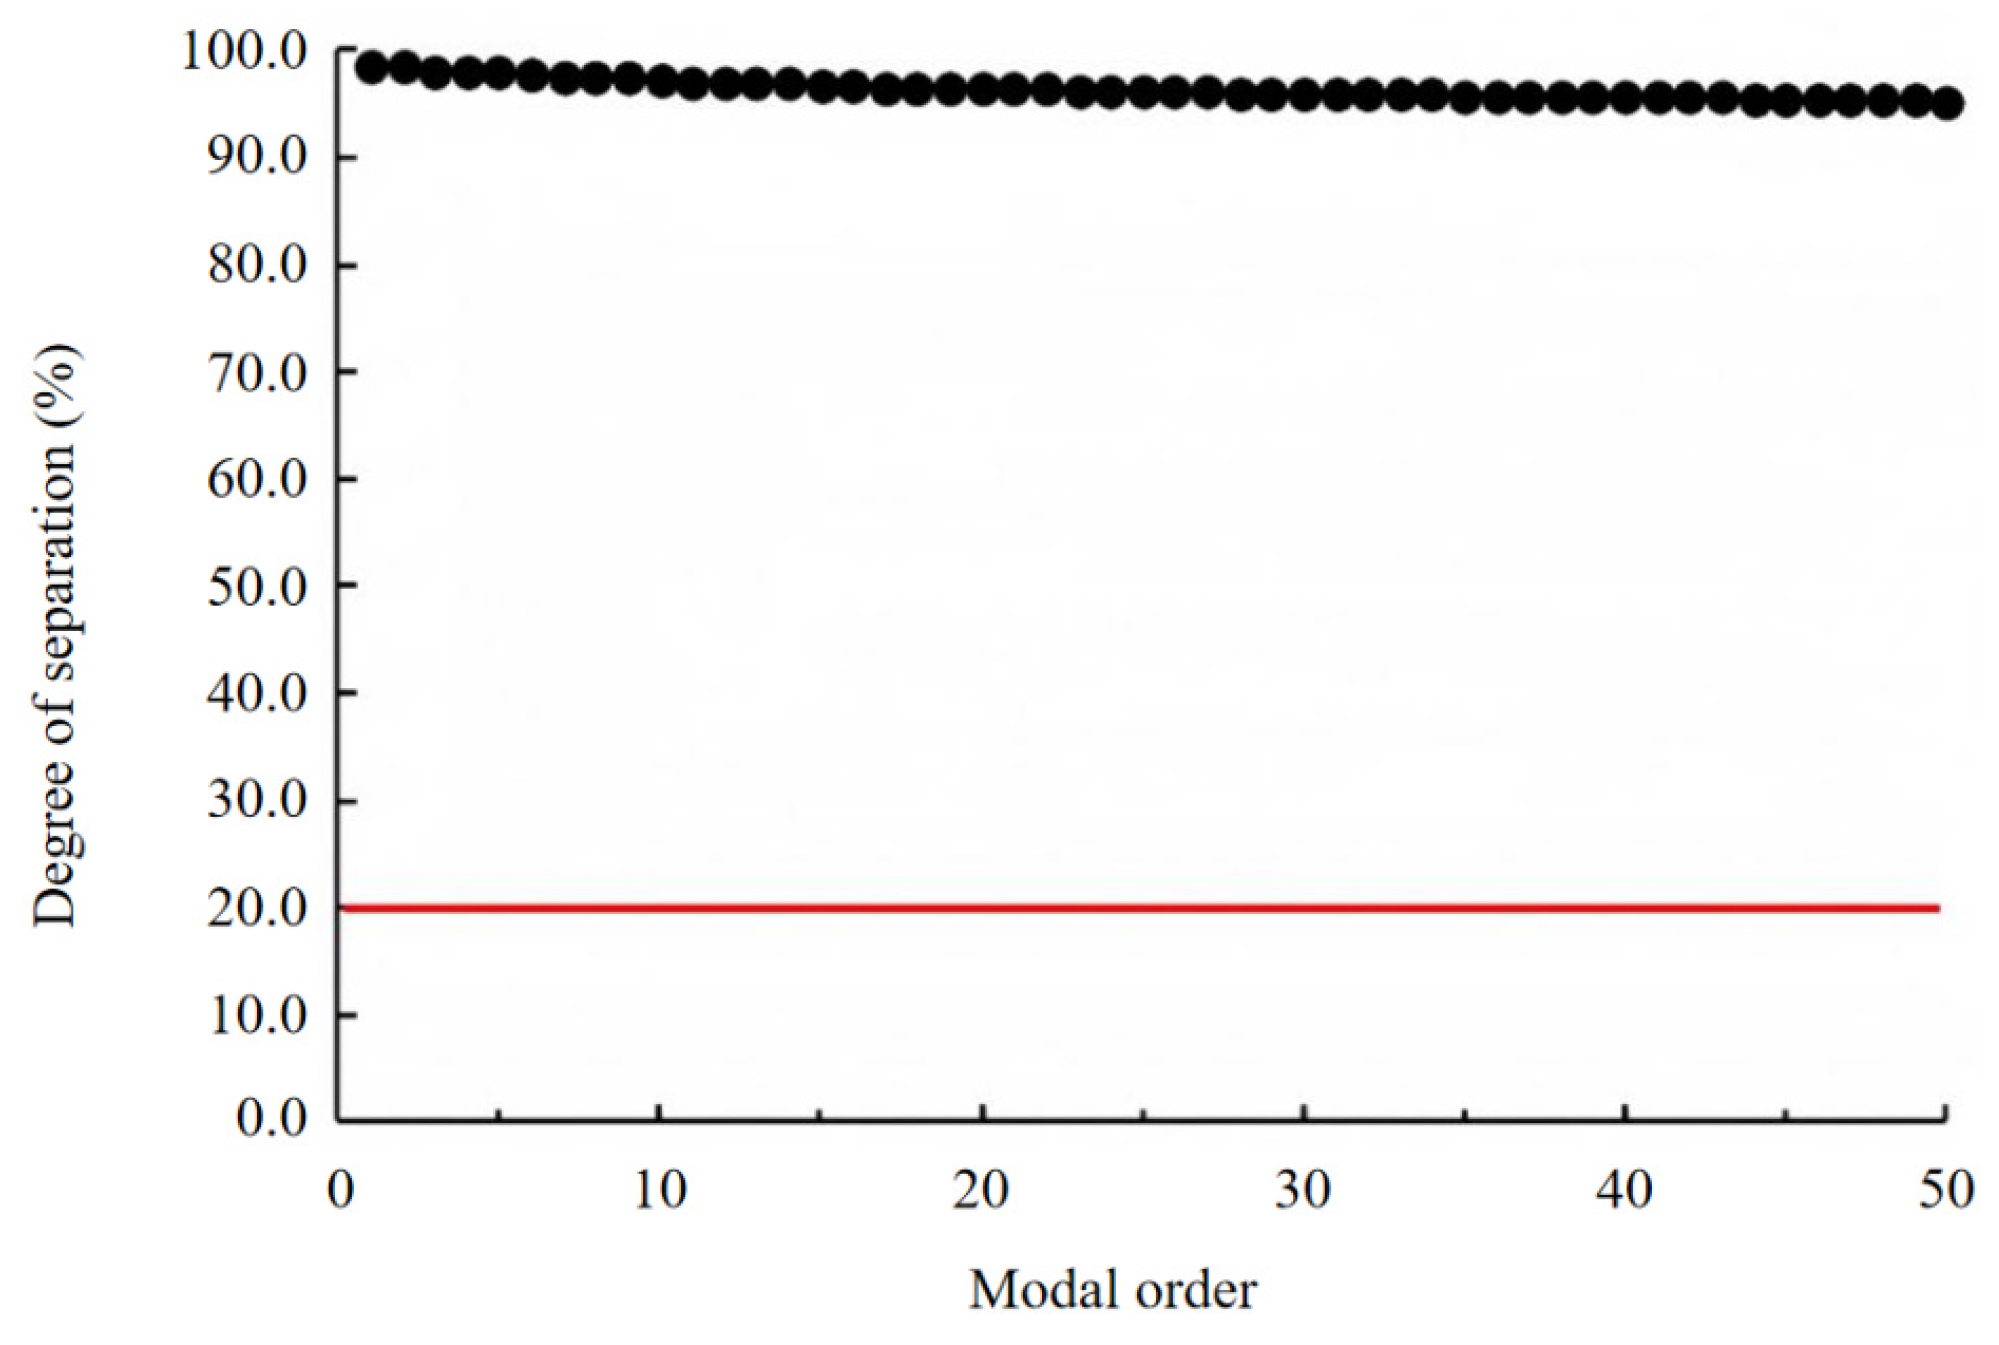
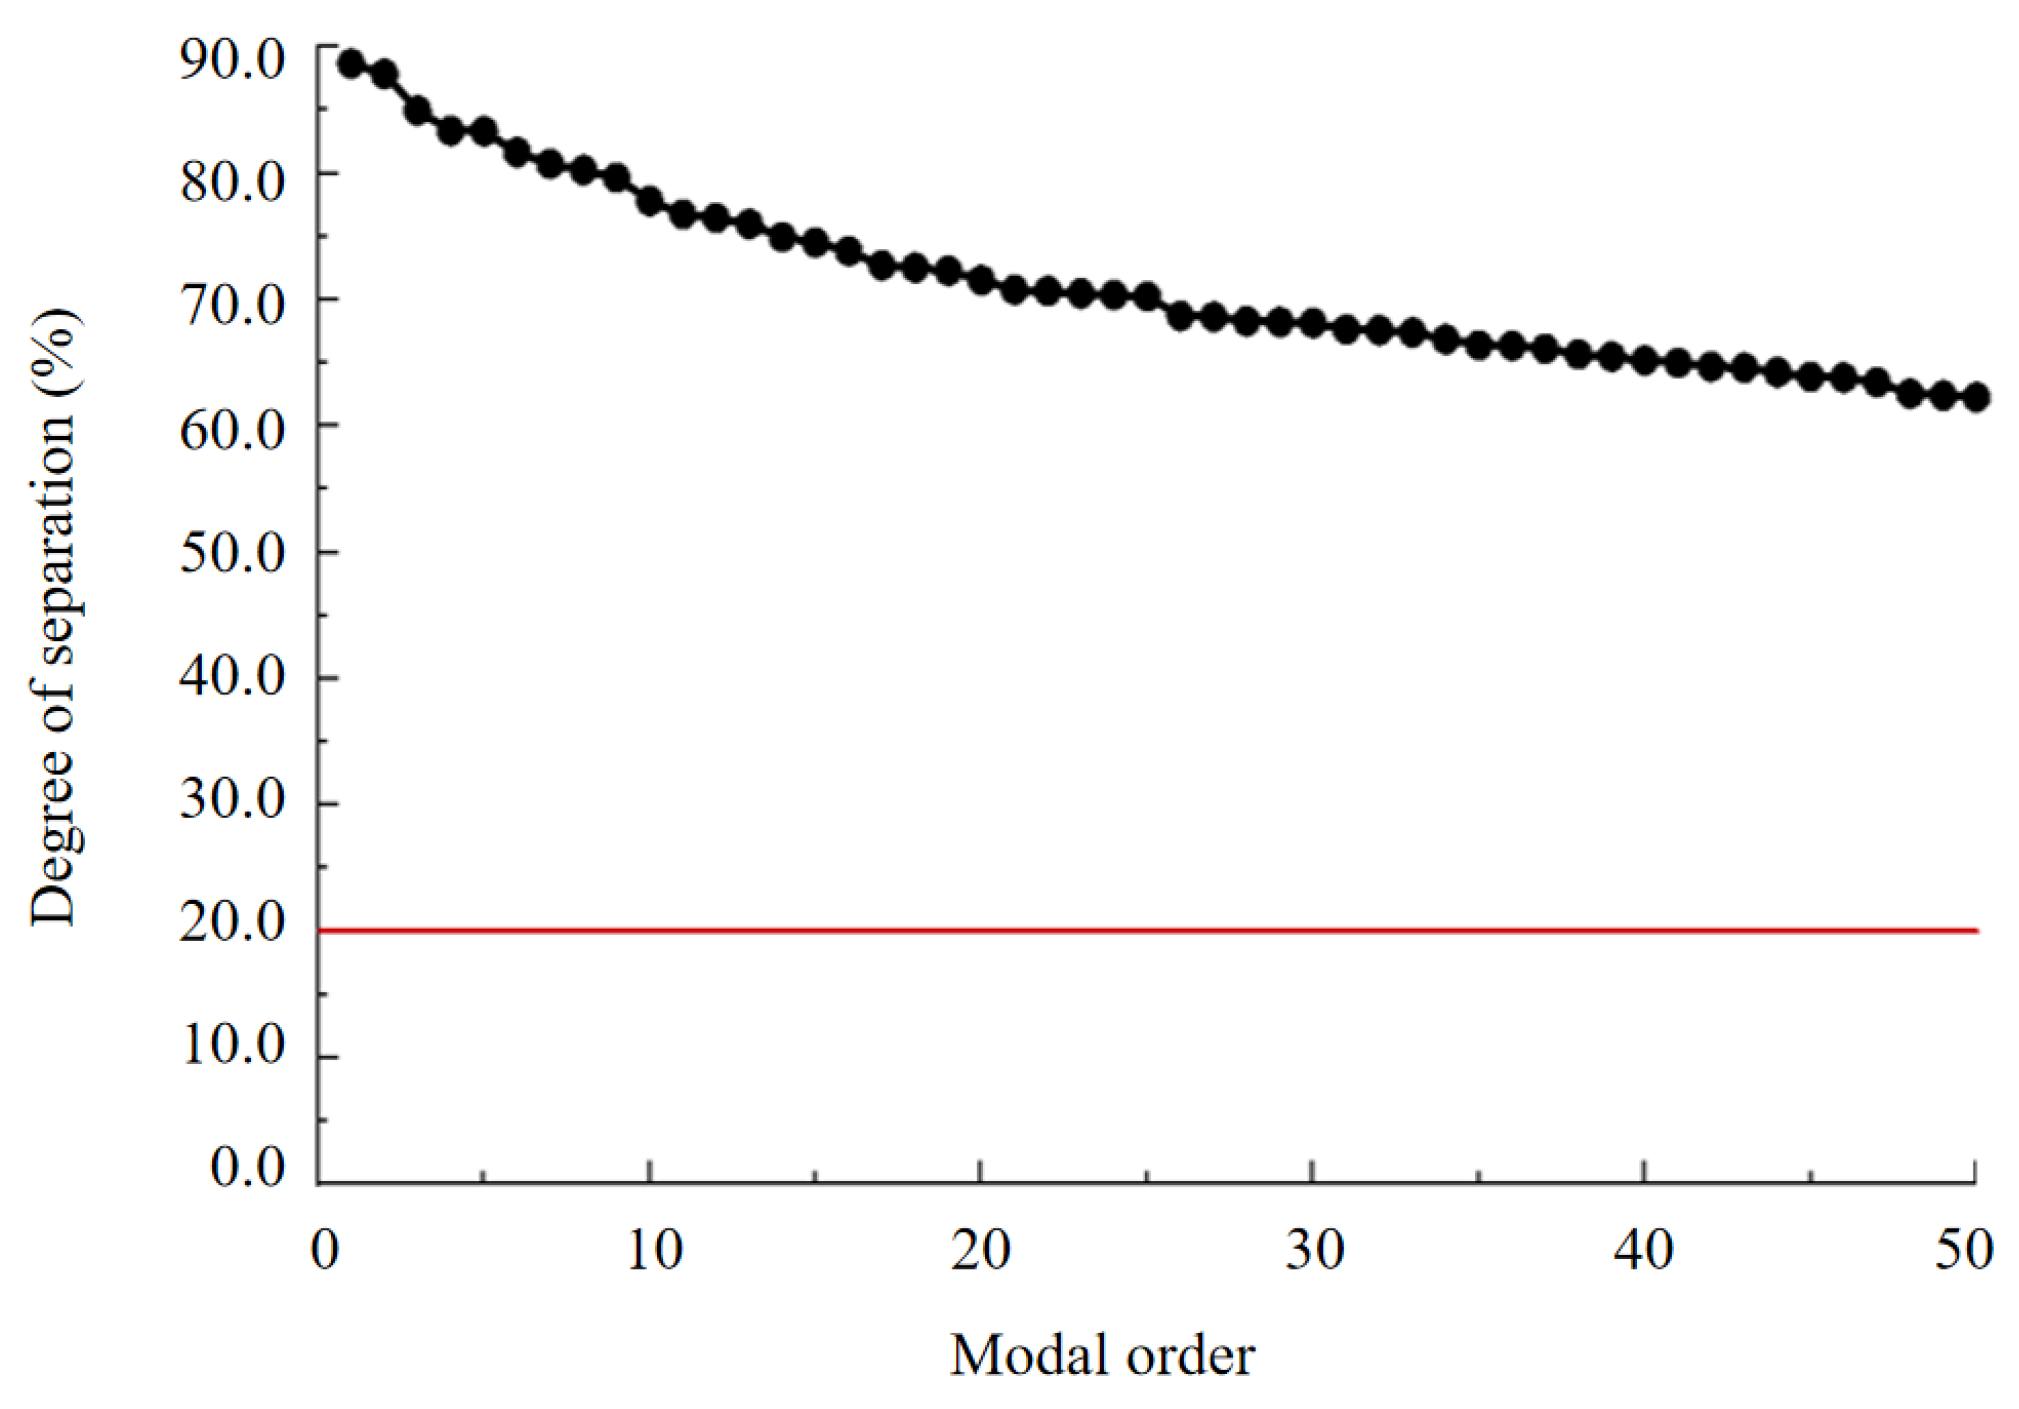
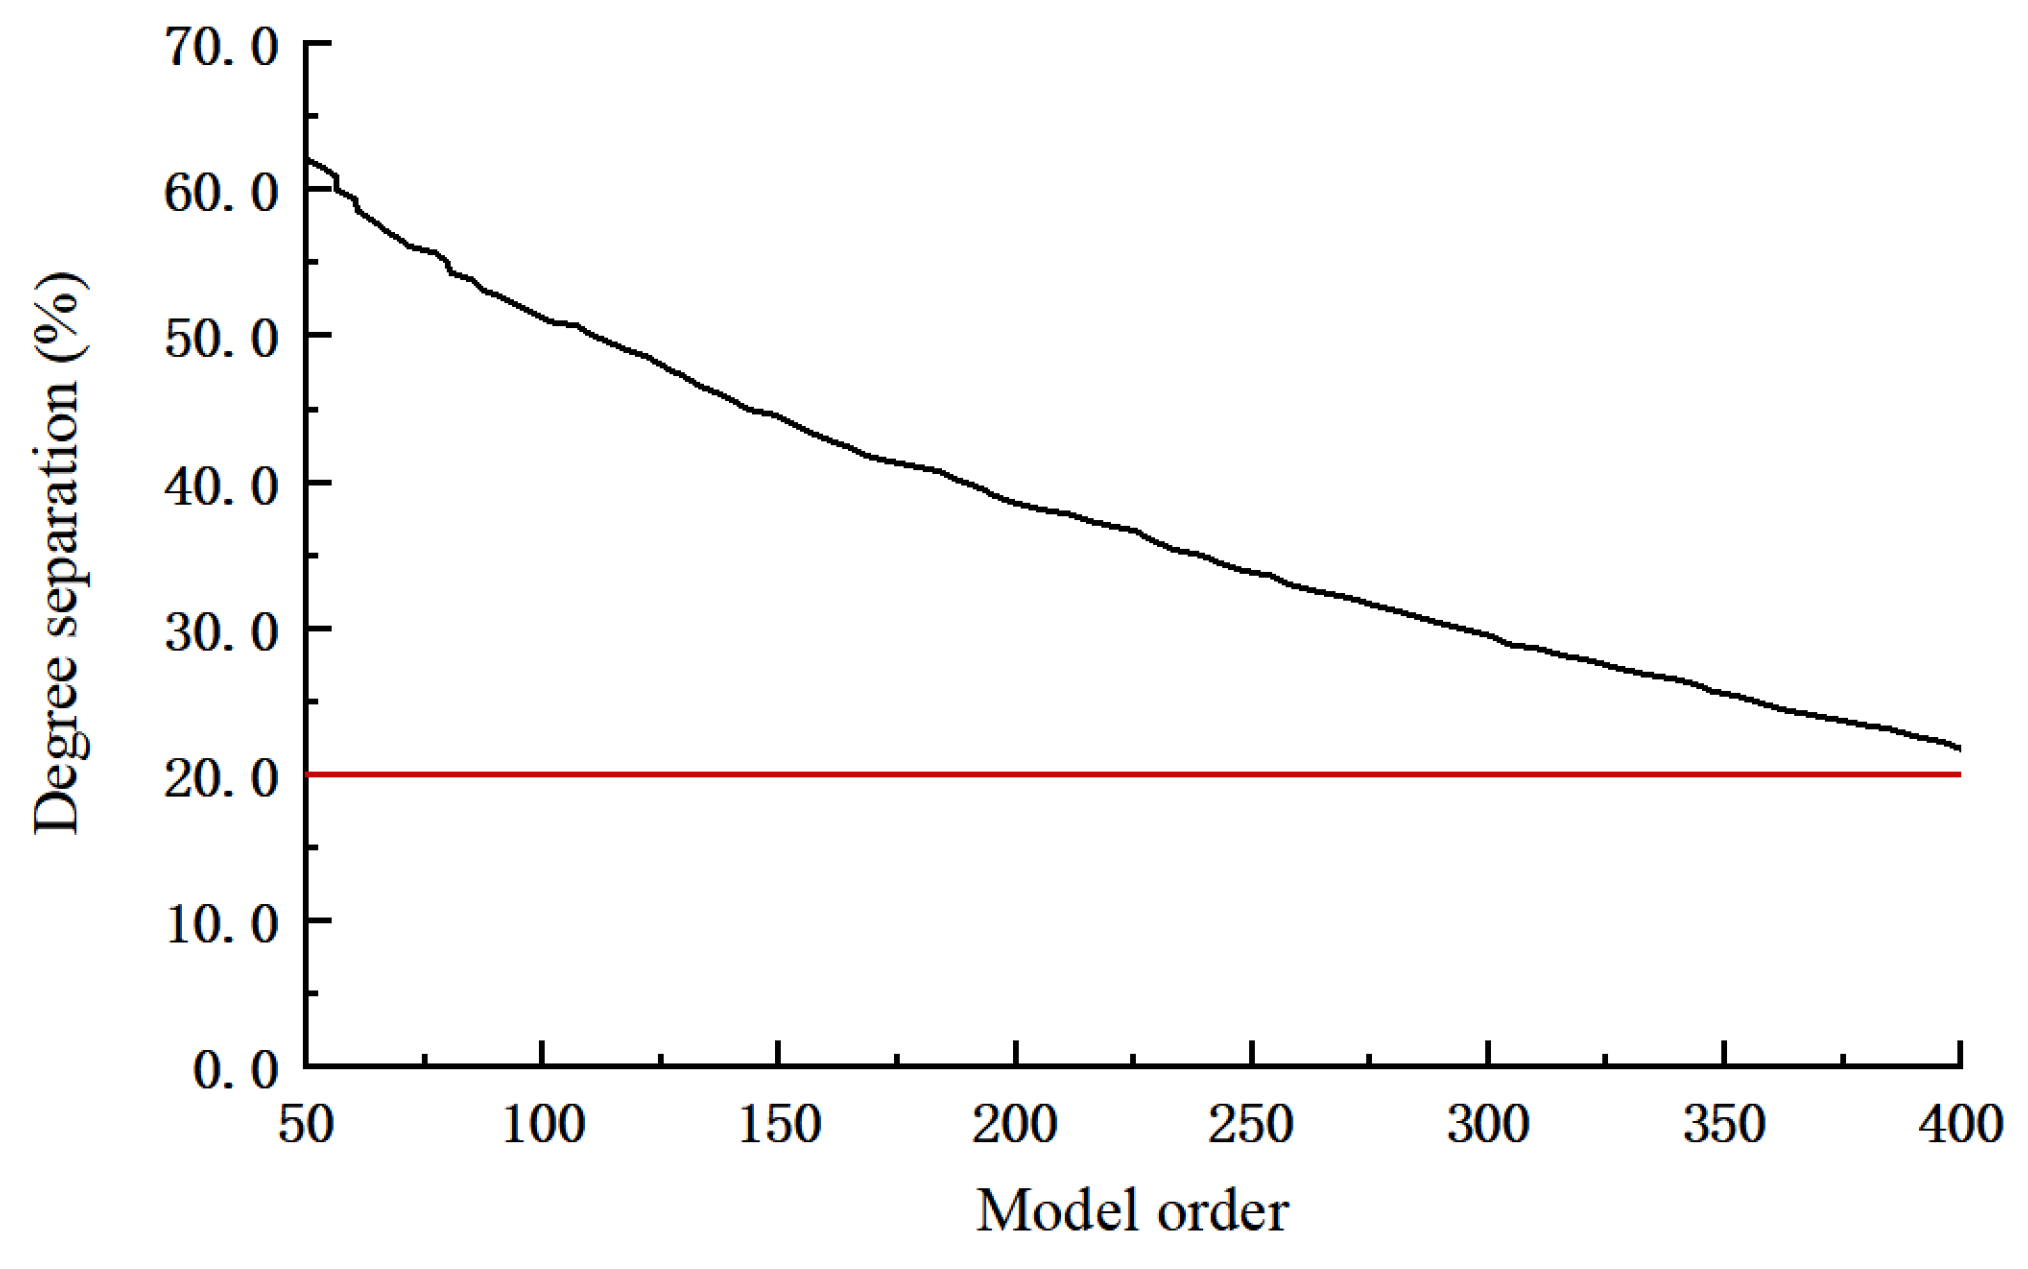
(4) For the blade passage frequency of 24.583 Hz, although the separation ratios of the first 50 modes all satisfy the 20% criterion, the separation ratio shows a continuously decreasing trend with increasing mode order. Therefore, the analysis range was extended to the 400th mode. The extended calculations show that even at the 400th mode, the separation ratio remains significantly above 20%. Within the range of modes 51 to 400, the separation ratio never falls below 20%.
It should be noted that the present resonance assessment employs the code-specified frequency separation criterion (NB/T 35011-2016) as the primary screening tool. While this criterion is effective for identifying potential resonance hazards, a more comprehensive quantification—incorporating excitation force amplitudes, modal participation factors, and the spatial distribution of dynamic loading—represents a natural extension of this work and is recommended for future investigations.