1. Introduction
With the continuous increase in railway mileage in China, by the end of 2025, the national railway operating mileage had reached 165,000 km, of which high-speed railways accounted for over 50,000 km, establishing the world’s largest and most advanced high-speed railway network [
1]. To evaluate track quality and ensure operational safety, railway tracks require regular inspection [
2]. The Track Quality Index (TQI) is a technical indicator that comprehensively evaluates the state of track geometric irregularities using mathematical statistical methods [
3]. This index quantifies the smoothness of the track structure by calculating the sum of the standard deviations of seven geometric parameters—including longitudinal level (left and right), alignment, gauge, cross-level, and twist—over a specified track section. A smaller TQI value indicates better track quality. Therefore, accurately measuring track geometric irregularities plays a crucial role in maintaining railway quality and ensuring the safety of both life and property [
4].
Track inspection technology [
5] is a key technology for ensuring track safety in railway transportation engineering. It is primarily implemented through two methods: static inspection (using manual or light measurement trolleys to measure parameters such as gauge and cross-level) and dynamic inspection (using track inspection cars under train loads). The evolution of dynamic inspection technology has gone through three generations. Currently, dynamic inspection technology has become the mainstream approach. Therefore, ensuring the accuracy and reliability of geometric irregularity measurements obtained from track inspection systems has become a critical challenge.
The core significance of measurement uncertainty evaluation in track inspection systems lies in quantifying the degree of confidence in inspection results [
6], thereby providing a scientific basis for safe track operation and maintenance as well as system optimization. It ensures the reliability of inspection results by clarifying the error range of measurements, avoiding misjudgment of track defects caused by ambiguous results, and reducing operational and maintenance risks. Furthermore, it identifies the primary sources of uncertainty, offering targeted directions for equipment calibration and algorithm optimization. Additionally, it meets standards and compliance requirements, aligning with the metrological requirements for measurement equipment in the rail transit industry, ensuring that inspection data possess legal validity and mutual recognition to support processes such as acceptance and assessment.
In the study of uncertainty sources in track inspection system measurements and vehicle–track coupling, Han Zhi et al. [
7] proposed a dynamic calibration method for track inspection systems based on actual railway lines, introduced a bisection method to reduce systematic measurement errors, and performed an analysis and uncertainty evaluation. Wang Yan [
8] proposed a method based on an integrated calibration test bench for track inspection systems, enabling full-system operating condition simulation and parameter traceability calibration. Xu et al. [
9] developed a three-dimensional train–track interaction model that couples the train and track into a complete system matrix. Wang et al. [
10] investigated a wayside hunting detection system for monitoring the absolute displacement of wheelsets. Fu et al. [
11], based on the dynamic response analysis of vehicle–track coupling, designed the track structure and discussed the vibration responses of the vehicle and track under different operating conditions by calculating the coupling system of an HTS maglev train.
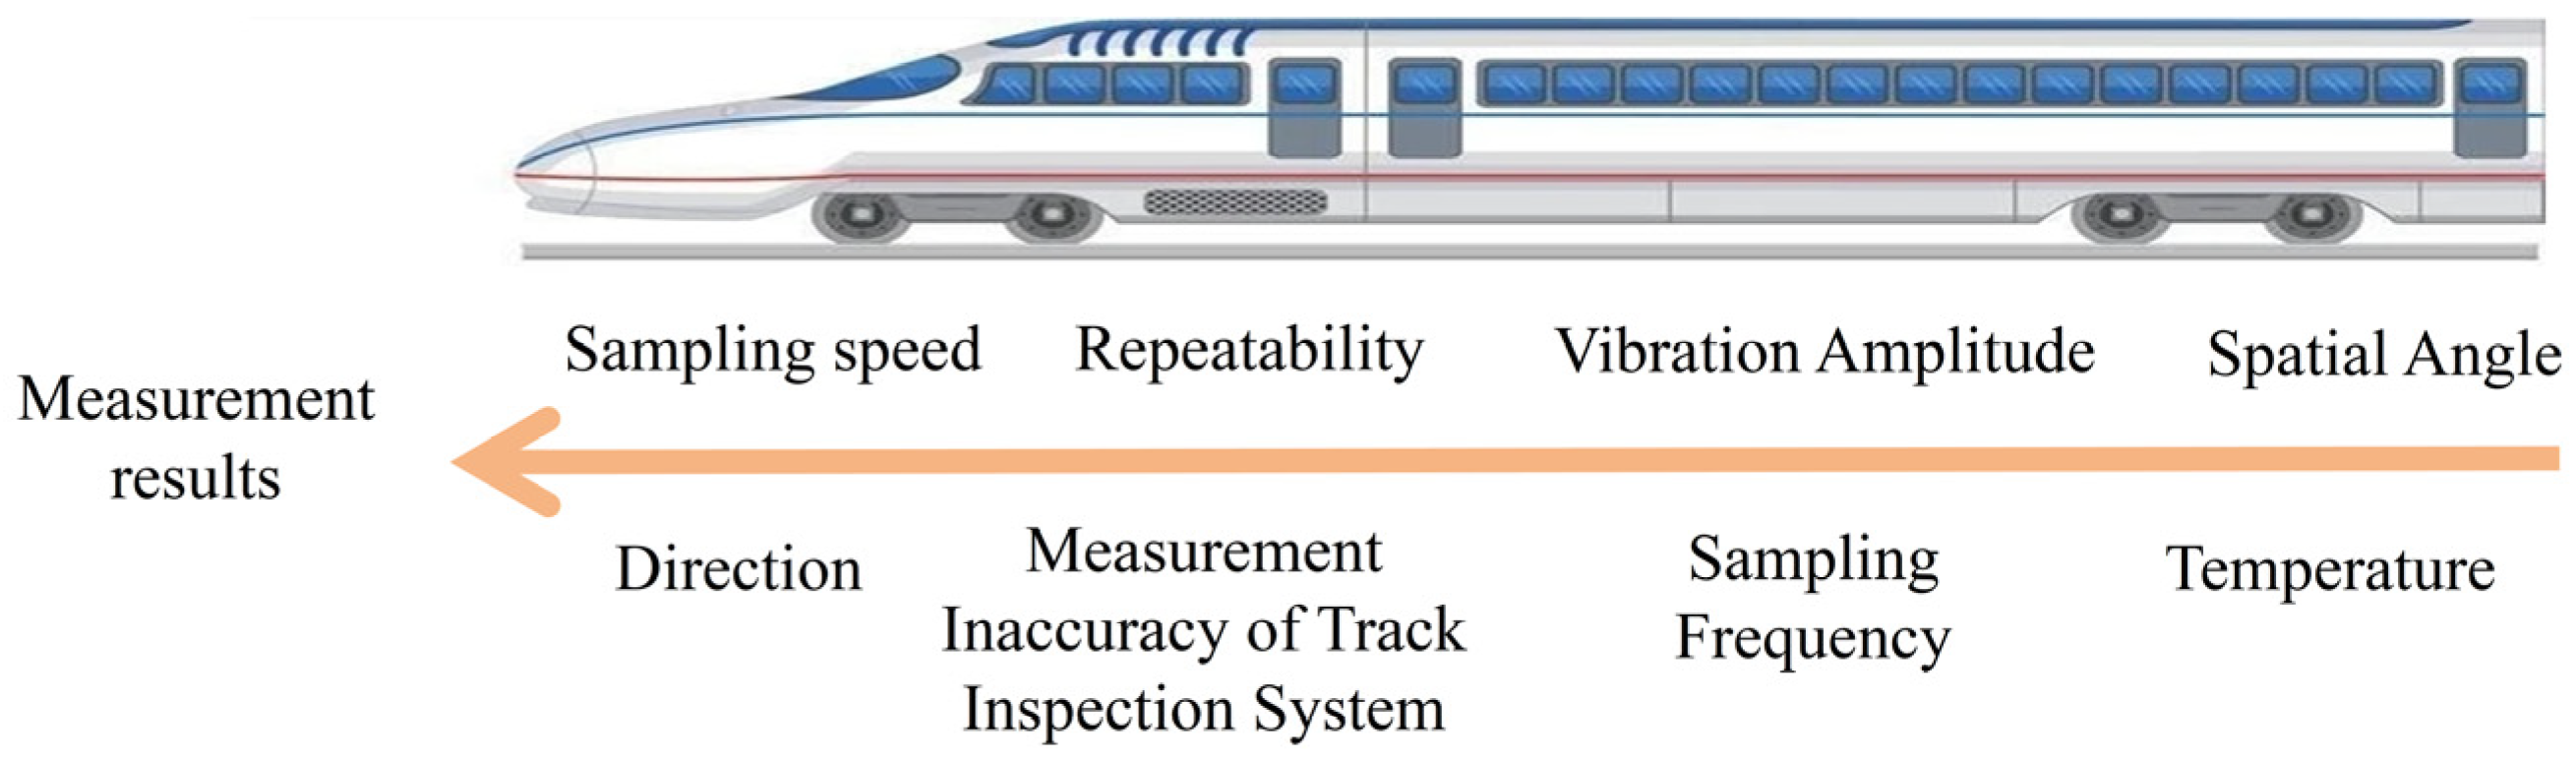
Currently, the evaluation of measurement uncertainty for track inspection systems faces several challenges. First, traditional methods based on actual railway lines are not only time-consuming and labor-intensive but also struggle to account for the influence of various operating conditions (such as vibration amplitude and spatial attitude) on the inspection quality of the track inspection system. Second, the operational environment of the track inspection system involves a dynamically coupled scenario between the track and the vehicle [
12], whereas traditional methods are based on static evaluation, making it difficult to accurately assess the measurement uncertainty of the track inspection system. Therefore, this paper analyzes and dynamically evaluates the sources of uncertainty in the measurement process of the track inspection system based on a calibration test bench in the laboratory.
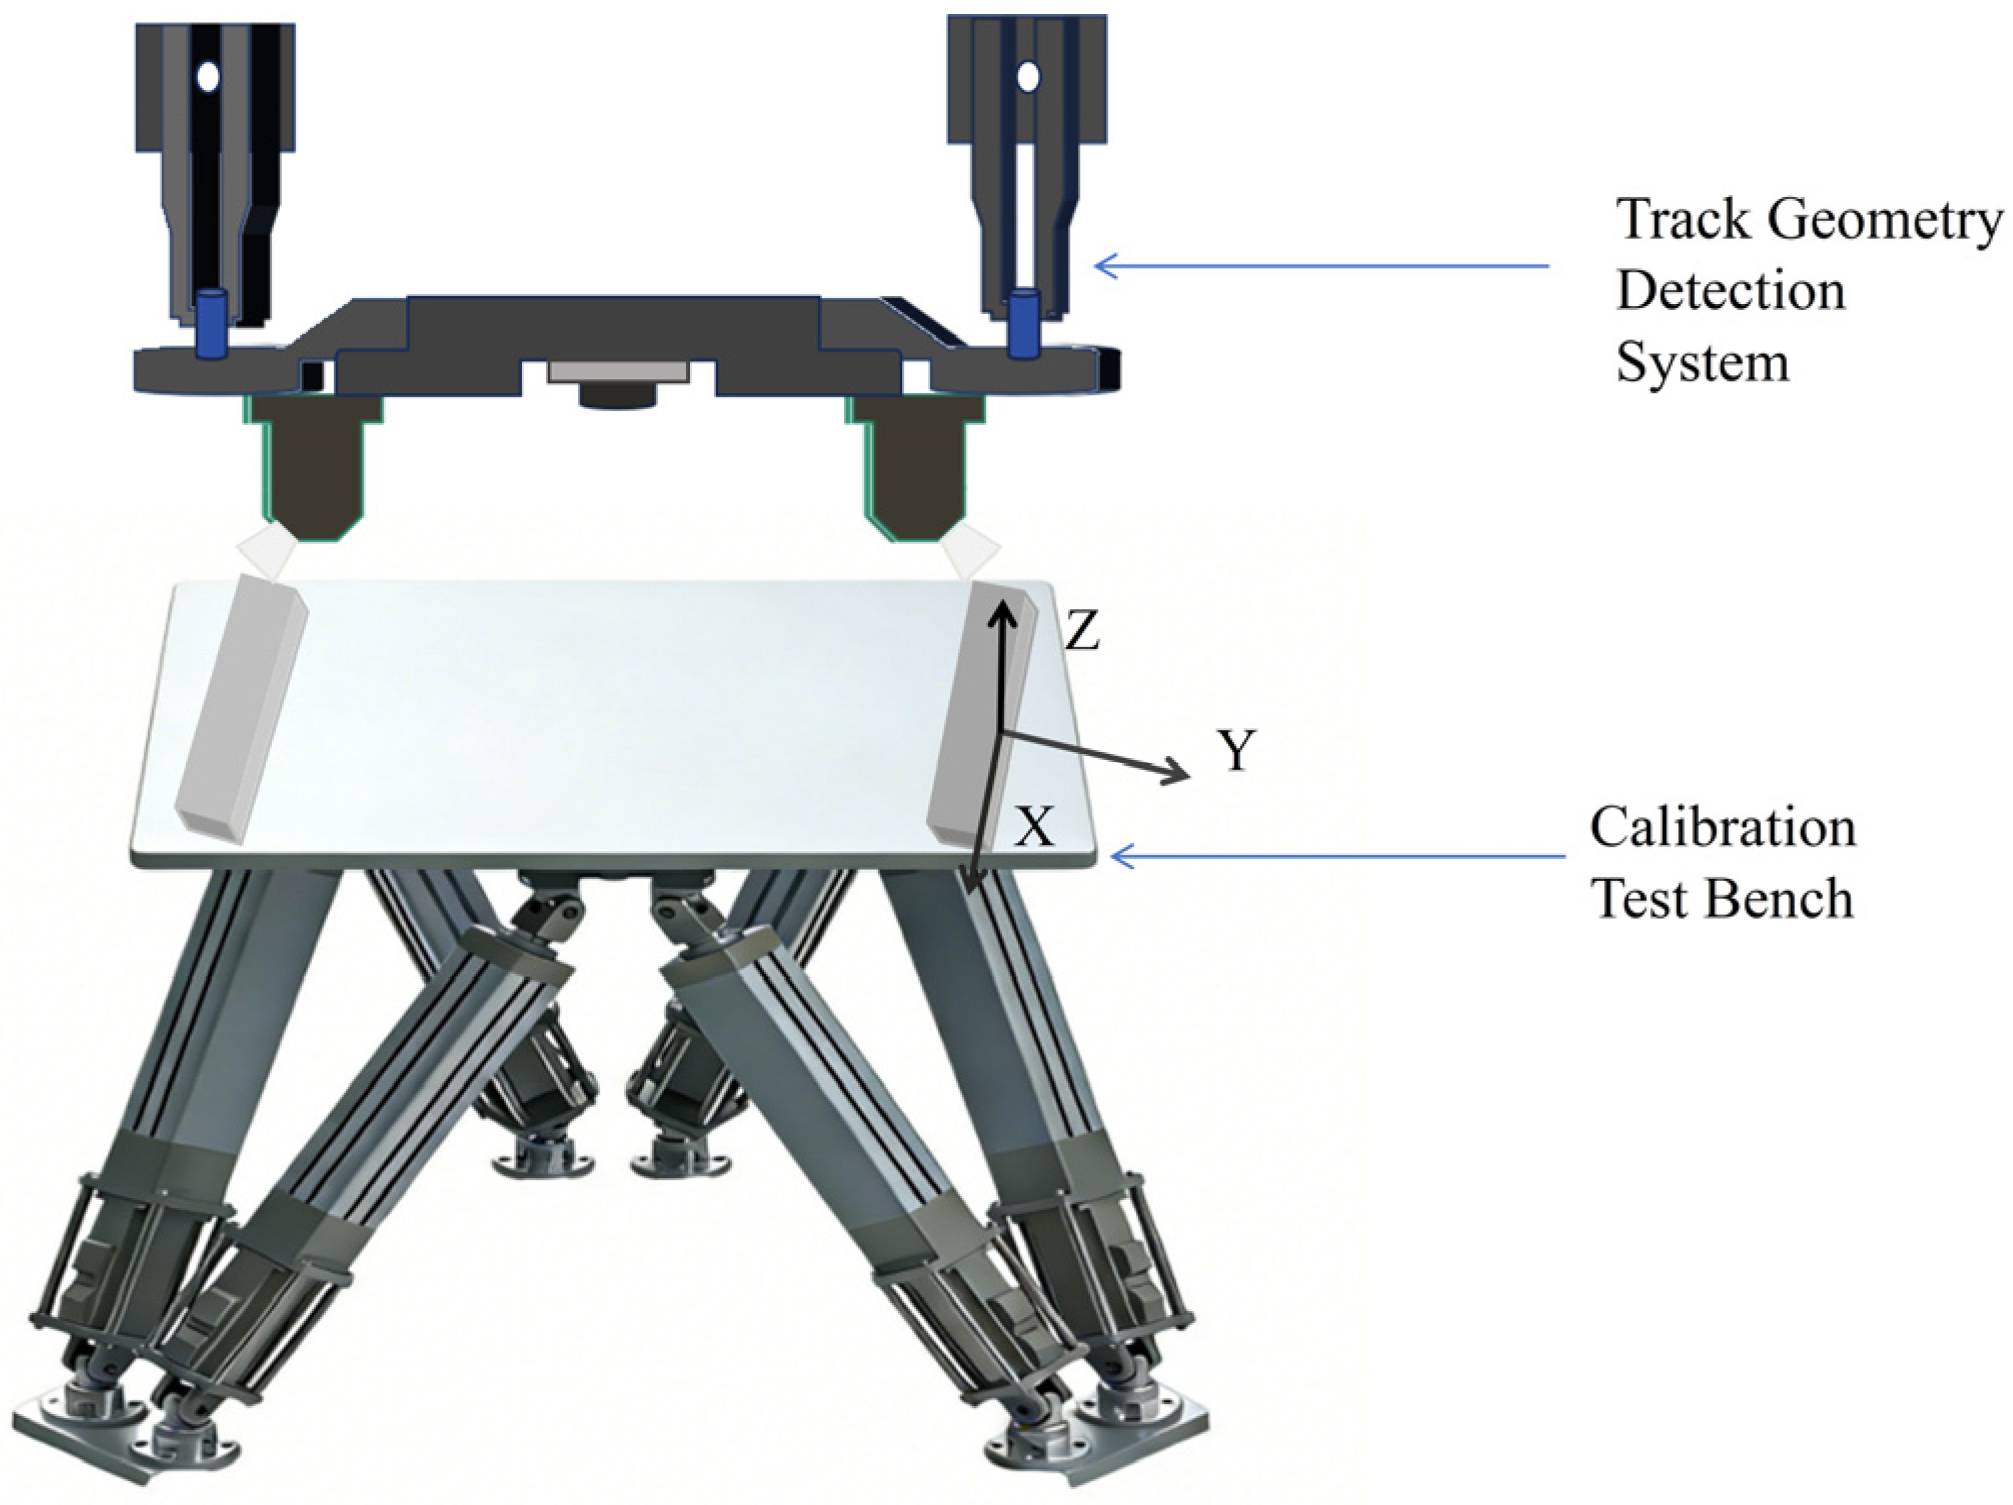
The experimental method involves mounting the object under test (i.e., the track inspection system) on a calibration test bench to measure a simulated track. The geometric irregularity values measured by the track inspection system are compared with the reference values, and the indication errors for each geometric irregularity are output. By varying the test bench parameters and initial conditions, the potential sources of uncertainty affecting the measurements of the track inspection system are analyzed. Finally, this paper takes the uncertainty evaluation of the gauge measurement process as an example, conducting an uncertainty evaluation of the gauge indication error using the Guide to the Expression of Uncertainty in Measurement (GUM). The track inspection system is subject to electromagnetic interference and vibration in actual measurements [
13,
14,
15]. Therefore, the robust statistical method [
16] is used to evaluate repeatability uncertainty, better reflecting real operating conditions and avoiding outlier interference in traditional methods.
The analysis and quantification of uncertainty sources in the measurement process of the track inspection system can serve as Type B input sources for subsequent evaluations, simplifying the complexity of the actual evaluation process while enhancing the reliability of the evaluation results.
5. Case Study: Measurement Uncertainty of Gauge Parameters
Taking the uncertainty evaluation of the gauge measurement process as an example, the track inspection system is mounted on the test bench to measure a simulated track. The test bench inputs the collected train operation data from actual lines (e.g., bogie frame data transmitted to the bogie simulator) to generate corresponding dynamic coupling between the vehicle body simulator and the bogie simulator. The collected train vibration amplitude is set to a reference amplitude, and experimental conditions such as amplitude multiplier, sampling speed, sampling frequency, and track spatial attitude can be varied according to the experimental requirements.
During the experiment, the positioning accuracy of the test bench, as given by its calibration certificate, is 0.01 mm. The uncertainty introduced by this factor is negligible compared to other components. Therefore, the uncertainty component arising from the calibration test bench is not considered in the following sections.
During the uncertainty evaluation process, the range coefficients can be obtained from the national metrological technical specification JJF 1059.1-2012,
Evaluation and Expression of Uncertainty in Measurement. The range coefficients used in this paper are presented in
Table 4 [
25].
5.1. Uncertainty Introduced by Measurement Inaccuracy of the Track Inspection System u1
In this study, an optimized evaluation method is adopted for the uncertainty introduced by the measurement inaccuracy of the track inspection system. The uncertainty is calculated based on the indication error Δ
E obtained from actual calibration. The uncertainty of the calibration process is
uE = 0.11 mm, and the indication error is Δ
E = 0.325 mm (derived from the calibration test data of the track inspection system). According to Equation (8), the uncertainty component
u1 is obtained as:
5.2. Uncertainty Introduced by Repeatability u2
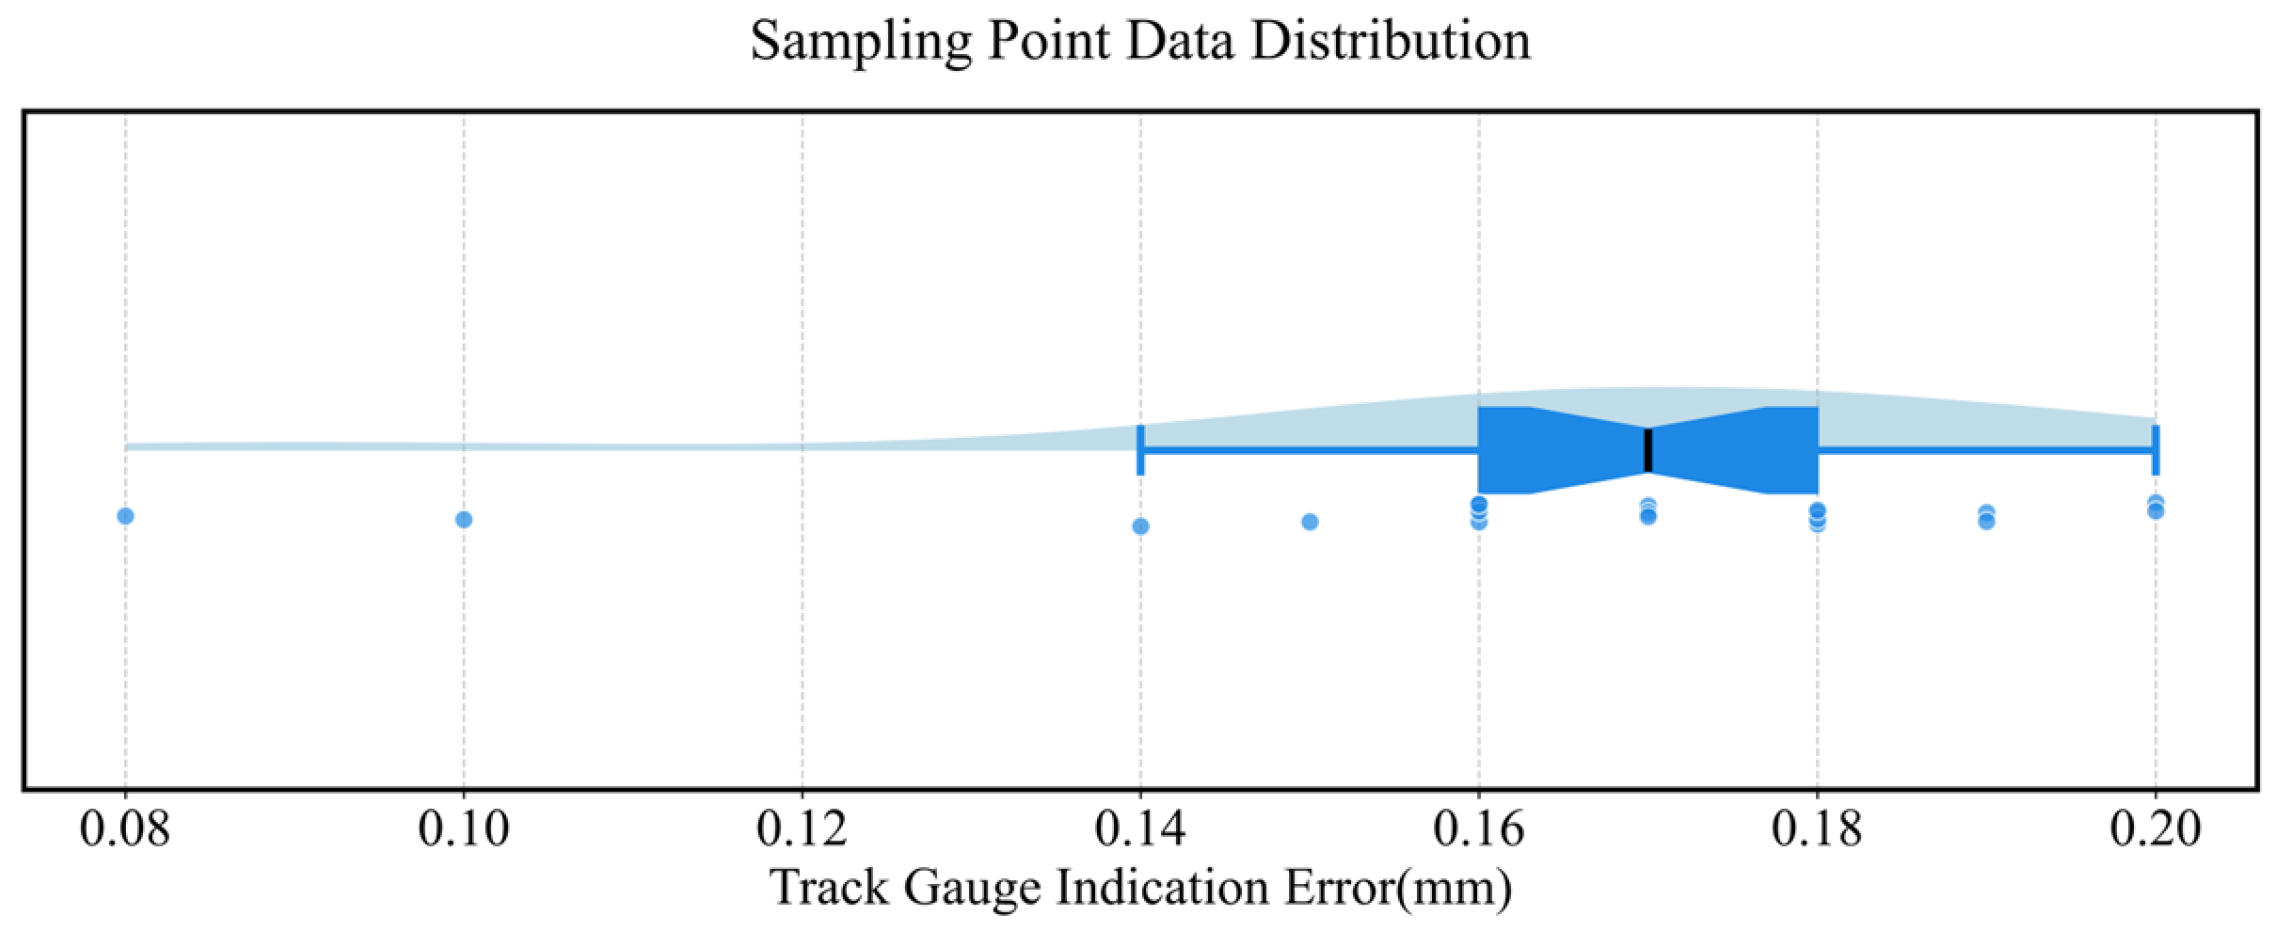
The track inspection system was mounted on the test bench for experimentation. Under constant experimental conditions and with the track simulation subsystem kept stationary (i.e., the gauge of the measured object remained unchanged), 20 measurements were performed, with sampling conducted at the same sampling point. The uncertainty introduced by repeatability was calculated using the robust statistical method. As shown in
Table 2, the uncertainty introduced by repeatability is
u2 = 0.015 mm.
5.3. Uncertainty Introduced by Vehicle Body Vibration Amplitude u3
The vibration amplitude of the train under normal operating conditions, as collected from actual measurements, was set as the reference amplitude (1×). Under otherwise constant experimental conditions, the vibration amplitude was varied, and measurements were conducted on the same standard gauge at amplitude multipliers of 1, 1.5, 2, 2.5, and 3. The mean gauge indication error for each measurement was calculated, and the results are presented in
Table 5.
According to
Table 4, the maximum gauge difference caused by vibration amplitude is
Rmax = 0.0915 mm. Therefore, the uncertainty introduced by vehicle body vibration amplitude is obtained from Equation (10):
5.4. Uncertainty Introduced by Different Sampling Frequencies of the Track Inspection System u4
With the vibration amplitude and sampling speed of the test bench kept constant, the track inspection system was used to measure the simulated track at different sampling frequencies. The mean gauge indication errors obtained under each condition are shown in
Table 6:
Therefore, the range of gauge indication errors caused by different sampling frequencies is 0.0728 mm. The uncertainty introduced by different sampling frequencies of the track inspection system is obtained from Equation (11):
5.5. Uncertainty Introduced by Measurement Under Different Spatial Attitudes of the Track Inspection System u5
Variations in the spatial attitude of the track can be quantified through the track simulation subsystem as angular variations in the RX, RY, and RZ directions. A deviation of 0.5° in each direction (covering both normal and extreme conditions) was applied. With other experimental conditions kept constant, the influence of different angular variations in the three directions on the measurement results of the track inspection system was investigated on the test bench. The data are shown in
Table 7.
Therefore, the range of gauge indication errors shown in
Table 6 is 0.4044 mm. The uncertainty introduced by different angular attitudes is obtained from Equation (12):
5.6. Uncertainty Introduced by Different Sampling Speeds u6
With the track geometric irregularity simulation subsystem kept unchanged (i.e., the gauge remained constant), the track inspection system was tested at different speeds (25 km/h, 50 km/h, 120 km/h, 200 km/h, 300 km/h, and 350 km/h) to obtain gauge indication error results. Six groups of measurement data were collected at the different speeds, each group containing 1000 consecutive gauge indication error values. Since the reference gauge remained unchanged, the mean value of each group was calculated, as shown in
Table 8.
The range among the mean gauge indication errors in
Table 7 is
Rmax3 = 0.013 mm. Therefore, the uncertainty introduced by different sampling speeds
u6 is obtained from Equation (13):
5.7. Uncertainty Introduced by Different Measurement Directions u7
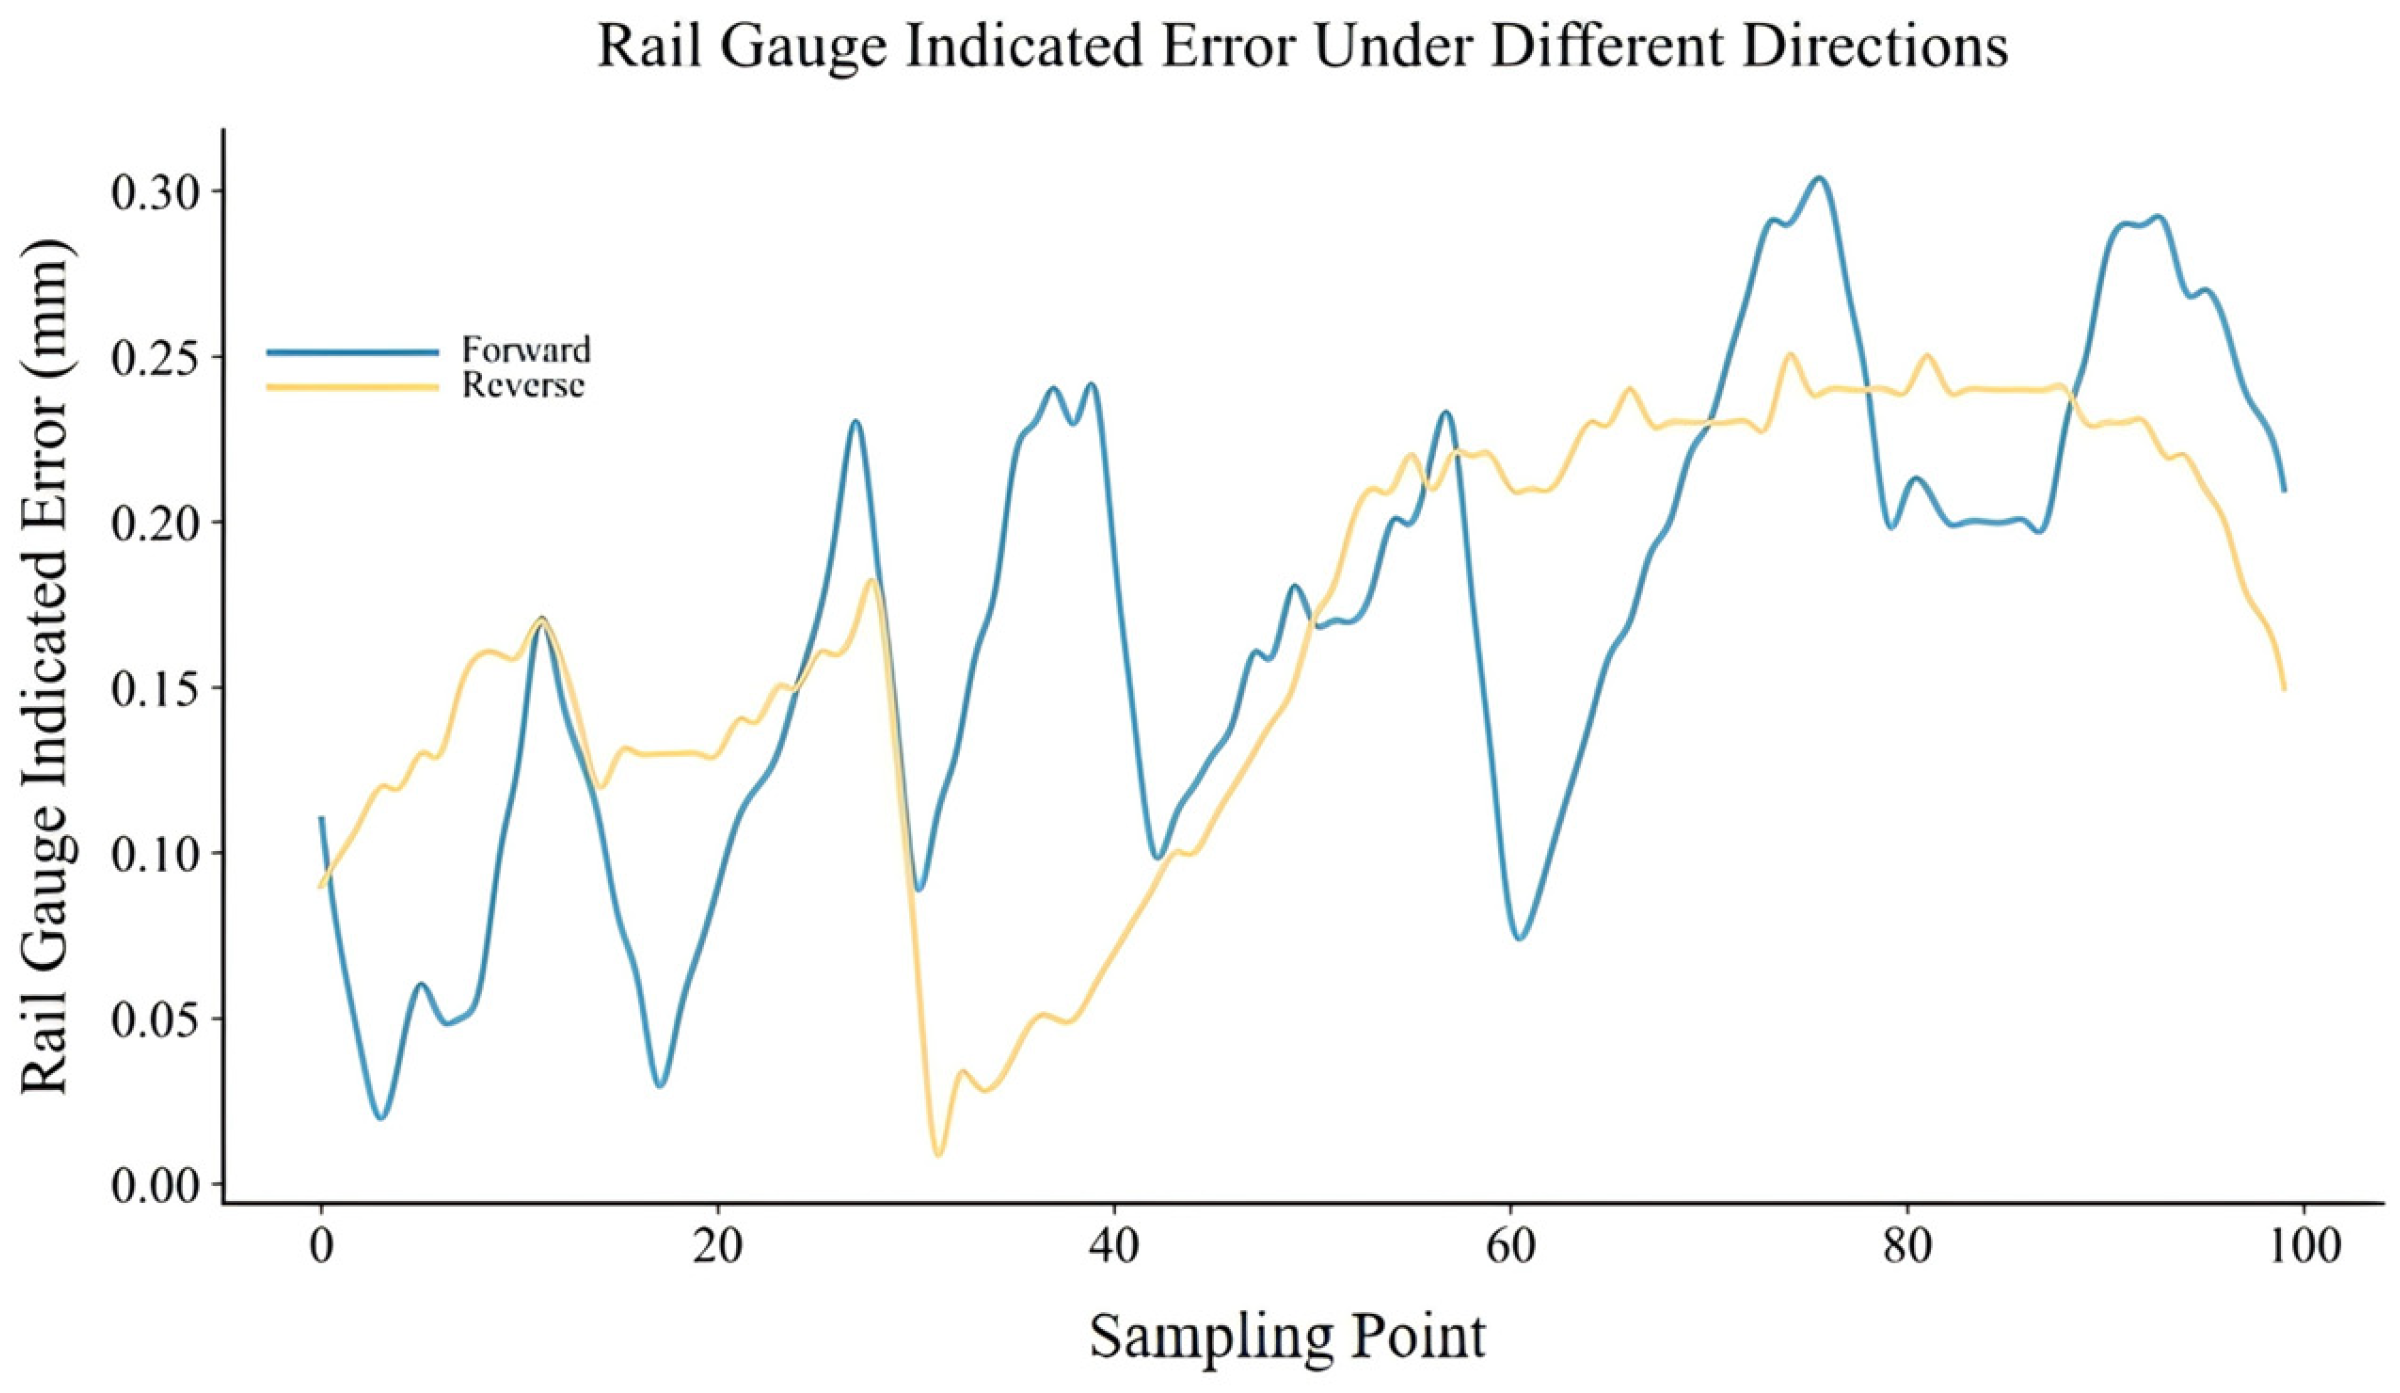
With all other experimental conditions kept constant, the track inspection system was used to measure the same standard gauge section in the forward and reverse directions, respectively. Two sets of gauge indication error data were obtained; the two sets of experimental data, along with the data segment at the sampling point where the maximum range occurs, are presented in
Table 9.
The two sets of data curves are shown in
Figure 6.
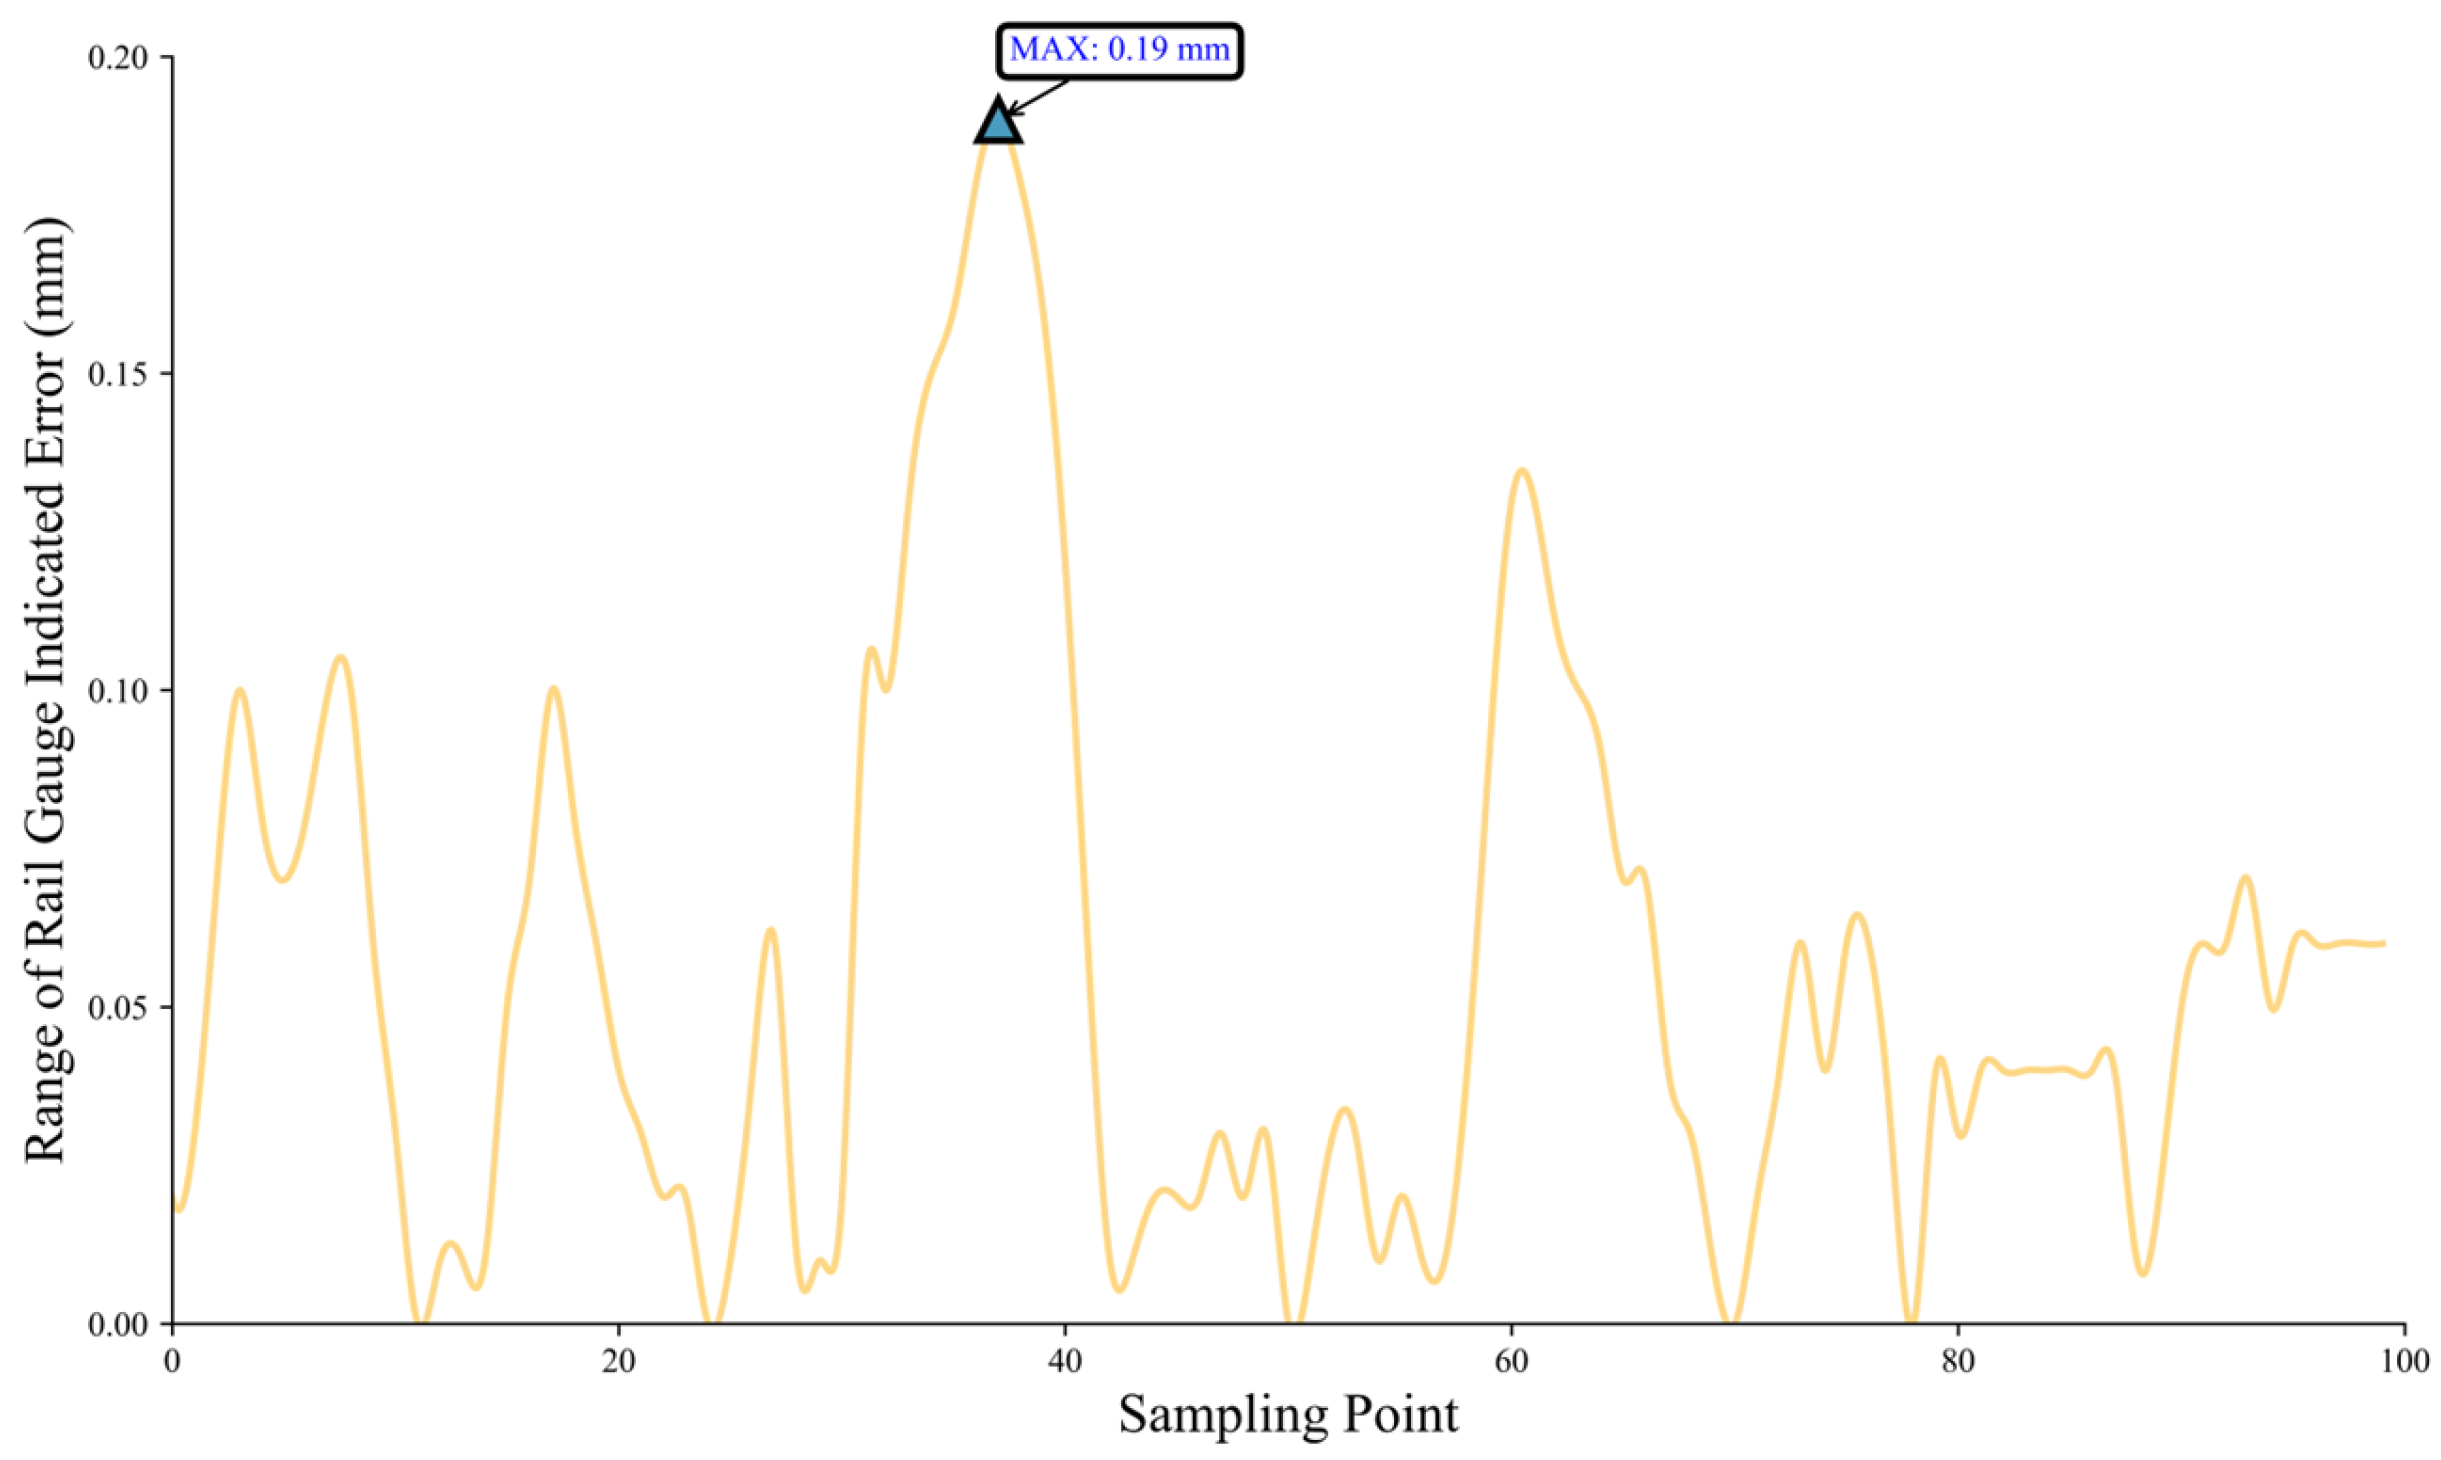
Figure 7 shows the curve of the range of gauge indication errors under different measurement directions. As illustrated in the figure, the maximum range is
Rmax4 = 0.190 mm. Therefore, the uncertainty introduced by different measurement directions can be obtained from Equation (14):
5.8. Uncertainty Introduced by Temperature Variation u8
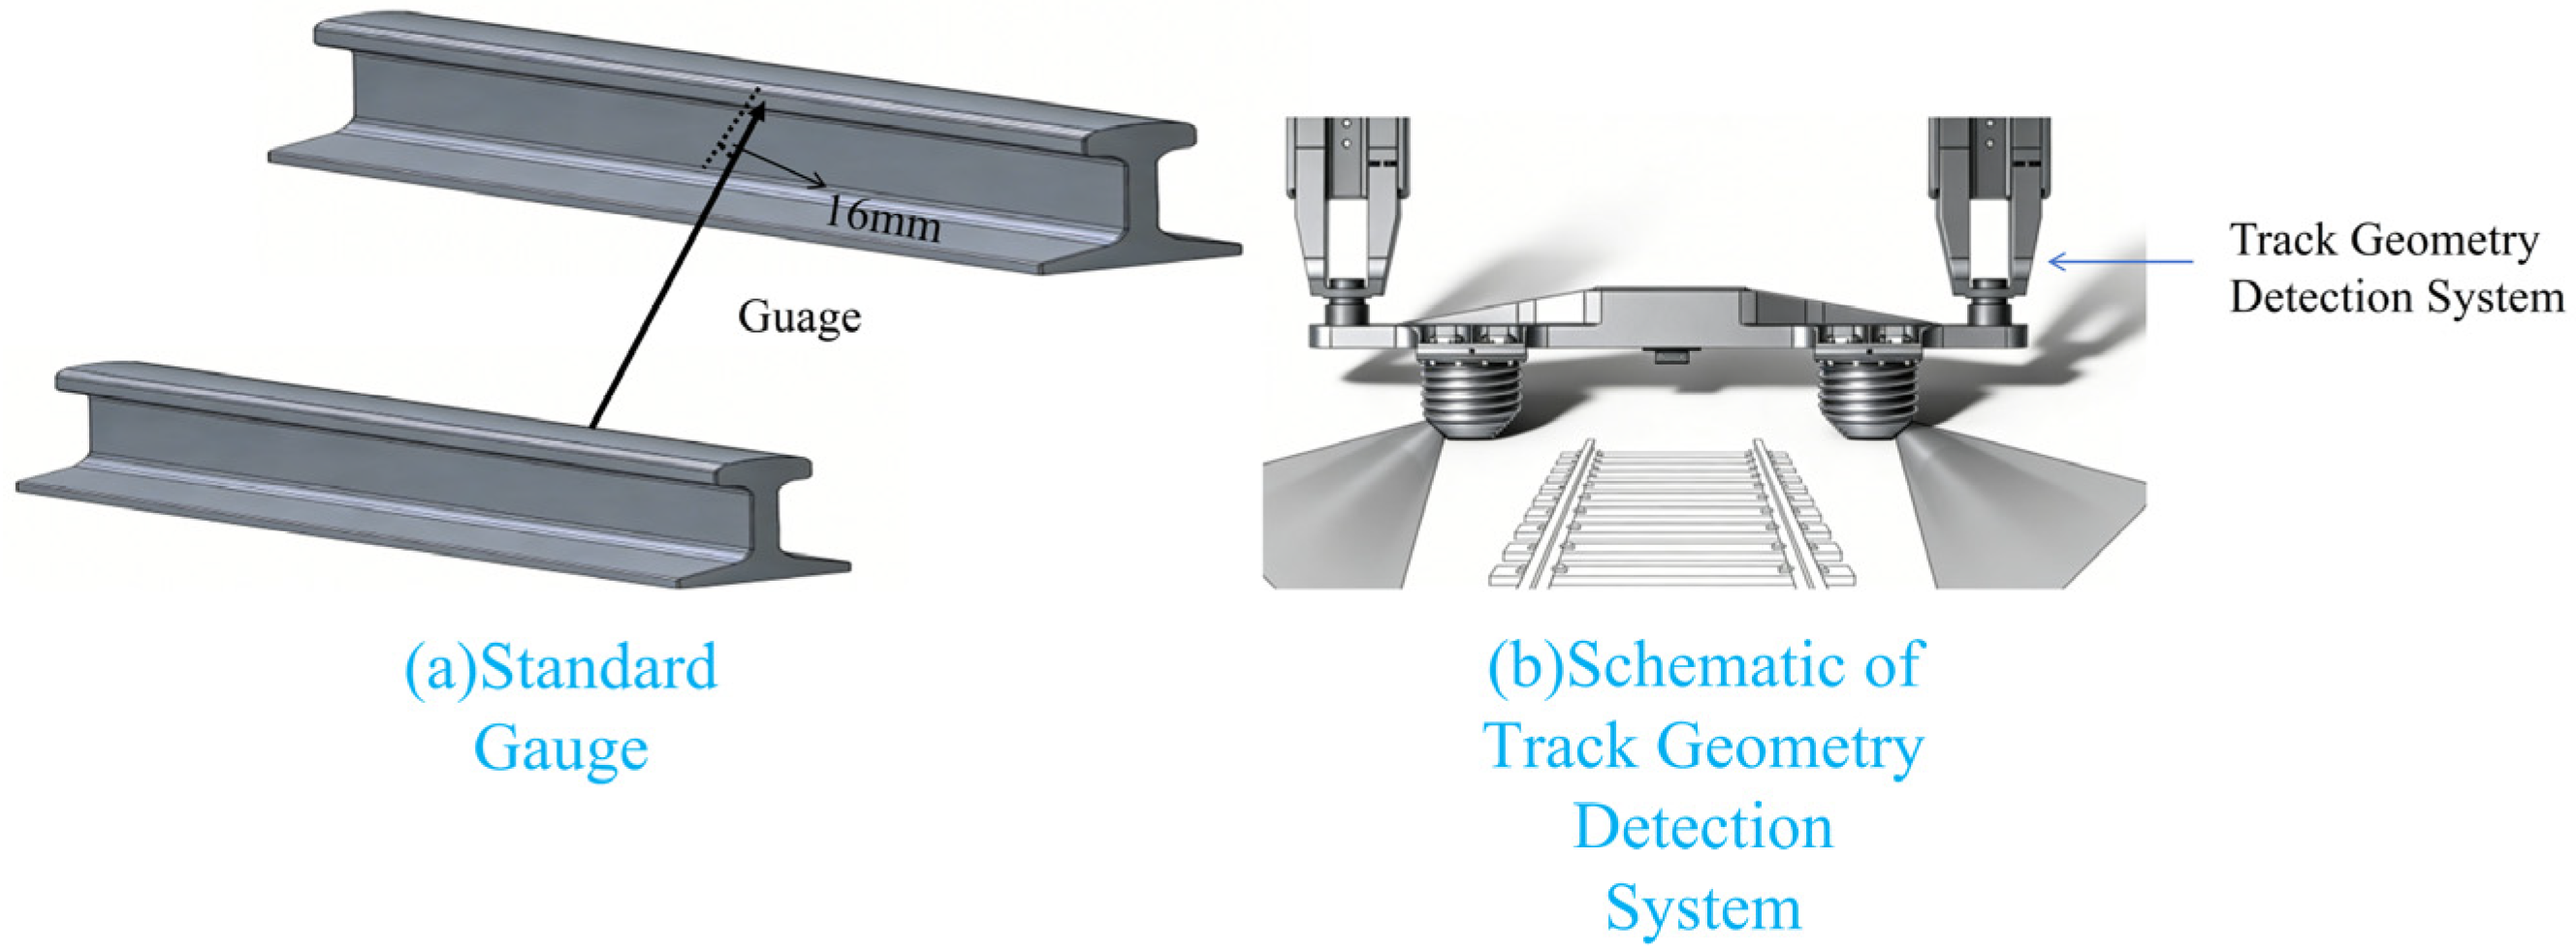
The operating temperature range of the track inspection system is estimated based on an extreme temperature difference of ±20 °C. The width of the rail at a point 16 mm below the top surface is 70 mm, and
a is the linear expansion coefficient of the rail, taken as 12 × 10
−6/°C. The physical dimensional change caused by temperature is obtained from Equation (15):
Therefore, the measurement uncertainty of the gauge introduced by extreme temperature variation is obtained from Equation (16):
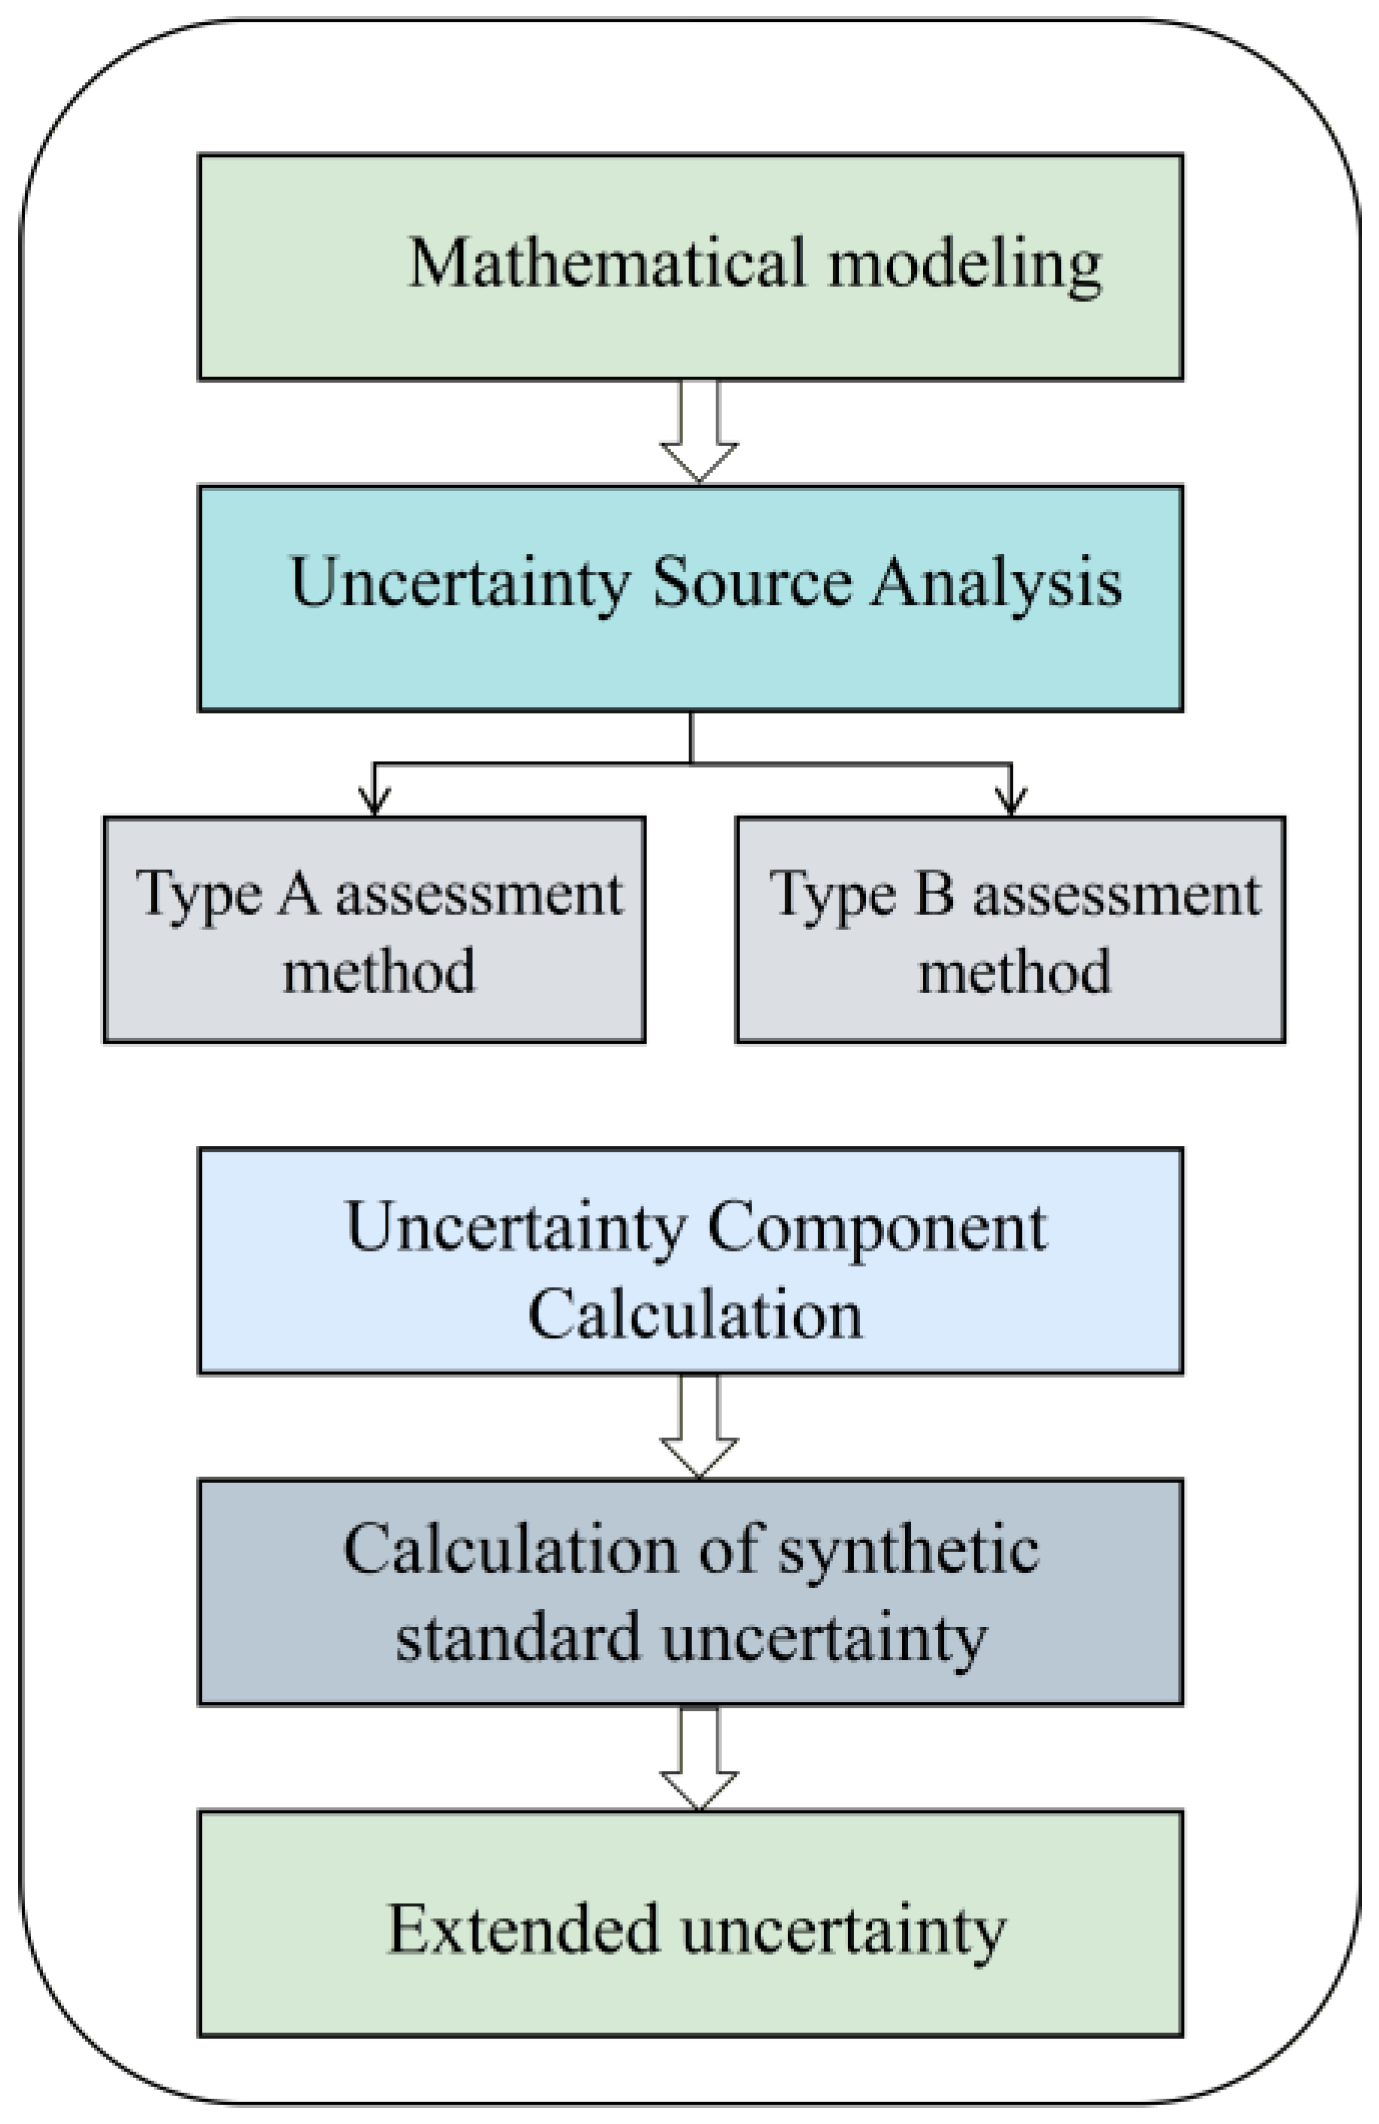
5.9. Calculation of Combined Standard Uncertainty and Expanded Uncertainty
Based on the analysis, since the above uncertainty components are independent of each other, the measurement uncertainty in the process of gauge measurement by the track inspection system is given by:
Since the uncertainty components are independent of each other, the measurement uncertainty in the process of gauge measurement by the track inspection system is calculated using Equation (25), yielding a combined standard uncertainty of uc = 0.33 mm.
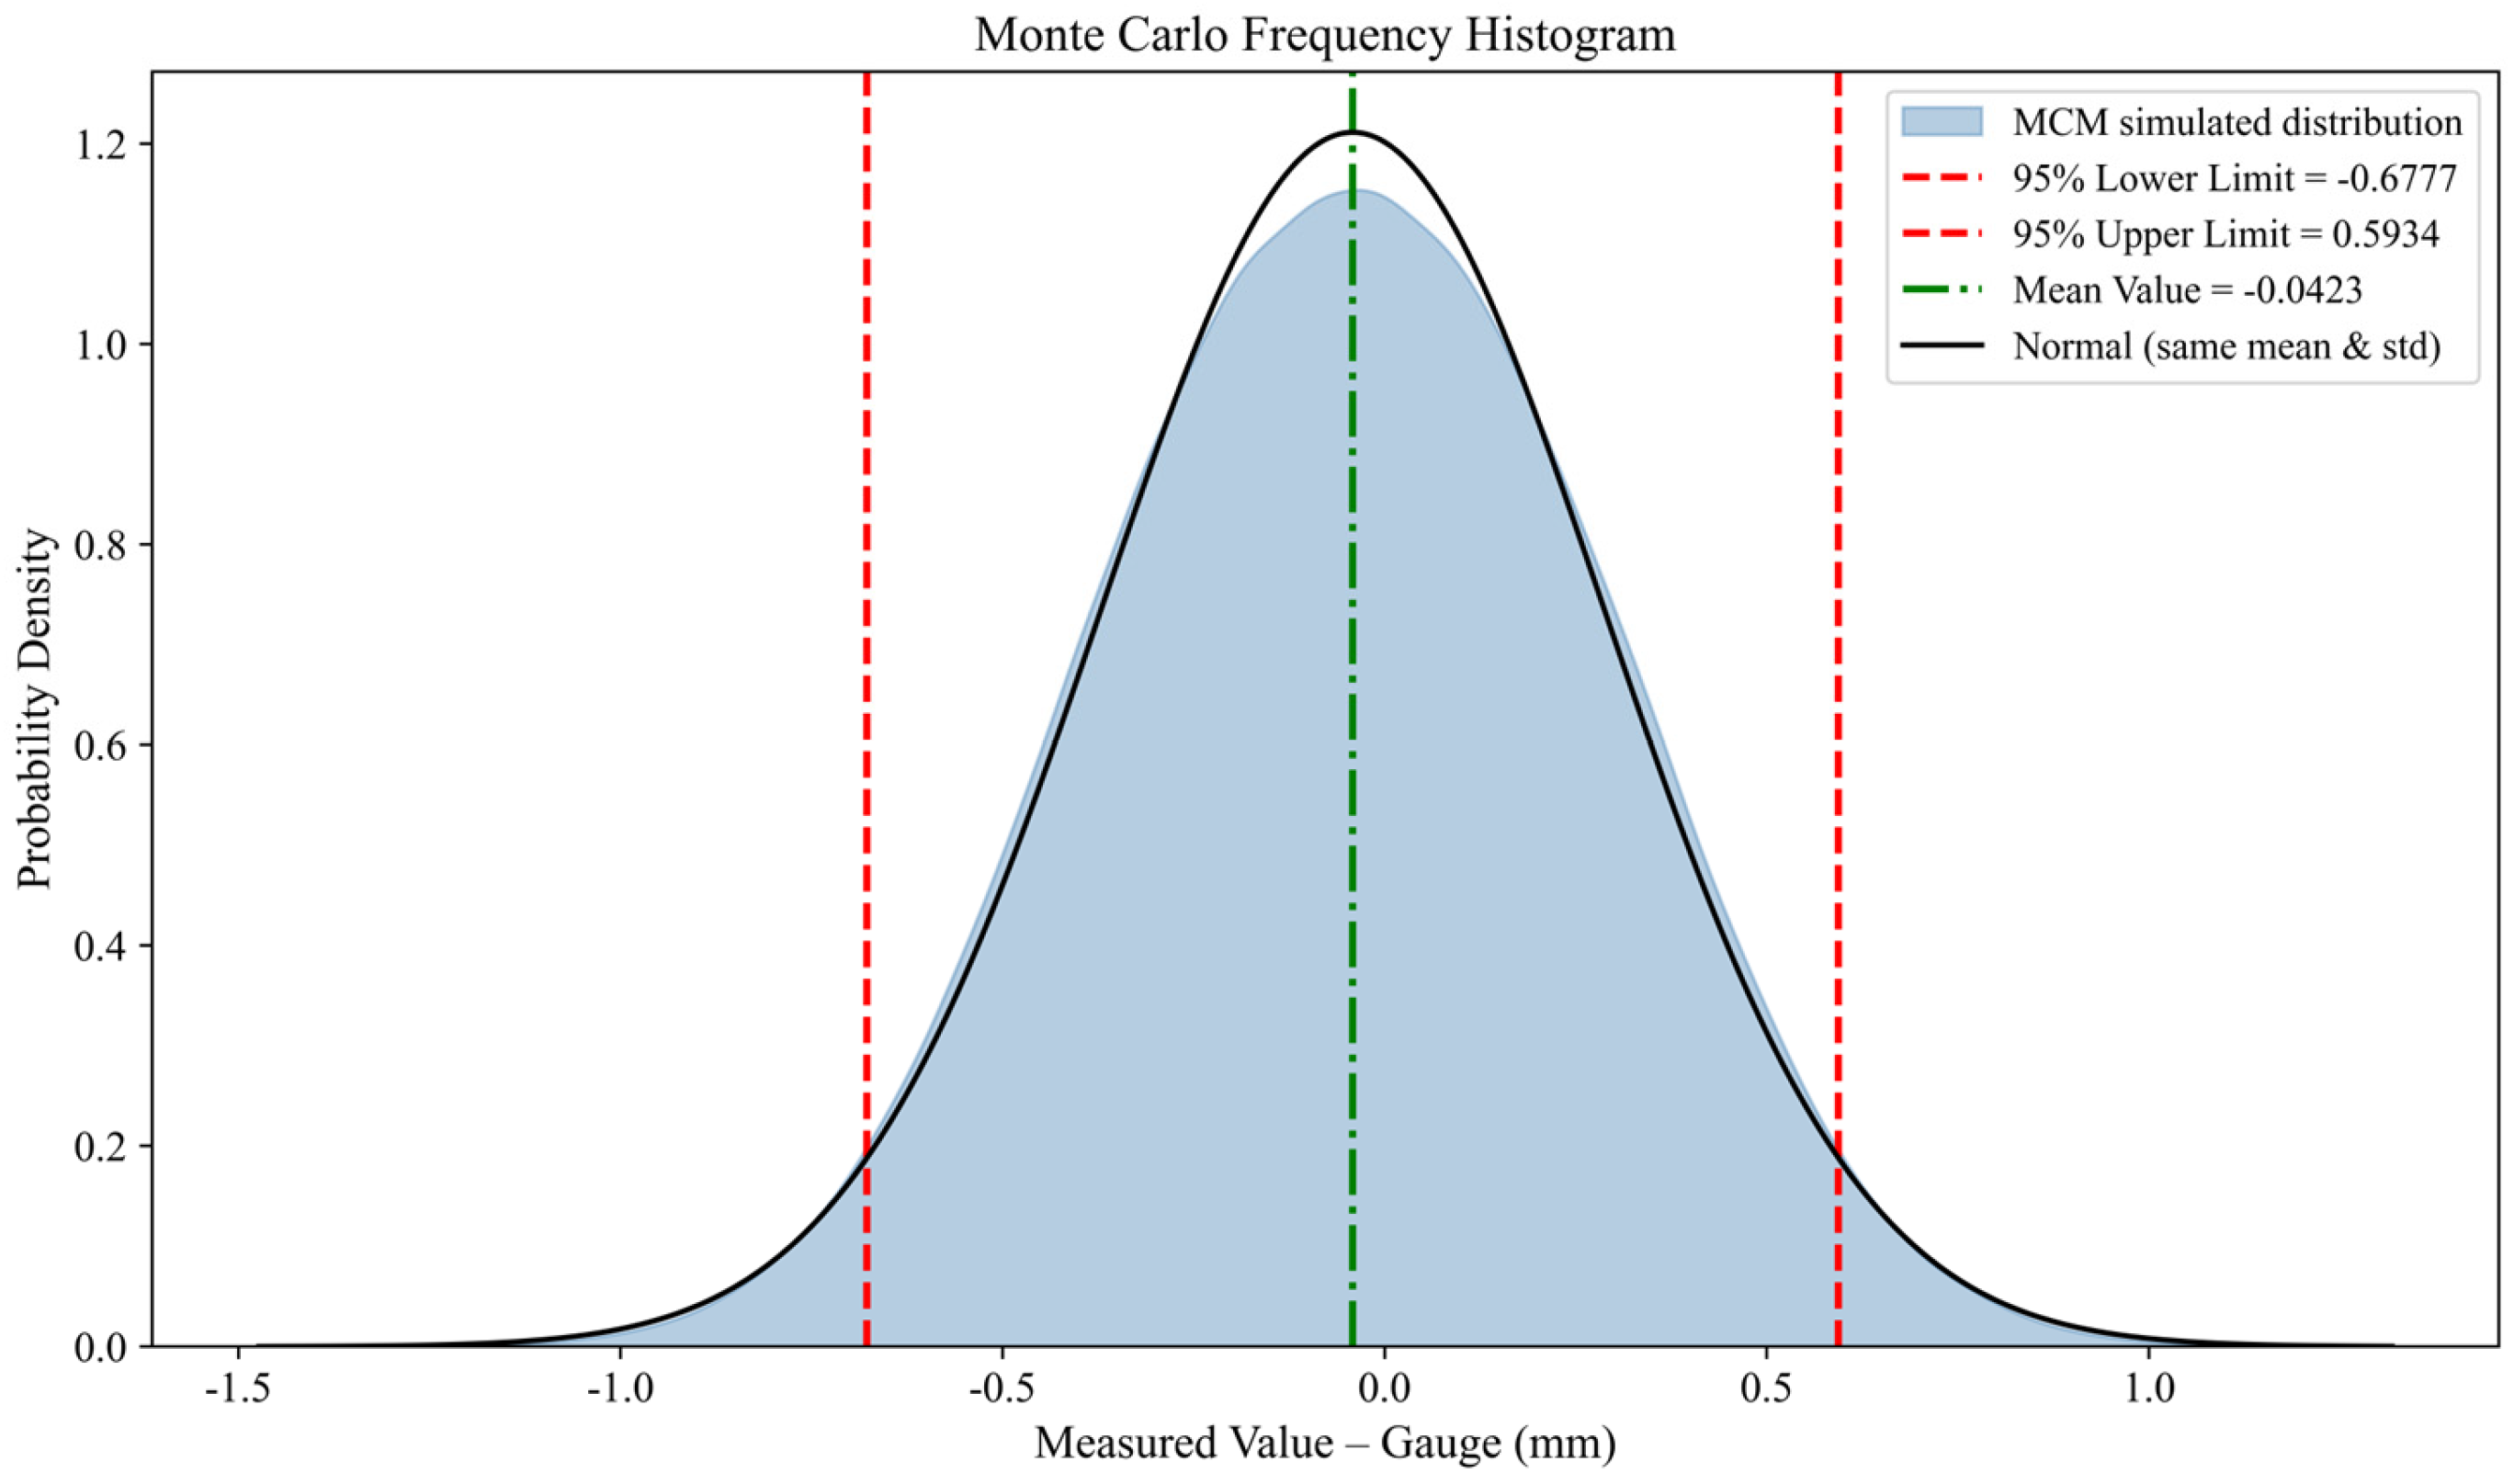
To verify the normality assumption and reasonably determine the coverage factor, we supplemented the analysis with the Monte Carlo method (MCM). The distribution was tested using the Monte Carlo method. The results of the MCM are shown in
Figure 8. According to the MCM calculation procedure, the combined standard uncertainty
uc1 and the expanded uncertainty
U95 were obtained as
uc1 = 0.3291 mm and
U95 = 0.6348 mm. Then the coverage factor k can be calculated as:
Taking a coverage factor of k = 1.93, the expanded uncertainty is U = 0.64 mm.
Table 10 presents the summary of uncertainty components and their contribution analysis. It can be seen from the table that the uncertainties introduced by the measurement inaccuracy of the track inspection system and by different spatial attitudes account for relatively high proportions. Subsequently, the evaluation scheme can be improved based on these main sources of uncertainty.
6. Conclusions
This paper presents an analysis and evaluation method for uncertainty sources in the measurement process of a track inspection system based on a calibration test bench. For the first time, the dynamic coupling between the train and the track is incorporated into the evaluation method, ensuring the accuracy and repeatability of track geometry parameter inspection data. The robust statistical method is integrated into the repeatability evaluation of the track inspection system, effectively suppressing the interference of outliers and yielding measurement results that better reflect the true repeatability under actual measurement conditions.
Taking gauge measurement as an example, an uncertainty evaluation experiment was conducted for the measurement process of the track inspection system. The experimental results show that the expanded uncertainty is U = 0.64 mm, satisfying the requirement that the uncertainty be less than one-third of the maximum permissible error for gauge inspection of track inspection vehicles, thereby validating the feasibility of the proposed method. Furthermore, the analysis and evaluation results of the uncertainty sources presented in this paper can serve as Type B uncertainty inputs for subsequent field evaluations, providing a reliable metrological basis for the uncertainty evaluation of track inspection systems and enabling a faster and more accurate assessment.
The uncertainty evaluation method and the quantified Type B input sources proposed in this paper have clear engineering application value. In routine inspections of high-speed railways, this method can be embedded into the data processing system of comprehensive inspection trains to enable dynamic accuracy assessment. In multi-source data fusion, it can serve as a basis for weight allocation. Furthermore, the obtained expanded uncertainty of 0.66 mm provides a quantified boundary for controlling the confidence interval in gauge exceedance judgments, thereby supporting precise decision-making in track maintenance and repair. Future work may focus on further improving the dynamic response accuracy of the test bench to reduce the gap between the simulated and actual track environments.




 ,
,