


Abstract
To address the coupled challenges of tire dynamic load regulation and ride comfort improvement in hydrogen-powered heavy-duty trucks (HPHDTs) under non-stationary road excitations, this study evaluates a magnetorheological (MR) damper-based semi-active front suspension system. A vehicle–road coupled dynamic simulation model was developed in MATLAB/Simulink (R2025b) using a Class C road profile, and three representative driving conditions, namely acceleration, deceleration, and constant-speed driving, were considered. Four control strategies, namely, interval type-2 (IT2) fuzzy control, type-1 (T1) fuzzy control, skyhook control, and PID control, were comparatively investigated. The results indicate that deceleration is the most critical operating condition, resulting in more severe tire–road interactions and poorer ride comfort than the other scenarios. Among the evaluated strategies, IT2 fuzzy control provides the best overall performance. Compared with the passive suspension, it reduces the front-wheel RMS dynamic load by 63.39% and improves ride comfort by 64.67% under deceleration. The T1 fuzzy and PID controllers provide moderate improvements, whereas skyhook control exhibits relatively limited effectiveness. These findings demonstrate that combining MR dampers with IT2 fuzzy control provides a feasible and robust approach for improving road friendliness, ride quality, and operational stability in advanced heavy-duty vehicle suspension design.
1. Introduction
With the rapid advancement of sustainable transportation technologies, hydrogen-powered heavy-duty trucks (HPHDTs) have emerged as a promising solution for decarbonizing long-haul freight [1]. Compared with conventional diesel vehicles, hydrogen trucks offer substantial environmental benefits; however, their dynamic performance, particularly under complex and non-stationary driving conditions, remains a critical concern [2,3,4]. Unlike conventional diesel heavy-duty trucks, HPHDTs require the integration of hydrogen storage tanks, fuel cell stacks, battery packs, electric drive units, and auxiliary systems within limited chassis space, which may alter mass distribution, axle loads, pitch inertia, and the center-of-gravity position, thereby introducing specific challenges for suspension design, tire dynamic load regulation, and ride comfort control. In practical operations, heavy-duty trucks frequently undergo transient maneuvers such as rapid acceleration, braking-induced deceleration, and speed fluctuations [5,6,7,8,9]. These maneuvers introduce non-stationary road excitations that significantly affect tire–road interactions and ride comfort. Excessive dynamic tire loads not only deteriorate vehicle handling stability but also accelerate road surface degradation, while poor ride comfort can adversely impact driver health and long-term operational safety [10,11,12].
Suspension systems play a vital role in mitigating these issues by isolating road-induced vibrations and maintaining stable tire–road contact [13]. Traditional passive suspension systems, although simple and reliable, lack adaptability to varying road and driving conditions, making them insufficient for modern heavy-duty vehicles operating under diverse environments [14,15,16]. In contrast, semi-active suspension systems, particularly those based on magnetorheological (MR) dampers, have attracted considerable attention due to their fast response, low energy consumption, and ability to provide continuously variable damping characteristics [17,18,19]. By adjusting the damping force in real time, MR damper-based systems can effectively suppress vibration and improve both ride comfort and road holding performance [20,21].
In terms of control strategies, various approaches have been proposed to enhance the performance of semi-active suspension systems, including classical PID control, skyhook control, and intelligent control methods such as type-1 (T1) fuzzy control [22,23,24]. Samaroo et al. [25] conducted a simulation study on a semi-active suspension system for an in-wheel-motor-driven electric vehicle by integrating a dynamic vibration-absorbing structure with a PID-controlled MR damper, demonstrating the effectiveness of PID control in improving suspension performance. Lee and Oh [26] developed a hybrid damping mode MR damper for semi-active suspension systems and showed that the incorporation of skyhook-based control strategies, together with roll, dive, and squat control, can significantly reduce vehicle body vibrations and enhance ride comfort and handling stability under varying driving conditions. Qin et al. [27] developed a MR semi-active seat suspension system and reported that T1 fuzzy control, particularly with a variable universe scheme, exhibits strong adaptability and superior vibration attenuation performance compared with traditional fuzzy and skyhook control strategies, thereby effectively improving ride comfort. However, these control methods still face challenges in addressing system nonlinearities, uncertainties, and time-varying characteristics under non-stationary excitations. Interval type-2 (IT2) fuzzy control, as an advanced extension of T1 fuzzy logic, introduces an additional degree of freedom to better handle uncertainties, thereby offering enhanced robustness and improved control performance in complex dynamic systems [28].
Although previous studies have extensively investigated suspension control strategies and ride comfort improvement, most of them focus on steady-state conditions or simplified excitation inputs, with limited attention given to non-stationary driving scenarios. Moreover, there is a lack of comprehensive comparative analysis addressing both tire dynamic load and ride comfort for HPHDTs equipped with MR-based semi-active suspension systems. Therefore, a systematic investigation considering realistic driving conditions and multiple control strategies is necessary to provide deeper insights into suspension performance optimization.
In this context, this study develops a vehicle–road coupled dynamic model of an HPHDT in MATLAB/Simulink (R2025b), based on a six-degree-of-freedom (6-DOF) half-vehicle model integrated with a human–seat subsystem, and evaluates the performance of a semi-active front suspension system with MR dampers under non-stationary road excitations. Four control strategies, namely IT2 fuzzy control, T1 fuzzy control, skyhook control, and PID control, are implemented and comparatively analyzed under acceleration, deceleration, and constant-speed conditions. The dynamic tire loads and human–seat vertical acceleration are selected as the primary evaluation indices because they directly reflect tire–road interaction and ride comfort, respectively. In addition, suspension deflection is considered in the control design and constraint setting to ensure that the suspension operates within its allowable working range. The objective is to identify an effective control strategy that can simultaneously reduce tire dynamic loads and improve ride comfort, thereby enhancing vehicle stability and reducing road damage under complex driving conditions.
2. Semi-Active Suspension System
To investigate the dynamic characteristics of an HPHDT under non-stationary road excitations, this section establishes a comprehensive modeling framework for the semi-active suspension system. First, a 6-DOF half-vehicle model incorporating a human–seat subsystem is developed to describe the coupled vertical and pitch dynamics of the vehicle, as well as the interactions between the sprung and unsprung masses. Subsequently, an MR damper model is introduced, and its key parameters are identified to accurately characterize the controllable damping behavior. Finally, a time-domain non-stationary random road excitation model is constructed to represent realistic driving conditions with time-varying statistical properties.
2.1. System Model
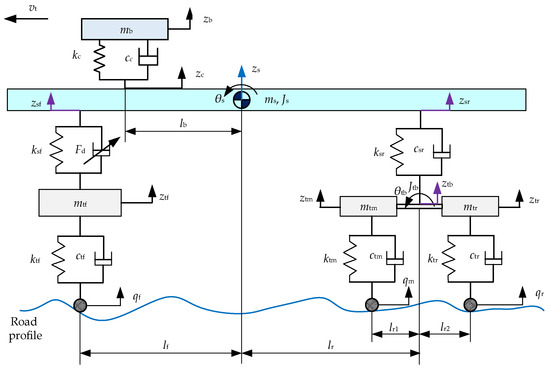
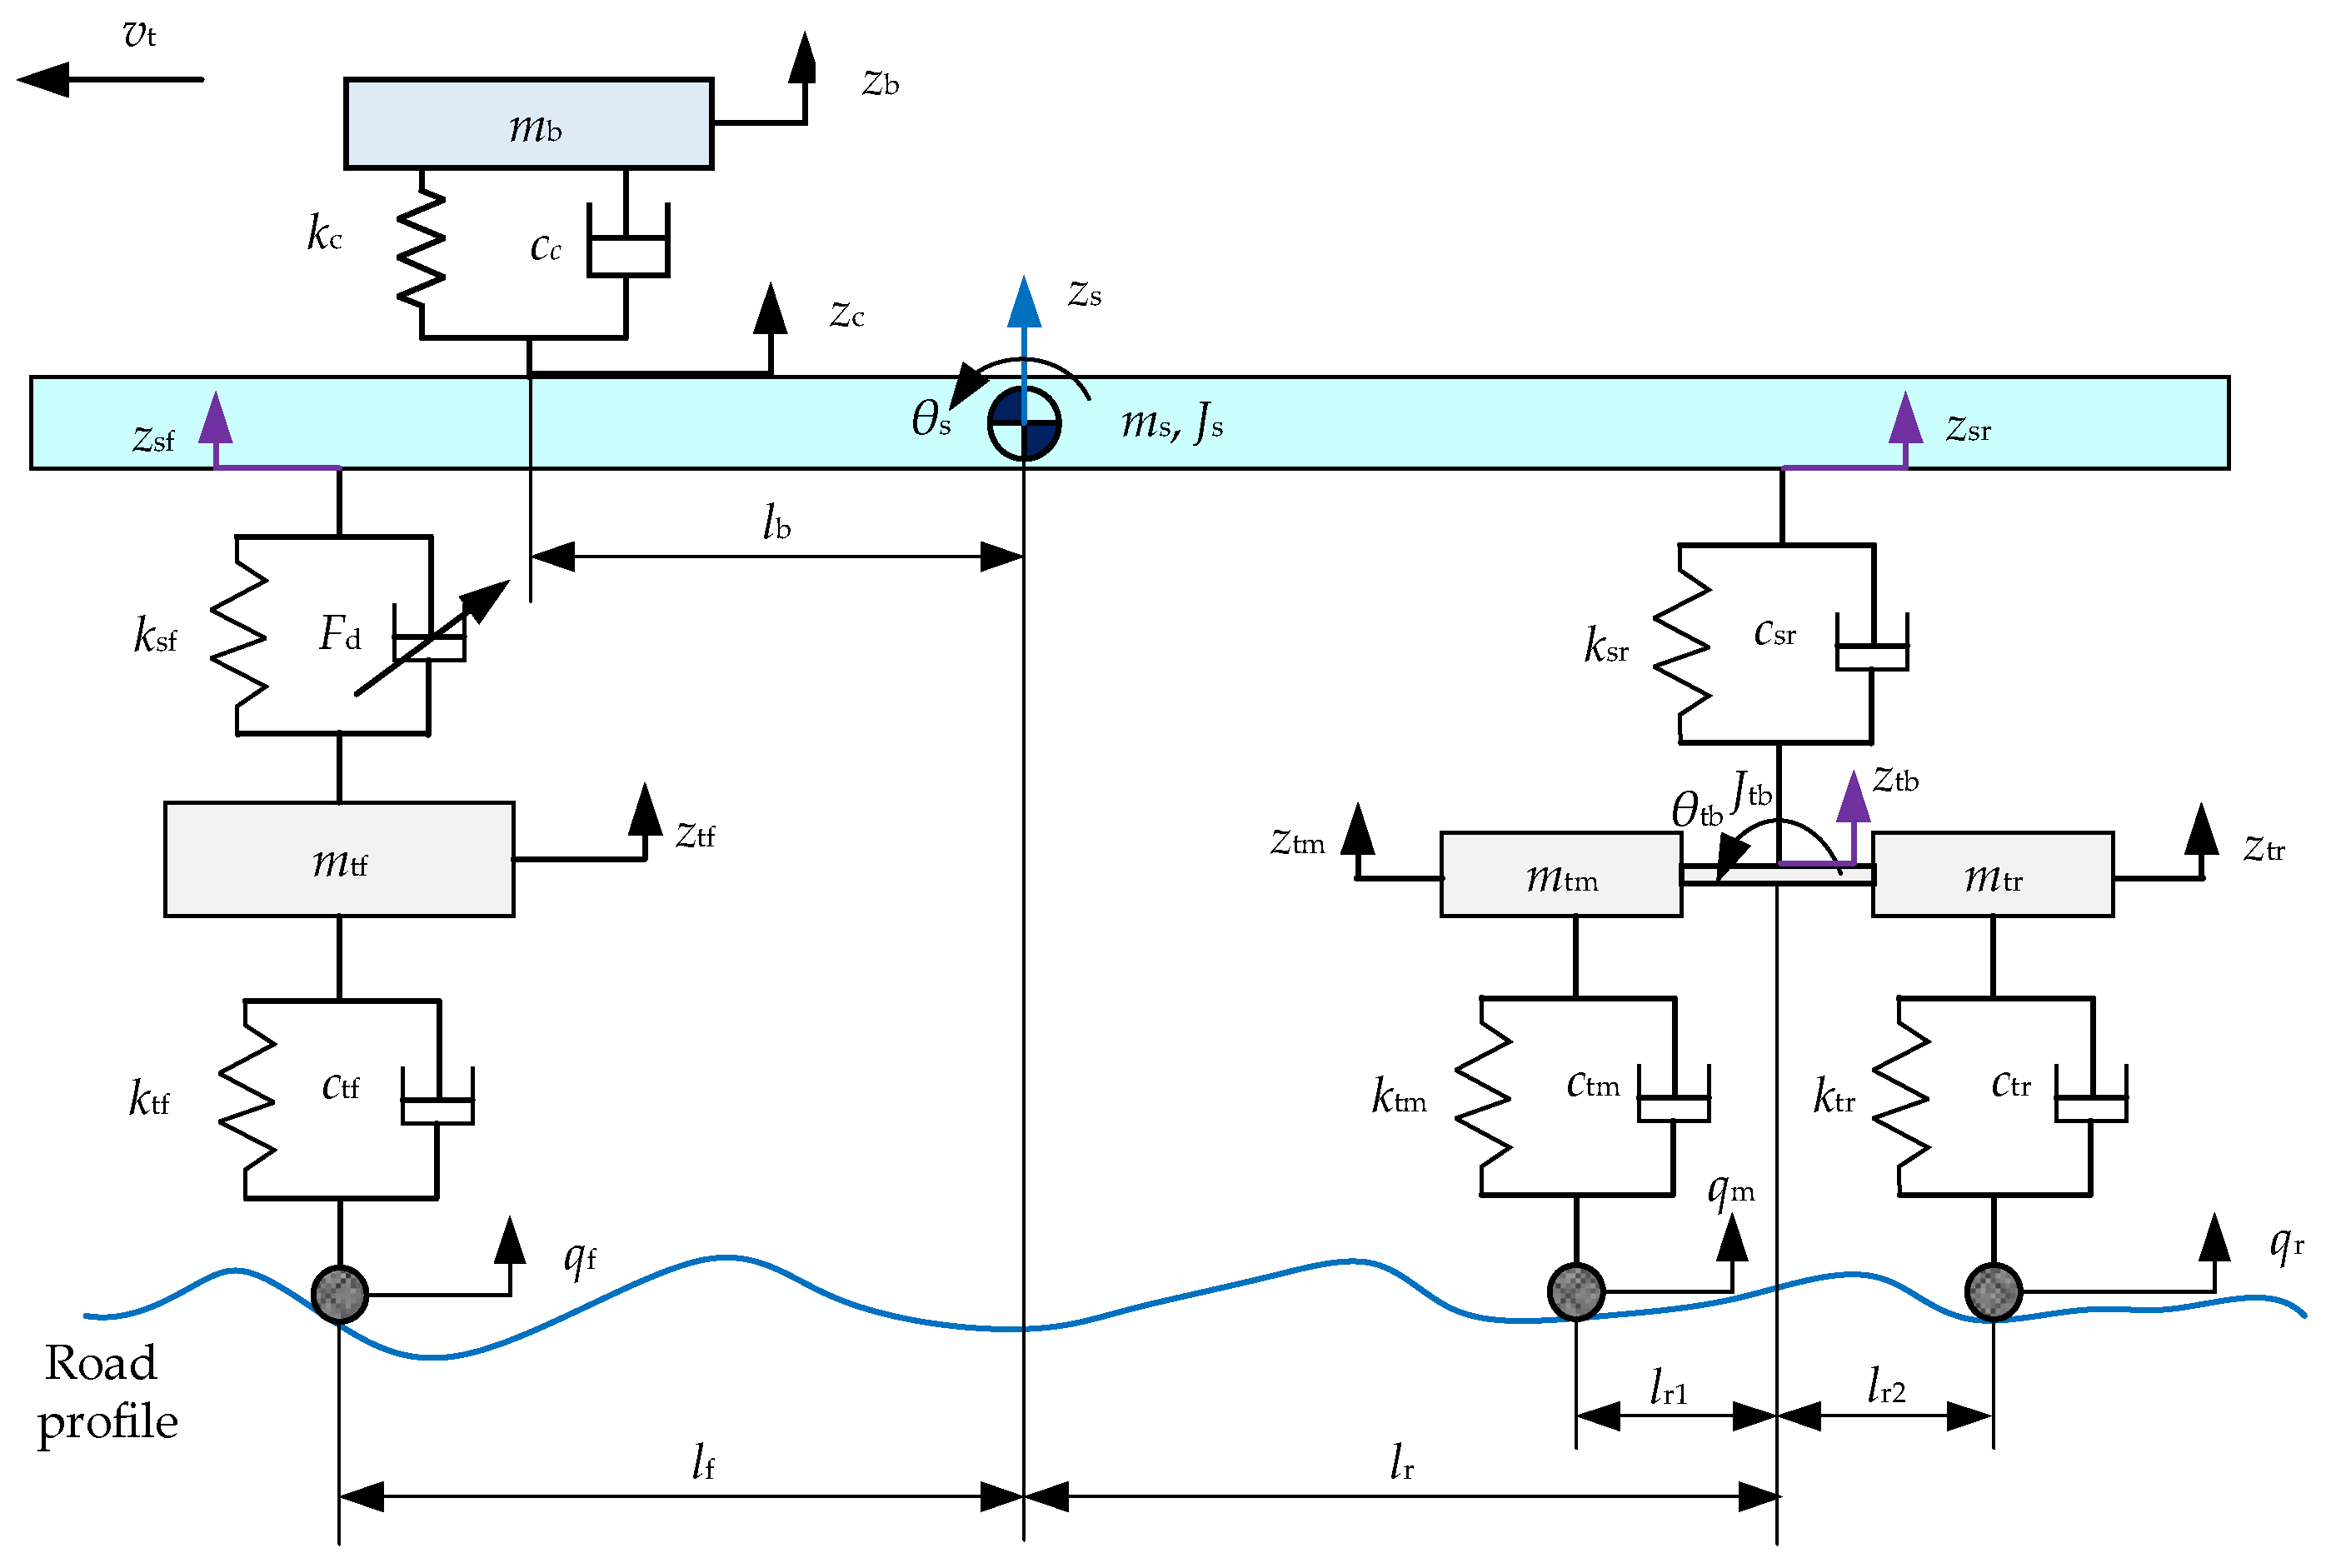
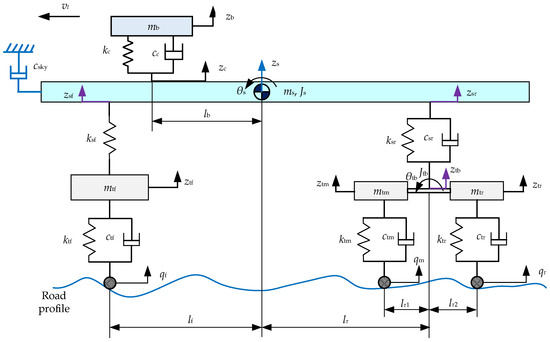
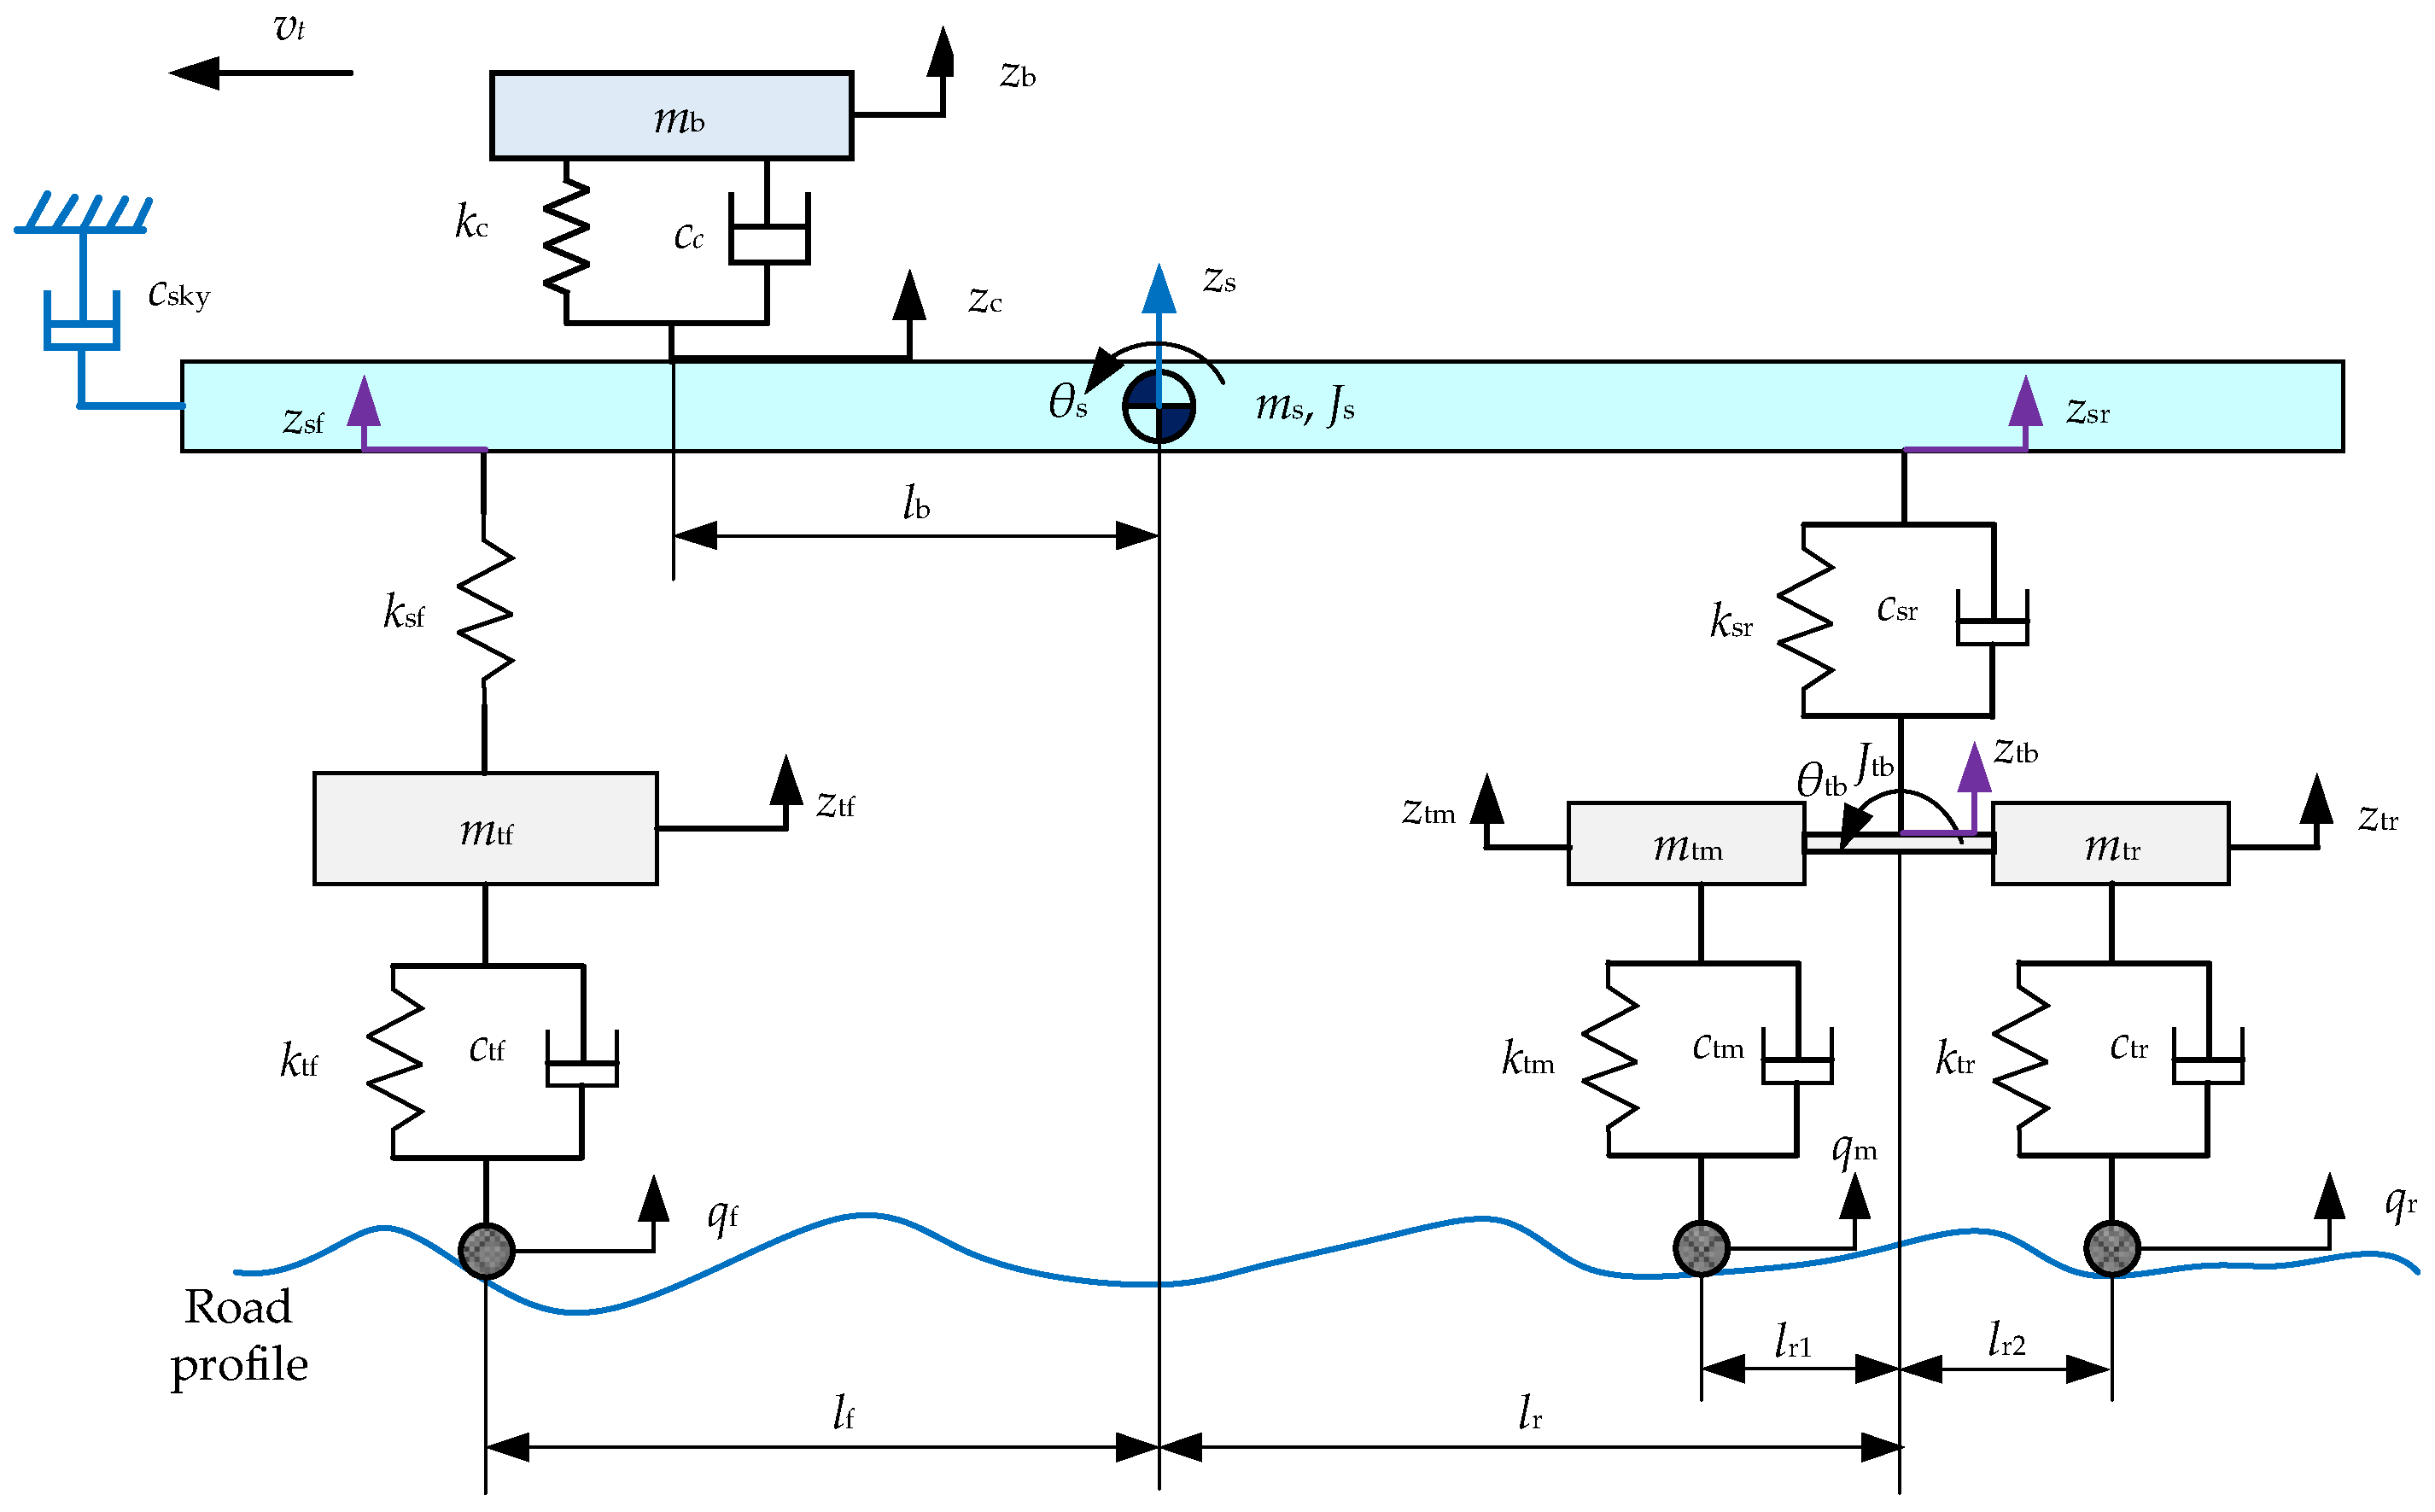
To investigate the vibration characteristics of the HPHDT under non-stationary road excitations, a 6-DOF half-vehicle dynamic model integrated with a human–seat subsystem is developed, as illustrated in Figure 1. The model describes the vertical and pitch motions of the vehicle body, as well as the dynamic interactions among the front axle, tandem rear axles, and seat suspension system. The 6-DOF vehicle model is established based on linear vertical vibration assumptions, in which the suspension springs, tires, and pitch coupling are represented by equivalent linear elements under small-displacement motion. However, the overall semi-active suspension system exhibits nonlinear characteristics due to the current-dependent hysteretic behavior of the MR damper and the nonlinear control laws used in the fuzzy controllers. Therefore, the proposed model can be regarded as a linear vehicle dynamic framework coupled with a nonlinear controllable damping subsystem.
Figure 1.
Dynamic model of HPHDT system.
In the model, the suspension-related effects of the hydrogen-powered configuration are represented by the sprung mass, pitch moment of inertia, center-of-gravity location, and static axle load distribution, thereby accounting for the influence of hydrogen storage tanks, fuel-cell-related components, and auxiliary systems on vertical vibration, pitch motion, and tire dynamic load transfer. For the investigated heavy-duty truck, no independent cab suspension system is installed. The cab is only equipped with a tilting mechanism for maintenance access, which is mechanically locked during vehicle operation and does not provide vertical elastic or damping isolation. Therefore, the cab is treated as part of the sprung mass, and no additional cab suspension degree of freedom is introduced. This assumption is consistent with the actual vehicle configuration and allows the analysis to focus on the coupled vertical vibration of the vehicle body, front semi-active suspension, tandem rear suspension, and human–seat subsystem.
The vehicle is modeled as a tri-axle configuration comprising a front axle and a tandem rear axle assembly. The front suspension is equipped with an MR damper operating in semi-active mode, while the middle and rear axles are connected via an equalizing suspension mechanism and represented as passive suspension units. This tandem suspension configuration enables effective load redistribution between the two rear axles, which is particularly important for heavy-duty trucks operating under varying load conditions. Since fuel cell heavy-duty trucks generally involve hydrogen storage tanks, batteries, fuel cells, and electric drive units, their distributed component layout may affect packaging and vehicle mass distribution; therefore, the present model incorporates these configuration effects at the system-dynamics level rather than explicitly modeling the electrochemical and thermal subsystems.
Using Newton’s second law, the mathematical equation can be described as follows:
Since this study focuses on the vehicle-system-level comparison of suspension control strategies, the tires are modeled as equivalent vertical spring-damper elements, and the dynamic tire loads are calculated from the relative displacement and velocity between the unsprung masses and the road inputs. The mathematical expressions for the dynamic loads exerted by the front tire on the road Ff, the middle tire Fm, and the rear tire Fr, are given as follows:
The parameters of the 6-DOF vehicle system are listed in Table 1.
Table 1.
Parameters of the 6-DOF vehicle system [29].
2.2. MR Damper Parameter Identification
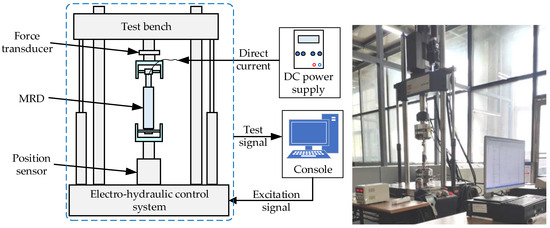
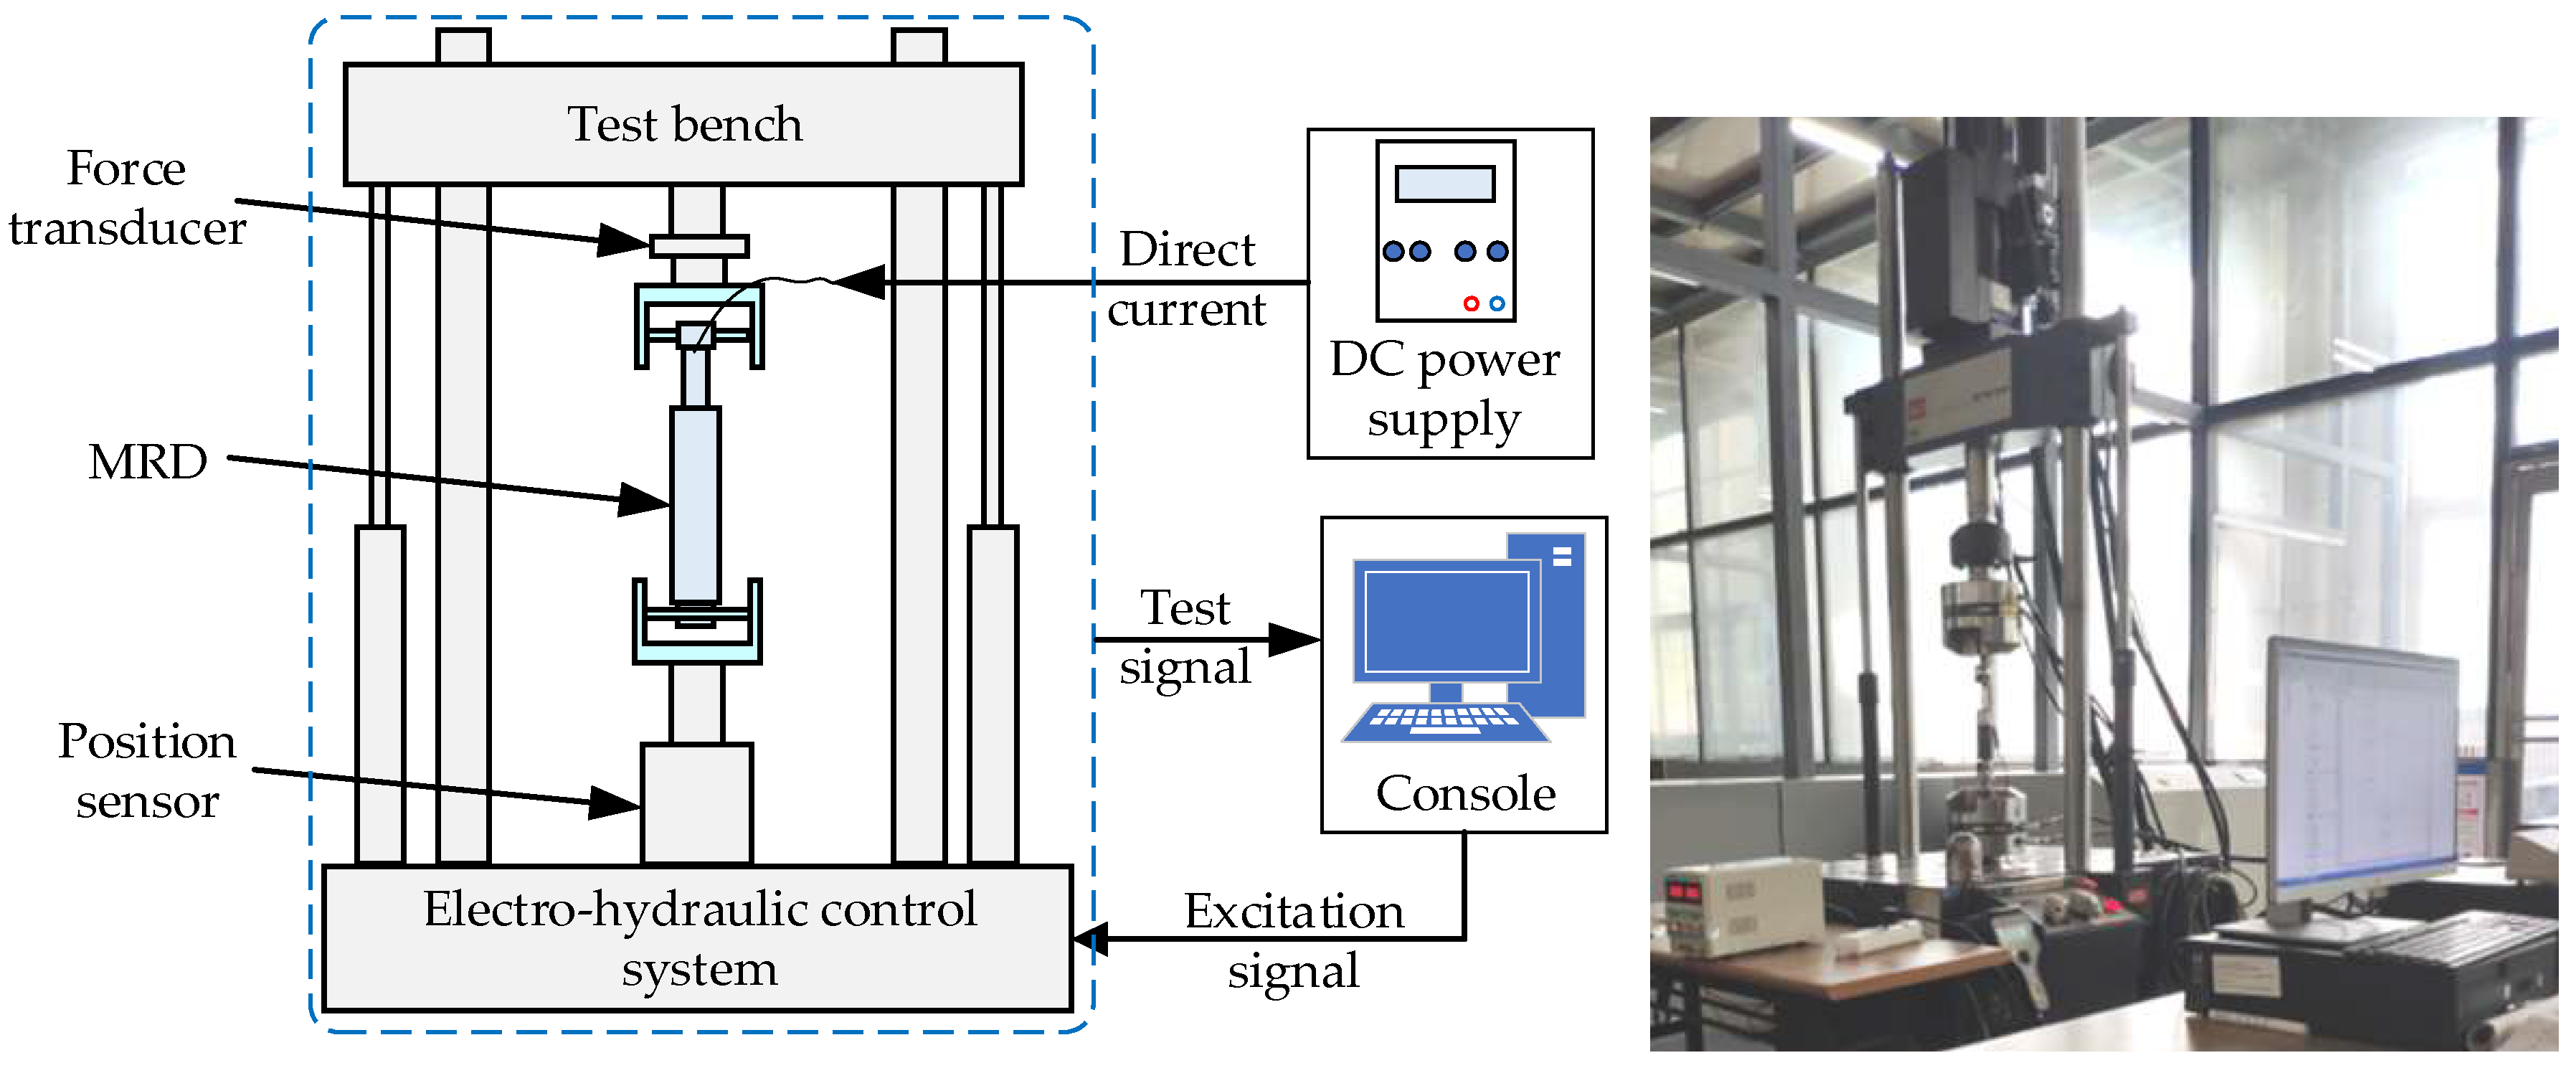
The mechanical performance of the MR damper was evaluated using an MTS322 material testing system (MTS Systems Corporation, Eden Prairie, MN, USA), which primarily consists of a BOHAI C120-100B MR damper (Beijing Bohai Vehicle Engineering Co., Ltd., Beijing, China), a single-channel hydraulic servo excitation unit, a force transducer, a built-in displacement sensor, and a regulated current source. The displacement sensor has a resolution of 0.01 mm. The experimental setup is illustrated in Figure 2. During testing, a sinusoidal excitation signal was applied as the input, with amplitudes ranging from 5 mm to 45 mm in increments of 10 mm, and excitation frequencies varying from 0.8 Hz to 4 Hz in increments of 0.8 Hz. The input current supplied to the MR damper was adjusted from 0 A to 3 A in increments of 0.75 A.
Figure 2.
Mechanical performance test system.
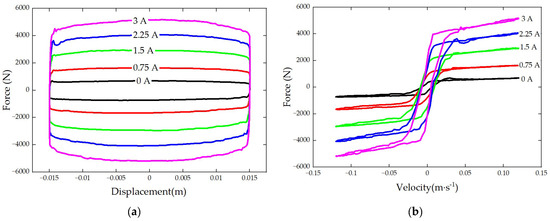
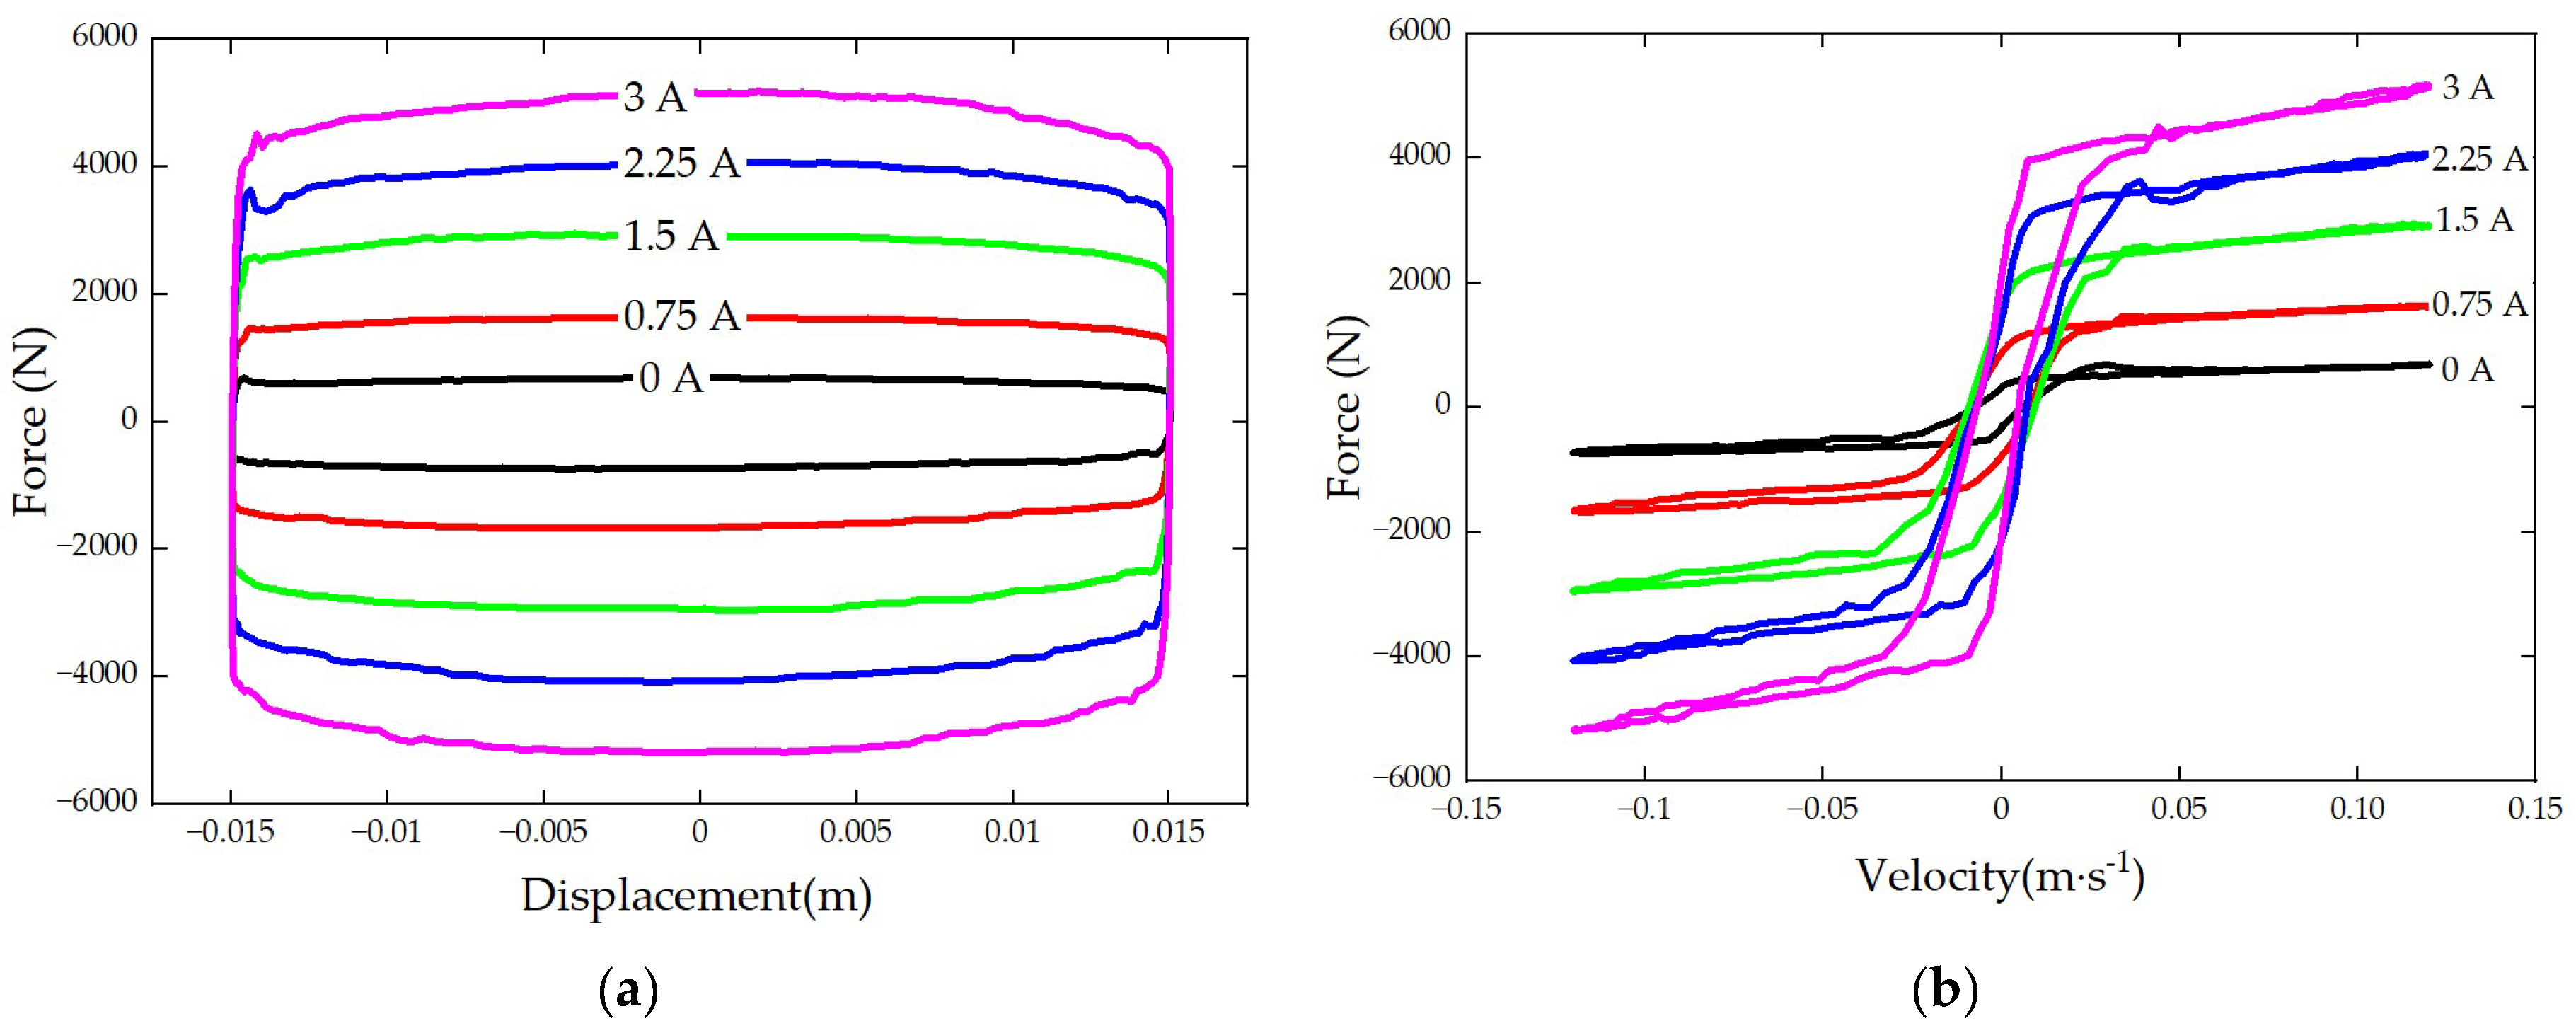
To reduce the number of experimental runs while maintaining representative coverage of the parameter space, a uniform design method based on the U5(53) table was adopted. This method organizes three factors, namely amplitude, frequency, and current, each at five levels, into five evenly distributed experimental combinations, enabling efficient identification of the primary response characteristics of the MR damper. The displacement x, velocity v, and damping force F under different current inputs were obtained through data processing. The force–displacement (F-x) and force–velocity (F-v) characteristic curves for a representative case with an amplitude of 15 mm and a frequency of 1.6 Hz are presented in Figure 3.
Figure 3.
Mechanical characteristics of the MR damper under different currents: (a) damping force–displacement; (b) damping force–velocity.
As shown in Figure 3a, under identical excitation conditions, the output damping force increases with the input current. During piston motion, the damping force exhibits relatively weak dependence on displacement, and the overall curve presents an elliptical shape, indicating typical hysteresis behavior. As illustrated in Figure 3b, at a given piston velocity, the damping force also increases with current. Moreover, the curve exhibits distinct segmentation between low-velocity and high-velocity regions, revealing nonlinear and hysteretic characteristics of the MR damper, with a more pronounced hysteresis loop observed in the low-velocity region.
To accurately describe the hysteresis loop of the output force–velocity curve, a hyperbolic tangent term of the piston acceleration with an asymptotic saturation characteristic is added to improve the fitting accuracy of the width of the hysteresis loop in the output force–velocity curves of MR damper. An asymptotic saturation magic formula model is presented as follows [30,31]:
where B, C, D, E, F, and M represent the stiffness, shape, peak, curvature, hysteresis width, and inertia factors of the asymptotic saturation magic formula, respectively; c, k and, f represent the damping factor, stiffness factor, and bias force, respectively; s, v, and a represent the piston displacement, velocity, and acceleration of the asymptotic saturation magic formula, respectively; D0, D1 and D2 represent the constant, primary, and secondary term coefficients, respectively; I represents the exciting current.
By substituting Equation (16) in Equation (15), the equation can be rewritten as follows:
where FMR_i and FMR_0 represent the damper force controlled by the control current and the other damping forces, excluding the controlled damping force and base damping force, respectively.
Based on the experimental data, the least squares method is applied to fit the corresponding coefficients of Equations (15)–(19). The fitting parameters are listed in Table 2.
Table 2.
Identified parameter results of the MR damper model.
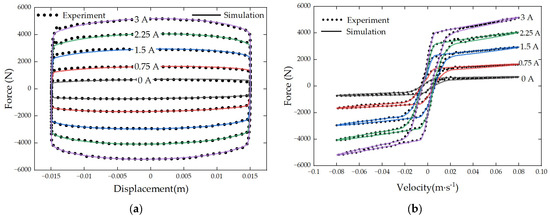
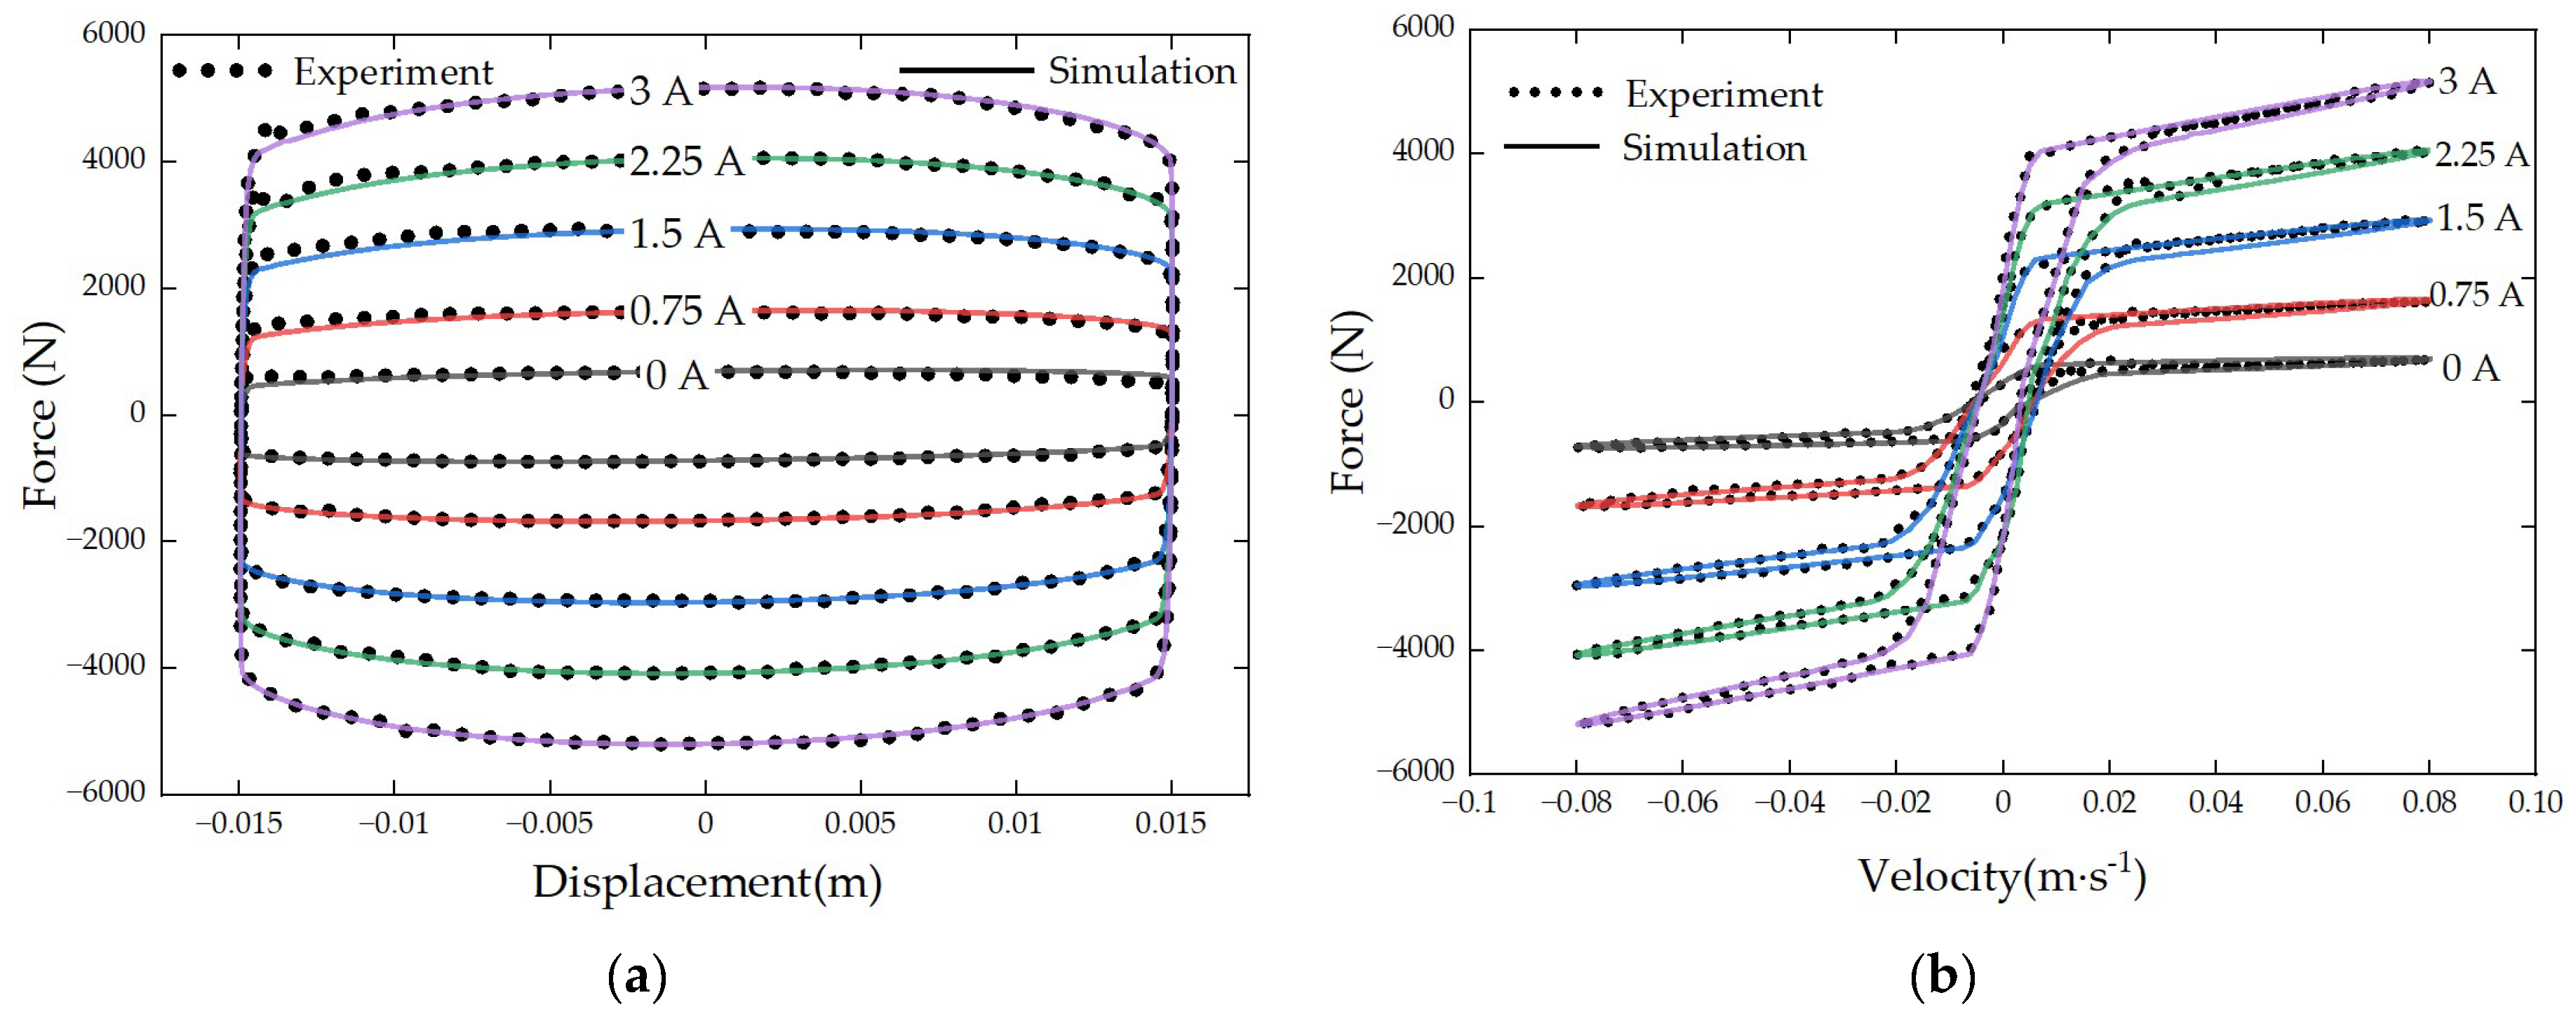
The comparisons between the modelled and experimental curves under 1.6 Hz is presented in Figure 4.
Figure 4.
Comparisons of modelled and experimental results: (a) damping force–displacement; (b) damping force–velocity.
Figure 4 indicates that an offset force exists in the measured output force, which mainly originates from the gravity of the excitation head, the gravity of the fixture, and the preload required to compress the piston rod to the middle position. This offset force reduces the apparent range of the measured output force, and its value is approximately 0.7015 kN. The excitation frequency of 1.6 Hz is selected as a representative case to illustrate the comparison between the experimental and modeled results. At this frequency, the error percentages between the experimental results and the optimized model outputs are 5.18%, 5.06%, 5.15%, 4.58%, 5.48%, and 5.85%, respectively, when the control current increases from 0 A to 3 A in increments of 0.75 A. In addition, comparisons were also performed for the other tested excitation frequencies ranging from 0.8 Hz to 4.0 Hz. The identified model shows consistent agreement with the experimental results in terms of damping force amplitude, current-dependent variation, and hysteresis trends, indicating that the optimized MR damper model is suitable for subsequent semi-active suspension simulations.
The control current can be expressed as follows:
where y is defined as:
2.3. Non-Stationary Road Excitation Model
Time-domain simulation of road excitation is commonly realized using several approaches, including the harmonic superposition method, the filtered white noise method, autoregressive models, and Poisson-based methods [32,33,34,35]. However, most existing studies assume that the vehicle travels at a constant velocity. Under non-uniform driving conditions, although the road profile remains statistically stationary in the spatial domain, the corresponding excitation in the time domain becomes non-stationary due to the variation in vehicle speed.
To more accurately reproduce the stochastic characteristics of real road surfaces, the filtered white noise method is adopted in this study. This approach enables the generation of road excitation signals consistent with the target road roughness spectrum. The road surface excitation model of the front wheel of the vehicle is established as follows [36]:
where n0 is the reference spatial frequency and the value is 0.1 m−1; nc is the lower limit spatial cut-off frequency of the filter and the value is 0.01 m−1; vt is the vehicle velocity at time t; Gq(n0) is the roughness coefficient of the road surface; W(t) is the time-domain Gaussian white noise signal.
Let the time delays between the front wheel and the middle and rear wheels be denoted as t1 and t2, respectively. The time-domain correlation between the front wheel and the middle/rear wheels can therefore be expressed as follows:
When the vehicle travels at a non-uniform speed, the time delays t1 and t2 are no longer constants. Consequently, Equation (20) cannot be directly solved using the Fourier transform. Based on the first- and second-order differential relationships in the time–space domain transformation, a Taylor series expansion and subsequent derivation are performed [29]. The resulting time-domain differential equations describing the non-stationary road excitations acting on the middle and rear wheels can therefore be expressed as follows:
where L1 and L2 are the wheelbases between the middle and rear wheels and the front wheels, respectively. L1 = lf + lr−lr1 and L2 = lf + lr + lr2.
3. Control Strategies
To evaluate the effectiveness of different semi-active control approaches under non-stationary road excitations, four representative strategies with progressively enhanced capability in handling system complexity and uncertainty are investigated. First, a conventional PID controller is employed as a baseline linear control method to regulate vehicle body acceleration. Second, the classical skyhook control strategy is adopted to emulate virtual inertial damping and suppress vibrations within the constraints of semi-active suspension systems. Subsequently, a T1 fuzzy logic controller is developed to address system nonlinearities without requiring an accurate mathematical model. Finally, an IT2 fuzzy logic controller is introduced to explicitly account for uncertainties caused by stochastic road excitations and parameter variations. By adopting a unified modeling framework and consistent evaluation criteria, a systematic comparative analysis is conducted to examine the performance differences among these control strategies in terms of tire dynamic load reduction and ride comfort improvement, with particular emphasis on the robustness advantages of the IT2 fuzzy control approach.
3.1. PID Control
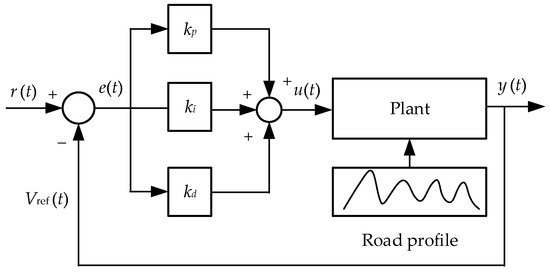
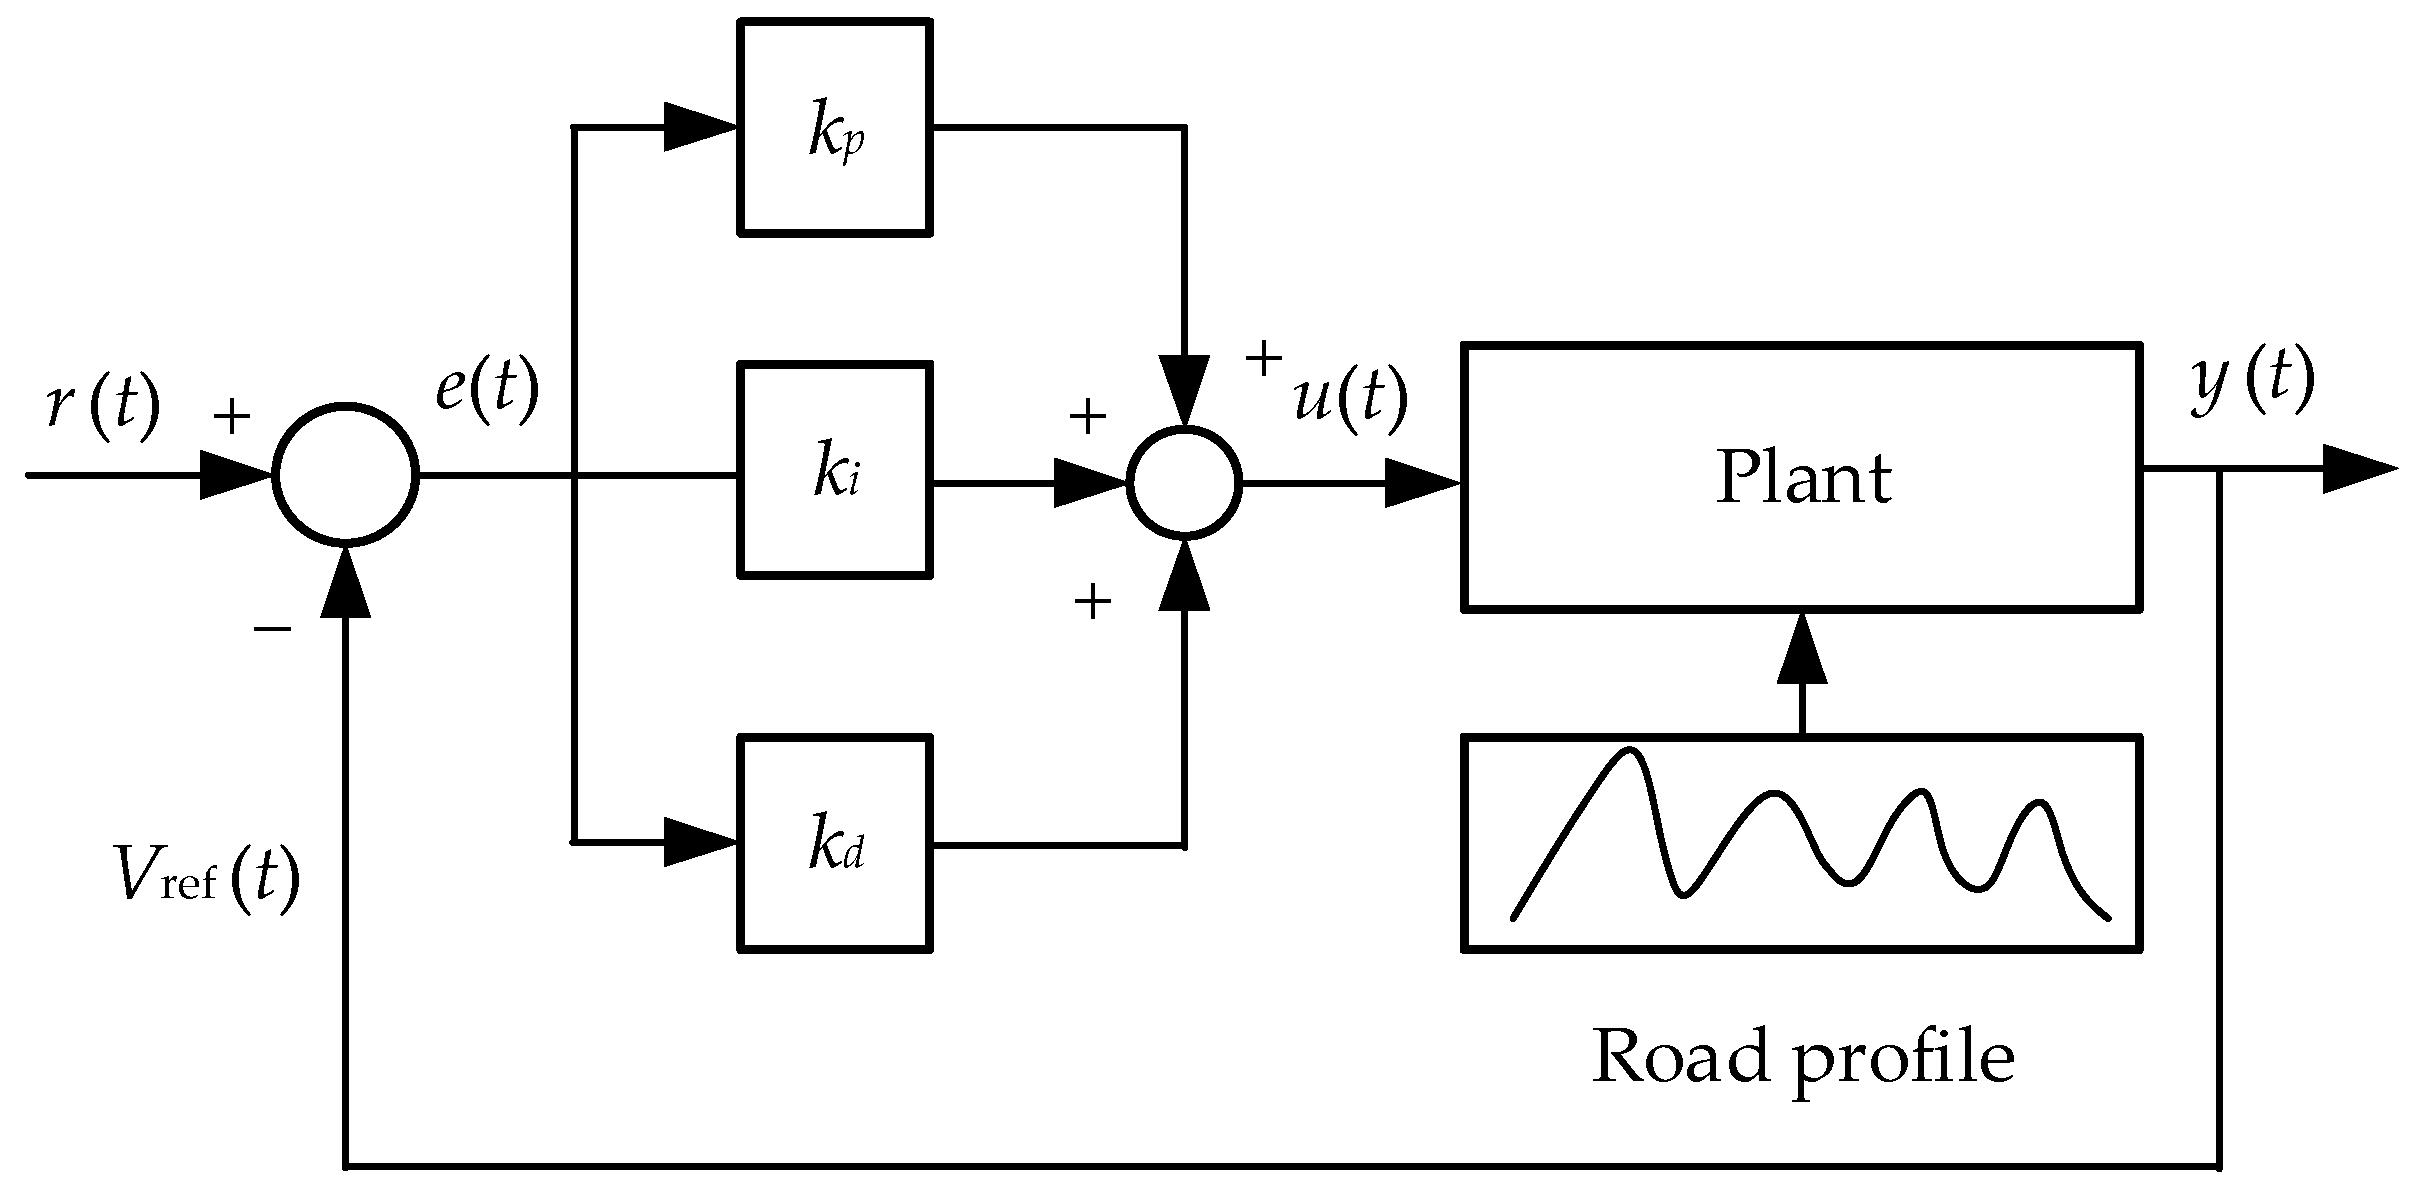
The proportional–integral–derivative (PID) controller is employed as a benchmark control strategy for the semi-active front suspension system due to its simple structure, clear physical interpretation, and proven robustness in engineering applications. The configuration of the PID controller is illustrated in Figure 5. The PID controller regulates the system response through the combined action of proportional, integral, and derivative terms, enabling a balanced trade-off among response speed, vibration attenuation, and steady-state accuracy. Owing to these advantages, PID control has been widely adopted in vehicle suspension systems to improve ride comfort and dynamic stability.
Figure 5.
PID controller structure block diagram.
The PID control law is defined as follows:
where e(t) denotes the control error, which is defined as e(t) = r(t)−Vref(t). Here, r(t) represents the reference input of the controlled response, and Vref(t) is the feedback response output. Kp, Ki, and Kd are the proportional, integral, and derivative gains, respectively. The proportional term improves the response speed, the integral term reduces steady-state error, and the derivative term enhances damping characteristics by suppressing oscillations and overshoot.
Considering the nonlinear characteristics of the MR damper and the semi-active constraint, a manual tuning procedure combined with iterative simulation was adopted. The tuning process was conducted sequentially by first adjusting Kp, followed by fine-tuning Ki, and Kd to achieve a compromise between ride comfort improvement and tire dynamic load control under non-stationary road excitations. After iterative simulations, the final parameters were determined as Kp = 900,000, Ki = 10,000, and Kd = 2000.
3.2. Skyhook Control
Skyhook control is implemented as a classical semi-active suspension strategy for performance comparison. Due to its clear physical interpretation and proven effectiveness in vibration suppression, the skyhook algorithm has been widely applied in vehicle suspension systems to enhance ride comfort by introducing a virtual damping force acting on the sprung mass, without significantly degrading road-holding performance.
The conceptual structure of the skyhook controller is illustrated in Figure 6. The fundamental principle of skyhook control is to emulate a virtual damper connected between the vehicle body and an inertial reference, often referred to as the sky. In this context, the virtual damping force represents the ideal damping effect applied to the sprung mass and is generated according to the vertical velocity of the vehicle body. Through this mechanism, body motion can be effectively suppressed, particularly in the low-frequency range that is most critical to ride comfort [37].
Figure 6.
Schematic diagram of the skyhook controller structure.
The ideal Skyhook control force is defined as follows:
where Csky denotes the skyhook damping coefficient and żs is the vertical velocity of the sprung mass. In practice, because the suspension system is semi-active and the MR damper can only dissipate energy, the control law must satisfy the semi-active constraint. Therefore, the implemented control force is expressed as follows:
The skyhook damping coefficient Csky was determined through simulation-based parameter tuning to achieve a compromise between ride comfort improvement and tire dynamic load control under non-stationary road excitations. Similar to the PID controller, the final parameter value was selected after iterative evaluation of vehicle body acceleration and tire dynamic load responses, Csky = 10,000 N·s·m−1.
3.3. Type-1 Fuzzy Control
To cope with the inherent nonlinearities of the semi-active suspension system and the uncertainties caused by non-stationary road excitations, a T1 fuzzy controller is adopted. In contrast to conventional linear control approaches, fuzzy control does not require an explicit mathematical model and can effectively incorporate expert knowledge into the control process, making it well suited for complex vibration systems with time-varying parameters and nonlinear damping characteristics.
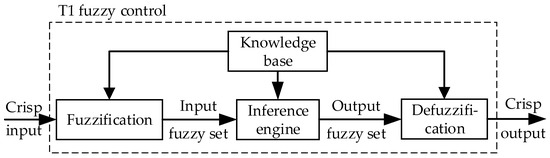
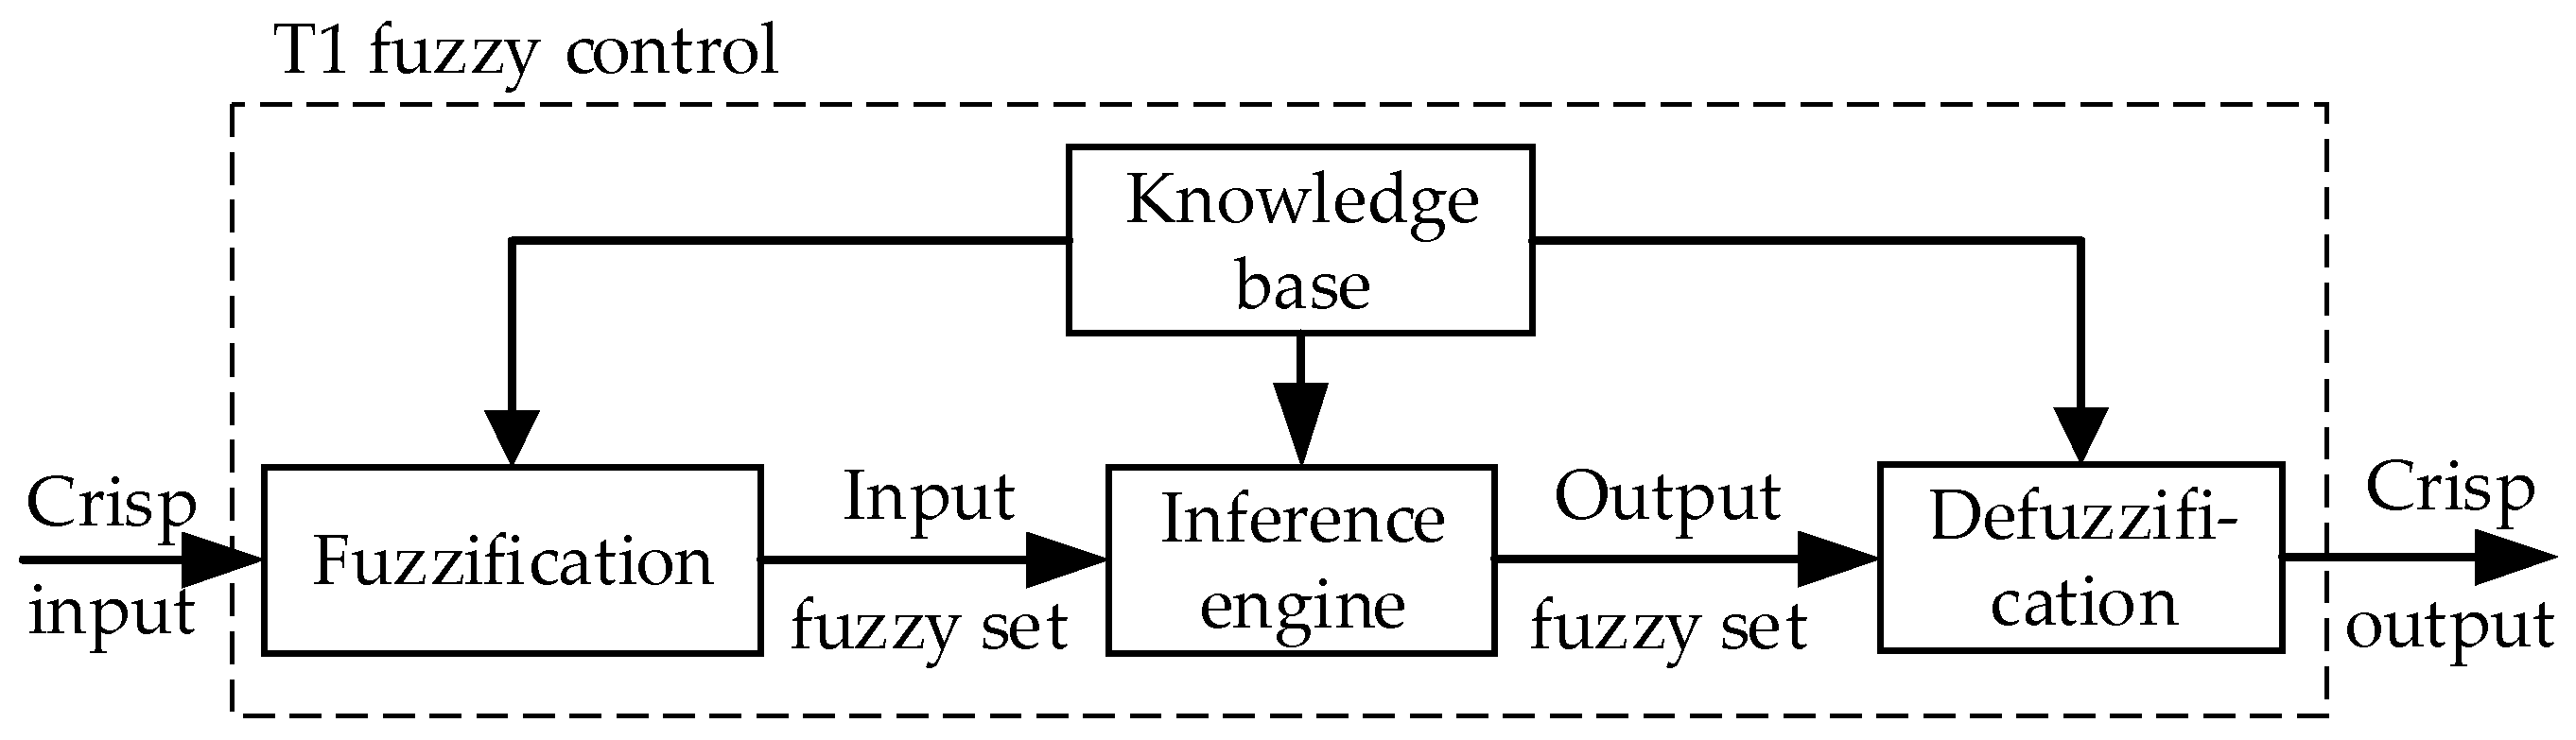
The structure of the adopted T1 fuzzy controller is shown in Figure 7. It comprises four primary modules, including fuzzification, rule base, inference mechanism, and defuzzification. The inputs to the controller are selected as the sprung mass vertical acceleration and the suspension deflection , which jointly reflect ride comfort and suspension working state. The controller output is the desired control force, which is subsequently converted into the MR damper control current.
Figure 7.
Structure of the T1 fuzzy controller.
Both input variables are characterized using seven linguistic labels, namely NB, NM, NS, ZO, PS, PM, and PB, which denote negative big, negative medium, negative small, zero, positive small, positive medium, and positive big, respectively. For ease of implementation and computational efficiency, triangular and trapezoidal membership functions are adopted. The rule base is formulated according to vibration attenuation principles. For instance, when the body acceleration and suspension deflection share the same sign and exhibit large magnitudes, a higher damping force is required to effectively suppress oscillatory motion.
The inference procedure is based on the Mamdani fuzzy inference scheme, while the centroid method is applied for defuzzification to generate a crisp control output. The general fuzzy rule Rl can be expressed as follows:
where (i = 1, 2, …, n) and Gl are the fuzzy sets of the fuzzy membership functions and , respectively, and N is the number of fuzzy rules.
Using singleton fuzzification, the Mamdani fuzzy inference algorithm, and the center-of-area defuzzification method, the fuzzy model of T1 fuzzy control can be expressed as follows:
where x = [x1, x2, …, xn]T, .
Define the fuzzy basis function as follows:
Let and
, then the T1FLC system can be expressed as follows:
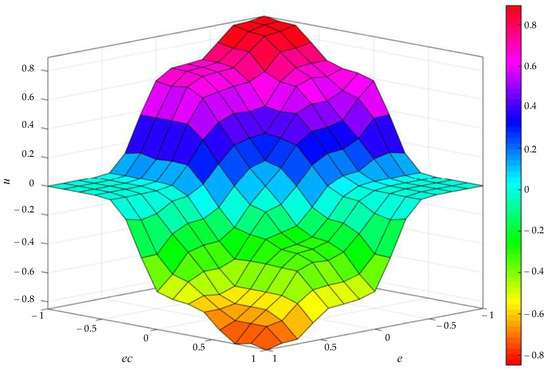
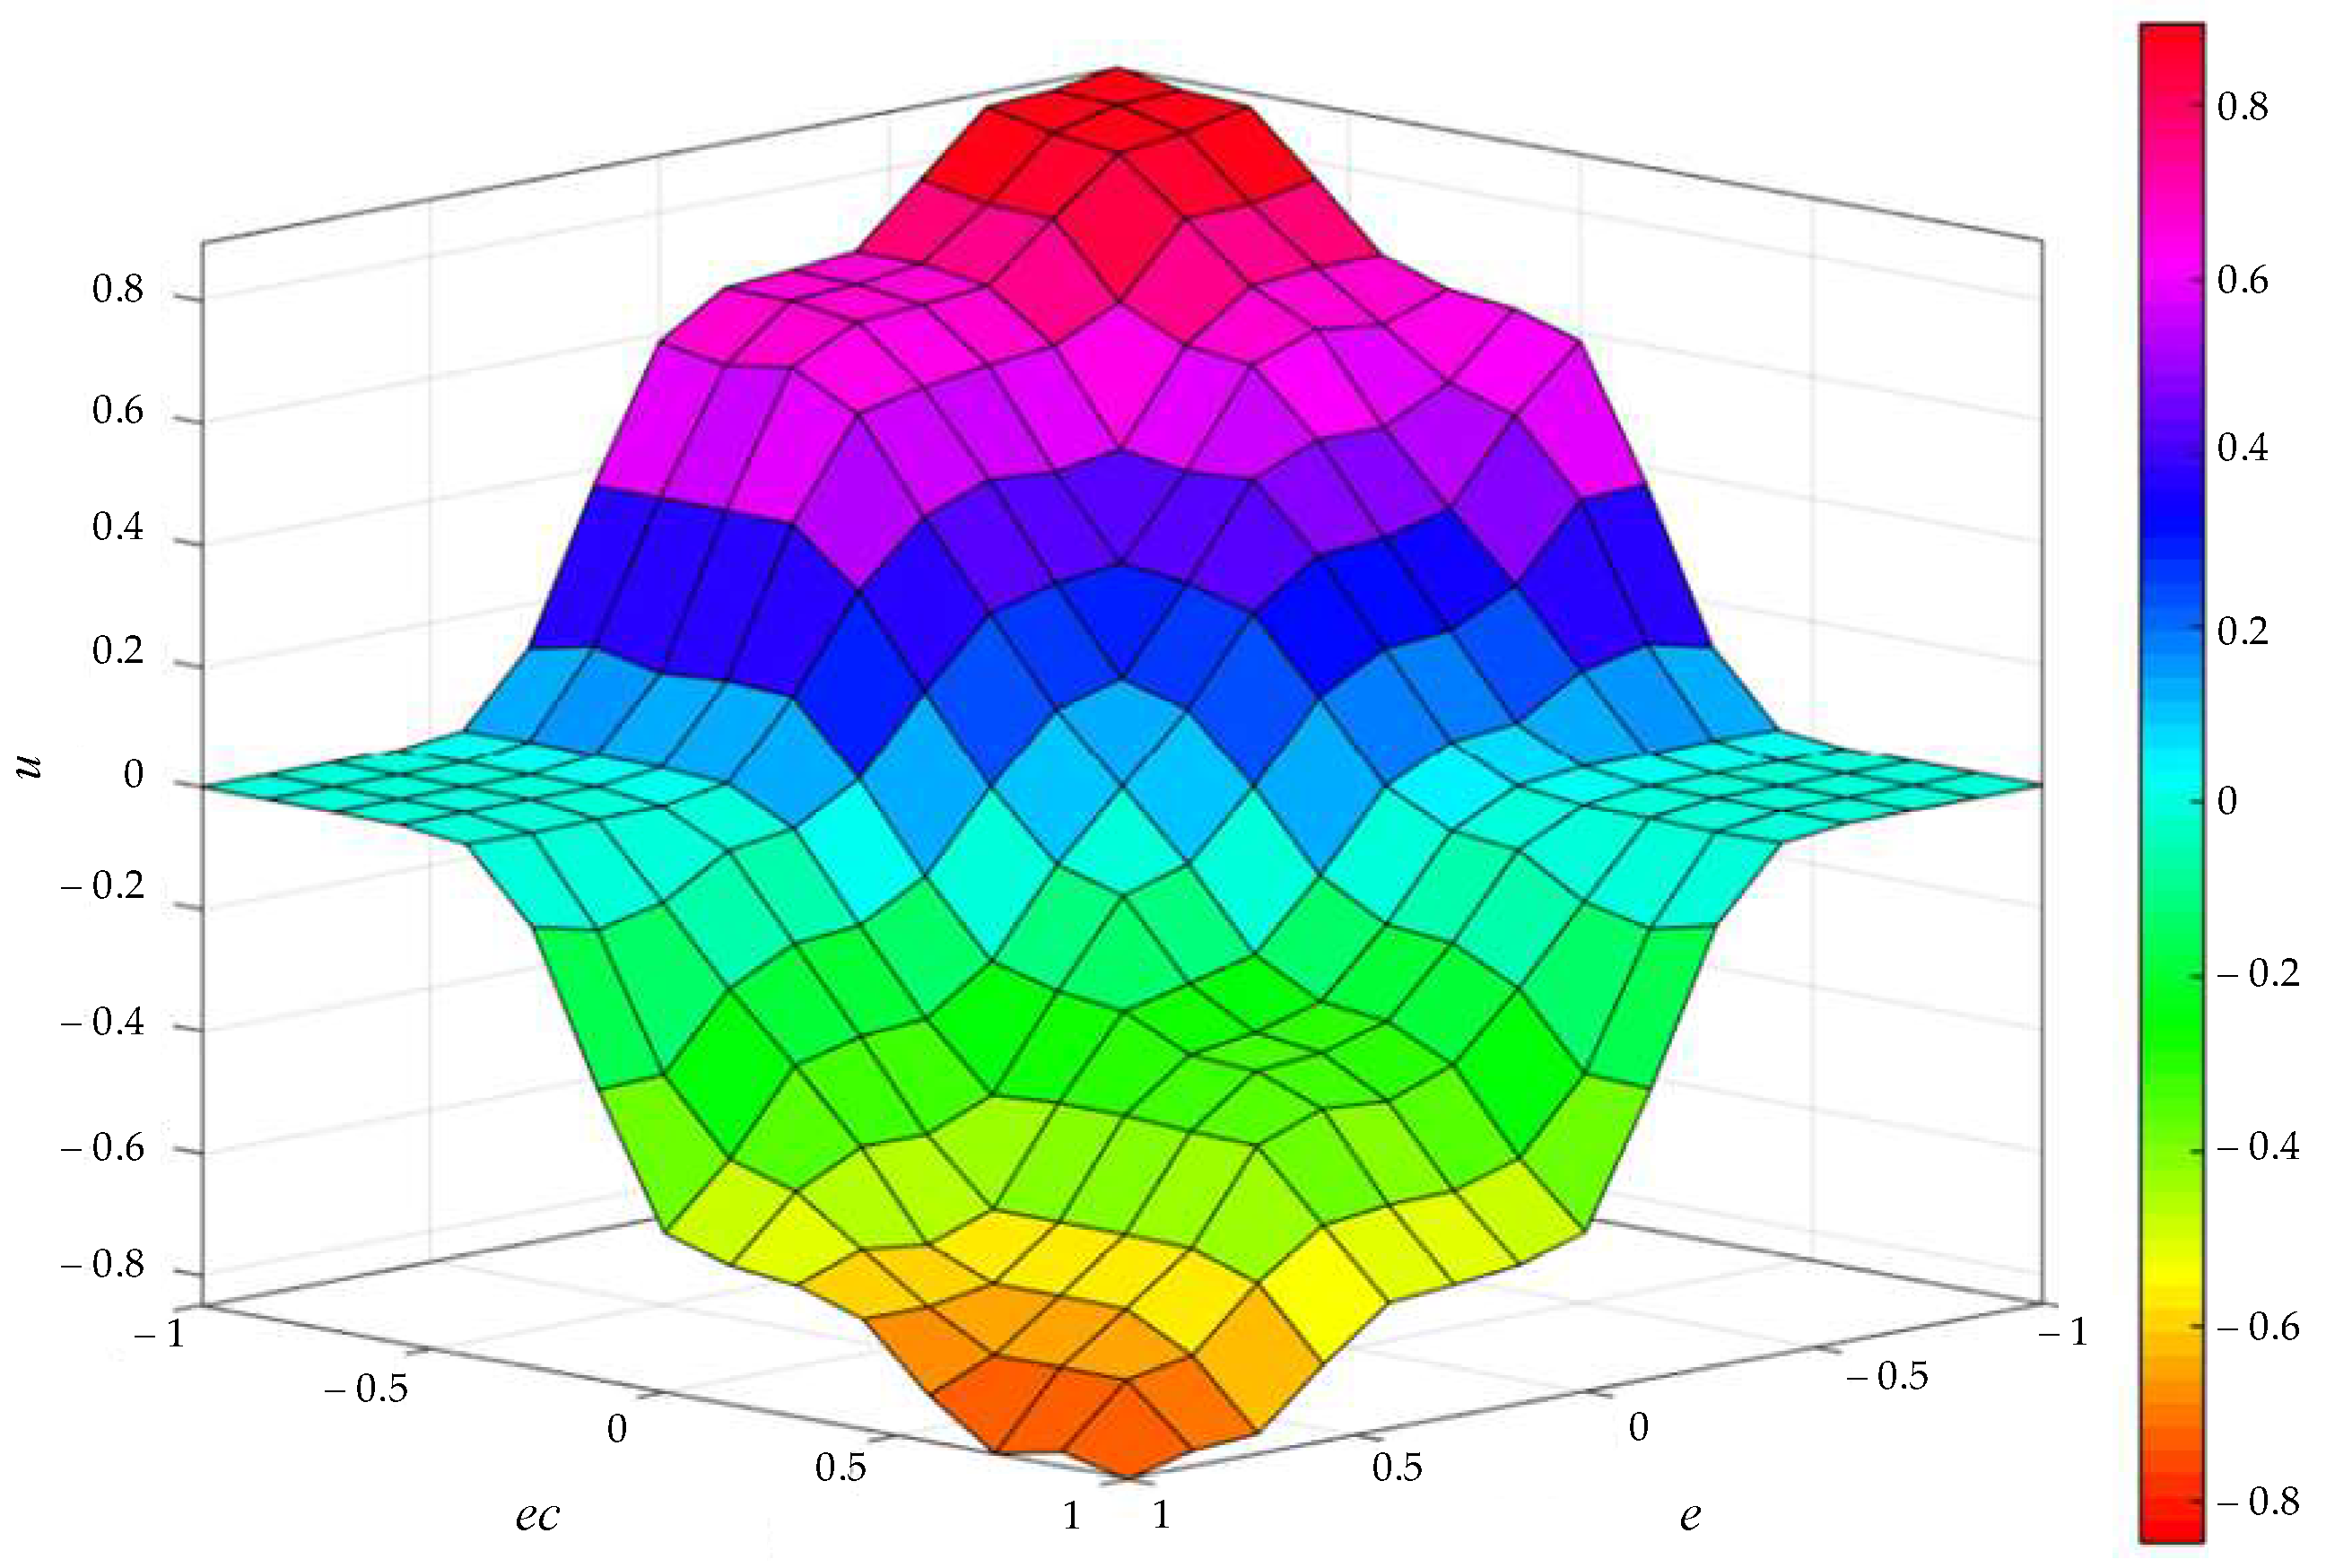
Two inputs (error e and ec) and one output (force u) fuzzy logic control with rule-base is implemented. Sprung mass velocity (error e) and acceleration (change in error ec) are used as input, and control force (u) is output. Fuzzy logic control rule base is a linguistic-based rule base which incorporates past human experience. Table 3 represents the two input–one output rule base for ride comfort. Figure 8 represents the surface plot rule base as stated in Table 3.
Table 3.
Fuzzy logic rule table.
Figure 8.
Fuzzy control surface of the T1 fuzzy control system.
3.4. Interval Type-2 Fuzzy Control
To improve control robustness in the presence of non-stationary road excitations and system uncertainties, an IT2 fuzzy logic controller is developed. In contrast to the T1 fuzzy control approach, the main difference lies in the way uncertainty is modeled within the membership functions. Rather than using precise membership grades, the IT2 fuzzy set incorporates a footprint of uncertainty, which allows the controller to explicitly account for variations in road excitation intensity, vehicle load conditions, and parameter fluctuations of the MR damper.
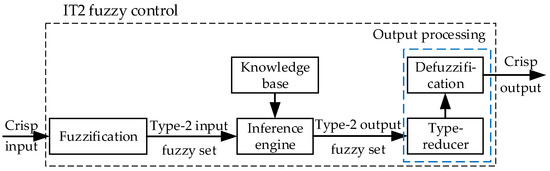
The architecture of the proposed IT2 fuzzy logic controller is shown in Figure 9. Similar to the T1 fuzzy controller, it includes fuzzification, rule base, inference mechanism, and defuzzification components. However, an additional type-reduction stage is introduced prior to defuzzification to convert the IT2 fuzzy output into a T1 fuzzy set.
Figure 9.
Structure of the IT2 fuzzy controller.
A type-2 fuzzy set, denoted by , is defined by membership domain . It is expressed as follows:
where X denotes the universe of discourse with a mapping X → [0, 1], and x ∈ X represents an element in the universe of discourse.
In this study, Gaussian membership functions are adopted, with the footprint of uncertainty (FOU) modeled by variations in the mean and variance, as expressed by:
where m denotes the mean, which is a constant, and represents the variance.
The upper membership function (UMF) and the lower membership function (LMF) can be expressed as follows:
Three common fuzzy rule structures are widely used, namely the Zadeh rule structure, the Takagi–Sugeno–Kang (TSK) rule structure, and the fuzzy hyperbolic tangent structure. In this study, the Zadeh rule structure is adopted, and the l-th fuzzy rule can be expressed as follows:
where the input variables x1(t), x2(t), …, xp(t) are the antecedent variables, the output linguistic variable y is the consequent variable, and denote IT2 fuzzy sets, p is the number of antecedents, and l represents the total number of fuzzy rules.
IT2 Zadeh fuzzy rules in conjunction with the Mamdani implication operator (MIO) are adopted to describe the type-2 fuzzy inference process, considering a two-antecedent–one-consequent rule structure, singleton fuzzification, and the minimum t-norm. Under these assumptions, the firing strength set of the l-th rule is an interval, which can be expressed as follows:
where denote the upper and lower membership functions of the antecedent footprint of uncertainty (FOU), respectively. denotes the minimum t-norm. In the IT2 Mamdani fuzzy system considered in this study, two antecedents are used, together with singleton fuzzification and the minimum t-norm, to perform fuzzy inference.
The type-reduction process converts the type-2 fuzzy set into an equivalent type-1 representation, among which the Karnik–Mendel method is one of the most commonly adopted approaches [38]. To overcome its computational limitations, the enhanced Karnik–Mendel method was proposed to reduce the number of iterations and improve computational efficiency [39]. Subsequently, further optimization of the stopping criteria led to the enhanced iterative algorithm with stop condition, which can decrease computational cost by approximately 50% when the number of rules is less than 100 [40]. In this study, the enhanced iterative algorithm with stop condition is employed to regulate ride comfort in the considered heavy-duty vehicle model equipped with a semi-active suspension system.
Based on the adopted type-reduction approach and the defined membership functions, the left and right endpoints yl and yr, corresponding to the switching points, are determined through the type-reduction process. The corresponding mathematical formulations are expressed as follows:
Finally, defuzzification is performed to map the type-reduced type-1 fuzzy set to a crisp value. The defuzzified output is obtained by taking the average of yl and yr, which is expressed as follows:
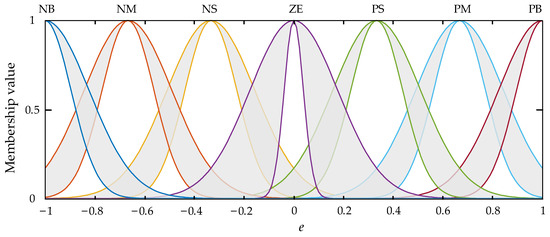
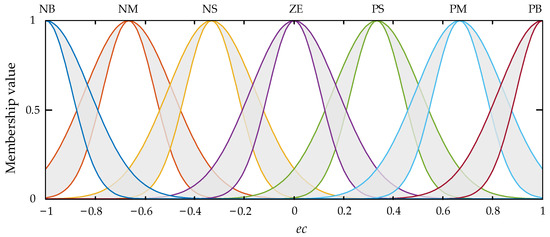
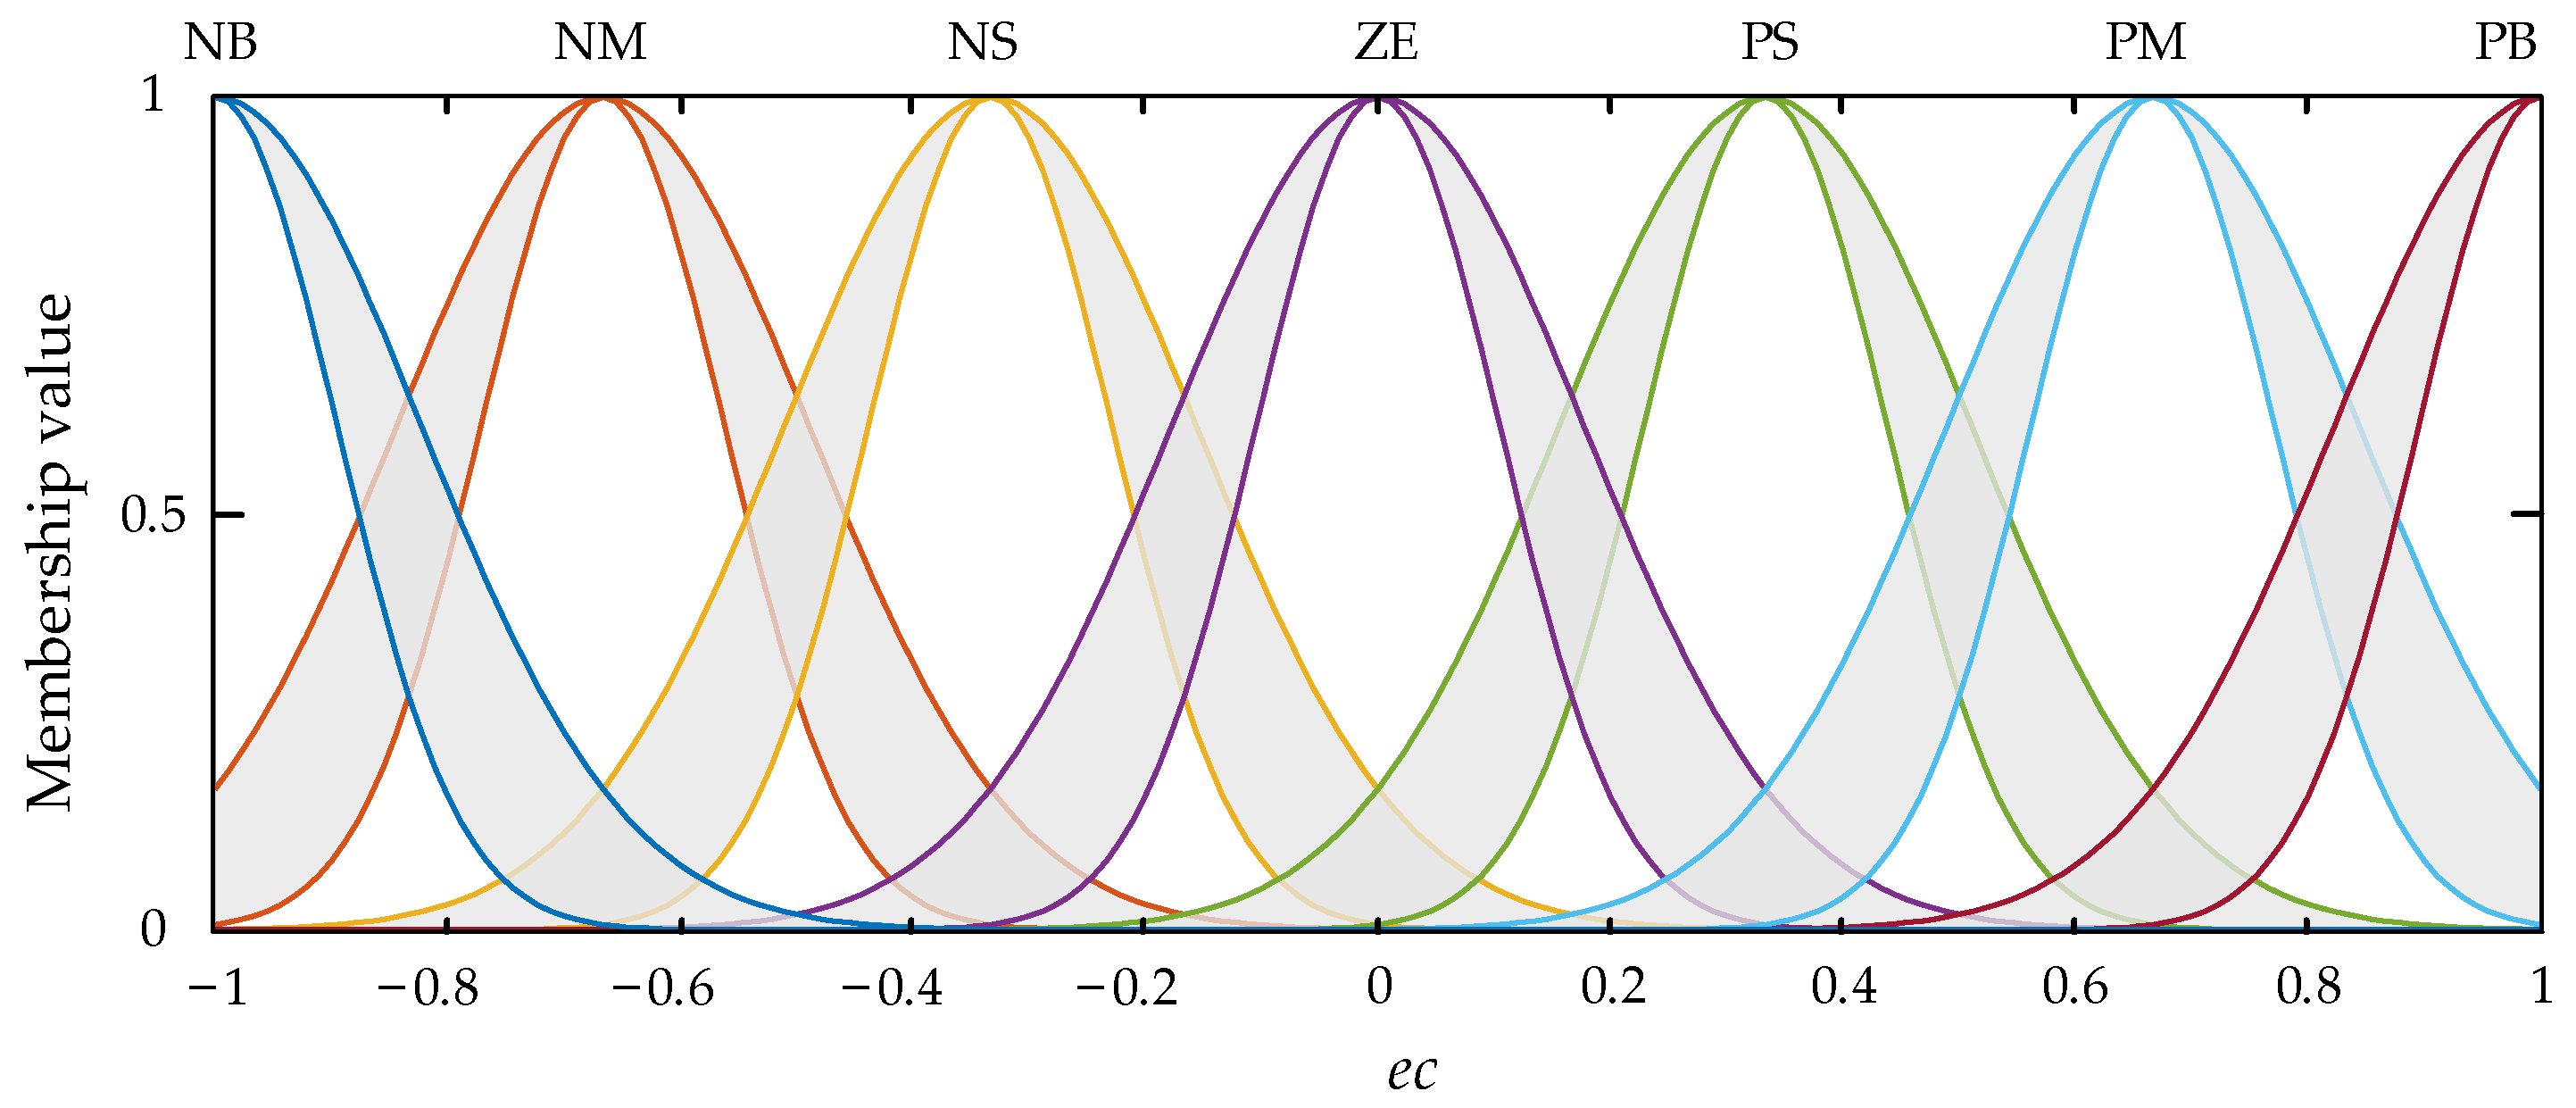
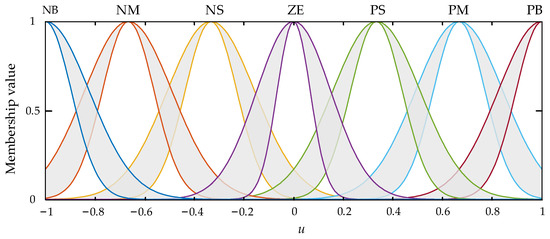
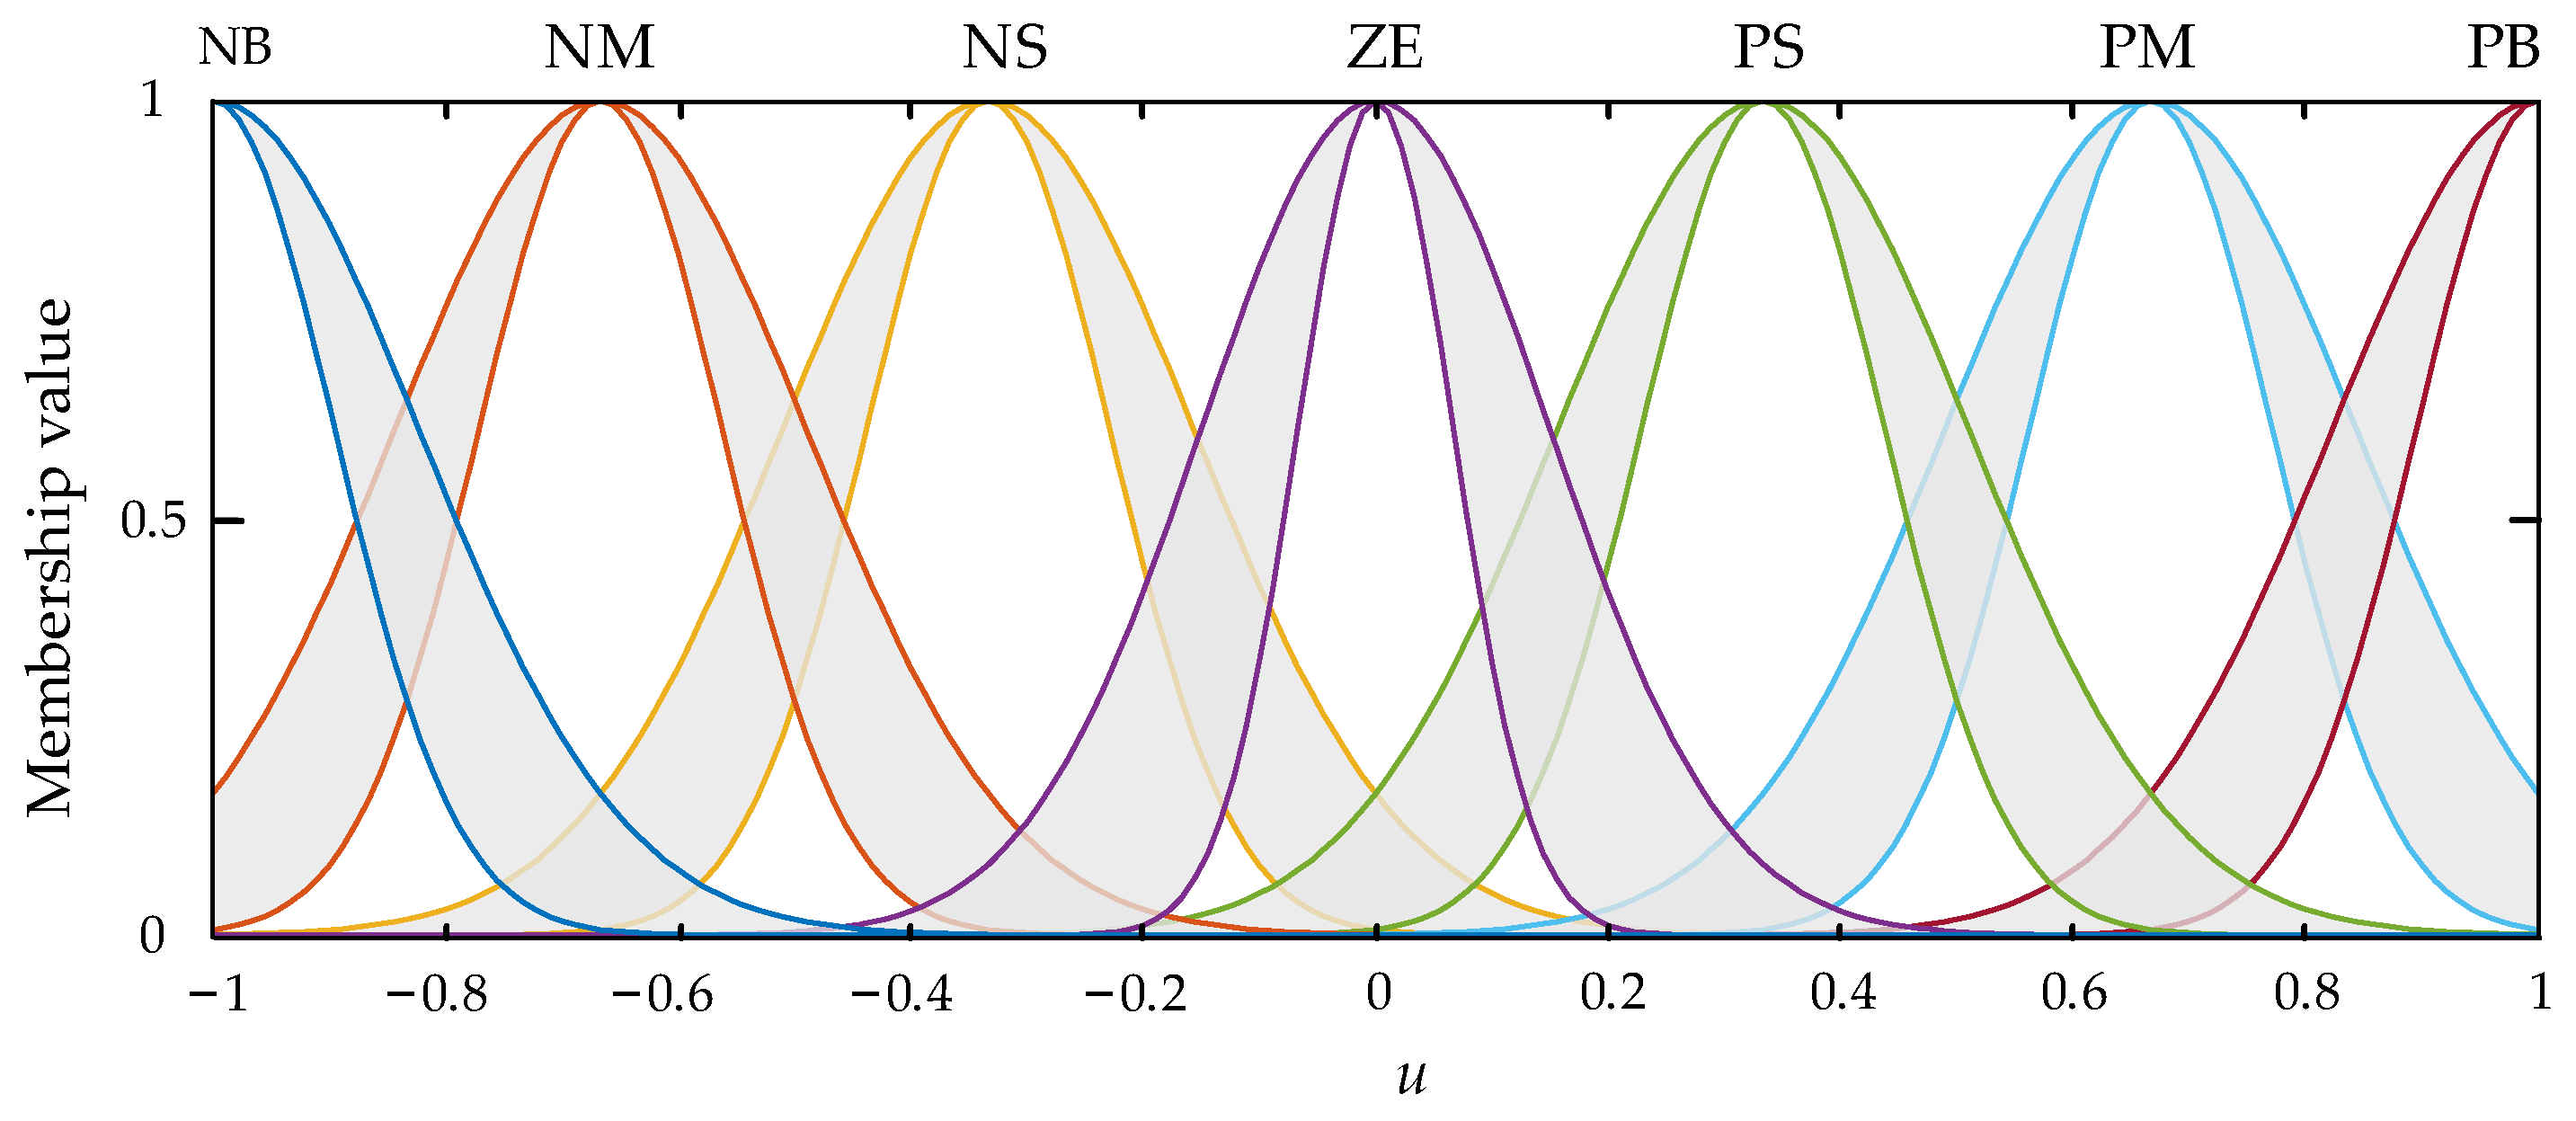
The input and output variables of the IT2 fuzzy controller are consistent with those used in the T1 fuzzy controller, and all variables are normalized within the range of −1 to 1. Both the input and output fuzzy sets are described using seven Gaussian membership functions associated with the linguistic terms NB, NM, NS, ZE, PS, PM, and PB. The membership functions for the input variables e and ec are illustrated in Figure 10 and Figure 11, respectively, while those for the output variable u are presented in Figure 12.
Figure 10.
Relative velocity input MFs for IT2 fuzzy control.
Figure 11.
Acceleration input MFs for IT2 fuzzy control.
Figure 12.
Output MFs for IT2 fuzzy control.
4. Results and Discussion
A 6DOF dynamic simulation model was developed in MATLAB/Simulink (R2025b) to evaluate the dynamic performance of the HPHDT. The road excitation input was modeled as a Class C road profile in accordance with ISO 8608:2016(E) [41]. This road class was selected because it represents a medium-quality road condition and provides sufficient excitation intensity to distinguish the dynamic responses and control effectiveness of different suspension strategies. Compared with lower-roughness road classes, Class C road excitation can better reveal variations in tire dynamic load and ride comfort, while avoiding the excessively severe vibration responses associated with higher-roughness road classes that may obscure the intrinsic control performance of the semi-active suspension system. Under non-stationary driving conditions, four suspension control strategies, including IT2 fuzzy control, T1 fuzzy control, skyhook control, and PID control, were implemented and comparatively investigated. The vertical acceleration of the human–seat system and the dynamic loads of the front, middle, and rear tires were selected as the main response indices to assess the influence of different control methods on ride comfort and tire dynamic load characteristics.
4.1. Comparative Analysis of Road Excitation
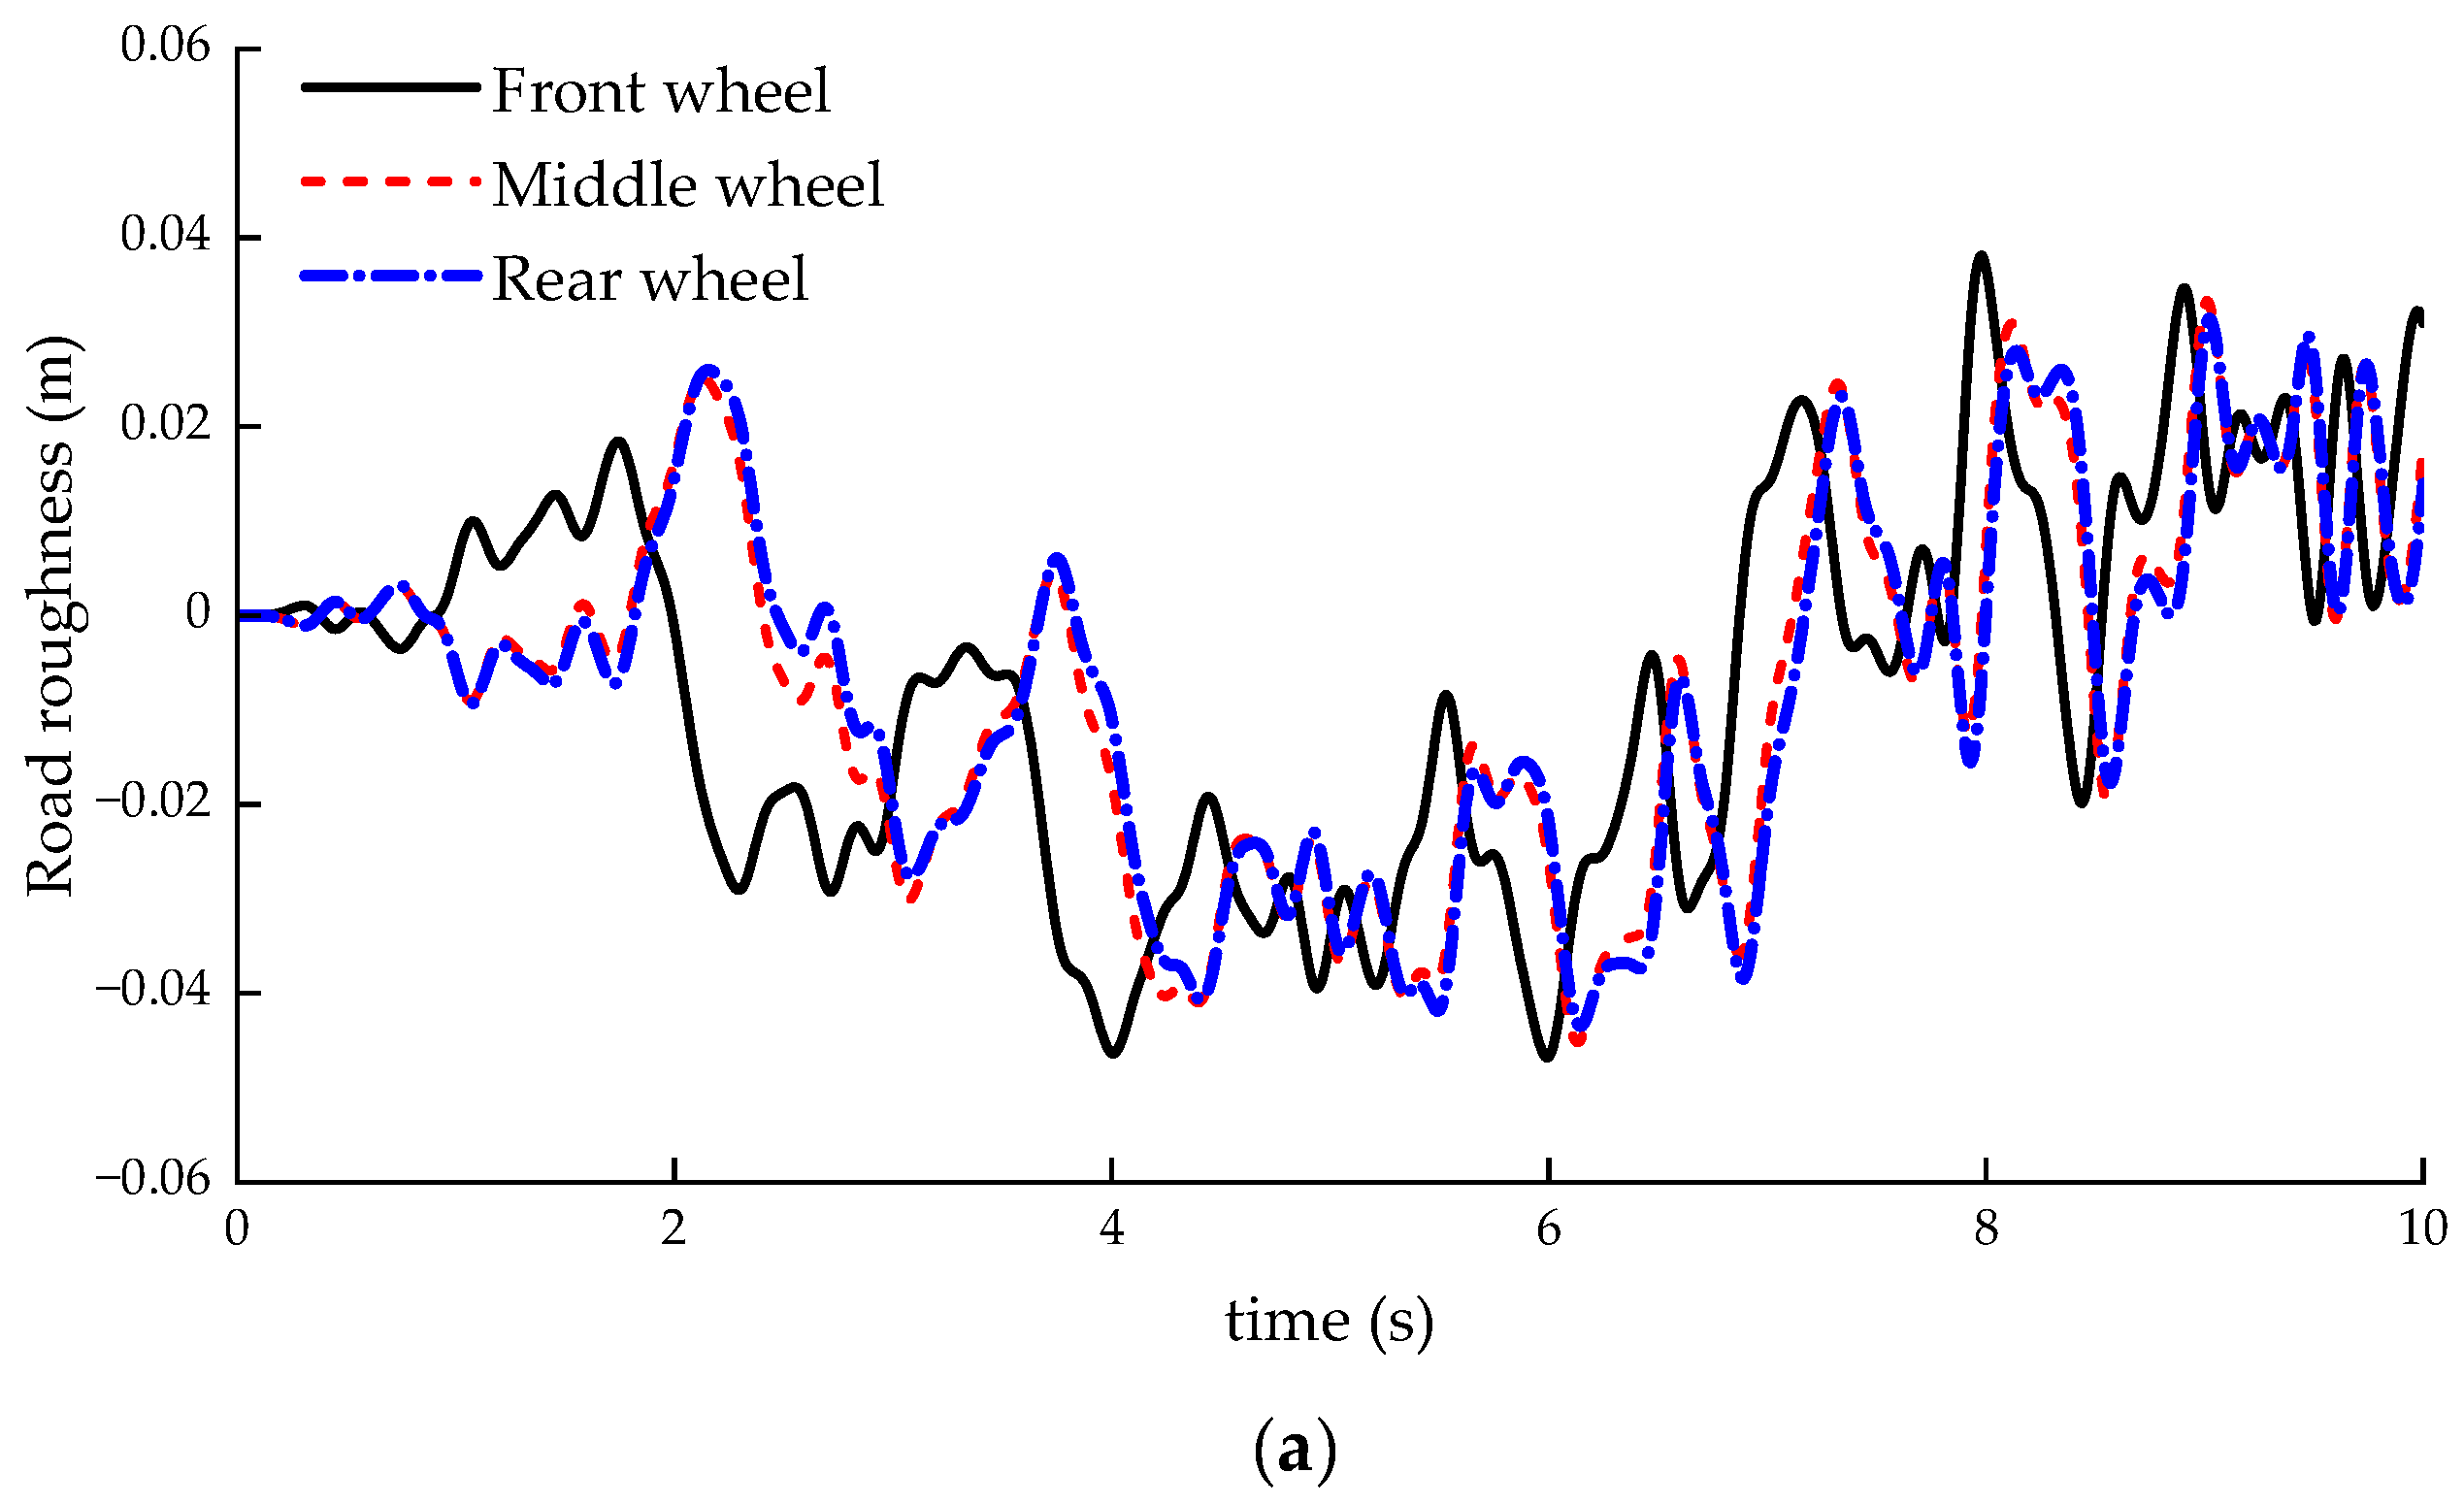
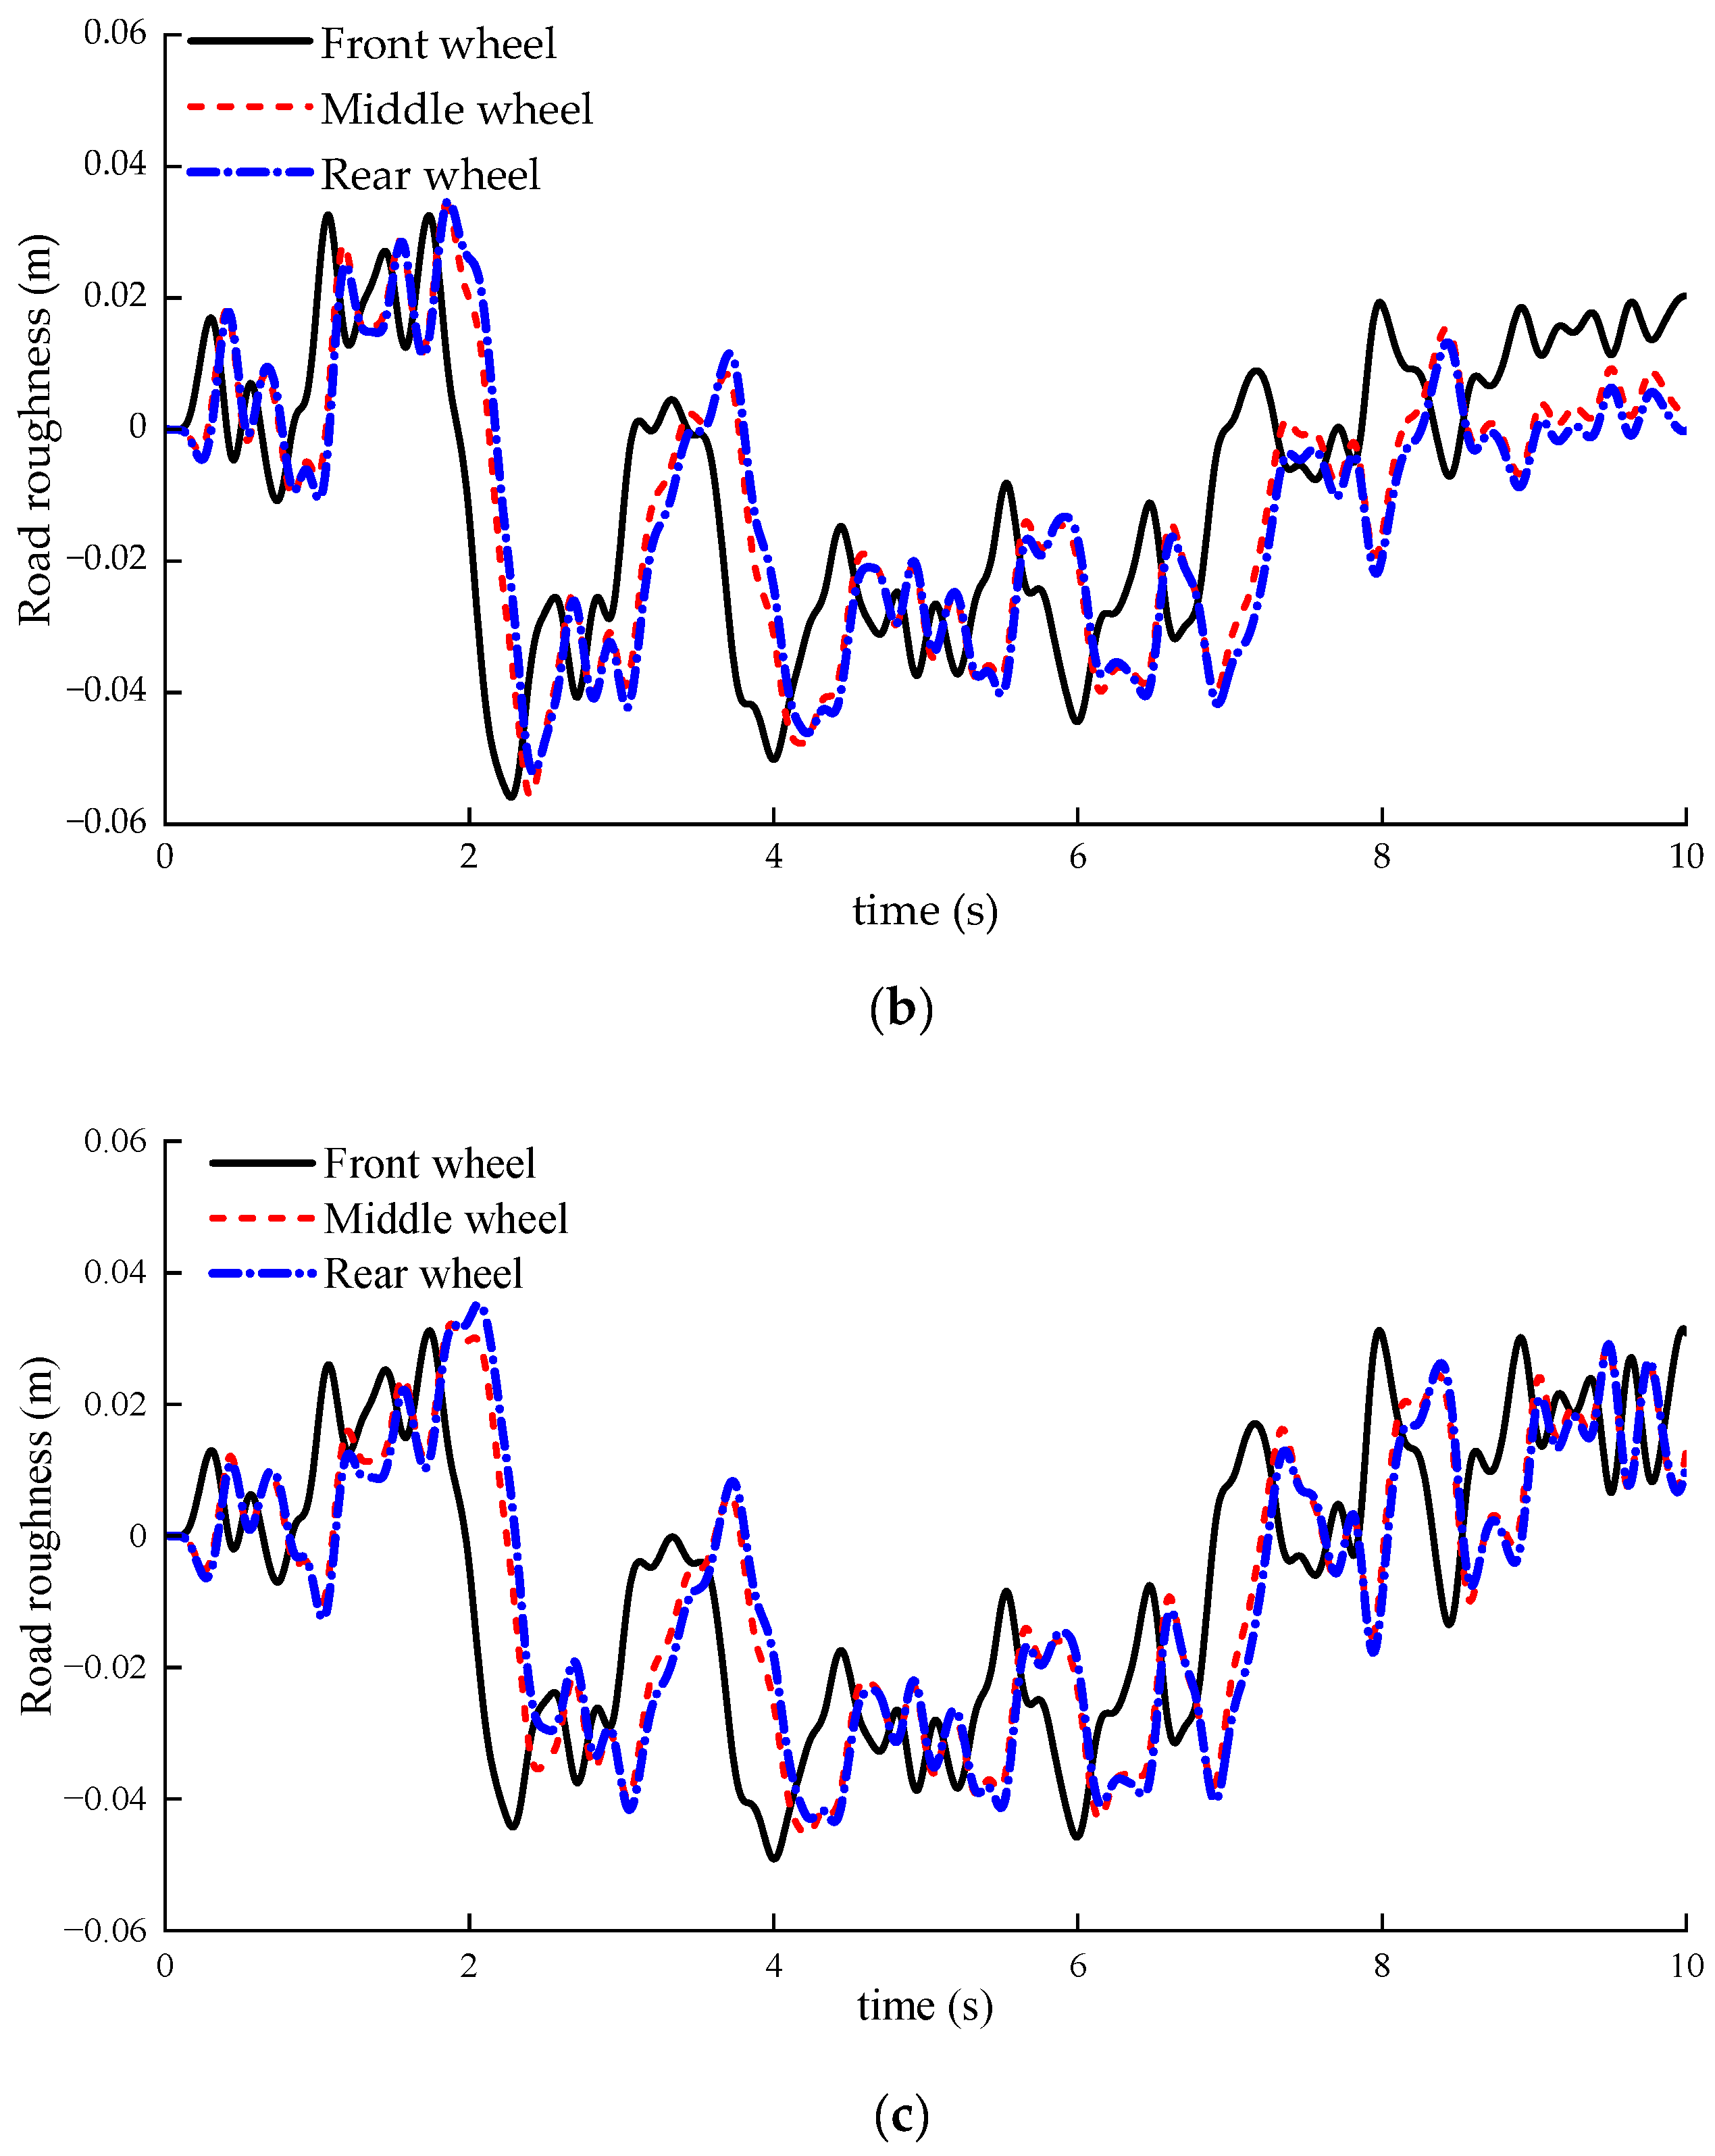
To investigate the dynamic tire load responses and ride comfort characteristics of an HPHDT under non-stationary and steady-state driving conditions, three representative operating scenarios were considered: acceleration from rest, deceleration under braking, and constant-speed cruising. A Class C road profile was adopted, with a total simulation duration of 10 s. Specifically, for the acceleration condition, the initial velocity was set to 0 m·s−1 with a constant acceleration of 3 m·s−2; for the deceleration condition, the initial velocity was 30 m·s−1 with a constant deceleration of −3 m·s−2; and for the steady-state condition, the vehicle speed was maintained at 15 m·s−1.
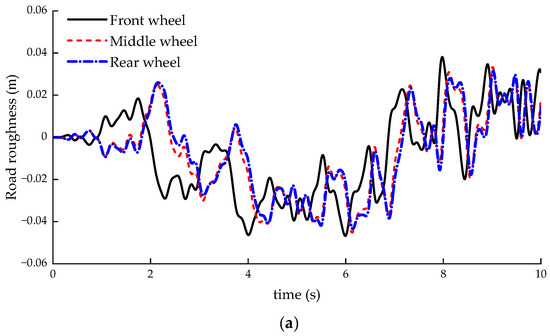
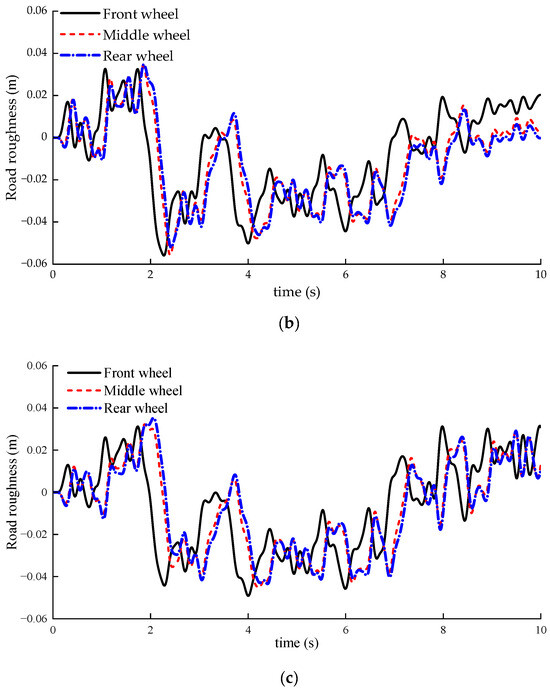
Figure 13 illustrates the road roughness excitation curves across these varying driving conditions. As observed in Figure 13a, the amplitude of road roughness excitation at each wheel increases progressively with time during acceleration. Furthermore, as the vehicle velocity increases, the time delay of road excitation between the front, middle, and rear wheels decreases. Conversely, Figure 13b demonstrates that during deceleration, the amplitude of road excitation decreases over time, while the time delay between the front, middle, and rear wheel excitations increases as the vehicle speed drops. Finally, as shown in Figure 13c for constant-speed cruising, there is a significant time delay in road excitation between the front wheels and the middle/rear wheels; however, the time delay between the middle and rear wheels is negligible. Compared to the front wheels, the excitation time delay for the middle and rear wheels is more pronounced, and the excitation amplitude at the rear wheels is slightly higher than that at the middle wheels.
Figure 13.
Road roughness excitation curves under different driving conditions: (a) acceleration; (b) deceleration; (c) constant speed.
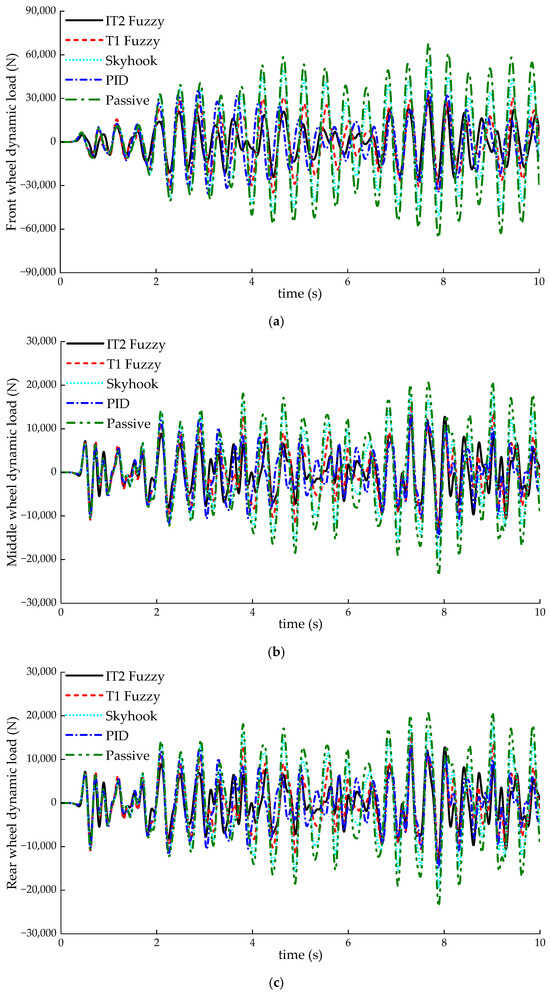
4.2. Comparative Analysis of Tire Dynamic Load
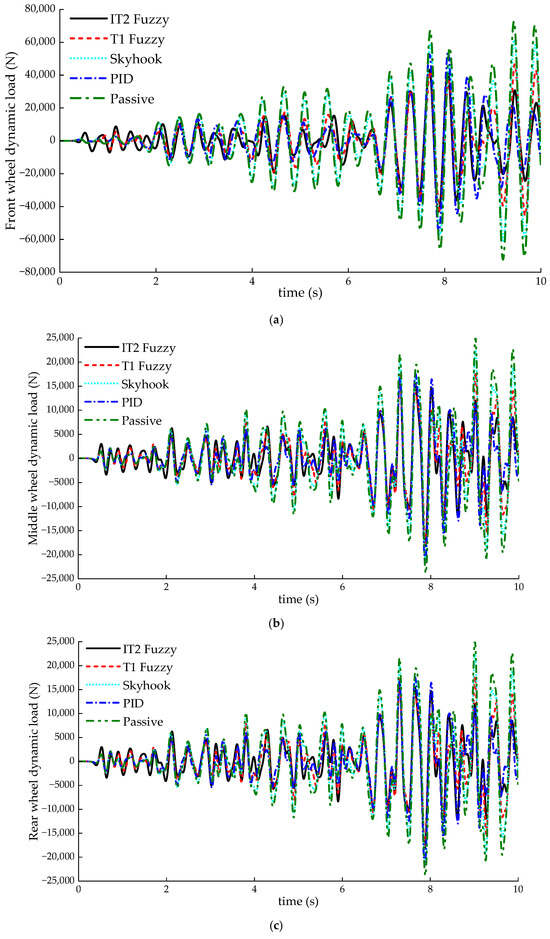
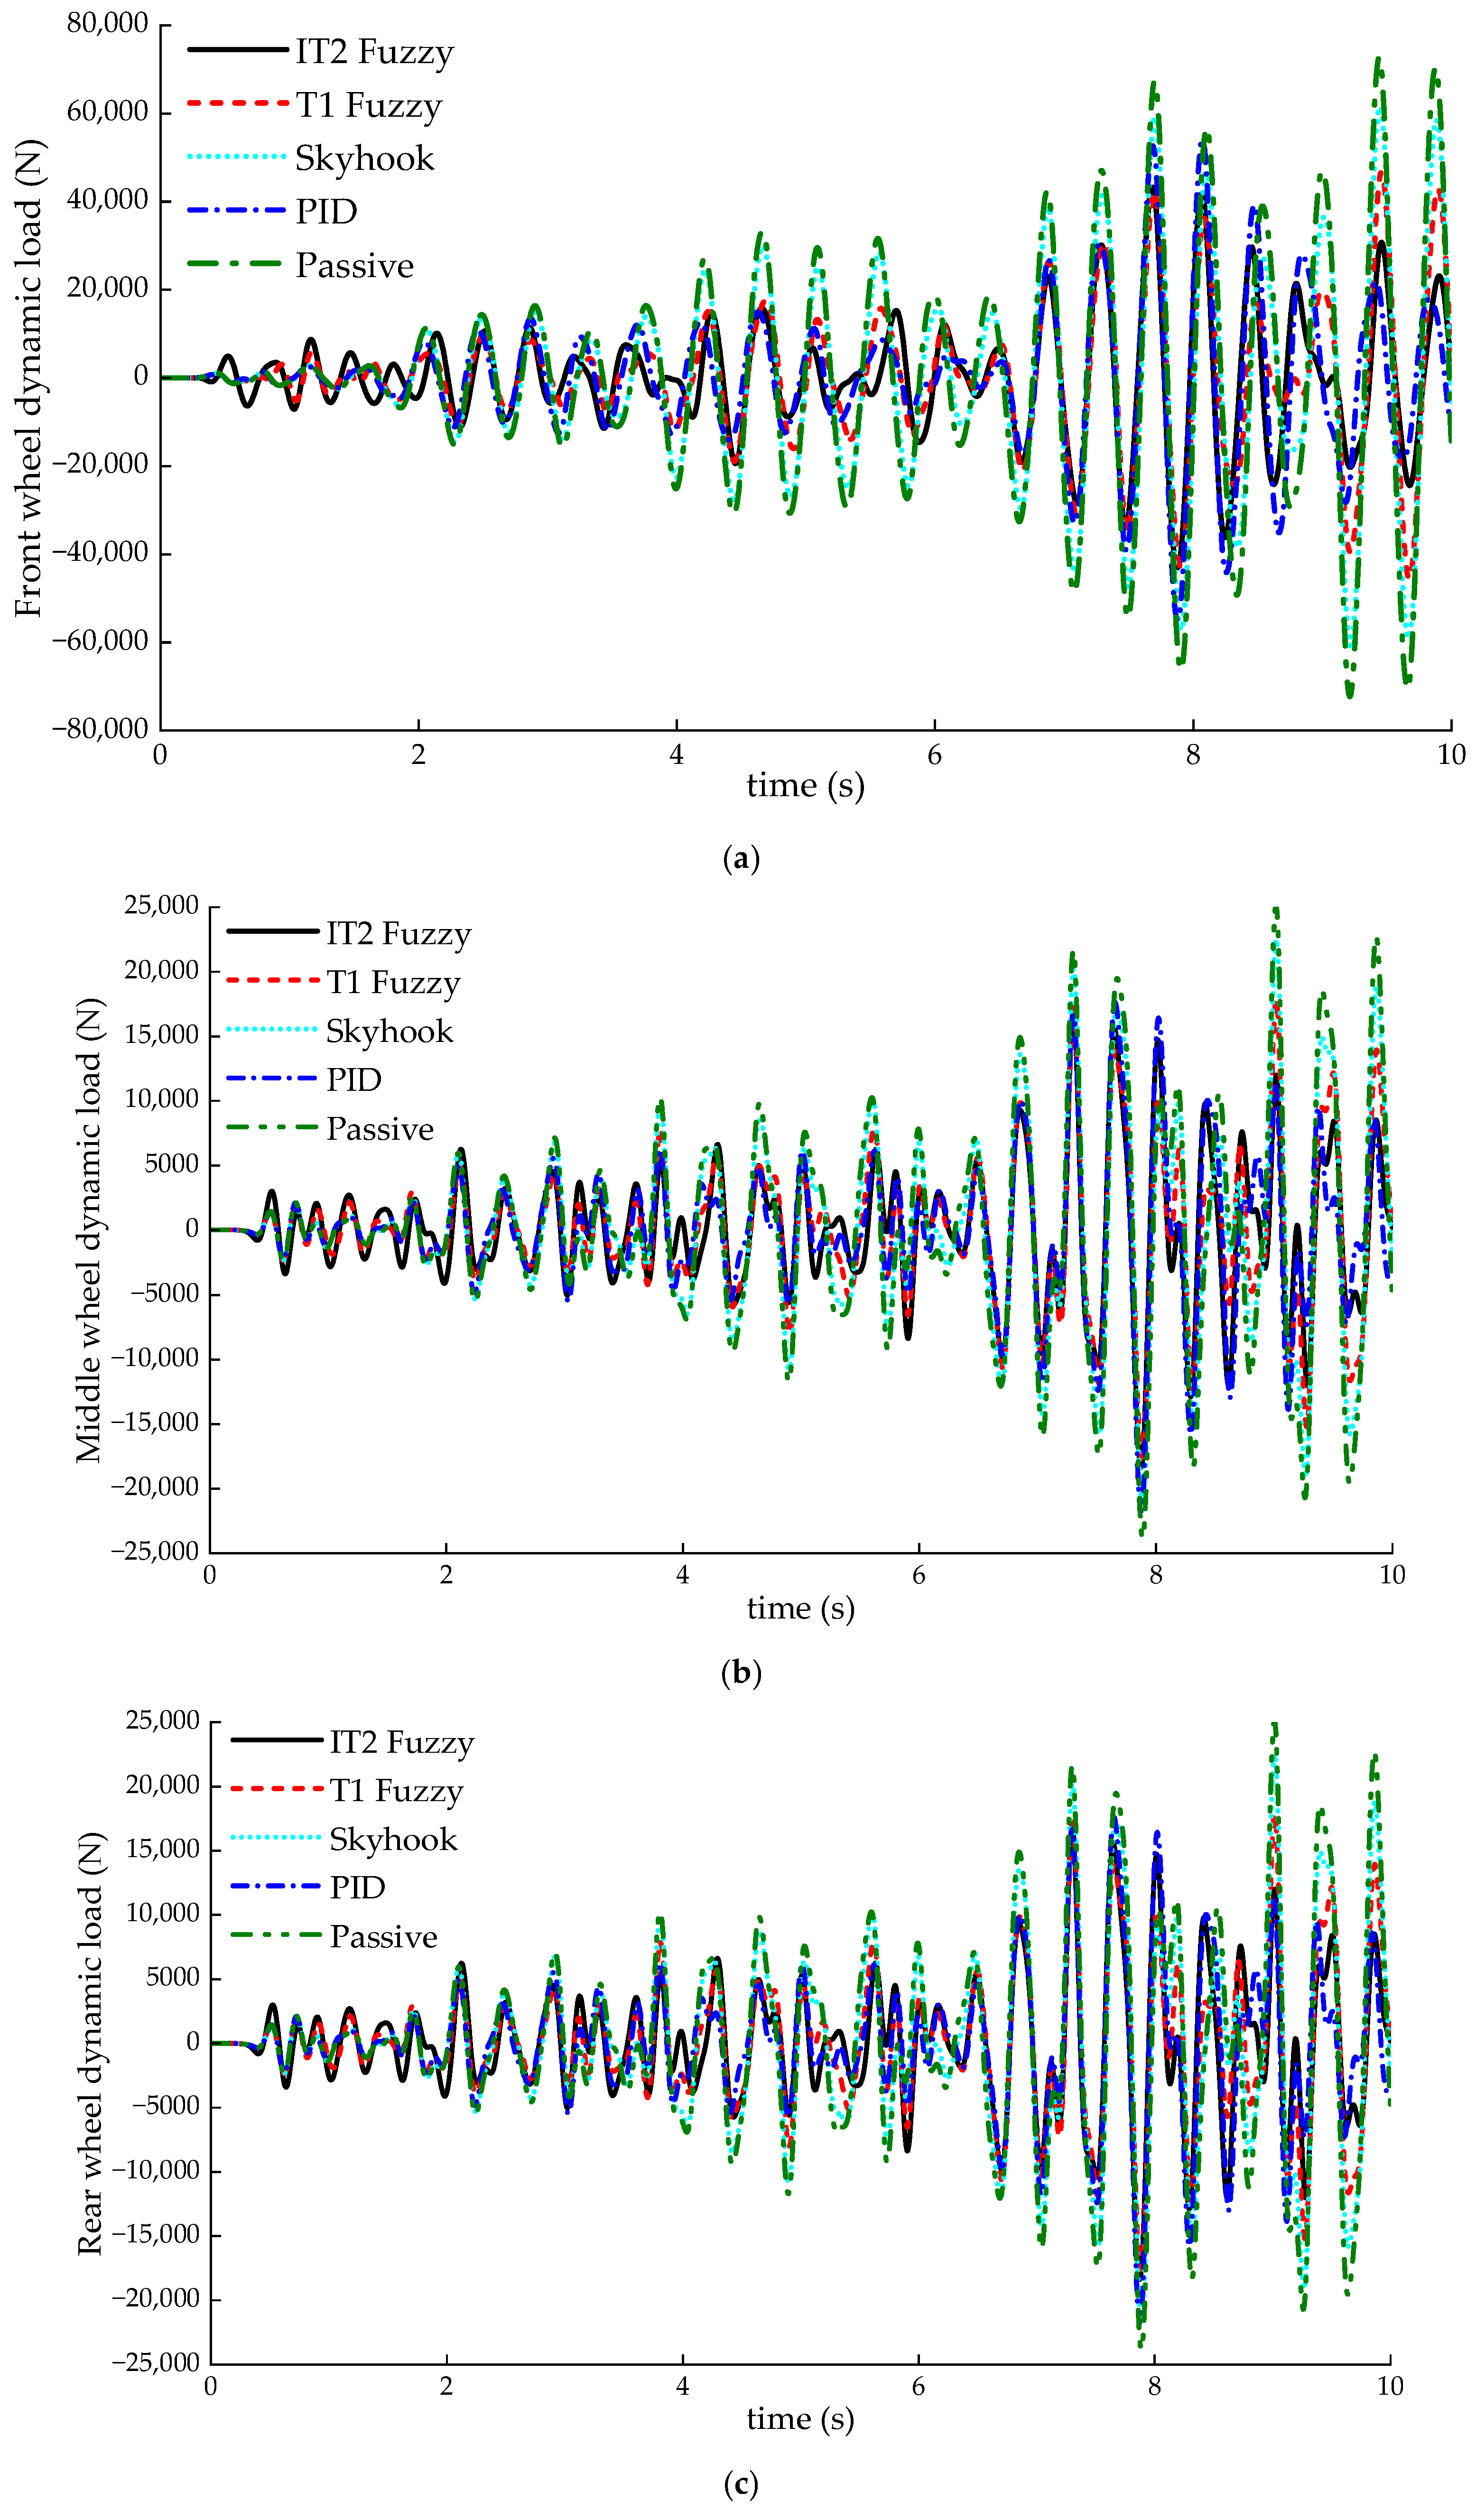
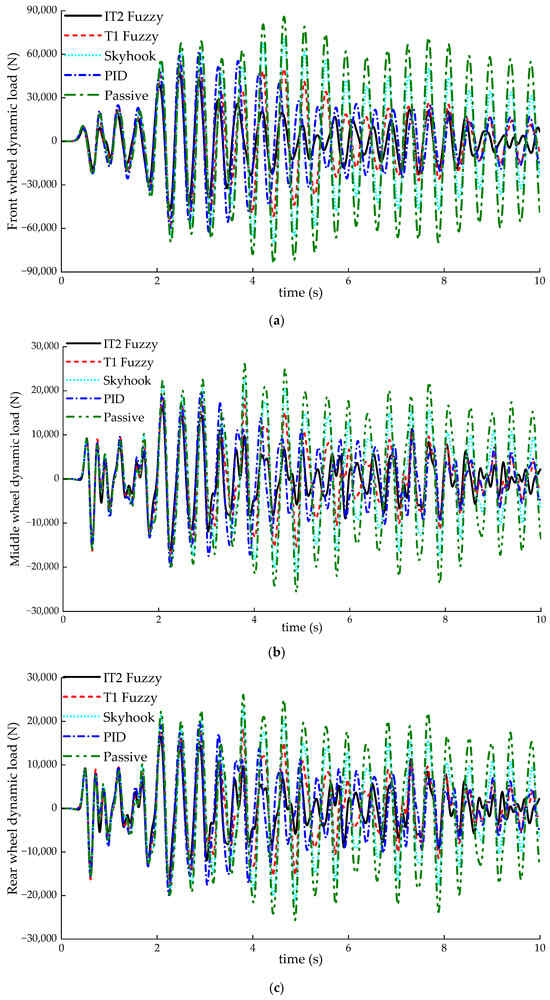
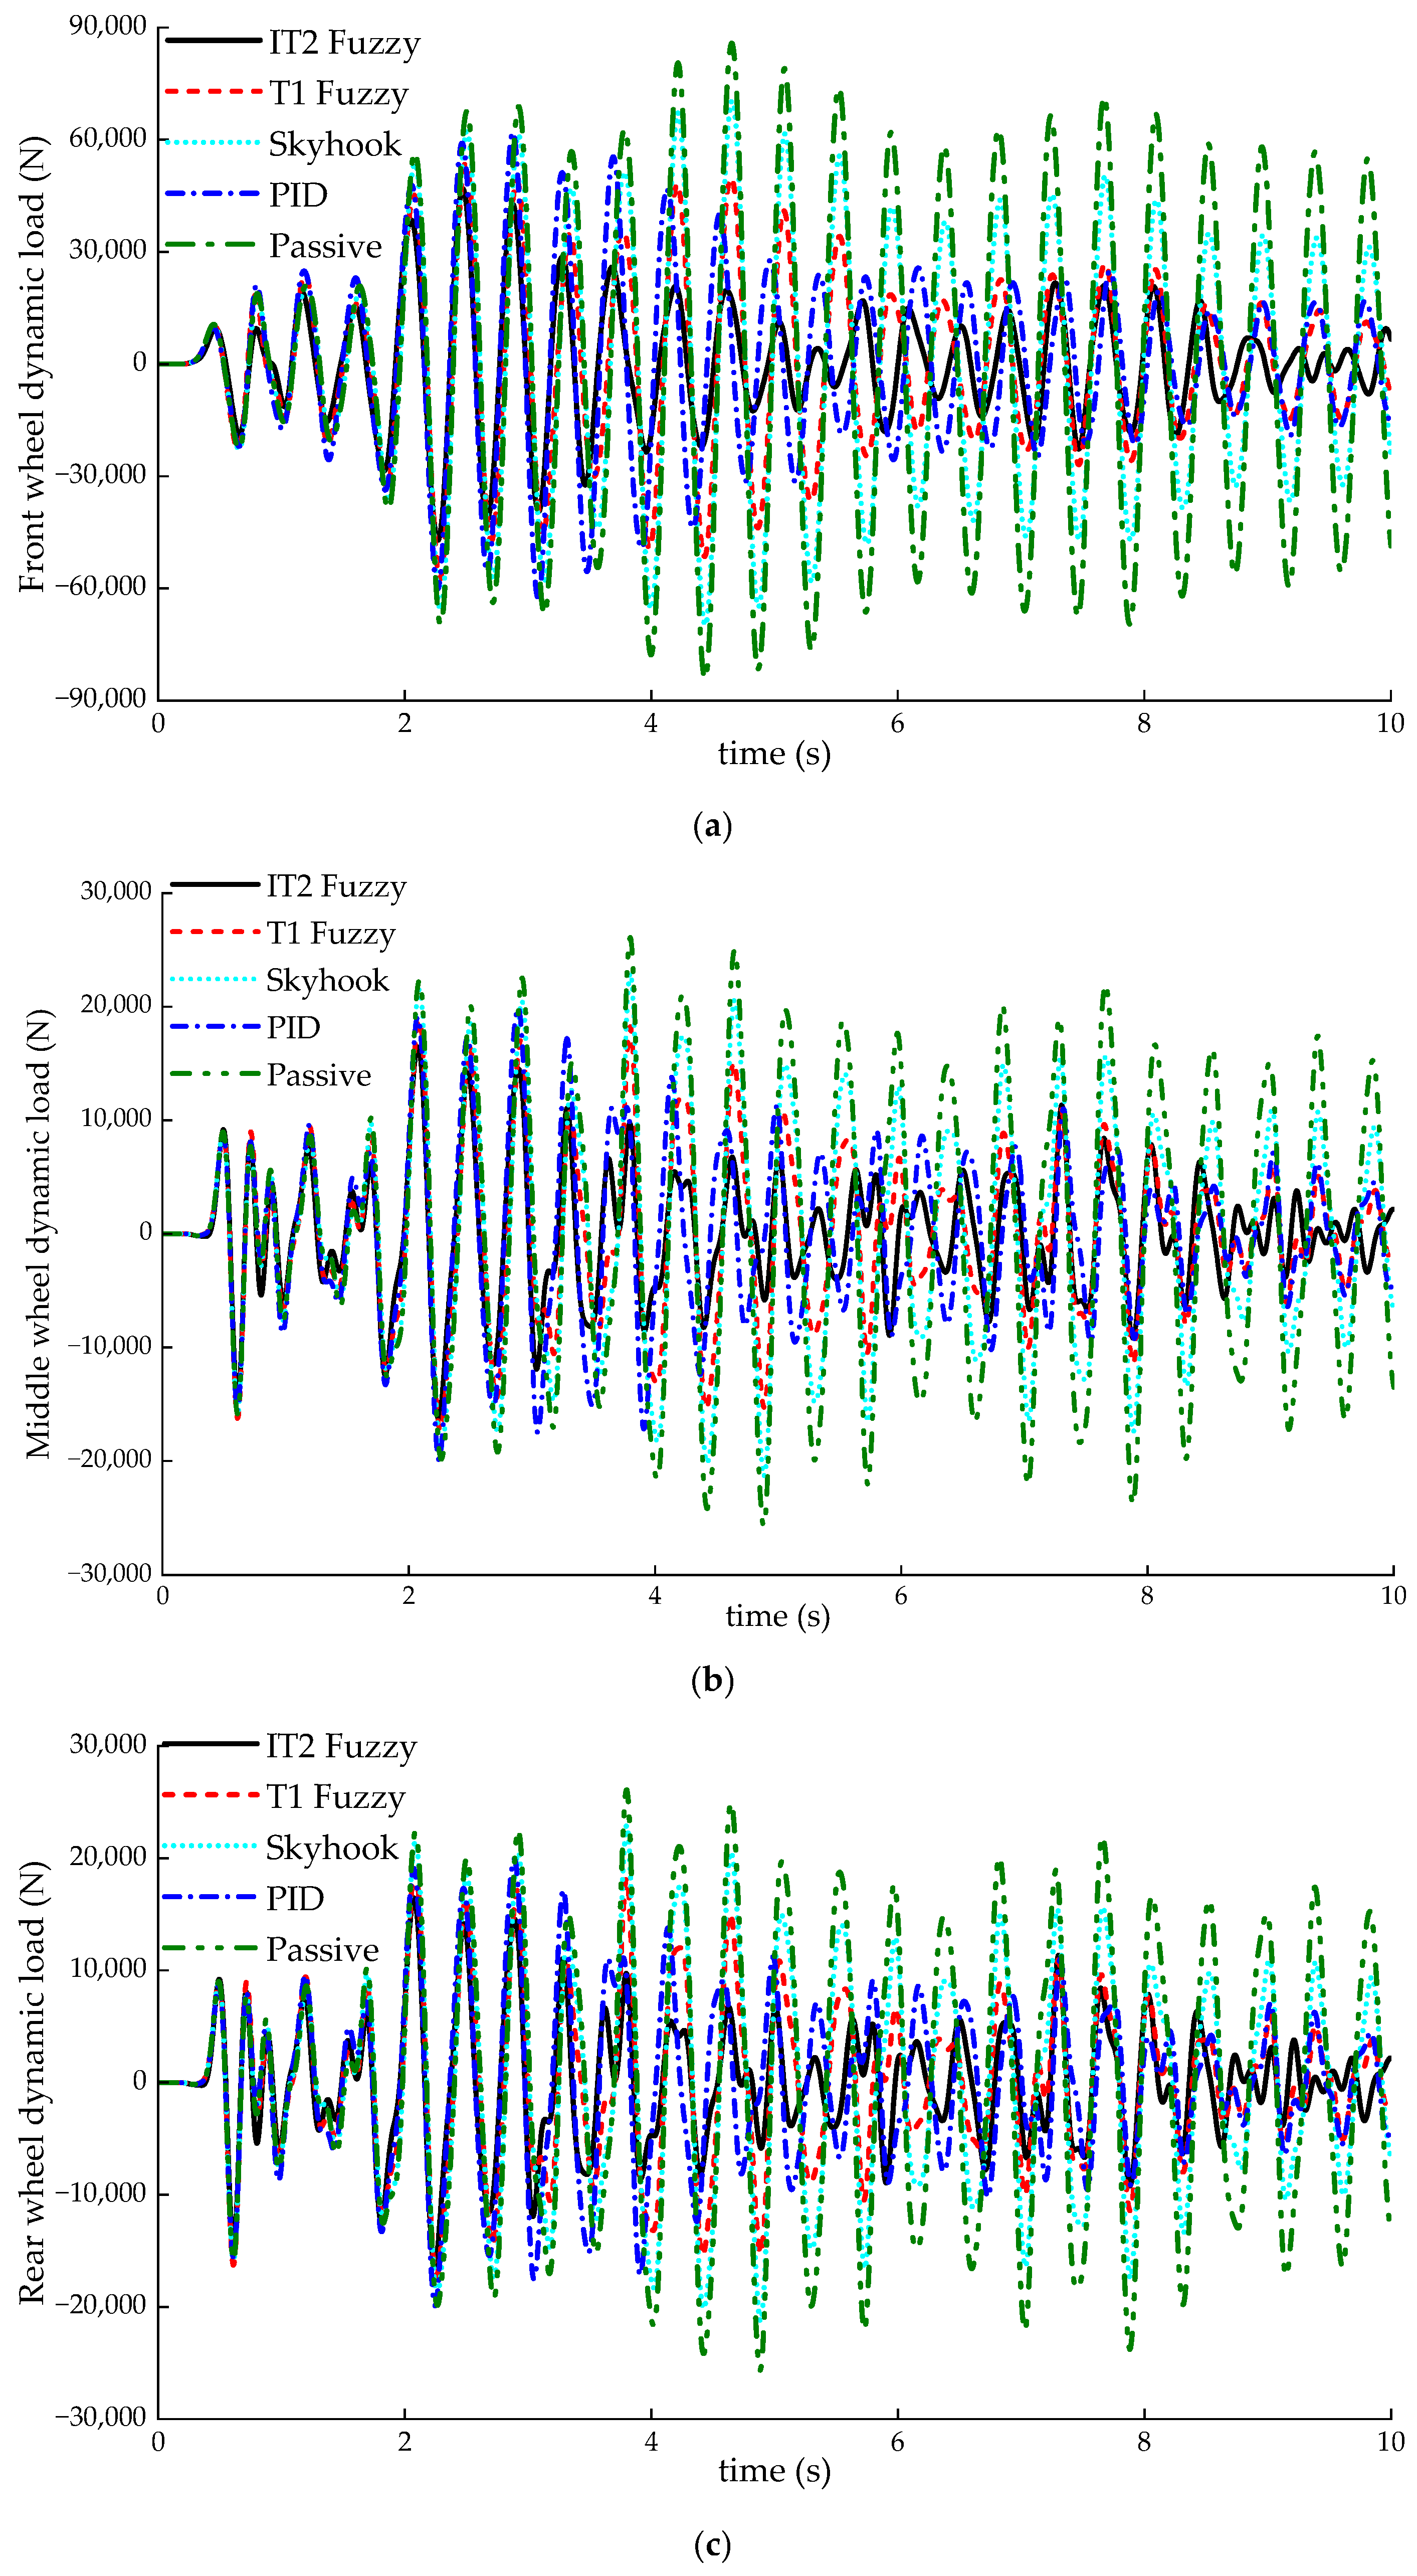
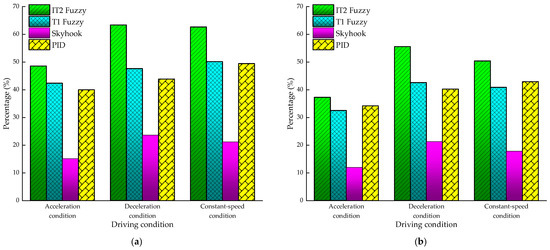
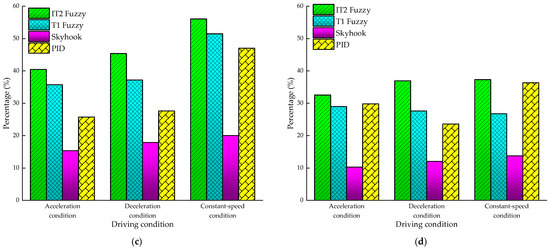
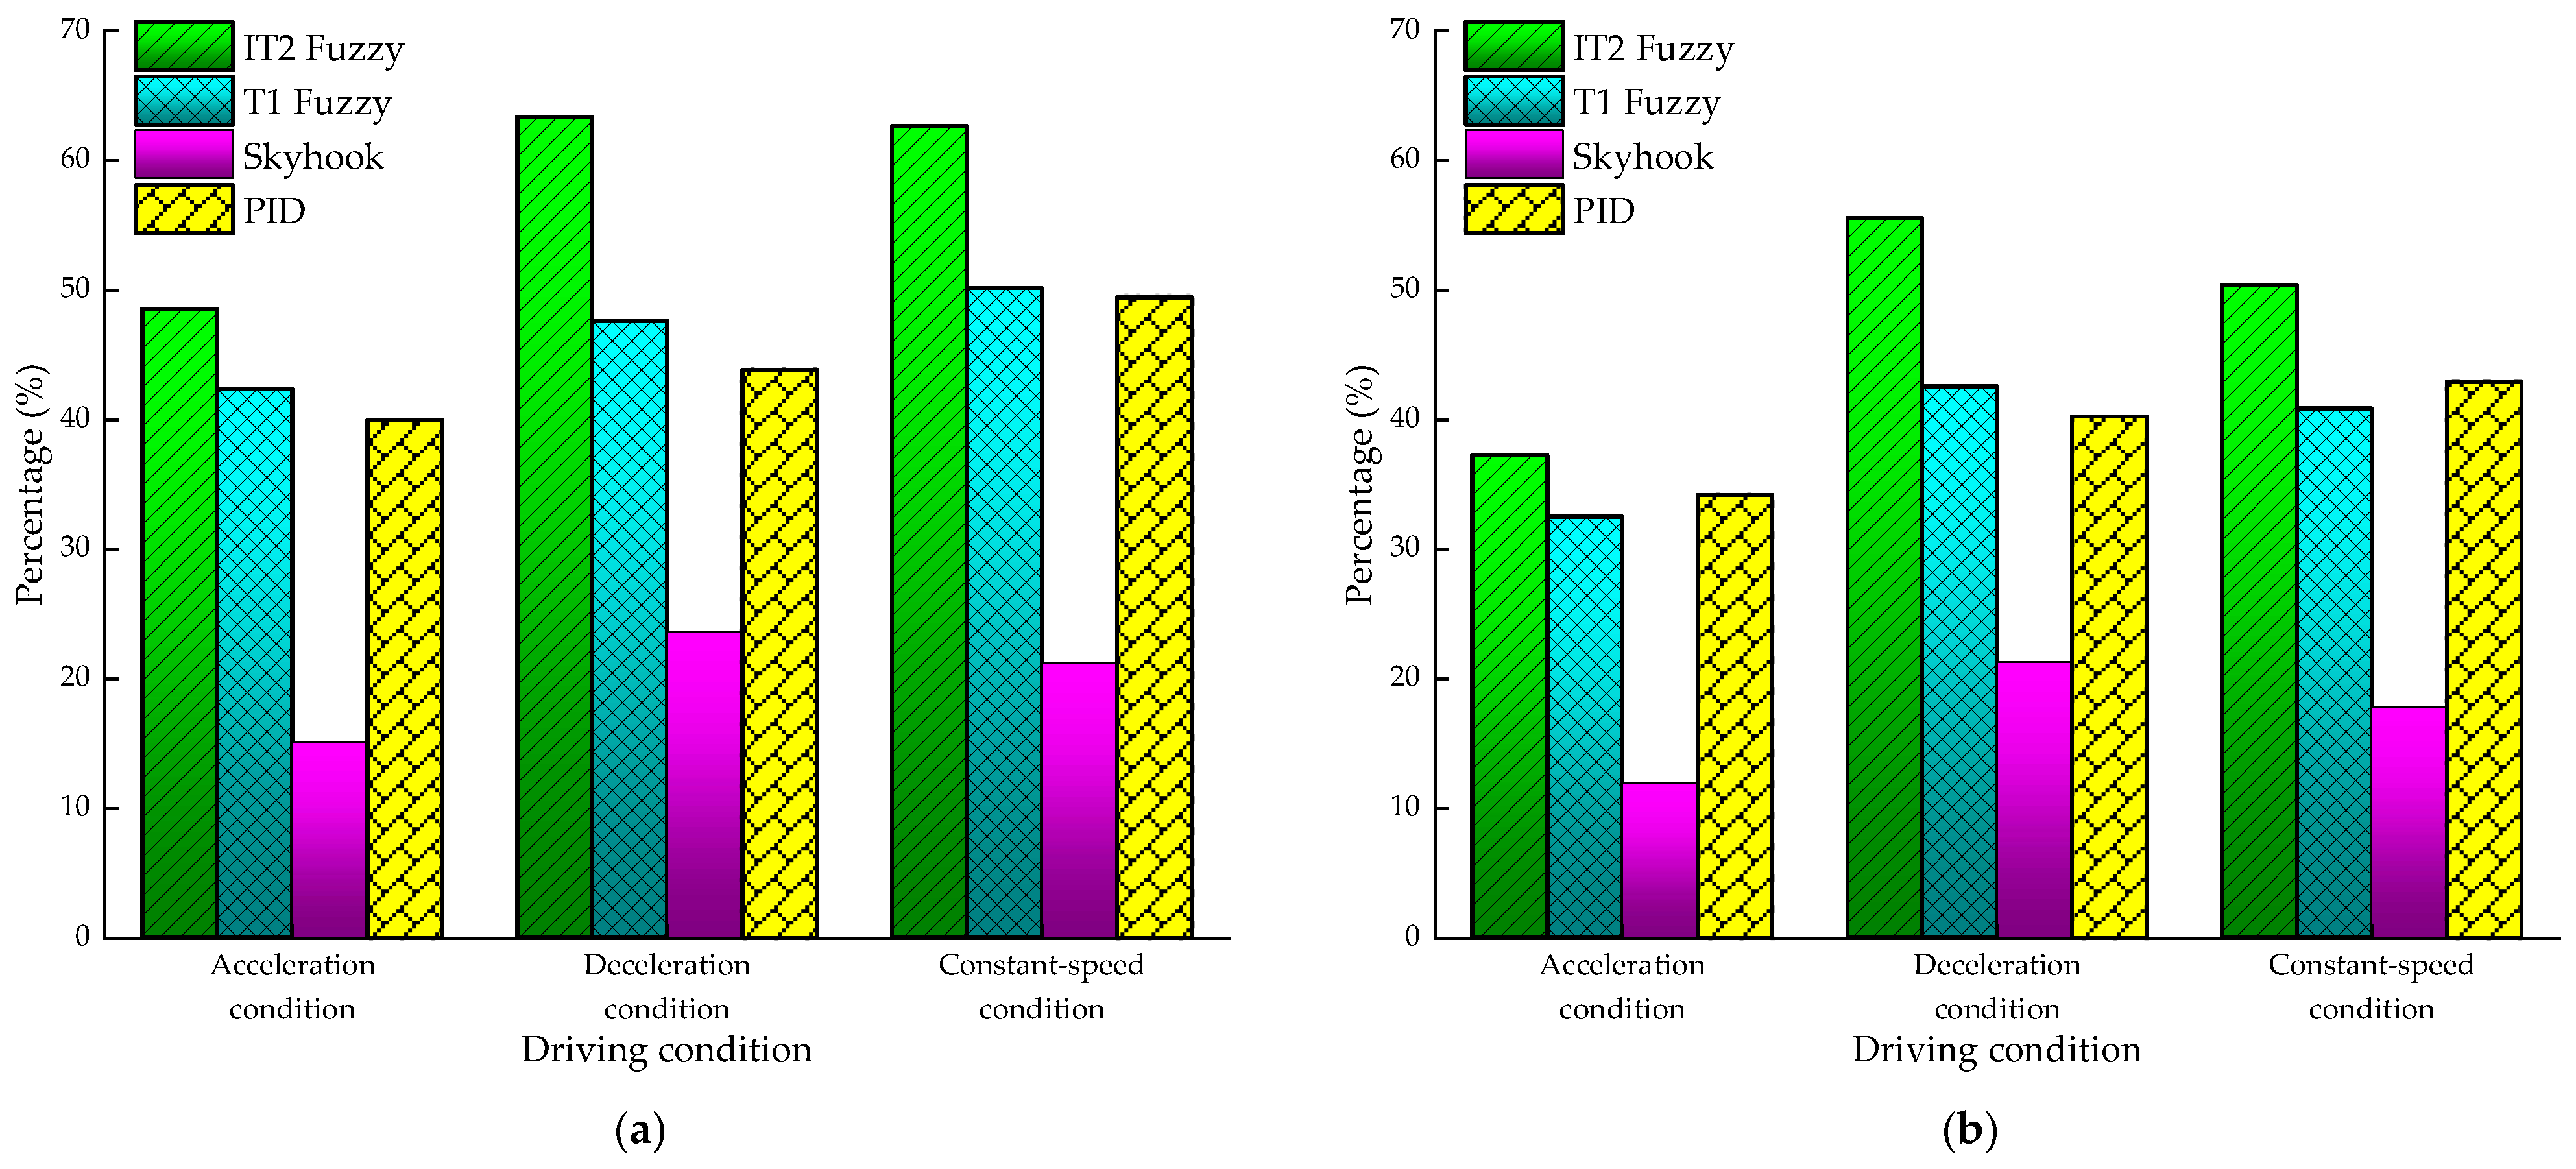
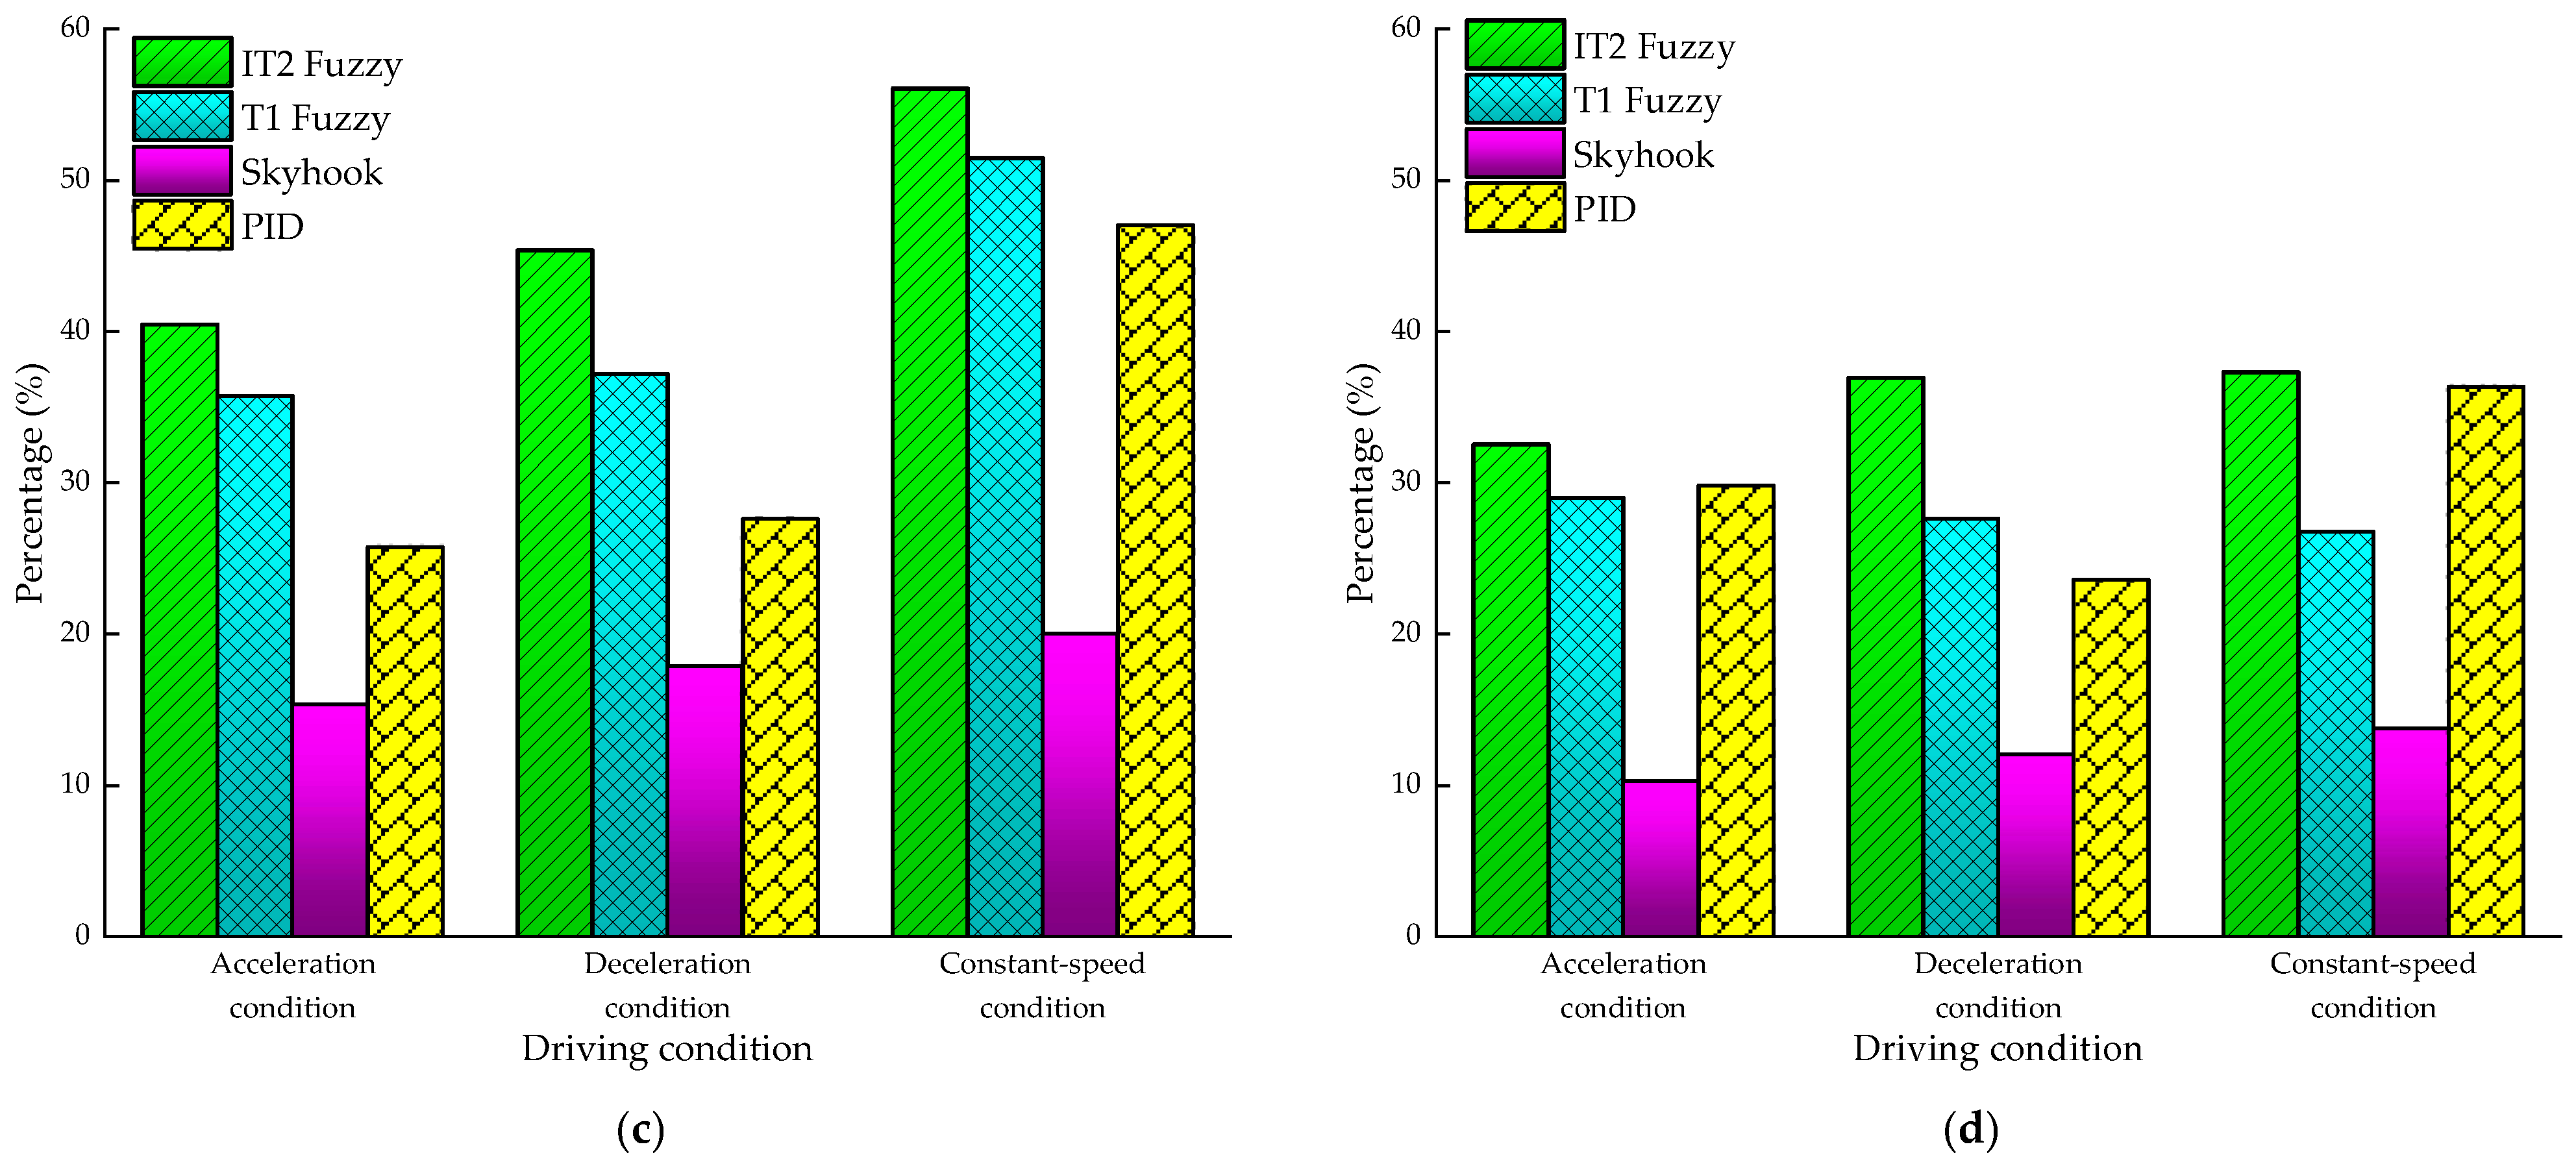
Figure 14, Figure 15 and Figure 16 illustrate the dynamic tire load responses of each wheel under various control strategies during acceleration, deceleration, and constant-speed driving, respectively. The corresponding statistical characteristics and peak values for the IT2 fuzzy, T1 fuzzy, skyhook, PID, and passive suspension systems are summarized in Table 4, where the percentages in parentheses indicate the reductions in root mean square (RMS) and peak values relative to the passive baseline. As shown in Table 4, the dynamic tire load responses of the middle and rear wheels exhibit only minor differences under the three driving conditions, mainly because these two axles are connected through a balanced suspension system and have a relatively short wheelbase. Therefore, to improve the readability of the comparative results and avoid redundant graphical information, Figure 17 presents only the reduction percentages of the front and rear wheel dynamic loads, including both RMS and peak values, under different driving conditions.
Figure 14.
Dynamic tire load responses of each wheel under different control strategies in the acceleration condition: (a) front wheel dynamic load; (b) middle wheel dynamic load; (c) rear wheel dynamic load.
Figure 15.
Dynamic tire load responses of each wheel under different control strategies in the deceleration condition: (a) front wheel dynamic load; (b) middle wheel dynamic load; (c) rear wheel dynamic load.
Figure 16.
Dynamic tire load responses of each wheel under different control strategies in the constant-speed condition: (a) front wheel dynamic load; (b) middle wheel dynamic load; (c) rear wheel dynamic load.
Table 4.
Comparison of RMS and peak values of dynamic tire loads under different control strategies and driving conditions.
Figure 17.
Reduction percentages of the four control strategies compared with the passive system under different driving conditions: (a) RMS values of front wheel dynamic load; (b) RMS values of rear wheel dynamic load; (c) peak values of front wheel dynamic load; (d) peak values of rear wheel dynamic load.
As shown in Figure 14, the amplitudes of dynamic tire loads for all wheels increase progressively over time during acceleration. Vehicles equipped with semi-active control strategies exhibit a significant reduction in load amplitudes. The front wheel experiences higher dynamic loads than the middle and rear wheels, while the middle and rear wheels show nearly identical responses due to the adoption of a balanced suspension configuration. It is evident from Figure 14 and Figure 17 and Table 4 that the IT2 fuzzy control strategy provides the most pronounced improvement under acceleration conditions. Compared with the passive suspension, the RMS and peak values of the front wheel dynamic load are reduced by 48.57% and 40.48%, respectively, while those of the middle and rear wheels decrease by 37.27% and 32.50%, respectively. In contrast, the skyhook control exhibits the least effectiveness, with reductions in RMS and peak values for all wheels limited to approximately 10% to 15%. The T1 fuzzy control and PID control show comparable performance for both front and rear wheels but remain inferior to the IT2 fuzzy control. Overall, the IT2 fuzzy control significantly enhances road-holding capability, improves handling stability, and mitigates road surface damage.
Figure 15 illustrates that the amplitudes of dynamic tire loads decrease over time during deceleration. For vehicles with semi-active control, a substantial reduction in load amplitude is observed after approximately 2 s. The control strategies have a more pronounced effect on the front wheel than on the middle and rear wheels. Among the four strategies, the IT2 fuzzy control consistently achieves the greatest reduction in dynamic tire loads. Quantitative results from Figure 15, Figure 17 and Table 4 indicate that the IT2 fuzzy control reduces the RMS and peak values of the front wheel dynamic load by 63.39% and 45.39%, respectively, compared with the passive system. The T1 fuzzy control yields the second-best performance, with an RMS reduction of 47.65% and a peak reduction of 37.21%. Meanwhile, the skyhook control shows the smallest improvement, with reductions of 23.64% for the RMS value and 17.89% for the peak value. The semi-active front suspension also significantly influences the dynamic loads of the middle and rear wheels, with the IT2 fuzzy control again demonstrating superior performance among all strategies.
As shown in Figure 16, the influence of semi-active control strategies on dynamic tire loads is not significant within the first 1.5 s of constant-speed driving. However, after approximately 2 s, all four control strategies markedly reduce the load amplitudes. Among them, the IT2 fuzzy control achieves the most substantial reduction, thereby improving tire–road contact performance. According to Figure 16 and Figure 17 and Table 4, the IT2 fuzzy control significantly decreases both RMS and peak values of dynamic tire loads for all wheels under the constant-speed condition. Compared with the passive suspension, the reductions for the front wheel reach 62.67% for the RMS and 56.08% for the peak, while the middle and rear wheels exhibit identical reductions of 50.39% and 37.31% for the RMS and peak values, respectively. The T1 fuzzy control outperforms PID control in reducing the front wheel loads, whereas PID control achieves better reductions for the middle and rear wheels.
A comprehensive comparison of the three operating conditions summarized in Table 4 indicates that, for the passive suspension system, the RMS values of dynamic tire loads under acceleration are lower than those observed during constant-speed cruising, although the corresponding peak values are slightly higher. Under deceleration, both the RMS and peak values exceed those under the constant-speed condition, suggesting that non-stationary driving, particularly braking, induces more severe tire–road interactions and presents a greater potential for road surface damage. To further assess the wheel–road contact condition, the peak dynamic tire loads were compared with the corresponding static vertical loads. Based on the vehicle parameters, the static vertical loads of the front, middle, and rear wheels are approximately 53.68 kN, 19.46 kN, and 19.46 kN, respectively. Tire–road contact loss may occur when the total vertical tire load becomes zero or negative; therefore, a peak dynamic tire load exceeding the corresponding static load indicates a potential risk of contact loss during the unloading phase. According to Table 4, the IT2 fuzzy control maintains the peak dynamic tire loads of all wheels below their corresponding static loads under the three driving conditions, indicating superior wheel–road contact stability. In contrast, the passive suspension and skyhook control show a higher risk of contact loss, especially under deceleration, while PID control also exhibits potential contact loss mainly at the front wheel under severe transient conditions. The integration of a semi-active front suspension system using MR dampers is therefore effective in reducing tire dynamic load fluctuations and enhancing road adhesion capability. Among the evaluated strategies, the IT2 fuzzy control consistently demonstrates the best performance by fully utilizing the real-time adjustable damping characteristics of the MR dampers, thereby ensuring more stable tire–road contact and reducing the destructive effect of vehicle dynamic loading on road infrastructure under complex non-stationary driving maneuvers.
4.3. Comparative Analysis of Ride Comfort
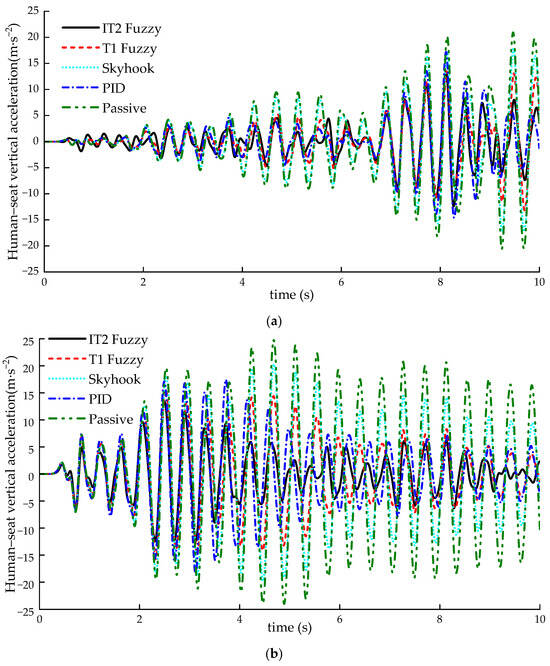
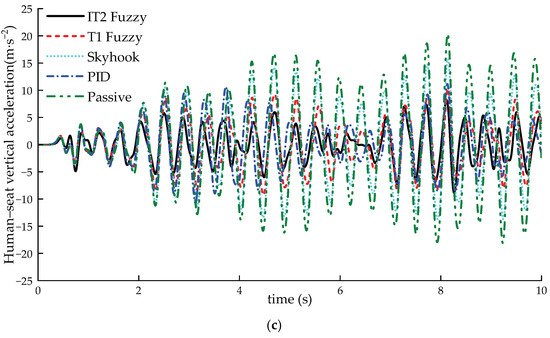
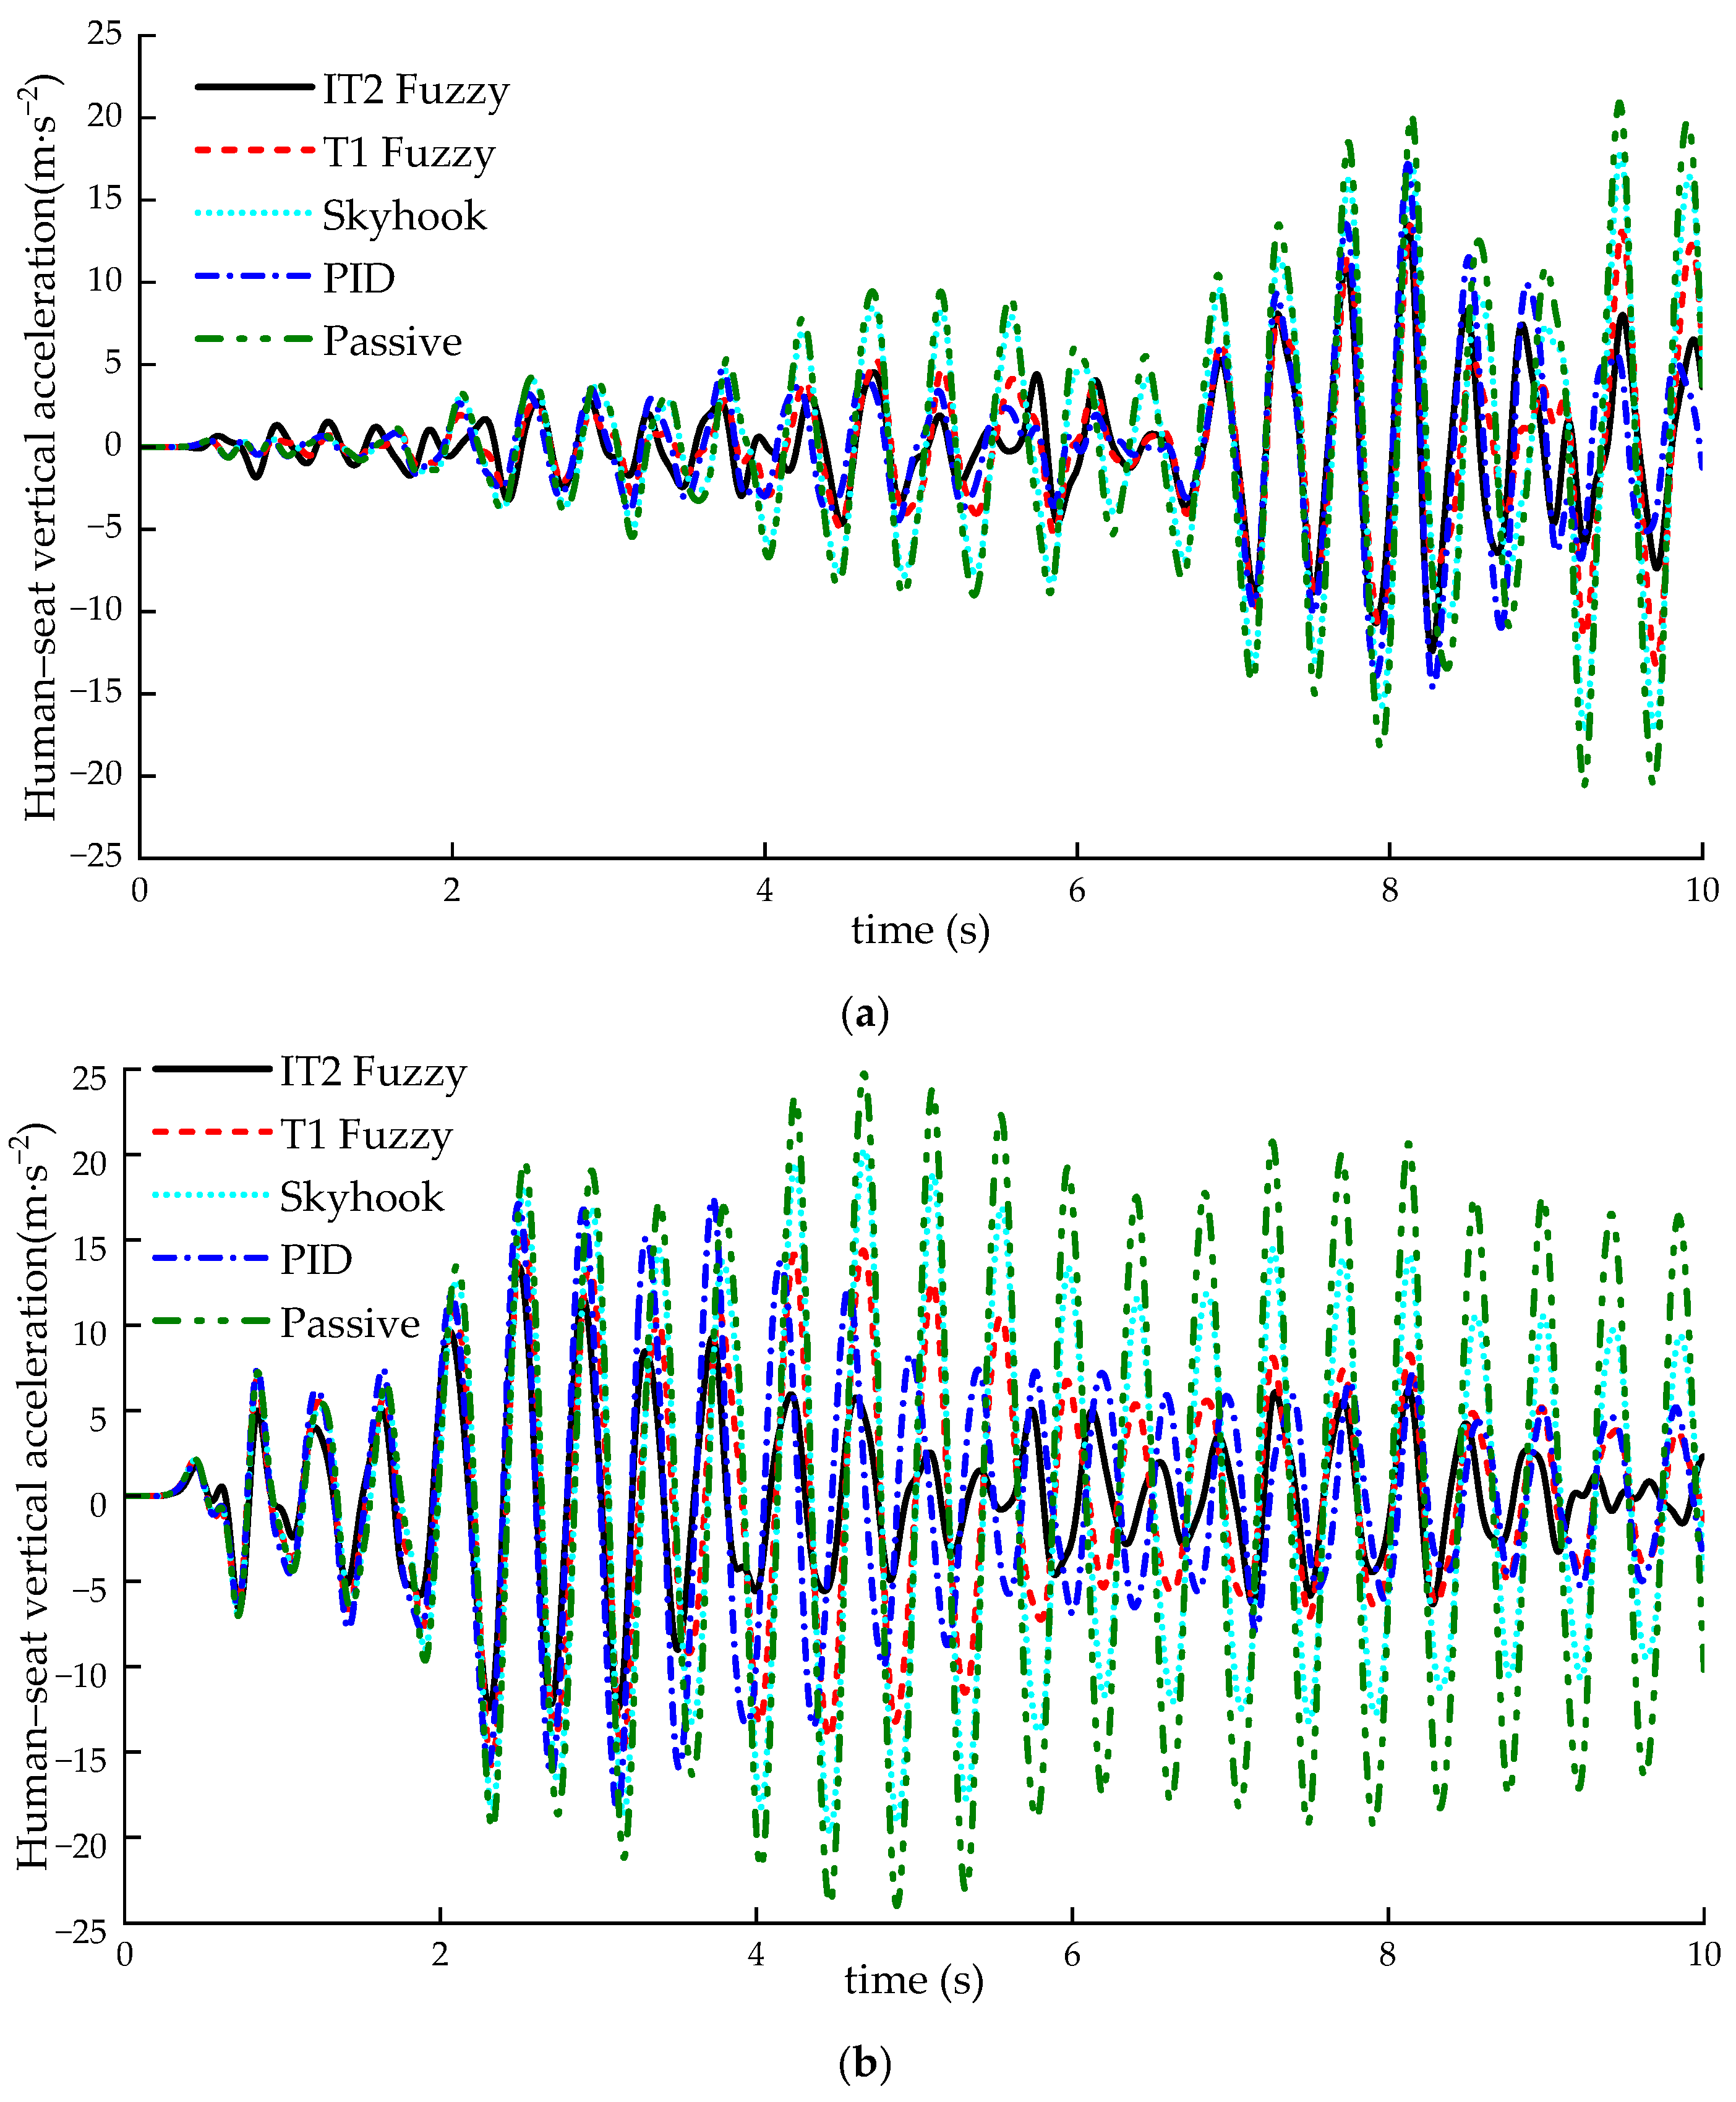
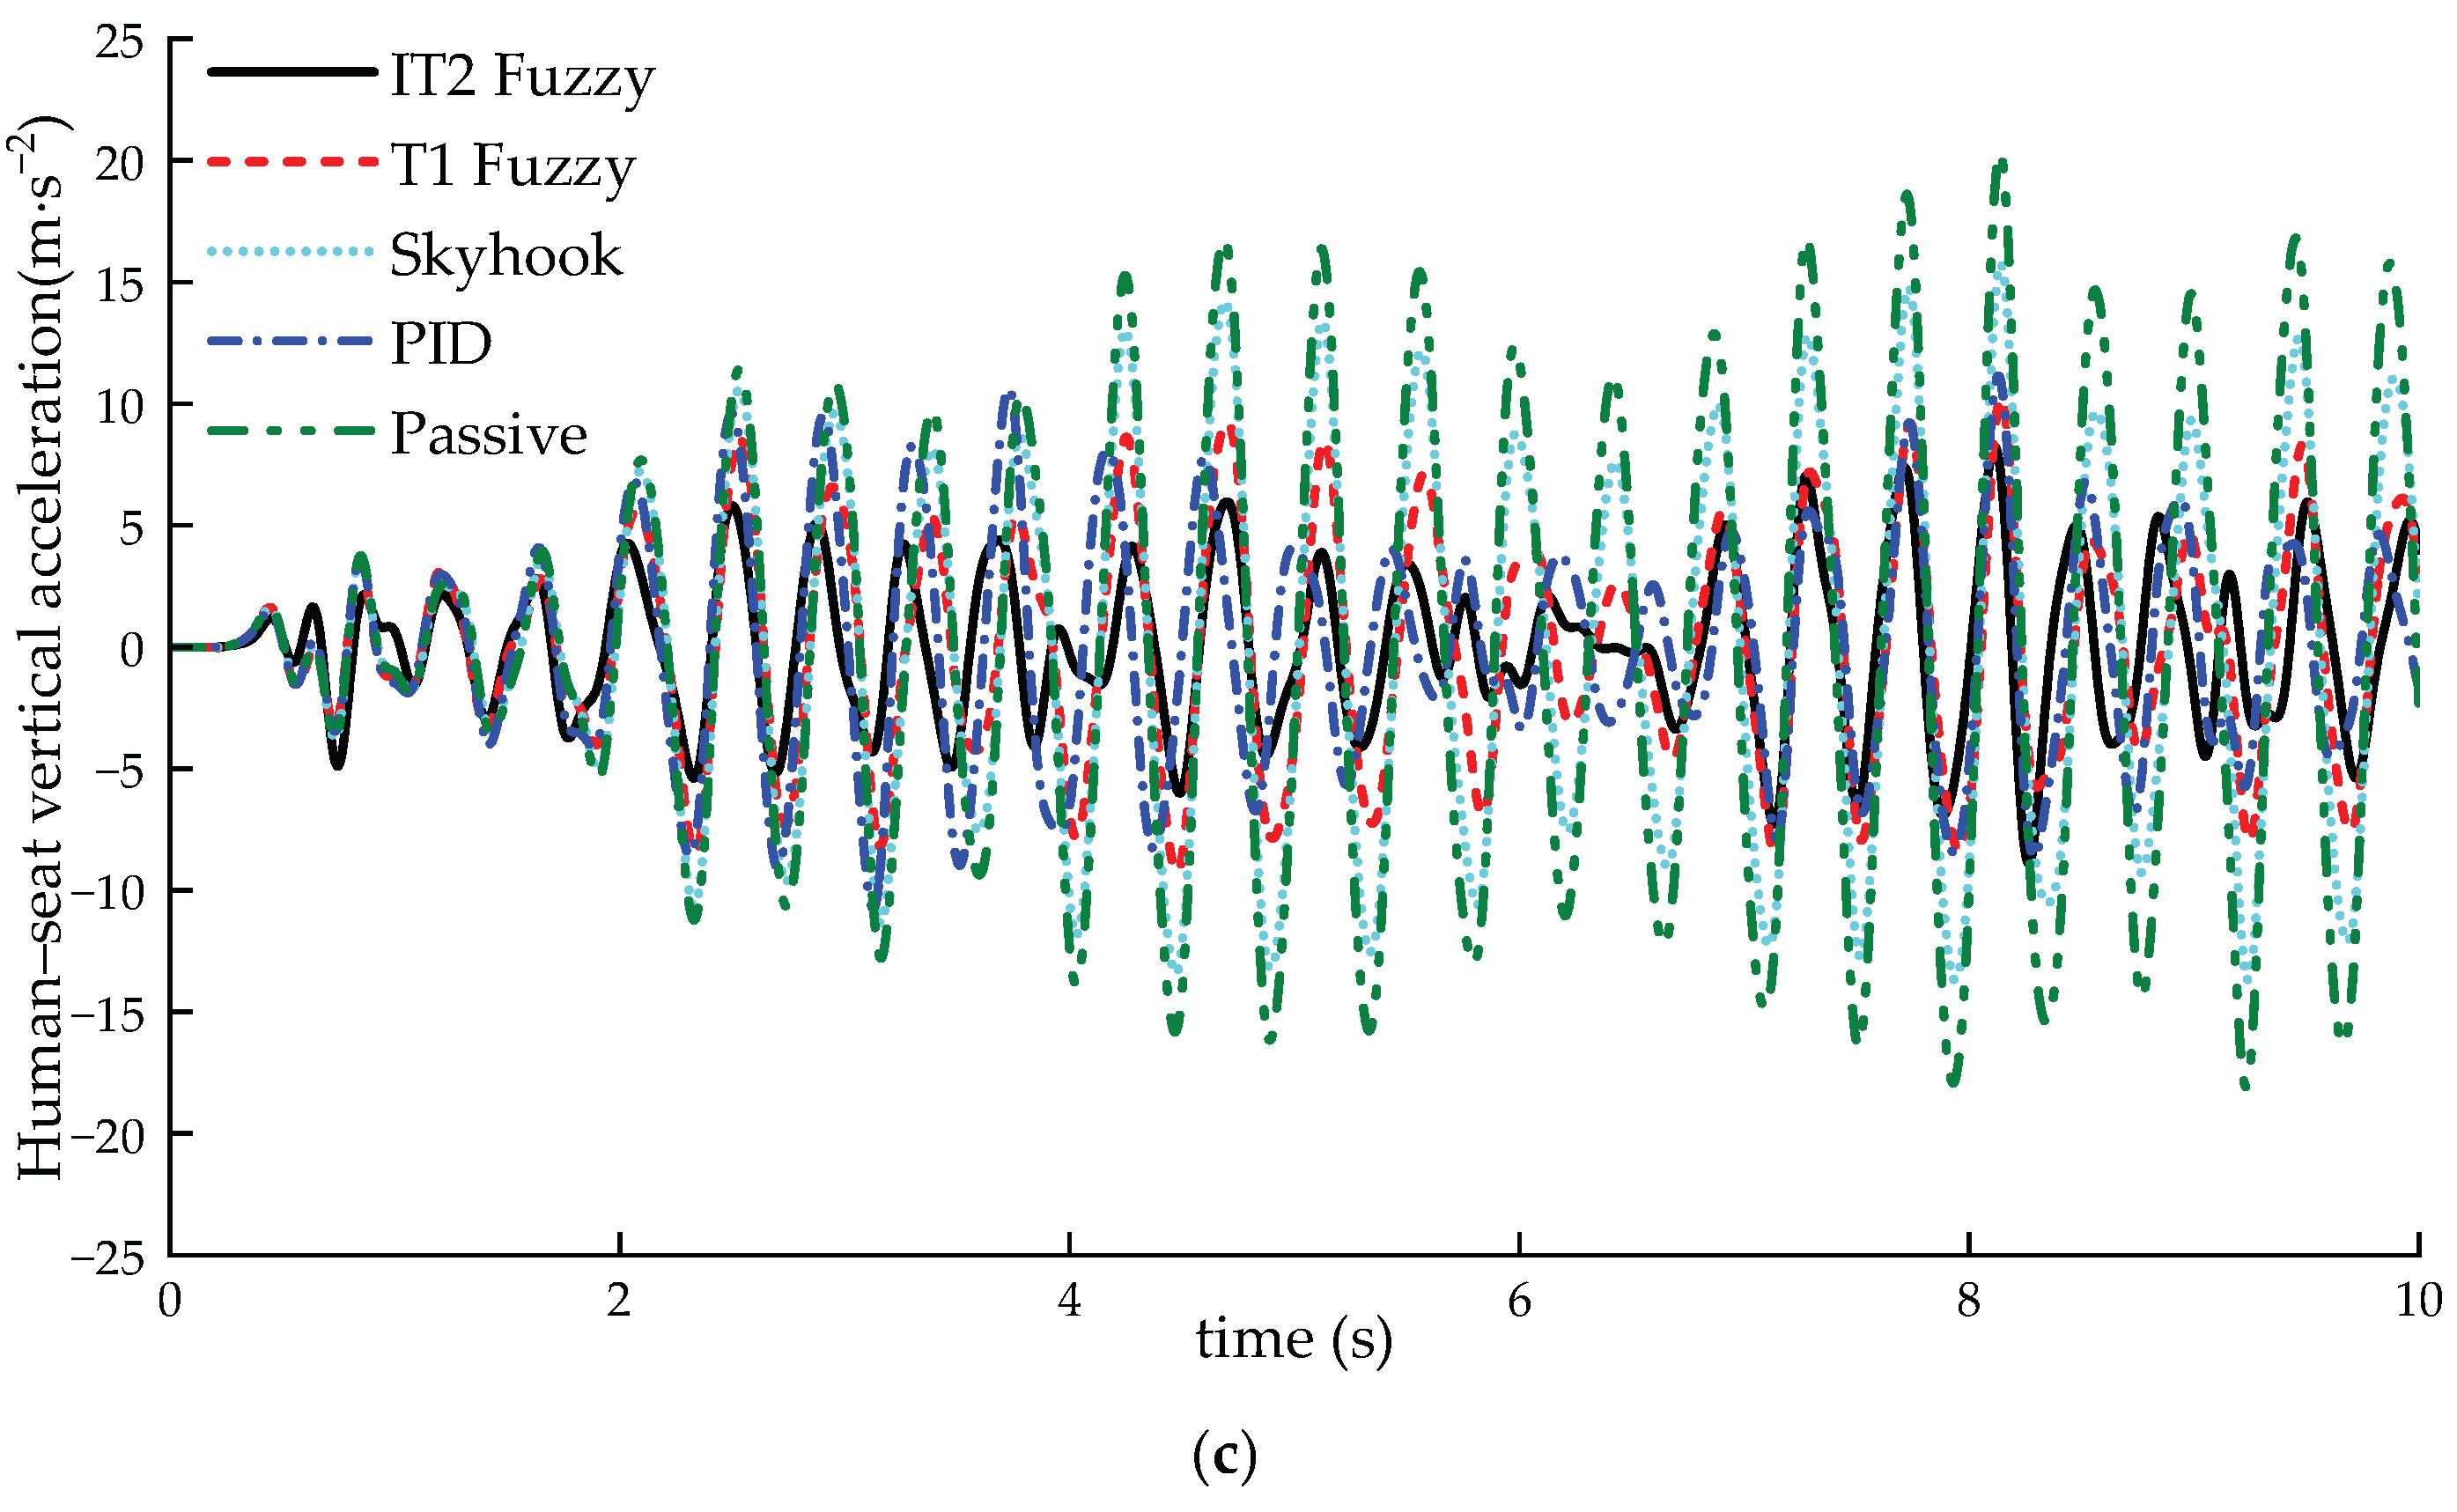
Figure 18 and Figure 19 present the comparative vibration response curves and the corresponding reduction percentages of human–seat vertical acceleration for the four control strategies relative to the passive suspension system under different driving conditions. As shown in Figure 18, for the passive suspension, the peak vertical acceleration of the human–seat system increases progressively after approximately 4 s during acceleration. Under the deceleration condition, the vertical acceleration rises sharply due to the rapid reduction in vehicle speed and then gradually decreases. During constant-speed driving, the acceleration amplitude increases with the intensity of road excitation. In contrast, the vehicle equipped with a semi-active front suspension system incorporating MR dampers exhibits a significant attenuation in vertical acceleration amplitude, highlighting the effectiveness of adaptive damping control. Among the four strategies, the IT2 fuzzy control provides the most pronounced vibration suppression, outperforming the T1 fuzzy control, PID control, and skyhook control.
Figure 18.
Comparative vibration response curves of human–seat vertical acceleration for various control strategies under different driving conditions: (a) acceleration condition; (b) deceleration condition; (c) constant-speed condition.
Figure 19.
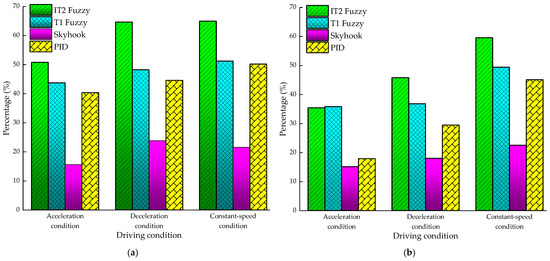
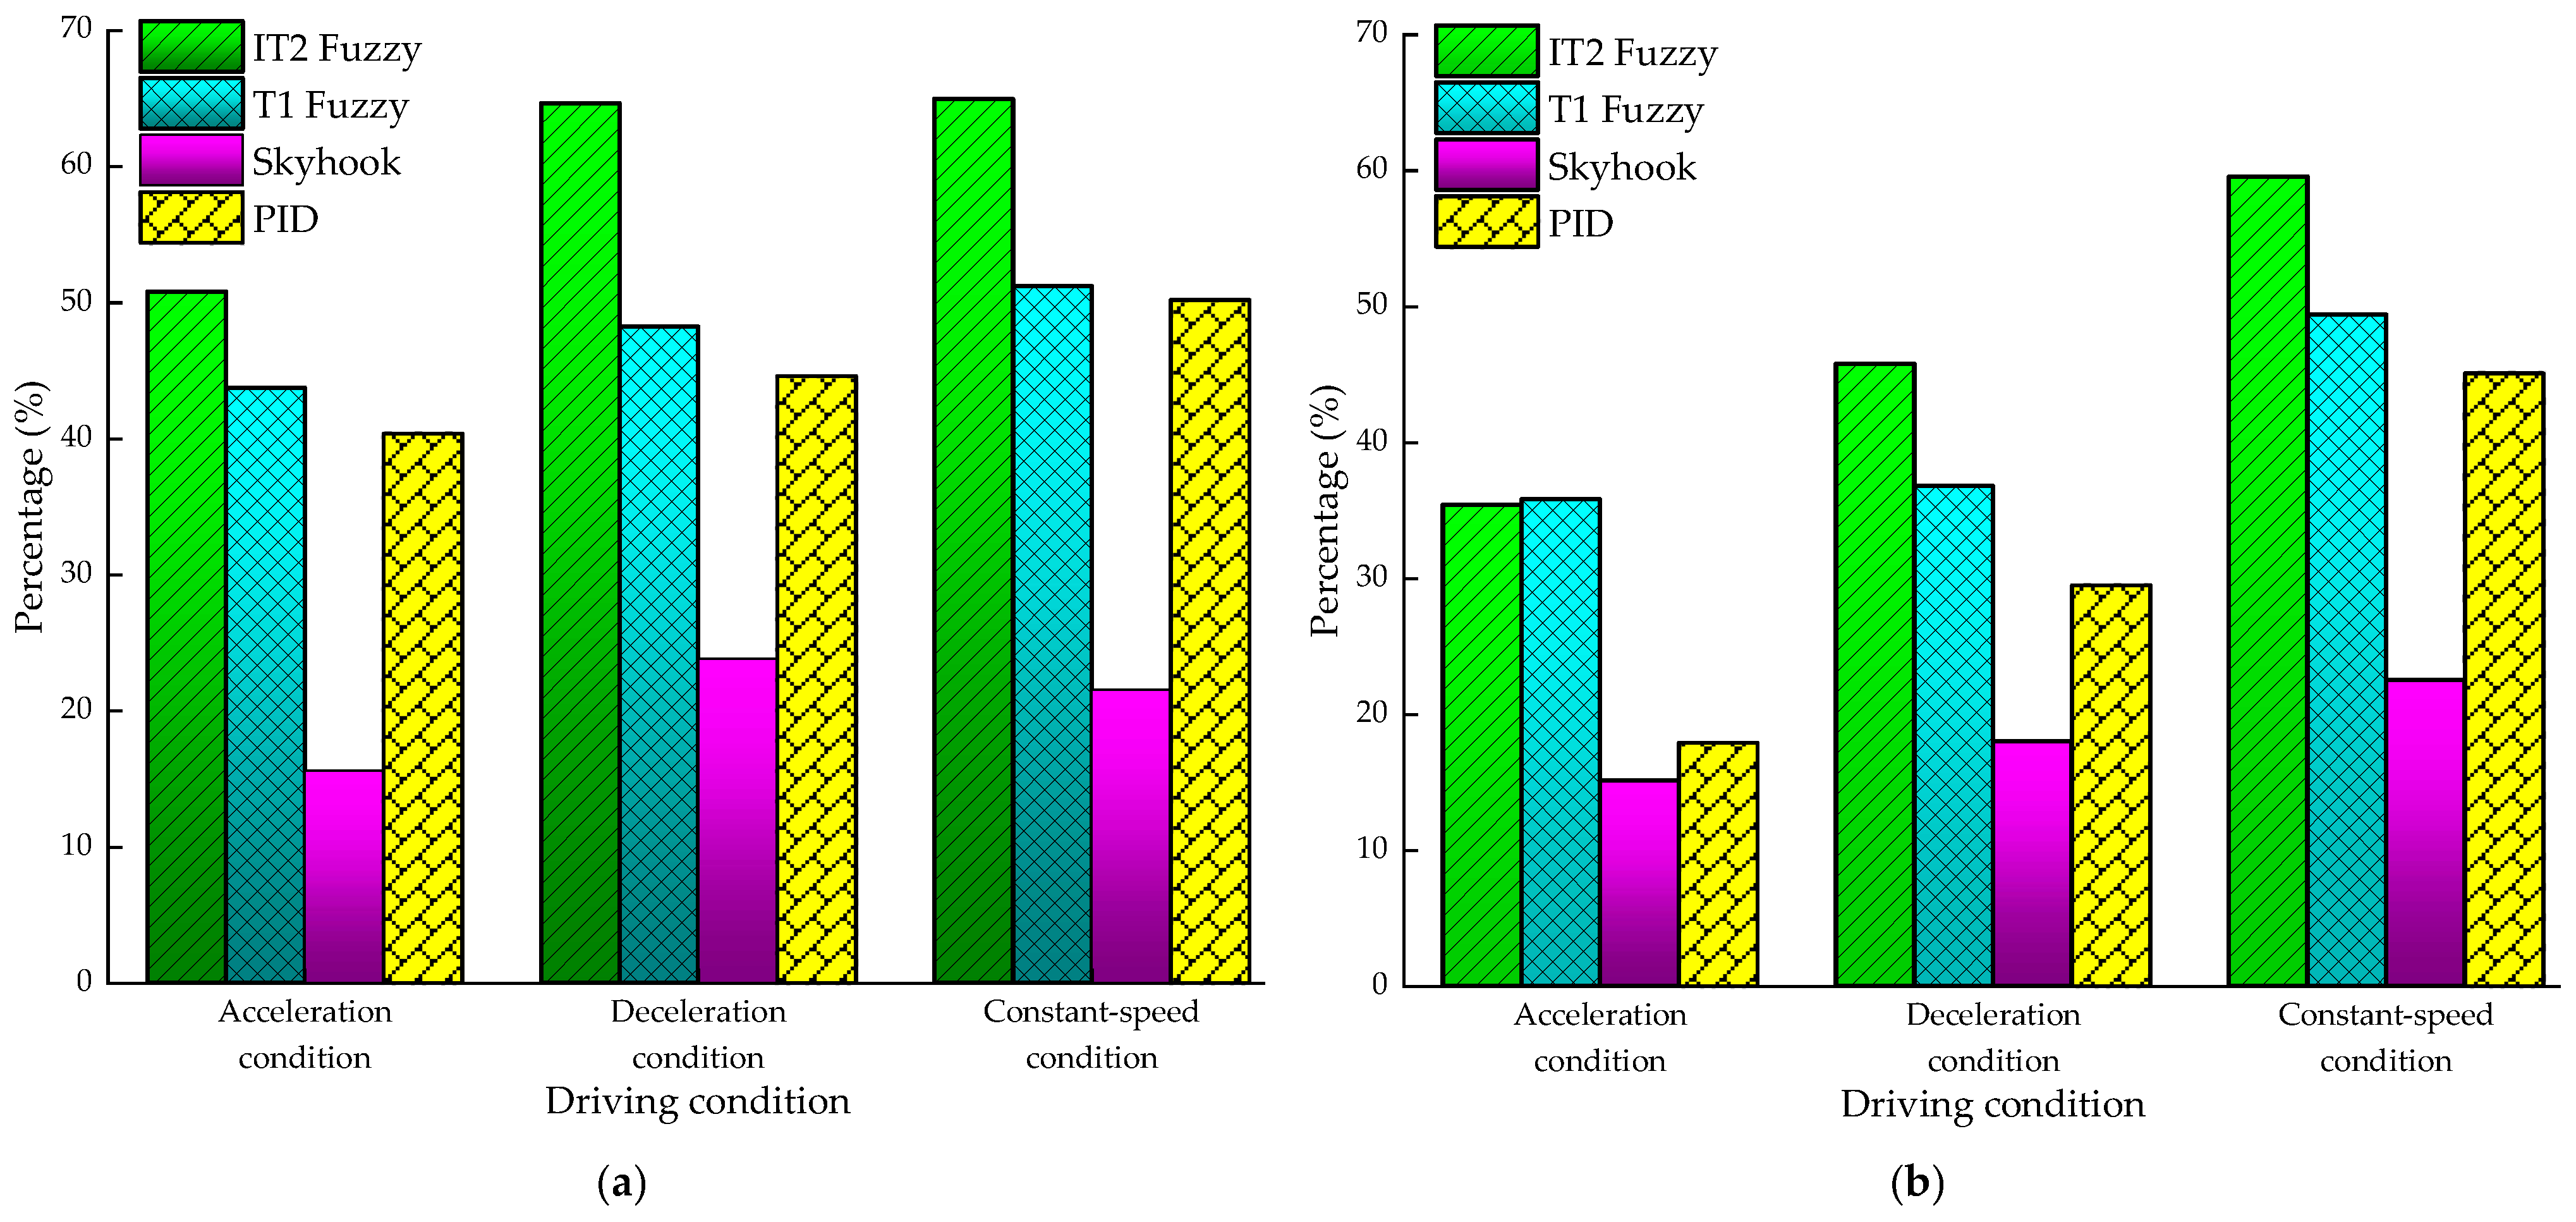
Reduction percentage of the four control strategies compared with the passive system under different driving conditions: (a) RMS values of human–seat vertical acceleration; (b) peak values of human–seat vertical acceleration.
As illustrated in Figure 19, under the passive suspension system, the deceleration condition results in the largest RMS and peak values of human–seat vertical acceleration, indicating the poorest ride comfort. Although the acceleration condition yields the lowest RMS value, its relatively higher peak value compared with the constant-speed condition still degrades comfort performance. In comparison, the semi-active suspension system markedly improves ride comfort across all driving conditions. Specifically, the IT2 fuzzy control achieves the greatest enhancement, with improvements of 64.67%, 50.82%, and 64.97% under deceleration, acceleration, and constant-speed conditions, respectively. The T1 fuzzy control provides moderate improvements of 48.25%, 43.77%, and 51.21%, while the PID control shows slightly inferior performance relative to the T1 fuzzy control. The skyhook control exhibits the least effectiveness, with improvements of 23.84%, 15.63%, and 21.56% under the respective conditions. Overall, these results demonstrate that the integration of an MR damper-based semi-active front suspension, particularly when coupled with the IT2 fuzzy control strategy, can effectively suppress human–seat vibration responses and significantly enhance ride comfort under both steady-state and non-stationary driving conditions.
5. Conclusions
This study investigated the dynamic tire load and ride comfort of an HPHDT under non-stationary excitations using a 6DOF simulation model developed in MATLAB/Simulink (R2025b). The results indicate that non-stationary driving conditions, particularly deceleration, significantly amplify vehicle vibrations and tire–road interactions compared to steady-state cruising. For the passive suspension system, the deceleration scenario represents the most critical operating condition, yielding the highest peak and RMS values for both tire dynamic loads and vertical acceleration. This highlights the necessity of semi-active intervention to mitigate road infrastructure damage and ensure passenger comfort during rapid changes in vehicle velocity.
The implementation of a semi-active front suspension system incorporating MR dampers effectively attenuates dynamic tire loads across all axles under varying driving scenarios. While the front wheels experience higher loads during acceleration, the balanced suspension configuration ensures nearly identical responses for the middle and rear wheels. Among the evaluated control strategies, the IT2 fuzzy control demonstrates superior performance by reducing the front-wheel RMS dynamic load by 48.57% during acceleration, 63.39% during deceleration, and 62.67% during constant-speed driving relative to the passive baseline. This strategy consistently outperforms T1 fuzzy, PID, and skyhook controls, providing more robust road adhesion and handling stability by effectively leveraging the adaptive damping capabilities of the MR dampers.
Regarding ride comfort, the semi-active control strategies significantly suppress human–seat vertical acceleration, with the IT2 fuzzy control achieving the most pronounced improvements of 64.67% during deceleration and 64.97% during constant-speed cruising. Although T1 fuzzy and PID controls offer moderate benefits, the skyhook control remains the least effective method for improving the vibration isolation performance of the heavy-duty truck. Ultimately, the integration of an MR damper-based semi-active front suspension coupled with an IT2 fuzzy control strategy provides a highly effective solution for balancing road friendliness and ride quality. This configuration ensures that HPHDTs maintain operational stability and reduced road impact even under complex, non-stationary driving maneuvers.
Author Contributions
Conceptualization, X.C., Z.W. and J.Y.; methodology, X.C. and Z.W.; software, X.C. and Y.Q.; validation, X.C., Z.W. and Y.Q.; formal analysis, X.C., Z.W. and G.L.; investigation, X.C., J.Y., G.L. and N.J.; writing—original draft preparation, X.C. and Y.Q.; writing—review and editing, X.C., Z.W., J.Y., G.L. and N.J.; visualization, Y.Q.; supervision, Z.W. All authors have read and agreed to the published version of the manuscript.
Funding
This research was funded by the Wenzhou Major Science and Technology Innovation Project, grant number ZF2024007; Henan Province Science and Technology Research Project, grant number 262102240085; Henan Provincial Key Research Projects for Colleges and Universities, grant numbers 25A460022, 25B460010, and 26B460005; and Henan Institute of Technology High-level Talent Startup Funding Project, grant number KQ2419.
Data Availability Statement
The original contributions presented in this study are included in the article. Further inquiries can be directed to the corresponding author.
Conflicts of Interest
Author Zhelu Wang is a faculty member at Yongjia College, Wenzhou Polytechnic, and only provides technical consulting services for Zhejiang Deli Connector Co., Ltd. There are no potential commercial or financial interests related to the research content of this manuscript that need to be declared.
References
- Kotlars, A.; Hudenko, J.; Jurgelane-Kaldava, I.; Stankevičienė, J.; Gailis, M.; Kukjans, I.; Batenko, A. Transitioning to hydrogen trucks in small economies: Policy, infrastructure, and innovation dynamics. Sustainability 2025, 17, 11272. [Google Scholar] [CrossRef] [Scilit]
- Ma, M.; Xu, E.; Zheng, W.; Qin, J.; Huang, Q. The optimized real-time energy management strategy for fuel-cell hybrid trucks through dynamic programming. Int. J. Hydrogen Energy 2024, 59, 10–21. [Google Scholar] [CrossRef] [Scilit]
- Li, Y.; Zuo, Q.; Liu, X.; Kou, C.; Chen, J.; Zhu, G.; Wang, H.; Ning, D.; Chen, W. Performance analysis of a large-displacement hydrogen direct injection engine designed for zero-carbon heavy-duty truck. J. Clean. Prod. 2026, 552, 147928–147945. [Google Scholar] [CrossRef] [Scilit]
- Liu, R.; Zhu, X.; Wang, X.; Xiang, R.; Su, L.; Chu, X.; Zhou, W. Design and performance investigation on adjustable ejector with petal spindle valve for high-power fuel cell adapted heavy-duty truck powertrain. Appl. Energy 2025, 390, 125774–125796. [Google Scholar] [CrossRef] [Scilit]
- Zhu, Y.; Bu, Y.; Gao, W.; Xie, F.; Guo, W.; Li, Y. Numerical study on thermodynamic coupling characteristics of fluid sloshing in a liquid hydrogen tank for heavy-duty trucks. Energies 2023, 16, 1851. [Google Scholar] [CrossRef] [Scilit]
- Yun, D.S.; Lim, B.C. Real-time axle-load sensing and AI-enhanced braking-distance prediction for multi-axle heavy-duty trucks. Appl. Sci. 2026, 16, 1547. [Google Scholar] [CrossRef] [Scilit]
- Shi, P.; Ni, G.; Jin, R.; Wang, H.; Wang, J.; Sun, Z.; Qiu, G. Multi-timescale battery-charging optimization for electric heavy-duty truck battery-swapping stations, considering source–load–storage uncertainty. Energies 2025, 18, 241. [Google Scholar] [CrossRef] [Scilit]
- Tota, A.; Dimauro, L.; Velardocchia, F.; Paciullo, G.; Velardocchia, M. An intelligent predictive algorithm for the anti-rollover prevention of heavy vehicles for off-road applications. Machines 2022, 10, 835. [Google Scholar] [CrossRef] [Scilit]
- Dimauro, L.; Tota, A.; Galvagno, E.; Velardocchia, M. Torque allocation of hybrid electric trucks for drivability and transient emissions reduction. Appl. Sci. 2023, 13, 3704. [Google Scholar] [CrossRef] [Scilit]
- Xiong, Y.; Liu, S.; Gong, M.; Jiang, L.; Cai, X.; Wang, H.; Xu, T.; Hong, J. Triaxial contact stress characterization for autonomous rail rapid transit pavements using coupled vehicle-pavement dynamic simulation. Int. J. Solids Struct. 2026, 327, 113809–113830. [Google Scholar] [CrossRef] [Scilit]
- Hai, R.; Meng, K.; Miao, J.; Zhou, R.; Xu, R.; Zhang, H.; Huang, J. Real-time visual monitoring and analysis of fuel cell heavy-duty truck power systems using deep learning-enhanced image processing algorithms. Trait. Du Signal 2025, 42, 2053–2063. [Google Scholar] [CrossRef] [Scilit]
- Thang, P.T.; Tu, D.T.; Huy Hai, D.; Van Tan, V. Active and semi-active strategies using PID control method for heavy-duty truck roll stability system. Proc. Inst. Mech. Eng. Part D J. Automob. Eng. 2025, 1–18. [Google Scholar] [CrossRef] [Scilit]
- Zhou, X.; Ma, N.; Liu, J.; Zhang, J.; Li, L. Experimental study on vibration isolation performance of mining dump truck suspensions for improving ride comfort. J. Vibroeng. 2025, 27, 1525–1543. [Google Scholar] [CrossRef] [Scilit]
- Yang, T.; Sun, J.; Liu, Z.; Wang, J. Research on suspension systems control for heavy duty transport vehicles under extreme operating conditions considering handling stability. Transp. Res. Rec. J. Transp. Res. Board 2025, 2679, 313–327. [Google Scholar] [CrossRef] [Scilit]
- Zhang, X.; Liu, F.; Dong, L.; Guo, H.; Zhang, X.; Chen, W. Adaptive sliding mode control for automatic leveling of a heavy-duty AGV with hydraulic actuators as the active suspension systems. J. Braz. Soc. Mech. Sci. 2025, 47, 73. [Google Scholar] [CrossRef] [Scilit]
- Theunissen, J.; Tota, A.; Gruber, P.; Dhaens, M.; Sorniotti, A. Preview-based techniques for vehicle suspension control: A state-of-the-art review. Annu. Rev. Control 2021, 51, 206–235. [Google Scholar] [CrossRef] [Scilit]
- Sebesta, K.; Zacek, J.; Salva, M. Experimental device for testing of semi-active magnetorheological damper. MM Sci. J. 2023, 2023, 6407–6412. [Google Scholar] [CrossRef] [Scilit]
- Chen, C.; Ma, R.; Ma, W. Magnetic circuit design of MR controller for improving the performance of the suspension. Trans. Can. Soc. Mech. Eng. 2023, 47, 410–422. [Google Scholar] [CrossRef] [Scilit]
- Dong, X.; Geng, T.; Li, X. Grey human simulated intelligent control of magnetorheological semi-active and electromagnetic active seat suspension. Smart Mater. Struct. 2025, 34, 125013–125035. [Google Scholar] [CrossRef] [Scilit]
- Chen, X.; Wang, Z.; Shi, H.; Jiang, N.; Zhao, S.; Qiu, Y.; Liu, Q. Review of agricultural machinery seat semi-active suspension systems for ride comfort. Machines 2025, 13, 246. [Google Scholar] [CrossRef] [Scilit]
- Zhang, K.; As’arry, A.; Zhu, L.; Hairuddin, A.A.; Hassan, M.K.; Md Zain, M.Z. Enhancing ride comfort of semi-active suspension through collaboration control using dung beetle optimizer optimized Fuzzy PID controller. Adv. Mech. Eng. 2025, 17, 1–14. [Google Scholar] [CrossRef] [Scilit]
- Chen, Y.; Jiang, M.; Yang, F.; Qian, R.; Zhai, R.; Wang, H.; Xv, S. Research on dynamic modeling and control of magnetorheological hydro-pneumatic suspension. Actuators 2025, 14, 73. [Google Scholar] [CrossRef] [Scilit]
- Ata, W.G.; Salem, A.M. Semi-active control of tracked vehicle suspension incorporating magnetorheological dampers. Veh. Syst. Dyn. 2017, 55, 626–647. [Google Scholar] [CrossRef] [Scilit]
- Tang, X.; Du, H.; Sun, S.; Ning, D.; Xing, Z.; Li, W. Takagi–Sugeno fuzzy control for semi-active vehicle suspension with a magnetorheological damper and experimental validation. IEEE/ASME Trans. Mechatron. 2017, 22, 291–300. [Google Scholar] [CrossRef] [Scilit]
- Samaroo, K.; Awan, A.W.; Islam, S. Semi-active suspension design for an in-wheel-motor-driven electric vehicle using a dynamic vibration-absorbing structure and PID-controlled magnetorheological damper. Machines 2025, 13, 47. [Google Scholar] [CrossRef] [Scilit]
- Lee, J.; Oh, K. Hybrid damping mode MR damper: Development and experimental validation with semi-active control. Machines 2025, 13, 435. [Google Scholar] [CrossRef] [Scilit]
- Qin, L.; Yang, S.; Xu, X.; Dai, J.; Chen, Z.; Li, G. Design and performance analysis of a magnetorheological semi-active seat for armored vehicles. J. Vib. Eng. Technol. 2025, 13, 562. [Google Scholar] [CrossRef] [Scilit]
- Lu, J.; Wong, P.K.; Li, W.; Zheng, C.; Zhao, J. Robust fuzzy output feedback control for a magnetorheological semi-active air suspension system with time-delay and actuator saturation. J. Vib. Control 2025, 32, 1245–1264. [Google Scholar] [CrossRef] [Scilit]
- Liu, J.; Xu, L.; Zhang, K. Tire dynamic load characteristics analysis of heavy vehicles under non-stationary running condition. J. Vib. Shock 2020, 39, 109–114. [Google Scholar] [CrossRef]
- Wang, J.-C.; Zhang, S.-W.; Lou, J.-C.; Chen, S.-A. Asymptotic saturation magic formula model and time delay compensation control for a magnetorheological semi-active suspension. Veh. Syst. Dyn. 2025, 20, 1–21. [Google Scholar] [CrossRef] [Scilit]
- Wang, J.; Zhou, M.; Tong, J.; Liu, J.; Chen, S. Augmented kalman estimator and equivalent replacement based taylor series-lqg control for a magnetorheological semi-active suspension. Actuators 2024, 13, 138. [Google Scholar] [CrossRef] [Scilit]
- Chiu, M.-C.; Karkoub, M.; Her, M.-G. Two-dimensional car suspension energy harvesting system with road harmonic base excitation. Energy 2024, 304, 132108–132124. [Google Scholar] [CrossRef] [Scilit]
- Chen, S.-A.; Li, X.-W.; Wang, J.-C. High-order filtering white noises modulated by coherent and incoherent functions based road irregularities. IEEE Trans. Intell. Veh. 2024, 9, 3952–3963. [Google Scholar] [CrossRef] [Scilit]
- Quqa, S.; Siddiqui, M.A.; Zonzini, F.; Palermo, A. Identification of bridge curvature profiles from dynamic responses induced by moving vehicles using autoregressive models. Mech. Syst. Signal Process. 2025, 241, 113553–113571. [Google Scholar] [CrossRef] [Scilit]
- Shah, D.; Santos, M.M.D.; Chaoui, H.; Justo, J.F. Event-triggered non-switching networked sliding mode control for active suspension system with random actuation network delay. IEEE Trans. Intell. Transp. Syst. 2022, 23, 7521–7534. [Google Scholar] [CrossRef] [Scilit]
- Yang, L.; Wang, G.; Cui, H.; Liu, W.; Zhang, L. Longitudinal, lateral, and vertical coordinated control of active hydro-pneumatic suspension system based on model predictive control for mining dump truck. Machines 2026, 14, 133. [Google Scholar] [CrossRef] [Scilit]
- Mahmood, A.; Kat, C.-J.; Els, P.S. Ride comfort optimization with handling constraints over rough terrain. J. Terramechanics 2026, 122, 101105–101121. [Google Scholar] [CrossRef] [Scilit]
- Chen, Y. Design of sampling-based noniterative algorithms for centroid type-reduction of general type-2 fuzzy logic systems. Complex Intell. Syst. 2022, 8, 4385–4402. [Google Scholar] [CrossRef] [Scilit]
- Chen, Y. Design of weighted based divided-search enhanced Karnik–Mendel algorithms for type reduction of general type-2 fuzzy logic systems. Complex Intell. Syst. 2025, 11, 182. [Google Scholar] [CrossRef] [Scilit]
- Liu, X.; Yang, Z. Randomized algorithms for computing the fuzzy weighted average and the generalized centroid of an interval type-2 fuzzy set. Fuzzy Sets Syst. 2025, 518, 109508–109527. [Google Scholar] [CrossRef] [Scilit]
- ISO 8608:2016; Mechanical Vibration—Road Surface Profiles—Reporting of Measured Data. International Organization for Standardization (ISO): Geneva, Switzerland, 2016.

Disclaimer/Publisher’s Note: The statements, opinions and data contained in all publications are solely those of the individual author(s) and contributor(s) and not of MDPI and/or the editor(s). MDPI and/or the editor(s) disclaim responsibility for any injury to people or property resulting from any ideas, methods, instructions or products referred to in the content. |
© 2026 by the authors. Licensee MDPI, Basel, Switzerland. This article is an open access article distributed under the terms and conditions of the Creative Commons Attribution (CC BY) license.