Article

Machine Vision for In Situ Measurement and Control of Wire Stickout in LWDED Process

1
Department of Mechanical and Aerospace Engineering, Missouri University of Science and Technology, Rolla, MO 65409, USA
2
Product Innovation and Engineering, St. James, MO 65559, USA
*
Author to whom correspondence should be addressed.
Machines 2026, 14(5), 534; https://doi.org/10.3390/machines14050534
Submission received: 1 April 2026 / Revised: 8 May 2026 / Accepted: 8 May 2026 / Published: 11 May 2026
(This article belongs to the Section Machines Testing and Maintenance)

Abstract

This work presents a machine-vision–based measurement and control framework for laser wire directed energy deposition (LWDED) processes. A visible-light camera system is used to capture meltpool images, from which a novel vision algorithm extracts the wire–meltpool interface location. By utilizing a camera that is rigidly mounted to the deposition head, the vision algorithm provides a relative measurement of the distance between the nozzle tip and the workpiece, also referred to as wire stickout. A proportional-derivative (PD) control strategy is implemented using the measured stickout as feedback to adjust deposition feedrate. Results show that the control system successfully compensates for improper layer height increments, enabling thin-wall builds to consistently reach target geometry.

1. Introduction

Additive manufacturing is the process of building a part by sequentially adding material to achieve a desired net or near-net shape. This is contrasted from traditional subtractive manufacturing techniques that start with bulk material and remove excess until the desired shape is achieved. Additive manufacturing has been heavily researched in the last 30 years because of its logistic and geometric flexibility and its efficient resource usage. Its commercial activity is growing in the automotive, aerospace, biomedical, and energy industries [1]. Directed energy deposition (DED) is a popular AM technique in which a stream of input material is fed into a concentrated energy source to shape a desired geometry. DED is popular because of high deposition rates and resultant ability to build large-scale parts [2]. The two primary input material geometries for DED processes are wire and powder. Powder DED is attractive because of its geometric freedom, small feature capability, and multi-material capabilities. Wire-based DED has many advantages over powder-based DED, including higher deposition rates, lower input material costs, near 100% material usage, and working environment cleanliness [3]. Wire-based DED typically adds energy into the process with a laser, welder, or a combination of the two.
One unique feature of wire deposition processes is the presence of material transfer state, also known as “stability state”, which describes how the incoming material interacts with the meltpool and workpiece. Generally, material transfer state can be classified into “stable”, “dripping”, and “stubbing” deposition. Stable deposition creates a continuous stable molten metal transfer from the wire tip to the meltpool [4], and only occurs when an appropriate concentration of energy exists within the meltpool. This is the most desirable transfer state because of its consistency and reduced likelihood for defects. Stubbing deposition occurs whenever the wire does not fully melt upon entering the meltpool, causing it to hit the workpiece and deflect. This state is indicative of insufficient energy present in the meltpool, which can result in external defects such as unmelted wire protruding from the workpiece [5] and internal defects such as lack of fusion [6]. In dripping deposition, an excess of energy causes the wire to melt before making contact with the workpiece. Overheating allows surface tension to wick the molten metal into a droplet. The droplet typically stays suspended above the workpiece until gravity forces it to fall onto the part. Uncontrolled dripping is generally considered undesirable because of its effect on the final geometry of a deposited part, though there are some niche cases where controlled dripping is considered advantageous, such as droplet welding [7,8]. Both unstable transfer states can be detrimental to final part quality because of their propensity to induce defects in parts. Unstable material transfer can also be harmful to the deposition cell, resulting in stuck wire or a clogged contact tip. Both unstable transfer states are caused by an incorrect amount of energy present within the meltpool.
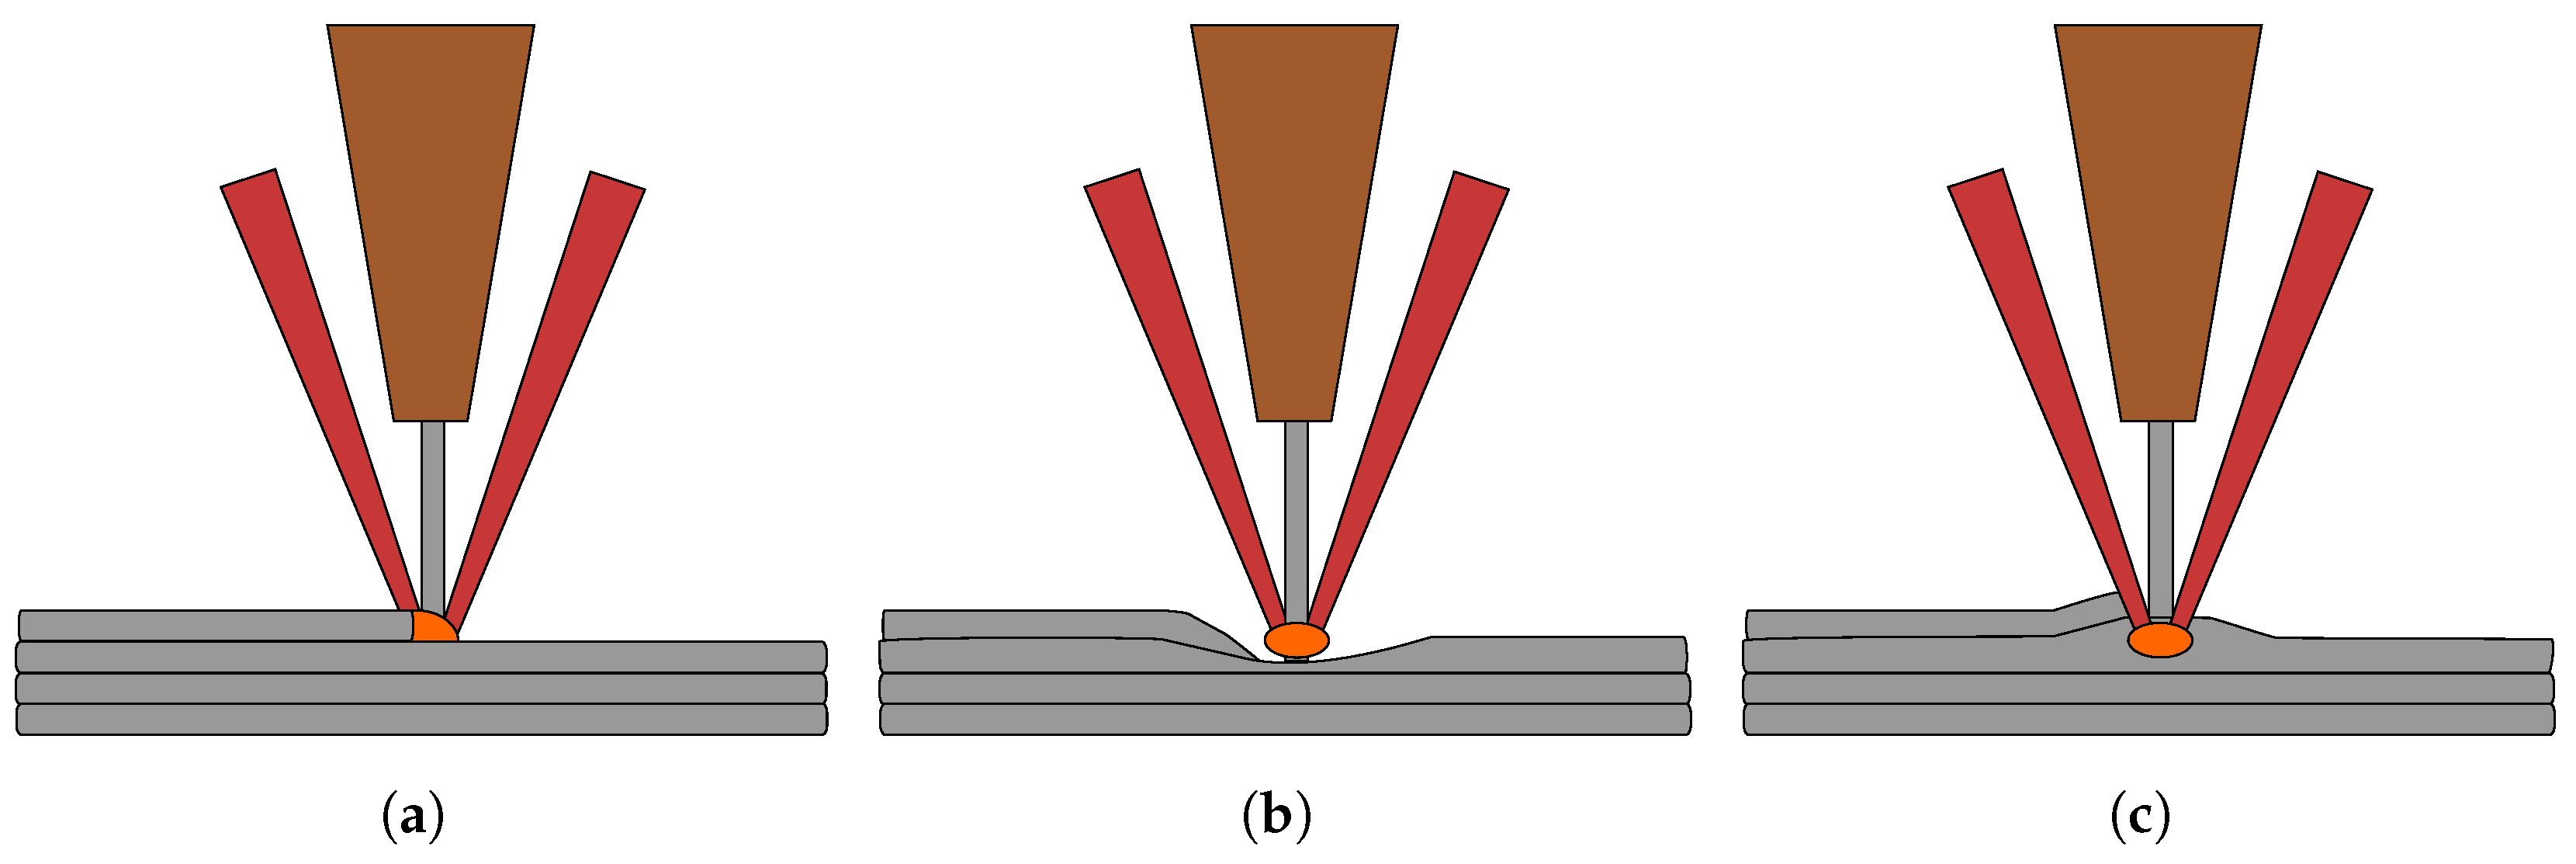
One of the greatest factors that can affect the concentration of energy in the meltpool during deposition is offset height. During deposition, the location where laser energy meets the wire does not change. This is because the position of the wire relative to the laser is mechanically constrained. However, changes in build height can affect the ratio of energy shared between the wire and the workpiece. An elevated region in a deposit can focus too much energy on the workpiece while a depressed region can focus too much energy on the wire. A graphic showing this effect is displayed in Figure 1. In an ideal deposit, the offset between the deposition system and workpiece remains constant. However, due to thermal buildup in the workpiece throughout deposition, constant process parameters can create inconsistent geometries [9]. Monitoring build location and implementing feedback control are, therefore, critical to compensating for these geometric inconsistencies.
Deposition height has been monitored in previous work. Resistive techniques have been used to estimate change in wire length through current measurements [10,11]. Early optical measurement techniques utilized secondary external laser sources to illuminate the deposited bead for in-process measurements [12]. This work was later improved by using a coaxial camera for multi-direction measurements [13]. In another work, Heralic et al. utilized a 3D scanner with iterative learning control to adjust height between layers [14]. Recent work has also utilized optical coherence tomography to take in situ measurements and perform control of deposition height [15,16].
Vision-based feedback mechanisms are attractive because of their low implementation cost and high data throughput [17], returning a large amount of spatial and temporal information between frames. The simplest implementation of vision systems in DED processes typically involves tracking the meltpool or workpiece with a single camera [18,19]. These vision systems typically aim to capture information about the meltpool geometry or thermal state. Multi-camera systems have also been implemented with the goal of obtaining more accurate geometry information during deposition, specifically trying to measure the height or width of the deposited bead [20,21]. More recent work has used data-driven models to measure meltpool stability [22], measure meltpool geometries [23], and predict deposition height [24].
This work develops and proposes the use of a vision-based measurement technique and feedback-control structure for LWDED processes. A visible-light camera is used to capture images of the meltpool that are fed into a novel machine-vision algorithm. This algorithm locates the position of the wire–meltpool interface. Because the camera is rigidly mounted to the deposition head, the measured interface position provides a relative indication of wire stickout. Wire stickout is defined as the length of wire extending between the deposition head and the workpiece surface. The resulting measurement is used as feedback to regulate deposition feedrate, compensating for geometric variations and producing a more consistent deposit.

2. Materials and Methods

2.1. Deposition Cell

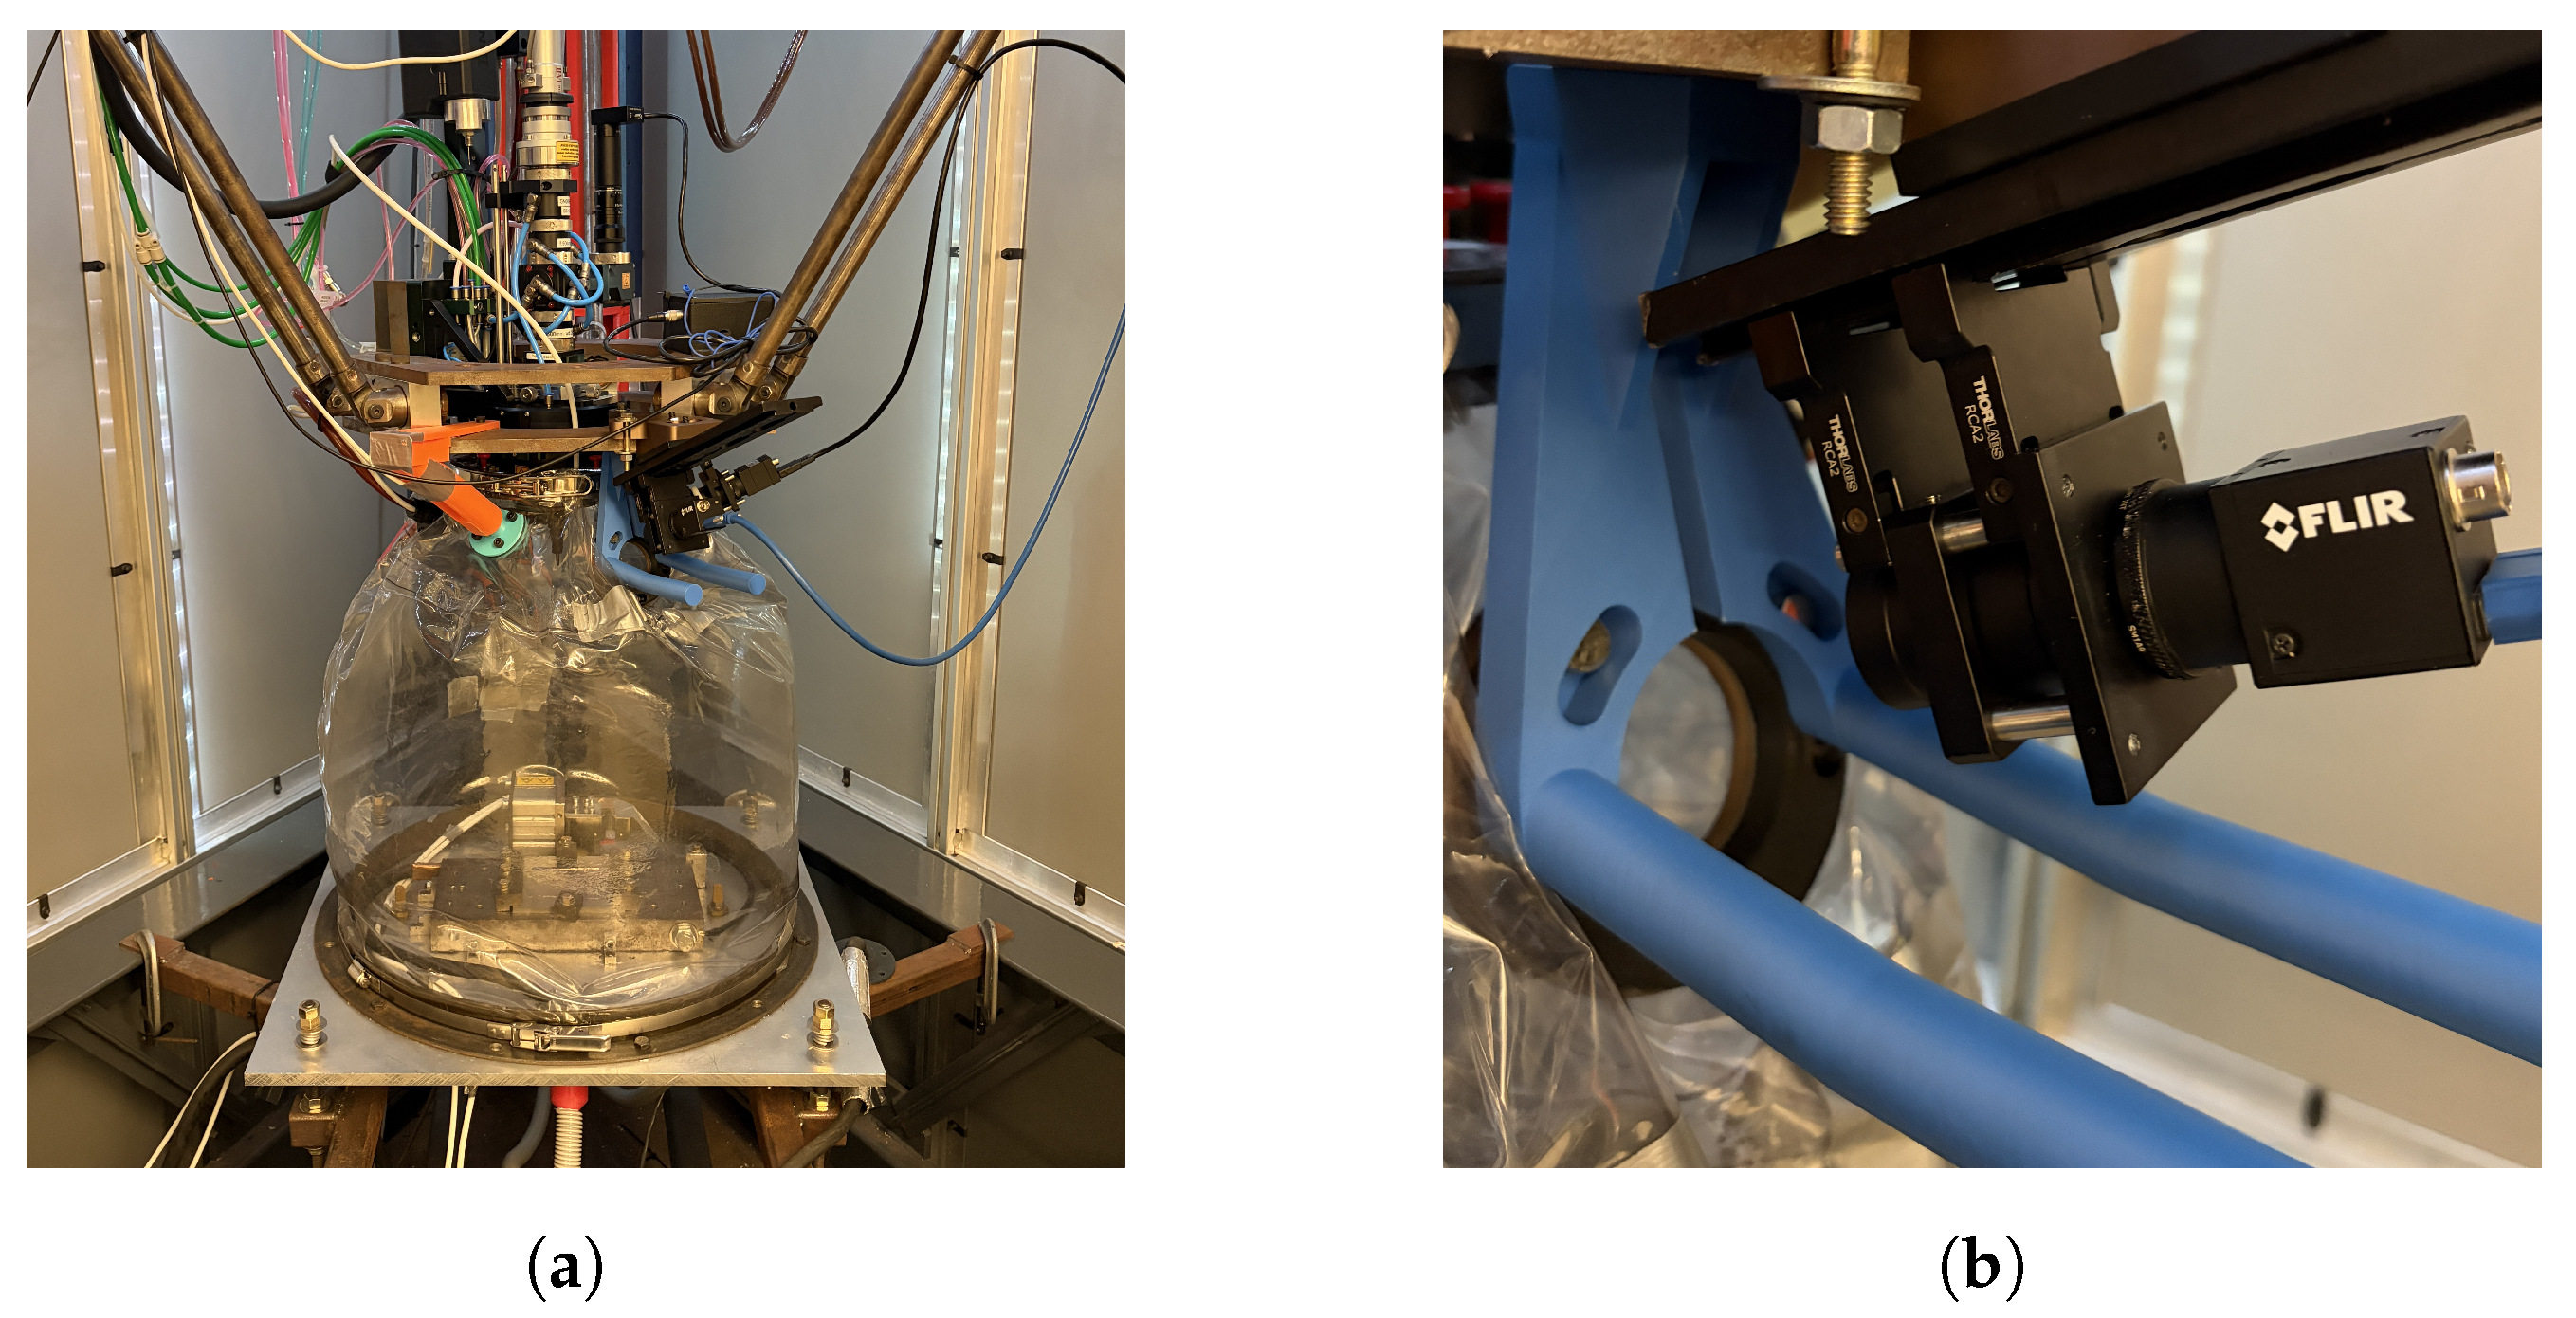
The deposition cell utilized in this study was constructed by students at the Missouri University of Science and Technology (MS&T). The system is an LWDED cell that was designed to deposit Ti-6Al-4V. The four primary components of the cell are the motion, wire-delivery, laser, and beam-delivery apparatuses. Motion in the cell is facilitated through the use of a custom-built delta robot that is controlled with LinuxCNC. Wire delivery in the cell is carried out by a dual-stage feeding system. Bulk feed is handled by a Miller Autocontinuum 500 (Miller, Milwuakee, WI, USA) while precise feed is provided by a Dinse DIX FD 200 M (Dinse, Wood Dale, IL, USA). The laser utilized in this cell is a 4 kW 1070 nm Laserline LDF 4000-30 (Laserline, Livonia, MI, USA). Beam delivery is facilitated through the use of a Fraunhofer COAXwire laser processing optic (Coaxworks, Dresden, Germany). This optic splits the incoming beam into three separate beams that surround the wire 120 degrees apart. Because Ti-6Al-4V is highly reactive to oxygen, a PVC welding tent around the deposit environment is constantly flooded with argon. The deposition cell along with the process camera can be seen in Figure 2a.
The camera used for this system is a Flir BFS-U3-51S5M-C (FLIR, Wilsonville, OR, USA) machine-vision camera. It operates at 60 frames per second with 2448 × 2048 resolution, and an exposure time of 350 µs. Frames are captured in the Mono8 format, with each image recorded as an 8-bit grayscale frame. The camera is rigidly mounted onto the delta robot’s frame and is focused directly onto the welding wire. This configuration ensures that the meltpool and deposited bead remain within the camera’s field of view and in focus throughout the deposition process. The optical stack for the camera consists of a telephoto 35 mm M12 focusing optic (Commonlands, San Diego, CA, USA), an FB600-10 bandpass filter (ThorLabs, Newton, MA, USA) centered at 600 nm with 10 nm FWHM band, and neutral density (ND) filters. Bandpass filters are designed to pass a specific band of light through and reject all others. Because of its narrow bandwidth, most broadband visible light and laser emissions are suppressed. The remaining signal is primarily comprised of emissions from high temperature titanium, which results in a thermally driven image that is still representative of meltpool and bead geometry. To help reduce sensor saturation, neutral density filters are also added to the optical stack. The camera is shown in Figure 2b.

2.2. Development of Machine Vision Tool

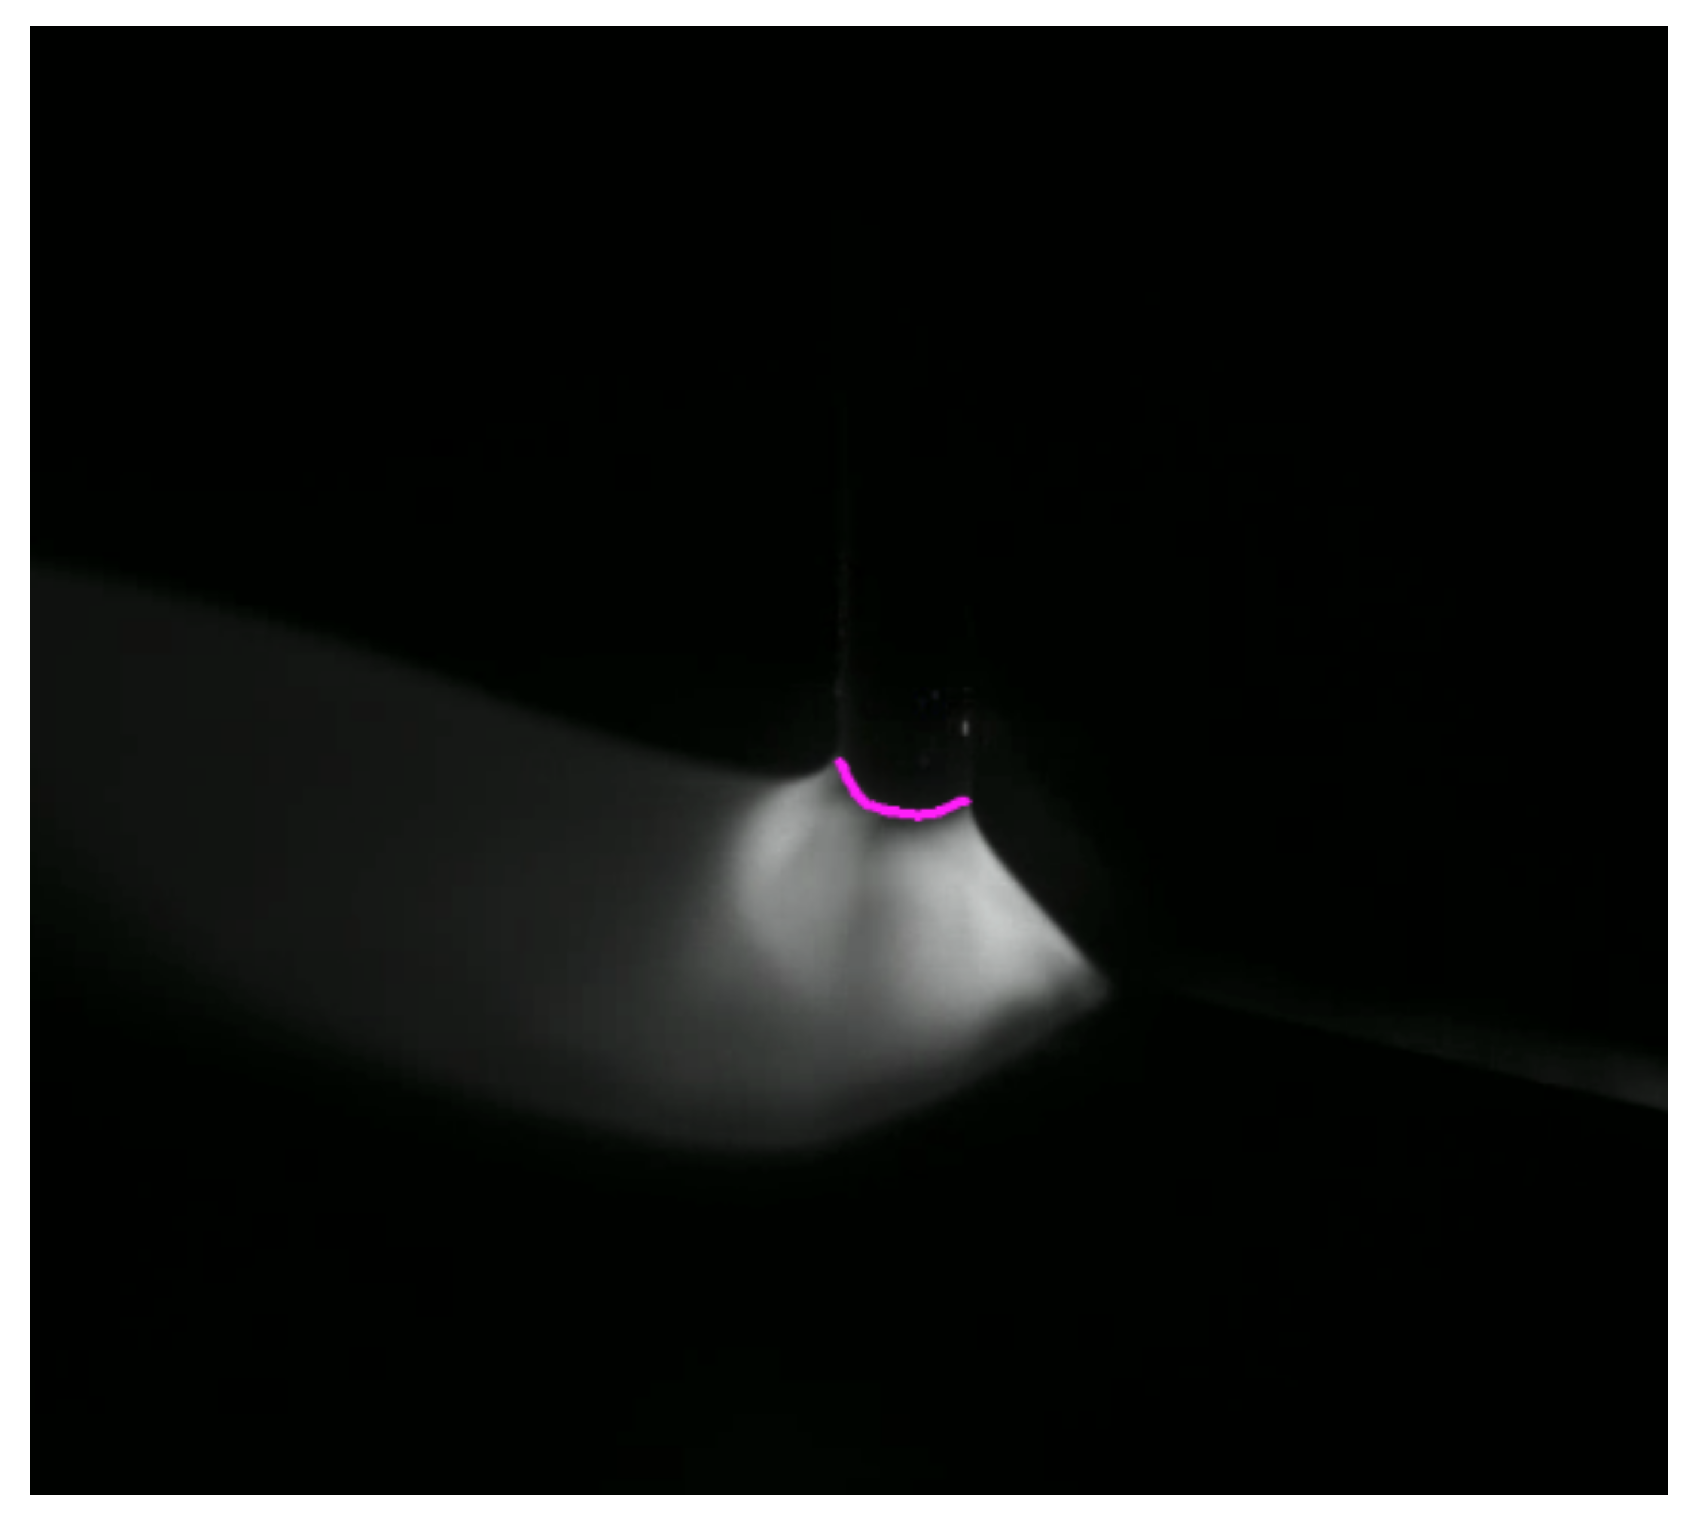
The machine vision tool developed in this study quantifies the amount of wire stickout between the deposition head and workpiece. The camera used for analysis is rigidly mounted to the head, allowing a relative measurement of the distance between the deposition head and the workpiece surface to always be calculated. The tool computes the wire–stickout height to be the centroid position of contour of the wire–meltpool interface. An annotation of this contour is shown in Figure 3.

2.2.1. Vision Stickout Algorithm

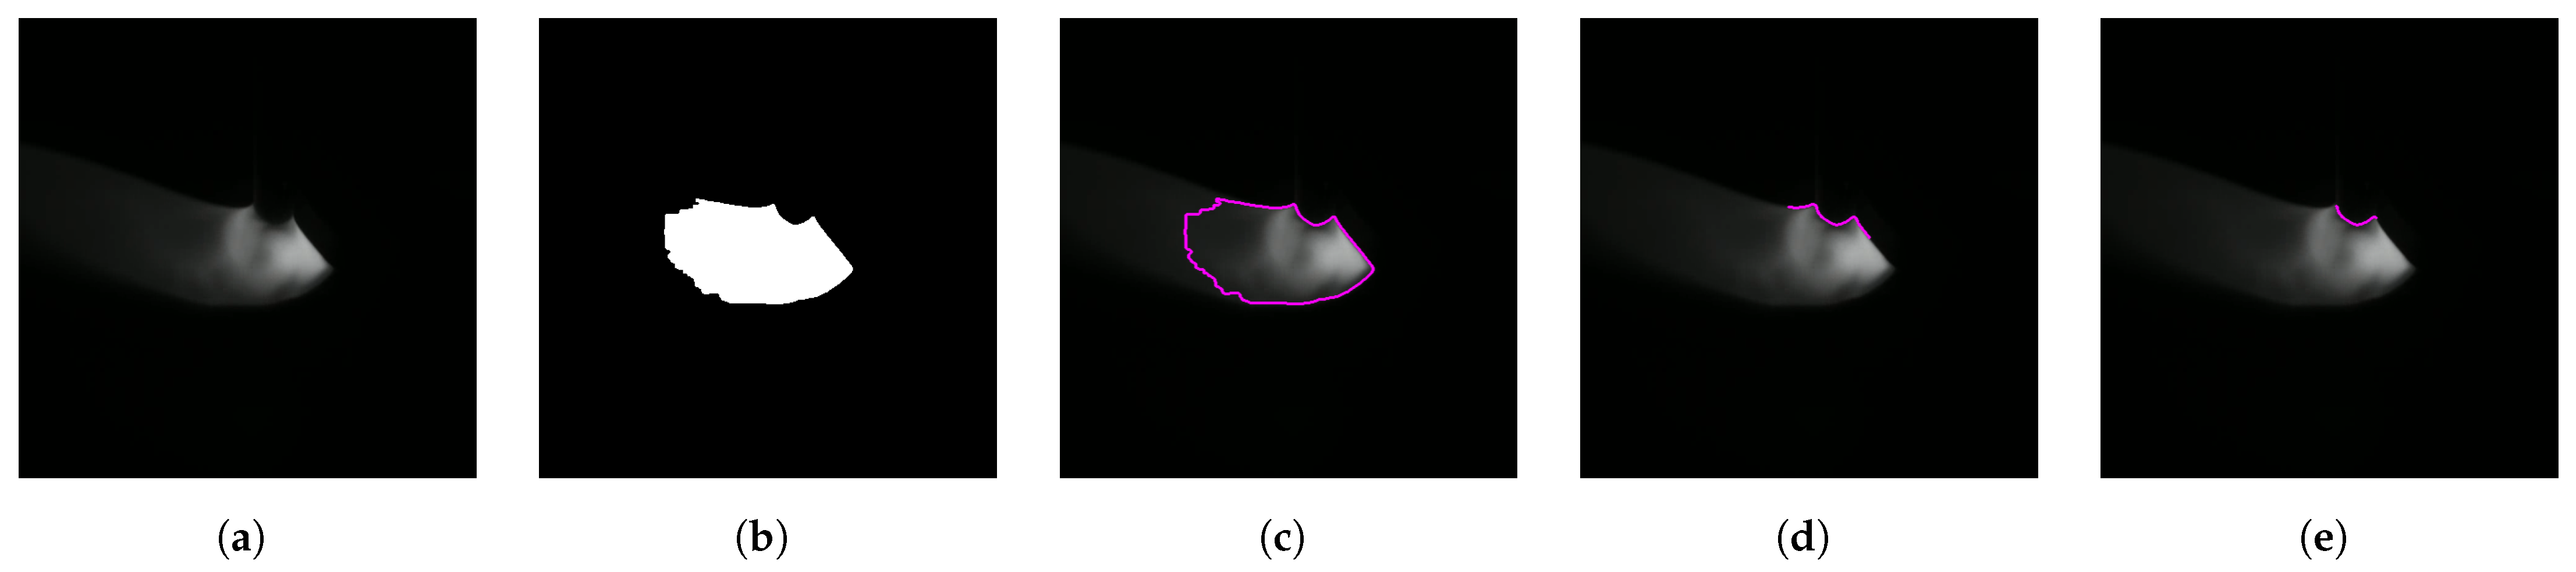
The vision tool is divided into four steps. First, the meltpool region is separated from the background by thresholding the 8-bit grayscale image into a binary image. Next, the meltpool boundary is selected as the largest contour in the binary image, yielding a set of discrete points along the meltpool perimeter. The top edge of the meltpool is then isolated by analyzing the local direction of neighboring contour points around the boundary. Finally, the wire–meltpool intersection is located by finding the two largest changes in direction along the isolated boundary, indicating the two sides of the cusp. Figure 4 visualizes each step of the vision algorithm leading to the final interface selection. A mathematical explanation follows.
Let the grayscale image at time t be F t ( x , y ) , a function of x and y pixel coordinates, where each pixel is represented by an integer intensity value in the range [ 0 , 255 ] . A binary mask is created using threshold T intensity .
B t ( x , y ) = 1 if F t ( x , y ) T intensity 0 if F t ( x , y ) < T intensity
The meltpool boundary is calculated using the border-following algorithm of Suzuki et al. [26], as implemented in OpenCV [27]. The OpenCV function findContours ( ) accepts a binary image B t ( x , y ) and returns an ordered set of boundary points P:
P = { ( x i , y i ) } i = 1 N .
To isolate the upper region of the meltpool, a normalized tangent direction is computed between neighboring contour points. This direction is projected onto a reference direction z to produce a scalar directional signal r i :
r i = ( P i + 1 P i ) P i + 1 P i · z , z = 1 0 .
Indices corresponding to the upper boundary of the meltpool contour, I top , are isolated by thresholding the directional signal using a threshold T direction . The directional signal may then be restricted to this region as r i top . Similarly, the points along this region are restricted to P top .
I top = { i r i < T direction }
r i top = { r i i I top }
P top = { P i i I top }
To isolate the location of the wire–meltpool interface, the top contour indices are further reduced to lie within the interface edge points. These edge points are identified by computing the discrete derivative of the directional signal along the top boundary, Δ r i top .
Δ r i top = r i + 1 top r i top
The two greatest peaks of Δ r i top represent the left and right edges of the wire–meltpool interface, i left and i right . I interface may then be found by confining the top meltpool contour indices I top to lie within i left and i right . Then, the points of the meltpool interface, P interface , are made up of the original set of points P restricted within indices I interface . The center point of P interface is taken as the stickout height.
I interface = { i I top i left i i right }
P interface = { P i i I interface }

2.2.2. Directionality Effects

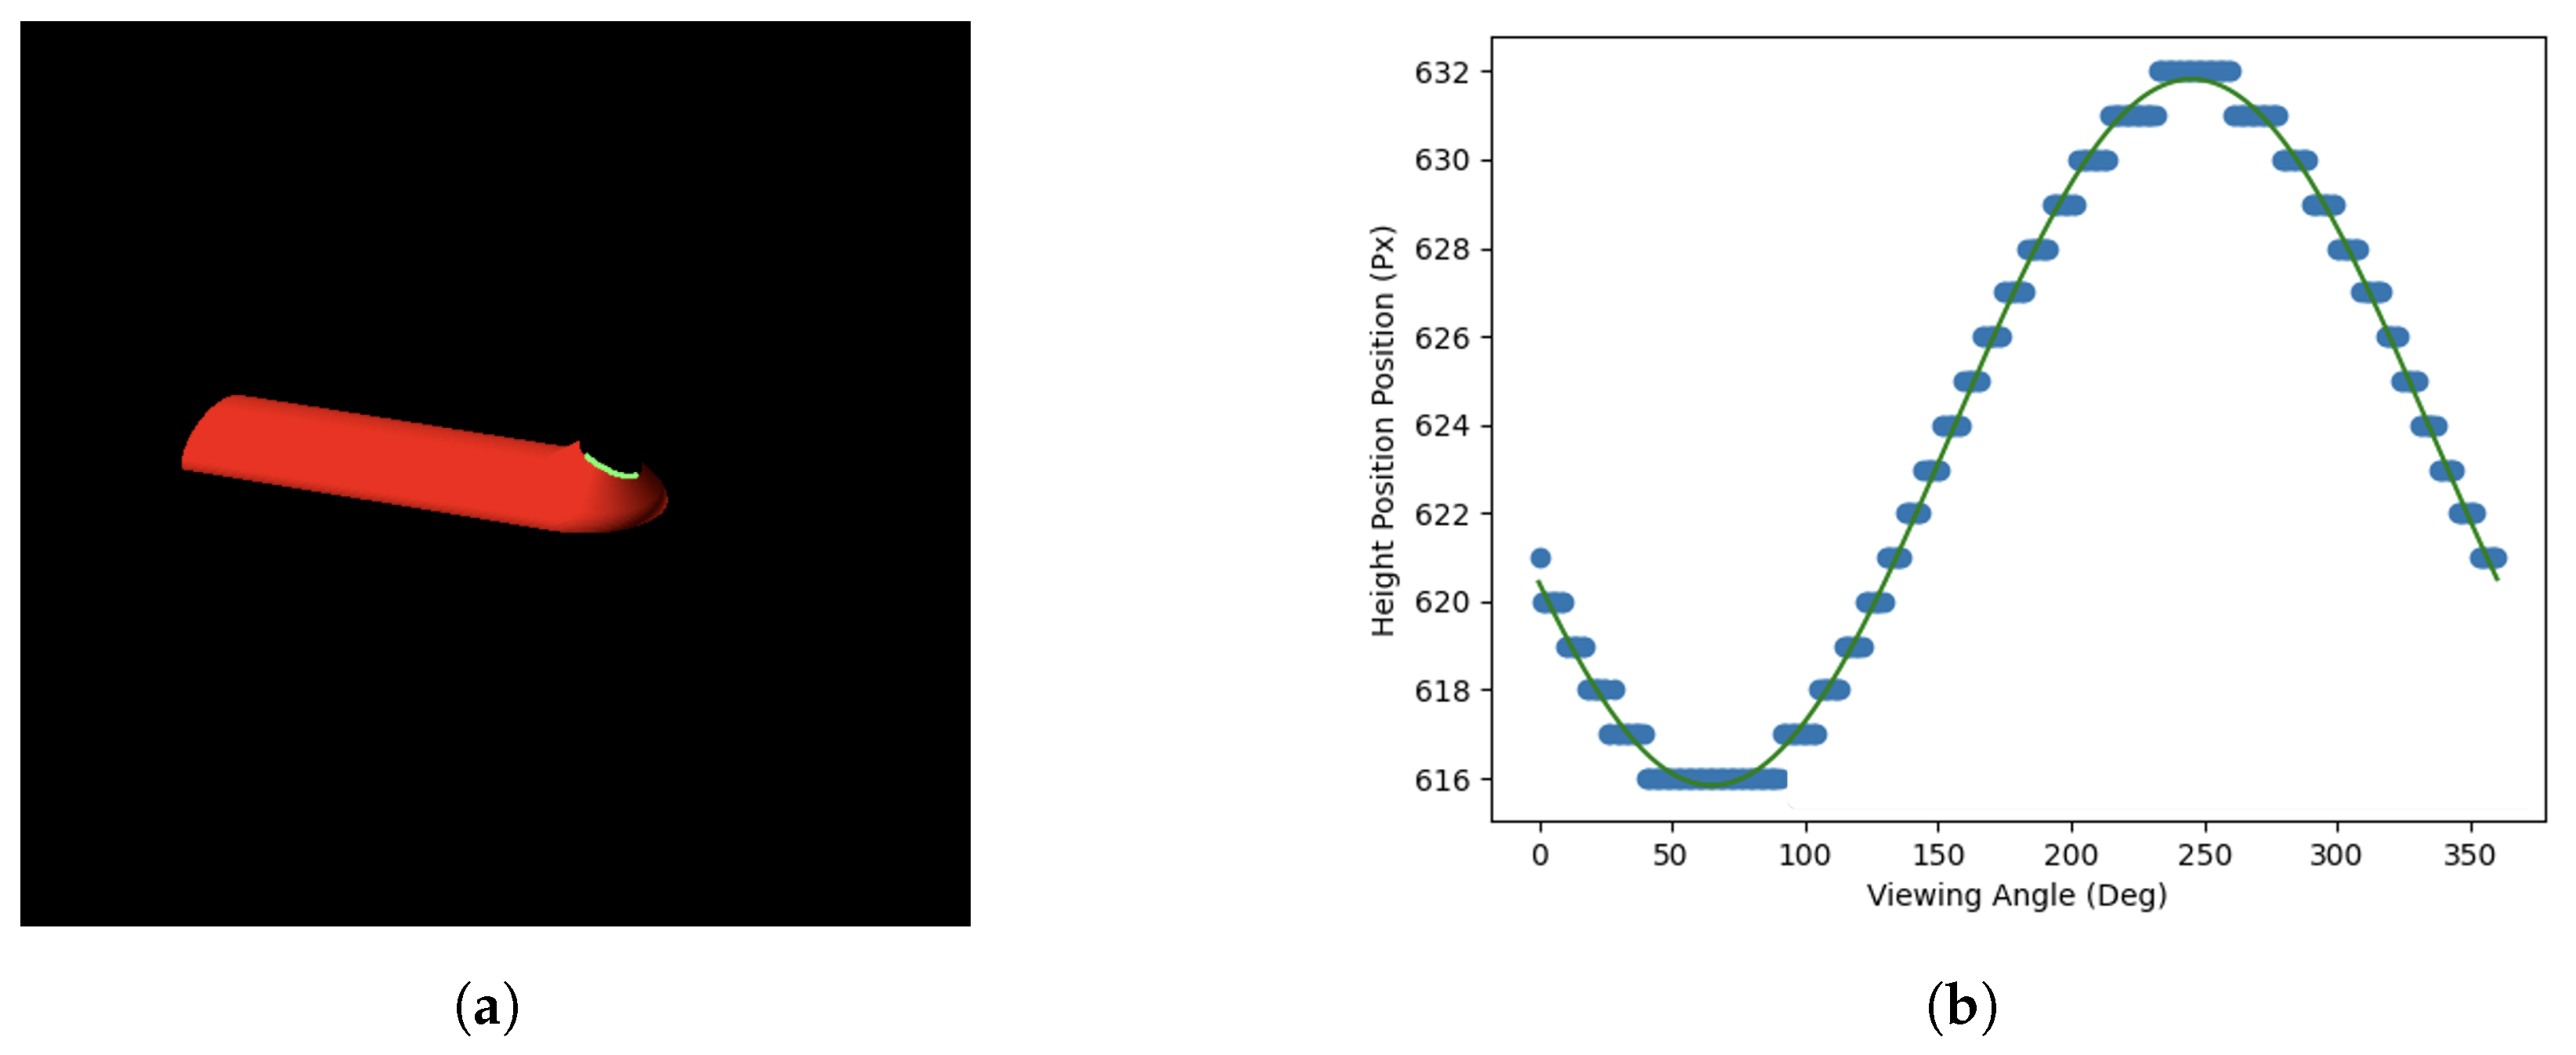
Because the camera is rigidly mounted to the robot during deposition, changes in direction of motion correspond to a change in the perceived viewing angle of deposition. In order to explore the effect that changes in viewing angle have on wire stickout, a simulation was created. The simulation uses a CAD rendering of meltpool and wire geometry to take images from a set distance above the meltpool. The virtual camera is then rotated 360 degrees around the CAD geometry and analyzed using the wire–meltpool interface vision algorithm described previously. Rotating the virtual camera 360 degrees around the meltpool simulates changes in direction of motion during deposition.
Results shown in Figure 5 demonstrate a sinusoidal relationship between measured height and viewing angle. This implies that discrete changes in direction manifest in static offset changes to the signal. This relationship means that the proposed vision algorithm should be able to measure deposition height for any direction of motion, as long as the active direction of motion is always known. This work focuses on bidirectional thin-walled deposition, so a single direction compensation value may be used for the entire structure. This method could be further developed to utilize full two-dimensional motion by normalizing incoming data based on the sinusoidal relationship shown in Figure 5.

2.2.3. Physical Interpretation of Measurement

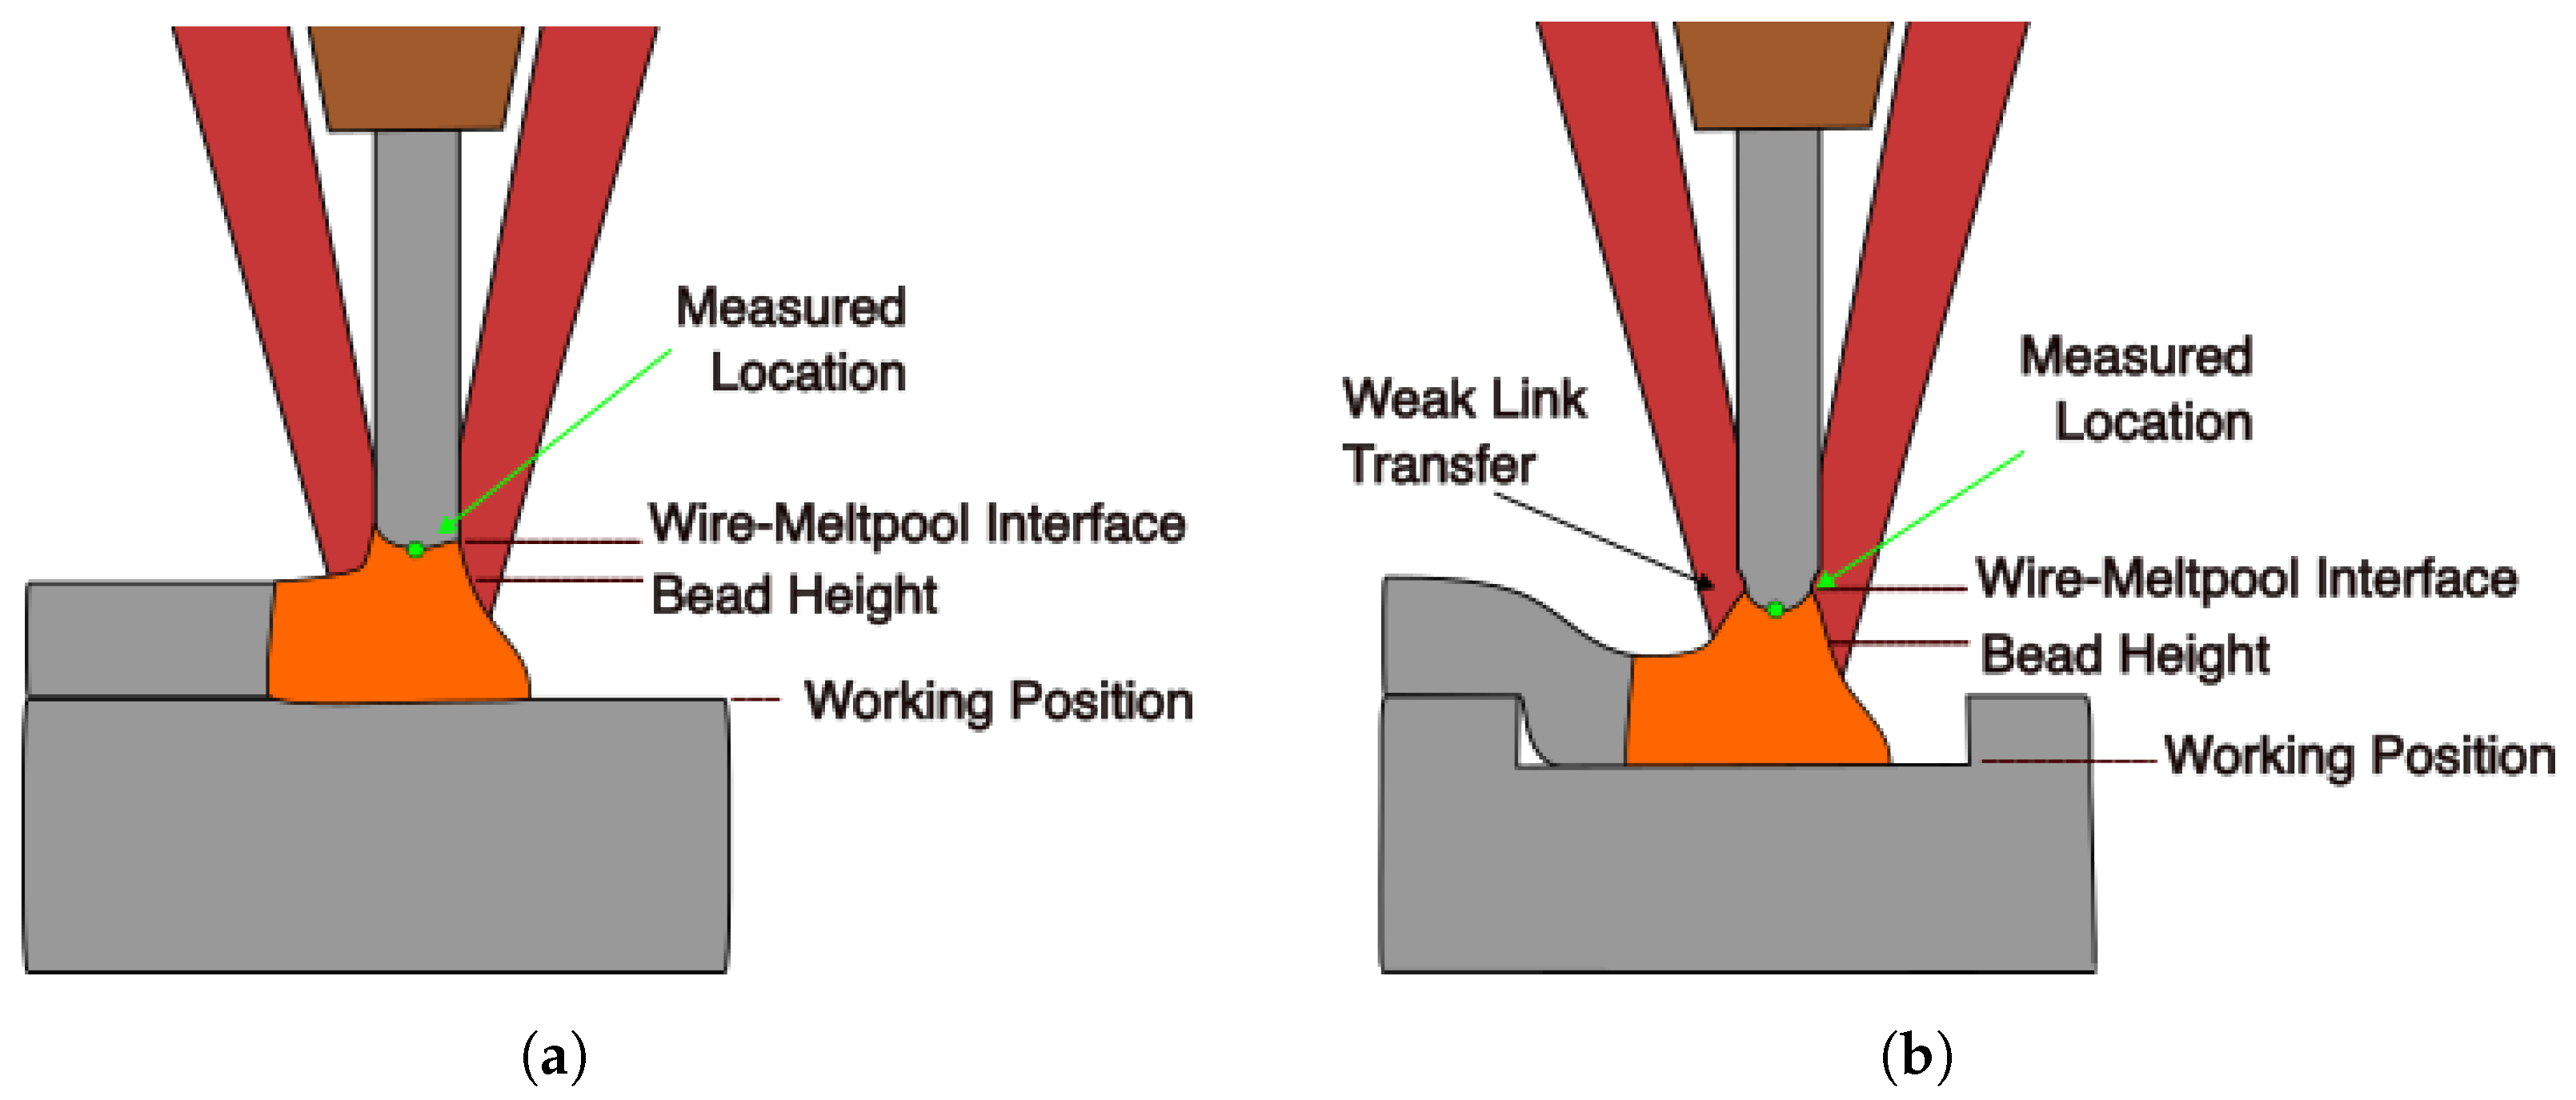
A depiction of the proposed vision measurement is shown in Figure 6. The measurement developed in this study estimates wire stickout by locating the wire–meltpool interface position relative to the deposition head. This vision tool does not provide a literal measurement of bead height or workpiece position. Its utility lies in its ability to give a visually significant measurement that can quantify deposit position. The vision measurement encodes information about multiple aspects of the meltpool state, including workpiece position, deposit layer height, and the condition of the wire–meltpool interface. As seen in the difference between Figure 6a,b, the measurement is dominated by the workpiece position, which sets the position of the meltpool during stable deposition. For small changes in control parameters, the stickout measurement maps approximately 1:1 to workpiece position, making it an effective feedback signal for the majority of realistic deposition conditions.
Large changes in the deposit thermal state can affect the bead height and wire interface location. As shown in Figure 6, the measured location does not scale exactly with change in workpiece position. This is because a change in workpiece position results in a change of thermal state, where more energy is being concentrated onto the wire than the workpiece. This phenomenon has been studied and is referred to as workpiece illumination proportion (WIP). Higher amounts of energy incident on the wire lead to an upward shift in the meltpool interface location and a taller bead height [25]. In more extreme deviations the high energy concentration on the wire can lead to a weak link transfer state. This state pushes the wire–meltpool interface up far enough to where the link between wire and meltpool is broken, resulting in a dripping deposition state, illustrated in Figure 6b. The goal of this sensing and control technique is to maintain a consistent stickout height throughout deposition, preventing large changes in WIP.

2.3. Control Structure

The machine vision tool presented measures the position of the wire–meltpool interface relative to the robot’s position. As the robot increments through layers, deviations in the stickout measurement indicate differences between deposited geometry height and the Z-increment height of the robot. Calculating the amount of wire stickout in real time enables estimation of the workpiece position in order to make in situ process adjustments to account for geometric inaccuracies.

2.3.1. Controller Design

The control system utilizes the relationship between machine travel speed, also referred to as feedrate, and total material input into the system. Because LWDED processes have near 100% material efficiency, the material input into the system may be described as the following:
Input Material Per Unit Length = Wire Feed Speed Feedrate
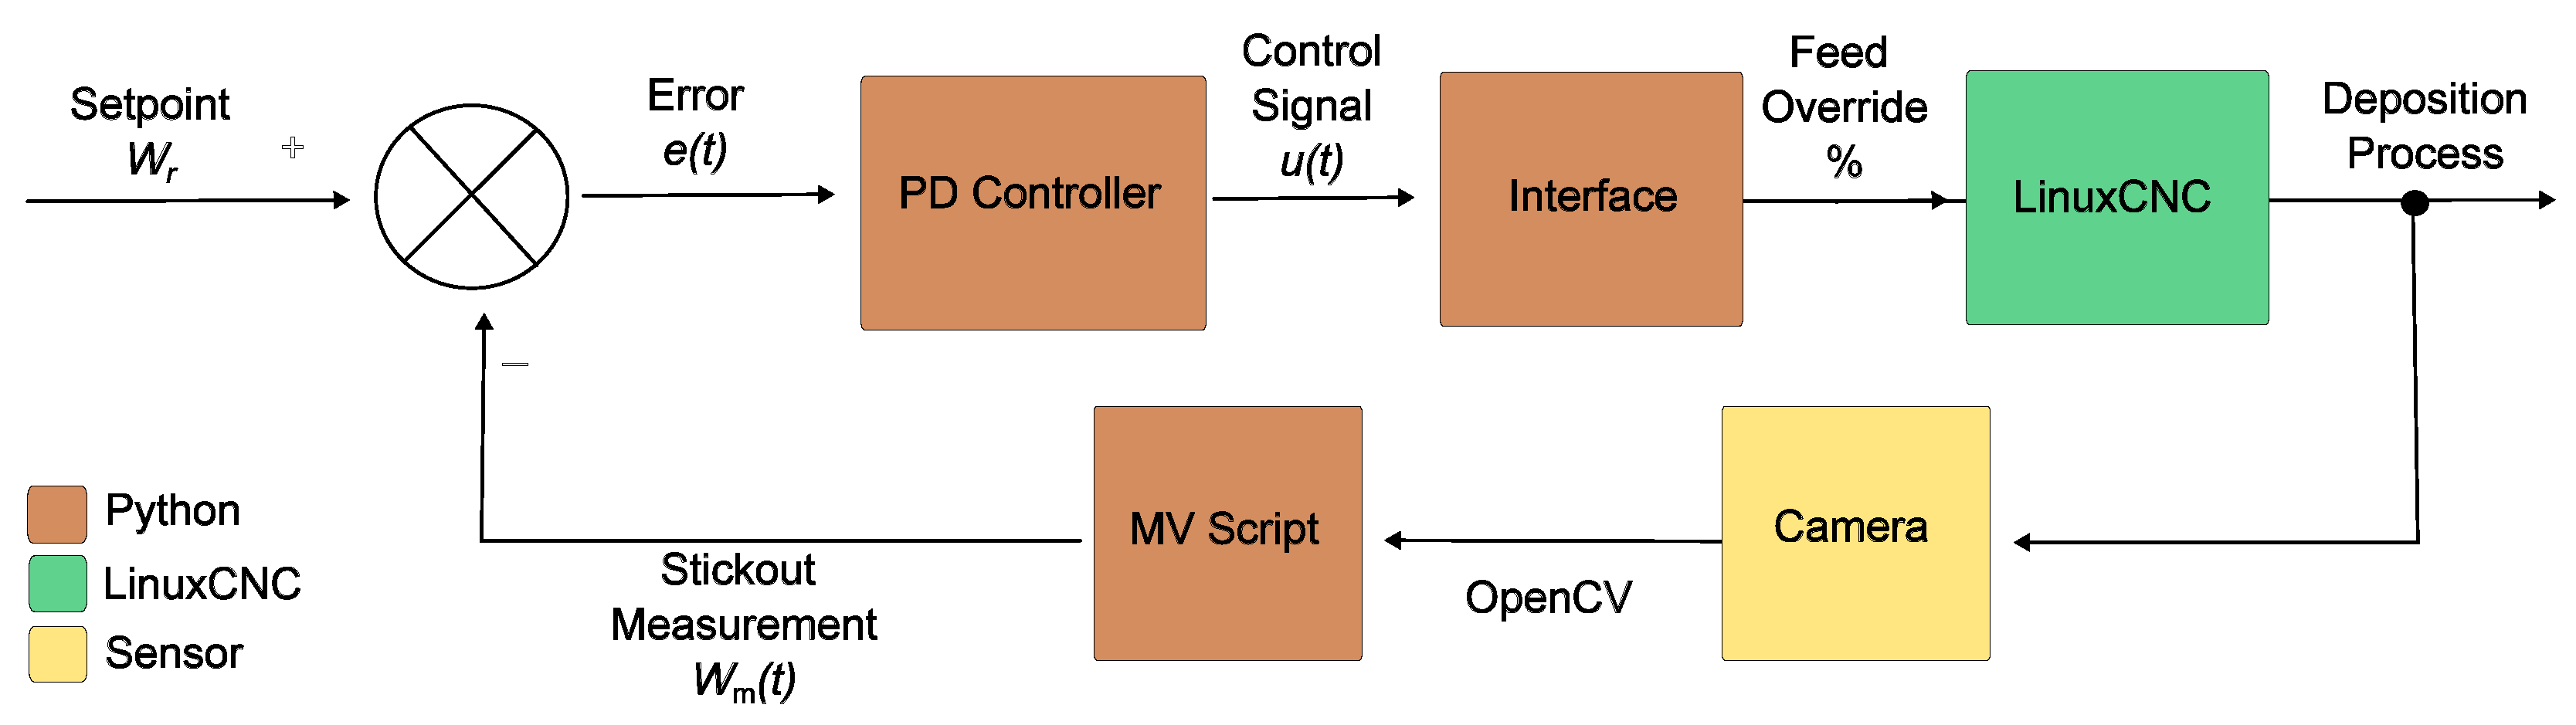
The material input into the system is inversely proportional to feedrate. Locations of the workpiece that need more material can be compensated with slower travel speed; conversely, areas requiring less material are compensated with a faster travel speed. A high stickout value implies a lower than nominal position in the workpiece while a low stickout value implies a higher than nominal position in the workpiece. With these relationships established, an error function and control algorithm can be implemented. The error function utilizes an ideal reference wire stickout measurement, W r . The error as a function of time, e ( t ) , is the difference between the current measured wire stickout value W m ( t ) and the desired stickout position. The control algorithm used is a proportional derivative (PD) controller. Controller gain values k p and k d were selected such that the output signal of the controller, u ( t ) , is a feed-override value, corresponding to a percentage deviation from nominal travel speed.
e ( t ) = W r W m ( t )
u ( t ) = k p e ( t ) + k d d e ( t ) d t

2.3.2. Control System Architecture

A block diagram of the wire stickout control is shown in Figure 7 and data flow diagram for signals is shown in Figure 8. Input into the PD controller is the error e ( t ) . The controller outputs the control signal u ( t ) , which gets passed to a hardware–software interface service. This service takes the feed override from the PD controller and adjusts the deposition process feedrate. As the process continues, the monitoring camera continues to capture images which are passed into the machine-vision script for measurement.
OpenCV is used to capture images from the camera and pass them into the machine vision script. The vision tool passes its wire–stickout measurements to the PD controller through a shared memory queue. This queue is necessary because the PD controller and machine vision script run simultaneously in parallel processes. Output from the controller is passed to the hardware–software interface through an HTTP-based webserver. The interface utilizes LinuxCNC’s hardware abstraction layer to make adjustments of the machine feedrate.
The system response time has been characterized and is shown in Table 1. The total response time includes frame capture, machine-vision computation, control signal generation, communication, and dynamic response. The two dominant time contributors are the camera frame rate and the dynamic response of the machine. The dynamic response was experimentally determined by measuring the time it took the machine to increase from 100% to 140% of the nominal feedrate. Total system response time of 64.5 milliseconds is considered acceptable, as the primary purpose of this height control system is to correct low frequency errors that accumulate over multiple layers.

2.4. Measurement and Control Validation

The goal of this work is to create a tool that can correct height variations that occur during deposition. These variations primarily result from the nonlinear relationship between process parameters and the resulting bead geometry, which is influenced by thermal accumulation throughout a build. In order to validate the tool’s ability to quantify height deviations within a single layer, slots of varying depths were milled into substrate pieces. The slots were then deposited over and machine vision measurements were taken. To validate the tool’s ability to quantify layer-to-layer height inconsistencies, two thin walls were deposited with the same process parameters, excluding Z-increment height. Vision measurements were then recorded and compared. Finally, in order to verify controller capability, three sets of deposits were run at varying Z-increment heights, with and without control. Purposefully stepping up by incorrect layer height increments puts the controller to the test of needing to constantly correct for variations.

3. Results

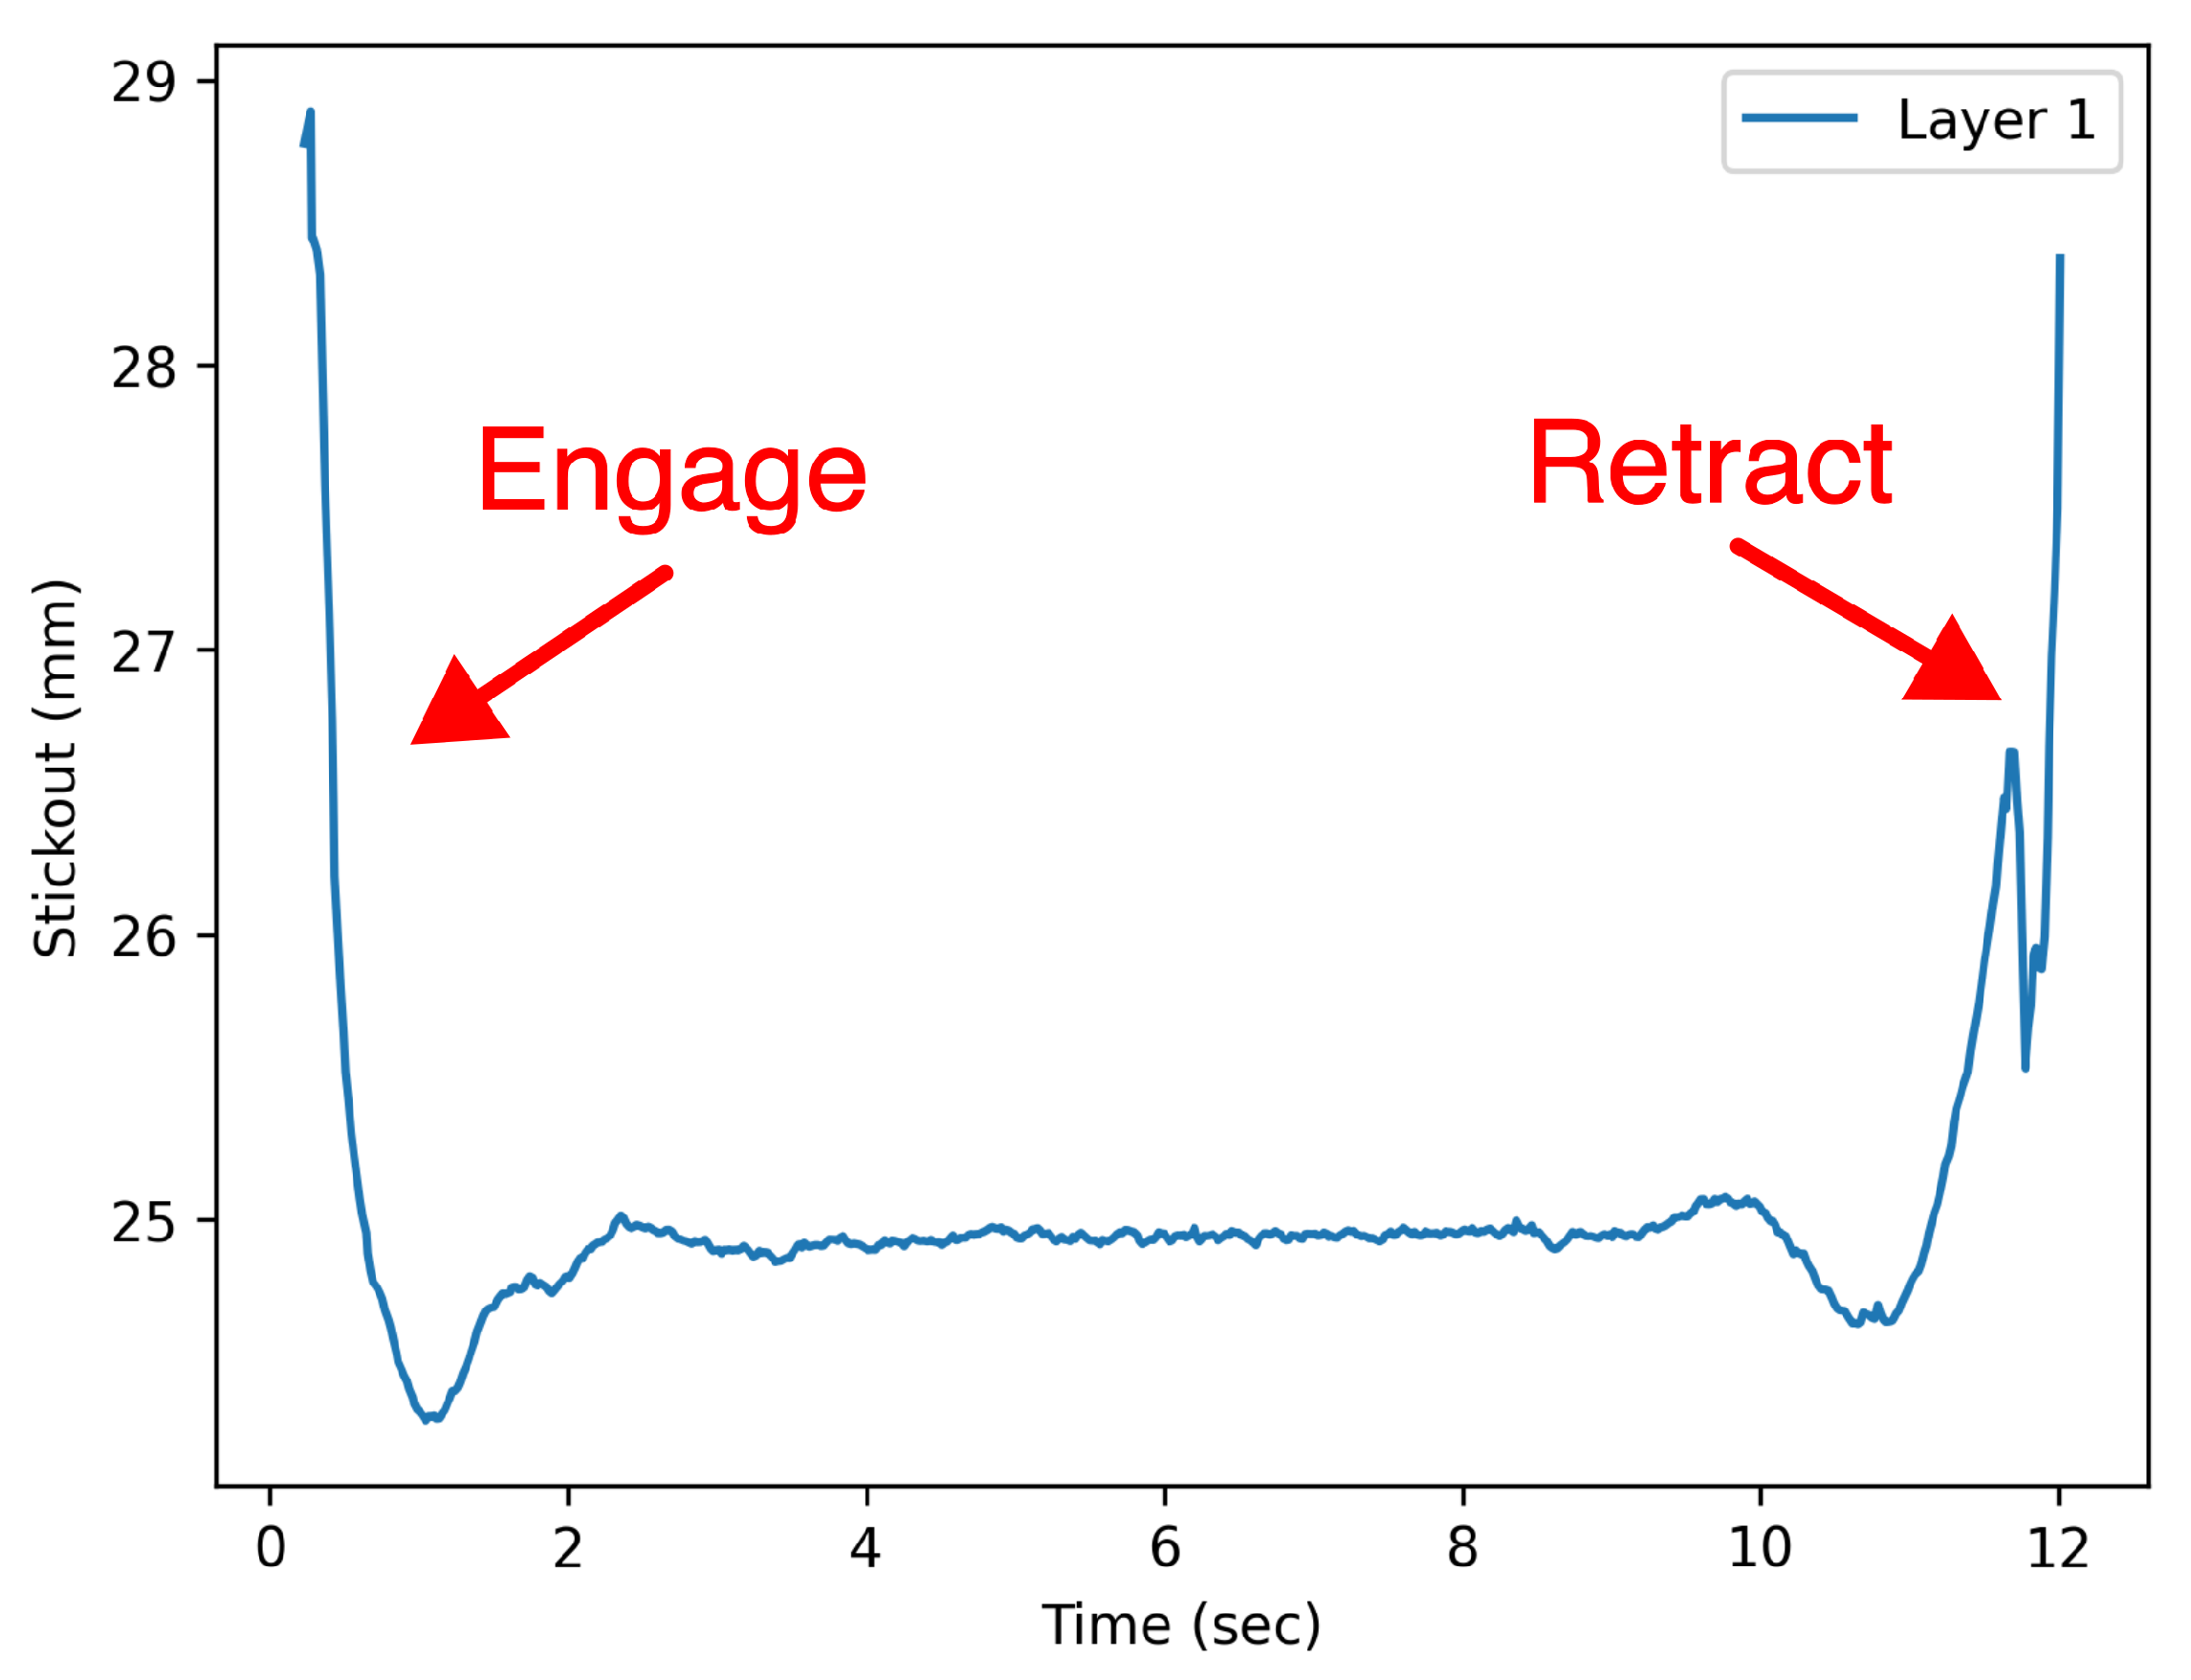
Figure 9 shows the stickout measurement from the deposition of a stable bead. The spike at the beginning and end of the deposit is the location of the engagement and retraction procedures. As the meltpool grows to nominal height, the stickout decreases accordingly. As the robot begins to move, the measurement remains stable until the retraction at the end of the deposition.

3.1. Validation of Measurements

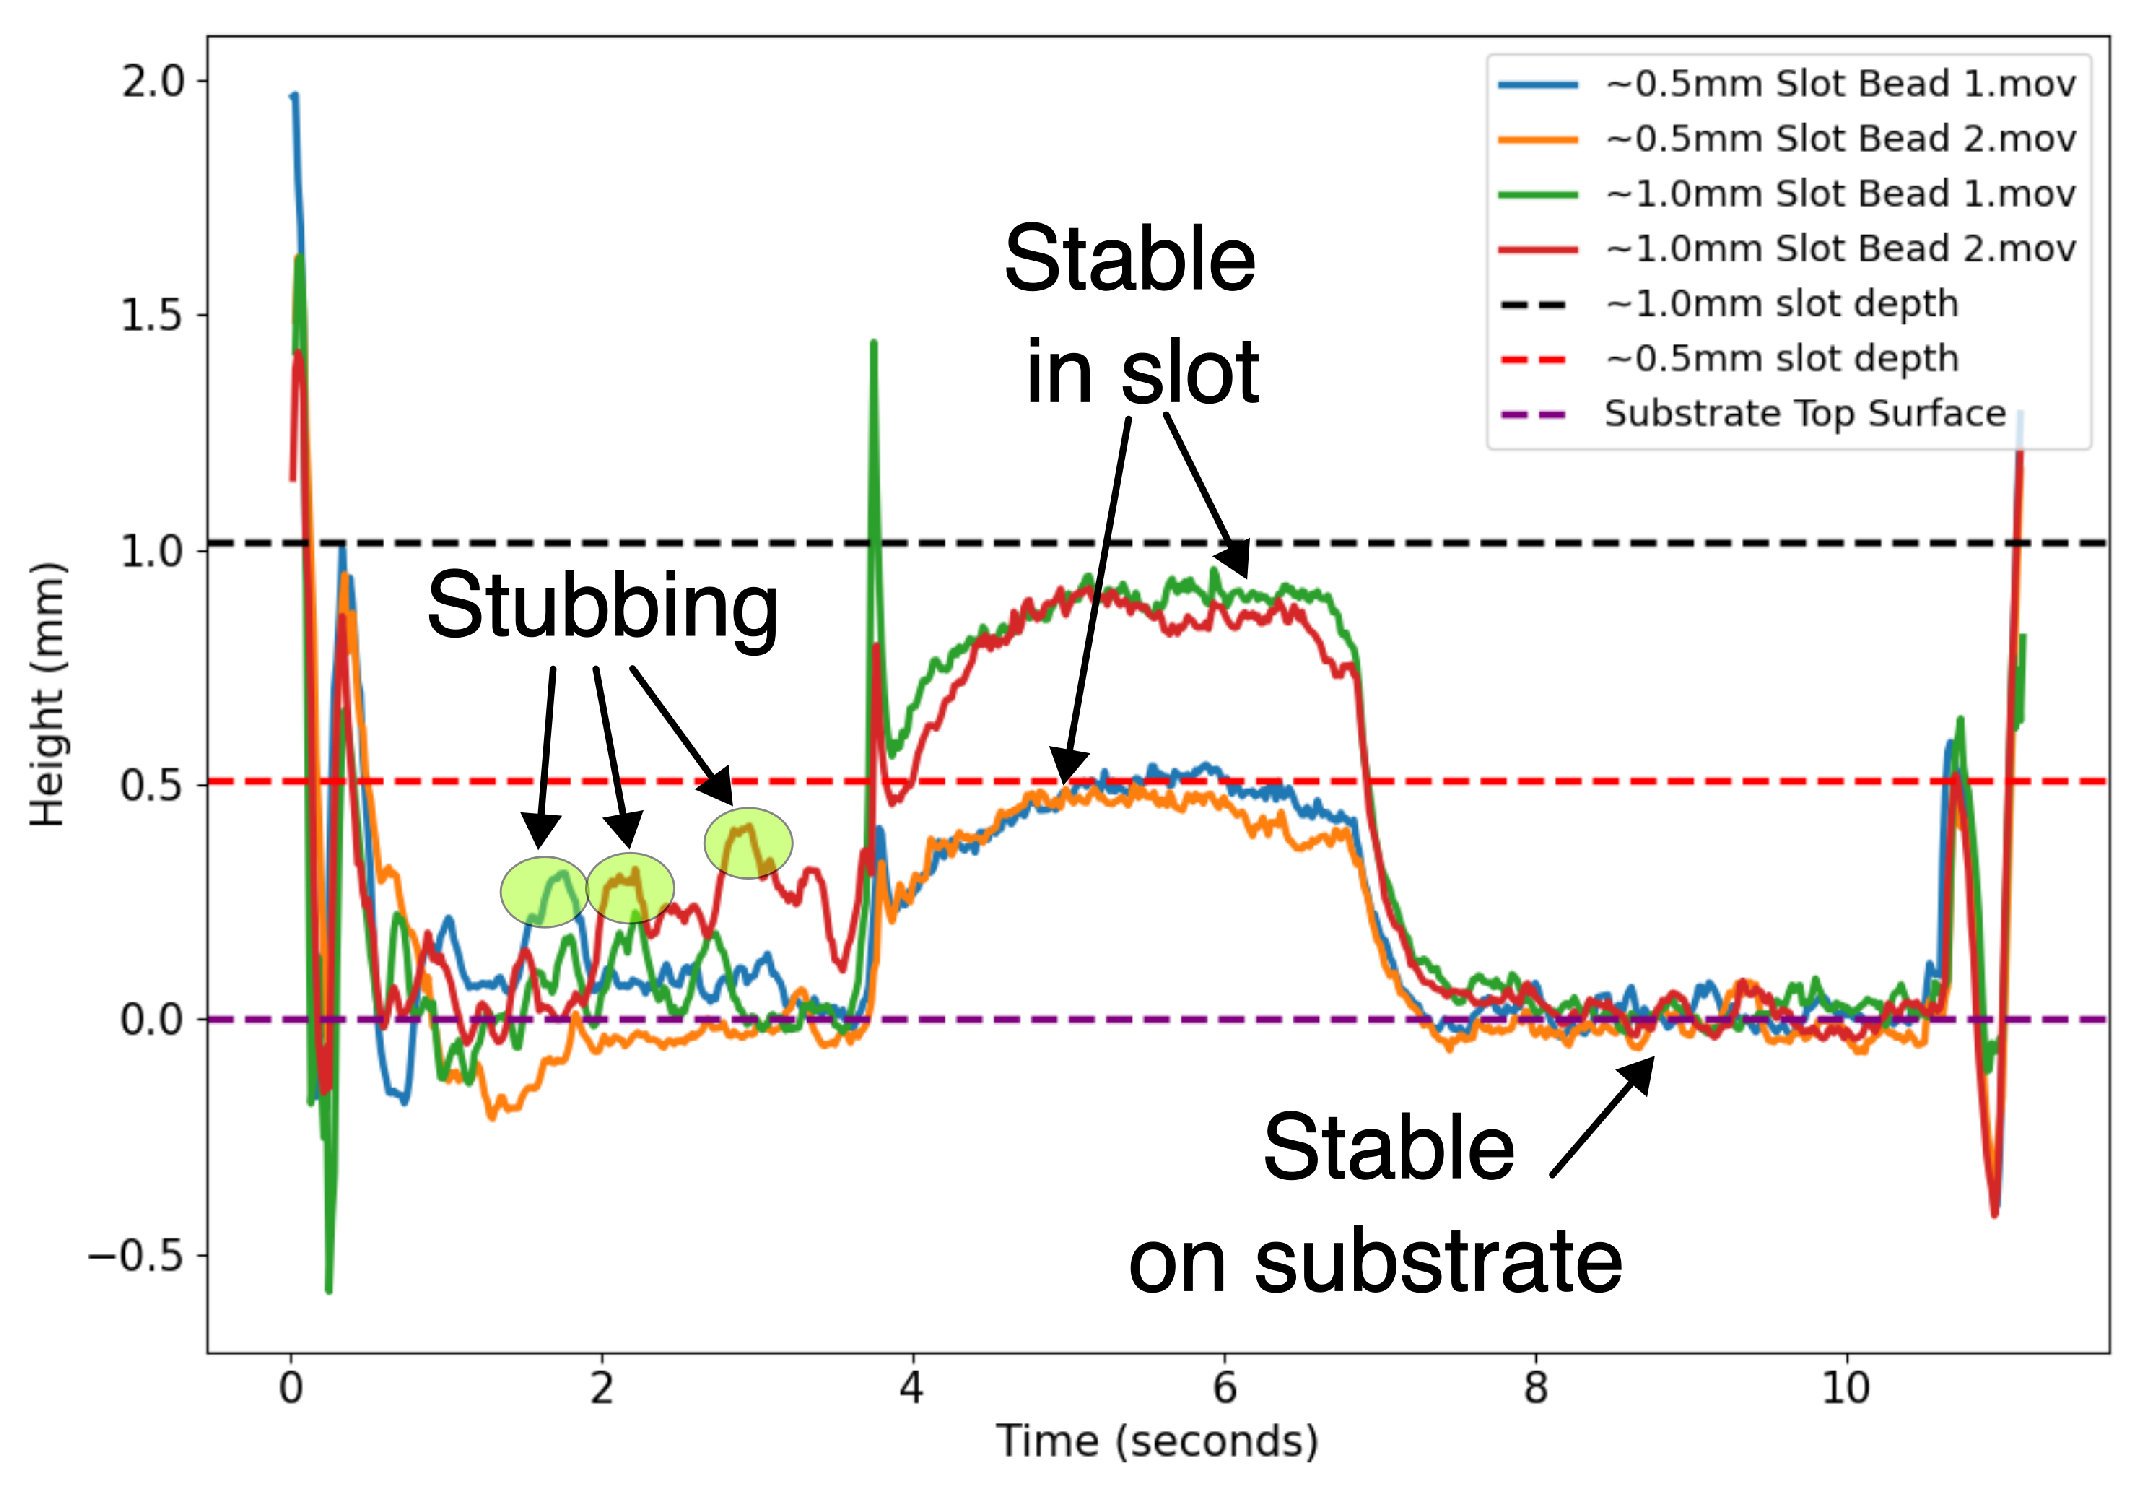
In order to validate that the tool is capable of measuring height variations within a single deposition layer, slots of depth 0.020″ and 0.040″ were milled into substrates and then deposited over. Slots of two different depths were used in order to validate the tool’s sensitivity to changes in workpiece position. Measurement results are shown in Figure 10. The results show a strong correlation between the workpiece position (slot depth) and the measured values. In order to ensure dripping did not occur at the bottom face of the slot, a relatively low laser power was required for this experiment. As a result, stubbing occurred at the beginning of most of the deposits. Stubbing can be seen as large jumps in the measured height data, where the wire interface position quickly moves as the wire hits the workpiece. Once the deposition reached a stable state, it remained stable for the duration of the bead. The measurements exhibit a clearly identifiable region corresponding to the robot’s traversal over the slot.
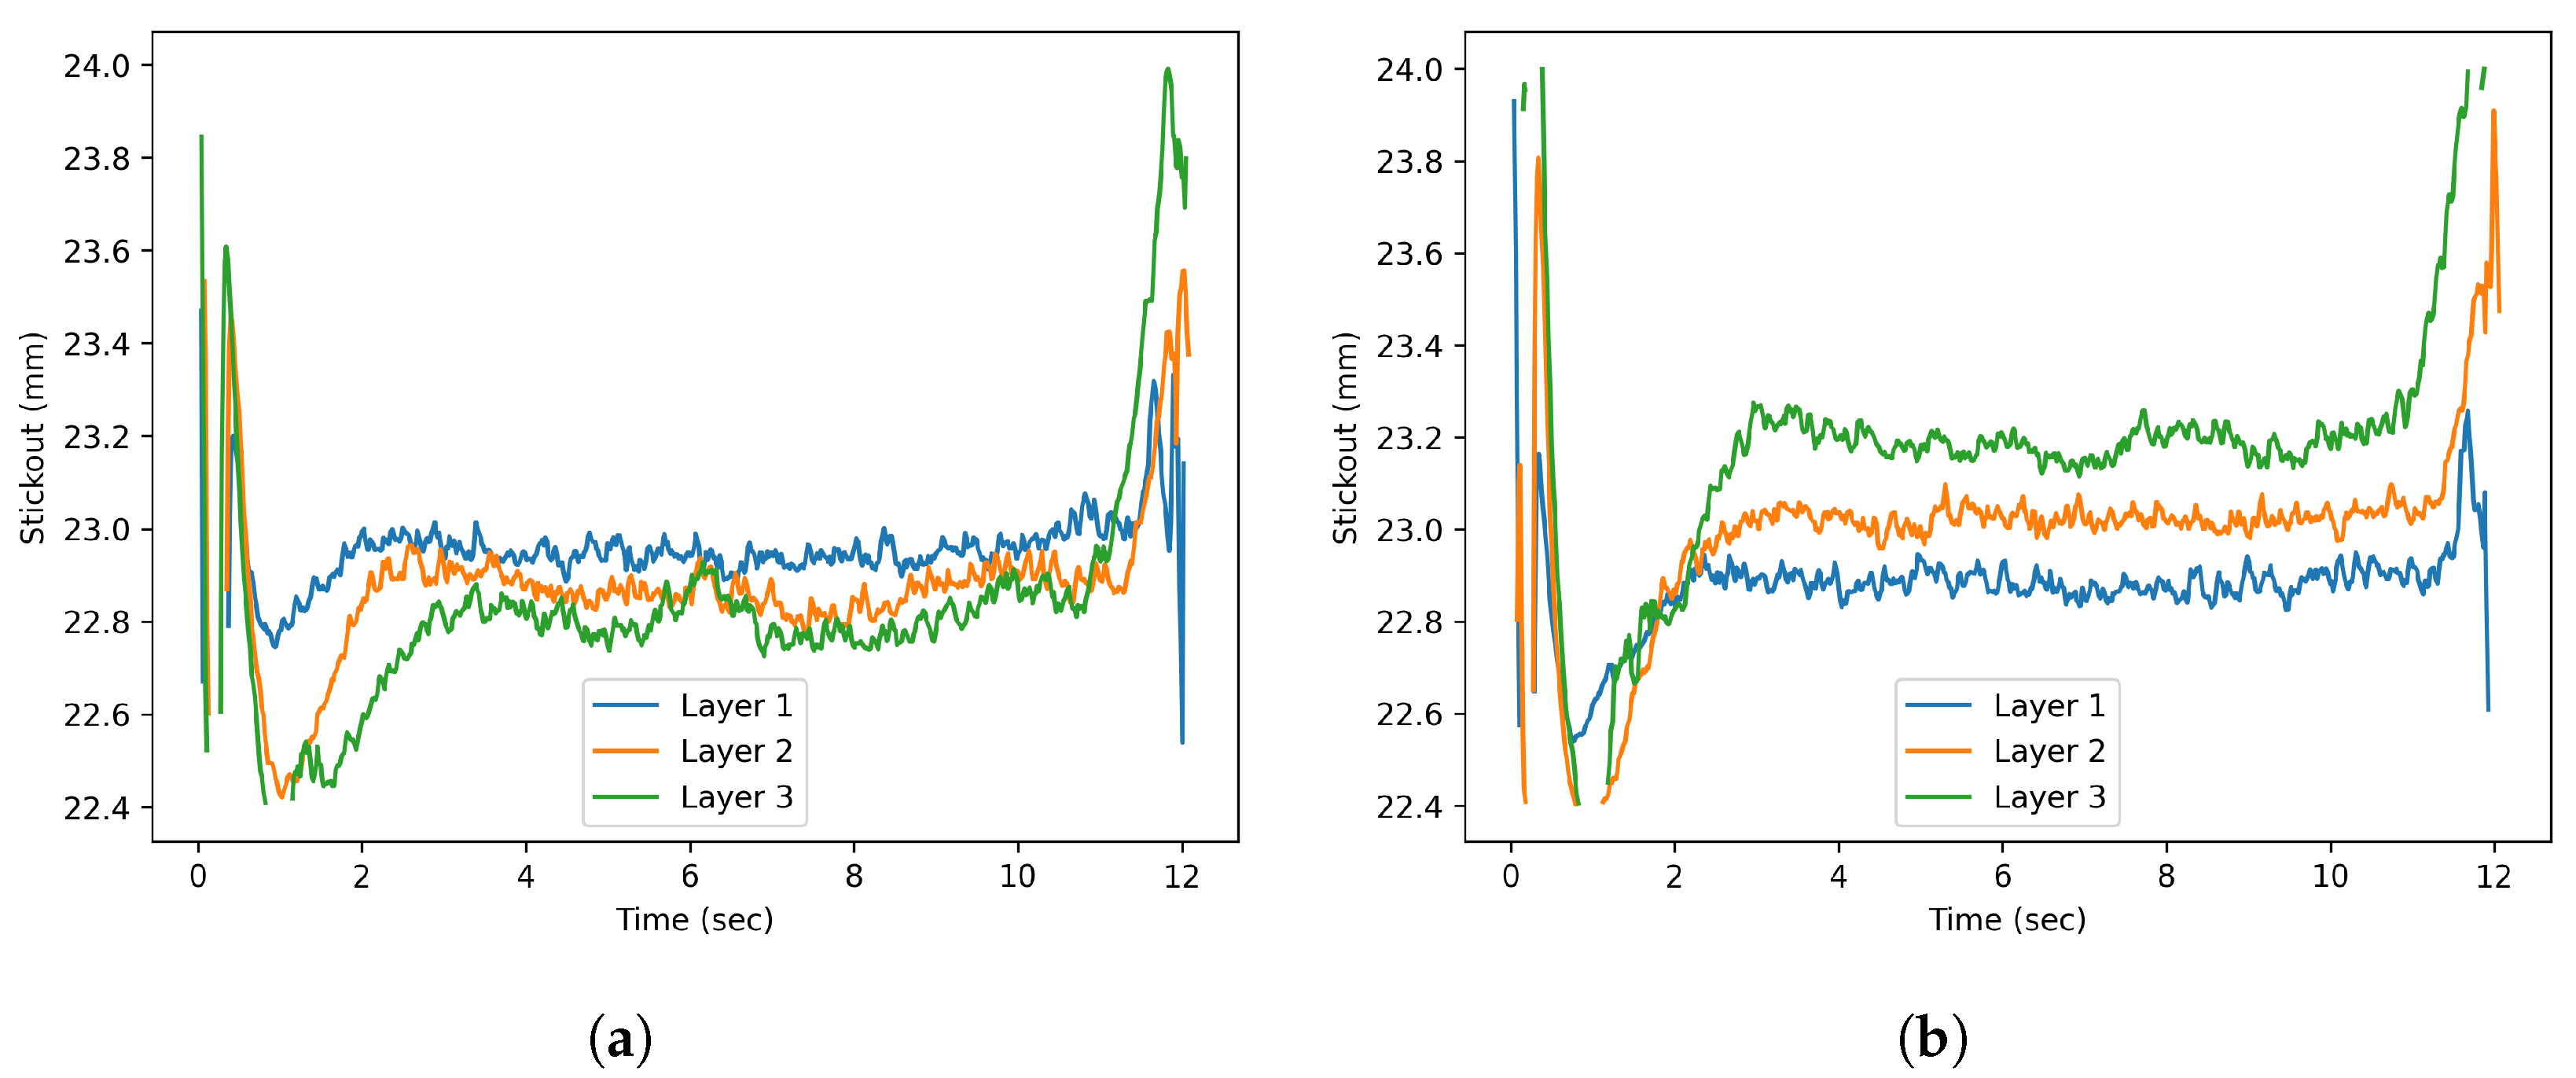
In order to validate whether the tool can measure changes in the stickout position between layers, three-bead-tall walls were deposited with varying Z-increment heights. The first wall utilized a Z-increment of 0.060″ and the second wall utilized a Z-increment of 0.070″. The wire stickout height was measured for every deposition and is plotted in Figure 11. The nominal bead height for both walls was roughly 0.065″. Figure 11a shows that when the programmed Z-increment is lower than the deposited bead height, the measured stickout decreases. Figure 11b shows that when the programmed Z-increment exceeds the deposited bead height, the stickout increases.

3.2. Control Results

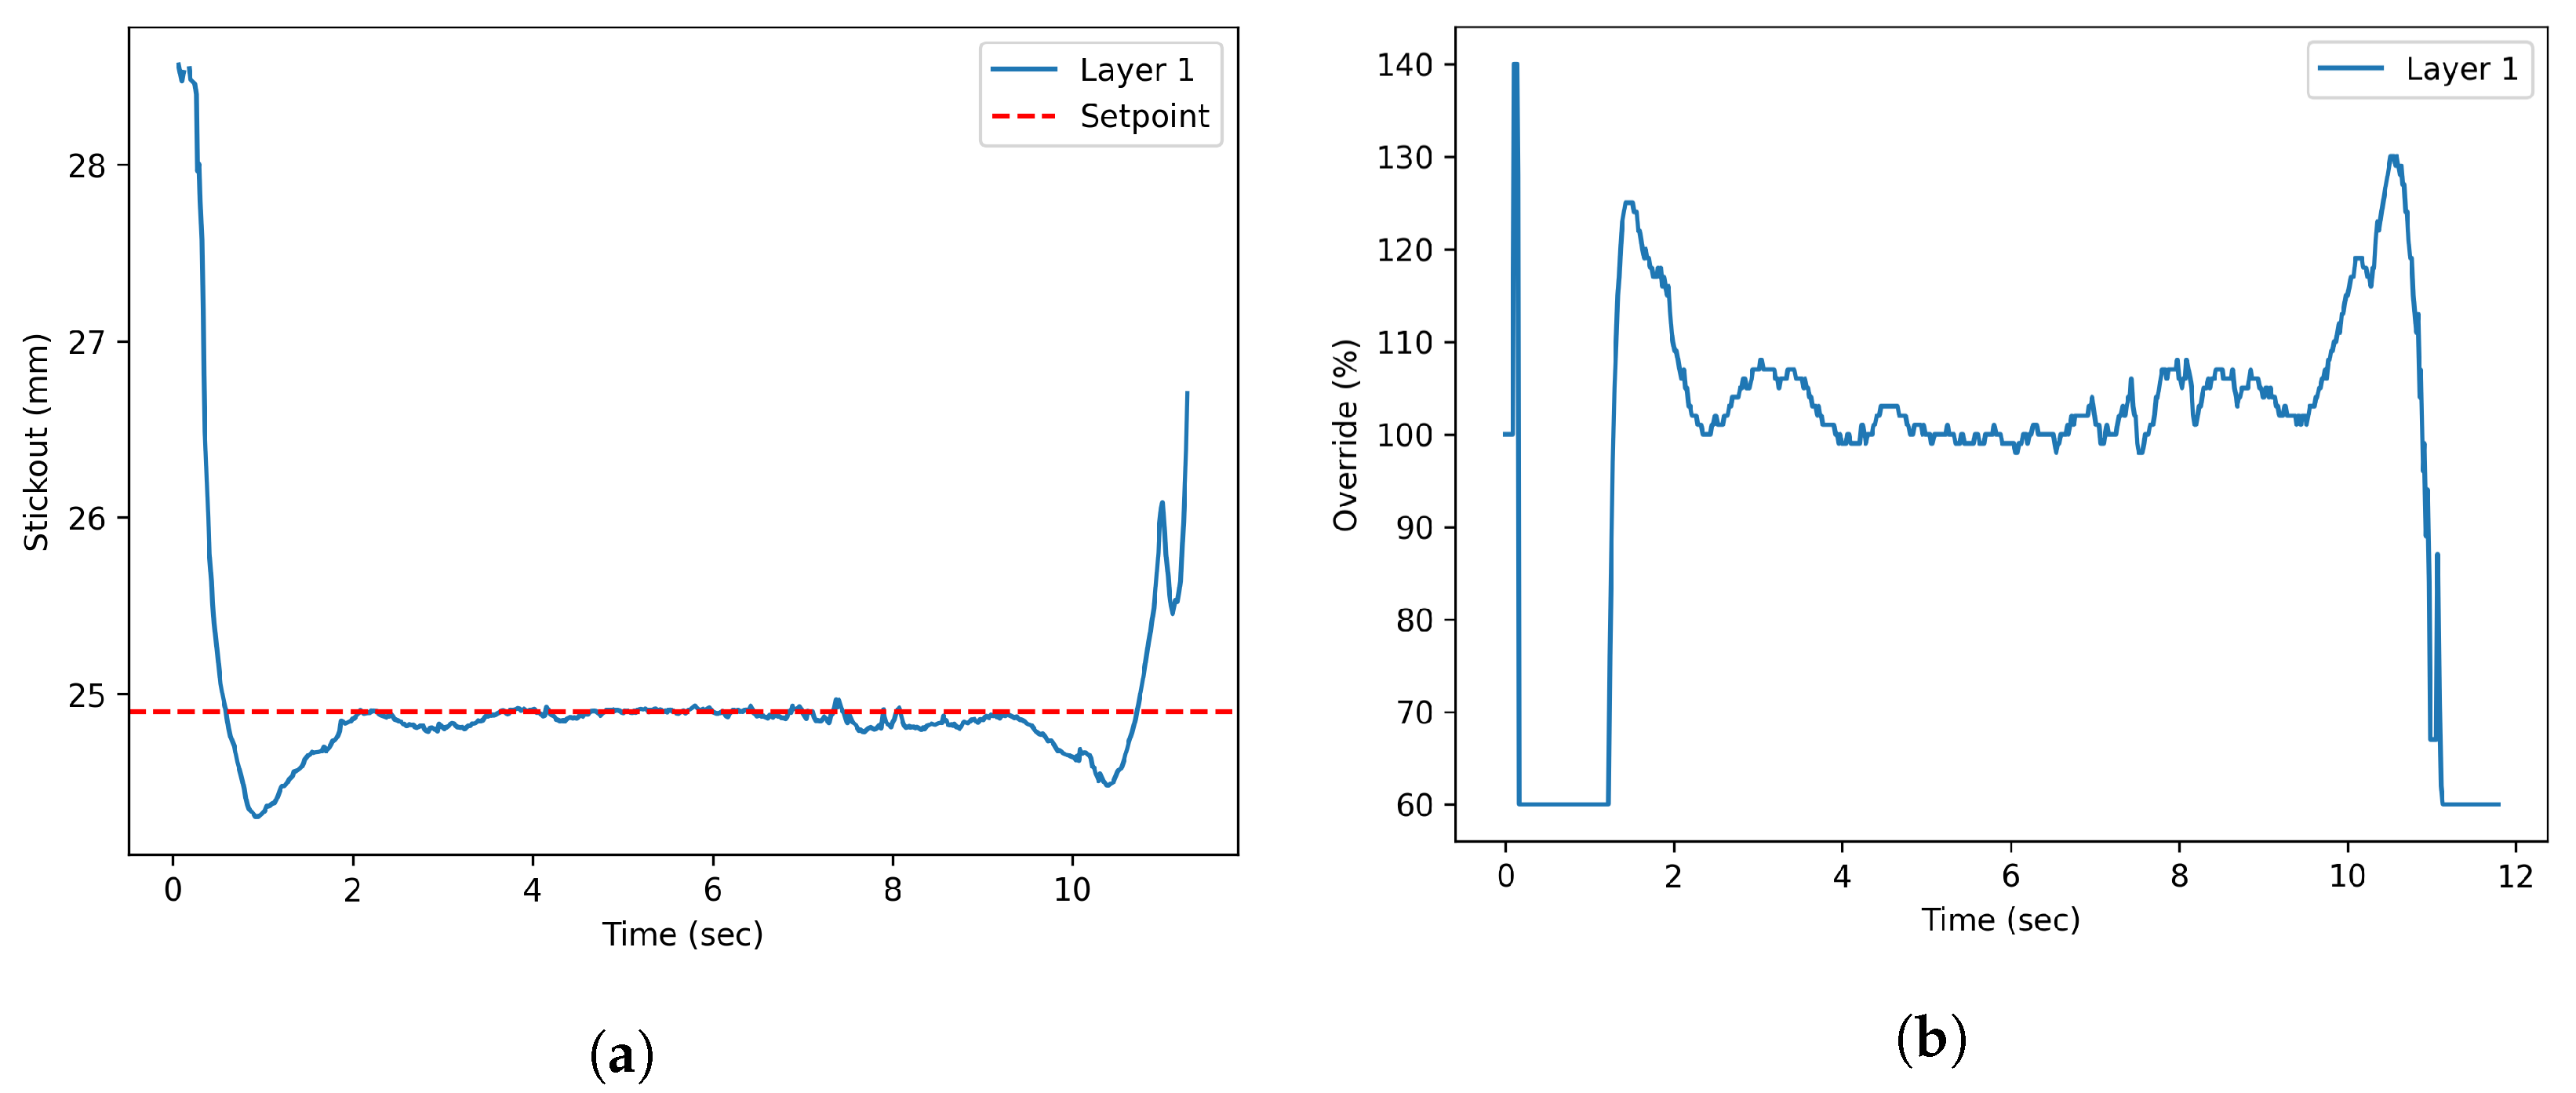
Figure 12b shows the output of the control system with gains described above, when subjected to the input from Figure 12a. The control system produces the expected outcome which is an attenuated signal that is inversely proportional to the input. The robot slows down at high stickout locations and speeds up at low stickout locations. The steep portions at the beginning and end of the deposit represent the meltpool formation and retraction. The increase of speed near the beginning and end of the deposit is the control system responding to buildup on the edges as a result of the start and stop conditions. For machine safety, the output of the controller is clamped at 60% and 140%.
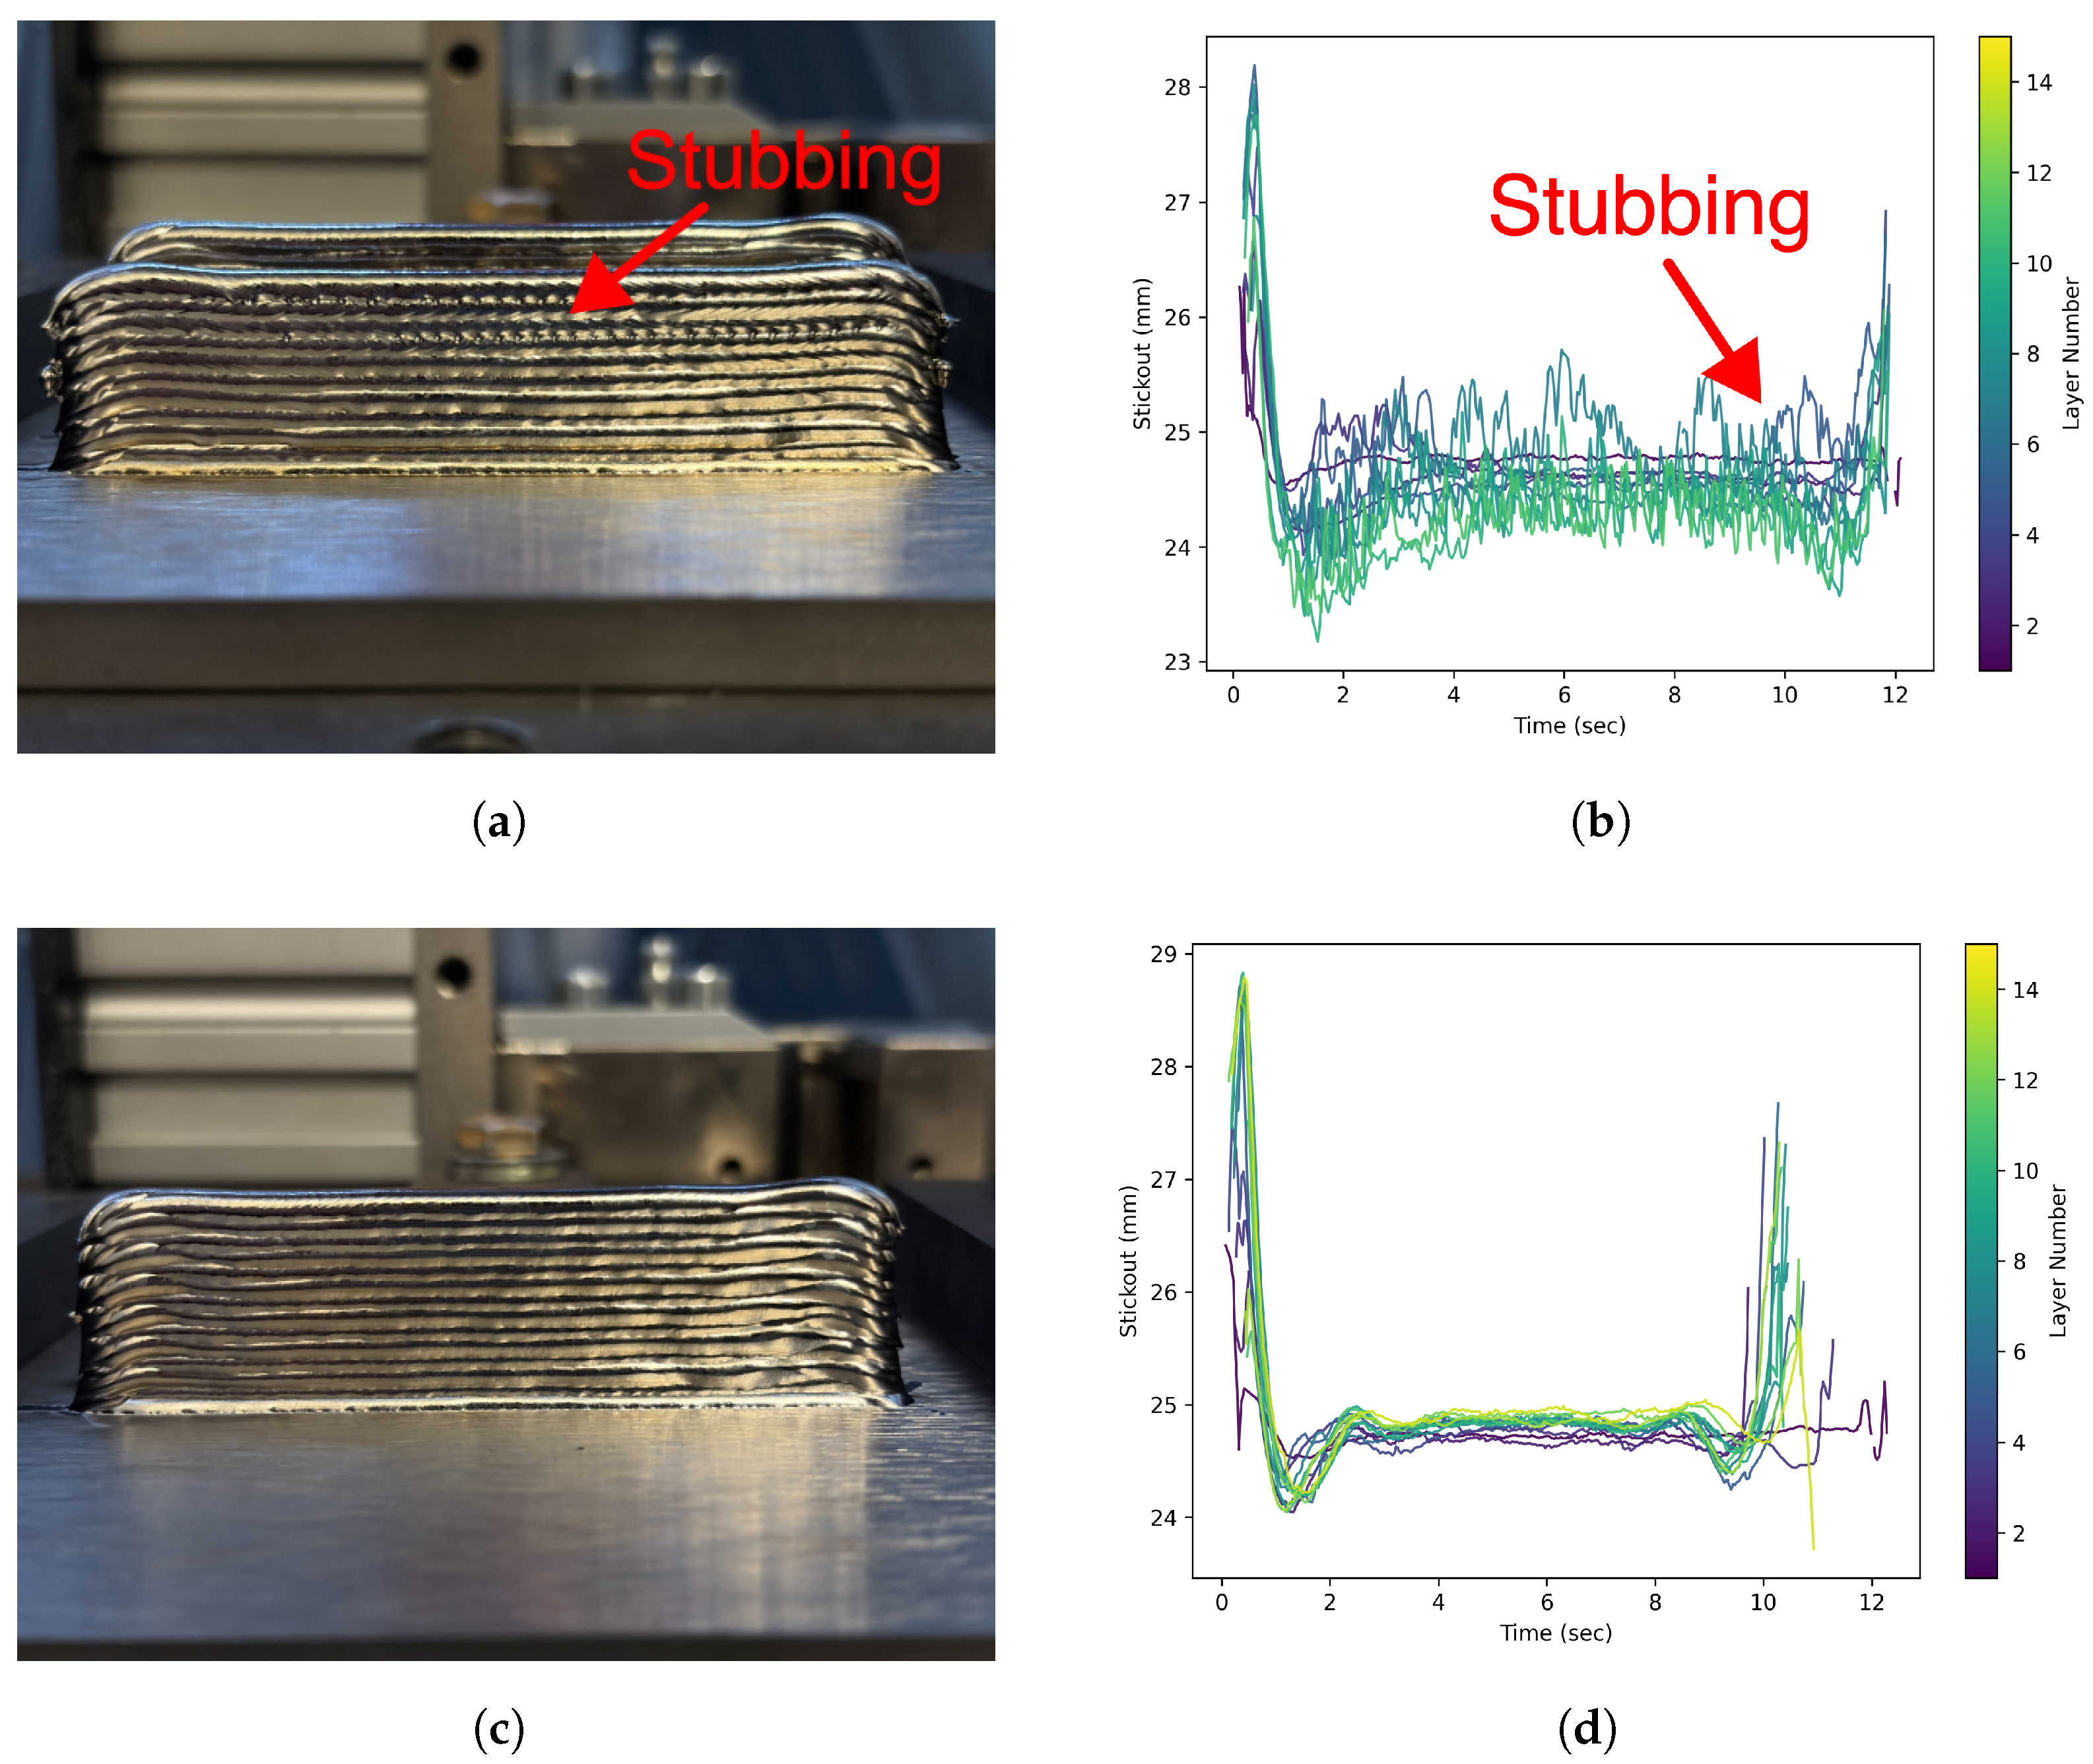
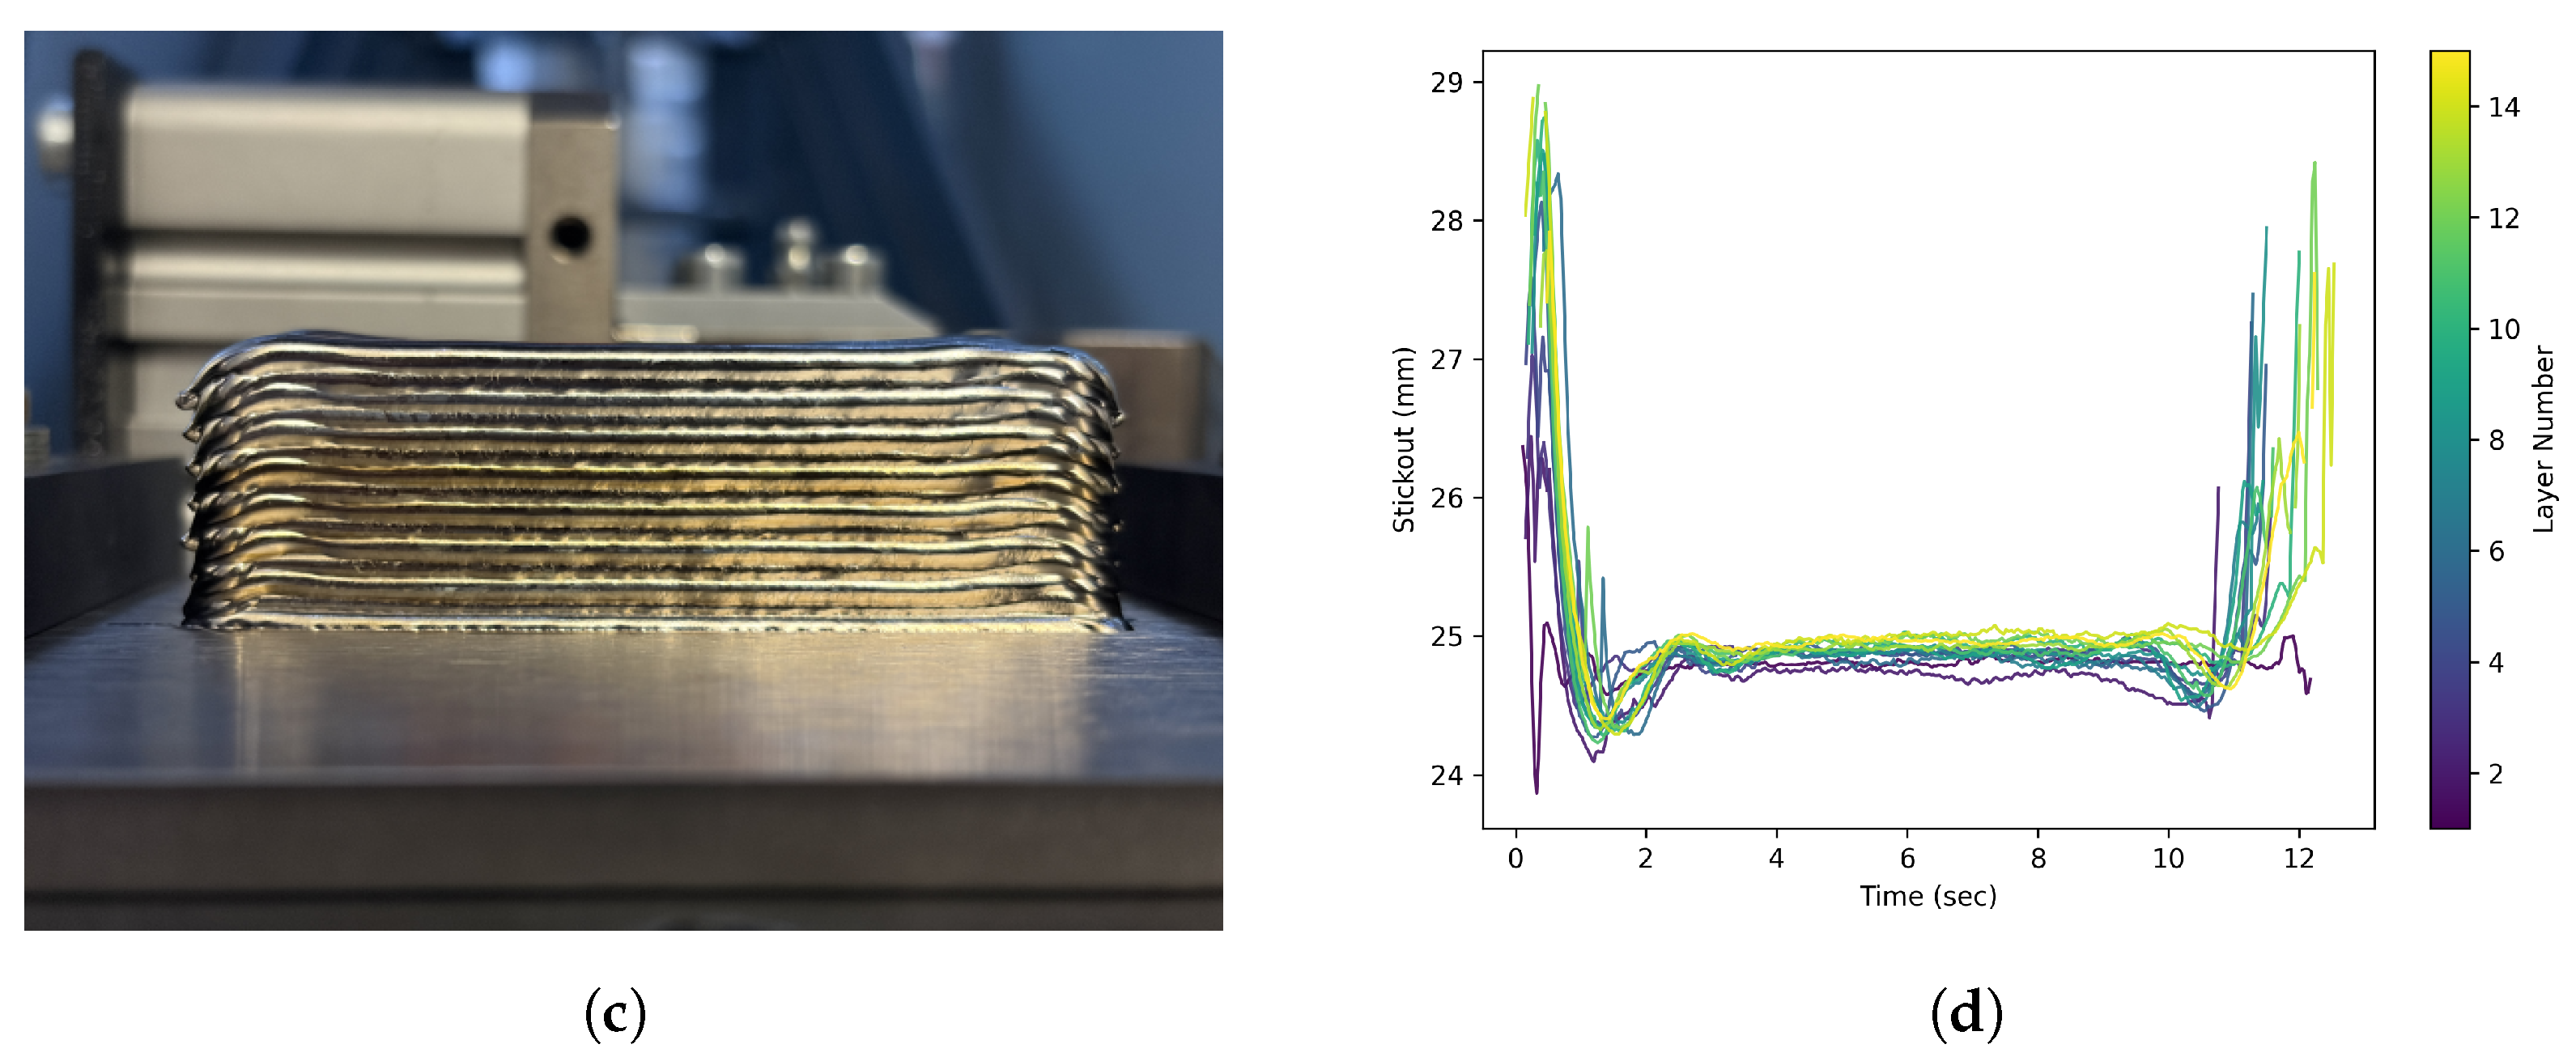
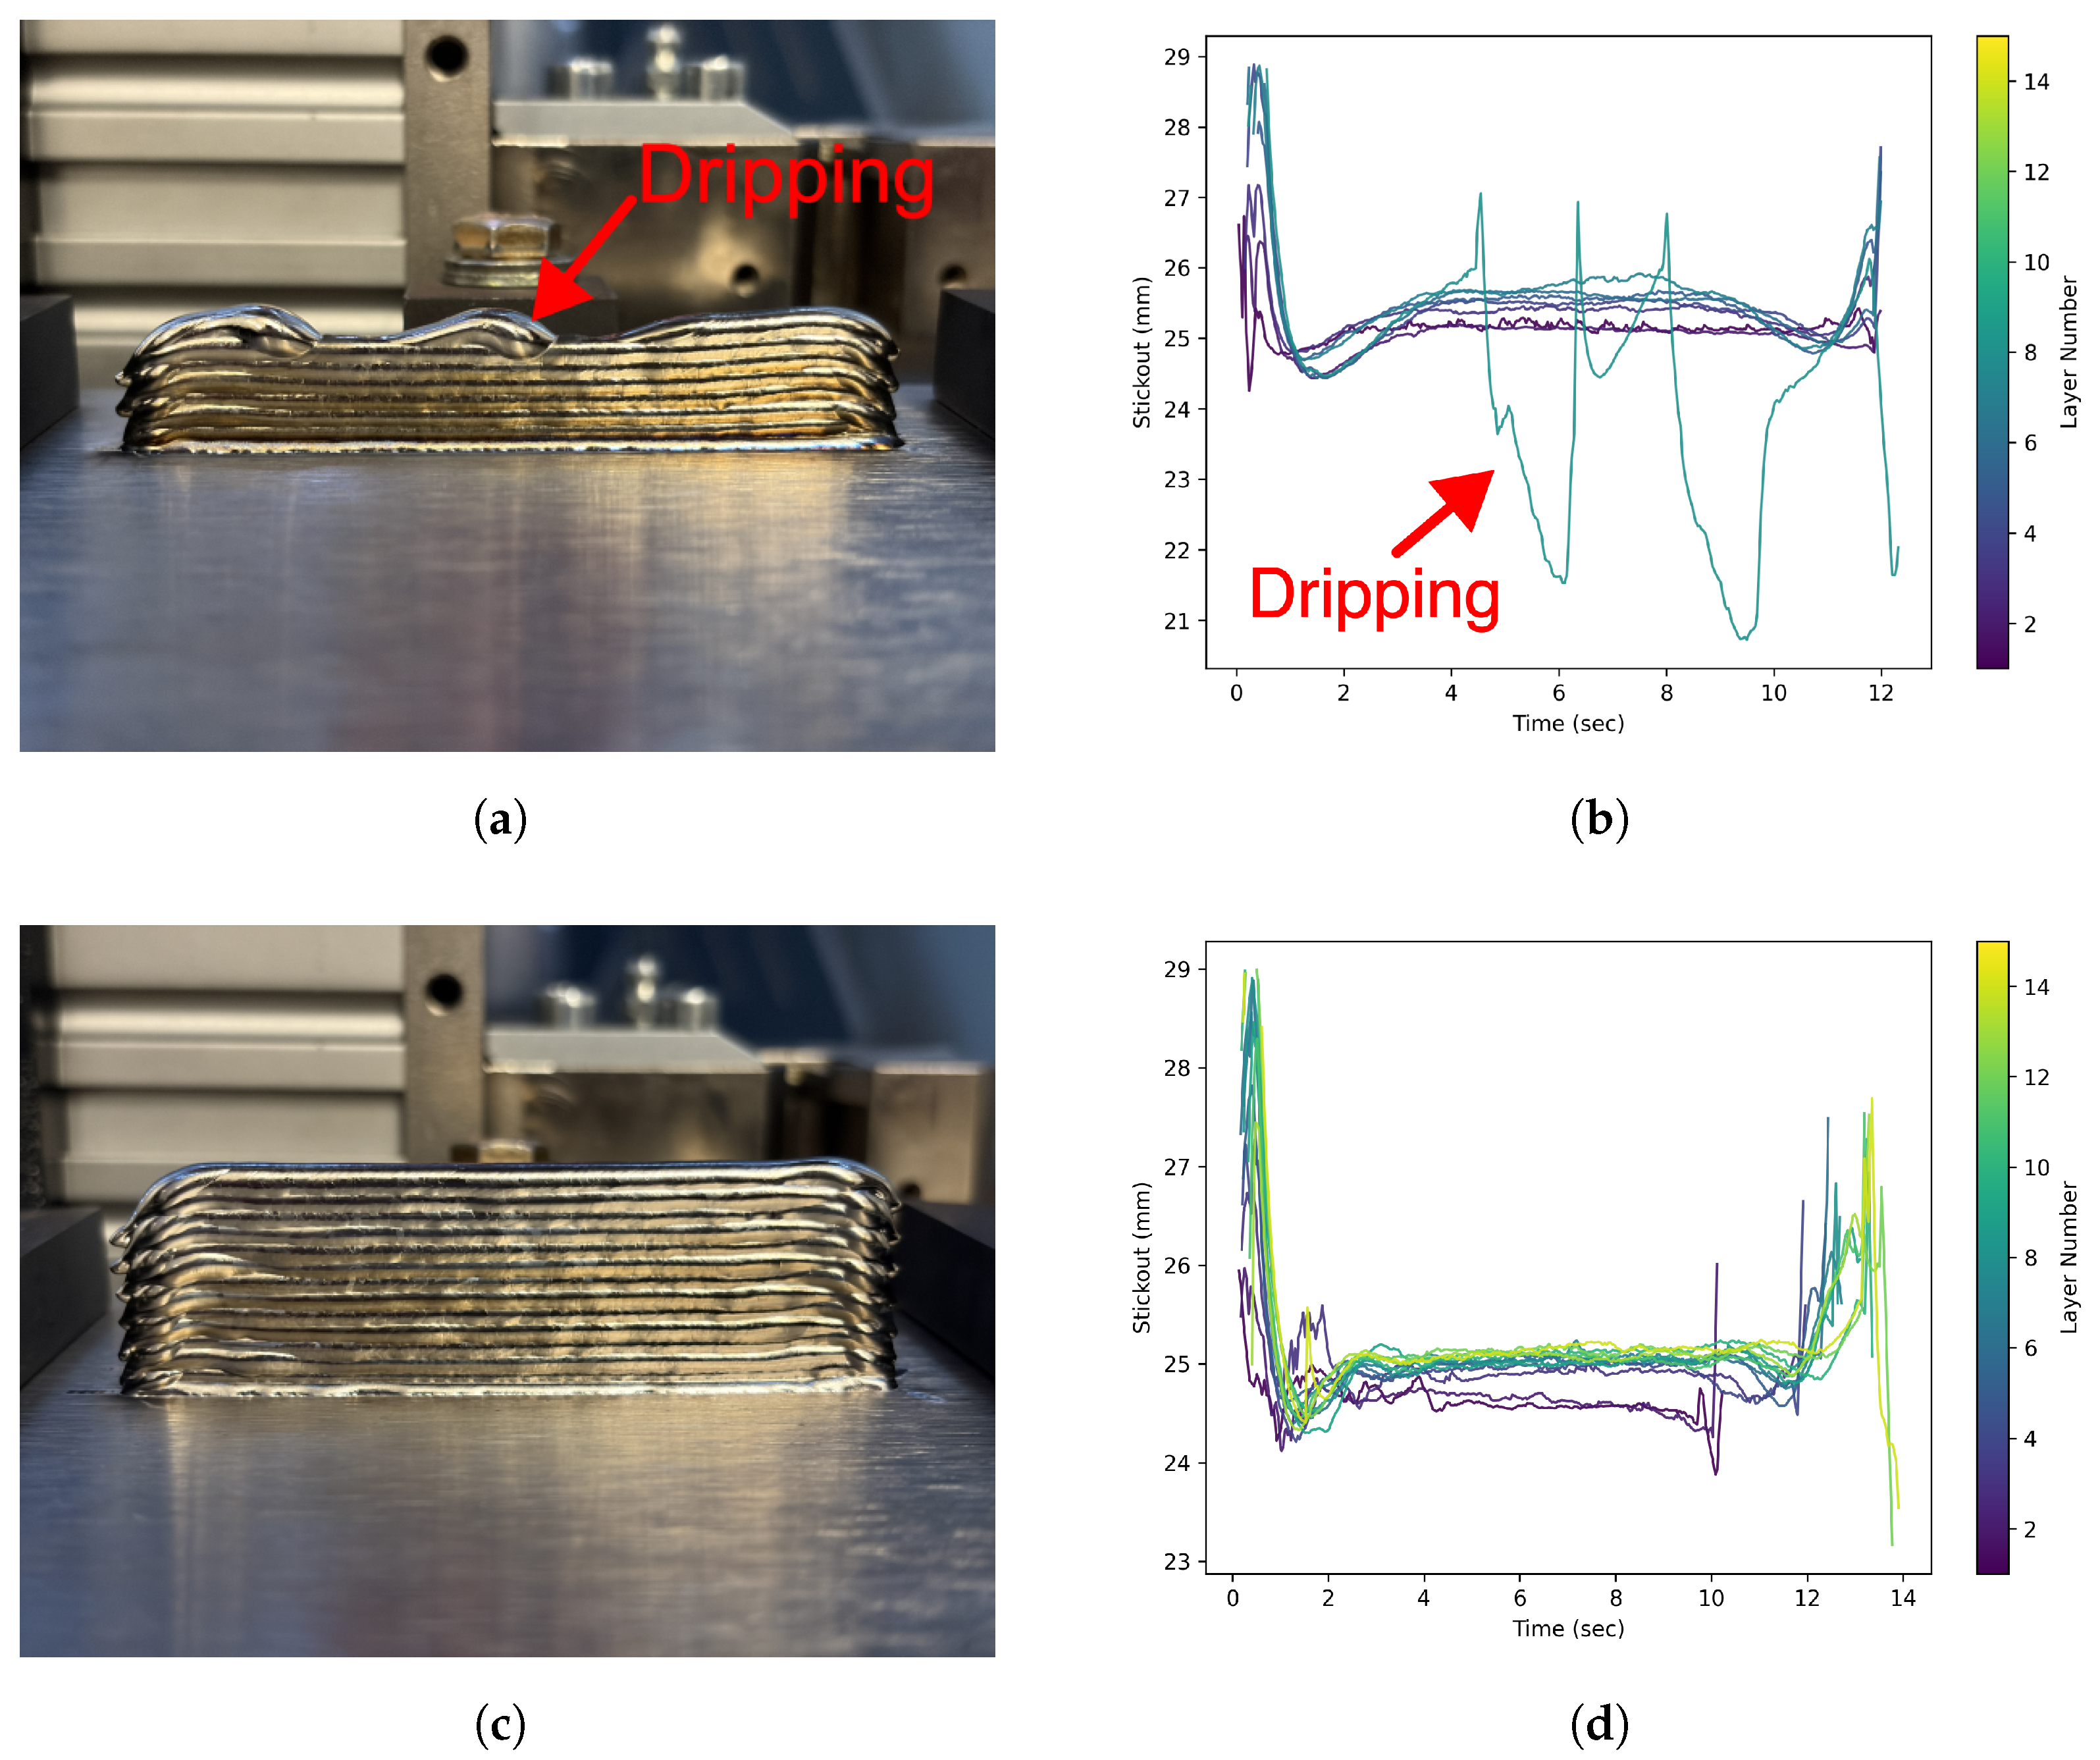
In order to test the control system’s ability to adjust deposition height in real time, six thin wall structures were deposited. Walls were made with 0.060″, 0.065″, and 0.070″ Z-increment heights, with and without control. The desired deposition height of each wall was 14 layers. Based on nominal parameters the height of each deposited bead was roughly 0.065″. All deposits with control reached the desired 14-layer-tall wall. The 0.065″ wall was the only uncontrolled wall that reached the desired 14 layers tall. Results for the 0.060″, 0.065″, and 0.070″ Z-increment deposits are shown in Figure 13, Figure 14, and Figure 15, respectively.

4. Discussion

4.1. Measurement Results Discussion

The stickout measurement profiles shown in Figure 9, Figure 10 and Figure 11 confirm that the vision tool successfully tracks relative changes in workpiece height throughout deposition. Figure 10 shows that whenever the deposition head travels over a low position in the workpiece, an increase in stickout measurement is observed. It can also be seen that as stickout height increases, the relationship with workpiece position becomes less direct. This is because the meltpool-wire energy balance changes, resulting in more energy incident upon the wire. This additional energy shifts the position of the wire–meltpool interface, as demonstrated in Figure 6.
The profile shown in Figure 9 is representative of multi-layer deposition, where material accumulation at bead start and stop locations produces locally raised segments, which manifest as reduced stickout near the beginning and end of each pass. This is contrasted with Layer 1 shown in Figure 11a,b, where the measurement remains relatively level following meltpool generation, because deposition is taking place on a flat substrate. The difference in these measurements highlights the physical characteristics of the measurement: the tool captures the surface profile of the substrate being deposited upon rather than the absolute height of the deposited bead. This distinction is important because the measurement represents geometric deviation from a nominal reference, which is sufficient for feedback control purposes but should not be interpreted as a direct bead height measurement.
A noted limitation of the tool is its sensitivity to instability during deposition. Stubbing events cause rapid and irregular movement of the wire inside the meltpool, making the wire–meltpool interface geometry difficult to track because of its irregular shape. Similarly, dripping deposition changes the expected shape and nominal position of the meltpool, degrading measurement quality. Because of these limitations, it would be advantageous to implement this tool in conjunction with the stability state classification tool discussed in [28]. Filtering stickout measurements based on stability classification would reduce the influence of instability events on the control signal.
The tool also demonstrated robustness to changes in deposition travel direction. Bidirectional measurement compensation was achieved by applying a single static directional offset, enabling consistent stickout measurement across opposing travel directions. While this approach is sufficient for the bidirectional geometry considered in this study, extension to full two-dimensional toolpath compensation could be achieved by mapping the sinusoidal directional response identified in Figure 5 to active travel direction.

4.2. Controls Results Discussion

As shown in Figure 13, Figure 14 and Figure 15, the machine-vision tool is capable of providing a control feedback signal to compensate for deposition height variances. A summary of these results is shown in Table 2. In the 0.060″ Z-increment case, shown in Figure 13, the programmed increment height was less than the nominal bead height, causing the workpiece to progressively approach the deposition head. Without control, measured stickout reduced across layers until stubbing became severe enough to halt the build at layer 11. The control system counteracted this trend by increasing feedrate to reduce material input per unit length, effectively limiting height accumulation and maintaining stable deposition through all 14 layers. Both deposits for 0.065″ increment height shown in Figure 14 were able to complete the full 14-layer build. However, material accumulation at bead start and stop points caused localized stubbing on the exterior edges of the uncontrolled wall in later layers. The control algorithm was able to reduce buildup at the beginning and end avoiding the localized stubbing effect. Results from Figure 15 show that without control, a programmed increment height of 0.070″ exceeded the nominal bead height, causing stickout to increase progressively as the workpiece fell further below the deposition head. This led to dripping deposition by layer 8. The control system responded by reducing feedrate to deposit additional material per unit length, recovering the nominal stickout and maintaining stable deposition through the full build.
A limitation of the current control strategy is the single-input, single-output framework. While feedrate adjustment is effective for correcting height deviations, it simultaneously alters the material input per unit length, resulting in effects on bead width and thermal history. Regions of the deposit that needed more material added to account for height have locally wider beads, resulting in nonuniform thickness throughout the wall. Furthermore, changes in the feedrate affect the energy distribution within the meltpool resulting in an uneven thermal history throughout the build. Coupling the feedrate controller with a laser power control loop could allow regulation of both geometric and thermal outputs, reducing these secondary effects. More broadly, a multi-input, multi-output control framework would treat the deposition process as a multi-variable optimization problem, where parameter adjustments maximize geometric accuracy while minimizing undesirable secondary effects such as width variation and thermal nonuniformity. The height measurement tool presented in this work could be incorporated as one sensing element within such a broader control architecture.

5. Conclusions

The objective of this work was to develop a machine-vision tool capable of in situ measurement and control of wire stickout during LWDED. In situ measurement of stickout can be used to compensate for variations in deposition height due to thermal accumulation throughout a build. Experimental validation demonstrated that the tool can accurately detect changes in stickout both within individual deposition tracks and across multiple layers. The stickout measurement tool was then used to create a successful control system that proved capable in its ability to correct for improper layer height Z-increments in thin-wall structures.
Future work will focus on further enhancing the capabilities of the tool, including:
  • Incorporating multi-directional compensation capability to support full two-dimensional motion.
  • Integrating transfer state classification to condition stickout measurements on process stability.
  • Incorporating the stickout sensor as one input within a broader multi-input, multi-output control framework.

Author Contributions

Conceptualization, B.M., R.M. and T.S.; methodology, B.M. and T.S.; software, B.M.; validation, B.M. and T.S.; formal analysis, B.M.; investigation, B.M. and T.S.; resources, F.L.; data curation, B.M.; writing—original draft preparation, B.M.; writing—review and editing, B.M., R.M., T.S. and F.L.; visualization, B.M., R.M., T.S. and F.L.; supervision, T.S. and F.L.; project administration, F.L.; funding acquisition, F.L. All authors have read and agreed to the published version of the manuscript.

Funding

This research utilized equipment made available by in kind contributions from GKN Aerospace.

Data Availability Statement

The original contributions presented in the study are included in the article. Further inquiries can be directed to the corresponding author.

Conflicts of Interest

Author Todd Sparks was employed by the company Product Innovation and Engineering. The remaining authors declare that the research was conducted in the absence of any commercial or financial relationships that could be construed as a potential conflict of interest.

Abbreviations

The following abbreviations are used in this manuscript:
LWDEDLaser wire directed energy deposition
DEDDirected energy deposition
PDProportional derivative

References

  1. Beyca, O.F.; Hancerliogullari, G.; Yazici, I. Additive Manufacturing Technologies and Applications. In Industry 4.0: Managing The Digital Transformation; Series Title: Springer Series in Advanced Manufacturing; Springer International Publishing: Cham, Switzerland, 2018; pp. 217–234. [Google Scholar] [CrossRef]
  2. Liu, Z.; He, B.; Lyu, T.; Zou, Y. A Review on Additive Manufacturing of Titanium Alloys for Aerospace Applications: Directed Energy Deposition and Beyond Ti-6Al-4V. JOM 2021, 73, 1804–1818. [Google Scholar] [CrossRef]
  3. Arunprasath, K.; Shanawaz, A.; Kavitha, S.; Narayanaperumal, S.; Solaman Bobby, S.; Velmurugan, G. Metallic additive manufacturing: State-of-the-art, process-structure-property relationships, and emerging trends. J. Mater. Res. Technol. 2026, 42, 1241–1275. [Google Scholar] [CrossRef]
  4. Ghanadi, N.; Pasebani, S. A Review on Wire-Laser Directed Energy Deposition: Parameter Control, Process Stability, and Future Research Paths. J. Manuf. Mater. Process. 2024, 8, 84. [Google Scholar] [CrossRef]
  5. Zapata, A.; Bernauer, C.; Stadter, C.; Kolb, C.G.; Zaeh, M.F. Investigation on the Cause-Effect Relationships between the Process Parameters and the Resulting Geometric Properties for Wire-Based Coaxial Laser Metal Deposition. Metals 2022, 12, 455. [Google Scholar] [CrossRef]
  6. Yang, T.; Liu, J.; Zhuang, Y.; Sun, K.; Chen, W. Studies on the formation mechanism of incomplete fusion defects in ultra-narrow gap laser wire filling welding. Opt. Laser Technol. 2020, 129, 106275. [Google Scholar] [CrossRef]
  7. Zhao, Y.; Yang, Q.; Huang, J.; Zou, J.; Wu, Y. Droplet transfer and weld geometry in laser welding with filling wire. Int. J. Adv. Manuf. Technol. 2017, 90, 2153–2161. [Google Scholar] [CrossRef]
  8. Krese, B.; Govekar, E. Recurrence quantification analysis of intermittent spontaneous to forced dripping transition in laser droplet generation. Chaos Solitons Fractals 2011, 44, 298–305. [Google Scholar] [CrossRef]
  9. Heralic, A. Monitoring and Control of Robotized Laser Metal-Wire Deposition. Ph.D. Thesis, Chalmers University of Technology, Göteborg, Sweden, 2012. [Google Scholar]
  10. Hagqvist, P.; Heralić, A.; Christiansson, A.K.; Lennartson, B. Resistance based iterative learning control of additive manufacturing with wire. Mechatronics 2015, 31, 116–123. [Google Scholar] [CrossRef]
  11. Croft, C. Research and Development of a Laser Hot Wire Deposition Process. Master’s Thesis, Missouri University of Science and Technology, Rolla, MO, USA, 2021. [Google Scholar]
  12. Heralić, A.; Christiansson, A.K.; Ottosson, M.; Lennartson, B. Increased stability in laser metal wire deposition through feedback from optical measurements. Opt. Lasers Eng. 2010, 48, 478–485. [Google Scholar] [CrossRef]
  13. Takushima, S.; Morita, D.; Shinohara, N.; Kawano, H.; Mizutani, Y.; Takaya, Y. Optical in-process height measurement system for process control of laser metal-wire deposition. Precis. Eng. 2020, 62, 23–29. [Google Scholar] [CrossRef]
  14. Heralić, A.; Christiansson, A.K.; Lennartson, B. Height control of laser metal-wire deposition based on iterative learning control and 3D scanning. Opt. Lasers Eng. 2012, 50, 1230–1241. [Google Scholar] [CrossRef]
  15. Maffia, S.; Krull, C.; Stittgen, T.; Wexel, H.; Zanger, F.; Koß, S.; Schleifenbaum, J.H. Optical Coherence Tomography (OCT) for Real-time Layer Thickness Monitoring in High-speed Laser Metal Deposition Process. BHM Berg- und Hüttenmännische Monatshefte 2025, 170, 179–187. [Google Scholar] [CrossRef]
  16. Onuseit, V.; Boley, S.; Brinkmeier, D.; Peter, A.; Menold, T.; Hagenlocher, C.; Graf, T.; Michalowski, A. Enhancing stability in thin-walled part production with L-DED wire using an adaptive controller. Procedia CIRP 2024, 124, 305–308. [Google Scholar] [CrossRef]
  17. Martikkala, A.; David, J.; Ylä-Autio, A.; Wiikinkoski, O.; Linnosmaa, E.; Ituarte, I.F. Cost-effective strategies for multi-layer height detection in LWDED. IET Conf. Proc. 2024, 2024, 80–87. [Google Scholar] [CrossRef]
  18. Sparks, T.E.; Tang, L.; Liou, F.W. Development of a Melt Pool Tracking Vision System for Laser Deposition. In Proceedings of the 20th Annual International Solid Freeform Fabrication Symposium, Austin, TX, USA, 3–5 August 2009; pp. 148–154. [Google Scholar]
  19. Xiong, J.; Zhang, Y.; Pi, Y. Control of deposition height in WAAM using visual inspection of previous and current layers. J. Intell. Manuf. 2021, 32, 2209–2217. [Google Scholar] [CrossRef]
  20. Lu, Y.; Xiao, M.; Chen, X.; Sang, Y.; Liu, Z.; Jin, X.; Zhang, Z. Online Measurement of Melt-Pool Width in Direct Laser Deposition Process Based on Binocular Vision and Perspective Transformation. Materials 2024, 17, 3337. [Google Scholar] [CrossRef] [PubMed]
  21. Hsu, H.W.; Lo, Y.L.; Lee, M.H. Vision-based inspection system for cladding height measurement in Direct Energy Deposition (DED). Addit. Manuf. 2019, 27, 372–378. [Google Scholar] [CrossRef]
  22. Flores, J.; Cabanes, I.; Gutierrez, A.; de Calle, K.L.; Gonzalo, O.; Portillo, E. An innovative smart monitoring system for DED-LB/MW process stability based on machine learning techniques. Int. J. Adv. Manuf. Technol. 2025, 137, 1759–1773. [Google Scholar] [CrossRef]
  23. Li, H.; Hu, L.; Ye, J.; Wei, W.; Gao, X.; Qian, Z.; Long, Y. A high-precision in situ monitoring system for laser directed energy deposition melt pool 3D morphology based on deep learning. J. Intell. Manuf. 2025, 36, 5525–5544. [Google Scholar] [CrossRef]
  24. Yu, M.; Zhu, L.; Ning, J.; Yang, Z.; Jiang, Z.; Xu, L.; Wang, Y.; Meng, G.; Huang, Y. Machine vision and novel attention mechanism TCN for enhanced prediction of future deposition height in directed energy deposition. Mech. Syst. Signal Process. 2024, 216, 111492. [Google Scholar] [CrossRef]
  25. Mathenia, R.; Flood, A.; McLain, B.; Sparks, T.; Liou, F. Effects of Laser Defocusing on Bead Geometry in Coaxial Titanium Wire-Based Laser Metal Deposition. Materials 2024, 17, 889. [Google Scholar] [CrossRef]
  26. Suzuki, S.; Abe, K. Topological structural analysis of digitized binary images by border following. Comput. Vis. Graph. Image Process. 1985, 30, 32–46. [Google Scholar] [CrossRef]
  27. Bradski, G. The OpenCV Library. Dr. Dobb’s J. Softw. Tools 2000, 25, 120–123. [Google Scholar]
  28. McLain, B.; Mathenia, R.; Sparks, T.; Liou, F. Machine Vision to Provide Quantitative Analysis of Meltpool Stability for a Coaxial Wire Directed Energy Deposition Process. Materials 2024, 17, 5311. [Google Scholar] [CrossRef]
Figure 1. Illustration showing the effect of changing deposition height on the energy shared between the wire and workpiece. (a) Ideal workpiece location; (b) low workpiece location; (c) high workpiece location.
Machines 14 00534 g001
Figure 2. Setup of processing optic integrated with a delta robot, laser input, and wire input [25]. (a) Missouri S&T LWDED cell. The working area is enclosed in an argon tent to reduce oxidation during deposition. (b) Visible light processing camera. The blue bracket is designed to shield the camera from the argon tent.
Machines 14 00534 g002
Figure 3. Meltpool image with detected wire–meltpool interface contour visualized in pink.
Machines 14 00534 g003
Figure 4. Visualization of the steps of the machine vision algorithm. (a) Original meltpool image. (b) Binary threshold applied—Equation (1). (c) Outer contour points—Equation (3). (d) Meltpool upper boundary—Equation (6). (e) Meltpool-wire interface—Equation (9).
Machines 14 00534 g004
Figure 5. Relationship between viewing angle and perceived wire stickout. (a) Image from viewing angle simulation. Red represents the meltpool and the green contour shows the intersection location. (b) Plot showing the difference in height with change in viewing angle. A sinusoidal fit was applied to the data.
Machines 14 00534 g005
Figure 6. Schematic depicting the deposit location measured by the machine vision tool for deposit over a flat substrate and slot. (a) Vision measurement point for a deposit with desired stickout. (b) Vision measurement point for a deposit with consistent high stickout.
Machines 14 00534 g006
Figure 7. Block diagram of the wire–stickout control structure.
Machines 14 00534 g007
Figure 8. Data flow diagram showing how measurements from camera images pass to the machine controller.
Machines 14 00534 g008
Figure 9. Stickout data for a stable deposition with material buildup at the beginning and end of the bead.
Machines 14 00534 g009
Figure 10. Stickout vs. time measurements from depositions over varying slot depths.
Machines 14 00534 g010
Figure 11. Stickout height measurements of three bead tall walls with different Z-increment heights. (a) Stickout measurement vs. time for 0.060″ in Z-increment height. (b) Stickout measurement vs. time for 0.070″ in Z-increment height.
Machines 14 00534 g011
Figure 12. Control system input and output signals for standard deposit. (a) Stickout measurement vs. time for deposition. Note that the setpoint is set to 1245 pixels for this test. (b) Feed override output signal vs. time from controller given relative input.
Machines 14 00534 g012
Figure 13. Control results from deposition with 0.060″ Z-increment height with and without control. Because the nominal bead height was 0.065″, the deposit becomes likely to stub as more layers are deposited. (a) Deposit with no control and 0.060″ Z-increment height. (b) Stickout vs. time measurement for 0.060″ Z-increment height with no control. (c) Deposit with control and 0.060″ Z-increment height. (d) Stickout vs. time measurement for 0.060″ Z-increment height with control.
Machines 14 00534 g013
Figure 14. Control results from deposition with 0.065″ Z-increment height with and without control. Because the nominal bead height was 0.065″, the Z-increment closely matches the deposited geometry, making this the most stable uncontrolled condition. Stubbing still occurs at the beginning and end of deposits due to material buildup from start and stop conditions. (a) Deposit with no control and 0.065″ Z-increment height. (b) Stickout vs. time measurement for 0.065″ Z-increment height with no control. (c) Deposit with control and 0.065″ Z-increment height. (d) Stickout vs. time measurement for 0.065″ Z-increment height with control.
Machines 14 00534 g014aMachines 14 00534 g014b
Figure 15. Control results from deposition with 0.070″ Z-increment height with and without control. Because the nominal bead height was 0.065″, the Z-increment exceeds the deposited geometry, making the deposit prone to dripping without corrective control. (a) Deposit with no control and 0.070″ Z-increment height. (b) Stickout vs. time measurement for 0.070″ Z-increment height with no control. (c) Deposit with control and 0.070″ Z-increment height. (d) Stickout vs. time measurement for 0.070″ Z-increment height with control.
Machines 14 00534 g015
Table 1. Measured system latency.
TaskTime (s)
Frame Capture0.0167
Machine Vision Computation 0.0036
Control Computation<0.0001
Communication 0.0041
Dynamic Response 0.040
Total 0.0645
Table 2. Summary of results from control testing.
TrialLayer CountFinal Mechanism
0.060″ No Control11Stubbing
0.060″ Control14Finished
0.065″ No Control14Finished
0.065″ Control14Finished
0.070″ No Control8Dripping
0.070″ Control14Finished
Disclaimer/Publisher’s Note: The statements, opinions and data contained in all publications are solely those of the individual author(s) and contributor(s) and not of MDPI and/or the editor(s). MDPI and/or the editor(s) disclaim responsibility for any injury to people or property resulting from any ideas, methods, instructions or products referred to in the content.