1. Introduction
In modern mechanical engineering, there is always a need to use improved methods and additions to existing surface machining processes [
1]. Powerful, efficient, and flexible laser processing technology is the most promising direction for improving the surface finishing process [
2]. The transition from contact sensors, detectors, and limit switches to contactless optical sensors requires increased attention to ensuring the conditions for their reliable operation. The operation of sensors in lighting conditions, in the presence of glare and flares, requires obtaining special marking surfaces that absorb light well to ensure better contrast, information content, and readability of information by optical sensors. Laser treatment is well-suited for this purpose. For example, femtosecond lasers can be used to make surface blackening, wettability and create surface microstructures with unique optical and sliding properties [
3,
4]. Laser irradiation makes it possible to create complex two-level microstructures [
5] that have roughness properties at the macroscopic and microscopic levels [
6]. The structures obtained as a result of laser processing can be periodic [
7] and formed either by controlled action or obtained in parallel with imparting other specified properties to the surface [
8,
9]. In modern industry, the fabrication of functional surfaces with nanometer precision is achieved through various techniques, with ultra-precision machining traditionally being prominent. Research into material removal mechanisms at the nanoscale and subsurface damage formation, including studies utilizing molecular dynamics (MD) simulations [
10], demonstrates the inherent complexity of achieving defect-free surfaces. To overcome the limitations of mechanical cutting, such as tool wear and microcrack formation in brittle materials, hybrid methods involving laser-assisted and vibration-assisted machining [
11,
12] have been actively developed. While the development of innovative multi-axis nano-machining devices enables the creation of hierarchical structures [
13], direct femtosecond laser treatment remains a unique non-contact method for rapidly modifying the optical properties of metals without the need for complex mechanical tooling. The effect of the laser processing method cannot be achieved by mechanical processing, such as cutting and grinding [
14]. The properties of the processed surface are assessed based on modern standards. The international standard ISO25178 offers dozens of parameters for determining the microstructure of the studied surface [
15]. Determining the pattern of changes in roughness parameters in the process of imparting the required surface properties improves the quality of production and control in the process of technical processing, helps to accelerate and simplify the implementation of these processes, and expands the scope of practical application of modern mechanical engineering standards. A practical study carried out to determine the effect of surface re-processing based on parameters characterizing the surface height distribution allows us to draw conclusions about the feasibility of re-processing for solving specific problems [
16,
17] of laser surface processing.
With the increasing role of standardization in modern mechanical engineering, the assessment of surface roughness parameters [
18] from the point of view of the ISO 25178 standard plays an important role. The real surface geometry is so complicated that a finite number of parameters cannot provide a full description [
19].
Standard ISO 25178 is a widely recognized reference framework of indices and procedures, which can help accelerate understanding of functional information. Such indices have been developed specifically for the micro-scale [
20]; however, they can also be successfully implemented in the case of larger scales [
21]. The standard defines material measures for the calibration of 2D-topography [
22] and 3D-topography measurement devices [
23]. Some of the suggested material measures have been established within the industrial application for a long time, while others [
24] have not yet been extensively researched regarding their practical abilities [
25]. Areal 3D analysis of surface texture gives more opportunities than a study of 2D profiles. Surface topography evaluation, considered as a 3D dimensional analysis [
26] in micro or nanoscales, plays an important role in many fields of science and life [
27,
28]. Among many texture parameters [
29], those connected with height are the most often used. However, there are many other parameters and functions that can provide additional important information regarding the functional behavior of surfaces [
30,
31] in different applications [
32,
33]. The mechanism driving the appearance change in the surface texture, topography, and roughness [
34,
35] of the treated samples has been studied by many researchers. The results indicate that the size and shape of laser processing-induced microscale cavities on the surface [
36] may account for the differences in the samples’ appearance [
2]. We study the correlation of the properties of surfaces processed with a femtosecond laser [
37,
38] with the values of the standard ISO 25178 parameters.
Recent advances in ultrafast laser surface functionalization have demonstrated the potential for precise control over material properties through the formation of Laser-Induced Periodic Surface Structures (LIPSS) [
39,
40]. These sub-wavelength structures can significantly modify the optical and wetting characteristics of austenitic stainless steels. However, achieving specific industrial goals, such as maximum blackening or superhydrophobicity, often requires multi-objective optimization strategies to balance surface roughness, processing speed, and chemical stability. While much research has focused on the low-fluence regime for regular nano-structuring, the transition to high-fluence, multi-stage processing remains a critical area for developing durable, high-contrast markers suitable for automated sensing environments. This study builds upon these developments by investigating the saturation limits of hierarchical structures formed under intensive ablation regimes.
Recent studies, synthesized in a comprehensive review [
41], highlight the role of periodic structures in surface engineering. Parallel to this, researchers have focused on multi-objective optimization to balance processing speed and optical performance, demonstrating that for austenitic steels, the transition from regular nanostructures to hierarchical micro-voids requires precise parameter control to avoid energy inefficiency.
2. Materials and Methods
Plates made of AISI 321 steel were processed using a high-power femtosecond fiber laser system, Jasper X0-20 (FLUENCE Technology, Warszawa, Poland). The choice of AISI 321 austenitic stainless steel as the substrate is dictated by its widespread application in critical industries, such as aerospace, nuclear, and chemical engineering, where components often operate under high temperatures and in corrosive environments. In such conditions, conventional marking methods (e.g., ink or chemical etching) are prone to degradation. Therefore, developing high-contrast, permanent laser-induced markers on this specific steel grade is essential for reliable automated tracking and sensor-based identification in harsh industrial settings. Furthermore, the presence of titanium as a stabilizing element in AISI 321 adds a unique metallurgical dimension to the study of laser-matter interaction and subsequent oxide layer formation. The sample dimensions were 0.035 m × 0.07 m × 0.0015 m. The laser radiation was delivered to the treated surface through a galvanometric scanning head. The main laser processing parameters used in the experiments are presented in
Table 1.
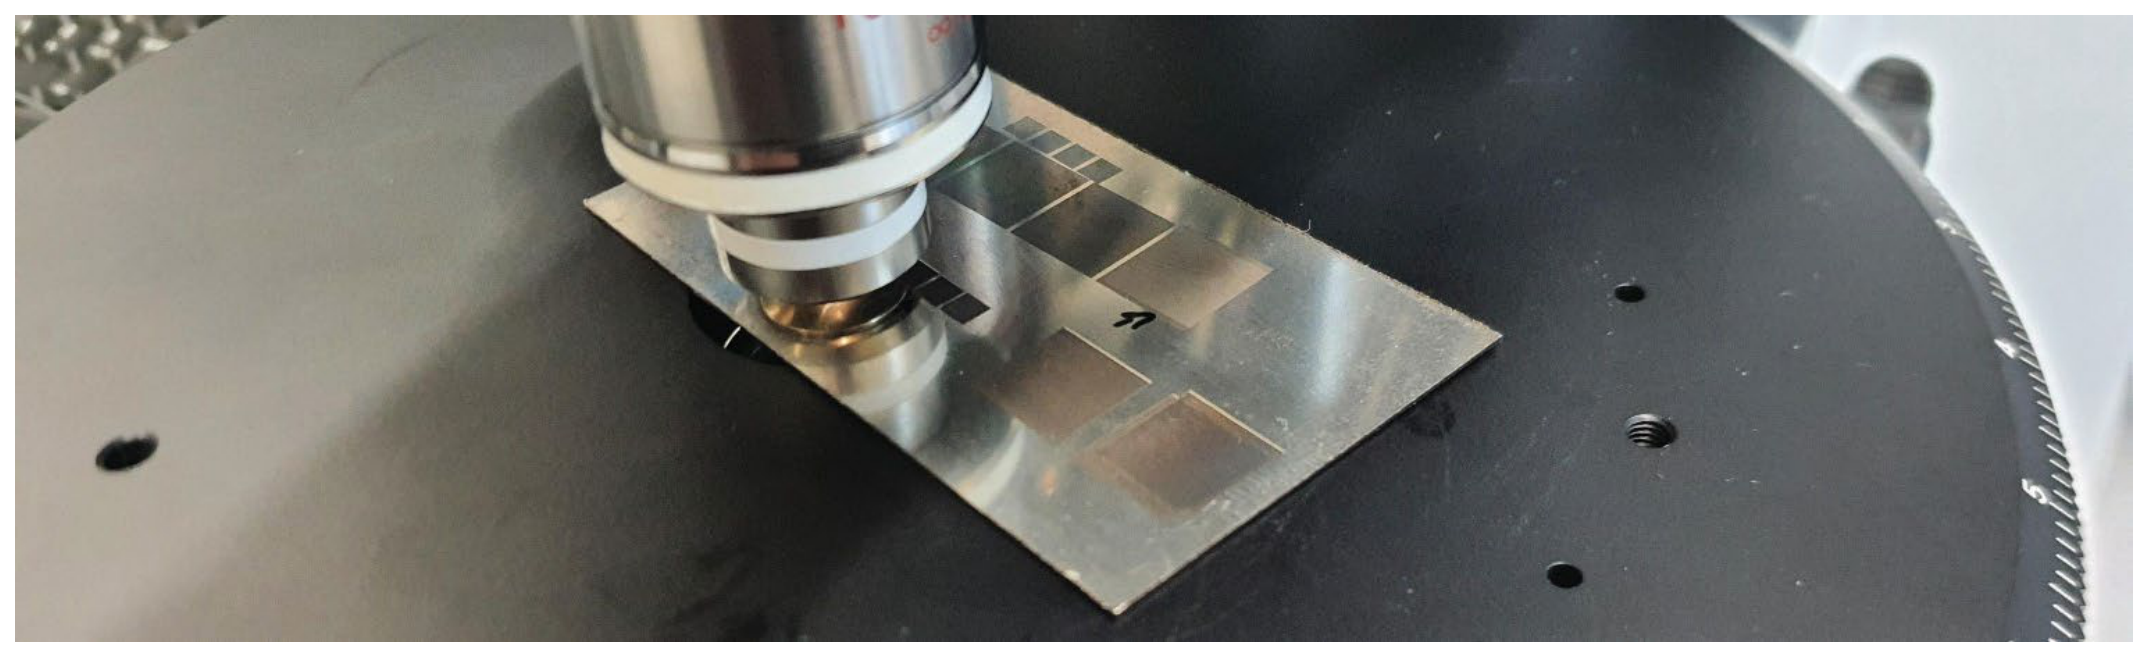
The laser operated with linear polarization, controlled by a half-wave plate. The pulse duration was less than 250 fs. Surface microrelief analysis was performed with the aid of a ZEISS AXIO HAL 100 optical microscope (
Figure 1, Carl Zeiss AG, Jena, Germany). Surface cross-sections were obtained using an Alicona IF-Portable RL optical microscope (Bruker Alicona, Graz, Austria).
To ensure the reproducibility of the results, surface topography measurements were performed in at least three independent regions for each sample. The obtained data were averaged, and the standard deviation was calculated to demonstrate statistical significance. The surface microrelief analysis was conducted using an Alicona IF-Portable RL system with a vertical resolution of 10 nm and a lateral resolution of 0.5 µm. Prior to the experimental series, the profilometer was calibrated using a certified step-height standard. Optical characterization was performed with a ZEISS AXIO HAL 100 microscope (Carl Zeiss AG, Jena, Germany), calibrated with a standard stage micrometer (10 µm division). The measurement uncertainty for the reported S-parameters was estimated to be within 1.0%.
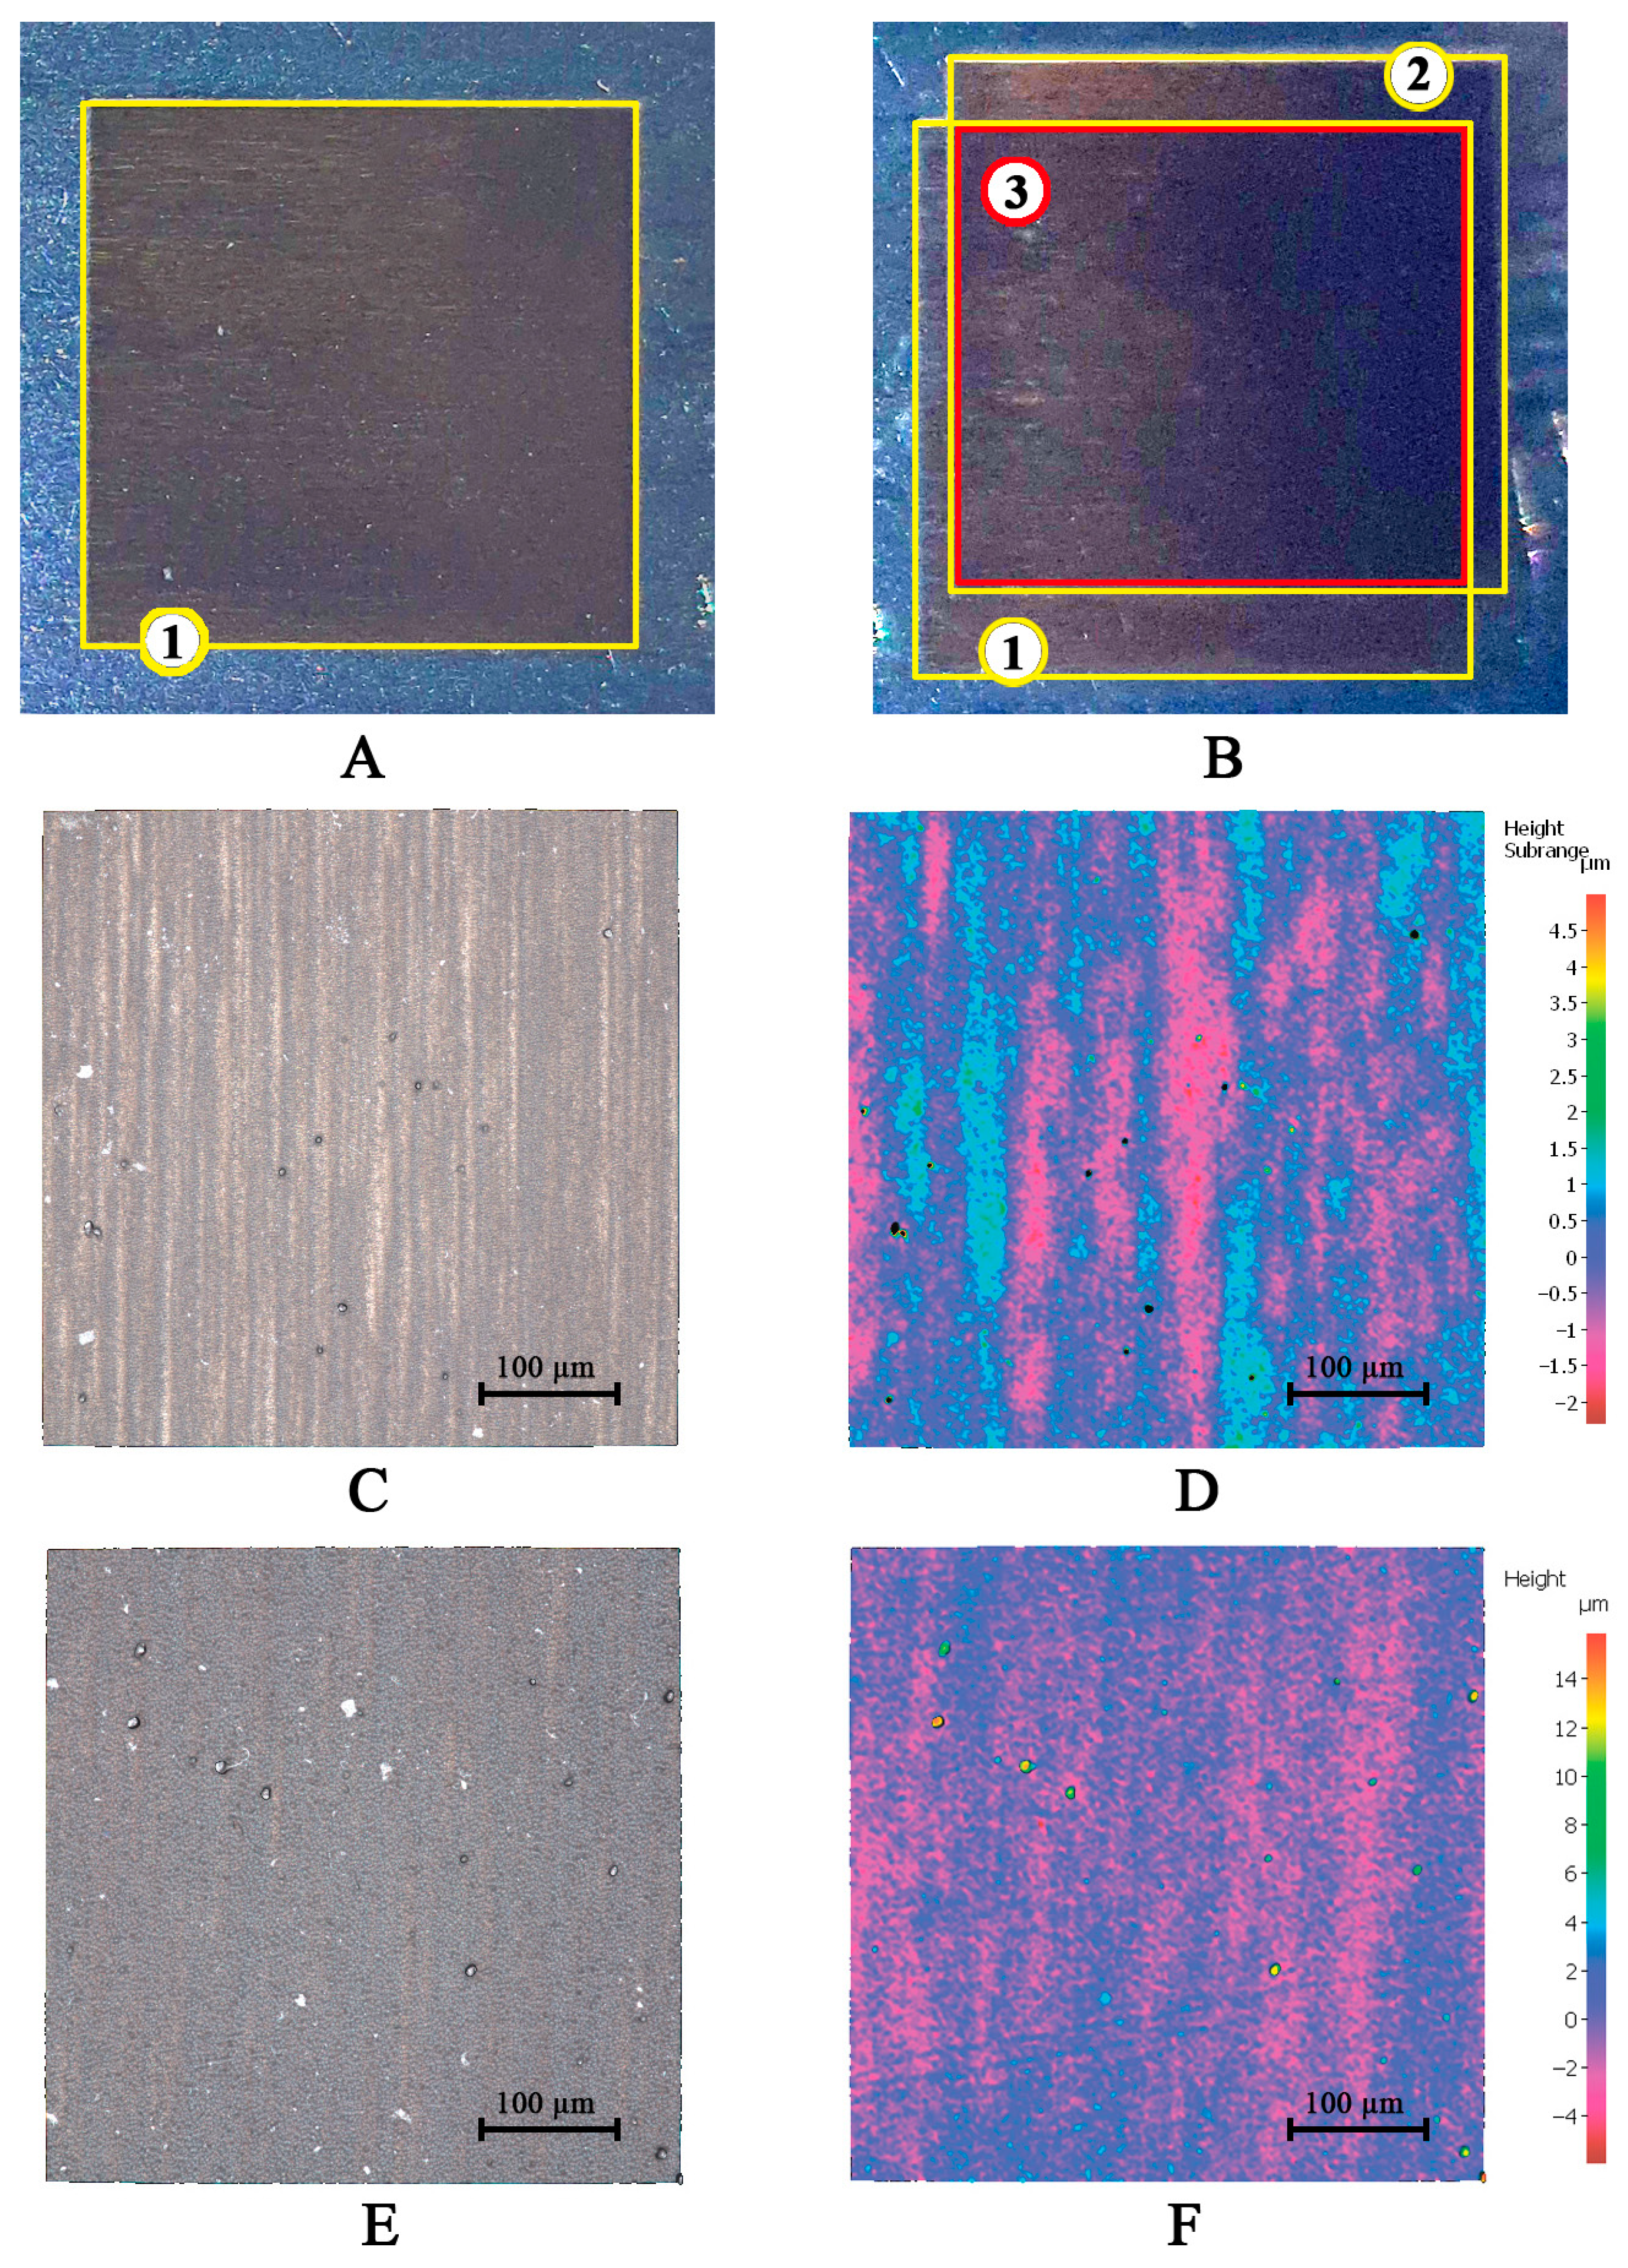
The properties of the first sample were studied after a single laser treatment of its surface (
Figure 2A, item 1). The surface of the second sample was processed in two stages. After an initial treatment similar to that of the first sample (
Figure 2B, item 1), the surface was secondary processed (
Figure 2B, item 2), resulting in an overlap zone of two sections of successive processing steps (
Figure 2B, item 3), where the surface was successively subjected to double laser irradiation. The scanning direction during secondary processing was perpendicular to the primary scanning direction. The rest of the laser processing parameters and energy values remained unchanged. The experiment yielded surfaces characterized by varying roughness profiles and distinct visual gradients of blackness (
Figure 2A, item 1,
Figure 2B, item 3).
The software used to process data obtained during microscopy is supplied with the equipment used and is therefore completely compatible with it.
When studying the properties of the surfaces studied, determining (Smr1, Smr2), asymmetry (Skewness) Ssk, kurtosis (Kurtosis), (Sku), and other indicators, technologies for assessing the surface microrelief are used in accordance with ISO 25178.
To characterize the surface properties, areal topography parameters, including material ratios (
Smr1,
Smr2), skewness
Ssk, and kurtosis (
Sku), were evaluated in accordance with the ISO 25178 standard:
where
The material portions of the peaks (Smr1) and the deeper valleys (Smr2), along with the reduced peak height (Spk) and reduced valley depth (Svk), were derived from the areal material ratio curve (Firestone-Abbott curve) using the microscope’s integrated software. The degree of blackening of the samples was assessed visually and in a graphical editor using color data in the HSB value range.
Verification of the spot size involved measuring the ablation zone widths on a Jeol 7001TTLS scanning electron microscope (SEM) at minimal pulse energies close to the ablation threshold, resulting in a value of 25 μm.
According to literature data for AISI 321 steel [
42,
43], the ablation threshold
Fth for femtosecond pulses is approximately 0.1−0.2 J/cm
2, corresponding to an optimal fluence for clean ablation of
Fopt ≈ 0.7−1.5 J/cm
2. In our study, a significantly higher fluence of
F0 > 20 J/cm
2 was employed, which is 15–20 times greater than
Fopt. This high-energy regime was chosen intentionally to ensure deep texturing and the formation of chaotic structures necessary for surface blackening. Consequently, the absence of minimal roughness in our results is entirely consistent with the theory, as the process occurs in an intensive ablation mode aimed at achieving maximum optical absorption rather than surface finishing or polishing. The use of a high overlap ratio (>95%) was an intentional choice. This facilitated a heat accumulation effect and enabled multiple exposures to the same zone, which is critical for the deep transformation of the micro-relief and for achieving maximum light absorption.
3. Results and Discussion
Visually, when assessing enlarged images of the surfaces of AISI 321 primary processing (
Figure 2C) and AISI 321 secondary processing (
Figure 2E), there are no indications that ordered periodic structures were formed (
Figure 2C,E). Surface height profiles captured both longitudinal (
Figure 3 and
Figure 4) and transverse (
Figure 5 and
Figure 6) of the laser scanning path further demonstrate the stochastic microstructure of the AISI 321 surfaces following primary and secondary processing.
The cross-sectional height curves of the surfaces (
Figure 2C,E) indicate the chaotic nature and lack of periodicity of the microstructure of the surfaces of AISI 321 primary processing and AISI 321 secondary processing, resulting in comparable color signatures (
Figure 2A,B), despite the difference in the number of surface treatment processes performed on samples.
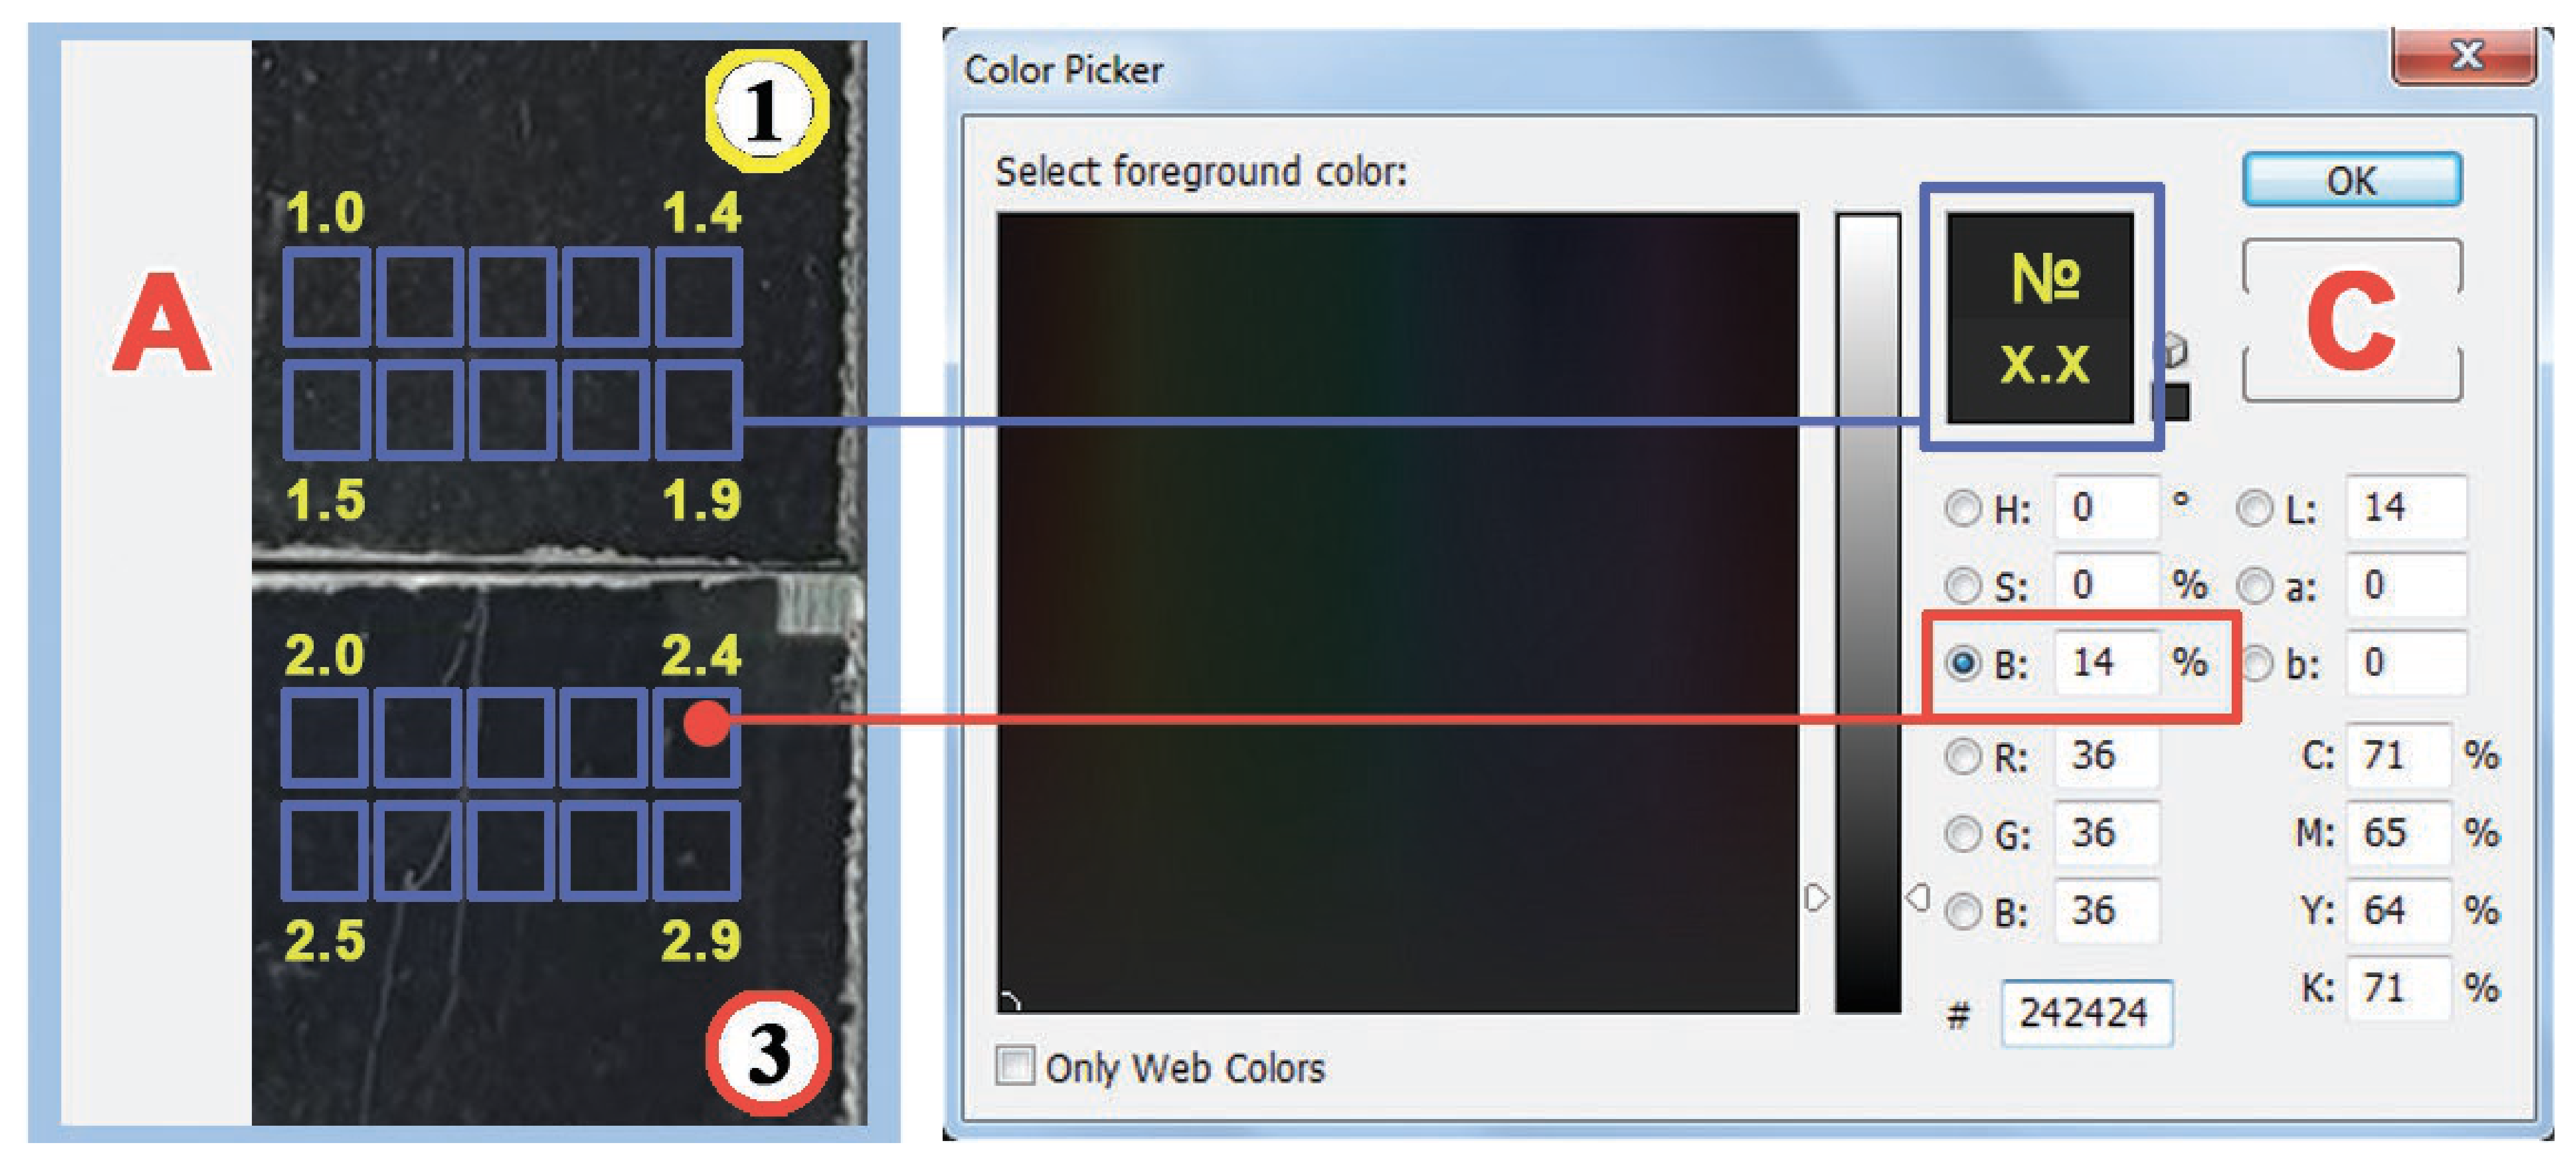
For objective verification of the results, the surface of the studied samples was divided into 10 regions, from 1.0 to 1.9 for the first sample and from 2.0 to 2.9 for the second sample (see
Figure 7). Data on the blackness in each region of both samples were obtained and the average values of blackness for the two samples were calculated.
To ensure maximum data fidelity and eliminate the influence of imaging conditions, such as light intensity, glare, and exposure, all investigated areas were photographed simultaneously in a single frame under diffused lighting. The subsequent segmentation of the image into individual zones was performed solely for the convenience of presentation in the manuscript. Thus, any recorded differences in HSB values are strictly attributable to the properties of the surface itself rather than the data acquisition conditions.
The averaged data for the analyzed specimens are summarized in
Table 2. Since the applied method quantifies surface brightness, the values decrease as the surface darkens, reaching 0% for an ideal black body (perfectly black surface).
The obtained data indicate a slight, within 2 percent (
Table 2), blackening of the surface after secondary processing. Thus, additional post-processing of the surface without changing the processing mode does not lead to a twofold increase in the degree of surface blackening compared to the nature of the surface blackening obtained as a result of the previous processing. Statistical analysis of the brightness (HSB) data revealed remarkable consistency in the measurement system. Despite the differences in mean blackening levels (16.6% and 14.4%), the standard deviation in both cases was an identical 0.7. Additionally, statistical significance was confirmed by a two-tailed Welch’s
t-test. The obtained
p-value (
p < 0.001) confirms that the instrumental error level remains constant throughout the digital image analysis, indirectly supporting the high reliability of the observed 5% increase in the Blackening value.
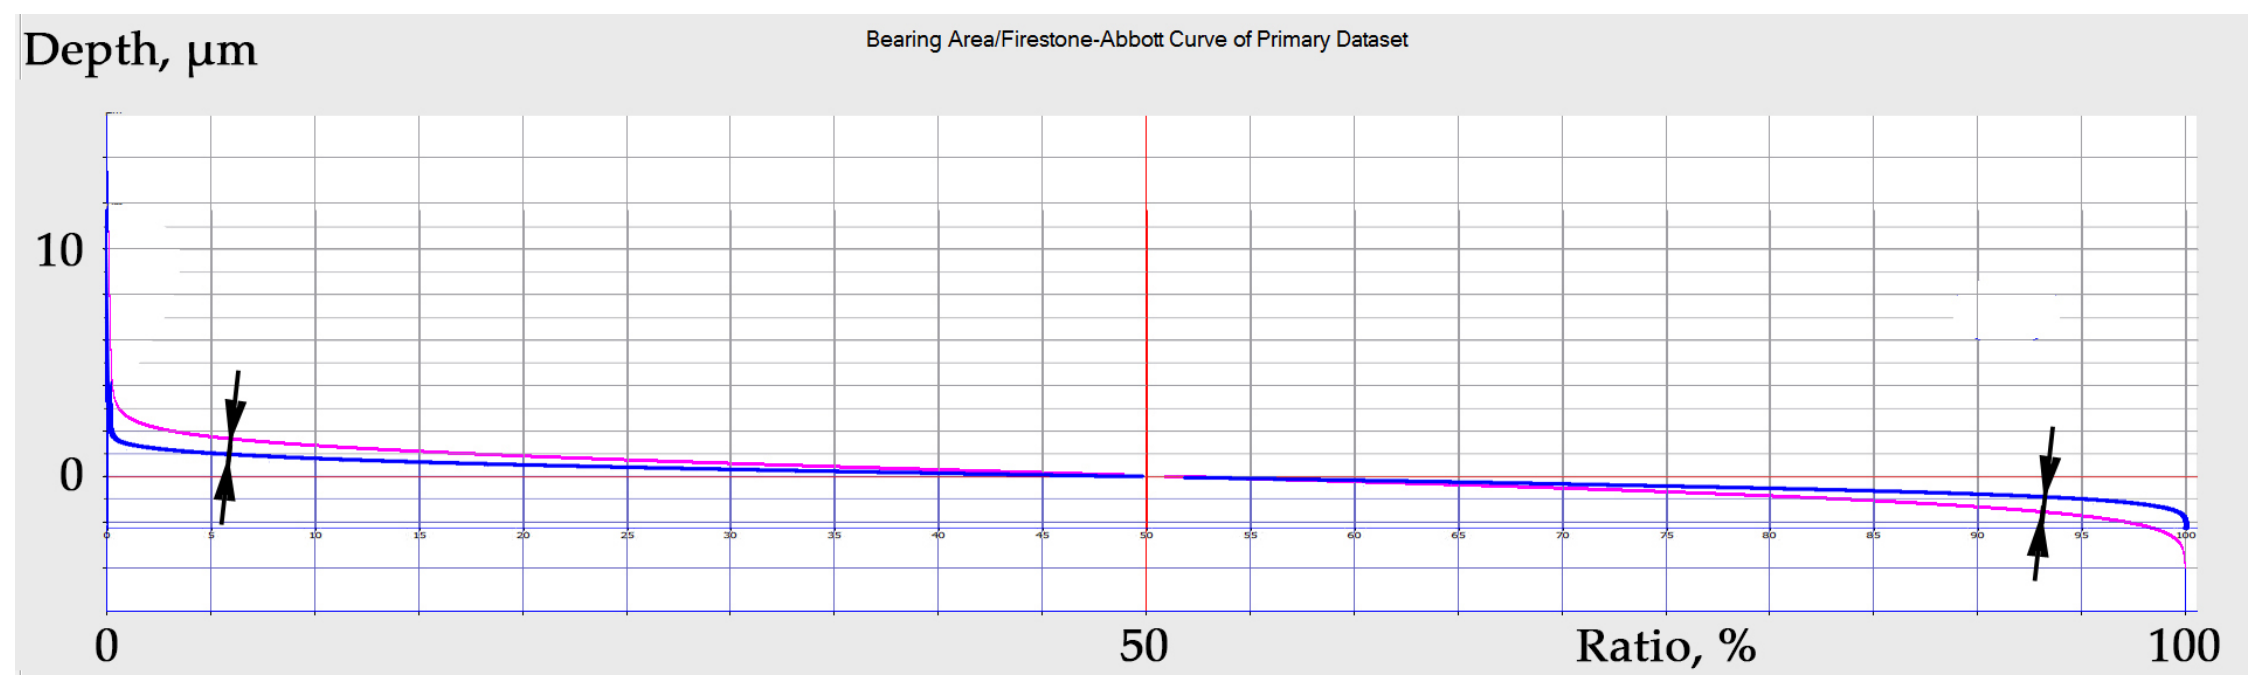
The comparative analysis of the surface truncation coefficients for a scale-limited area (
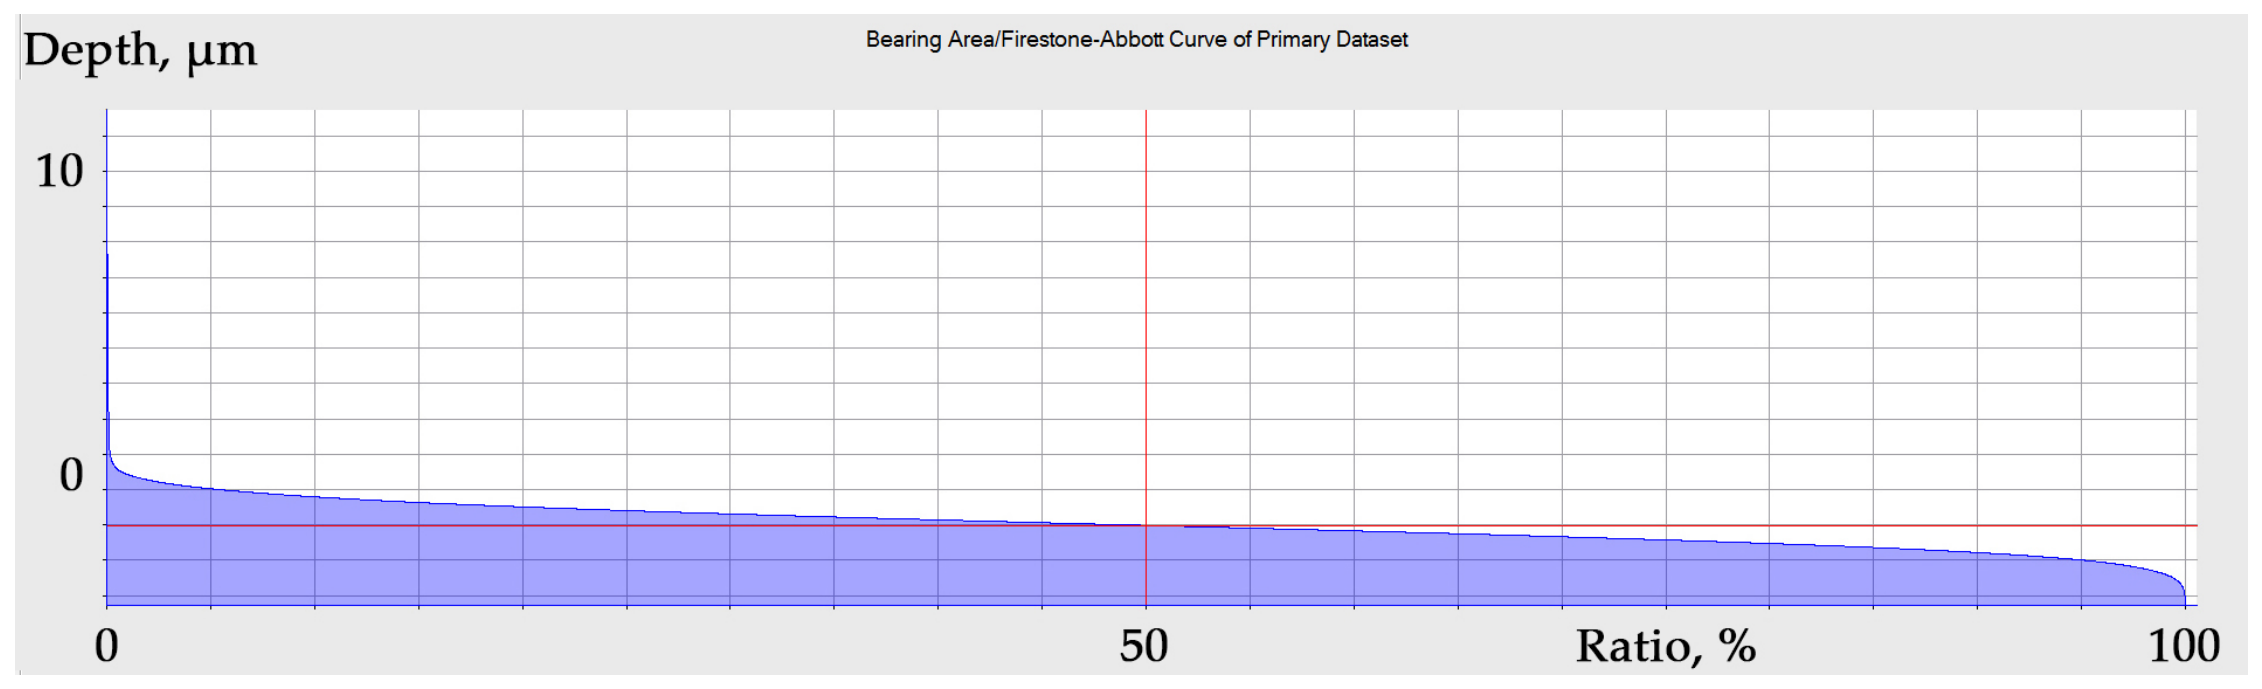
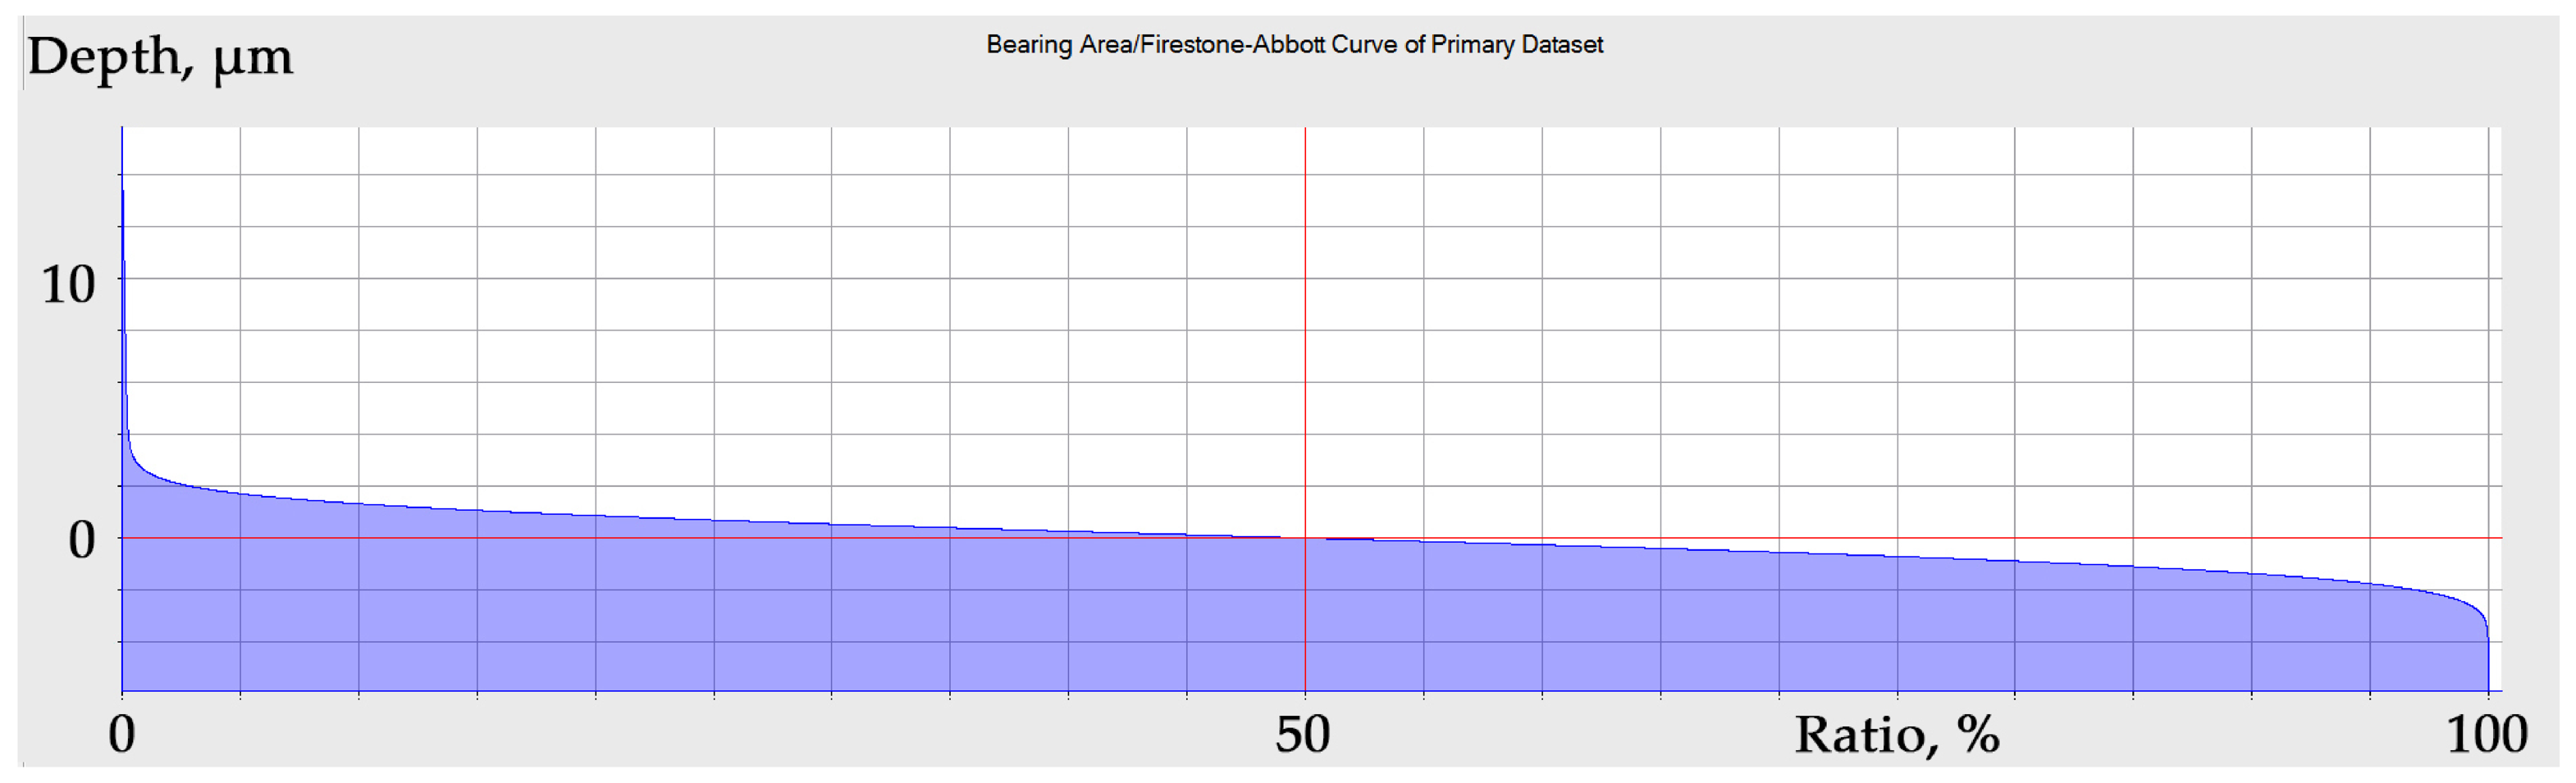
Figure 8) was performed by superimposing the material ratio (Firestone-Abbott) curves (
Figure 9) of the primary processing surface (blue line) and the graph of the Firestone-Abbott curve (
Figure 10) of the secondary processing surface (pink line); a divergence of the curves is noticeable (shown by arrows).
Specifically, in the peak zone (left side of the graph), the secondary processing curve shifts upward, reflecting a nearly twofold increase in the reduced peak height (
Spk) from 0.686 µm to 1.400 µm. Conversely, in the valley zone (right side of the graph), the curve shifts downward, indicating an increase in the reduced valley depth (
Svk) from 0.539 µm to 1.030 µm (
Table 3).
A more prominent microstructure (
Figure 10 and
Figure 11) of the surface of AISI 321 secondary processing (
Figure 2A) compared to the microstructure (
Figure 12 and
Figure 13) of AISI 321 primary processing (
Figure 2B) indicates a significant deviation of the curve from the mean profile height (
Rk). The core roughness height parameter (
Sk) of the AISI 321 secondary processing curve is 2.717 µm (
Table 3), which is more than one and a half times greater than the value of the parameter (
Sk) of the AISI 321 primary processing surface curve, which is 1.615 µm (
Table 3). This indicates that repeated processing increases the relief of the surface microstructure.
This simultaneous expansion of the curve in both peak and valley regions, combined with the steepening of the core slope (Sk), provides a comprehensive quantitative confirmation that secondary laser processing amplifies the vertical amplitude of the micro-relief, creating a more pronounced hierarchical structure.
The values of the reduced peak height (
Spk) = 1.400 µm and reduced valley depth (
Svk) = 1.030 µm parameters of the AISI 321 secondary processing surface are twice as large as the values of the corresponding parameters of the AISI 321 primary processing surface, (
Spk) = 0.686 µm and (
Svk) = 0.539 µm (
Table 3). Thus, repeated processing doubled the surface relief. A more prominent microstructure, according to visual assessment, also contributes to the blackening of the surface, although, as noted earlier, a multiple increase in values does not lead to a corresponding increase in the level of blackening.
It is observed that the peak material portion (
Smr1) and the valley material portion (
Smr2) exhibit no substantial deviation between the two compared surfaces: AISI 321 primary processing (
Smr1) = 9.990%, (
Smr2) = 91.110%; AISI 321 secondary processing (
Smr1) = 9.490%, (
Smr2) = 89.840% (
Table 3). From this, we can conclude that repeated laser processing does not reduce the proportion of the surface that can be removed during the lapping (Peak material portion) (
Smr1). Likewise, the proportion of hollows on the surface that serve to accumulate additives and lubricating coatings on the surface of the sample does not change noticeably. Thus, for a qualitative change in the surface optical properties, processing with modified laser parameters is required, but not multiple sequential processing in a fixed mode.
The ratio of parameters (
Smr1 and
Smr2) before and after repeated laser processing also suggests that the prevalence of peaks and valleys on the surface of the material (as well as their deficiency) is not decisive for the level of surface blackening, since the degree of darkness changed after the second treatment process within 2.5% (
Table 2).
When characterizing the surfaces based on the height distribution parameters (
Ssk), close, within the experimental error, values of the profile asymmetry parameter (
Ssk) = 1.210 of the AISI 321 primary processing surface (
Figure 2A) and the values of this parameter (
Ssk) = 1.585 for the AISI 321 secondary processing surface (
Figure 2B) are noted (
Table 3). The surface morphology is characterized by a preponderance of peaks relative to the volume of valleys and recessed features. Thus, this feature of the microrelief is preserved after repeated processing.
Also, for the surfaces under consideration, a high value of the peak coefficient parameter is observed: (
Sku) = 17.505 for the surface of AISI 321 primary processing (
Figure 2A), and (
Sku) = 19.107 for the surface of AISI 321 secondary processing (
Figure 3 and
Table 3). An increase in kurtosis (
Sku) is shown to correlate with surface darkening; yet a minor discrepancy within 5% in this topographic metric does not yield a significant visual contrast between the compared specimens (
Figure 2A,B).
The height distribution profiles for the studied surfaces exhibit a significant morphological similarity, particularly in the case of the primary laser-processed AISI 321 (
Figure 2A) and the primary secondary laser-processed AISI 321 (
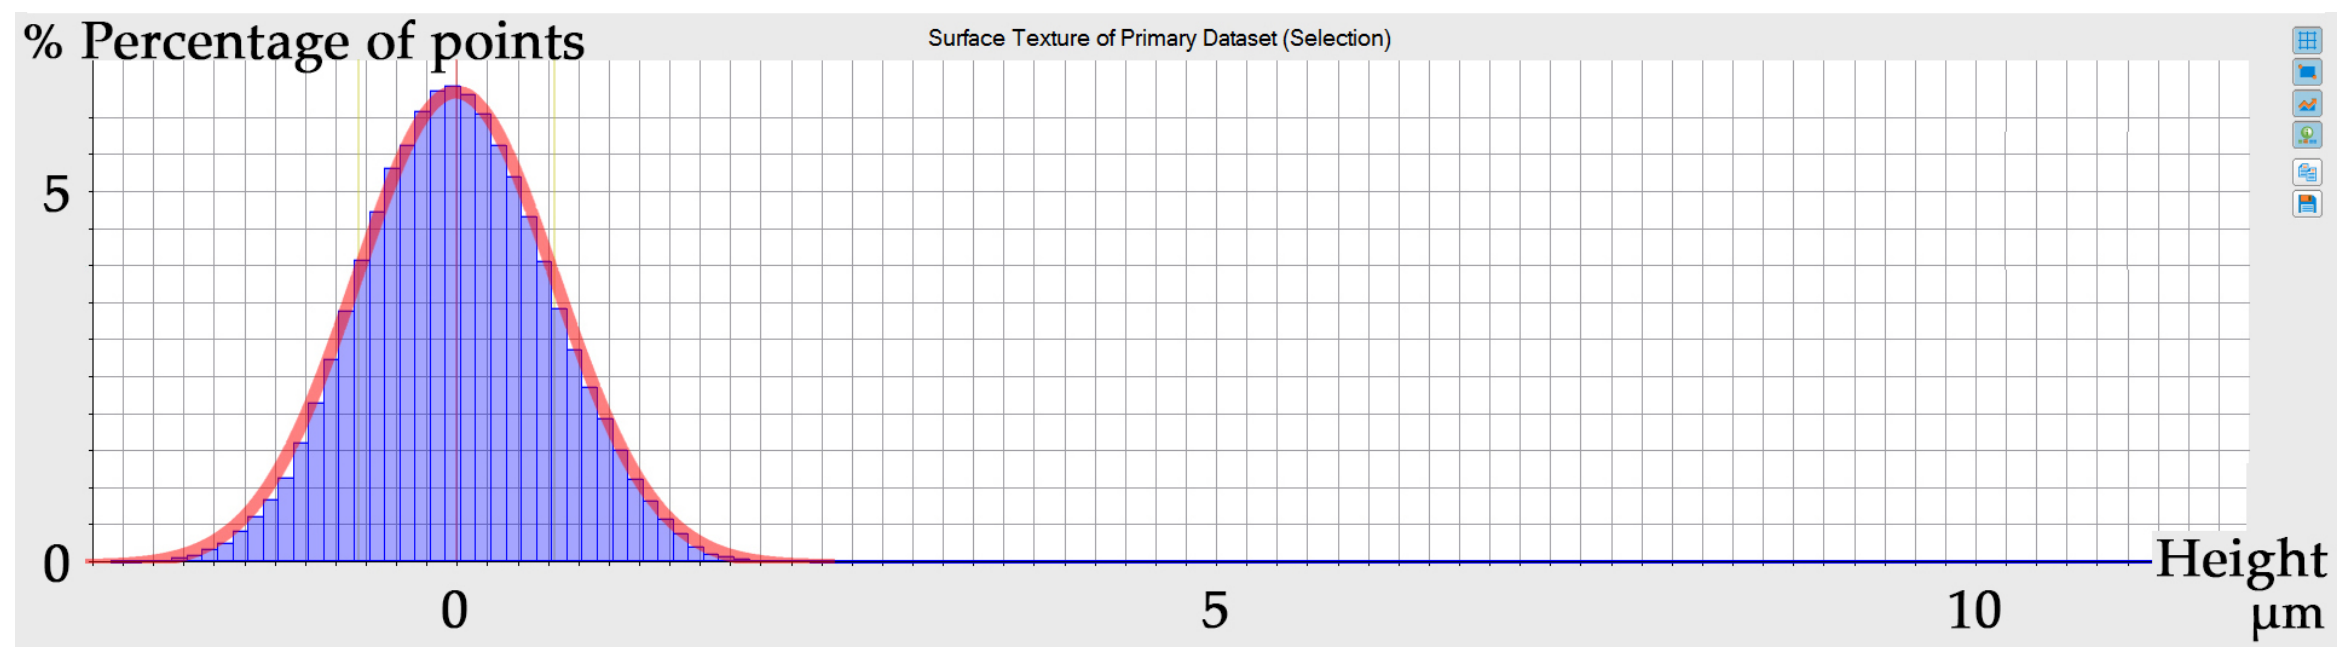
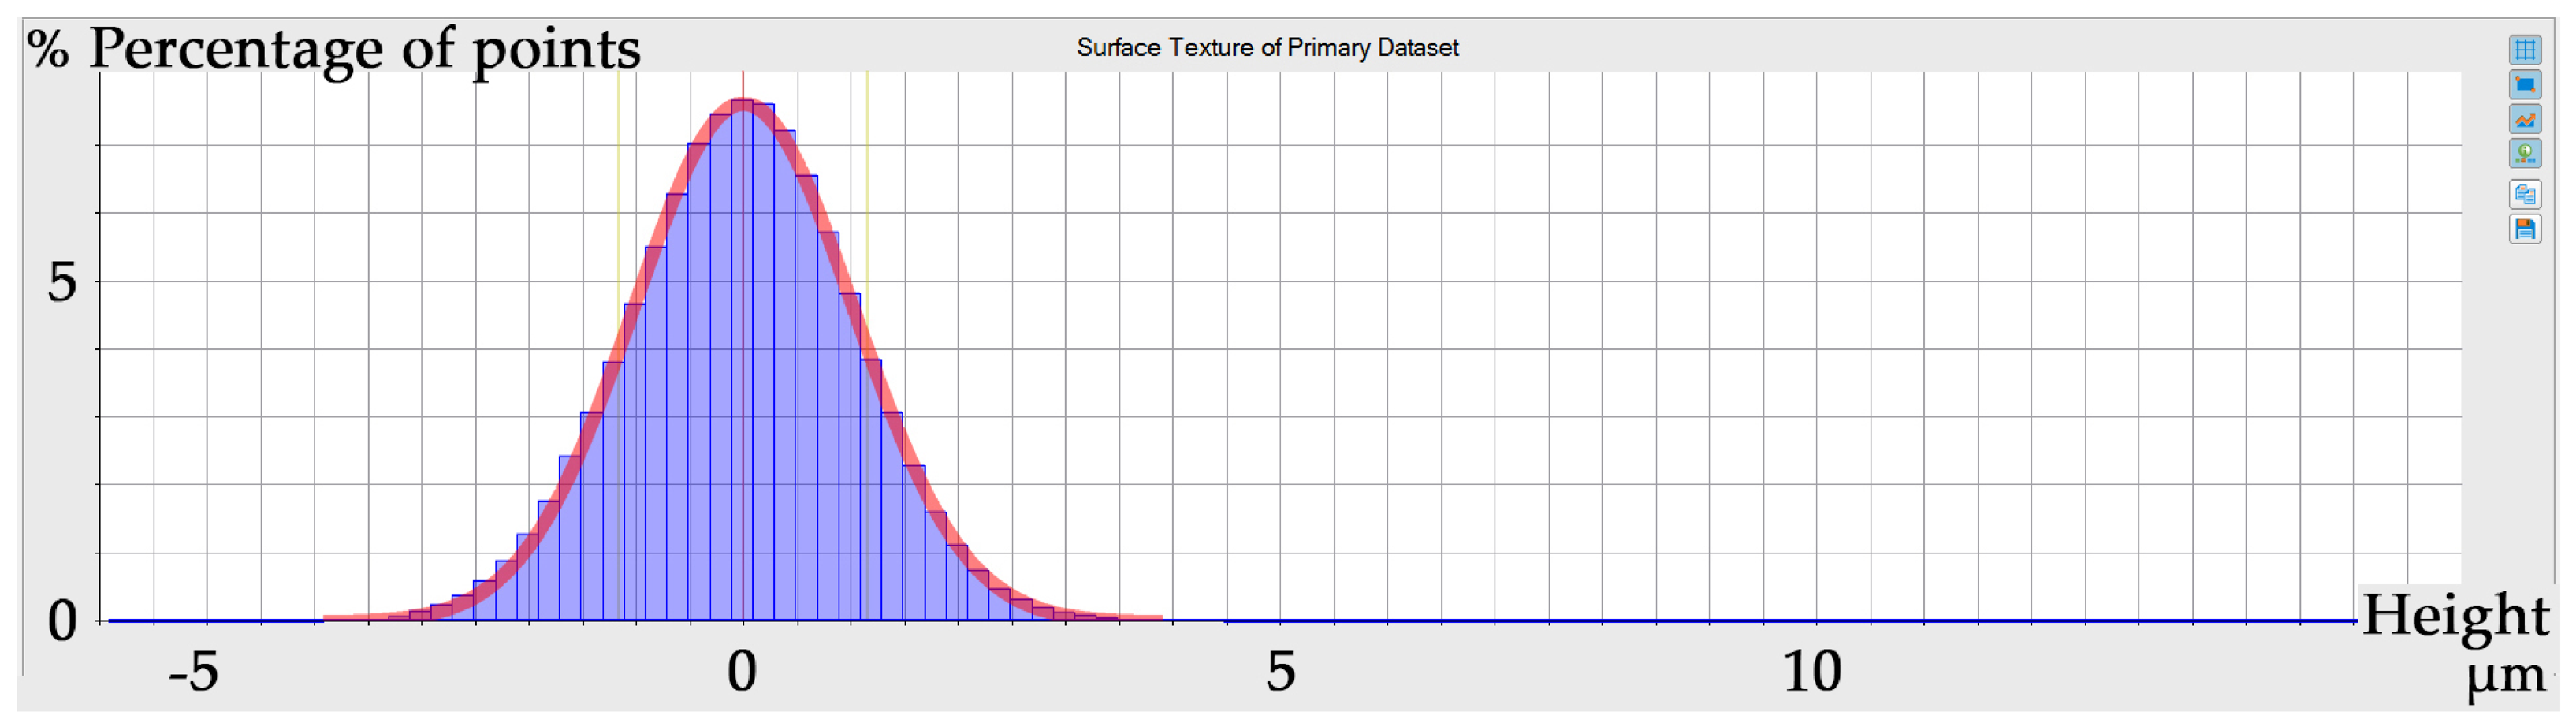
Figure 2B). The diagrams indicate that the distribution of heights has a Gaussian distribution (
Figure 11 and
Figure 12.). For clarity, in the figures (
Figure 11 and
Figure 12), the Gaussian nature of the distribution is shown by an additional red curve.
It can be stated that if, during the initial processing, a periodic surface microstructure is not formed and a complex height distribution is not observed, then repeated surface treatment in the same mode does not impart a periodic character to the surface structure and does not change the nature of the height distribution (
Figure 11 and
Figure 12).
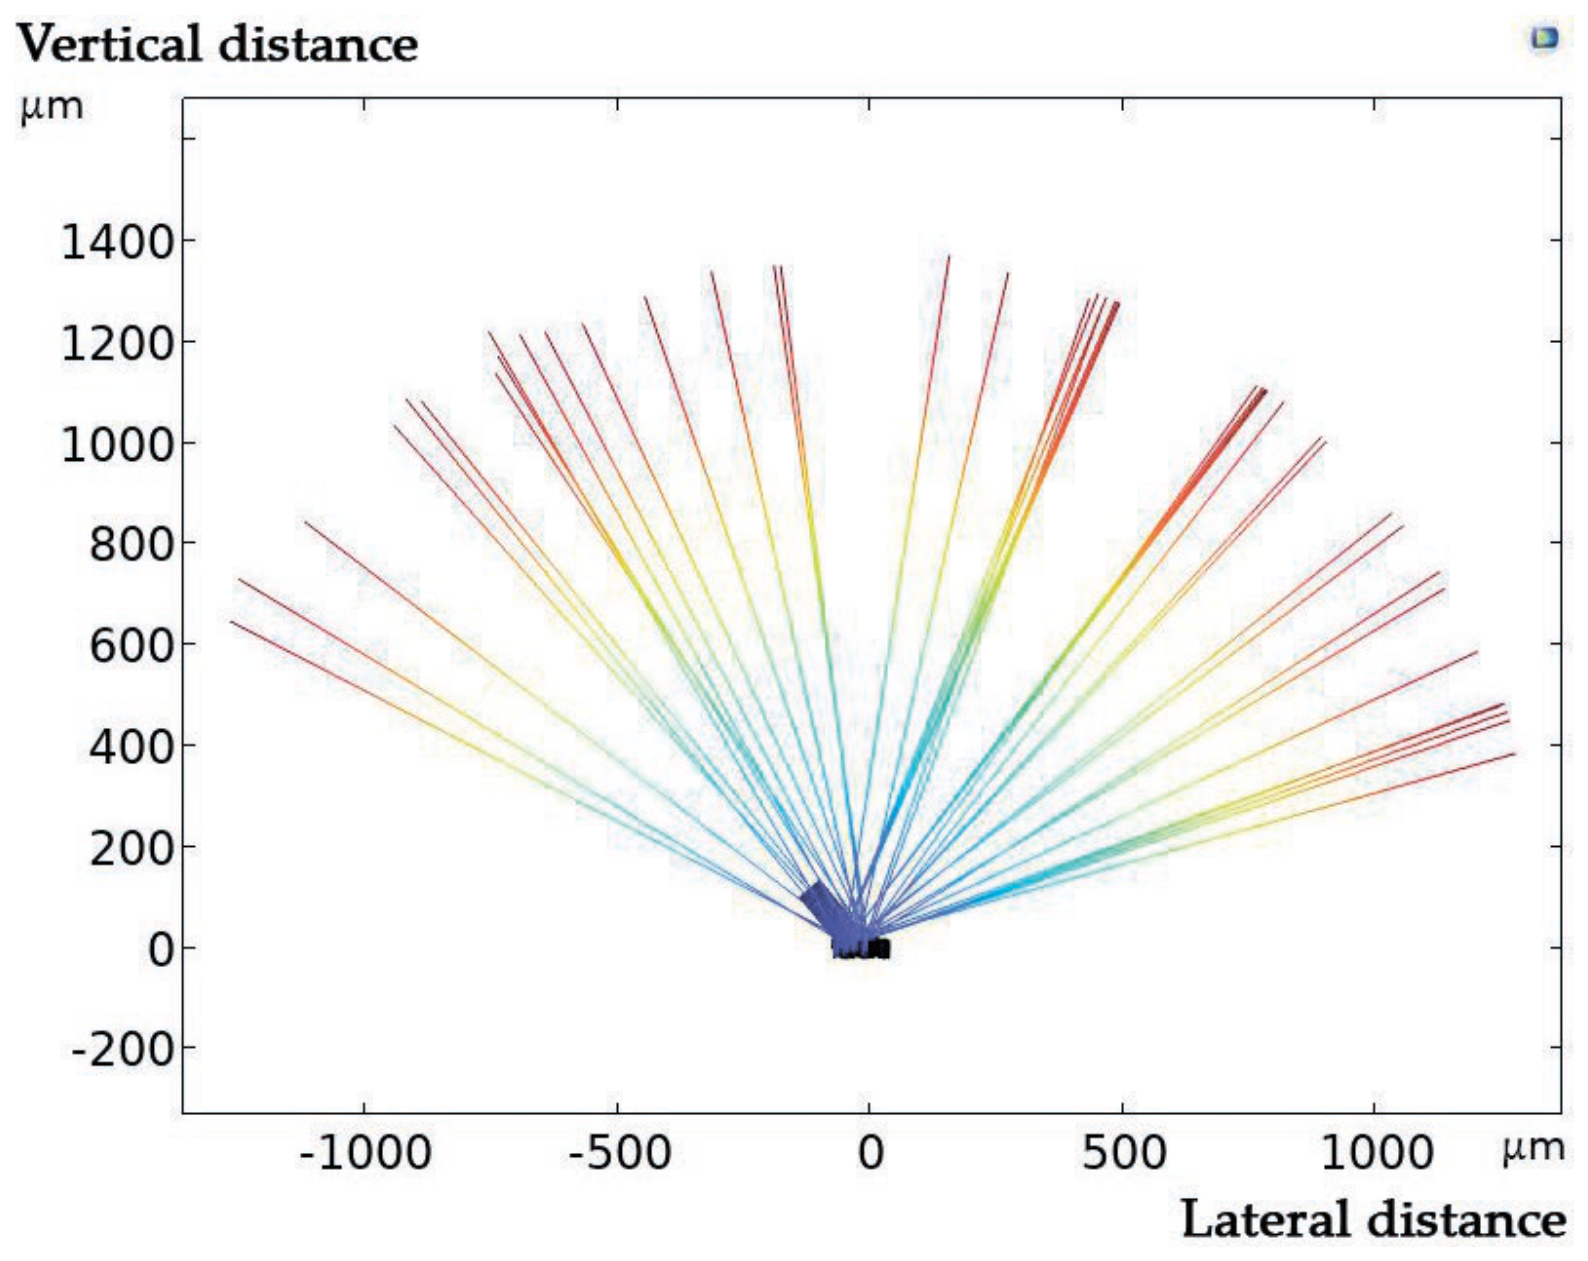
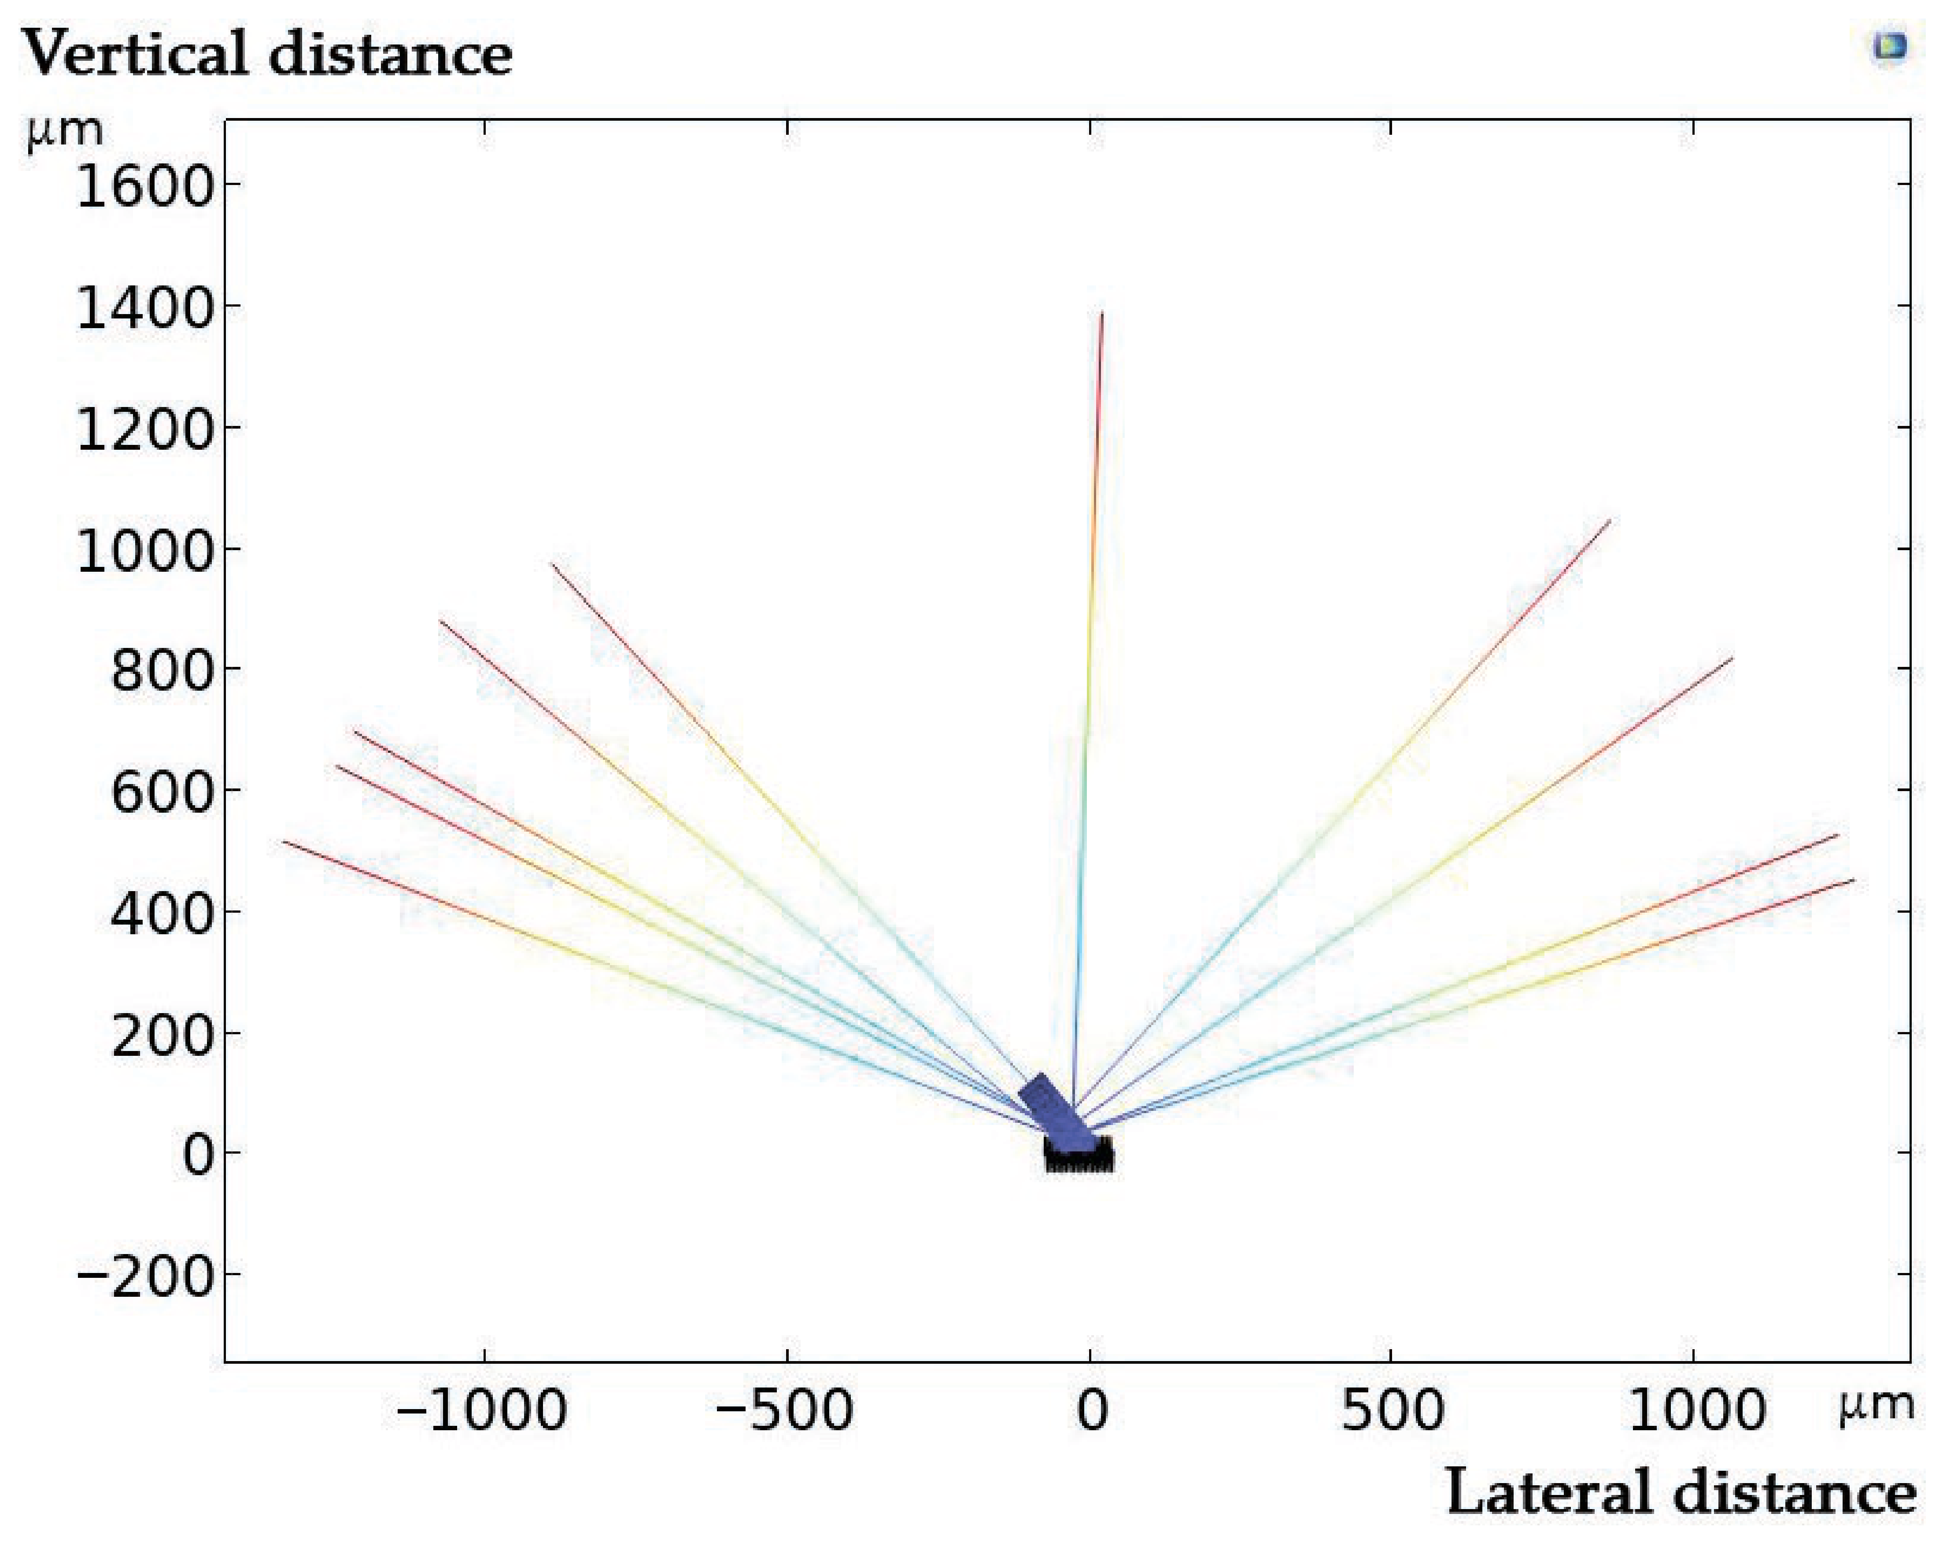
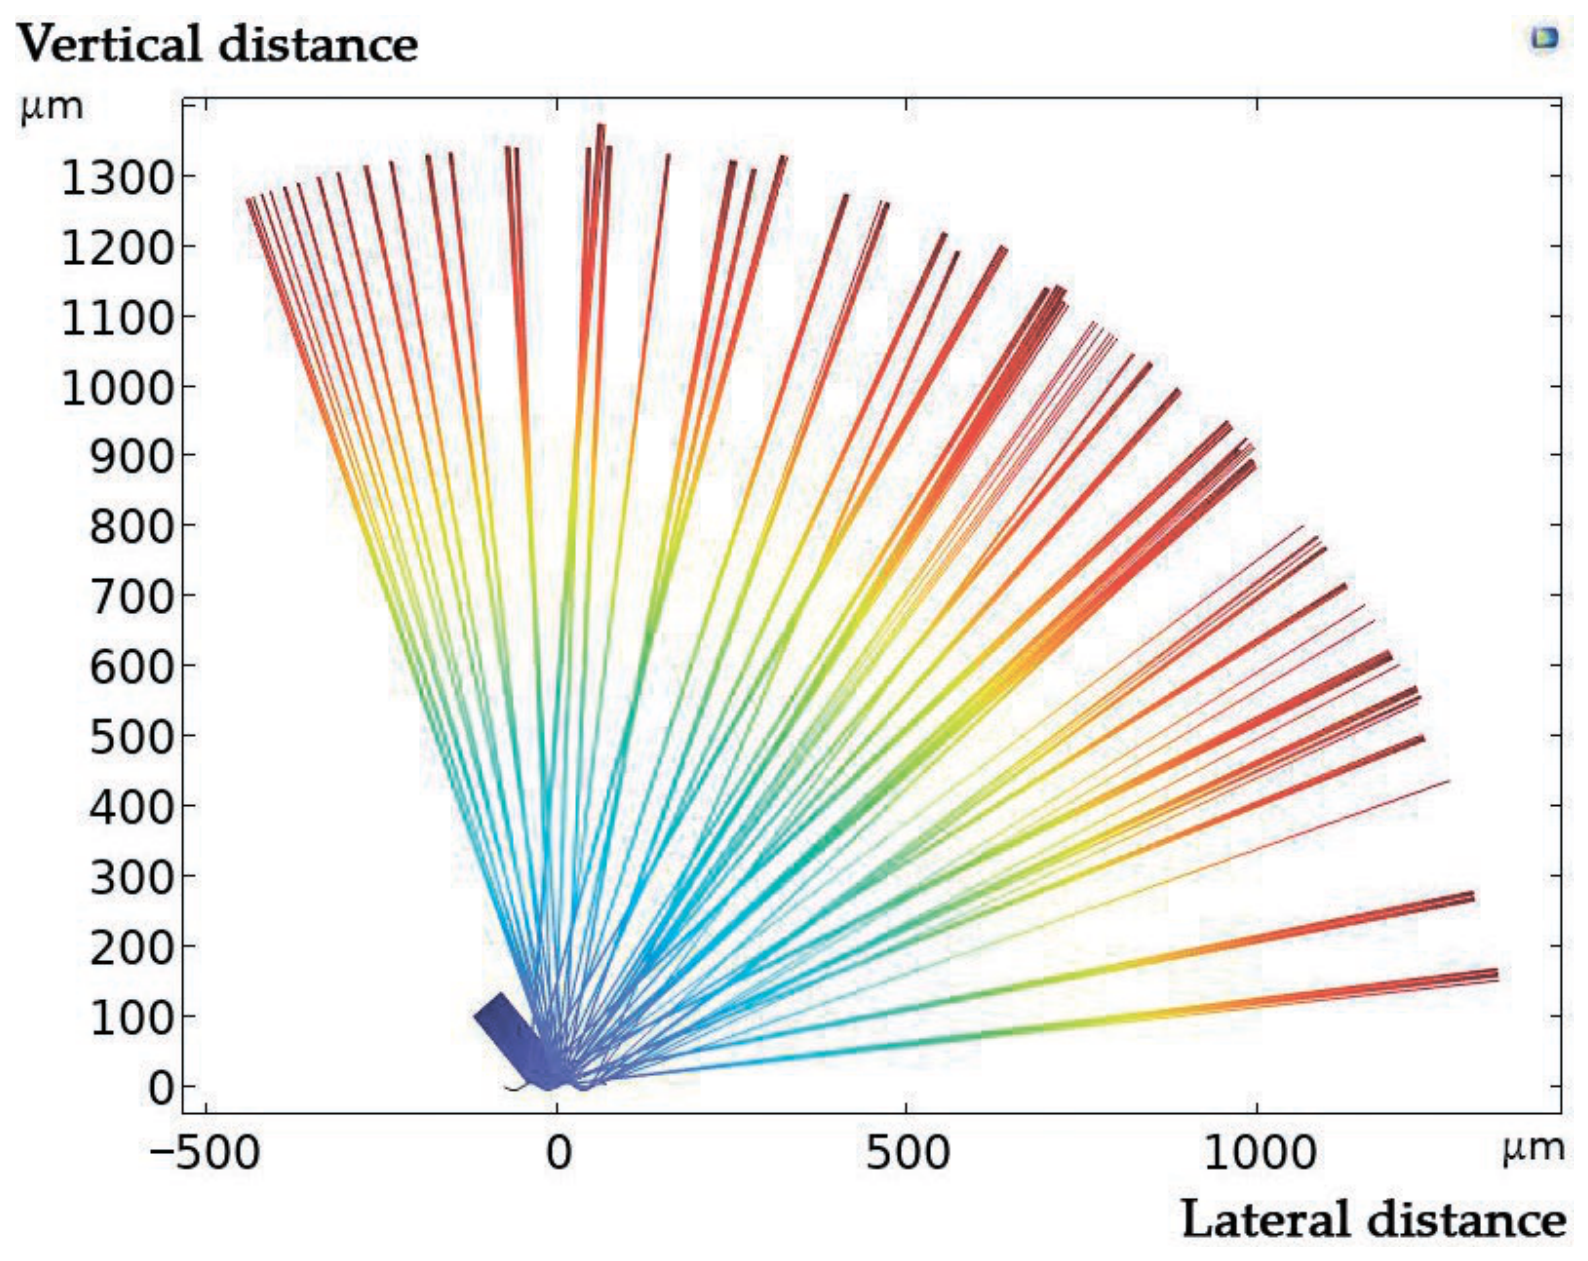
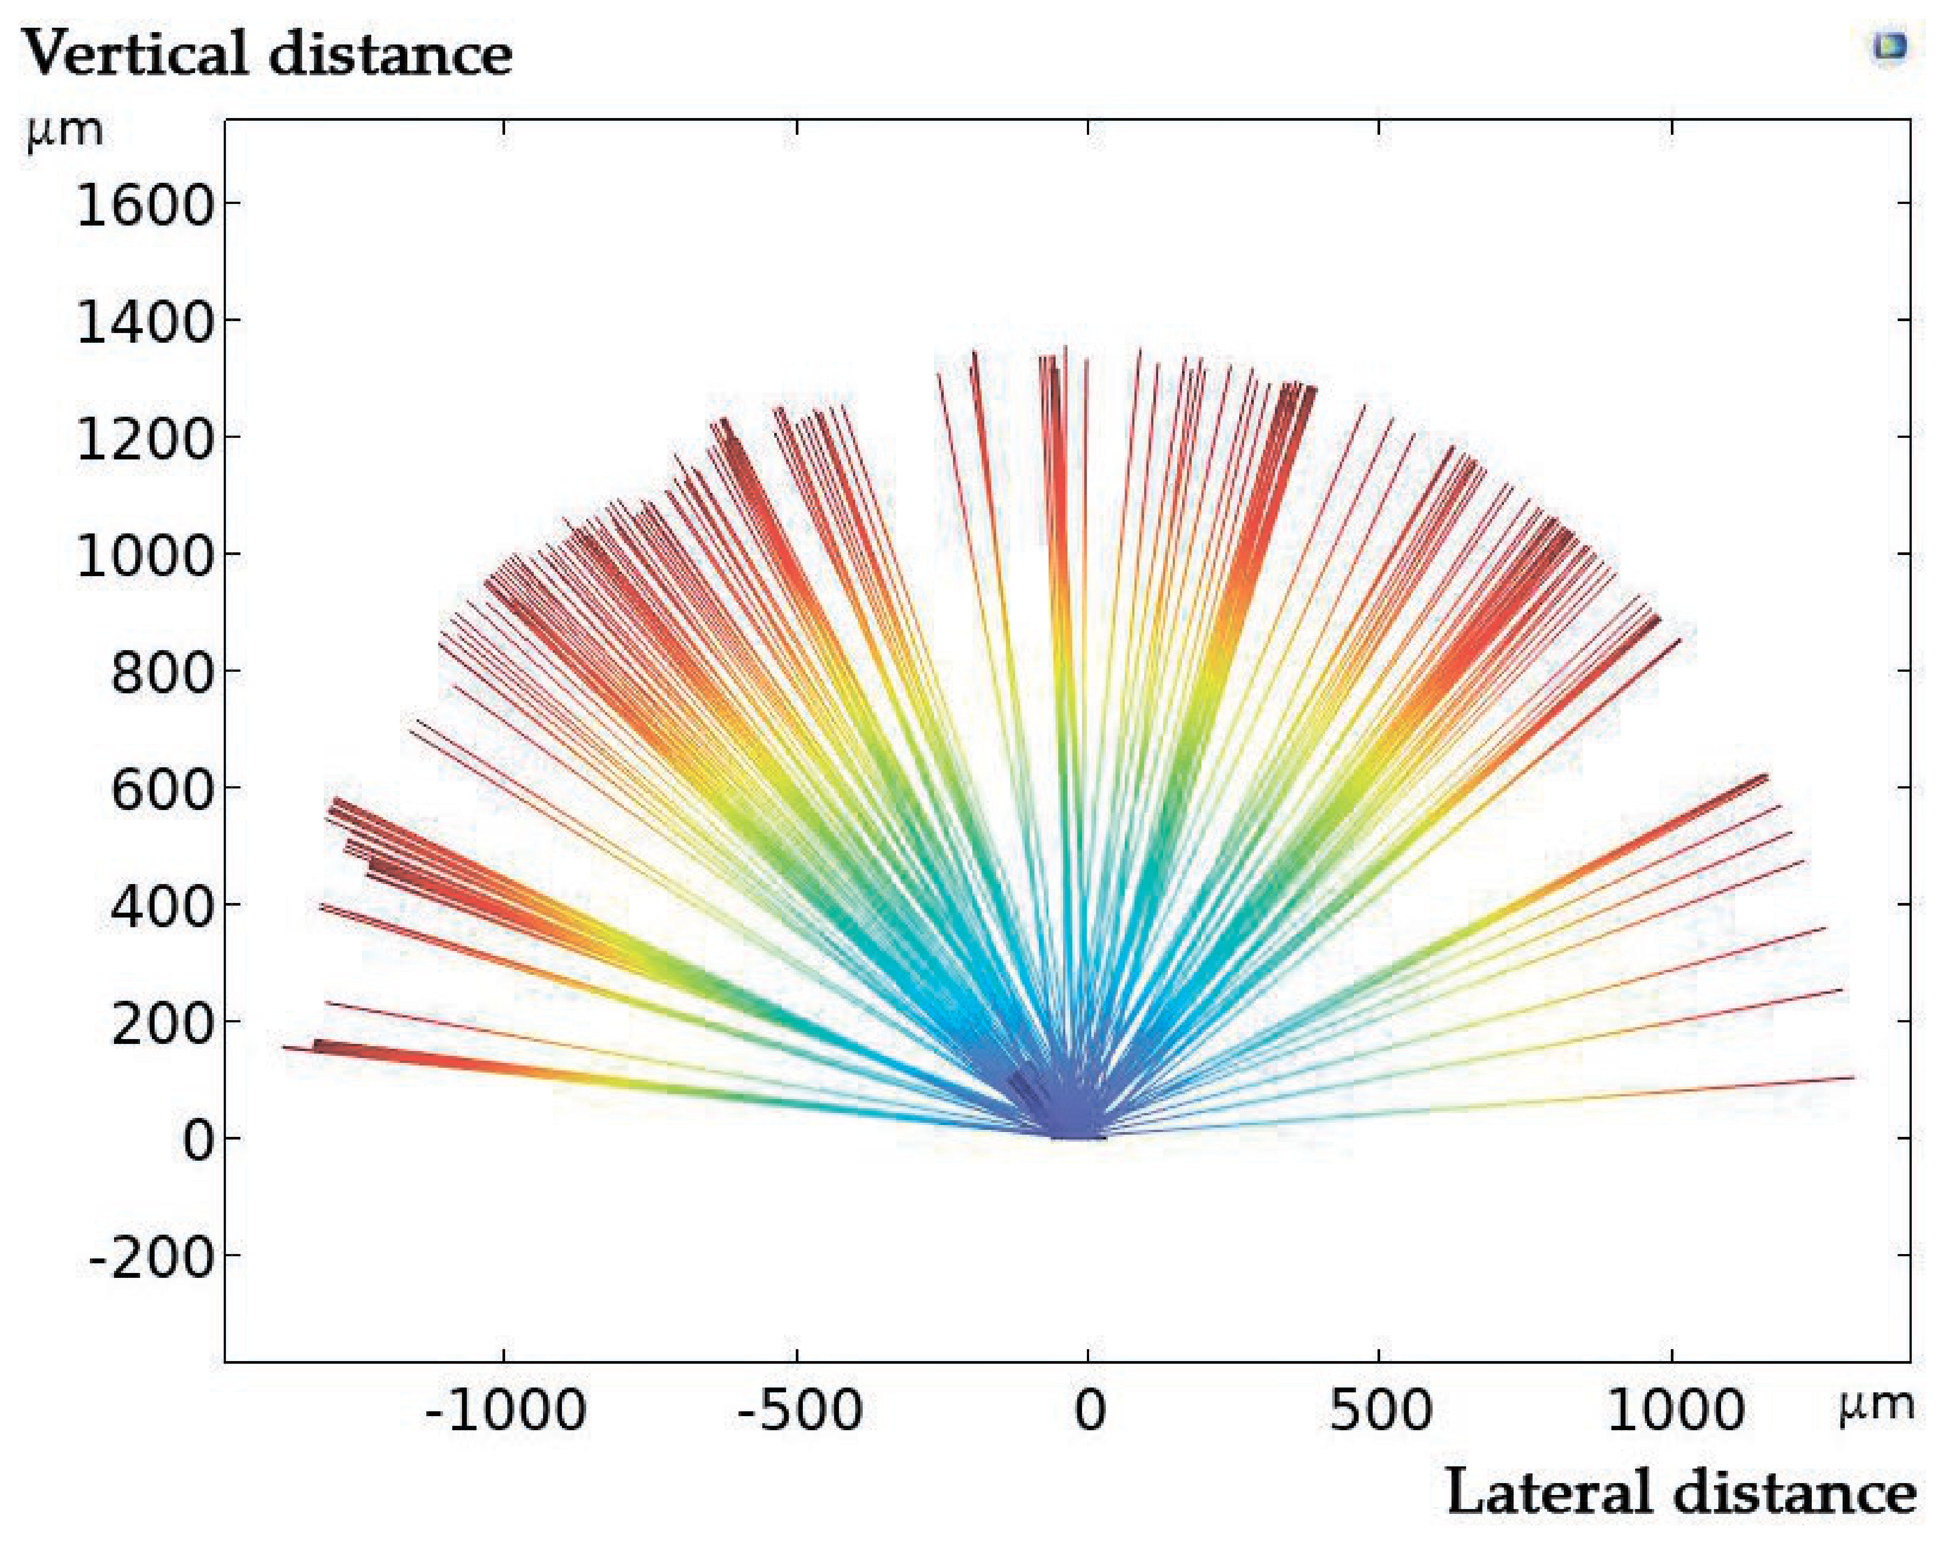
Computer models, built in the COMSOL
® v. 6.2 Multiphysics environment using the Ray Optics module [
44], of the reflection of a narrow beam of light from a surface with a low flatness index (
Sku) (
Figure 13) and a high flatness index (
Sku) (
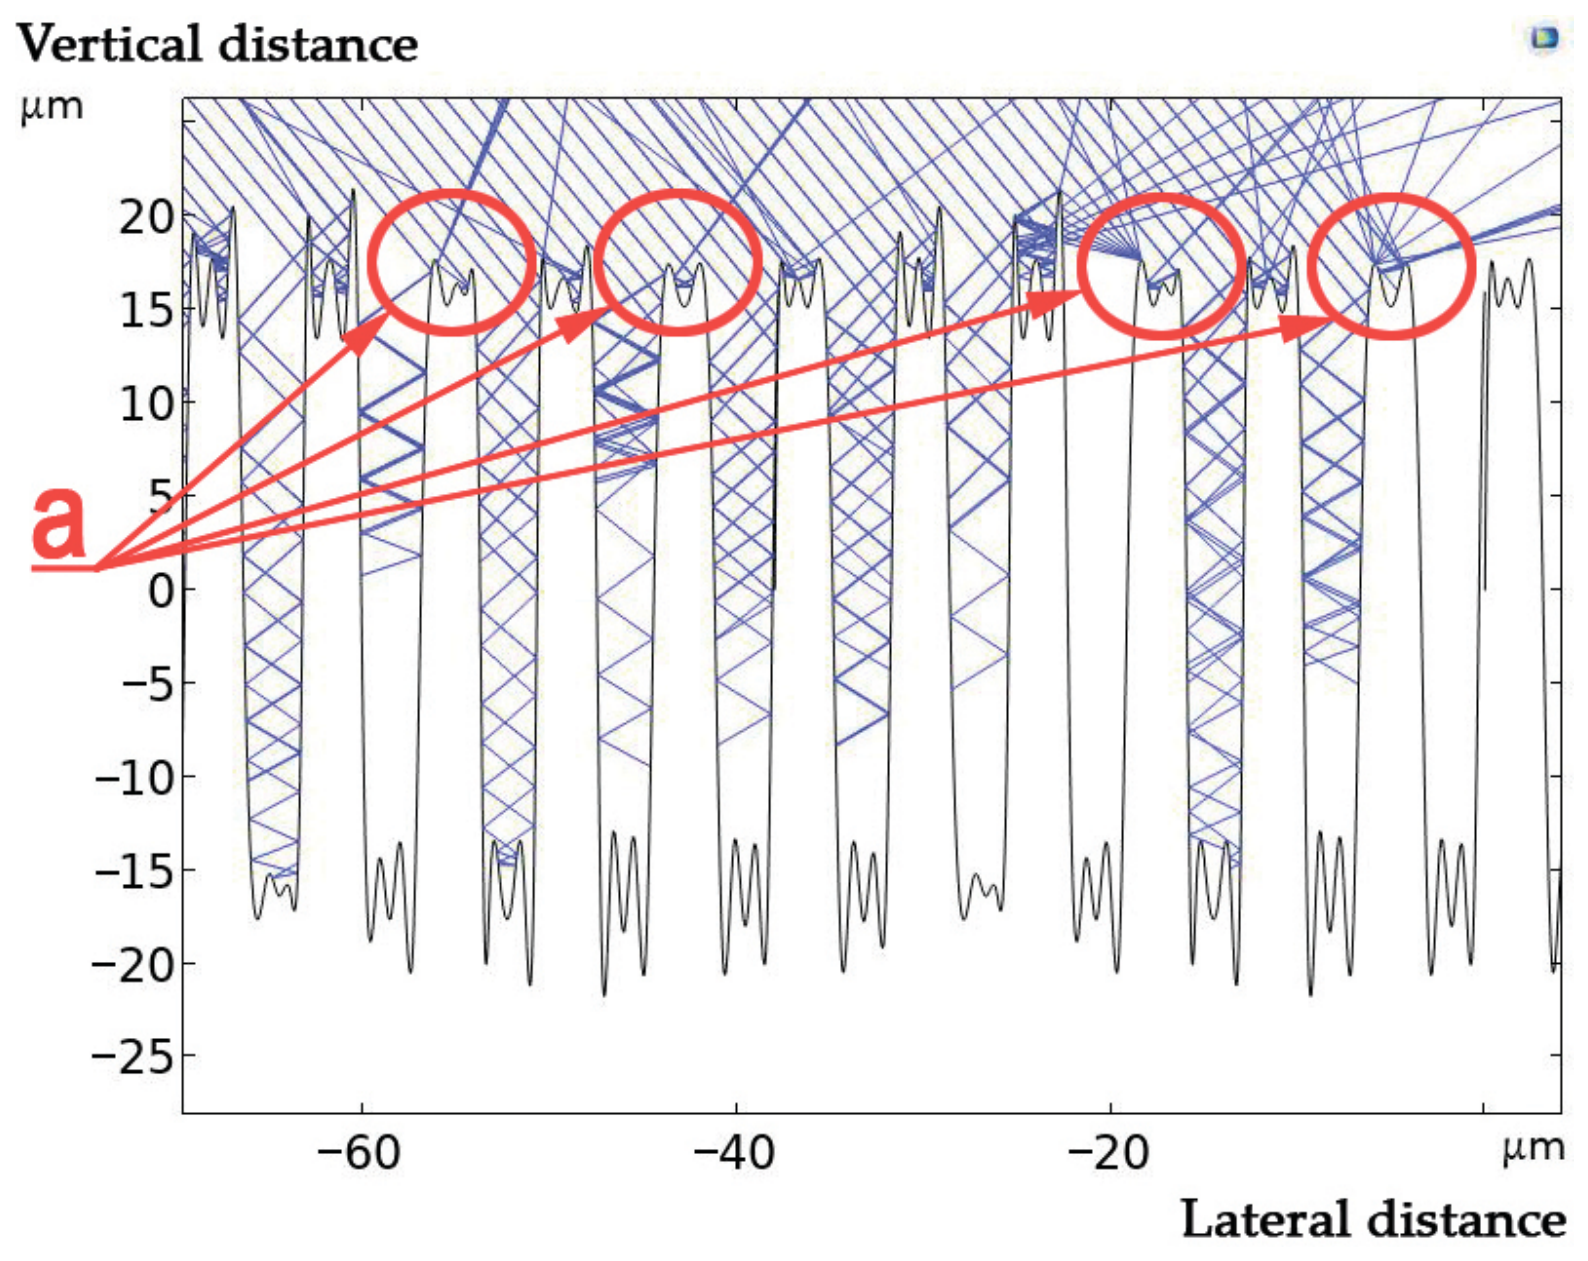
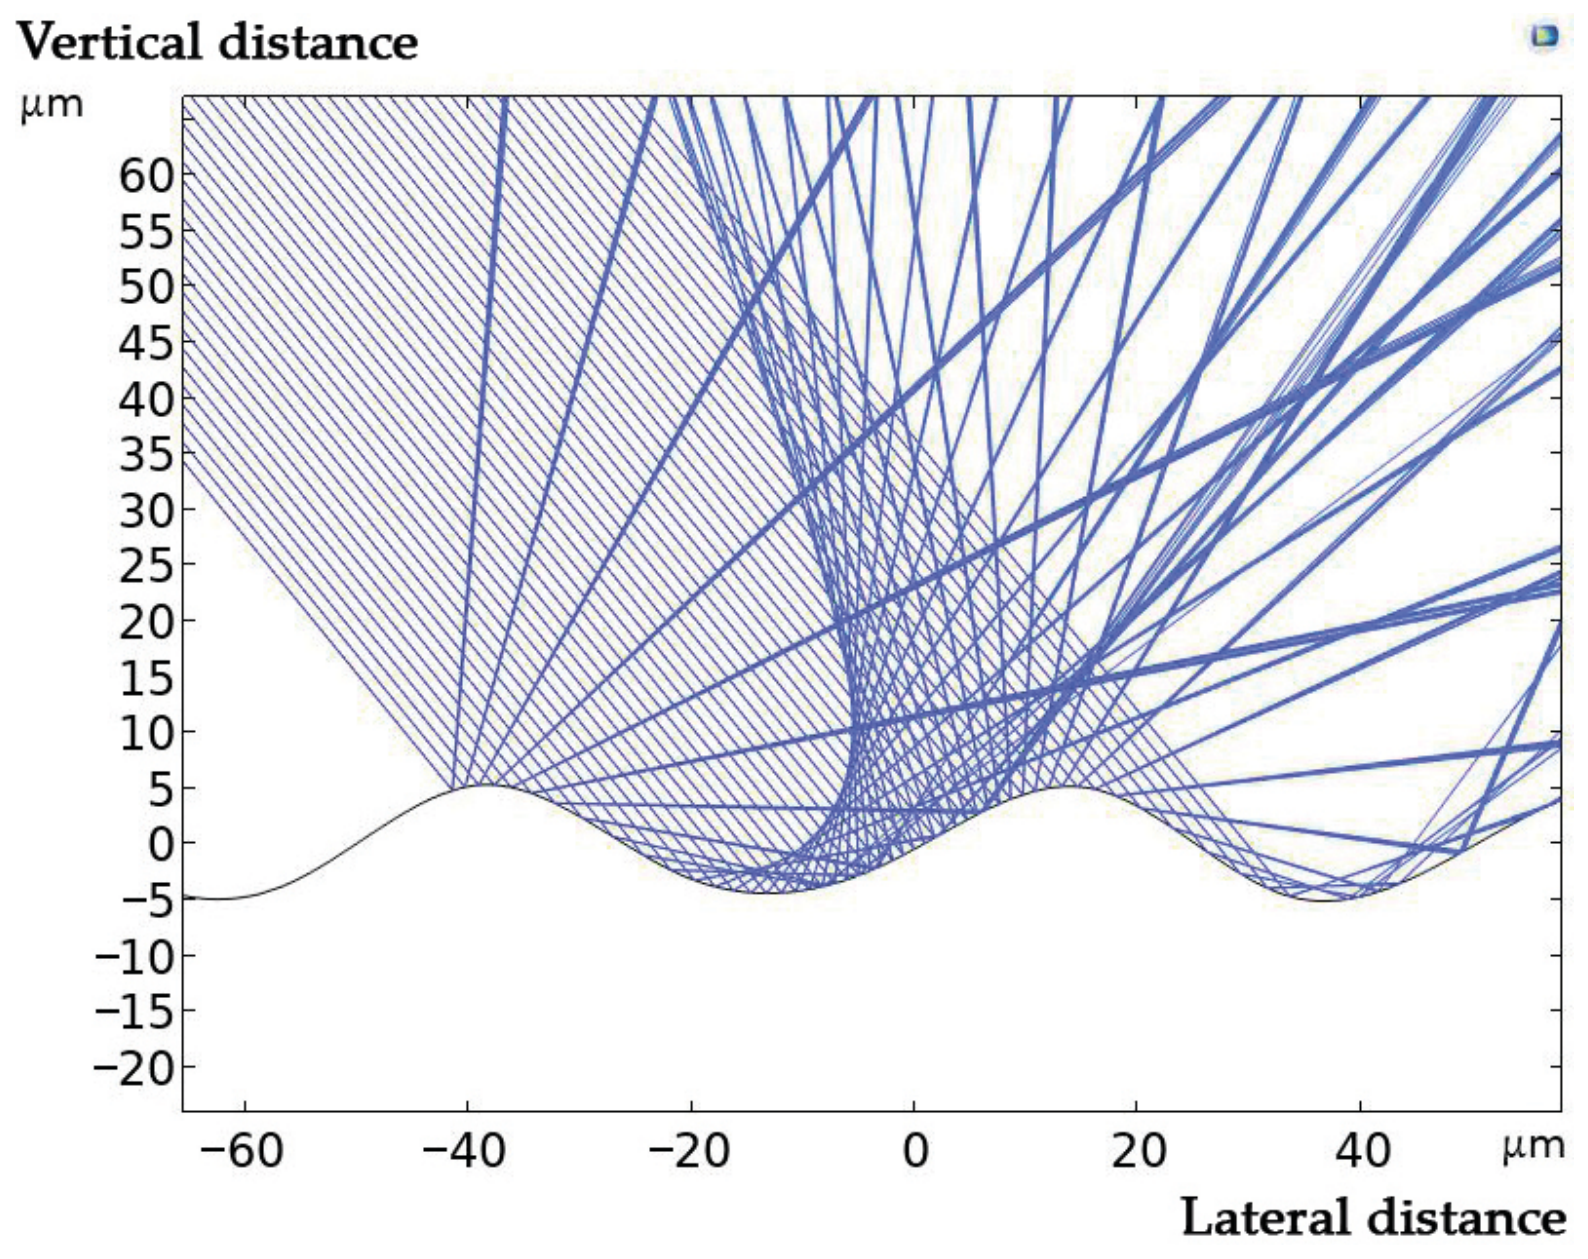
Figure 14) indicate better scattering of the beam by the scattering surface with an increase in this index. The reflection coefficient in the model calculation is set at 0.3. The reason for the worse scattering is the apical fragments of the microstructure (
Figure 15, pos. a), which effectively reflect the beam of light (
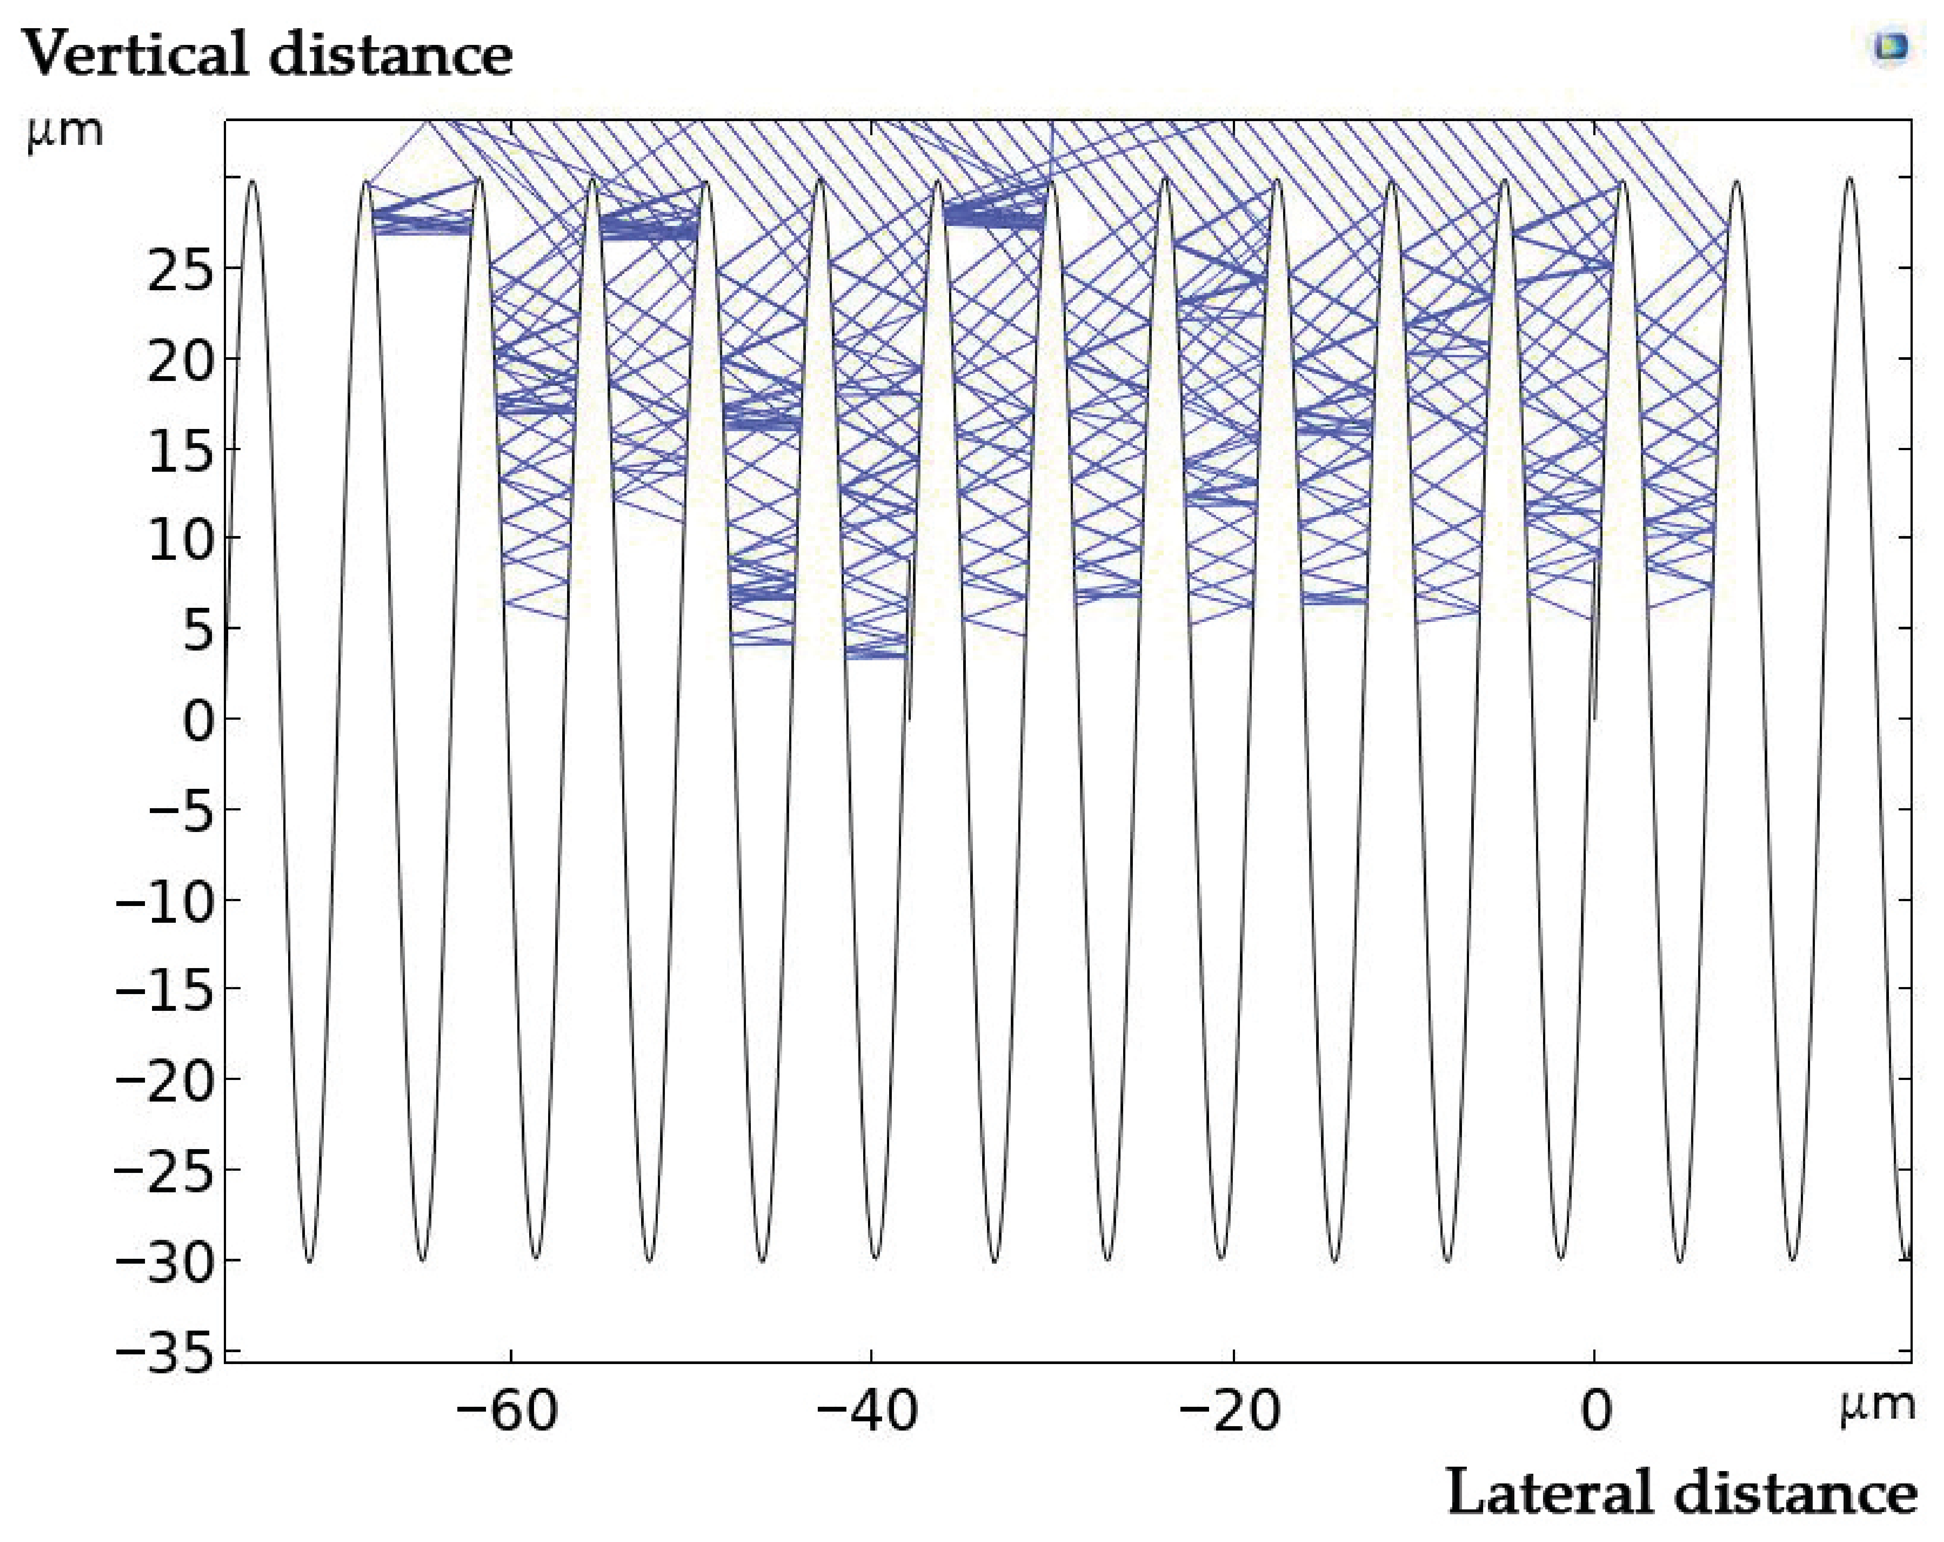
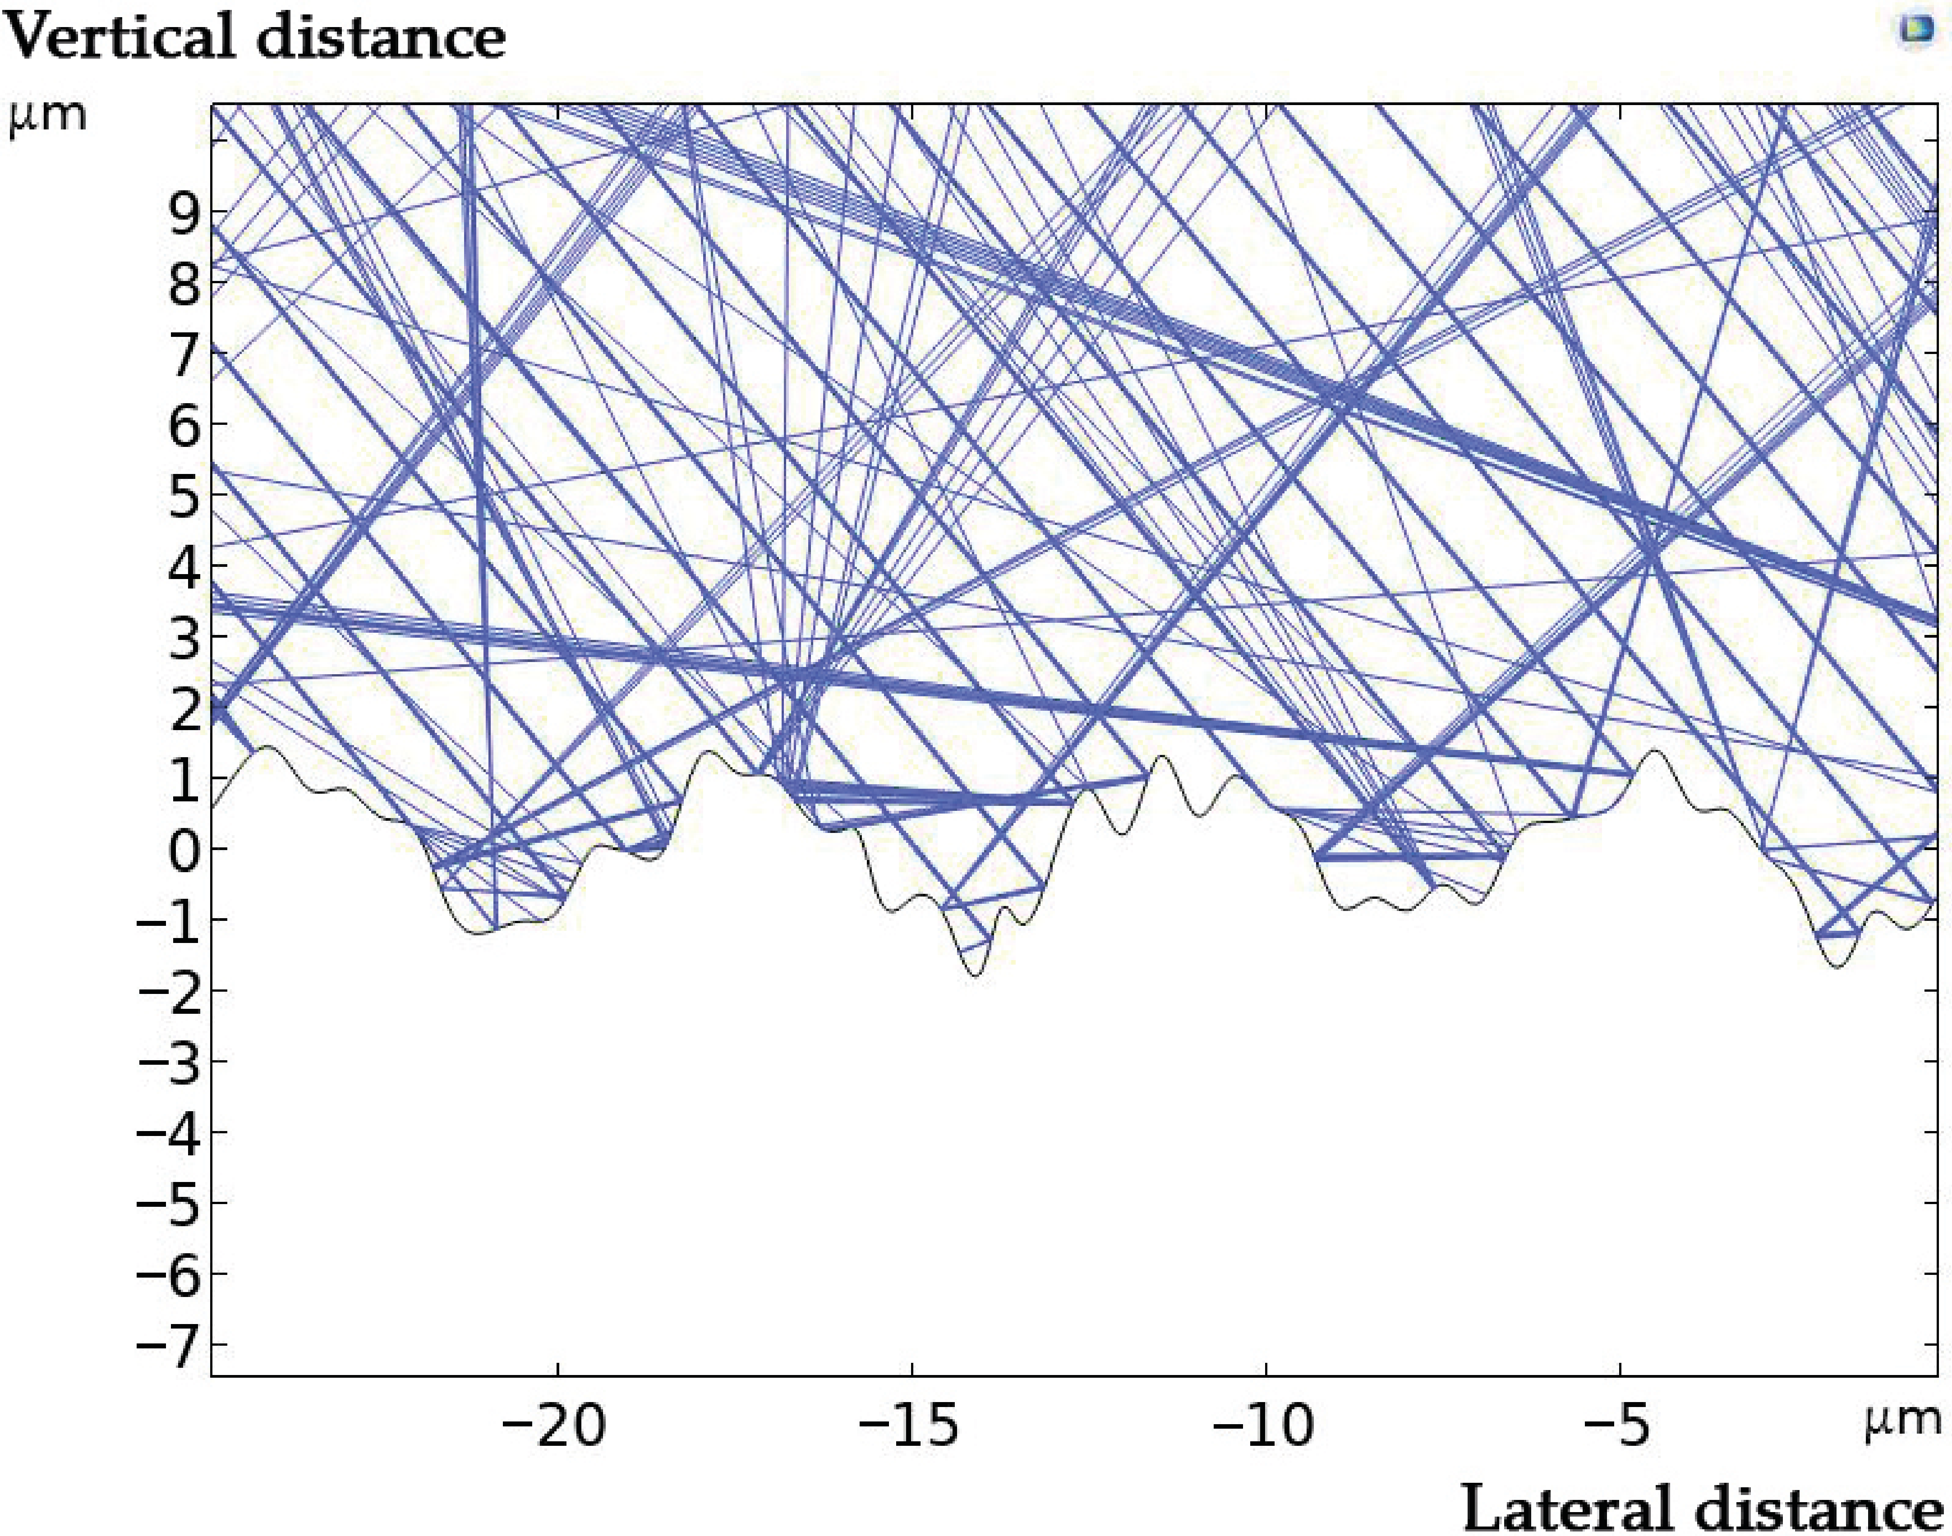
Figure 15). The absence of such reflecting surfaces in a microstructure with a high index (
Sku) allows such a surface to scatter light more effectively (
Figure 16).
Computer models of the reflection of a narrow beam of light from a surface with a low value of local gradients (
Sdq) (
Figure 17) and a high value of local gradients (
Sdq) (
Figure 18) also indicate better scattering of the beam by the scattering surface with an increase in this value. The reason for the worse scattering with a low (
Sdq) is the absence of a large number of reflecting surfaces on the surface, randomly located at different angles relative to the direction of incidence of the beam (
Figure 19). As the (
Sdq) value increases, the number of randomly positioned reflecting surfaces increases, which leads to better scattering of the directed beam (
Figure 20).
The increase in the Sdq parameter (root-mean-square slope) from 0.133 to 0.315 serves as a key indicator of the surface topographic evolution. From the perspective of radiation-matter interaction, the increase in local relief gradients initiates a multiple reflection mechanism within the micro-cavities. Each incident photon striking a steep asperity slope (indicated by the high Sdq) is not reflected into the hemisphere but is redirected deeper into the structure. According to the Bouguer–Lambert–Beer law and the geometric trap principle, the total absorption increases proportionally to the number of interaction acts , where n is the number of reflections. Thus, the observed secondary blackening is attributed not only to the growth in roughness amplitude but also to the effective energy redistribution within hierarchical irregularities, which transform the surface into a highly efficient optical trap.
4. Conclusions
Experimental investigations demonstrate that surface height distribution metrics play a pivotal role in evaluating the surface blackening achieved through femtosecond laser processing.
Based on visual assessments, it is concluded that the presence or absence of periodicity of the microstructures is not a decisive factor in determining the degree of blackening for AISI 321 steel.
A more relief microstructure, according to visual assessment, also contributes to surface blackening, despite the fact that, as noted earlier, a multiple increase in values does not lead to a corresponding increase in the degree of surface blackening, despite the fact that repeated processing increased the surface relief parameters by two times.
Additional post-processing of the surface without changing the processing mode does not lead to a twofold increase in the degree of surface blackening compared to the nature of the surface blackening obtained as a result of previous processing.
Repeated laser processing does not reduce the proportion of the surface that can be removed during subsequent running-in. Similarly, the proportion of depressions on the surface used to accumulate additives and lubricating coatings on the sample surface does not change significantly. Thus, for a qualitative change in the sliding and optical properties of the surface, processing with modified laser parameters is necessary, rather than two-fold sequential processing in a fixed mode. It is demonstrated that secondary perpendicular processing in an identical regime is characterized by a micro-relief saturation effect. Although the root-mean-square roughness (Sq) and the developed interfacial area ratio (Sdq) continue to increase, the primary laser pass already establishes the highly absorbing structure. This renders repeated exposure energetically inefficient for any substantial improvement in optical performance. Consequently, this defines an optimization limit for simple pass duplication without altering the pulse parameters themselves.
The first stage of processing led to an increase in the value of the surface profile asymmetry parameter (Ssk), which observation signifies that the topographic peaks dominate the surface structure, over elements formed by depressions and cavities. This feature of the microrelief was preserved after repeated surface processing, but no noticeable increase in the value of the asymmetry parameter was noted.
At the first stage, the parameters such as the maximum peak height (Sp) increased the most, by 7.33 times, and the ten-point surface height (S10z) increased by 6.04 times. After repeated processing, the maximum relative increase in the maximum trench depth (Sv) parameter was noted, by 2.57 times, and the root-mean-square slope (Sdq) by 2.37 times.
Also, repeated processing did not qualitatively increase the surface blackness, which confirms the conclusion that an insignificant, within 5%, increase in the kurtosis value, characteristic of the surfaces under consideration, does not allow one to visually observe a significant contrast in blackness between these surfaces (
Figure 2A,B).
It has been established that if the primary processing does not result in the formation of a periodic surface microstructure and a complex height distribution is not observed, then repeated surface processing in the same mode does not impart a periodic character to the surface structure and does not change the nature of the height distribution in accordance with the normal Gaussian distribution law.
A quantitative comparison of the topographical and optical data reveals a distinct correlation trend. Specifically, the 2.37-fold increase in the root mean square slope (
Sdq) from 0.133 in the primary stage to 0.315 in the secondary stage aligns with the recorded reduction in average surface blackening from 16.6% to 14.4% (
). This relationship is further supported by the ray optics simulations (
Figure 13,
Figure 14,
Figure 15,
Figure 16,
Figure 17,
Figure 18,
Figure 19 and
Figure 20), which indicate that higher surface gradients, when coupled with a high kurtosis index (
Sku > 17), promote more frequent multiple reflections and enhanced energy redistribution within the surface valleys. Thus, within the investigated processing range, the
Sdq parameter serves as an indicator of light-trapping efficiency, bridging the gap between 3D-roughness evolution and the resulting optical response.
It was quantitatively established that secondary laser processing provides only a marginal improvement in optical blackening (up to 5%, from 16.6% to 14.4% in HSB brightness), despite a significant 2.37-fold increase in the surface slope parameter (Sdq). For industrial automation and marking applications, this indicates that the optical trap efficiency has reached an asymptotic limit. Therefore, for high-speed production lines, optimizing the primary laser fluence and scanning step is more resource-efficient and effective than implementing successive multi-pass strategies. This allows for achieving high-contrast markers with minimal processing time and energy consumption.




 ,
,