Article

Numerical Simulation on Structural Optimization and Solid–Liquid Two-Phase Flow Energy Conversion of Mud High-Shear Mixer for Deepwater Drilling


1
College of Energy, State Key Laboratory of Oil and Gas Reservoir Geology and Exploitation, Chengdu University of Technology, Chengdu 610059, China
2
Tianfu Yongxing Laboratory, Geothermal Exploration, Development and Comprehensive Utilization Research Center, Chengdu 610213, China
3
College of Mechanical and Electrical Engineering, Chengdu University of Technology, Chengdu 610059, China
*
Author to whom correspondence should be addressed.
Machines 2026, 14(4), 432; https://doi.org/10.3390/machines14040432
Submission received: 2 March 2026 / Revised: 10 April 2026 / Accepted: 10 April 2026 / Published: 13 April 2026
(This article belongs to the Section Turbomachinery)

Abstract

To address the imbalance between the shearing–mixing quality and energy efficiency of deepwater drilling mud mixers and breakthrough the limitations of existing independent single-objective analytical perspectives, the Eulerian solid–liquid two-phase numerical simulation was adopted in this study. Combined with a modified shear rate algorithm and a triple energy coupling analysis of shear rate, Lamb vortex energy and Enstrophy, the energy conversion and particle dispersion mechanisms inside the mixer under variable flow rates and solid concentrations were systematically investigated, and the performance differences between the first-generation and optimized mixers were clarified. Structural optimizations including an additional modular stator with a designed shear gap of 2 mm, improved blade profiles and shear angles to 14.2°, and miniaturized radial dimensions of the impeller and volute were implemented to achieve compact structural upgrading. The results demonstrate that high-energy regions are concentrated in the rotor–stator gap. After optimization, the peak shear rate increases from 12,010 s−1 to 17,092 s−1, representing a 42.3% enhancement. The peak Lamb vortex energy and the mean Enstrophy rise by 8.6% and 18.9%, respectively. Shear rate correlates weakly positively with Lamb vortex energy and strongly negatively with Enstrophy, revealing vortex sensitivity to flow velocity and tight coupling of viscous dissipation to particle concentration. The outlet coefficient of variation Cv decreases by 59.6%. Higher flow rates strengthen the coupling of shear and vortex energy, and higher solid concentrations weaken stator shear performance. The optimized mixer achieves synergistic improvements in shear efficiency and mixing quality, with over 50% enhancement in mud dispersion stability and more than 15%.

1. Introduction

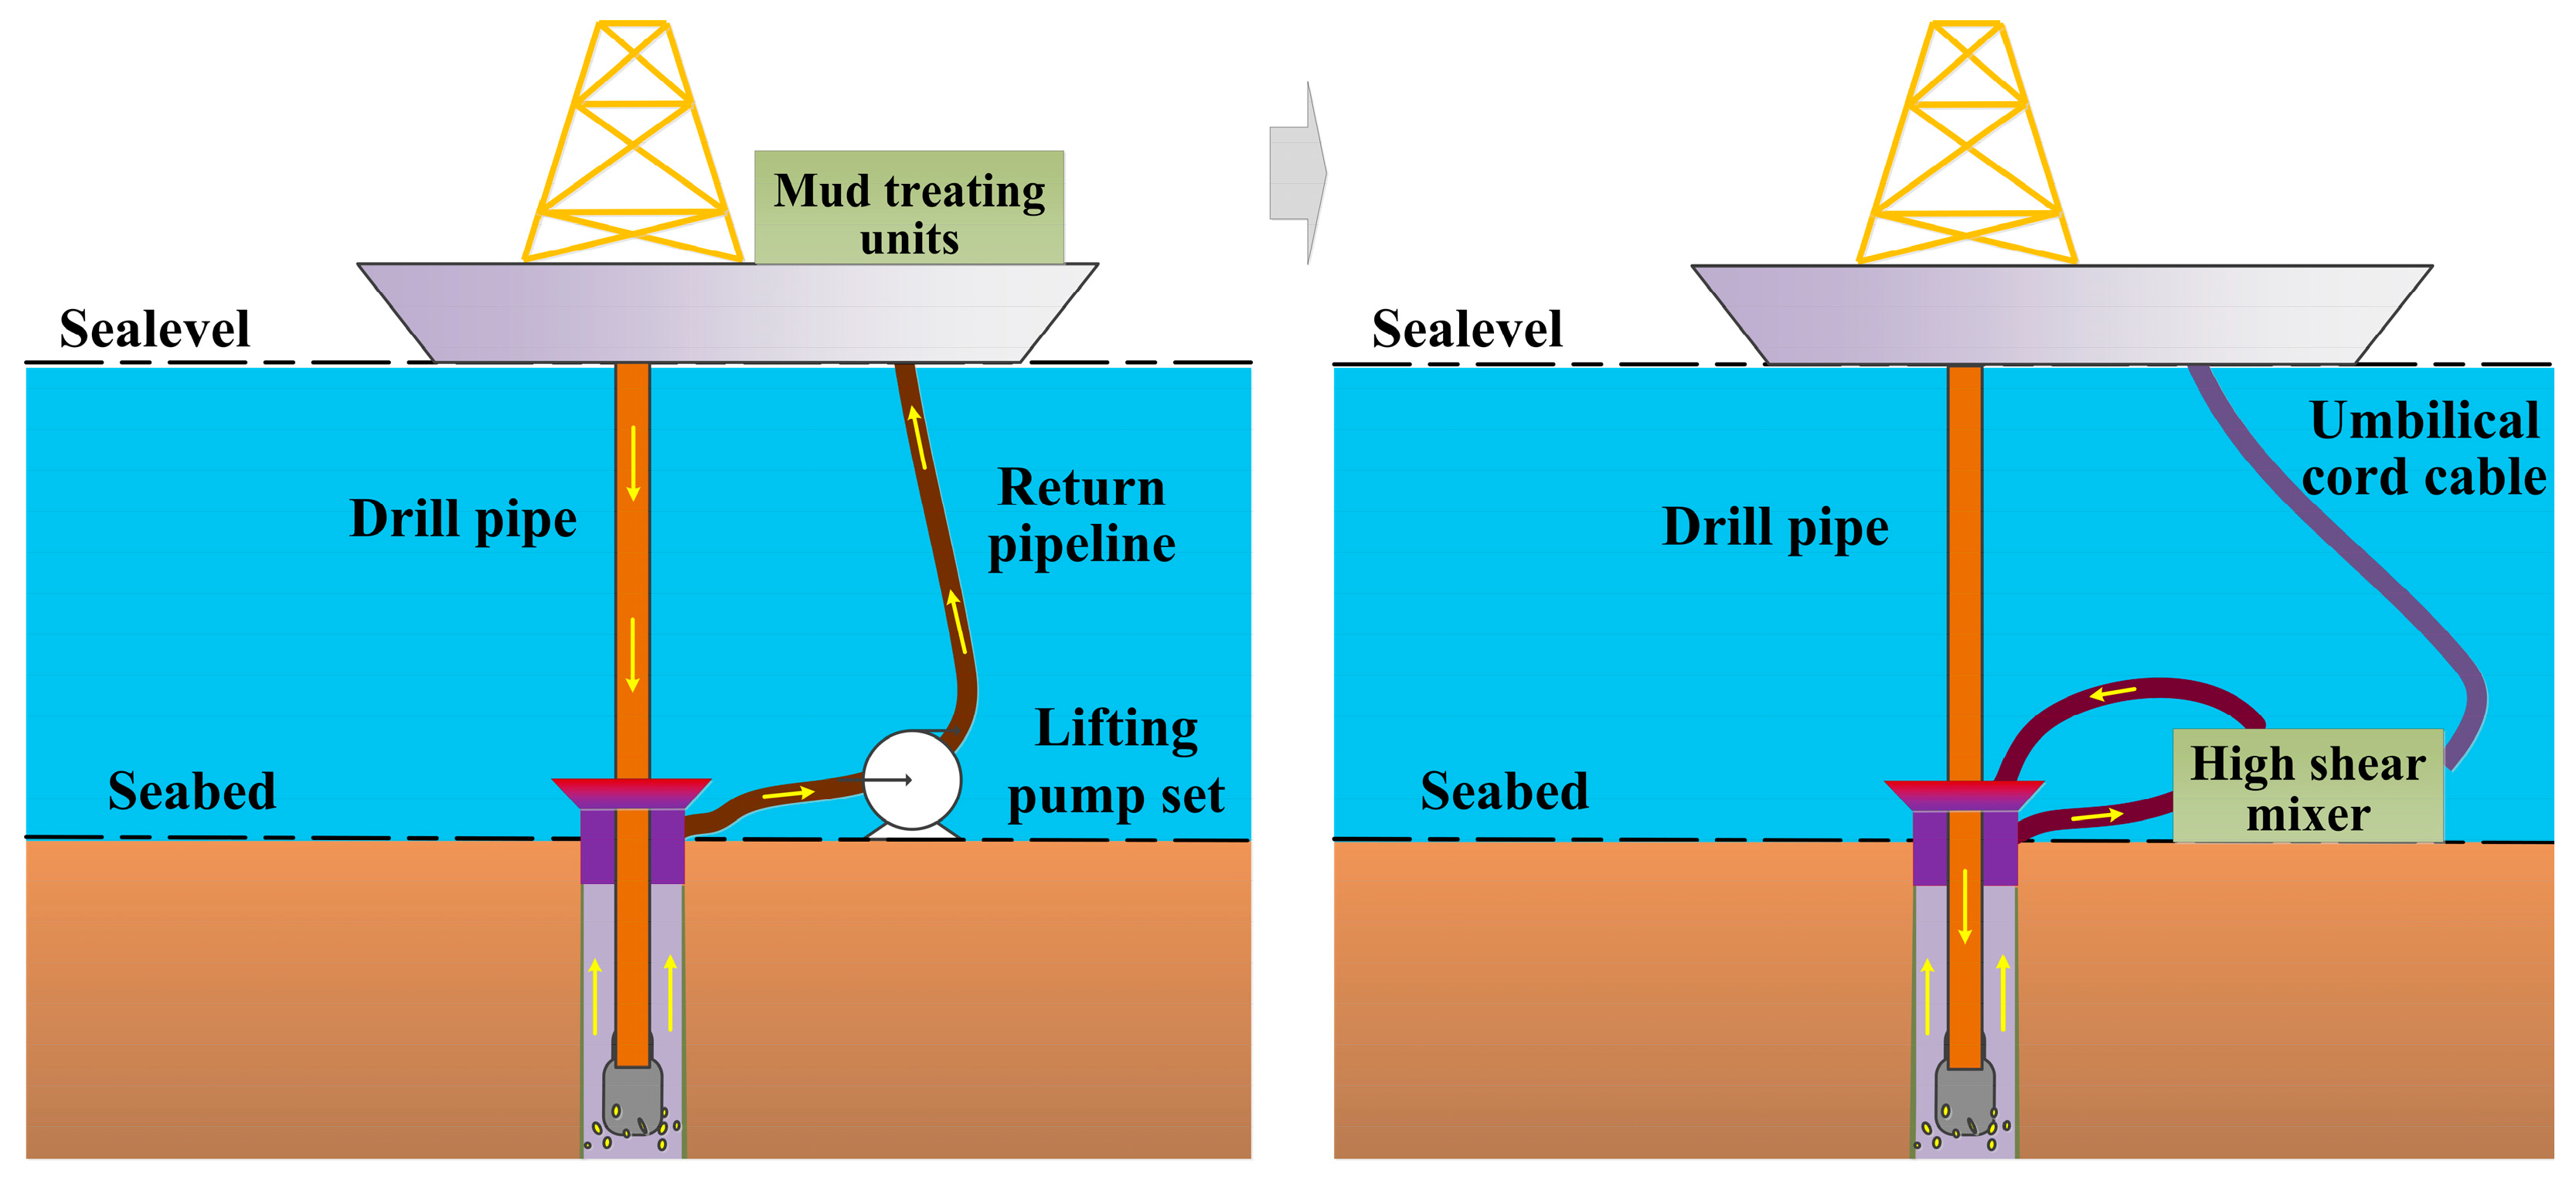
Offshore oil and gas are a core area of the global energy transition. Over the past decade, deepwater reserves have accounted for more than 70% of newly discovered large oil and gas fields. However, conventional drilling faces a narrow formation pressure window in extreme deep-sea environments deeper than 1000 m (about 10 MPa). As a key solution to this issue, dual-gradient drilling imposes extremely stringent requirements on the drilling fluid circulation system [1]. Owing to the long-distance transport from the ‘platform’ to the ‘seabed’, mud processed by conventional platform mixing systems is susceptible to weighting particle settling, which significantly increases the risk of drilling accidents [2,3]. As shown in Figure 1, this study adopts subsea in situ mixing and pressure regulation techniques. The mud mixing equipment is deployed directly at the wellhead, which effectively avoids the particle sedimentation problem caused by the conventional installation mode that circulates fluids back to the offshore platform.
The seabed mud high-shear mixer (HSM) is essential equipment in oil and gas drilling operations, significantly affecting mud properties and performance. The good stability of the drilling fluid can make the cuttings be taken out of the drilling well normally, stabilize the wellbore, and also help to protect the oil and gas layer [4,5]. In actual production, many enterprises are still using open mixing technology; its structure is simple and has a low cost, but the mixing efficiency is low, it is easy to make dust and chemicals volatile, and even the introduction of air can affect the safety and efficiency of drilling [6,7]. Therefore, the mud high-shear mixer has been gradually applied. Because of its obvious advantages in mixing uniformity, material adaptability, and high efficiency, it can quickly deal with chemical drugs and bentonite, realizing high shear, high energy efficiency continuous mixing under pressure, which is unmatched by open mixing tanks [8]. However, the current research basically focuses on a single-energy analysis perspective, and there are few studies on the multi-dimensional energy conversion characteristics of the high-shear mixer based on the energy conversion perspective weight analysis method, such as the dynamic and static domain and the shear domain. Therefore, it is very important to develop a closed, discontinuous-blade, mud high-shear mixer in seabed in situ that can achieve high shear and high efficiency pressurization by introducing shear vortex kinetic energy.
Nowadays, with the rapid development of computational fluid dynamics (CFD) technology, researchers have carried out a lot of research on wear, particle distribution and multiphase flow states in high-shear mixers by numerical simulation. The CFD-DEM coupling method for solid–liquid two-phase flows has matured, which is more advantageous for accurately describing the behavior of particles. Huang et al. [9] employed the CFD-DEM coupled method to analyze the solid–liquid two-phase flow behavior in a single-stage centrifugal pump, clarifying the movement of solid particles and its effect on the pump flow performance in head change. Li et al. [10] investigated particle motion in a deep-sea multi-stage lifting pump using the CFD-DEM method. The results indicated that the number of cycles through the pump had the greatest effect on particle degradation, and increasing the impeller speed favored particle degradation. For high-shear mixers, the researchers carried out a lot of research on the internal flow field. Debnath [6] investigated the reliability of key components in a high-shear homogenizer, specifically the stator and rotor (homogenizer head and rotor structure). The results indicated that homogenization efficiency was closely tied to the stator–rotor gap and the blade shape of the rotor ramp. Guo et al. [11] investigated the impact of stator–rotor structural parameters (e.g., tooth rows, shear gaps, slot widths) on the mixing performance of a high-shear homogenizer. Results indicated that double-row tooth structures improved mixing efficiency and energy dissipation. Wider slots prolonged high-energy dissipation zone residence time, further enhancing mixing. Yang et al. [12] investigated the impact of geometric parameters on a high-shear pump’s heat transfer performance. Results indicated that increasing rotational speed and reducing flow rate significantly enhanced heat transfer efficiency. A set of geometric parameters that could produce a higher turbulent energy dissipation rate and shear rate was determined, and a dimensionless correlation for heat transfer performance was established. Ma et al. [13] investigated flow field characteristics in a high-shear homogenizer using particle image velocimetry (PIV). Results indicated that rotor speed increases strain rate and turbulent kinetic energy dissipation. When the shear gap decreased from 1.5 mm to 0.5 mm, the turbulent kinetic energy dissipation rate increased by 96.8%. A relationship between strain rate, turbulent kinetic energy dissipation rate, and stator/rotor geometric parameters was established.
Concerning energy analysis, through experimental research and theoretical analysis, researchers have learned that shear stress can represent the strength of shear effect and shear rate is usually used instead of shear stress. Sisodia et al. [14] developed an enhanced methodology for calculating the shear rate of drilling fluids using a rotating narrow-gap coaxial cylinder. Generalized differential calculations were carried out under well-controlled conditions, including a pure steady state, laminar flow, and isothermal rotating fluid, making the method particularly suitable for estimating the shear rate in power-law fluids. In a related application, the shear rate measurement approach was extended by Boston et al. [15] to a laminar mixing tank system. A composite expectation function, constructed from regression models, was optimized via a simplified gradient algorithm to maximize its value. This procedure yielded an average shear rate deviation between 0.56% and 9.0%. To date, the hydrodynamic characteristics, energy dissipation and mixing performance of high-shear mixers have also attracted much attention. Vashisth et al. [16] numerically analyzed the flow field and mixing characteristics of HSMs with different stator heads, revealed the effects of fluid viscosity and rotor speed on turbulence and energy dissipation, and found that the mesh stator head presented the optimal energy dissipation near the rotor. Zhao et al. [17] combined large eddy simulation and proper orthogonal decomposition to analyze the flow and vortex structures in the shear gap and rotor–stator region of inline HSMs, and clarified the spatiotemporal evolution of flow structures. Ma et al. [18] experimentally investigated the effects of fluid viscosity and rotor structural parameters on local shear stress via particle image velocimetry, and established a correlation model between strain rate and structural parameters. Xing et al. [19] studied the deagglomeration performance of HSMs based on turbulent kinetic energy dissipation, and constructed a quantitative relationship between particle size evolution and input energy density, providing theoretical support for the design and scale-up of HSMs. The traditional pressure drop hydraulic loss calculation method has been unable to meet the exact location of the energy loss inside the pump and understand the specific flow mechanism. Therefore, the eddy energy theory that has emerged in recent years is the focus of researchers. The vortex phenomenon and viscous effect are very obvious in rotating machinery such as mixers. Compared with the observation of velocity field and pressure field, vortex dynamics can be observed more intuitively and effectively. At present, most of the research on vortex dynamics focuses on centrifugal pumps, screw pumps, vortex pumps, etc., and the research on high-shear mixers remains to be further studied. The Lamb vector is a kind of vortex force, which plays an important role in characterizing the flow state. The divergence and curl of the Lamb vector are related to momentum and vorticity transport in the flow field [20,21]. Lamb vector divergence is also known as Lamb vortex energy. Its positive and negative values represent the stretching and pushing motion of vorticity, respectively, which can represent the role of vortex force in the flow field in unsteady flow. Enstrophy represents the induced dissipation of kinetic energy by viscous and vorticity fields in viscous media. Based on the DDES turbulence model and vorticity of vortex dynamics, Tang et al. [22] carried out an unsteady numerical simulation of vortex motion in centrifugal pumps under multiple working conditions. Compared with the RNG turbulence model, the DDES turbulence model could better simulate the fine flow field structure. The vortex is mainly concentrated near the inlet and the tongue and moves with the fluid. The large vortex breaks into many small vortices, and the vorticity and vortex distribution range gradually decreases with the flow rate. Wang et al. [23] analyzed the flow rate, vorticity and energy distribution at the outlet of the double pump. Using the Liutex vortex identification method, it was found that the vortex was mainly caused by the backflow and velocity gradient along the wall. Reynolds stress leads to kinetic energy dissipation, and the formation of massive and banded vortices accelerates energy dissipation. The Eulerian multiphase flow model is an Eulerian–Eulerian model for dealing with multiphase flow problems. When simulating solid–liquid two-phase flow, the physical properties of the solid phase and liquid phase can be set separately. In this model, the solid phase is treated as a continuous phase similar to the fluid, which is suitable for studying the microscopic mechanism of solid–liquid two-phase flow in the pump. Tarodiya et al. [24] used the Eulerian multiphase flow model to simulate the centrifugal slurry pump of a solid–liquid mixture. The performance characteristics of the slurry pump predicted by Eulerian multiphase flow were very close to the experimental results, and the deviations of the water head and efficiency ratio were about 2% and 3%, respectively. Therefore, current research on the solid–liquid two-phase mixing mechanism in high-shear mixers needs to be strengthened. Most existing studies focus on macroscopic observations of flow fields, pressure distributions, and particle transport. Although energy analysis methods have been widely applied to conventional fluid machinery such as centrifugal pumps and axial-flow pumps, and some scholars have adopted single-energy indicators for the evaluation of such mixers in recent years, a microscopic analysis framework combining multi-dimensional energy and vortex dissipation has not yet been established. This makes it difficult to balance the optimization of efficiency and energy efficiency for high-shear mixers [25].
In this study, to address the limitations of the conventional hydraulic pressure drop model that only macroscopically calculates the total energy loss, fails to accurately locate energy dissipation regions and can hardly quantify mixing quality, we break through the restriction of single-energy analysis and establish an energy-weighted analysis method coupling shear rate, Lamb vortex energy, and Enstrophy. This triple-coupled model can fully characterize the energy conversion laws from multiple dimensions including shear action, vortex-driven dissipation and viscous vorticity kinetic energy dissipation, showing significant superiority in evaluating mixing quality. On this basis, an in-depth investigation is conducted on the multi-dimensional energy conversion characteristics in the dynamic–static flow regions and shear regions of the mud high-shear mixer. Numerical simulations are performed to identify the distribution locations and evolution laws of energy loss under varying particle concentrations and inlet flow rates, reveal the coupled effects of operating conditions on shear rate, Lamb vortex energy and Enstrophy, and compare the vortex energy dissipation mechanisms between the optimized mixer and the first-generation mixer, thereby clarifying the optimization direction of the mixer. The findings provide a new theoretical support from the perspective of shear vortex energy for the development of closed, discontinuous-blade, mud high-shear mixers with high shear and high-efficiency pressurization performance, and also offer a reference for the optimization design of similar mixing equipment.

2. Methods and Model

To overcome the limitation of the traditional hydraulic pressure drop model that can only calculate energy loss macroscopically and cannot reveal the microscopic energy mechanism of high-shear mixing, this study constructs a triple-coupled energy analysis framework of shear rate–Lamb vortex energy–Enstrophy.

2.1. Shear Energy Conversion Theory

2.1.1. Shear Rate Theory

The shear rate is used to describe the deformation rate of the fluid under the action of shear force, and can also be used as an index to measure the mixing efficiency of the mud. The shear rate formula of simple laminar flow is designed to consider the stretching, compression and deformation of fluid micro-mass, which is suitable for laminar flow of Newtonian fluid and power-law fluid [6,15,16]. However, in high-shear turbulent flows, the time-averaged shear rate alone cannot fully characterize the energy dissipation features induced by turbulent fluctuations, and the fluctuating velocity field cannot be directly obtained from numerical simulation post-processing. To this end, this study draws on the engineering approximation method for turbulent fluctuating entropy production and introduces a fluctuating energy correction term to refine the quantitative analysis of shear energy dissipation. This method has been maturely applied in the analysis of energy dissipation and fluctuating entropy production in rotating machinery [26,27].
The time-averaged shear rate is calculated from the time-averaged strain rate tensor, as shown in Equation (1).
γ ˙ ¯ = 2 ε ¯ : ε ¯ = 1 2 i = 1 3 j = 1 3 v j x i + v i x j 2
where γ ˙ ¯ is shear rate, (s−1), and ε ¯ is average shear rate, (s−1).
Similarly, the fluctuating shear rate can be expressed by Equation (2):
γ = 2 ε : ε = 1 2 i = 1 3 j = 1 3 v j x i + v i x j 2
where γ is shear rate, (s−1), and ε is average shear rate, (s−1).
Since the fluctuating velocity cannot be obtained via post-processing, and to characterize the contribution of turbulent fluctuations to shear energy dissipation, factors such as rotational speed, flow rate, the intensity of fluid micro-mass motion, the ability to resist deformation, and the influence of turbulent disturbances are considered. Parameters k and f are introduced, and the classical empirical model for fluctuating entropy production approximation is adopted to calculate the fluctuating energy correction term:
γ = C ρ k f μ e f f
where C is the empirical coefficient, which is referenced from the approximate calculation of the fluctuating entropy production term and temporarily set to 0.2; ρ is the fluid density (kg/m3); k is the turbulent kinetic energy (m2/s2); f is the turbulent fluctuation frequency (s−1); μ e f f is the effective dynamic viscosity ( P a s ), defined as μ e f f = μ + μ t , where μ is the dynamic viscosity, and μ t is the turbulent dynamic viscosity.
Therefore, the turbulent shear rate adopted in this study is expressed as follows:
γ ˙ = 1 2 i = 1 3 j = 1 3 v j x i + v i x j 2 + C ρ k f μ e f f

2.1.2. Eddy Kinetic Energy Theory

High-shear mixers with high shear force generate a variety of vortex scales within their internal flow fields during operation. Consequently, studying the transfer and dissipation of eddy kinetic energy from an energy perspective holds significant importance. Once the high-shear mixer reaches stable operation, its internal flow field can be approximated as a uniformly rotating flow. Based on the Boussinesq approximation, the rotating fluid is assumed to satisfy the basic motion equation and momentum equation in a uniformly rotating reference frame.
In the mixed flow process, both solid and liquid phases are treated as incompressible fluids, so the continuity equation in a rotating coordinate system is:
V = 0
For an incompressible fluid, the vector form of the N-S equation is introduced:
d V d t = 2 Ω × V + σ g ( + p ρ 0 ) + v 2 V
By neglecting the centrifugal force term of minor influence, the vorticity equation in the rotating coordinate system is derived via curl calculation as follows:
ω t + V · ω = 2 Ω + ω · V + σ × g + v 2 ω = 0
In Equation (7), the density term relates to temperature or concentration. Minimal temperature changes due to short fluid residence time allow neglecting density variations, and disregarding centrifugal force yields the simplified Navier–Stokes equation:
V V t = V 2 Ω + ω × V + V g + ( p ρ 0 + V 2 2 ) + μ V 2 V
In the operation of rotating machinery such as mixers, the driving blade will promote the high-speed rotation of the fluid. In this case, the flow Reynolds number of the flow field is often high, which makes the turbulence phenomenon and viscosity in the flow field become very prominent. In order to further study the flow characteristics of the fluid, the eddy viscosity hypothesis and fluid viscosity in the turbulence theory are combined. Let ε = ρ 0 μ , simplify, and obtain the final energy transport equation of the rotating fluid:
ρ 0 E t = ρ 0 g · V ρ 0 V 2 2 V · p V ε · ω × V ε ω 2
The left side of Equation (9) is the total energy of the fluid, the first three items on the right side are the mechanical energy of the fluid micro-mass, and the last two items represent the effects of viscous force and viscous dissipation on the fluid micro-mass.
The term ε · ω × V on the right side of the equation is the work done by the tangential viscous force, which represents the nonlinear work of the velocity and vorticity of the power-law fluid in the flow field, also known as the Lamb vector. The divergence of the Lamb vector is usually related to the energy conversion of the power-law fluid, which is usually defined as the Lamb vortex energy [28,29,30]. The term ε ω 2 on the right side of the equation is the energy dissipated by viscosity, which is affected by the viscosity and vorticity of the fluid, and is usually called Enstrophy [31,32,33].

2.2. Physical Model

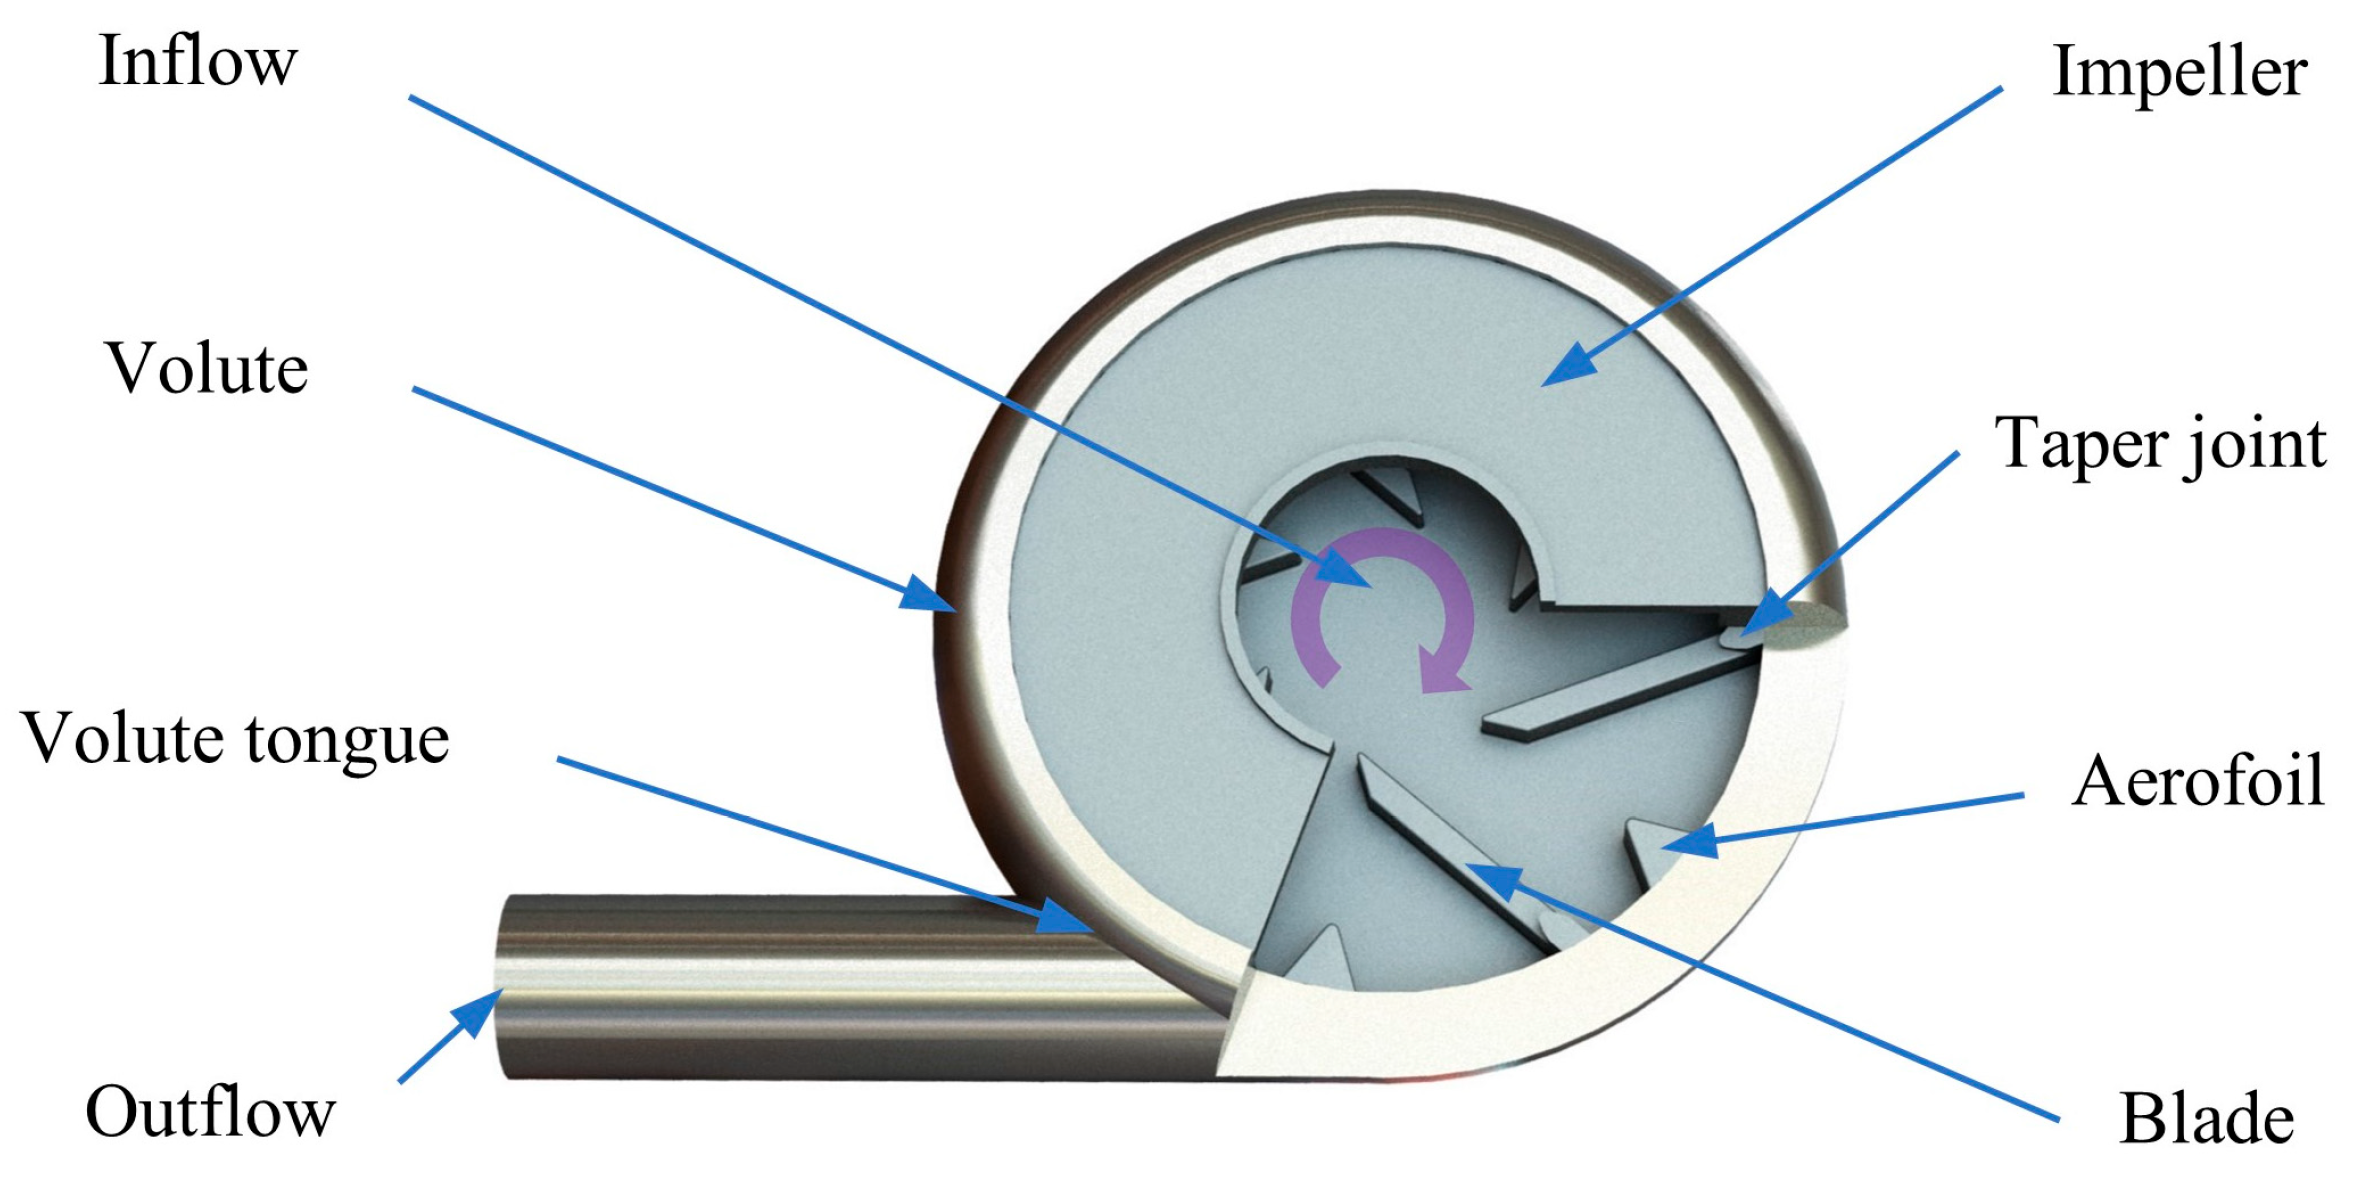
Our research group has developed the first generation of mud high-shear mixer in the early stage. The mixer is composed of six sets of blades with unequal lengths and six sets of aerofoil deflectors [34], as shown in Figure 2.
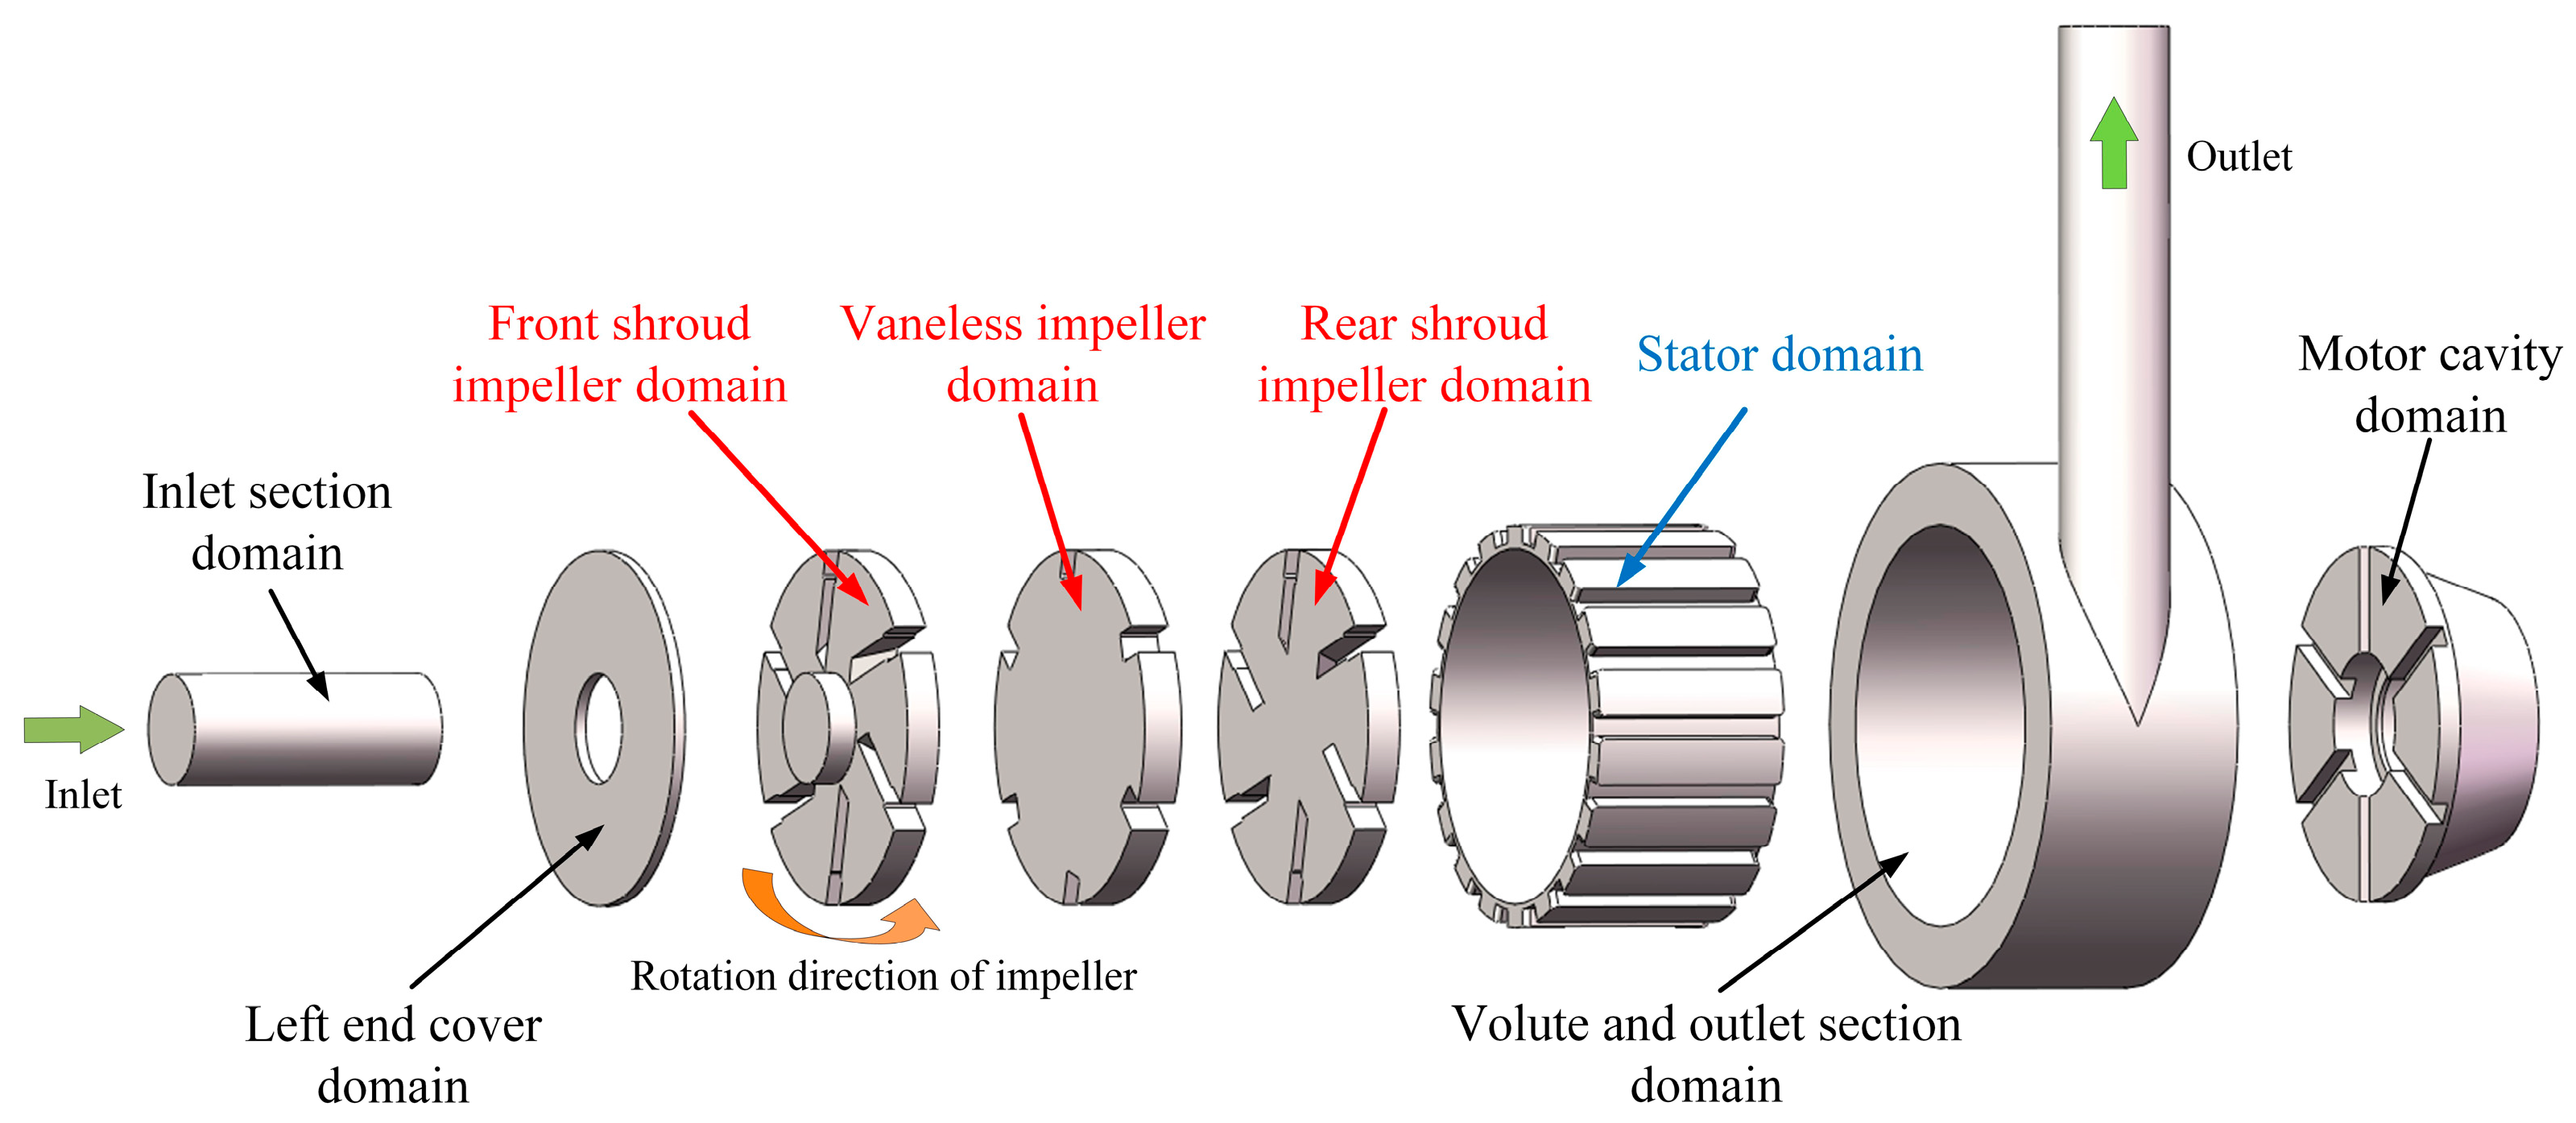
In this study, the first generation high-shear mixer was optimized, and the improved mud high-shear mixer with shear force was modeled in three dimensions. The extracted fluid domain was divided into 8 regions, as shown in Figure 3.
The impeller of the high-shear mixer model is composed of two groups of six discontinuous blades, and the middle of the impeller is a bladeless area. This design enhances the conveying capacity of the mixer while avoiding blockage caused by mud discharge challenges. The stator area contains 18 axial rectangular gaps, which help enhance the shear effect on the fluid. The high-shear mixer operates at a design speed of 2900 rpm, with a flow rate of 13 m3/h and a head of 6.2 m. Compared with the first-generation mixer, the model in this study features a reduced blade shear angle, inlet/outlet diameters and radial dimensions, along with an enlarged bladeless area and an additional stator structure. Detailed parameters are provided in Table 1.
For accurate numerical simulation, the lengths of the inlet and outlet sections are appropriately extended during the construction of the fluid domain, ensuring a minimum length of three times the pipe diameter. The fluid domain is divided into eight regions: inlet section, left end cover domain, three-layer impeller, stator area, motor cavity domain, volute, and outlet section.
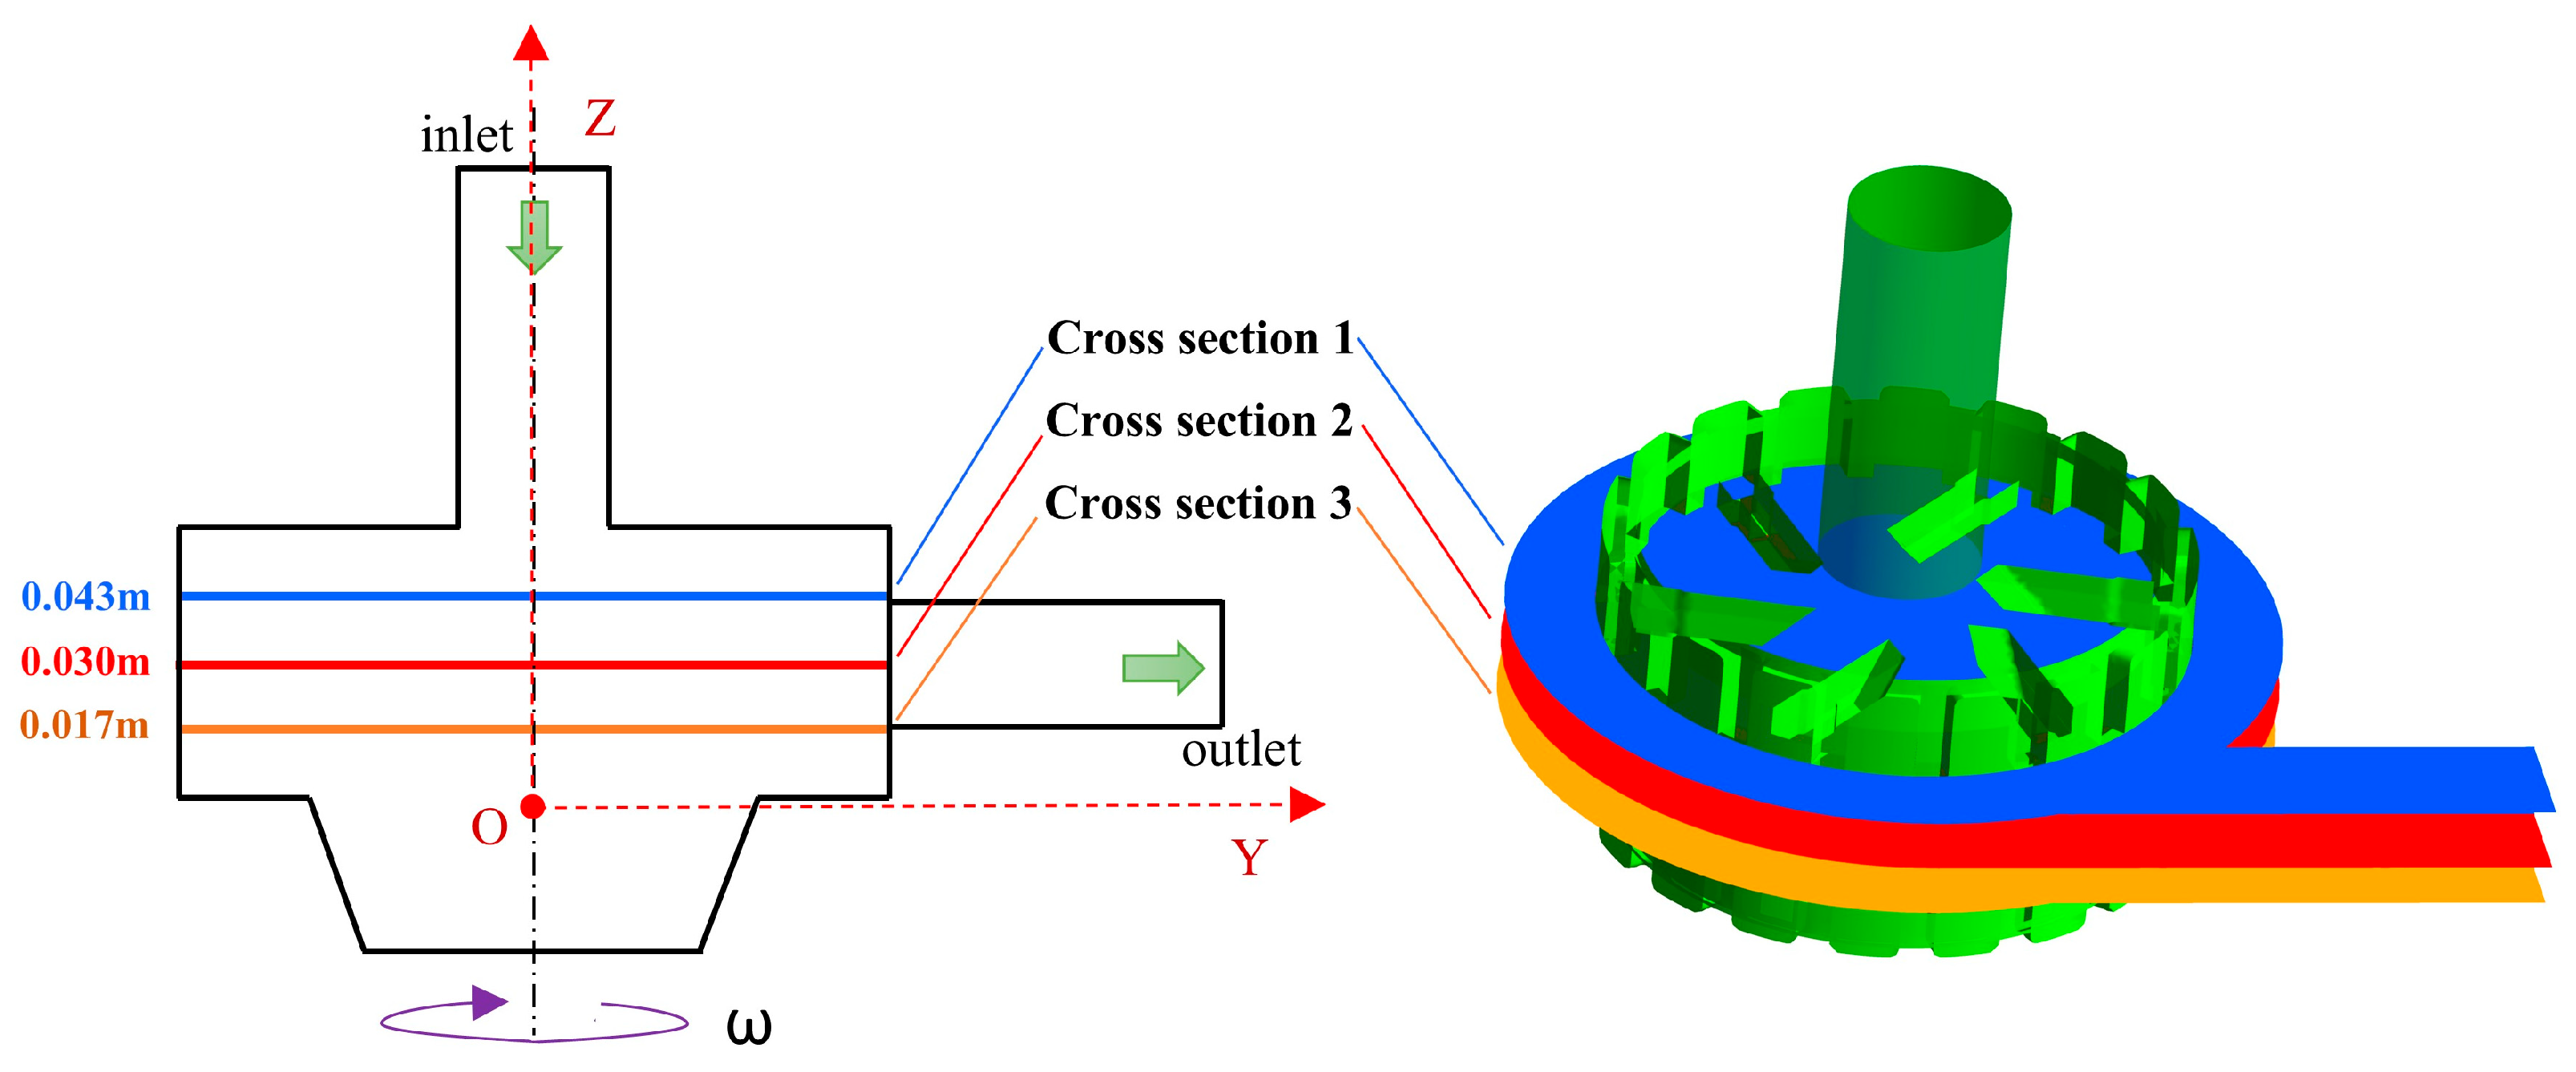
In order to study the energy conversion and dissipation of fluid flow in the mixer, and specifically understand its distribution in the stator and impeller, three monitoring surfaces perpendicular to the Z-axis are established in the basin, as shown in Figure 4. Section 1 is 0.043 m from the Y axis, which is the middle plane of the front shroud impeller domain. Section 2 is 0.030 m from the Y axis, which is the middle plane of the bladeless area. Section 3 is 0.017 m from the Y axis, which is the middle plane of the back shroud impeller domain.

2.3. Mesh Independence Verification

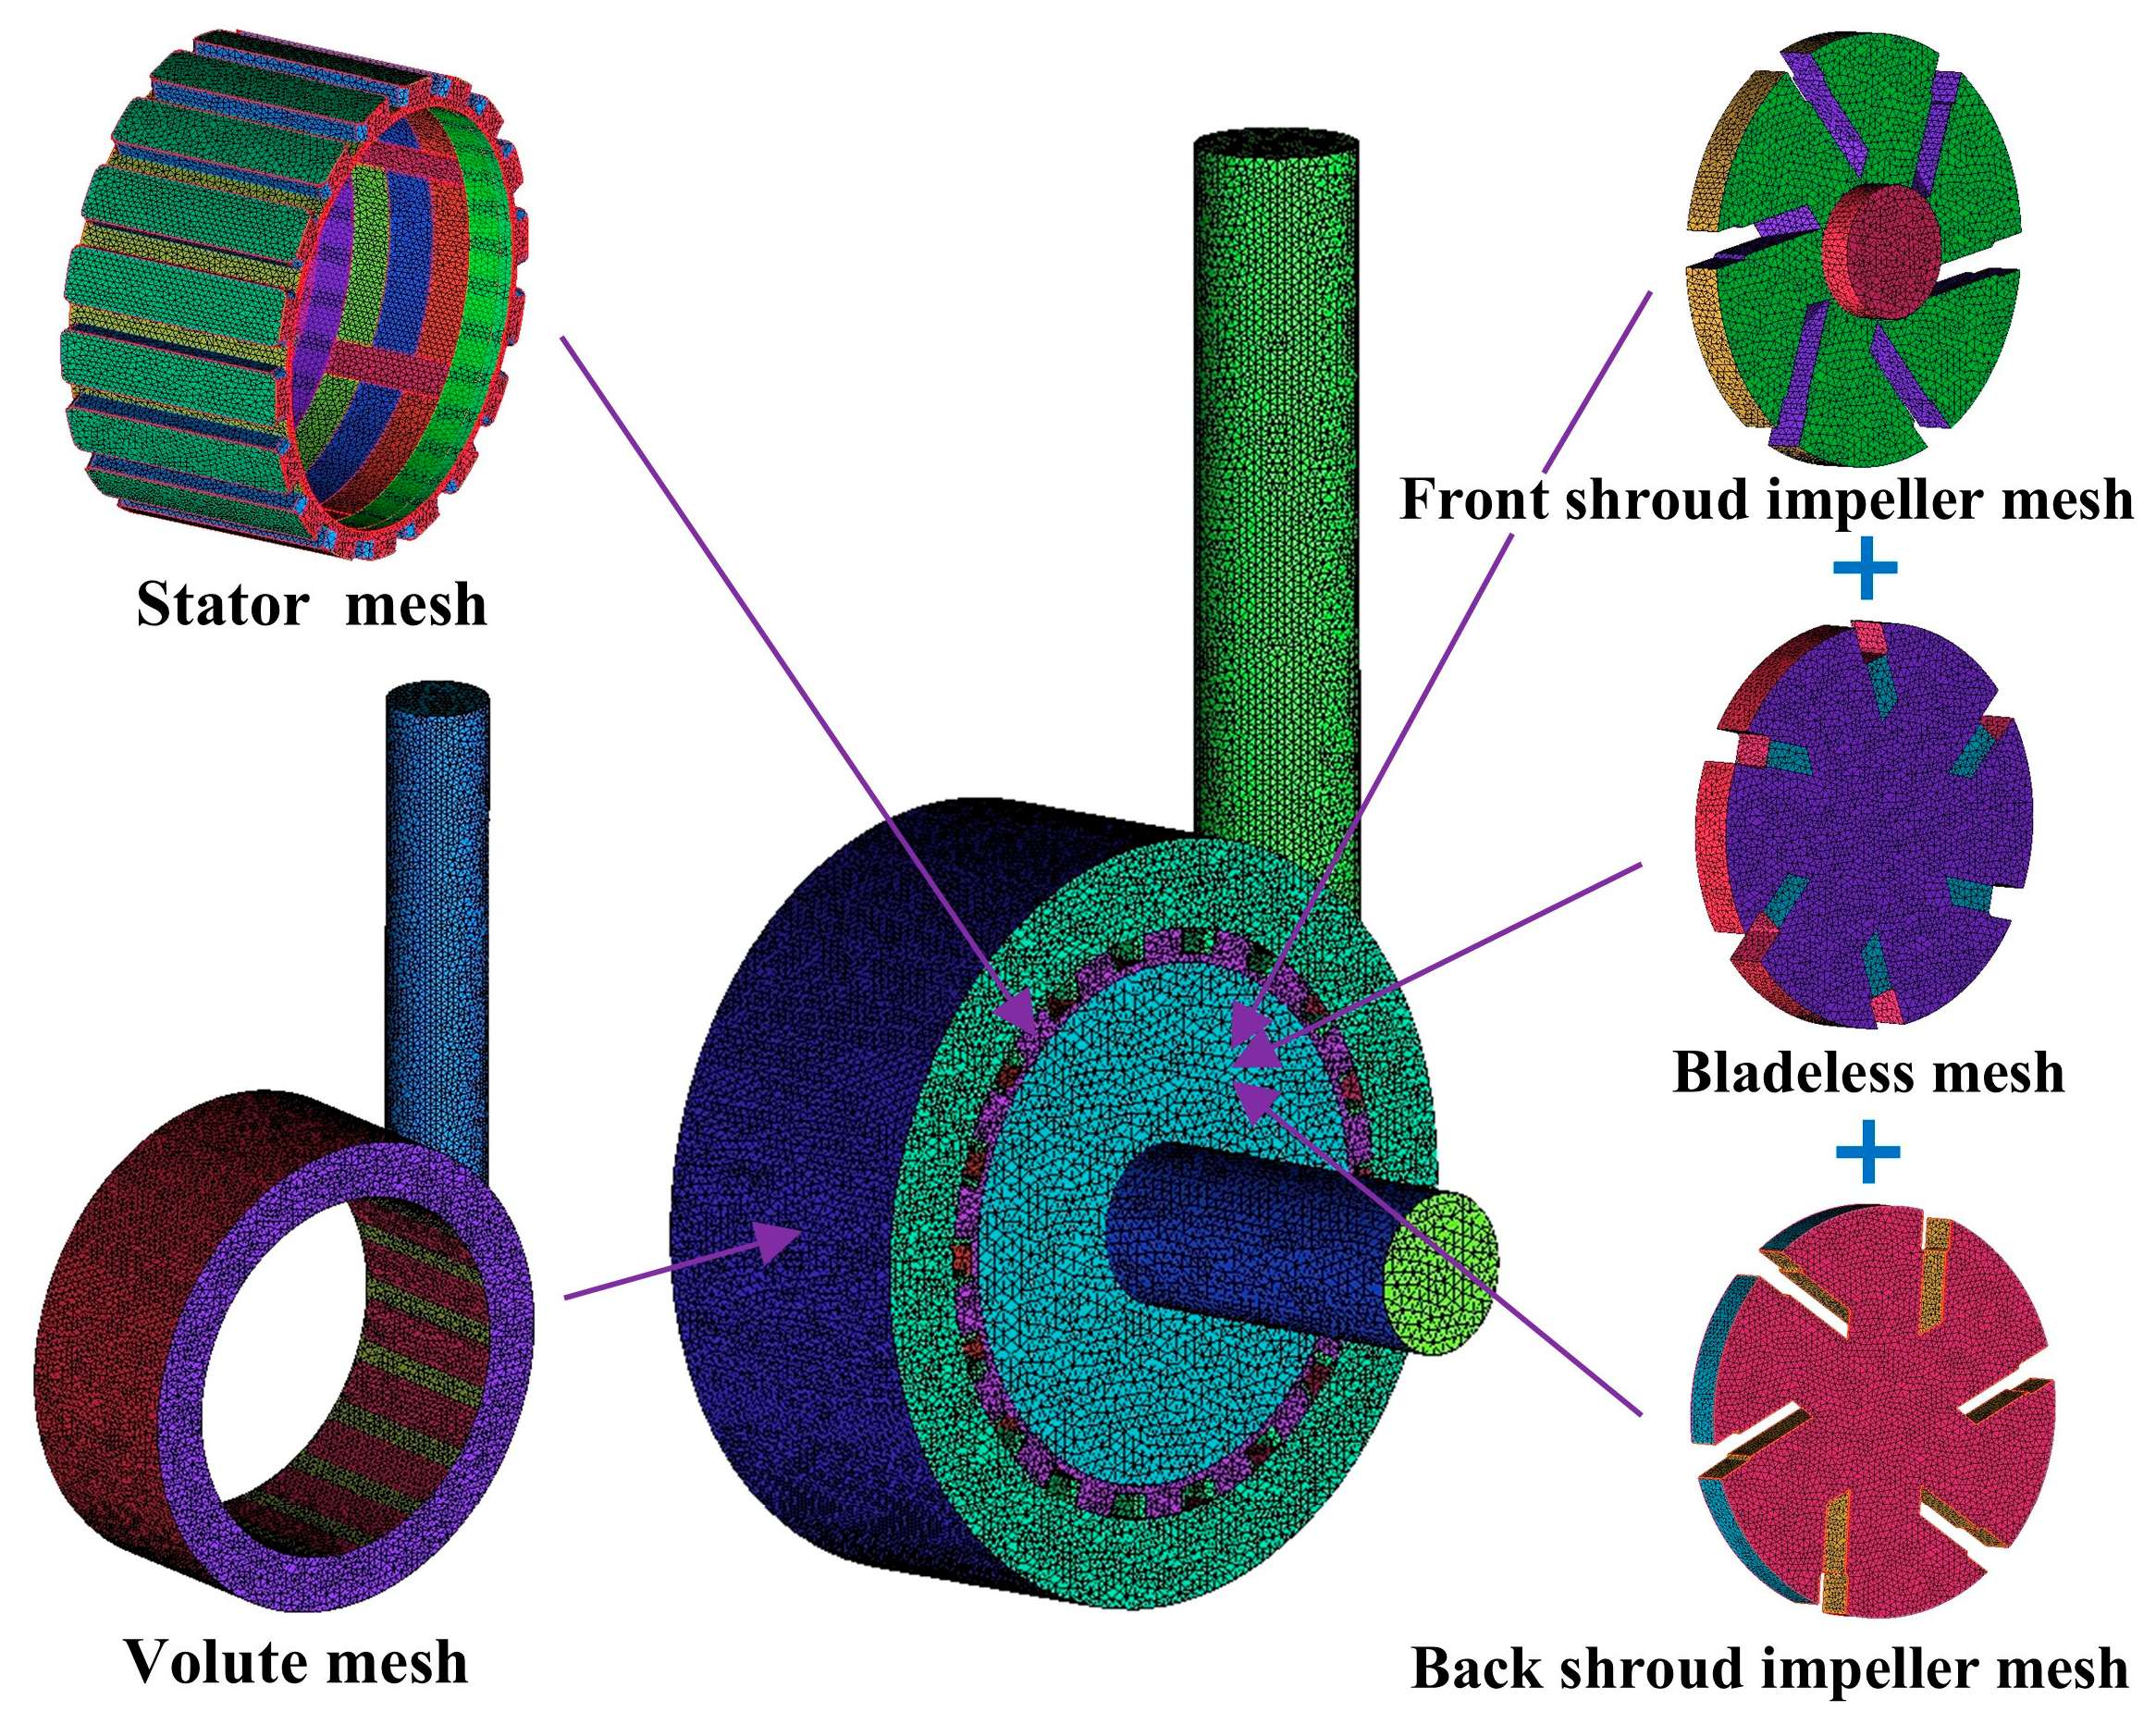
The internal structure of the mud high-shear mixer is relatively complex. To facilitate subsequent study, the internal domain is divided into eight regions, including the inlet section, a three-layer impeller, the stator, and the volute domain. ICEM CFD 2023 R1 software is employed to generate an unstructured tetrahedral mesh of the domain, with localized refinement near wall regions exhibiting high pressure gradients. Considering both computational efficiency and accuracy, a mesh consisting of 1.83 million elements was selected, and the minimum orthogonal quality is 0.216, as illustrated in Figure 5.
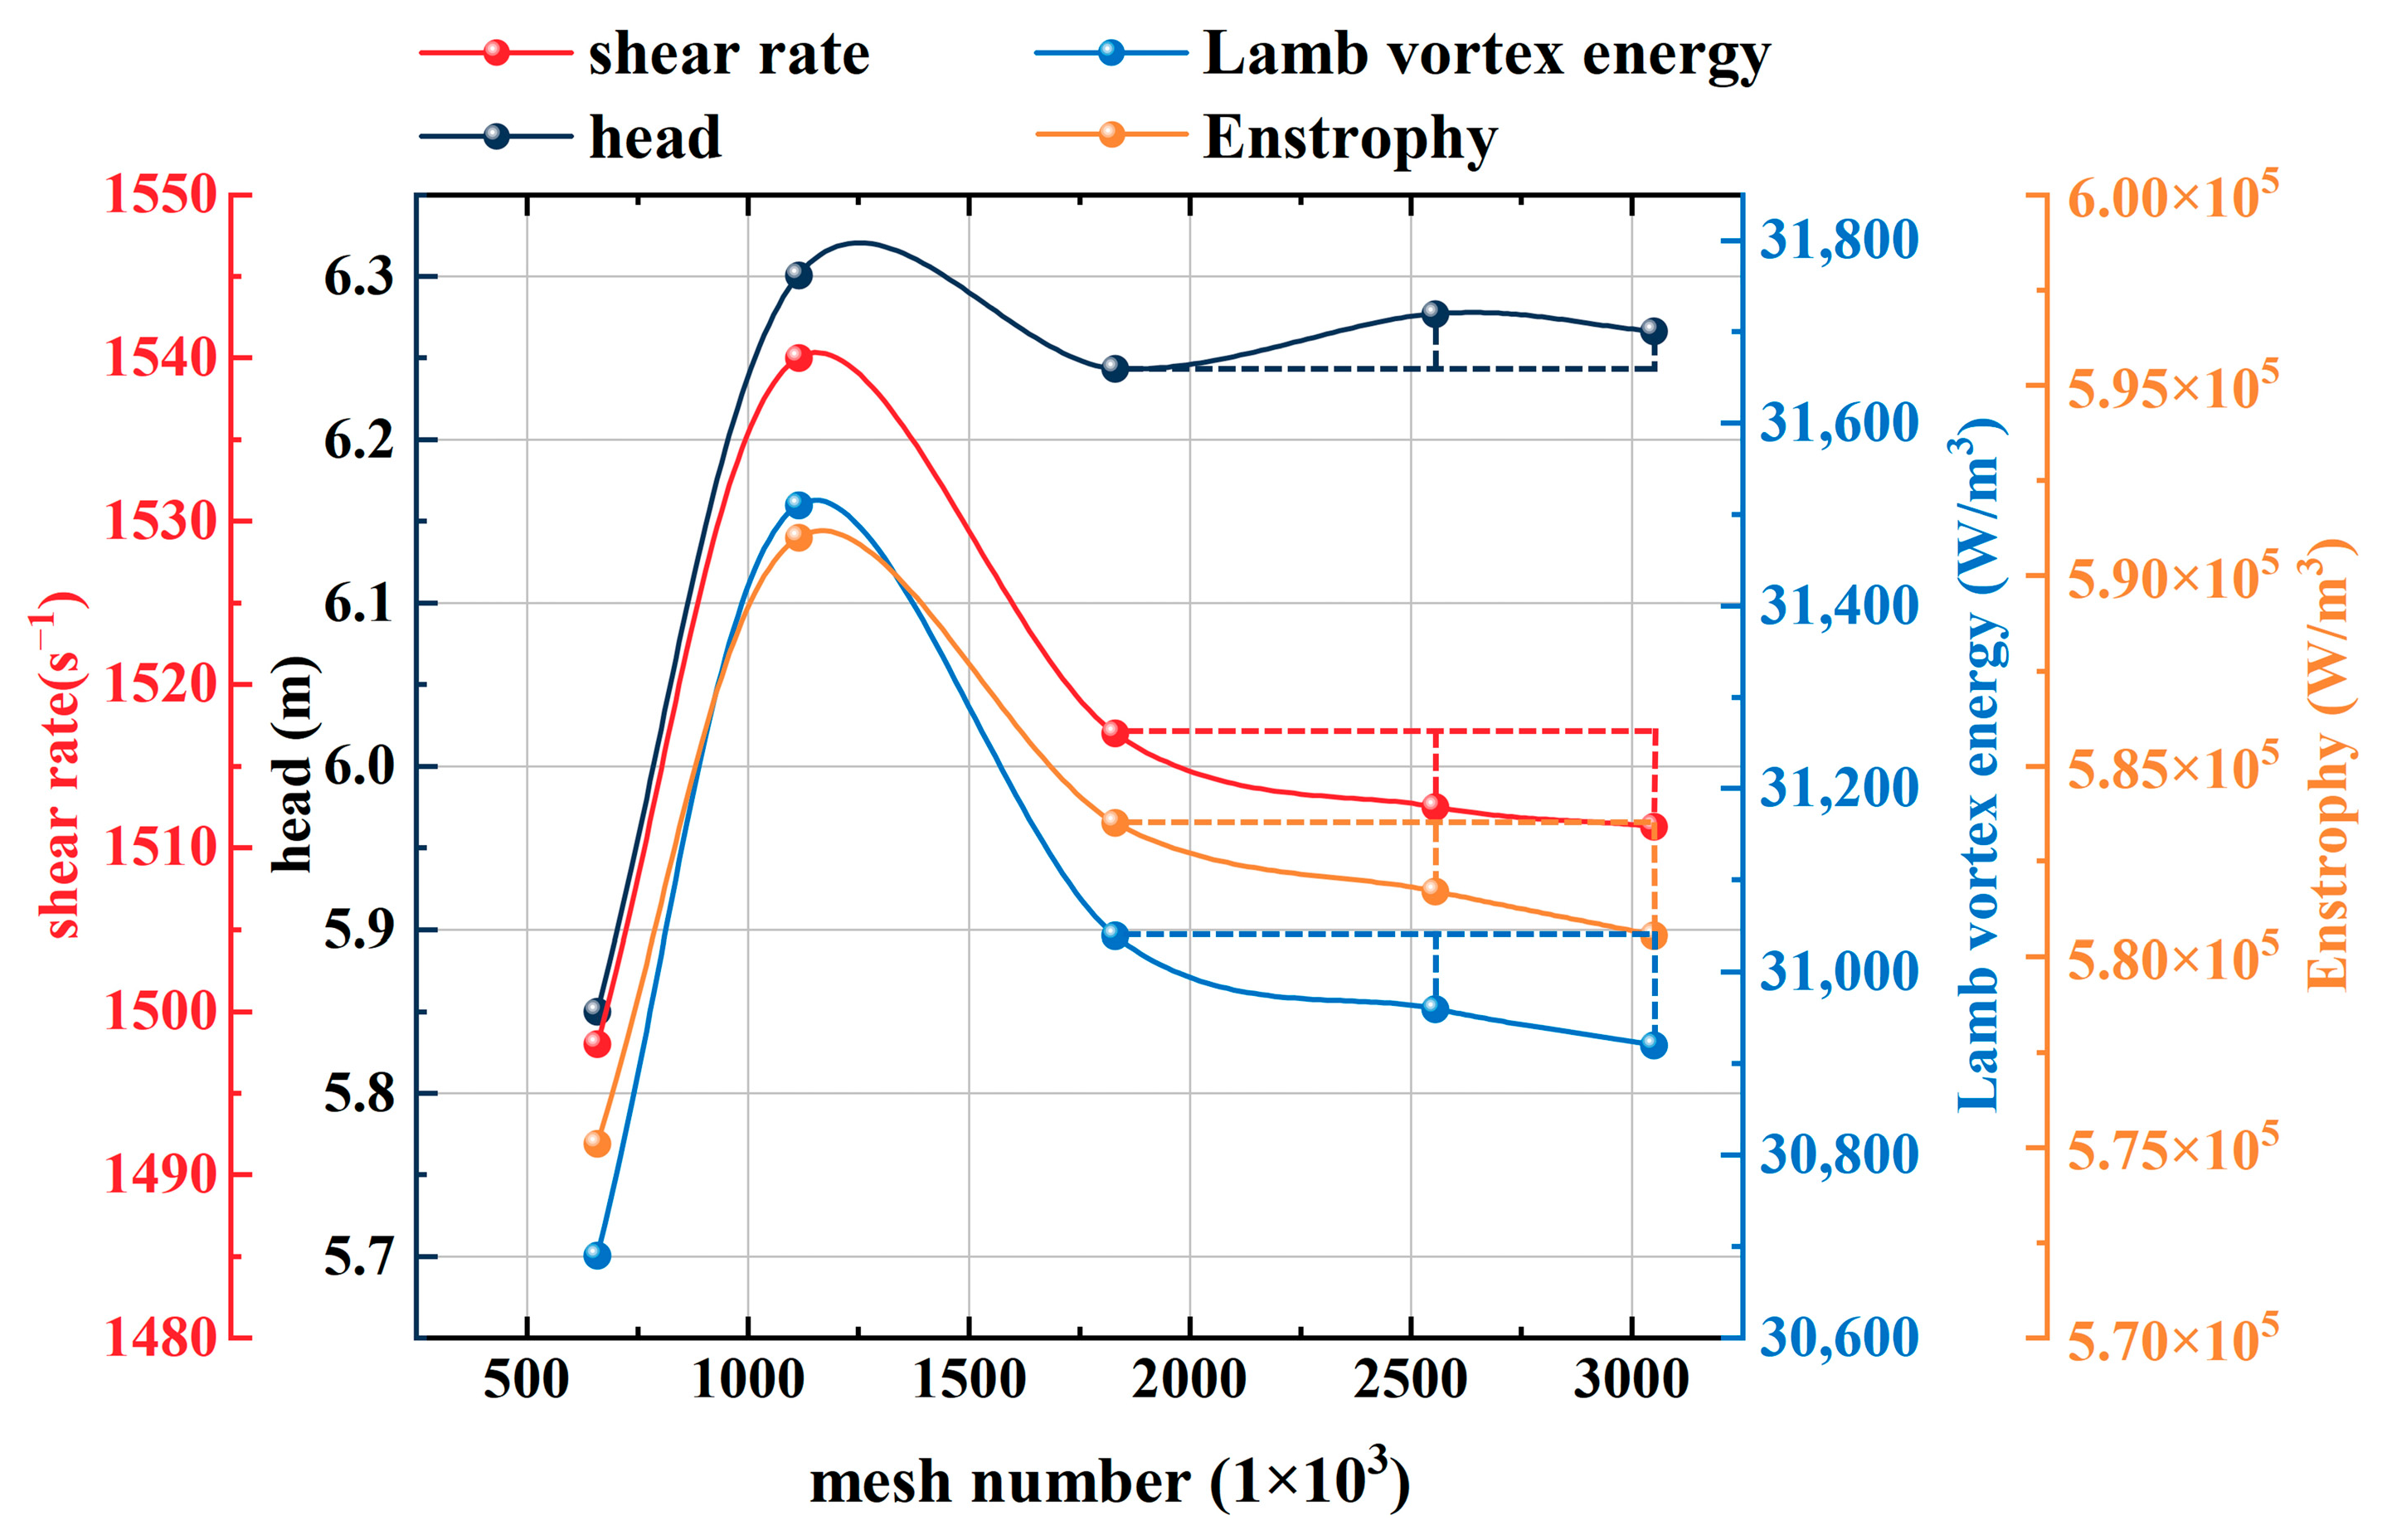
For mesh independence verification, five mesh schemes were designed with the cell count increasing gradually from 658,926 to 3,048,693, as shown in Figure 6. Under the standard design condition, numerical simulations of solid–liquid two-phase flow in the high-shear mixer were performed. During the simulation, the variations of core energy indicators including shear rate, Lamb vortex energy, and Enstrophy under different mesh resolutions were monitored simultaneously. The results demonstrate that when the mesh number increases to 1,829,867, the relative errors of shear rate, Lamb vortex energy, and Enstrophy are all controlled within 1.0%. Further refinement of the mesh count yields no significant reduction in these error values, which meet the engineering-allowed accuracy requirements. Consequently, the mesh scheme with 1,829,867 cells is selected for subsequent numerical studies to balance computational accuracy and cost.

2.4. Numerical Simulation and Boundary Conditions

2.4.1. Calculation Method Based on Euler Model

The Eulerian multiphase flow model is commonly used for simulating multiphase flows with distinct phase velocities. The model assumes that both the solid and liquid phases are continuous media that interpenetrate and interact, and establishes their own continuity equations and momentum equations for each phase. This model demonstrates high accuracy for multiphase flows with a large volume fraction of discrete phase, making it suitable for simulating high-shear mixer [35,36].
The flow equations of Eulerian solid–liquid two-phase flow are as follows:
Continuity equation of liquid phase:
α L t + x i α L U i
Continuity equation of solid phase:
α S t + x i α S V i
The momentum equation of the liquid phase:
t α L U i + x k α L U i U k = 1 ρ L α L P x i + ν L x i α L U i x k + U k x i β ρ L α L α S U i V i + α L g i
The momentum equation of the solid phase:
t α S V i + x k α S V i V k = 1 ρ S α S P x i + ν S x i α S V i x k + V k x i β ρ S α L α S V i U i + α S g i
where U i is the velocity component of the solid phase (m/s), V i is the liquid phase velocity component (m/s), ρ is the density of phase material, (kg/m3), P is pressure (Pa), ν L and ν S are the kinematic viscosity coefficients of the liquid phase and solid phase ( P a s ), x i is the coordinate component, g is the acceleration of gravity (9.8 m/s2); β = 18 1 + β 0 ρ L ν L / d 2 , which is the coefficient of interaction between each phase, d is particle diameter, (mm), β 0 is the flow parameter related to the Reynolds number of the particles, α is the phase volume fraction, α L + α S = 1 , and the subscripts L and S represent the liquid phase and solid phase, respectively.

2.4.2. Boundary Conditions and Physical Properties of Media

Properly setting boundary conditions and selecting initial values are critical in computational fluid dynamics (CFD) simulations. Properly configured boundary conditions enable the simulation results to closely approximate real-world conditions.
Based on the preliminary analysis, the Eulerian two-phase flow model was adopted. The liquid phase is mud (drilling fluid), and the SST k-ω turbulence model was selected for simulation. This turbulence model was first proposed by F. R. Menter in 1994 [37]. It integrates the near-wall computation capability of the standard k-ω model and the boundary-layer and free-flow prediction performance of the standard k-ε model. Menter initially applied this model to the aerodynamic turbulent flow over aircraft wings and verified its accuracy through experiments [38]. Nguyen et al. [39] adopted the SST k-ω model in the numerical simulation of high-shear mixers. PIV experimental results demonstrate that this zonal turbulence model is in good agreement with practical flow fields and is suitable for the simulation of high-shear mixers. The solid phase is modeled as spherical particles with a diameter of 0.5 mm. The maximum particle volume fraction is set to 0.6, and the volume fraction equation is solved using an implicit discretization scheme. Under the operating conditions of this study, the particle Reynolds number is low and the turbulence intensity is moderate, with drag force and gravity as the dominant forces. Owing to the small solid–liquid density difference and the weak influence of virtual mass force, the interphase lift force, turbulent dispersion, and the virtual mass coefficient are not considered in this study. Basic physical setting: the reference pressure is 101,325 Pa, and the gravity acceleration is 9.81 m/s2 along the coordinate Y negative direction of the coordinate system. The type of solver is a pressure base, transient solution. The rotating axis of the impeller domain is set as the Z axis, and the absolute speed is 2900 rpm. The rest of the domain is the stationary domain, and the mesh interface is set between the domains. The inlet boundary condition is the velocity inlet, which is 3.1841 m/s under standard conditions. The turbulence intensity is 5%, and the turbulence viscosity ratio is 10. The outlet boundary condition is the pressure outlet, the gauge pressure is 0 Pa, the backflow turbulence is consistent with the inlet setting, and the flow wall is a non-slip wall. The SIMPLE phase coupling solution scheme is adopted, the sub-relaxation factor remains the default, and the convergence standard is set to 10−4. The standard initialization is adopted, the time step is 0.001 s, the maximum iteration number is 8 steps, the total time step is 900 steps, and the simulation time is 0.9 s.
The density of the liquid phase is set to 1200 kg/m3, the viscosity is 1.003 × 10⁻³ Pa·s, the solid phase density is 2700 kg/m3, and the viscosity is 1.72 × 10⁻⁵ Pa·s.

2.5. Experimental Platform and Model Verification

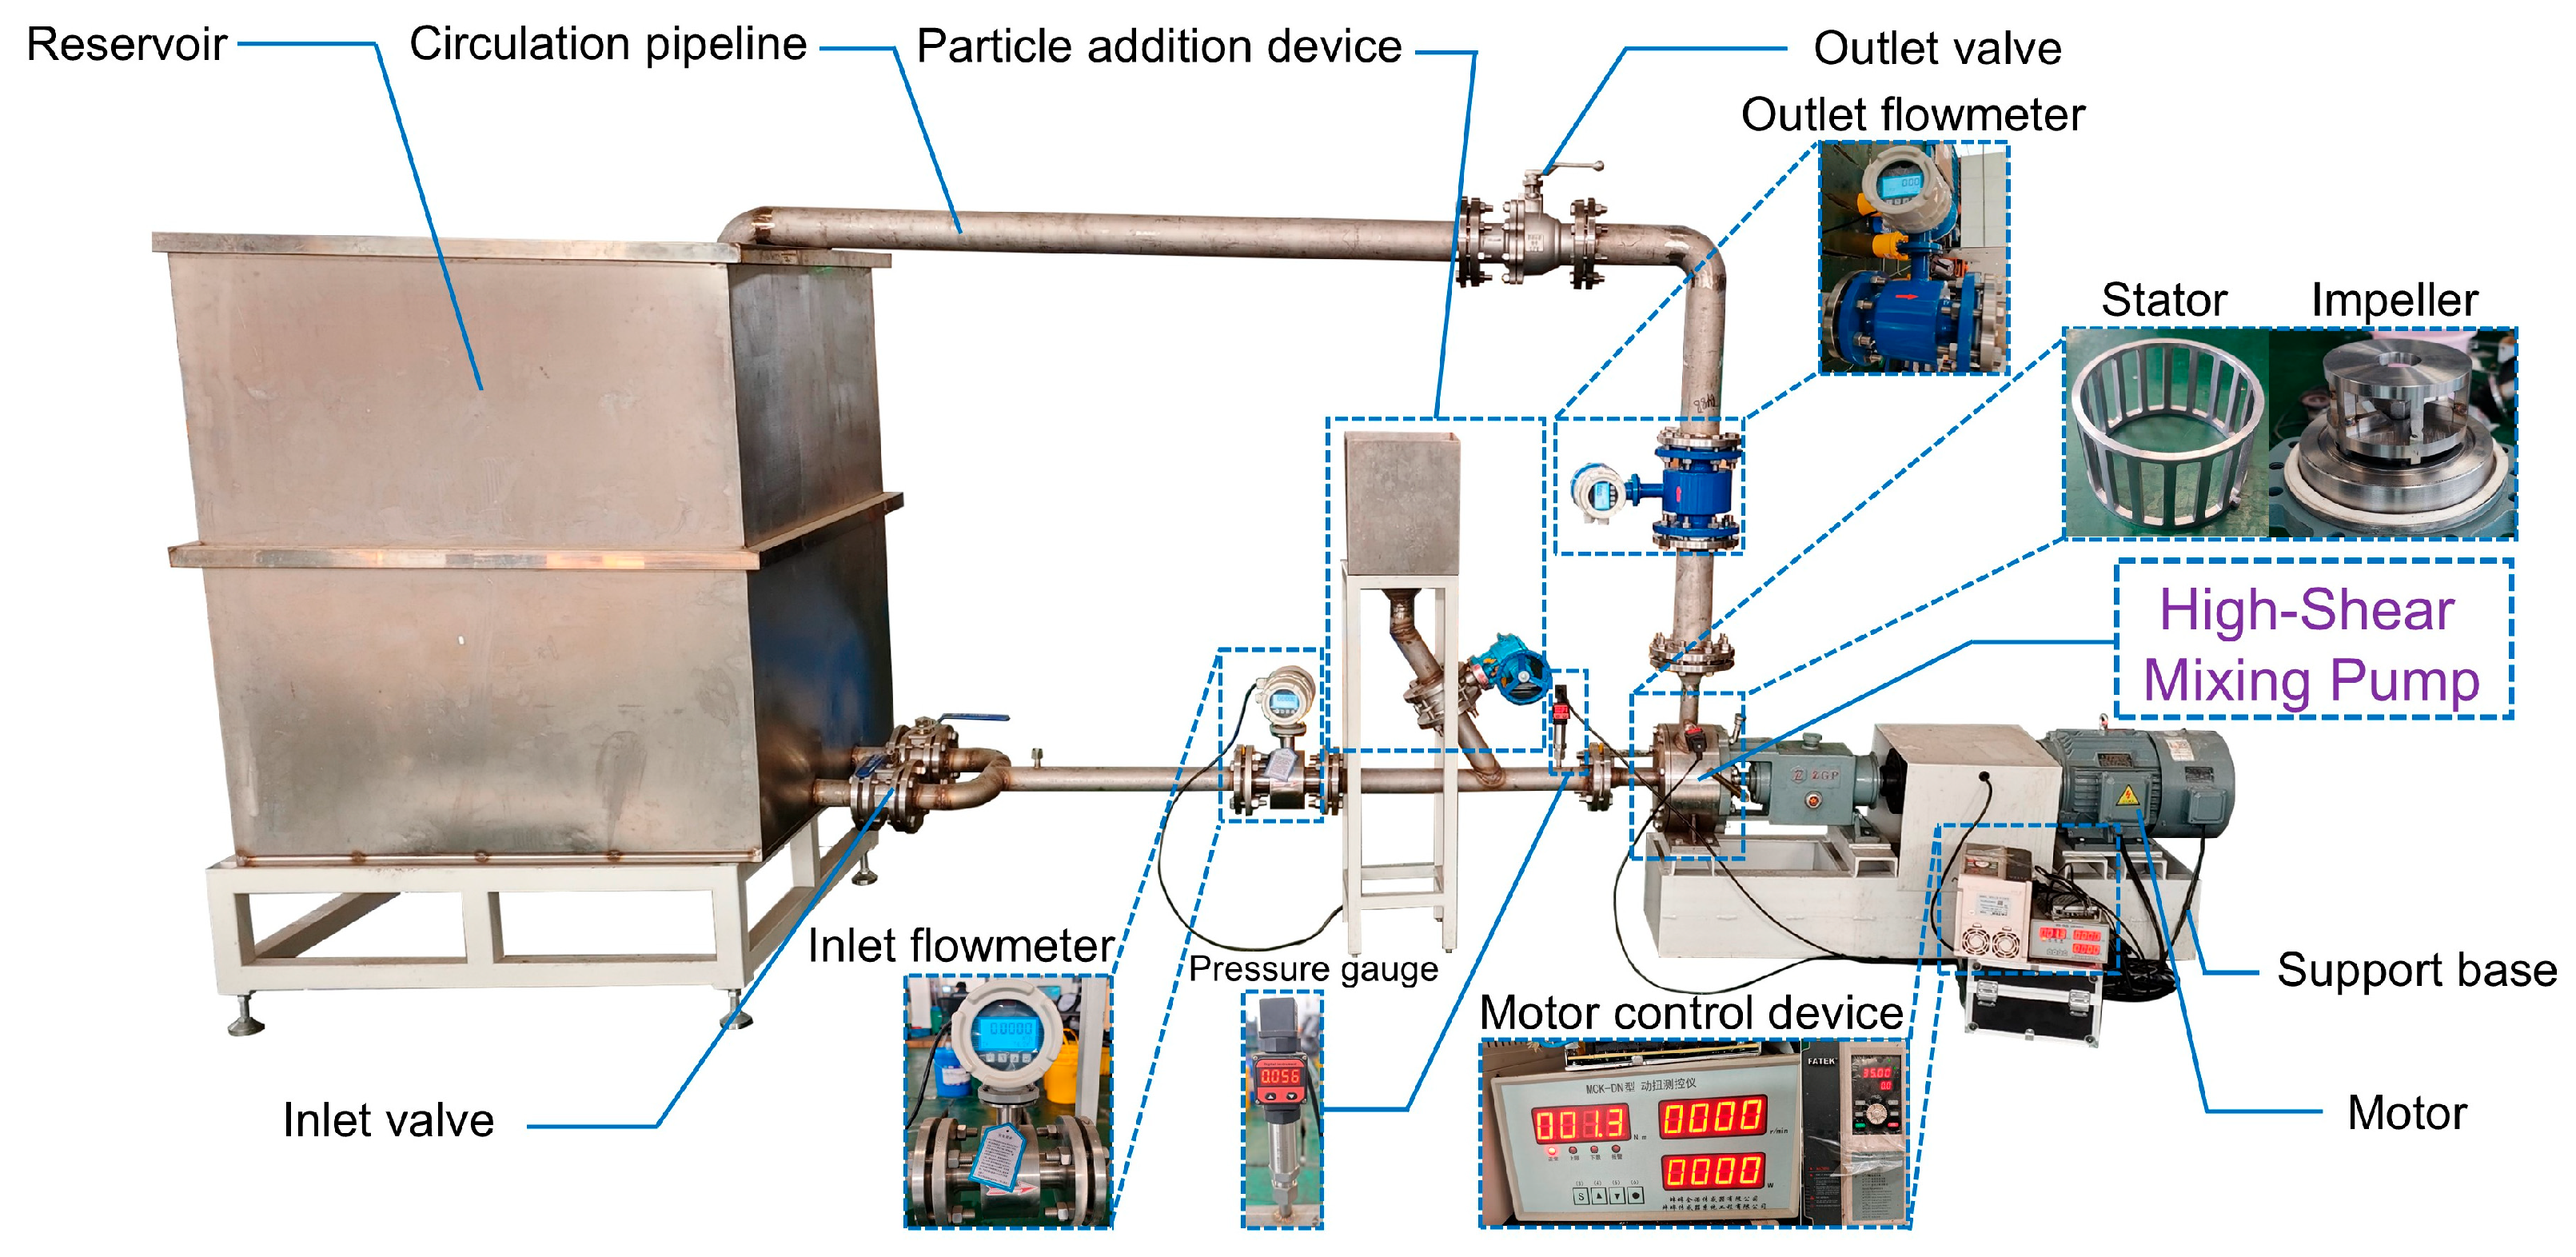
To investigate the actual flow characteristics of solid–liquid two-phase mixing, an experimental platform was established, as shown in Figure 7. The platform is mainly composed of a reservoir, an inlet/outlet flowmeter, an inlet/outlet pressure gauge, a particle addition device, a high-shear mixer (which contains two core components: stator and impeller), a motor and control device, an inlet/outlet valve, and a circulation pipeline. In the experiment, the inlet valve controls the inflow of fluid into the circulation pipeline, while the outlet valve regulates the flow rate. The particles are added by the particle addition device, and the particles are mixed by the high-shear mixer and returned to the reservoir. During this period, the motor control device adjusts the rotational speed and torque of the mixer. Finally, read the data such as pressure gauge and power meter, and calculate the parameters such as head and efficiency. The sheared fluid can also measure other parameters by viscometer, opacimeter, and so on.
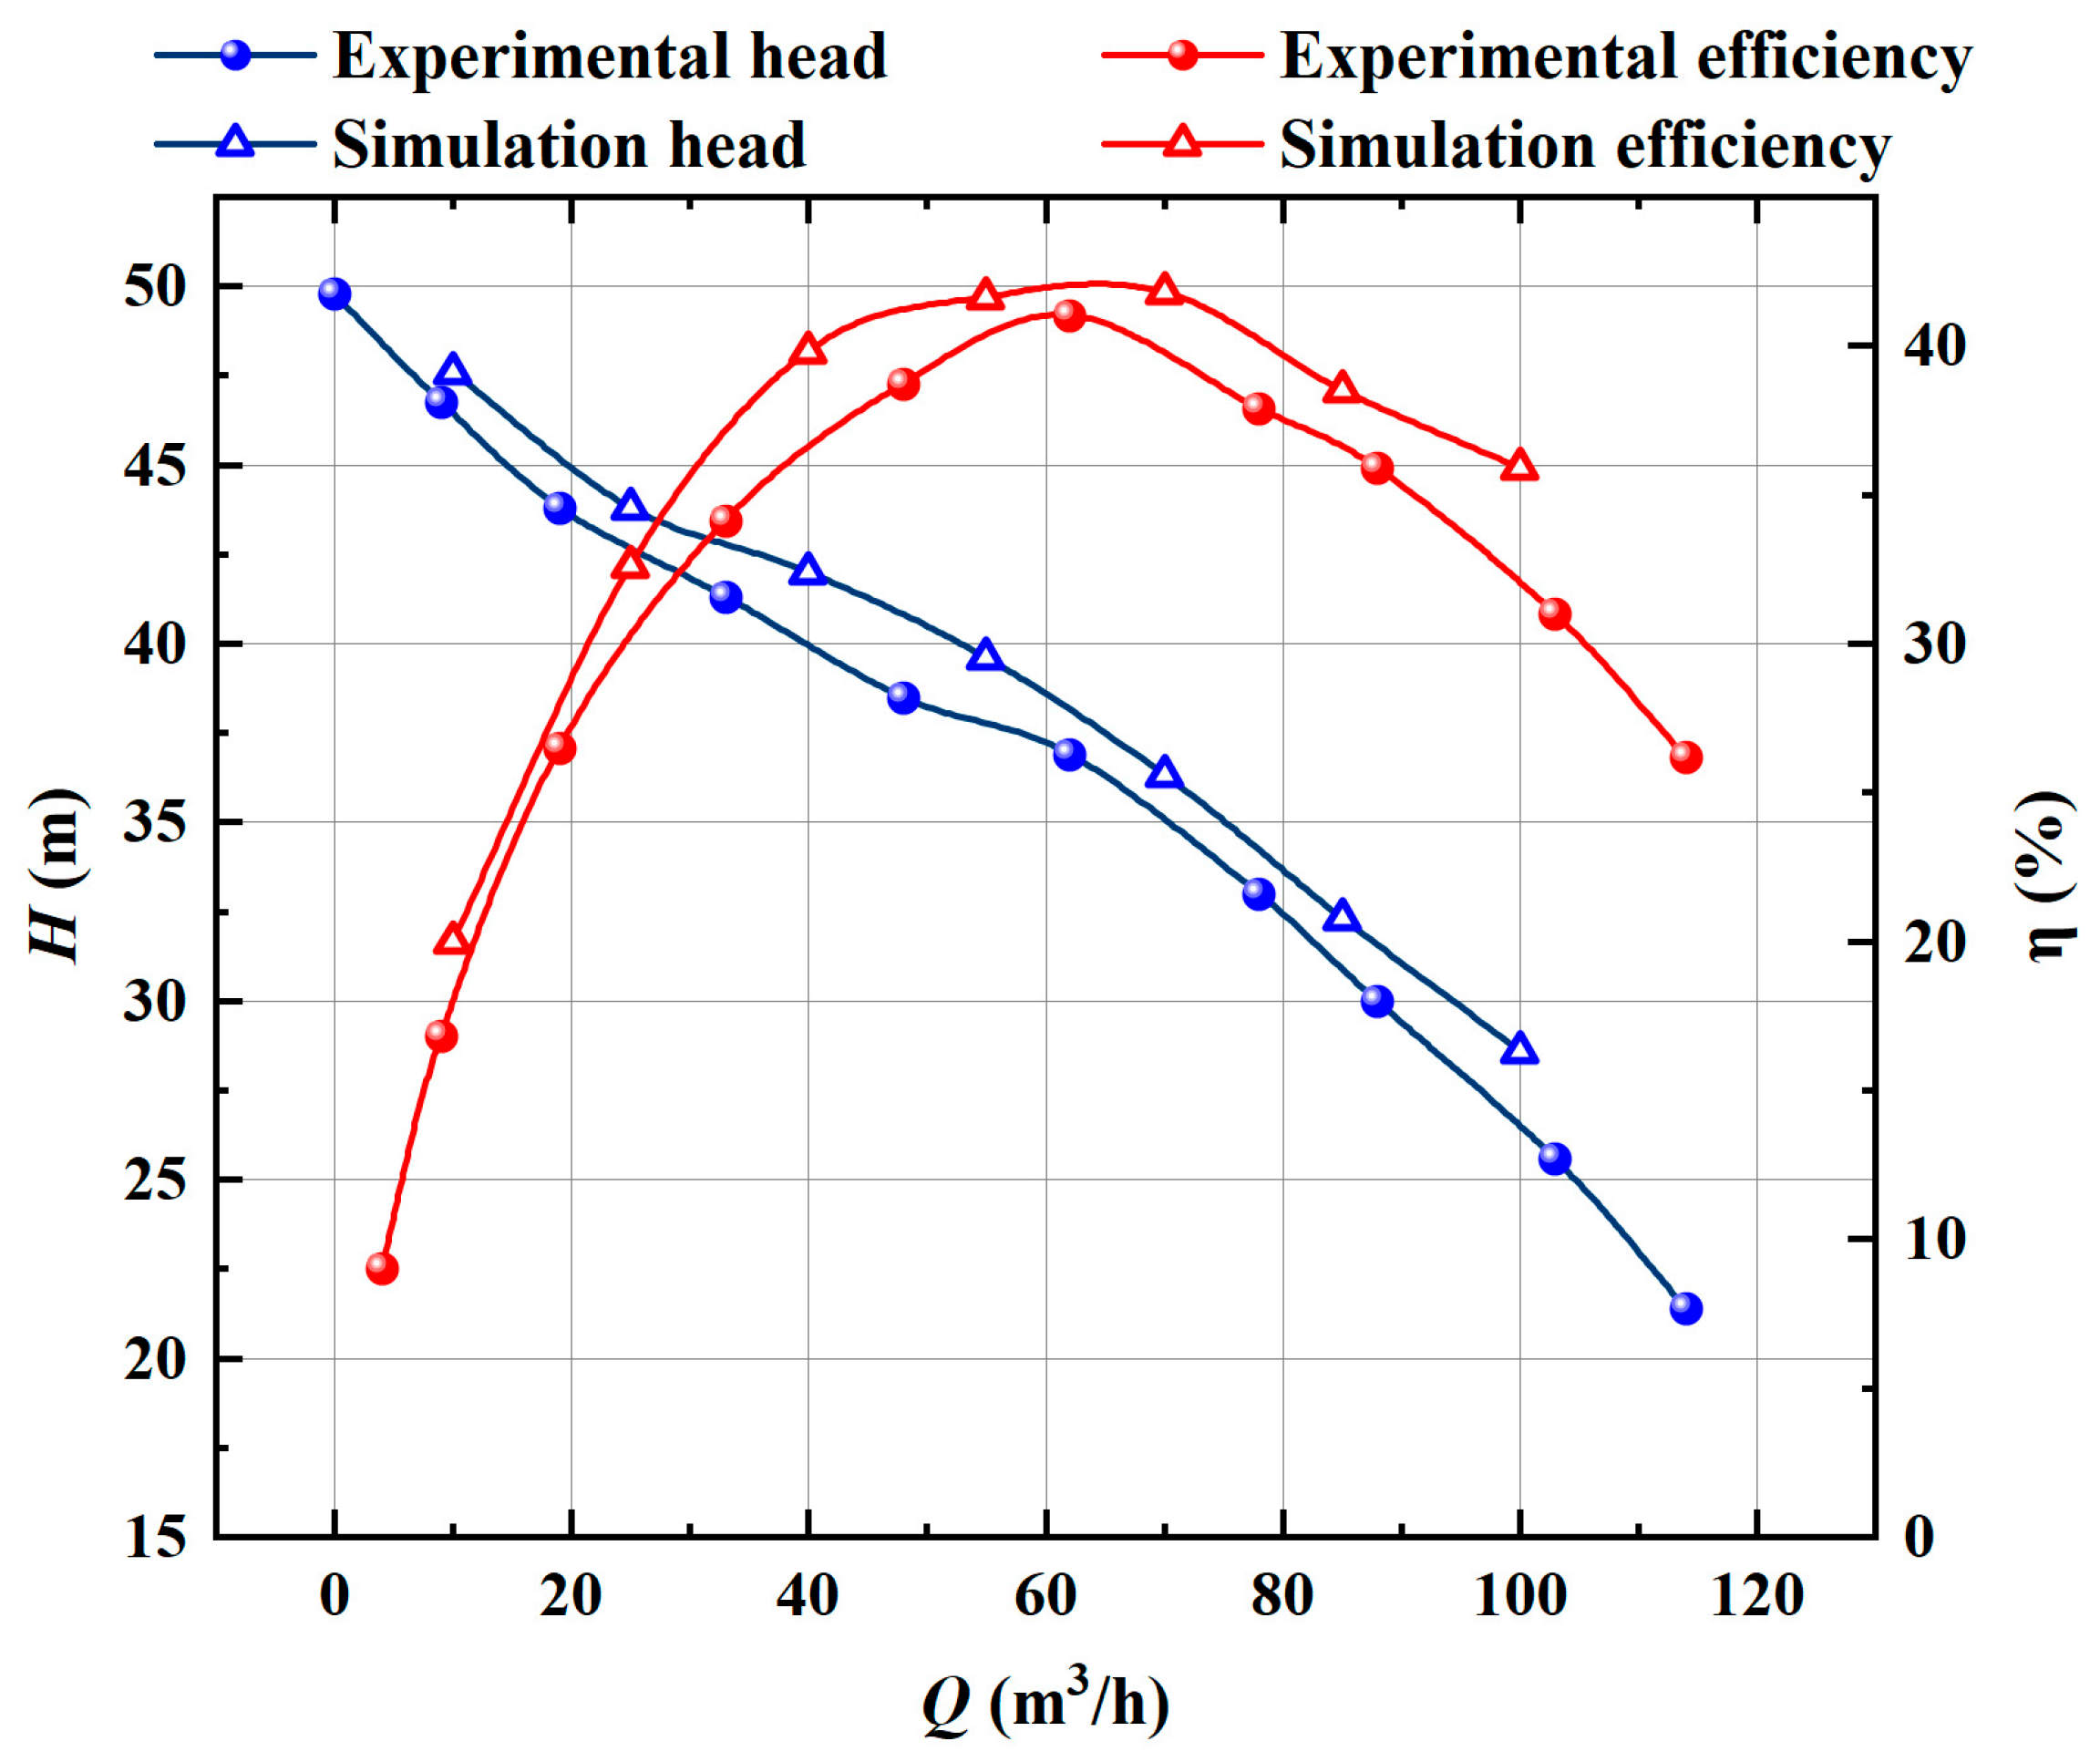
In practical solid–liquid two-phase flow experiments, the variation in circulating temperature is less than 5% in the early experimental stage, which exerts a negligible influence on fluid viscosity. Nevertheless, temperature fluctuations significantly affect the viscosity during the middle and later stages. Accordingly, we controlled the experimental temperature range to conduct the tests [34], as illustrated in Figure 8. Under the adoption of the Eulerian two-phase flow model and the SST k-ω turbulence model, with a mesh count of 1.83 million, the variation in mass flow rate between the inlet and outlet remains below 0.15%, while the maximum deviations in head and efficiency stand at 4.7% and 5.9%, respectively. Considering the temperature-induced experimental interference, the numerical simulation satisfies the convergence requirement.

3. Result and Discussion

3.1. Dispersion Characteristics of Particles and Quantification of Mixing Uniformity

3.1.1. Particle Dispersion Characteristics and Uniformity Under Different Flow Rates

The spatial transport and agglomeration characteristics of solid-phase particles are closely related to mud mixing quality. In this section, a working condition with a 9% solid-phase volume fraction is selected to investigate the particle distribution patterns under four flow rate gradients ranging from 0.54 Q to 1.92 Q. The coefficient of variation (Cv) of the solid-phase volume fraction at cross-section 2 is adopted to quantify the mixing uniformity, as shown in Equation (14), where a smaller Cv indicates more uniform solid–liquid mixing.
C v = σ S V F S V F ¯ × 100 %
where σ S V F is the standard deviation of solid volume fraction within the monitoring section, and S V F ¯ is the mean value of solid volume fraction. The solid particle volume fraction is abbreviated as SVF (Solid Volume Fraction) in the following context.
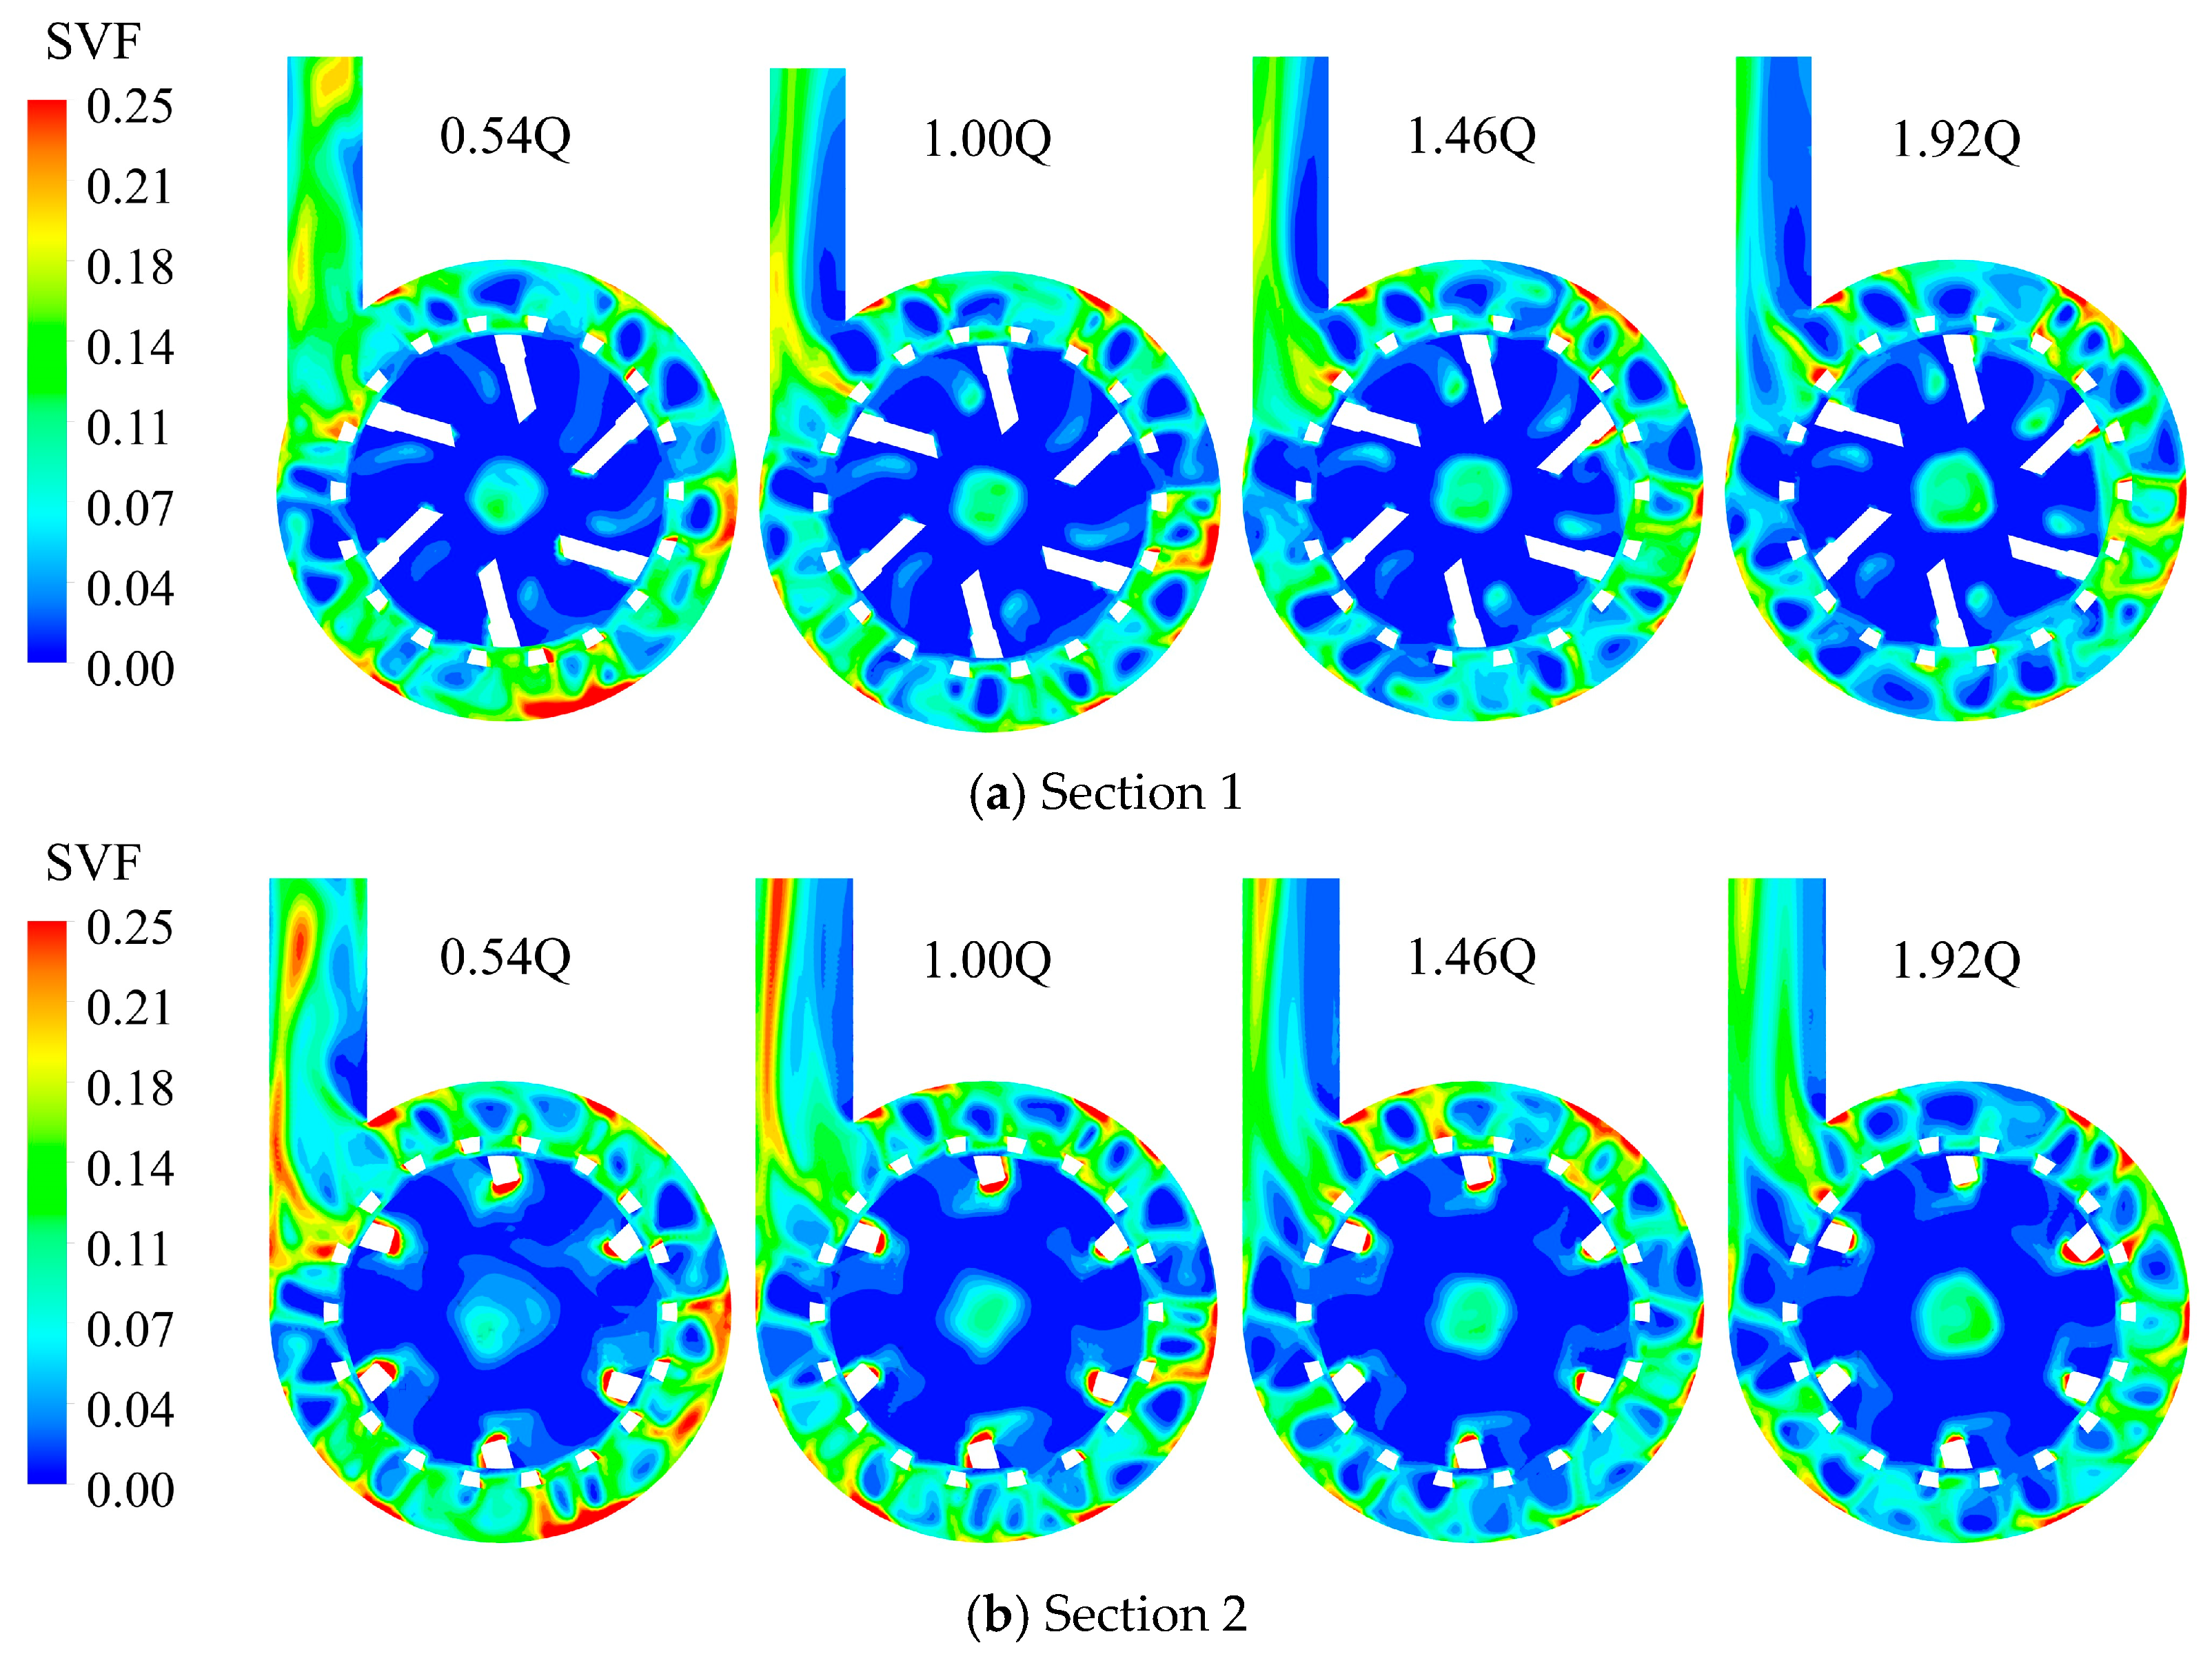
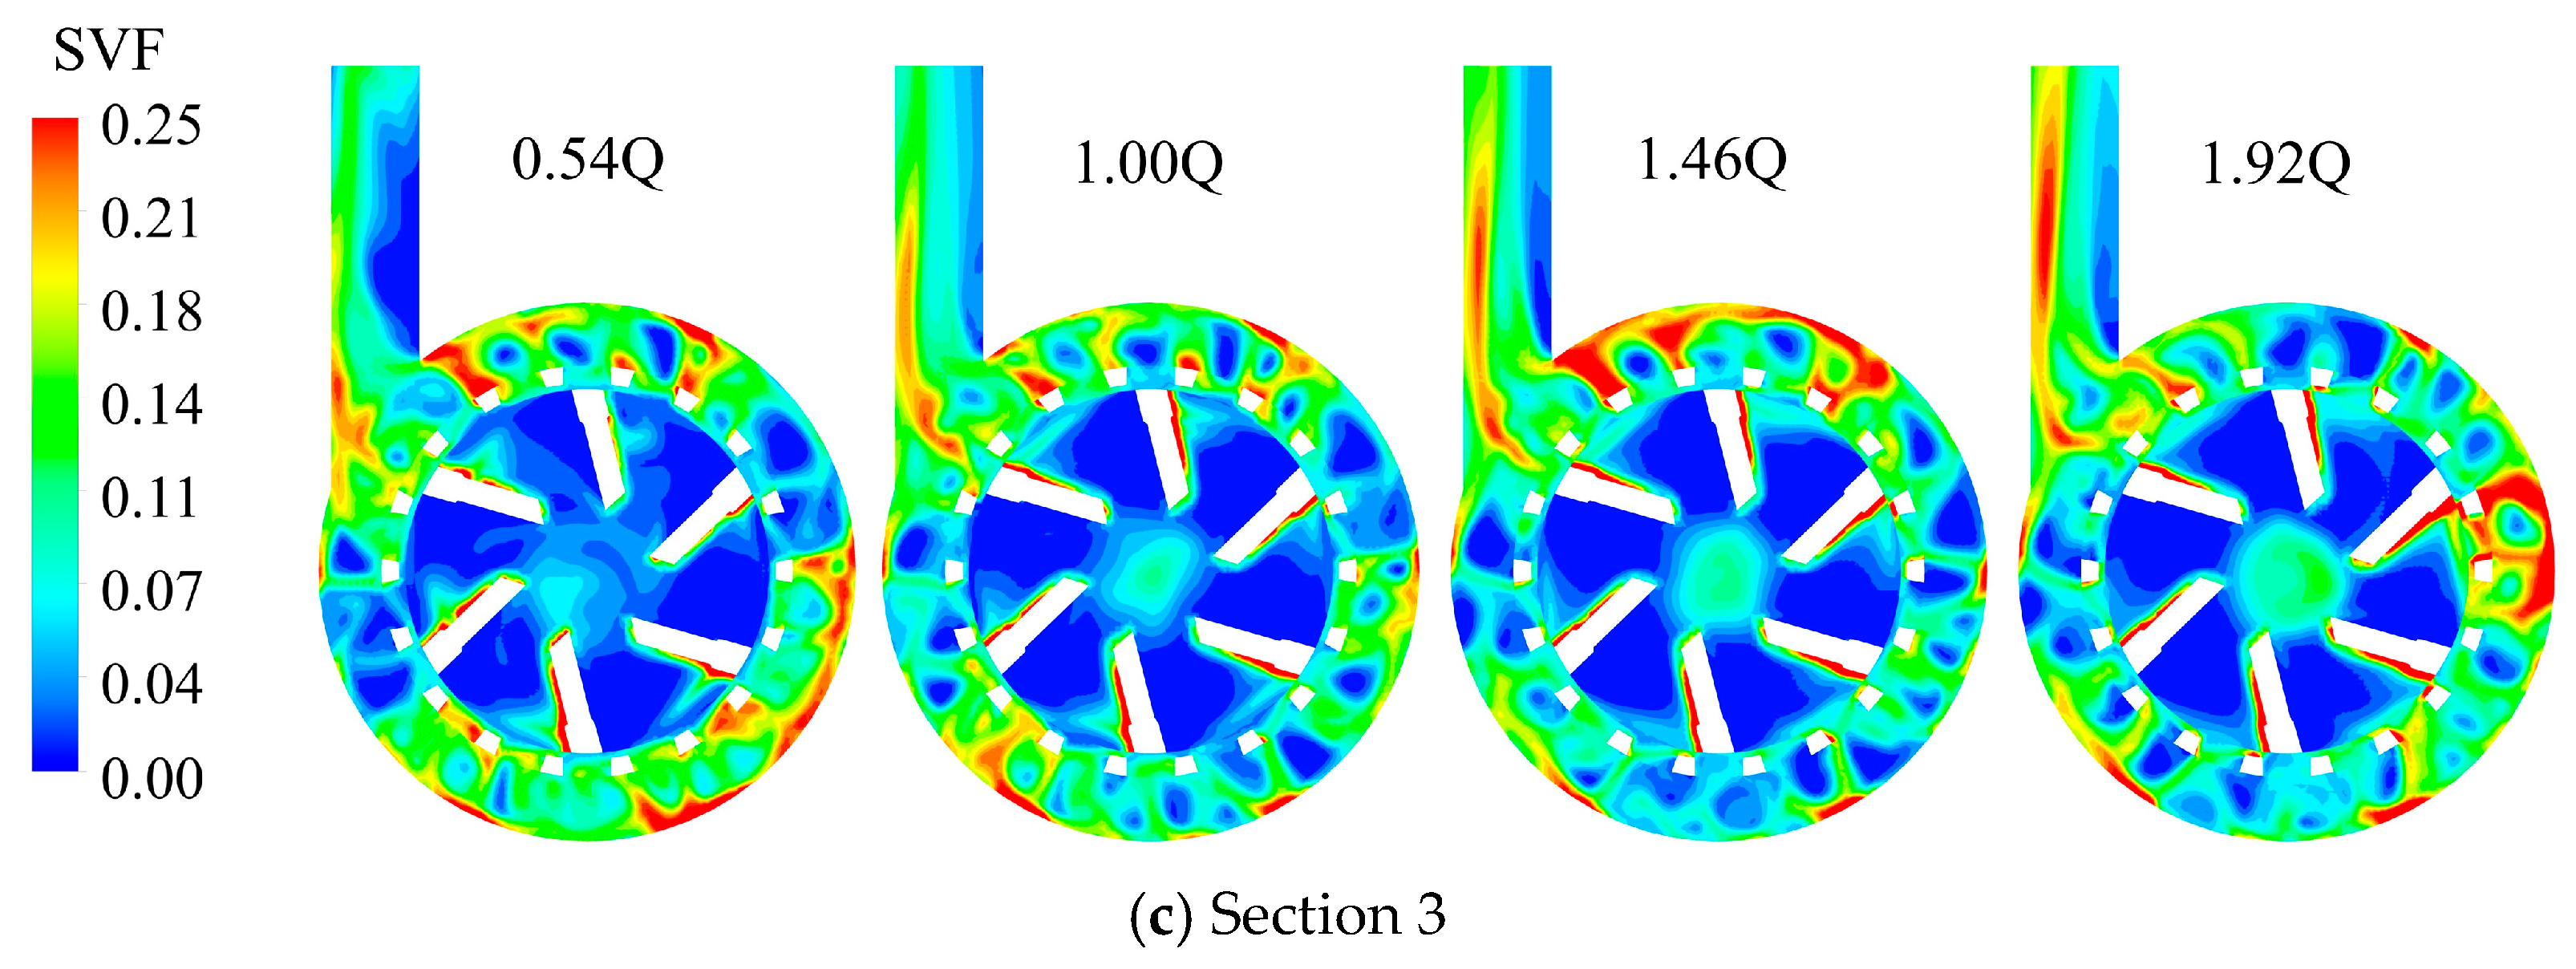
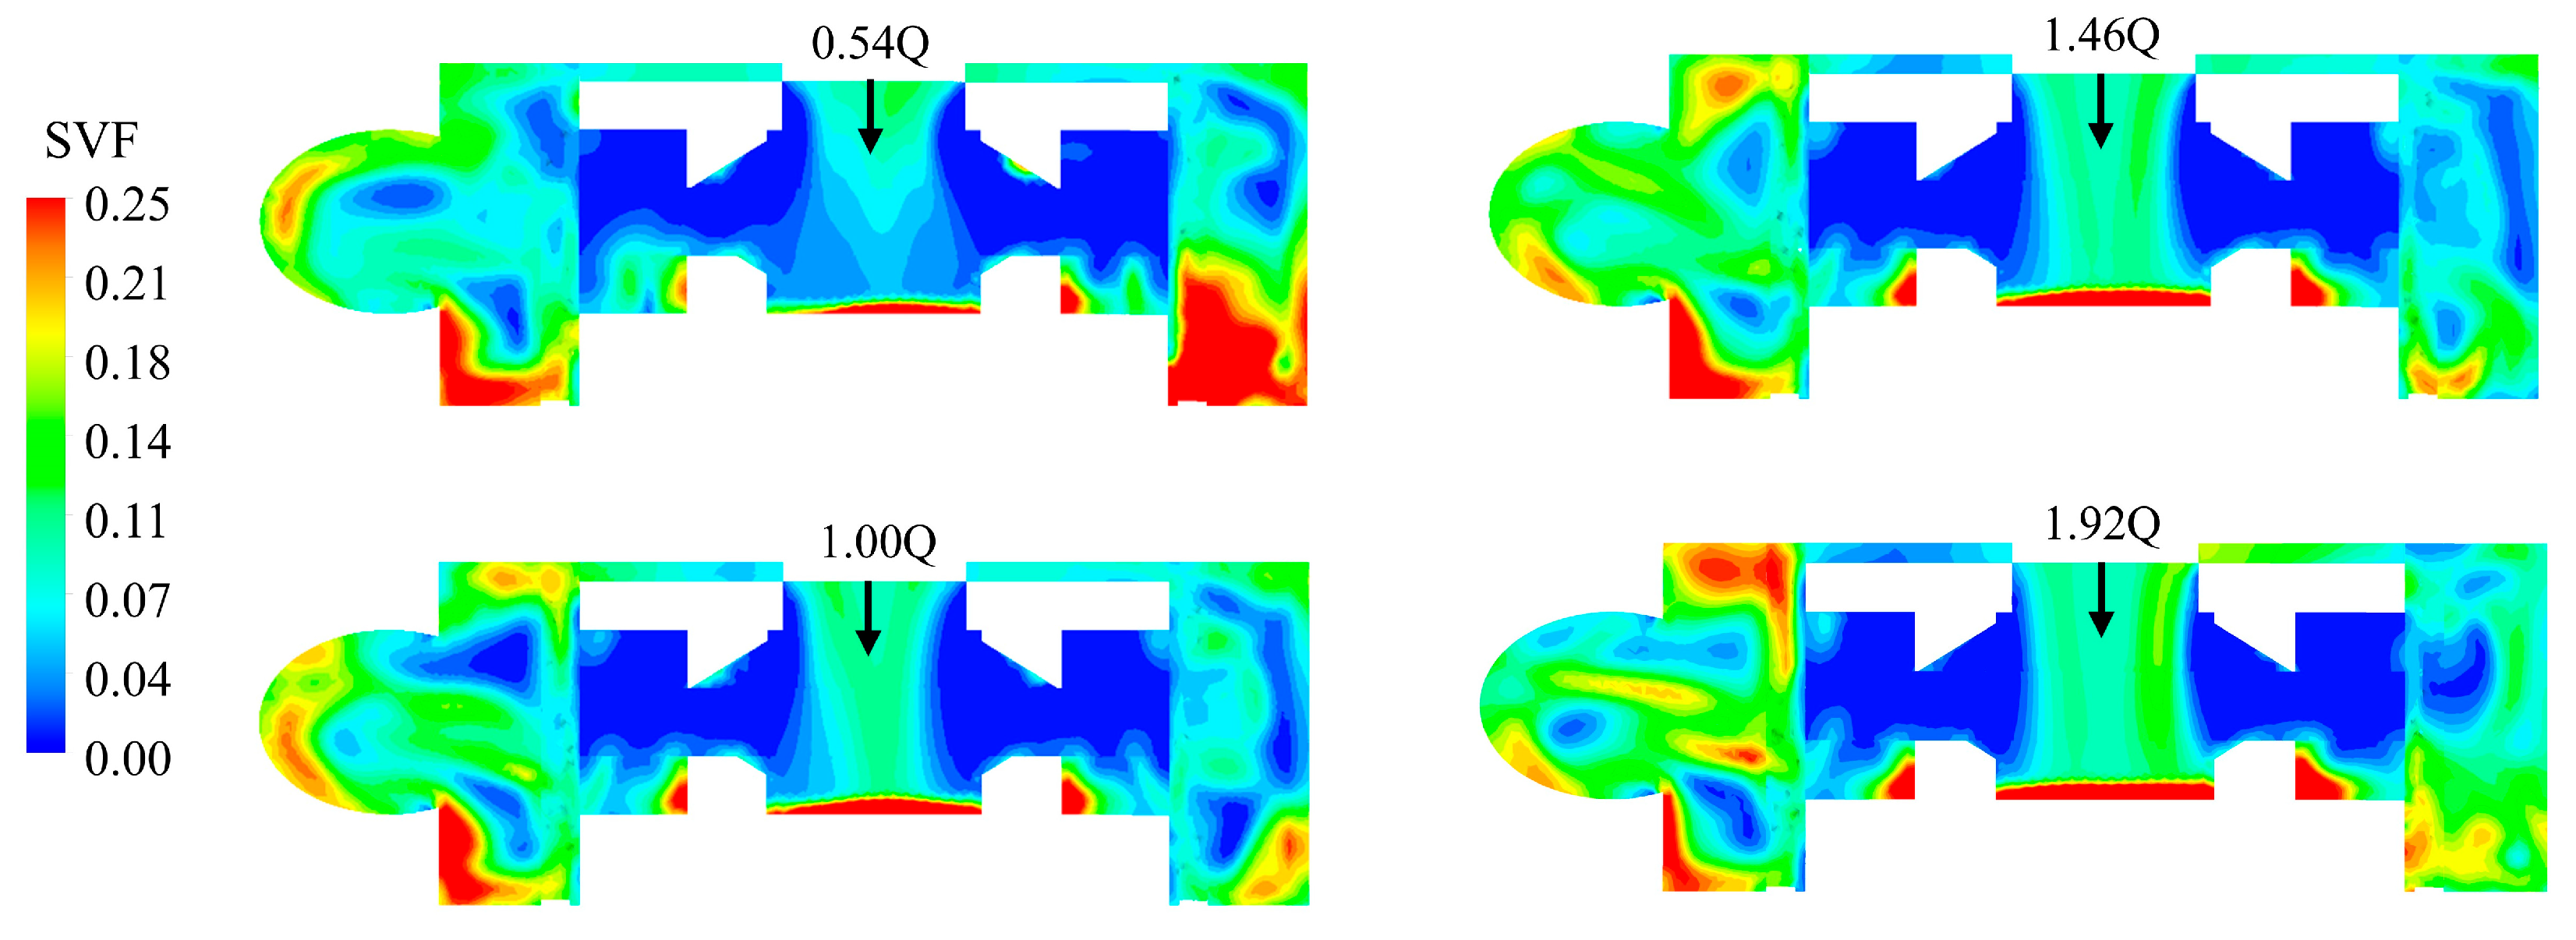
Figure 9 presents the contour of solid volume fraction distribution in the mixer at various cross-sections under different flow rates. Figure 10 shows the contour of particle volume distribution on the 45° cross-section through the rotation axis to the volute outlet. Solid particles exhibit directional accumulation in the mixer, with high-concentration zones concentrated in the volute domain, blade pressure side and back shroud region. A stable O-shaped vortex forms in the volute, and backflow at the volute tongue intensifies local particle accumulation. With increasing flow rates, the solid-carrying capacity of the fluid is significantly enhanced, relieving particle accumulation on the left volute and main inflow region and improving particle discharge efficiency. However, particle segregation at the volute outlet is aggravated by the coupling effect of tongue secondary flow, wall friction and boundary layer viscous force. In addition, Figure 10 indicates that particle distribution along the inflow direction in the volute becomes more uniform with rising flow rate.
Table 2 presents the coefficient of variation (Cv) of solid-phase mixing uniformity in the full flow domain under different flow rates and particle concentrations. The data reveal a significant positive correlation between flow rate and mixing uniformity: as the flow rate rises from 0.54 Q to 1.92 Q, the Cv drops from 19.1% to 12.8%, and the uniformity is improved by 33.5%. The quantitative results are highly consistent with the Contour distribution, verifying that increasing the inlet flow rate is an effective method to reduce particle accumulation and enhance mud mixing uniformity. Nevertheless, the weakening effect on shear action needs further discussion.

3.1.2. Effect of Particle Concentration on Particle Distribution and Uniformity

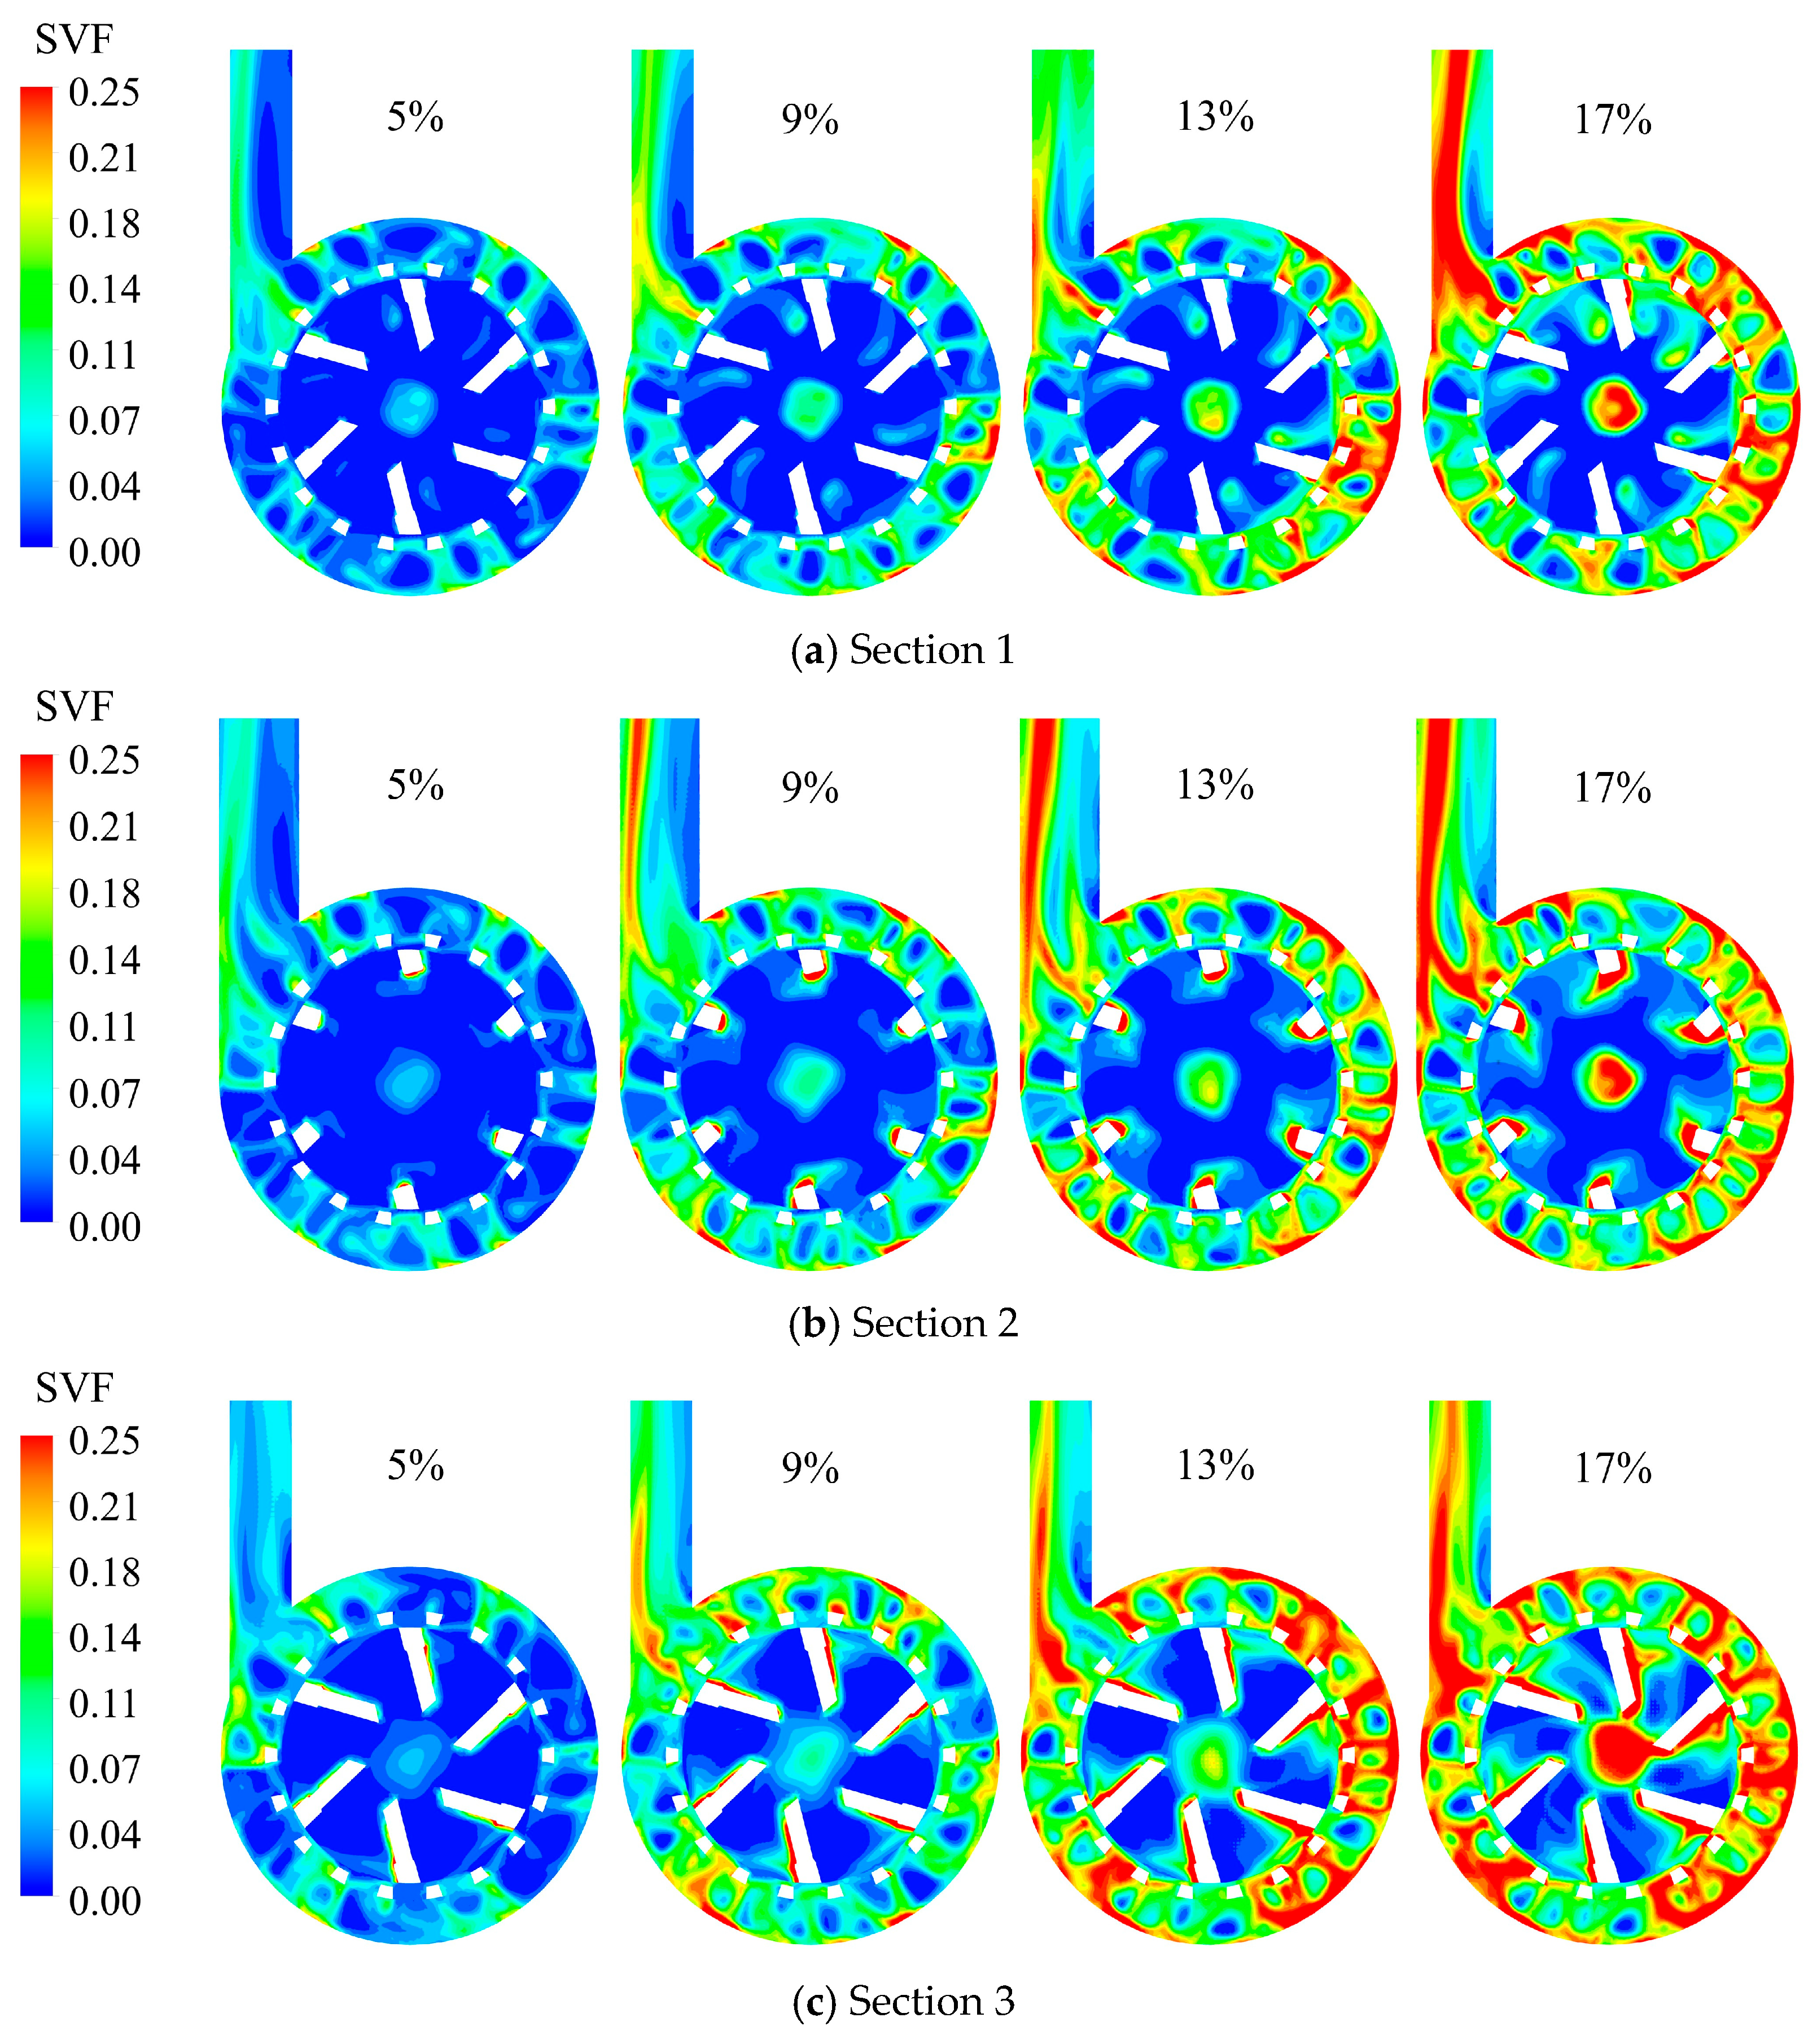
At the design flow rate Q, four solid volume fractions of 5%, 9%, 13% and 17% were set to analyze the effects of particle concentration on the dispersion characteristics of solid–liquid two-phase flow. The corresponding results are presented in Figure 11. With the increase in solid concentration, particle accumulation in the stator domain and volute domain is aggravated continuously, and the non-uniformity of particle distribution at the volute outlet increases significantly. Under the high concentration condition of 17%, massive particles accumulate on the left side of the outlet section, and severe particle deposition occurs at the impeller center and blade pressure surface, showing an obvious separation tendency of solid and liquid phases.
Combined with the data in Table 2, a significant negative correlation exists between particle concentration and mixing uniformity. As the concentration increases from 5% to 17%, the Cv rises from 11.6% to 23.2%, and the mixing uniformity decreases by 52.1%. The underlying mechanism is summarized as follows. At high concentrations, the collision frequency among particles increases greatly, and the residence time of fluid inside the mixer is prolonged, which remarkably weakens the shear dispersion effect of the stator. Meanwhile, the directional flow guiding effect of the tongue aggravates particle segregation and further deteriorates the mixing performance. Therefore, the solid particle concentration should be controlled in practical drilling operations to avoid mixing failure induced by high concentration conditions.

3.2. Effect of Operating Parameters on Coupling Characteristics of Shear–Vortex Energy

3.2.1. Coupling Influence of Flow Rate on Shear Rate, Lamb Vortex Energy and Enstrophy

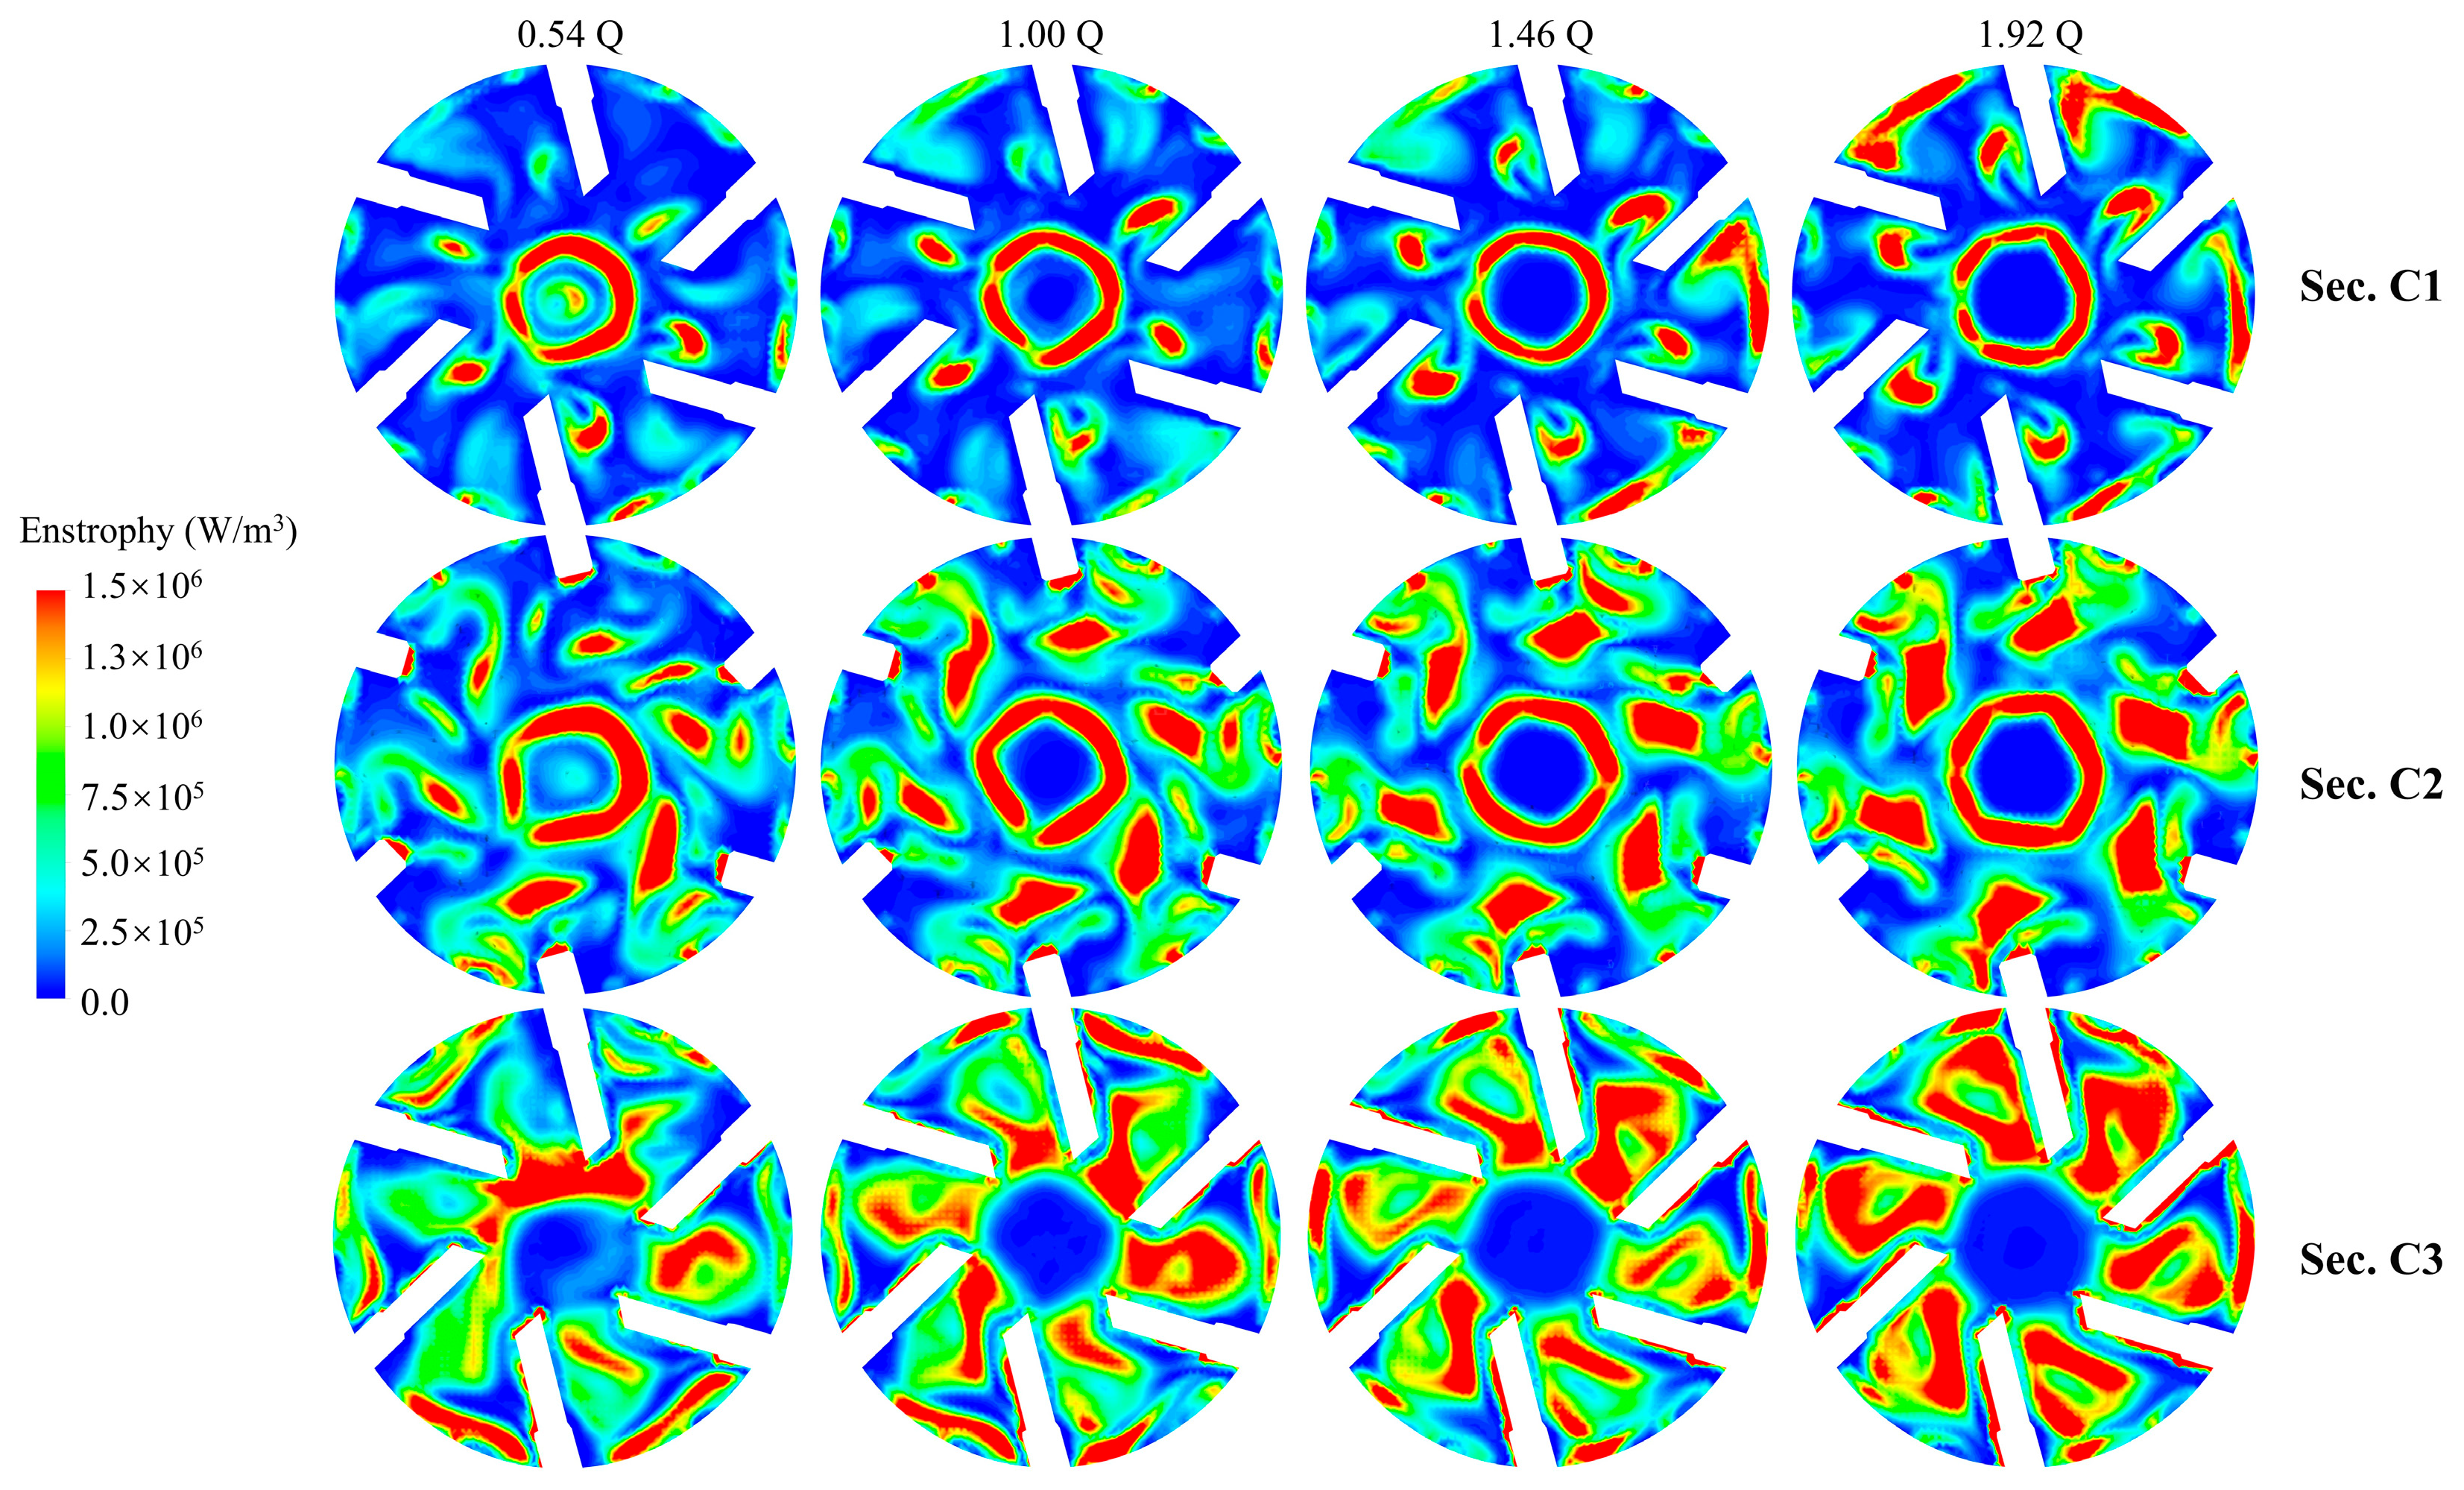
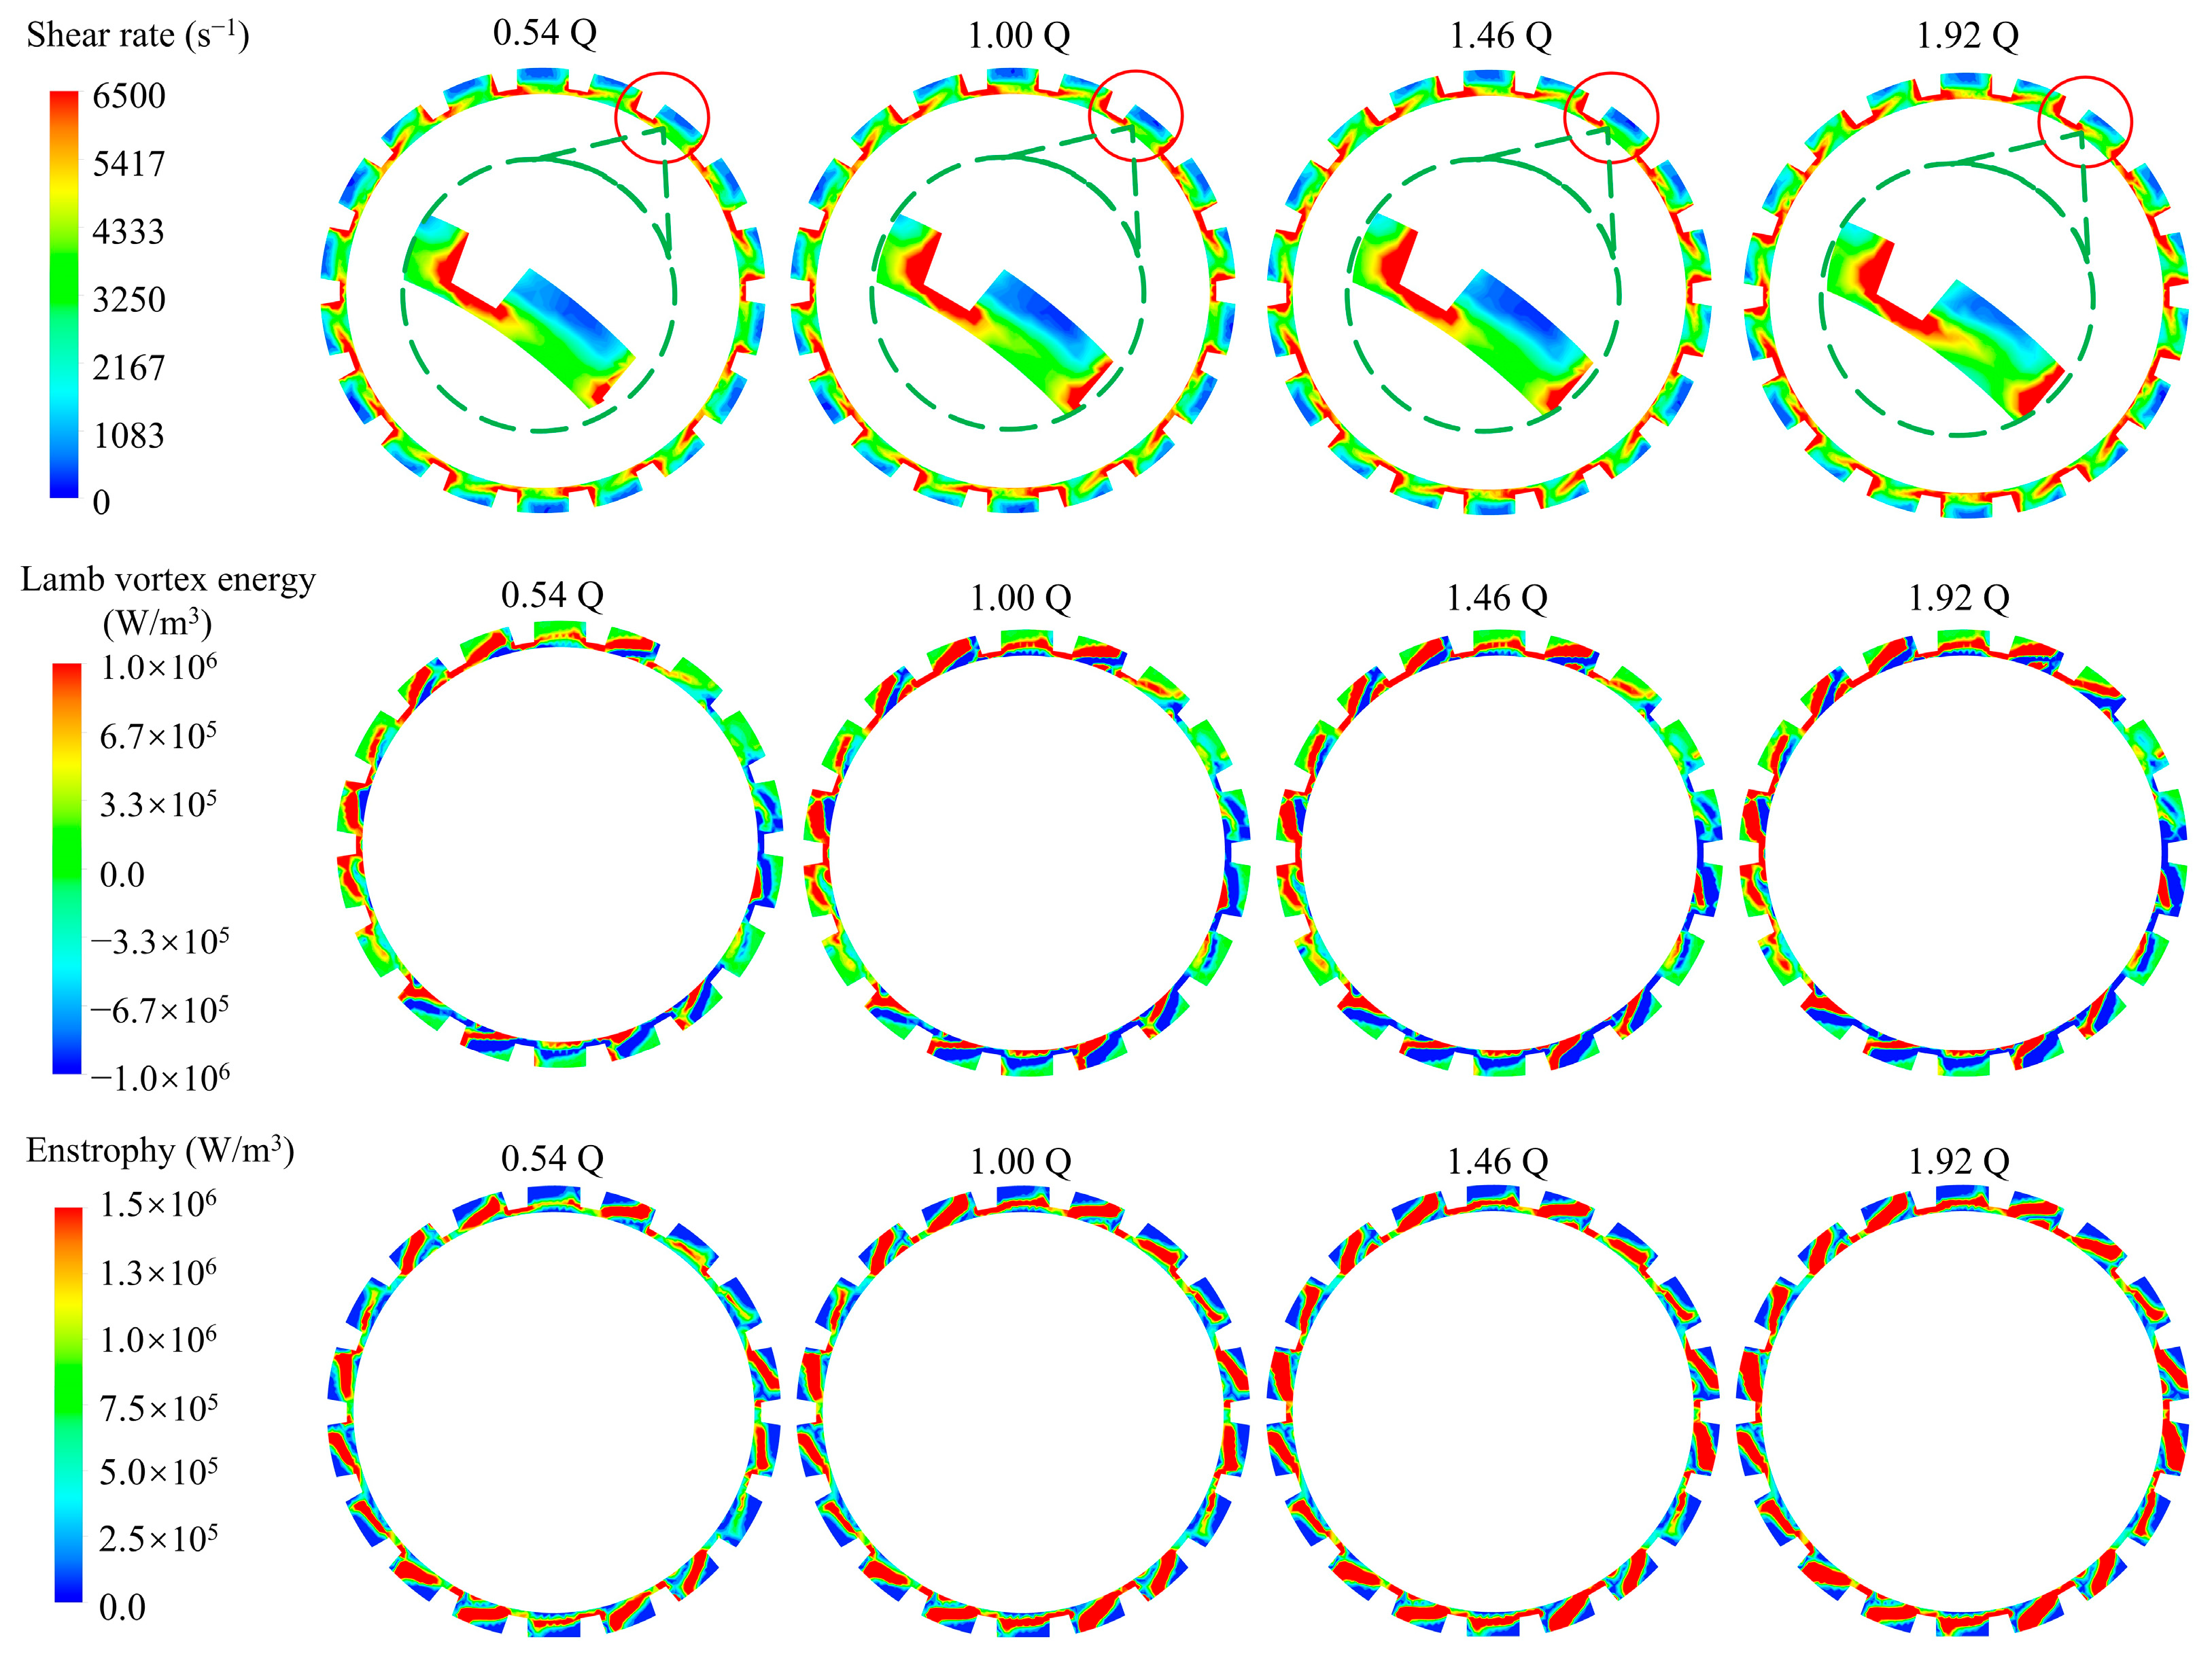
Four flow gradients ranging from 0.54 Q to 1.92 Q were adopted to investigate the synergistic regulation characteristics of flow rate on three core energy parameters, namely shear rate, Lamb vortex energy and Enstrophy, as illustrated in Figure 12. The high-value zones of shear rate, Lamb vortex energy and Enstrophy overlap significantly, mainly concentrating in the stator–rotor gap. The peak shear rate in this region reaches 17,092 s−1, with the peak Lamb vortex energy and Enstrophy up to 7.5 × 10⁸ W/m3 and 7.2 × 10⁸ W/m3, respectively. The high velocity gradient formed between the fluid accelerated by the impeller and the stationary stator induces intense shear, vorticity generation and viscous dissipation simultaneously, making this area the core position of internal energy conversion. As observed from the Contour, these high-value regions spread circumferentially in a strip wake toward the outer edge of adjacent stators. Increasing the flow rate expands the coverage of high magnitudes from the stator inner side to the impeller outer diameter. This distribution coincides perfectly with the dominant region for solid particle shear dispersion, which serves as the critical flow field zone determining the mud mixing performance.
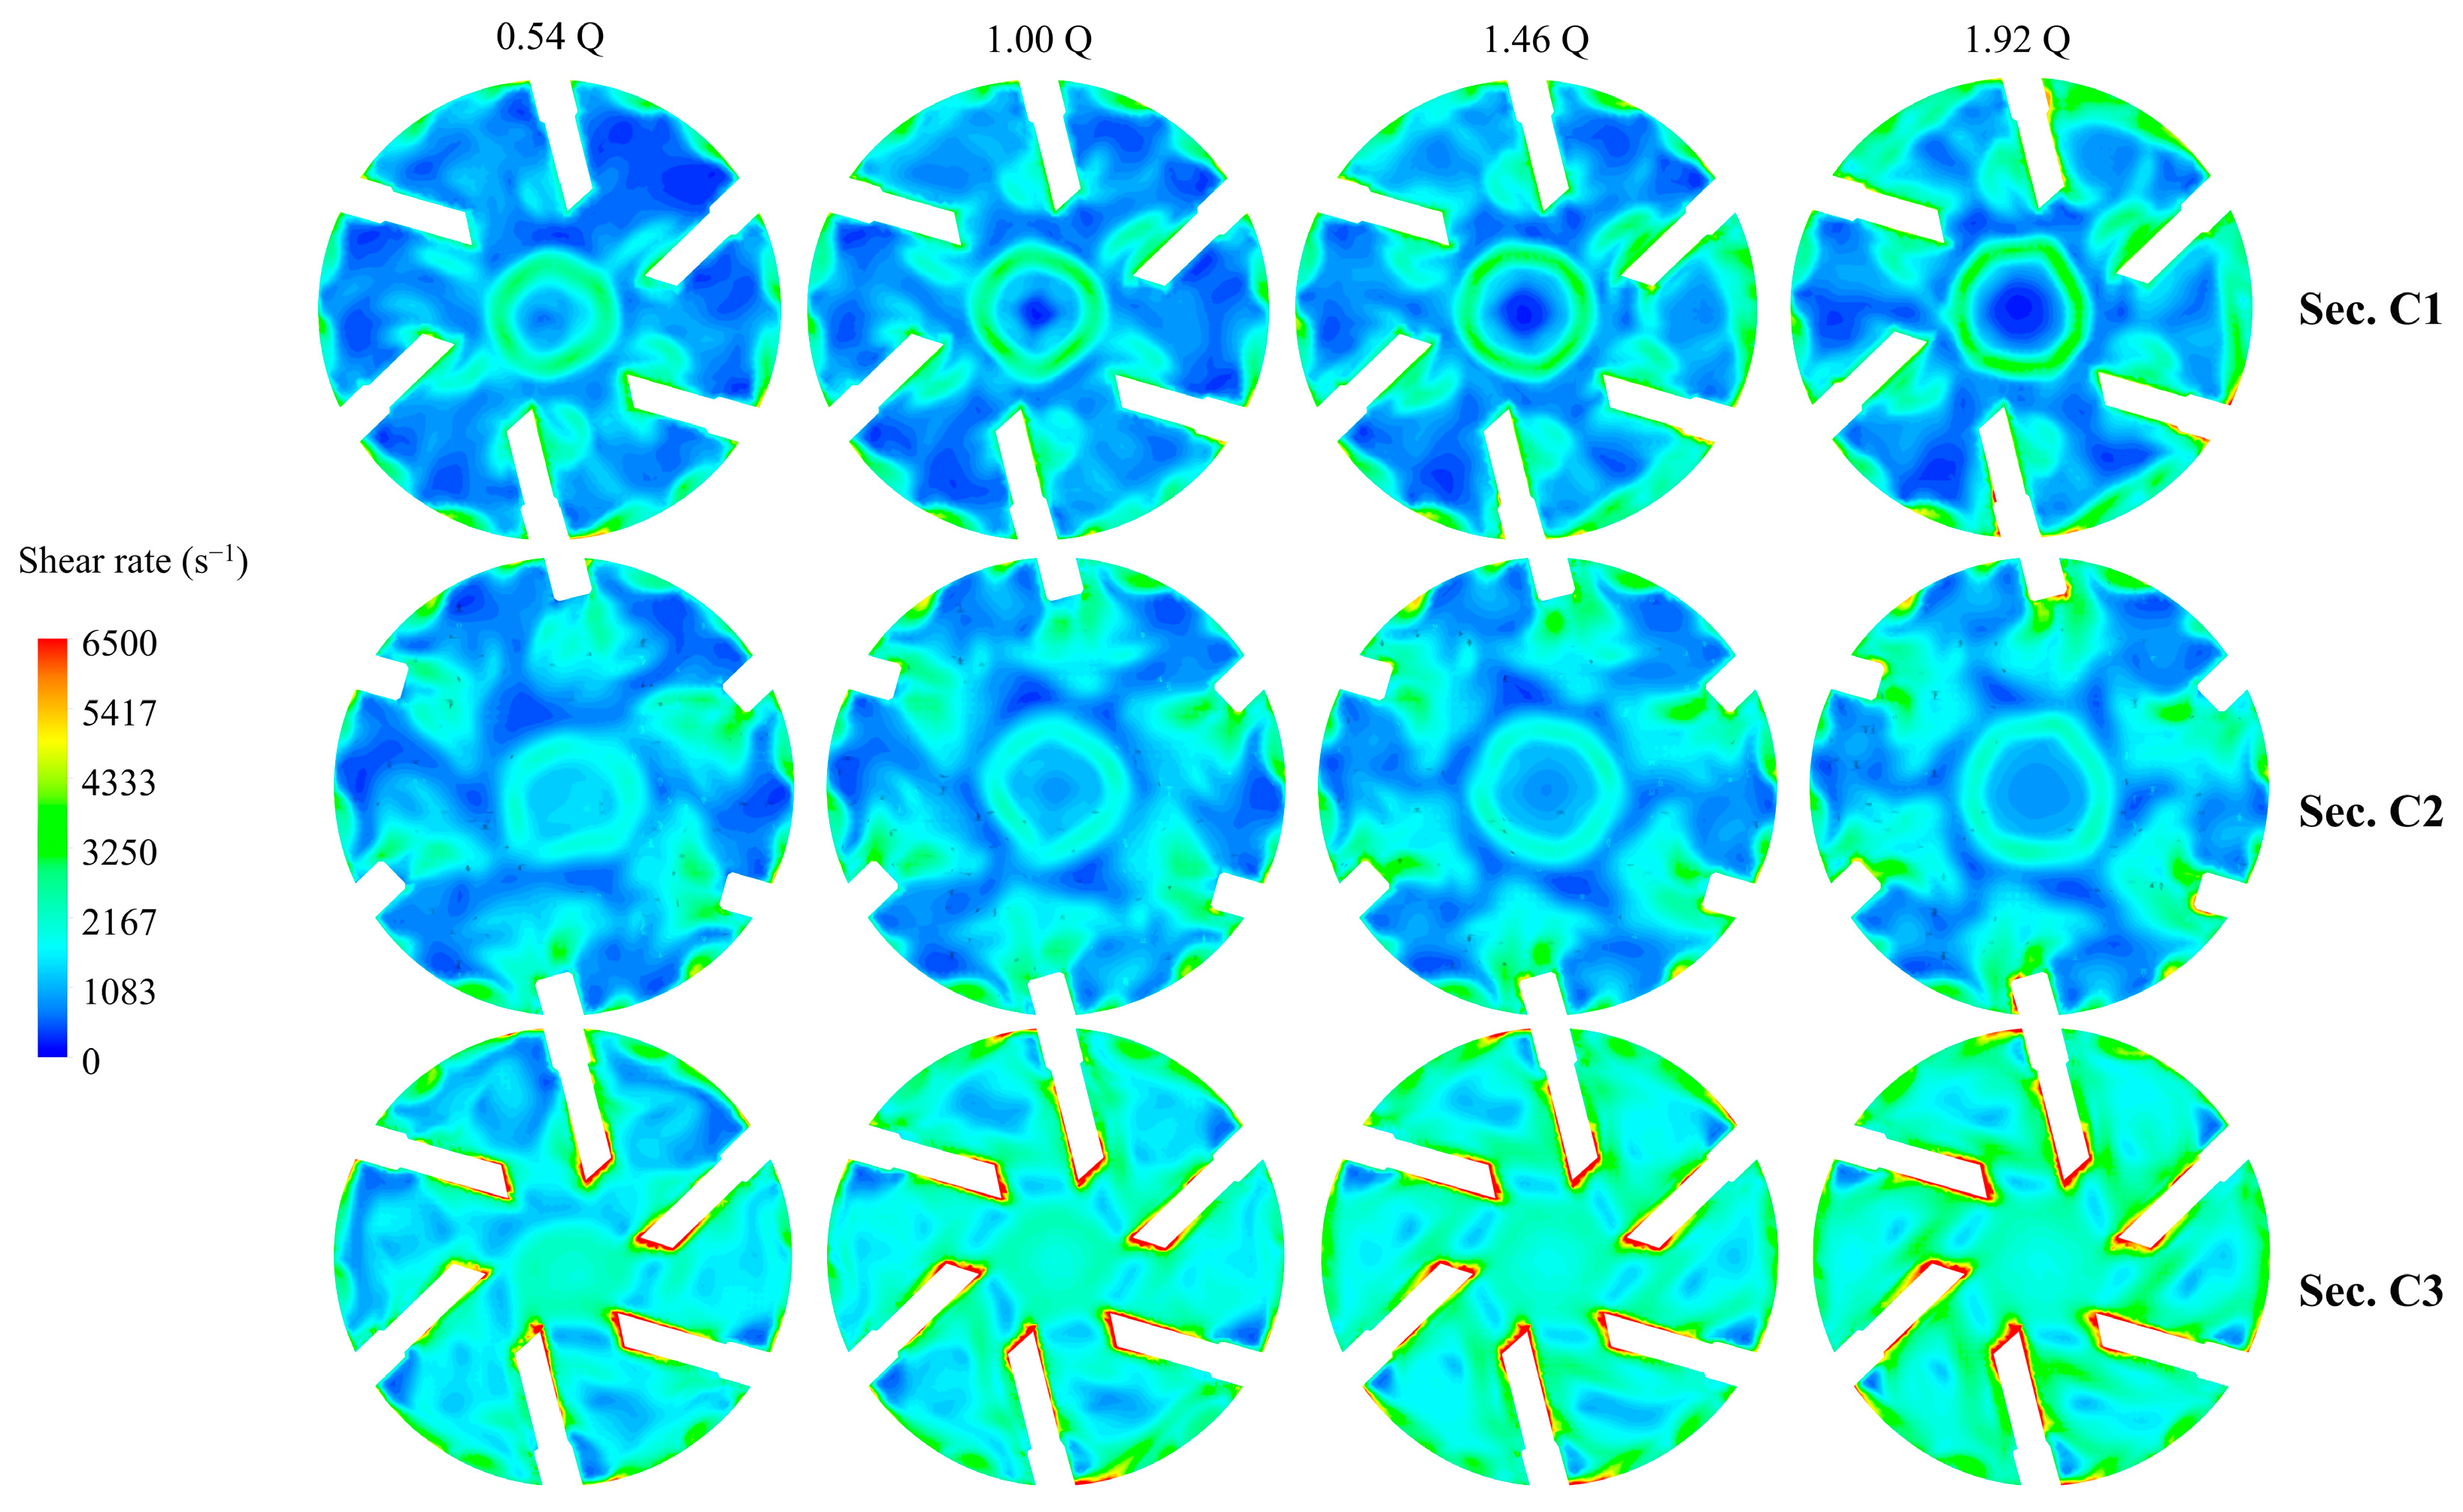
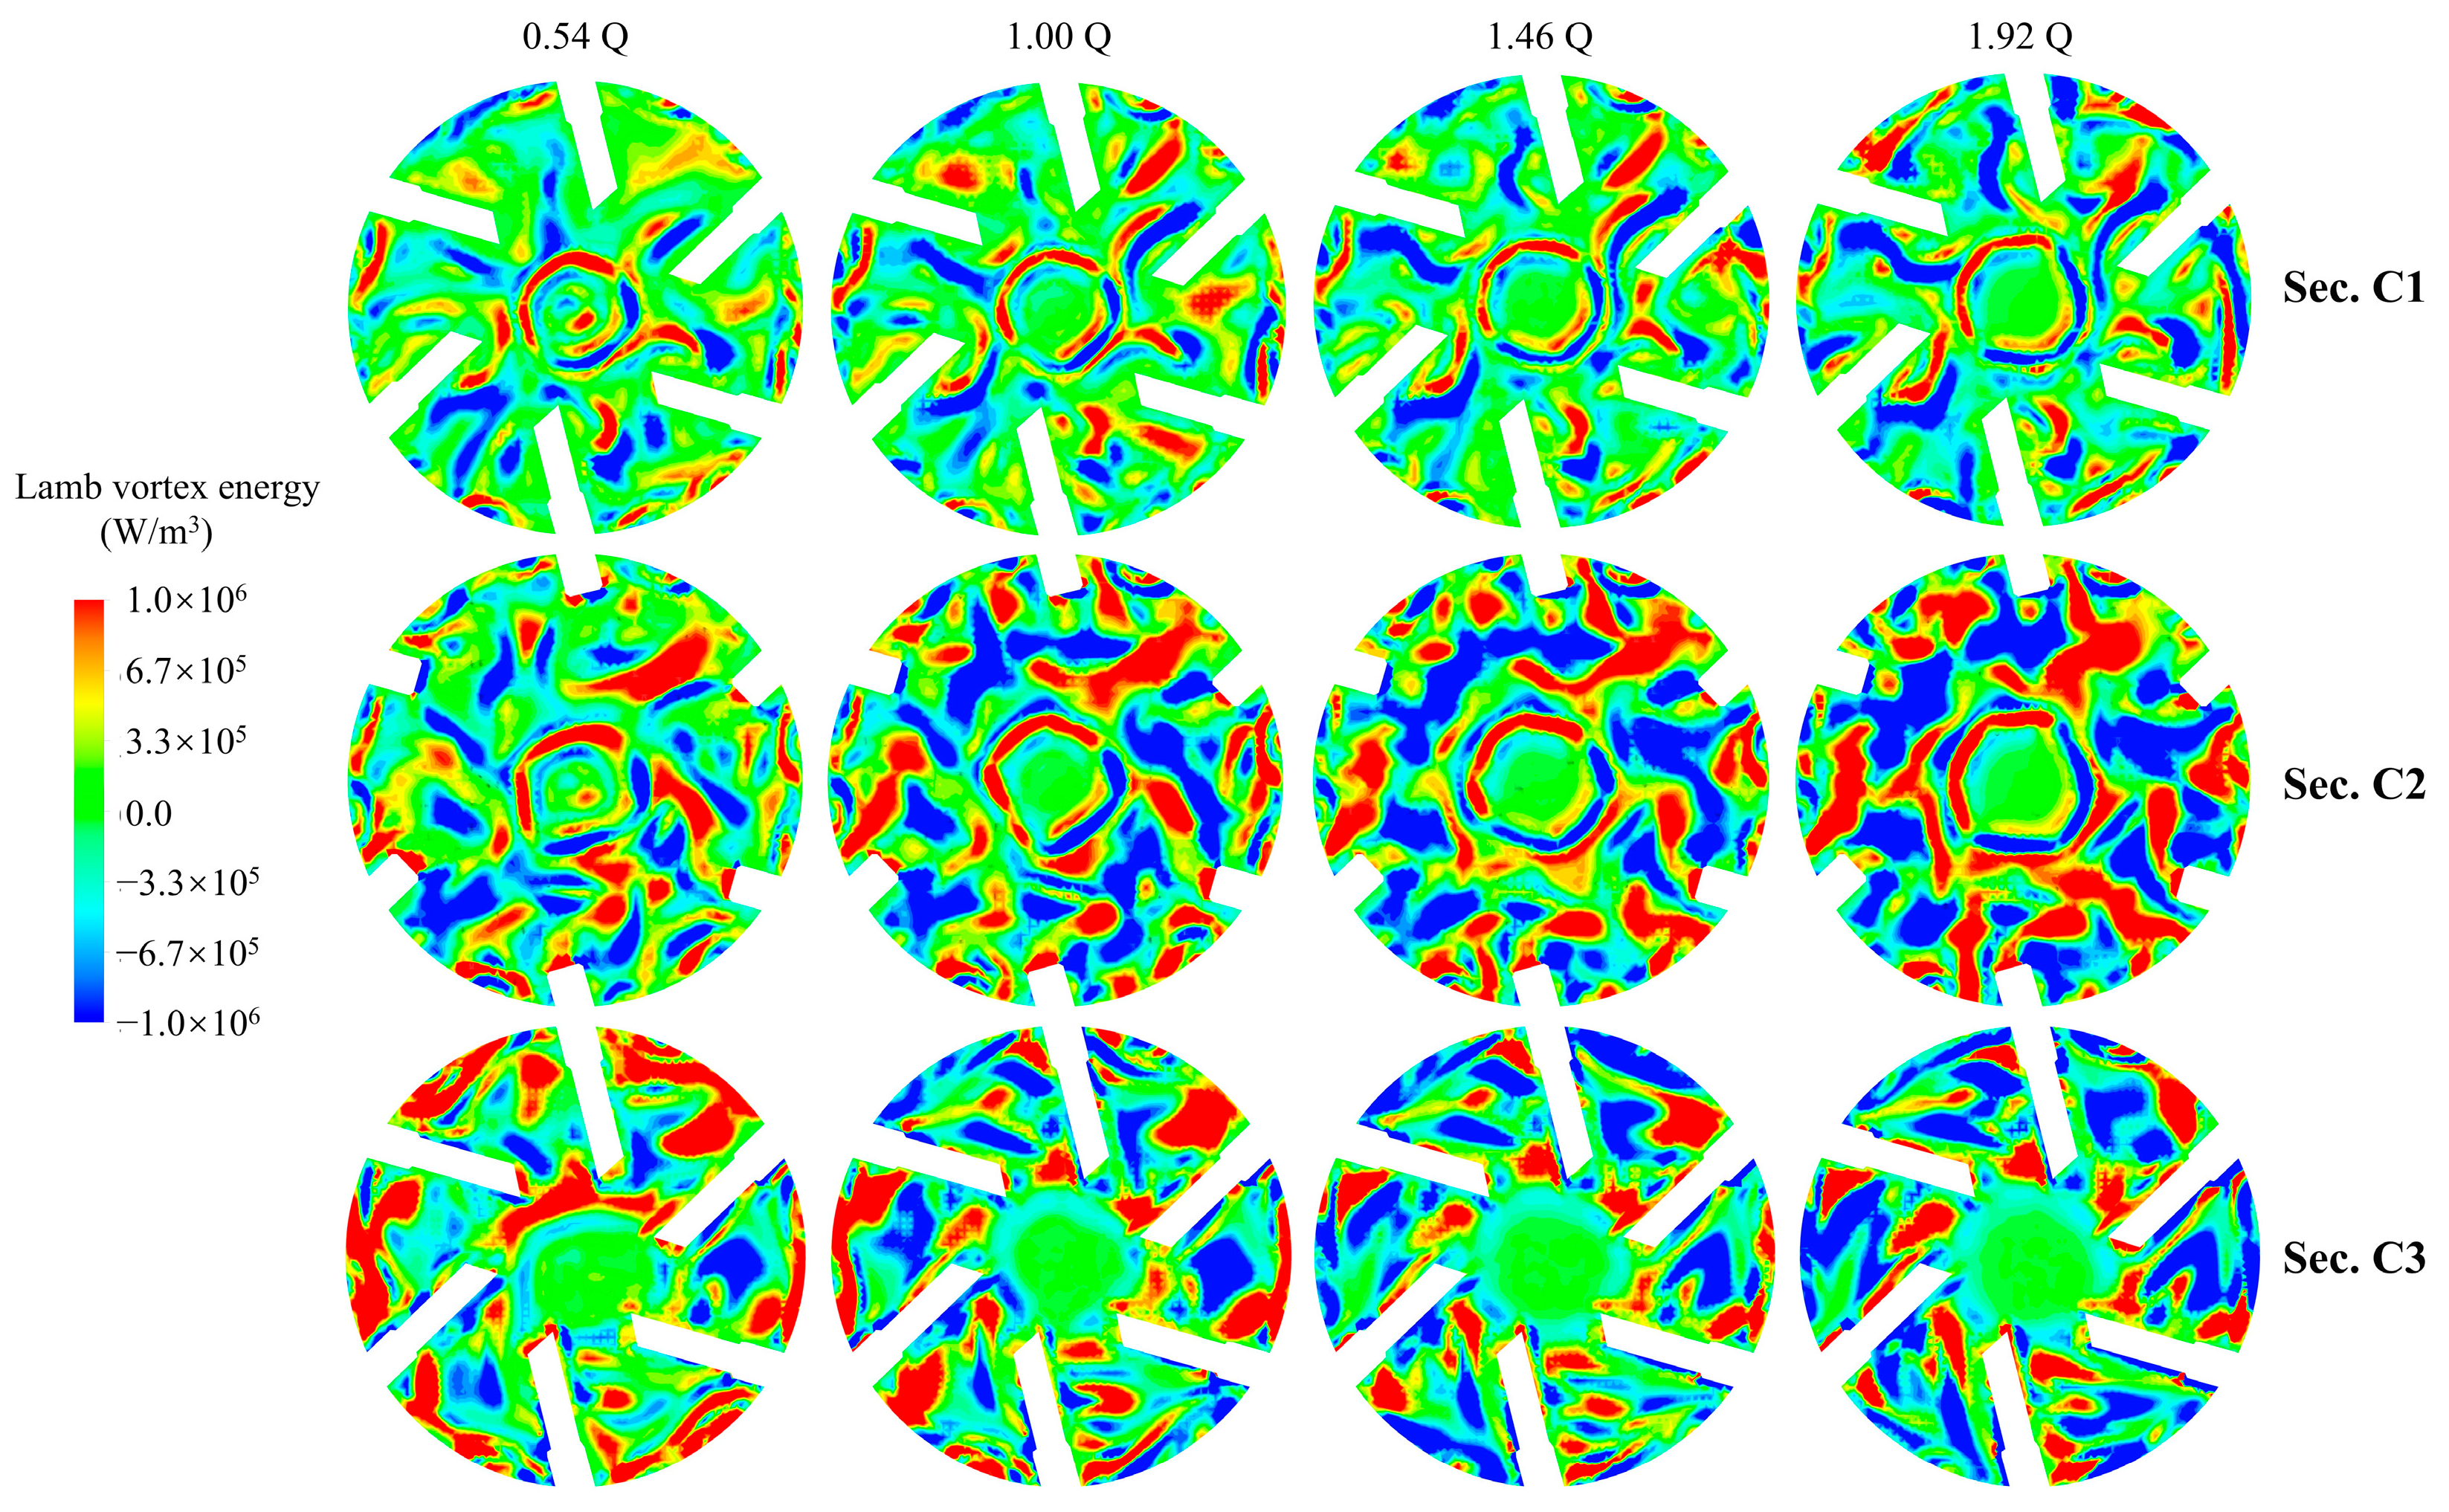
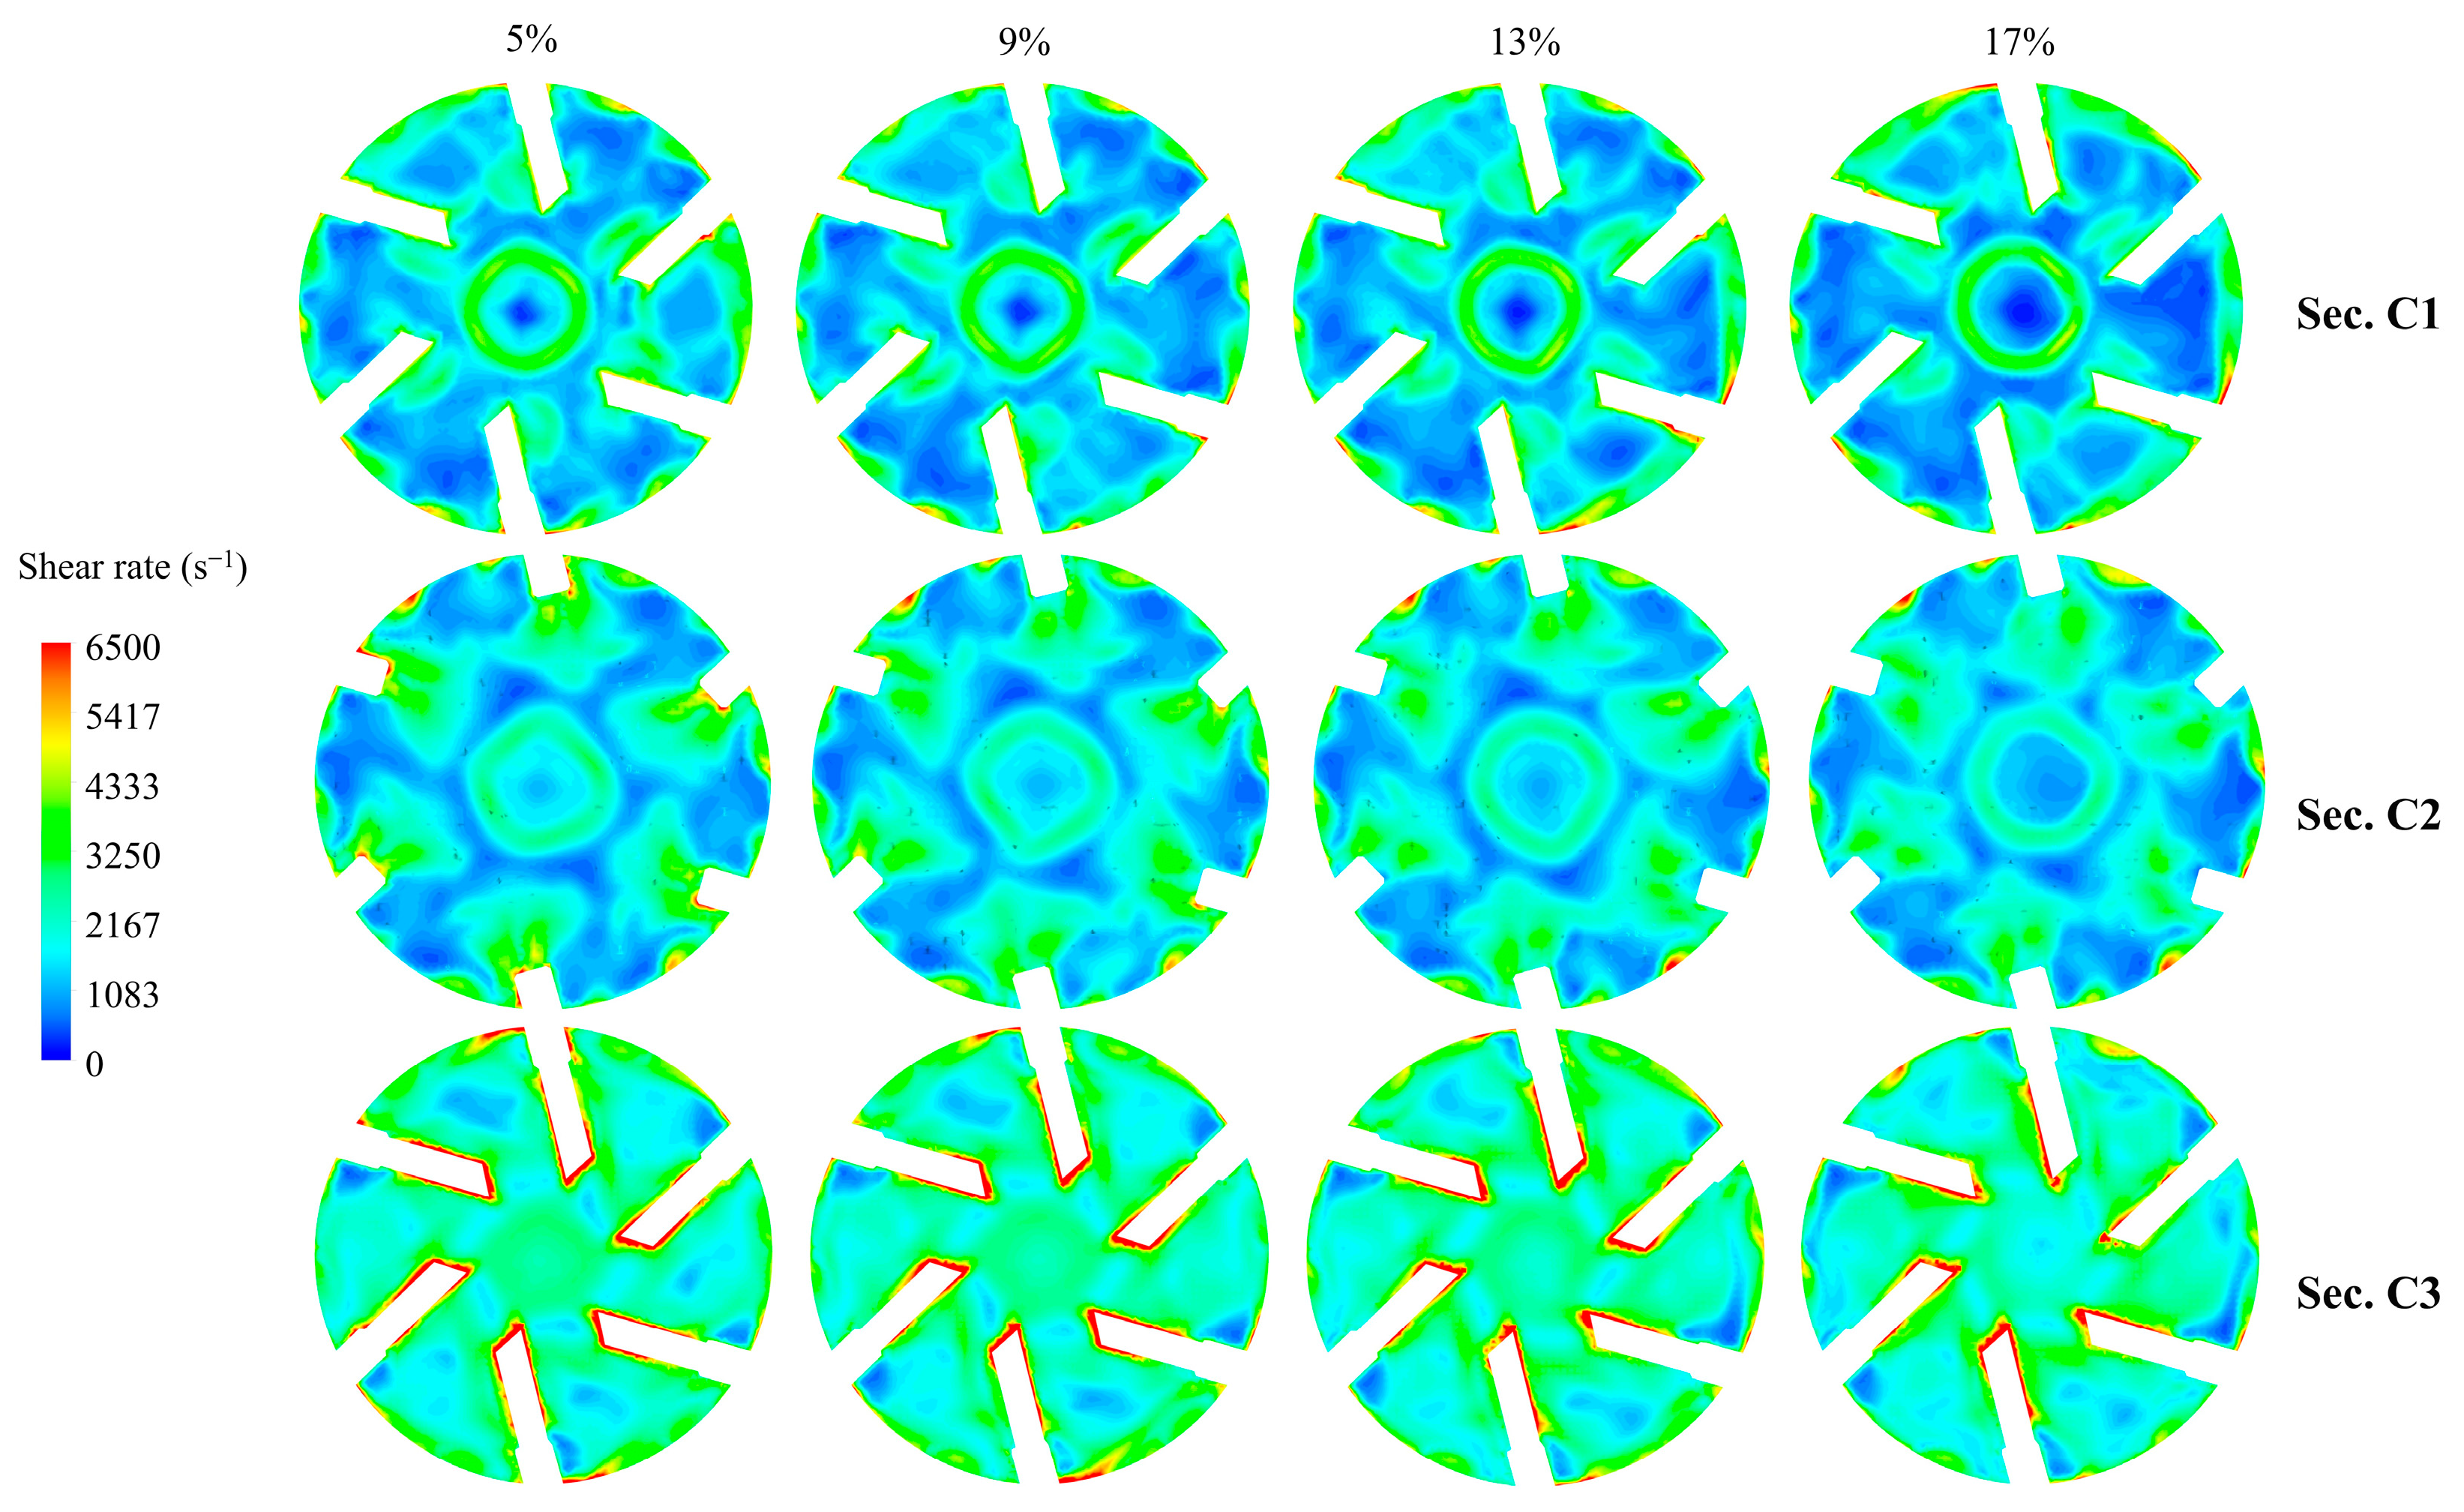
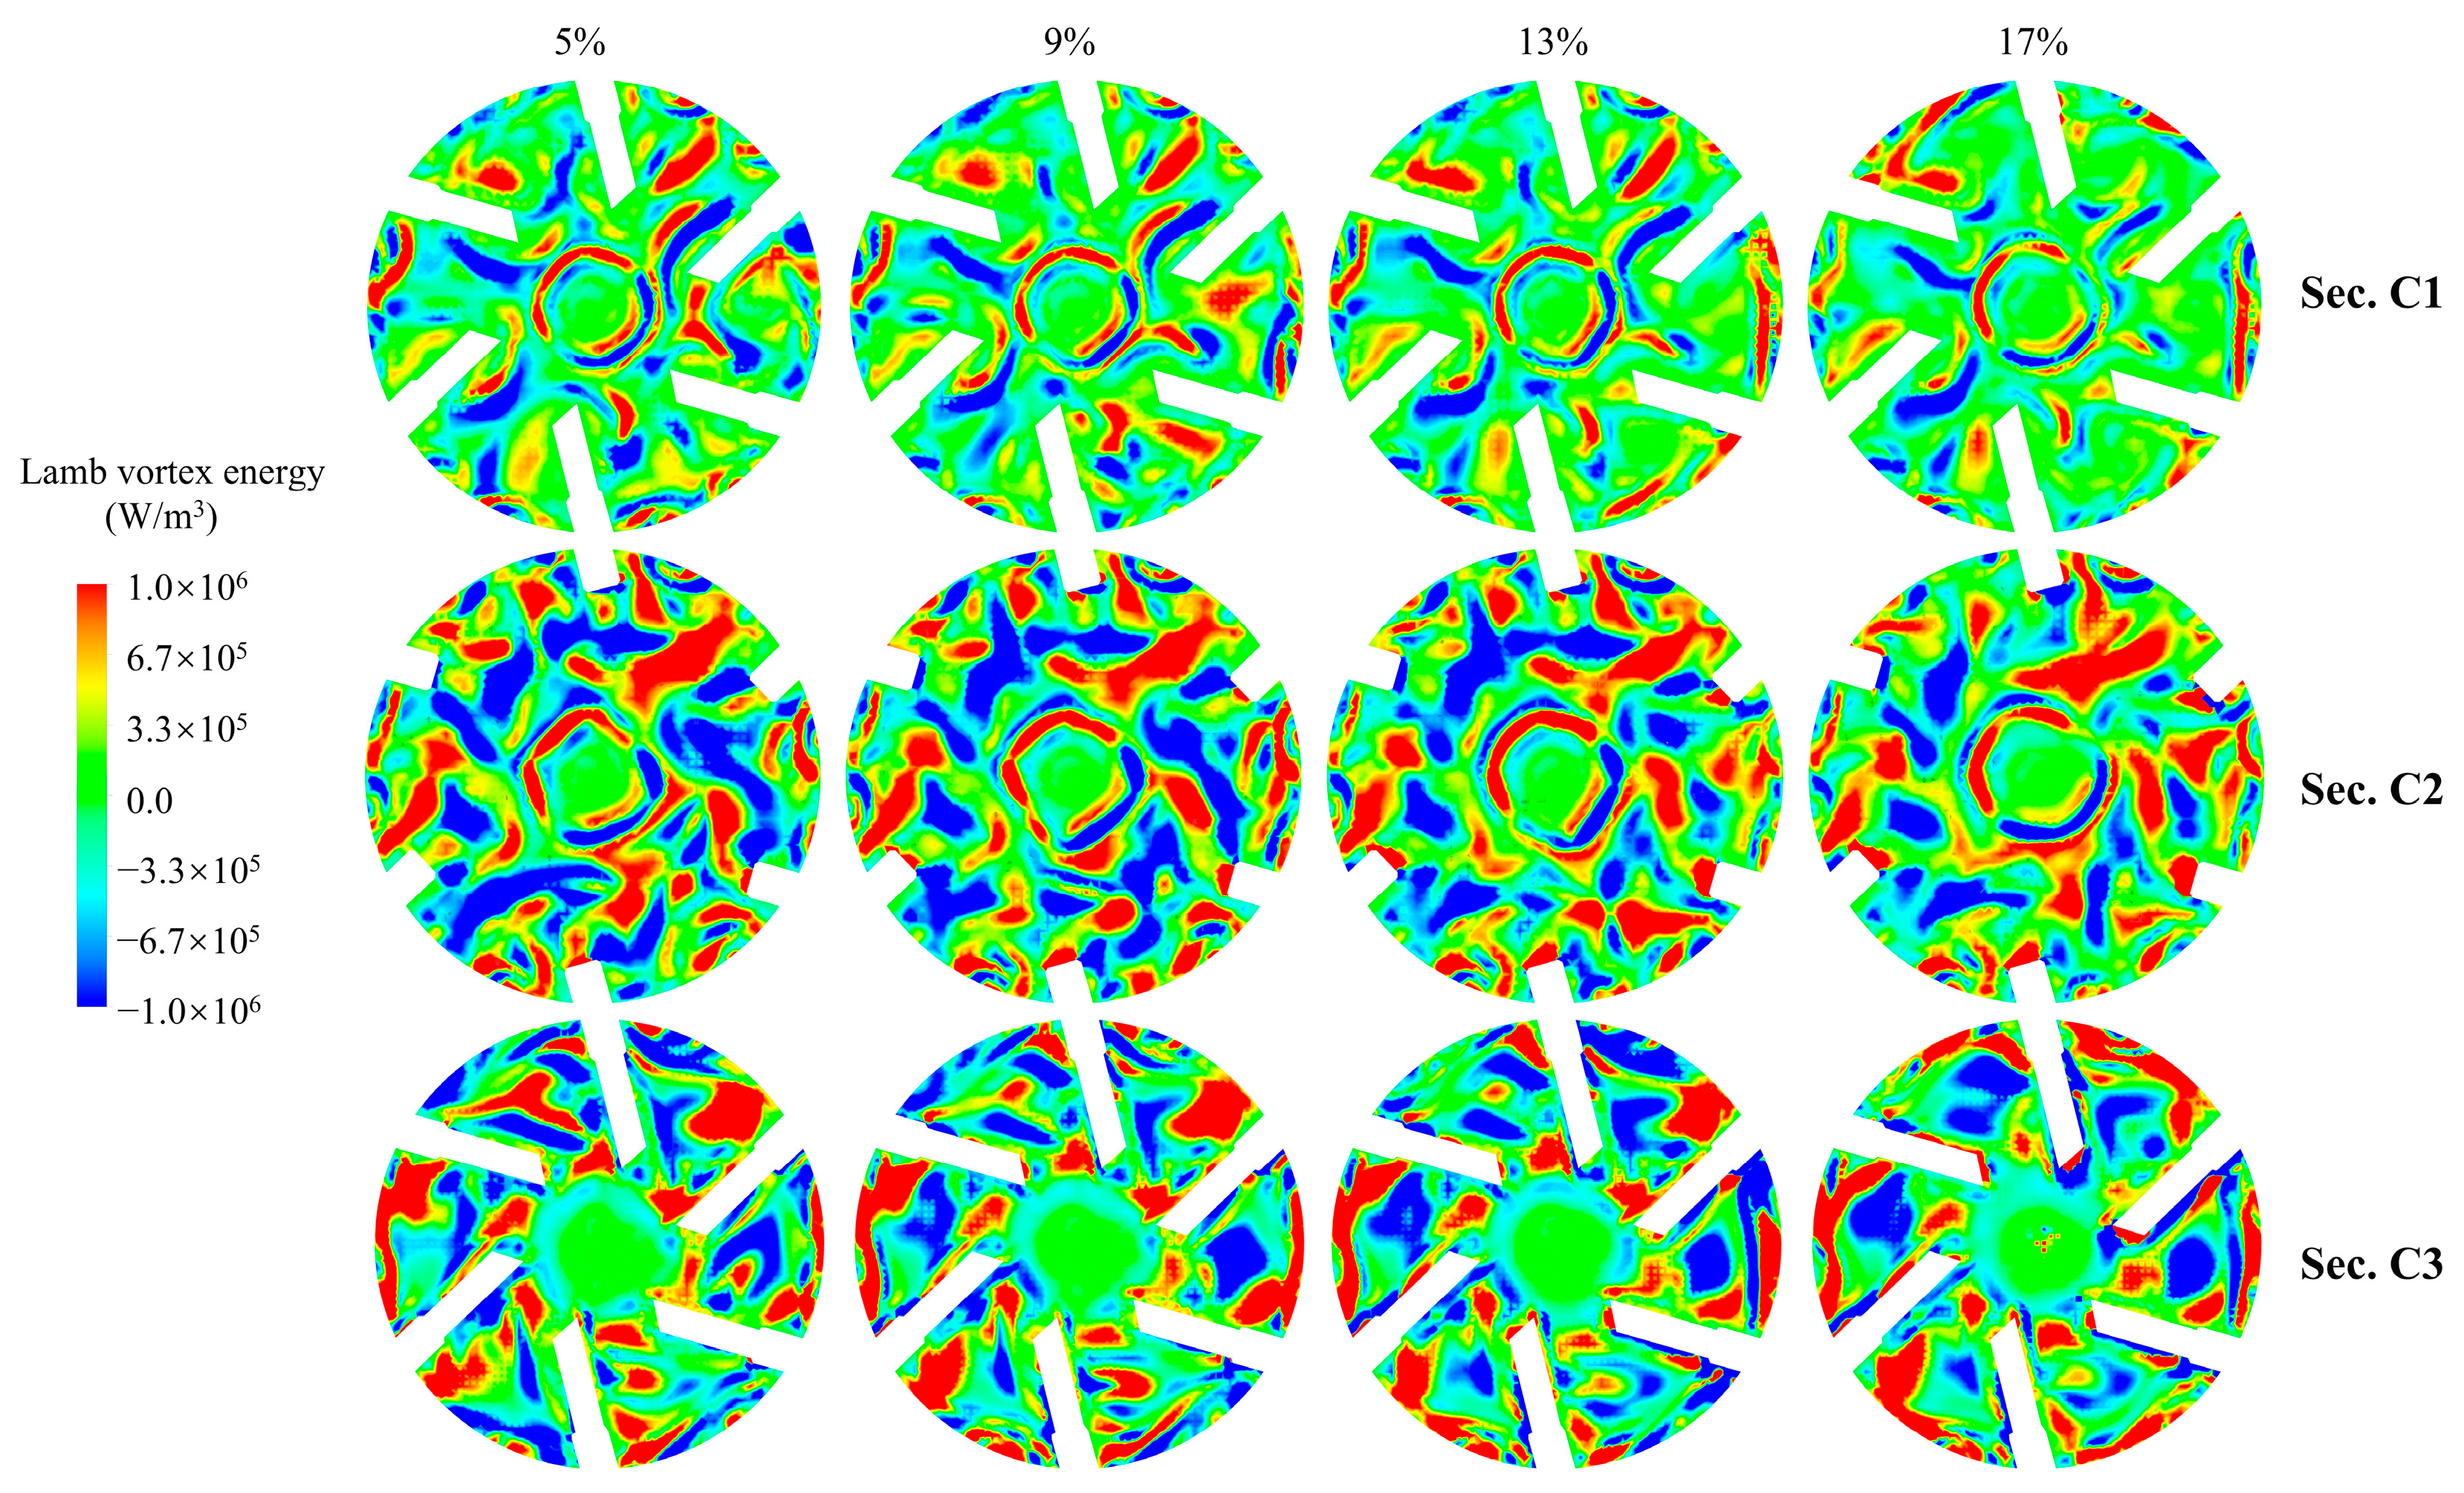
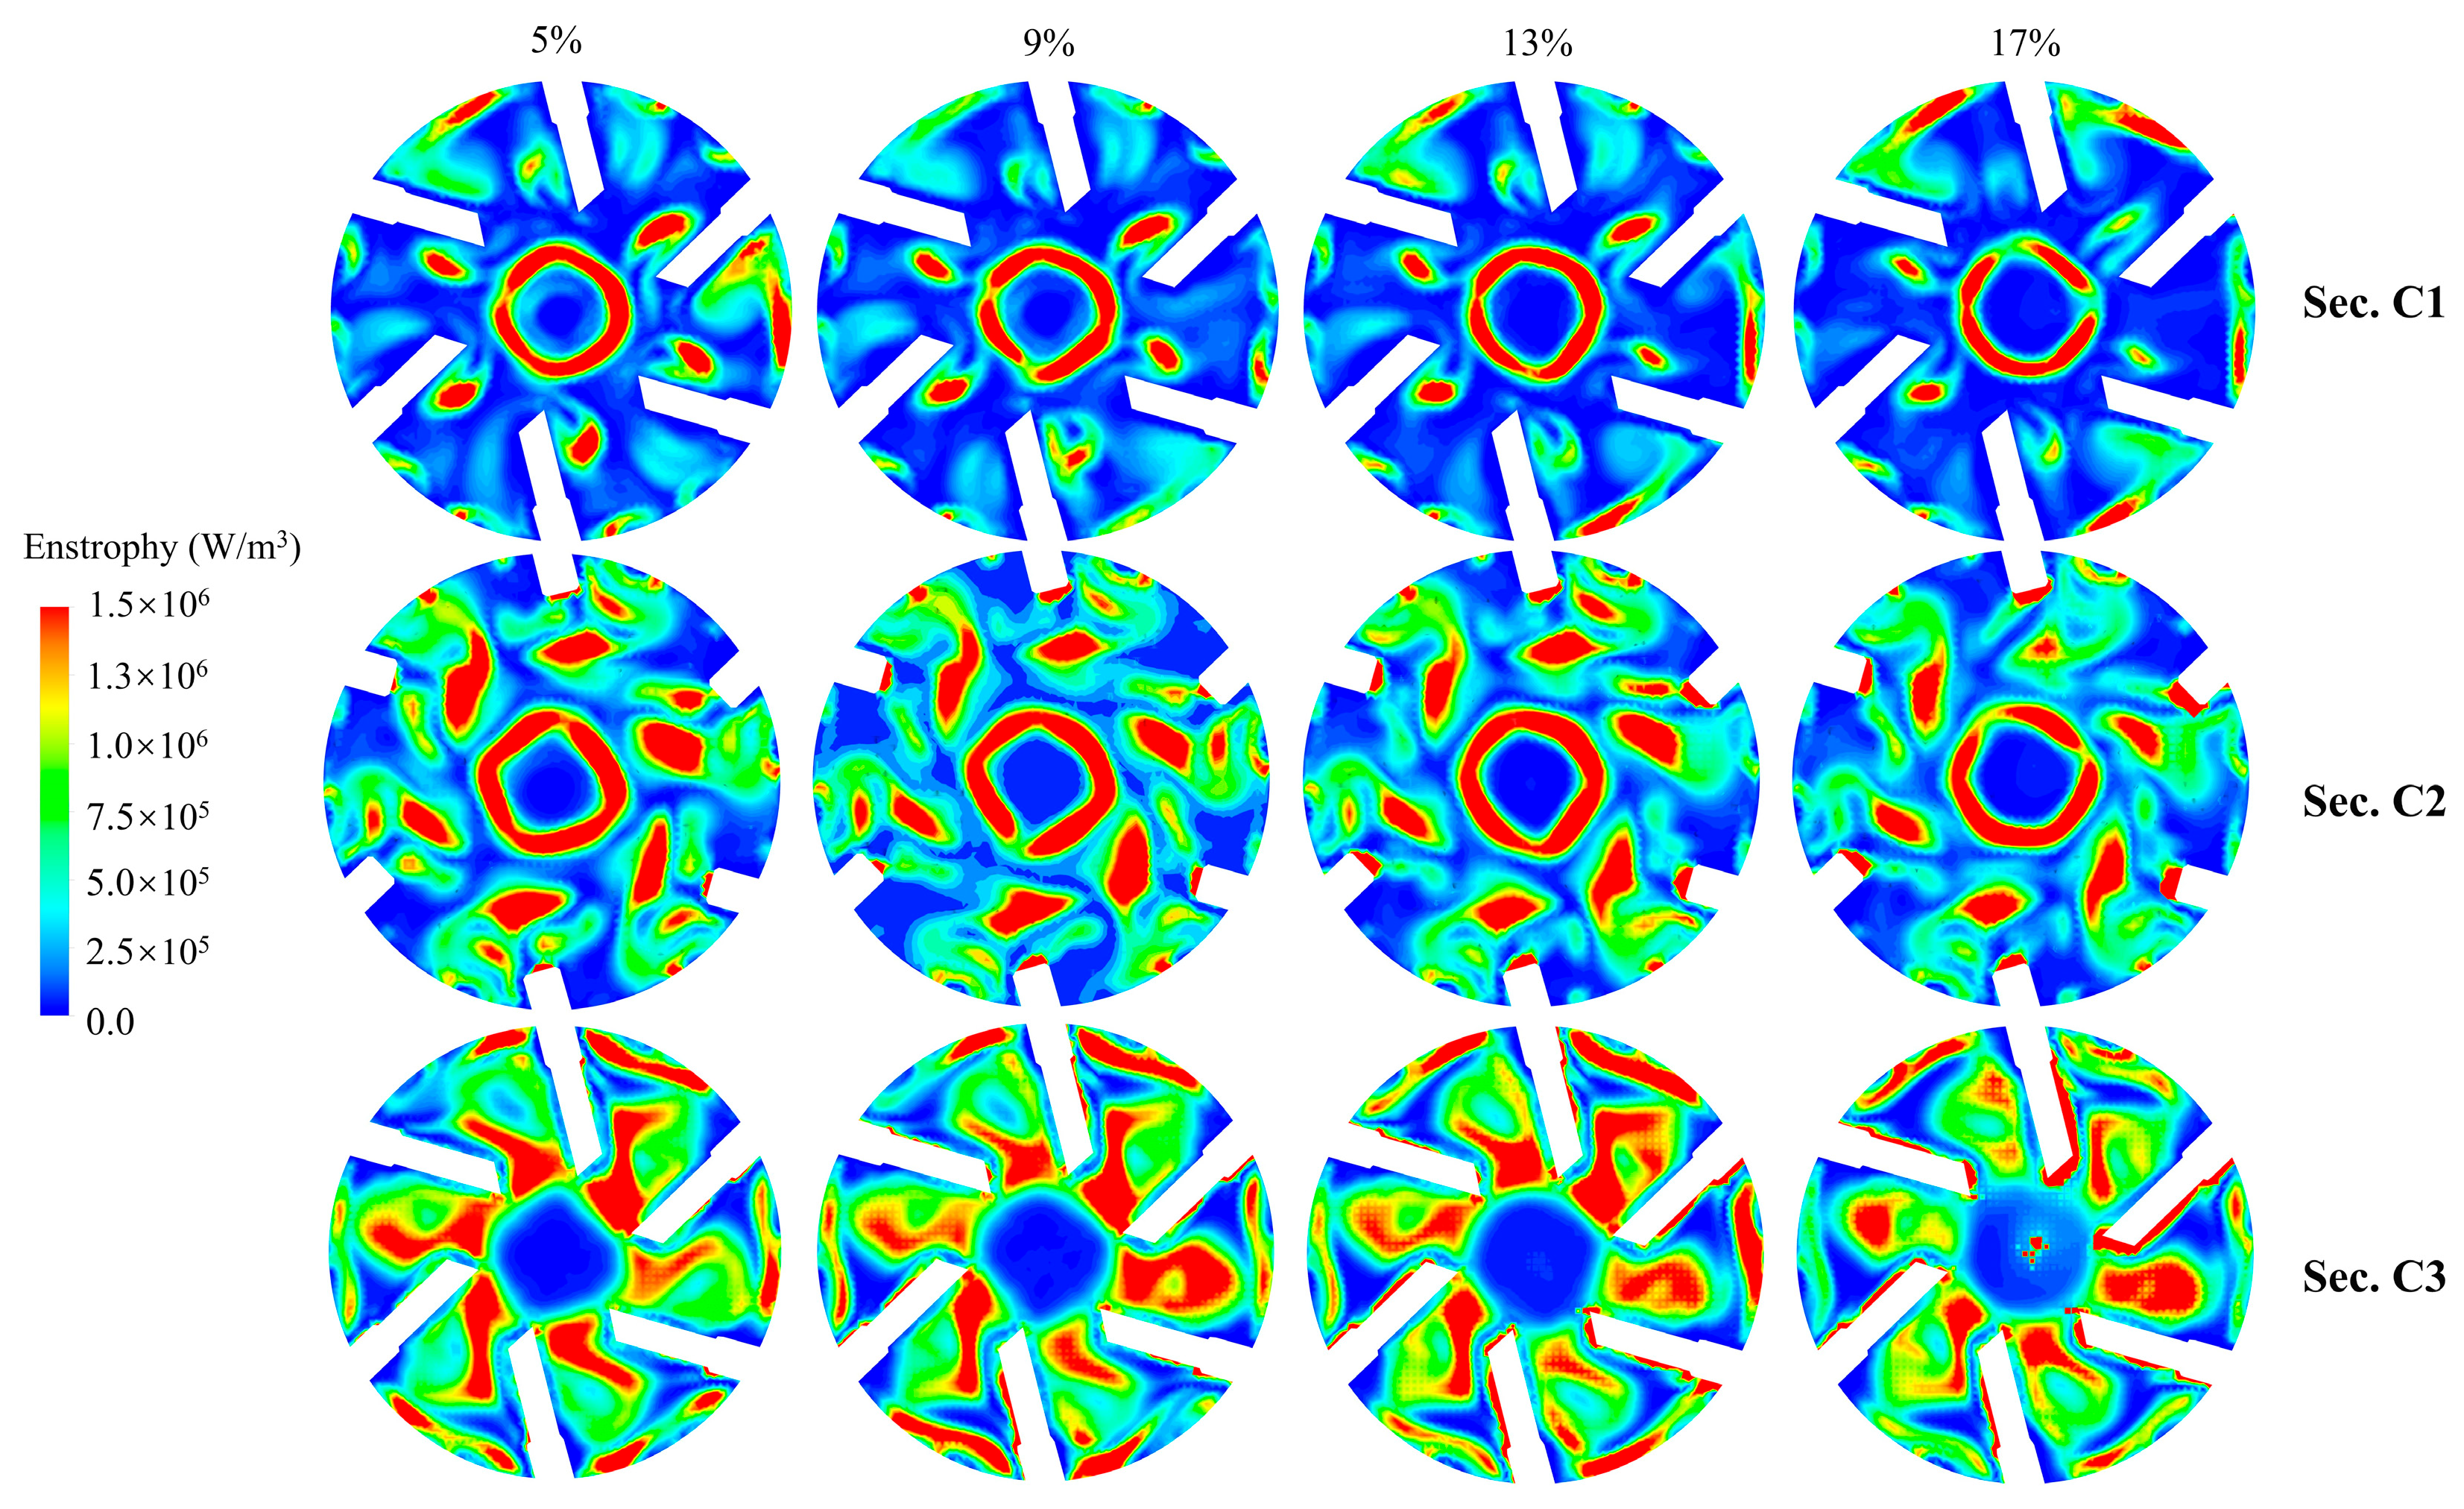
An analysis of shear energy indicators at different cross-sections in the impeller domain is presented in Figure 13, Figure 14 and Figure 15. The high-value zones of the three energy parameters are highly overlapped at the outer radial region of the impeller, reflecting the strong coupling correlation between shear and vortex energy. Statistical results show that the three parameters at the rear shroud cross-section are significantly higher than those in the bladeless zone and front shroud cross-section. The average shear rate of the rear shroud increases by 32.7%, and the average Lamb vortex energy rises by 41.2%. This phenomenon is associated with severe solid particle accumulation in the rear shroud region shown in Figure 10, which enhances flow field inhomogeneity. The rear shroud exhibits a much higher sensitivity to variations in operating conditions such as flow rate and particle concentration compared with other internal impeller regions. Moreover, the shear rate on the blade suction surface is higher than that on the pressure surface, owing to the easier occurrence of boundary layer separation and the formation of a stronger velocity gradient on the suction surface.
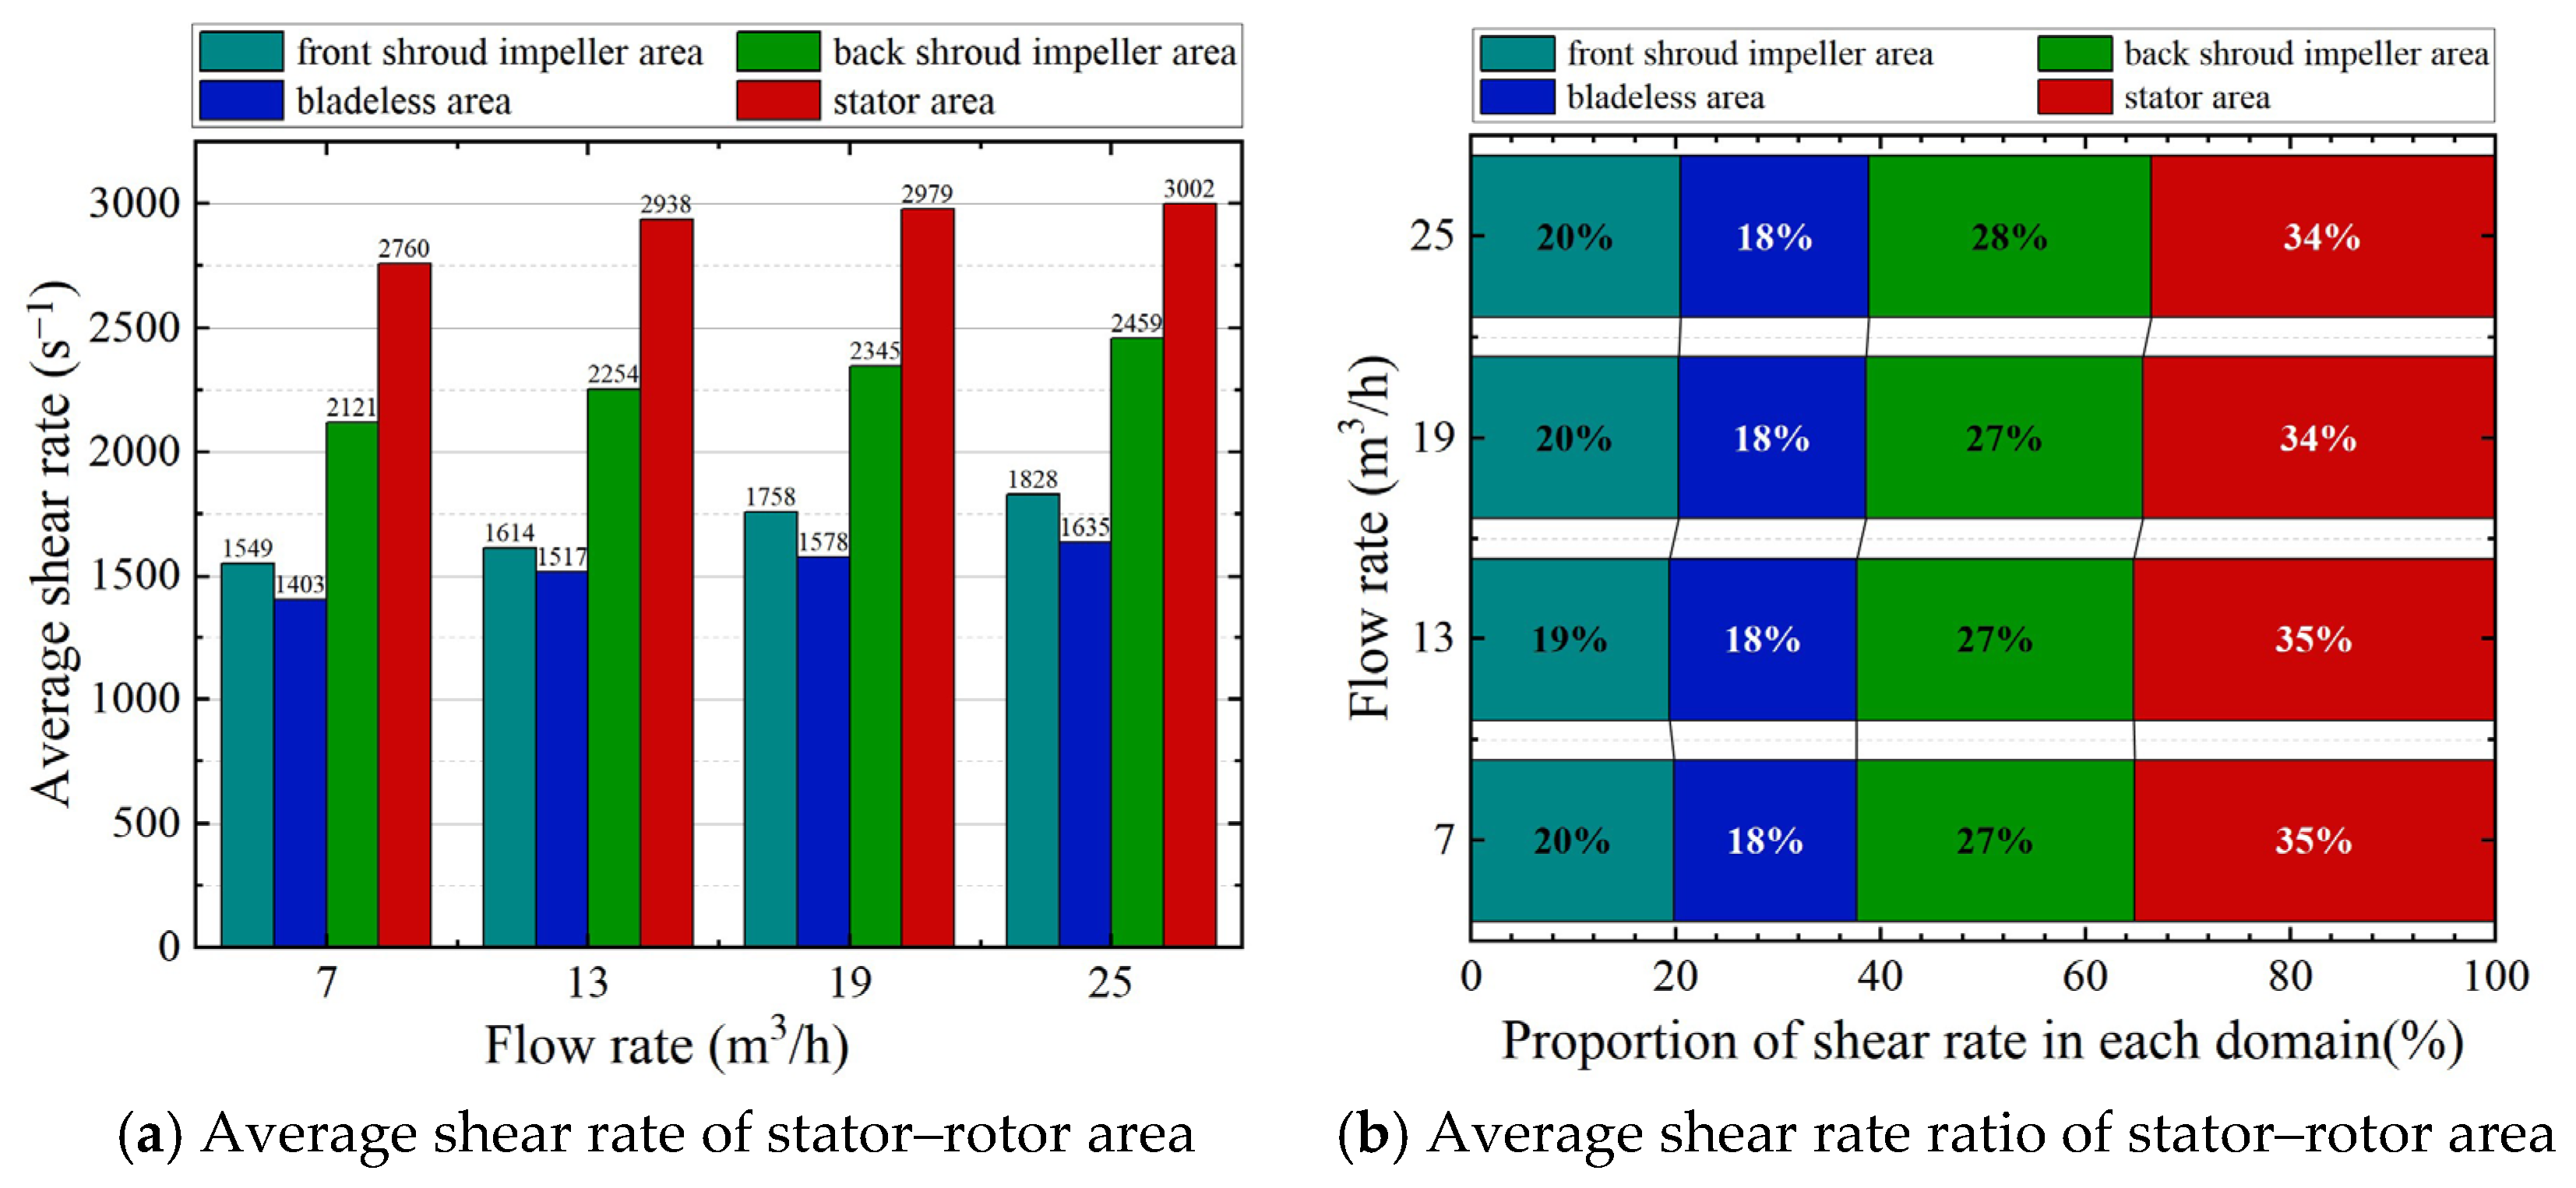
The shear rate increases linearly with the rising flow rate, with an average growth rate of 6.5%. As the flow rate increases from 7 m3/h to 25 m3/h, the average shear rate of the full flow domain rises from 1517 s−1 to 3002 s−1, representing an increase of 97.9%. Under all operating conditions, the stator domain always dominates the shear rate with a proportion maintained at approximately 35%, which acts as the core region for shear action. With the increase in flow rate, this proportion in the stator domain slightly decreases by 1%, and the dominant shear region mildly shifts toward the rear shroud impeller domain. The detailed variation laws are illustrated in Figure 16.
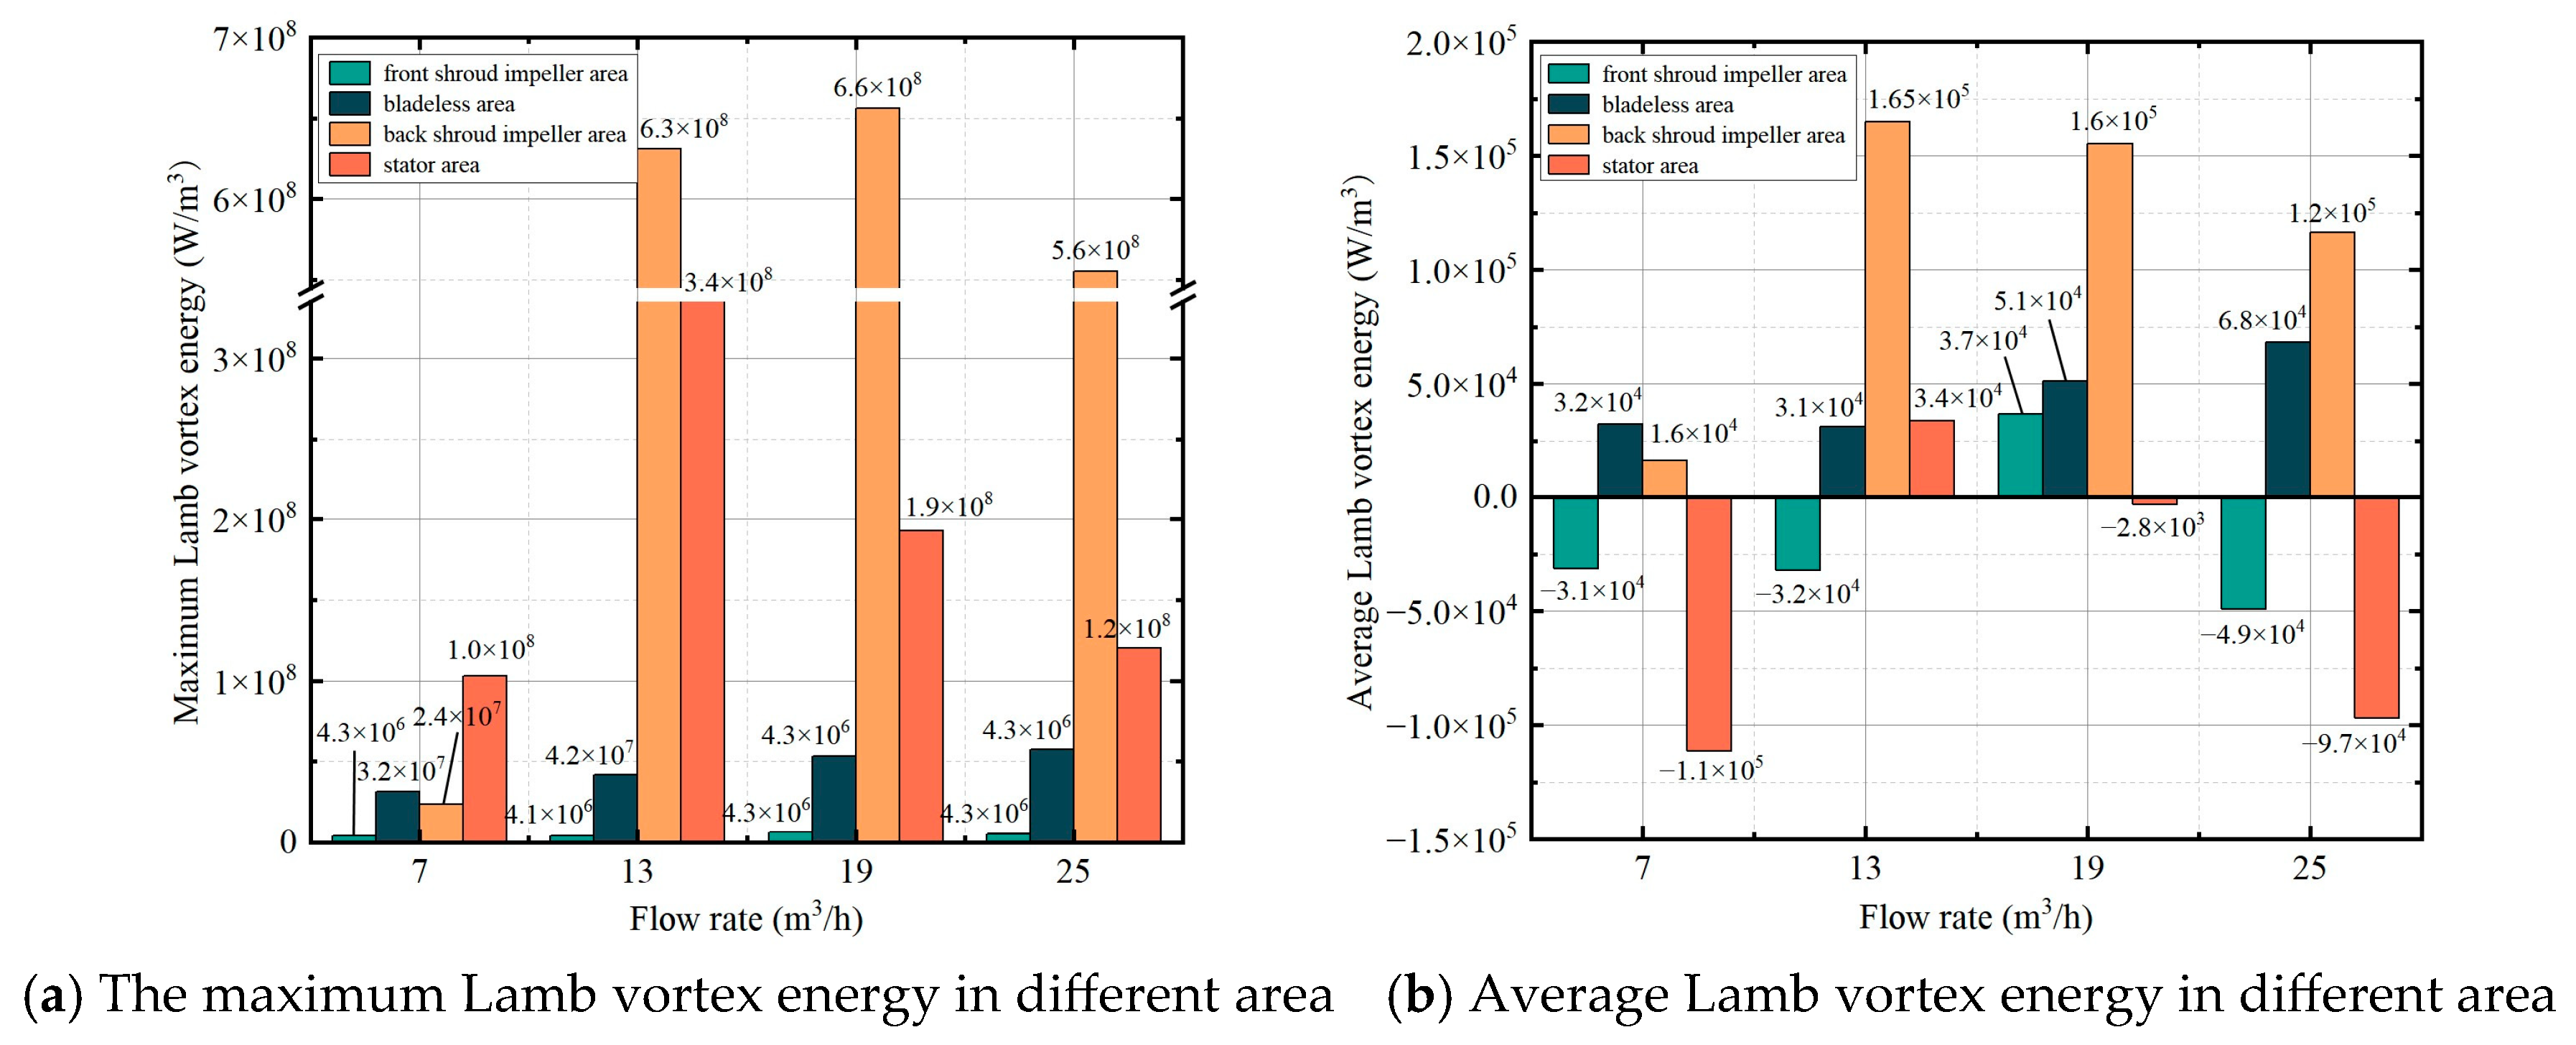
Lamb vortex energy increases nonlinearly with rising flow rates, showing distinct responses among different flow domains. At the low flow rate of 7 m3/h, the maximum Lamb vortex energy in the stator domain reaches 1 × 10⁸ W/m3, exceeding the total value of the impeller domain. When the flow rate increases above 13 m3/h, the vortex energy in the rear shroud impeller domain grows explosively, reaching a peak of 6.6 × 10⁸ W/m3 at 19 m3/h with an increment of 2525%, which dominates the entire flow field. At low flow rates, the proportion of positive and negative vortex energy is approximately 1:1. As the flow rate further increases, the bladed region is gradually dominated by negative vortex energy, and the vortex squeezing effect is enhanced. The detailed variation characteristics are presented in Figure 17.
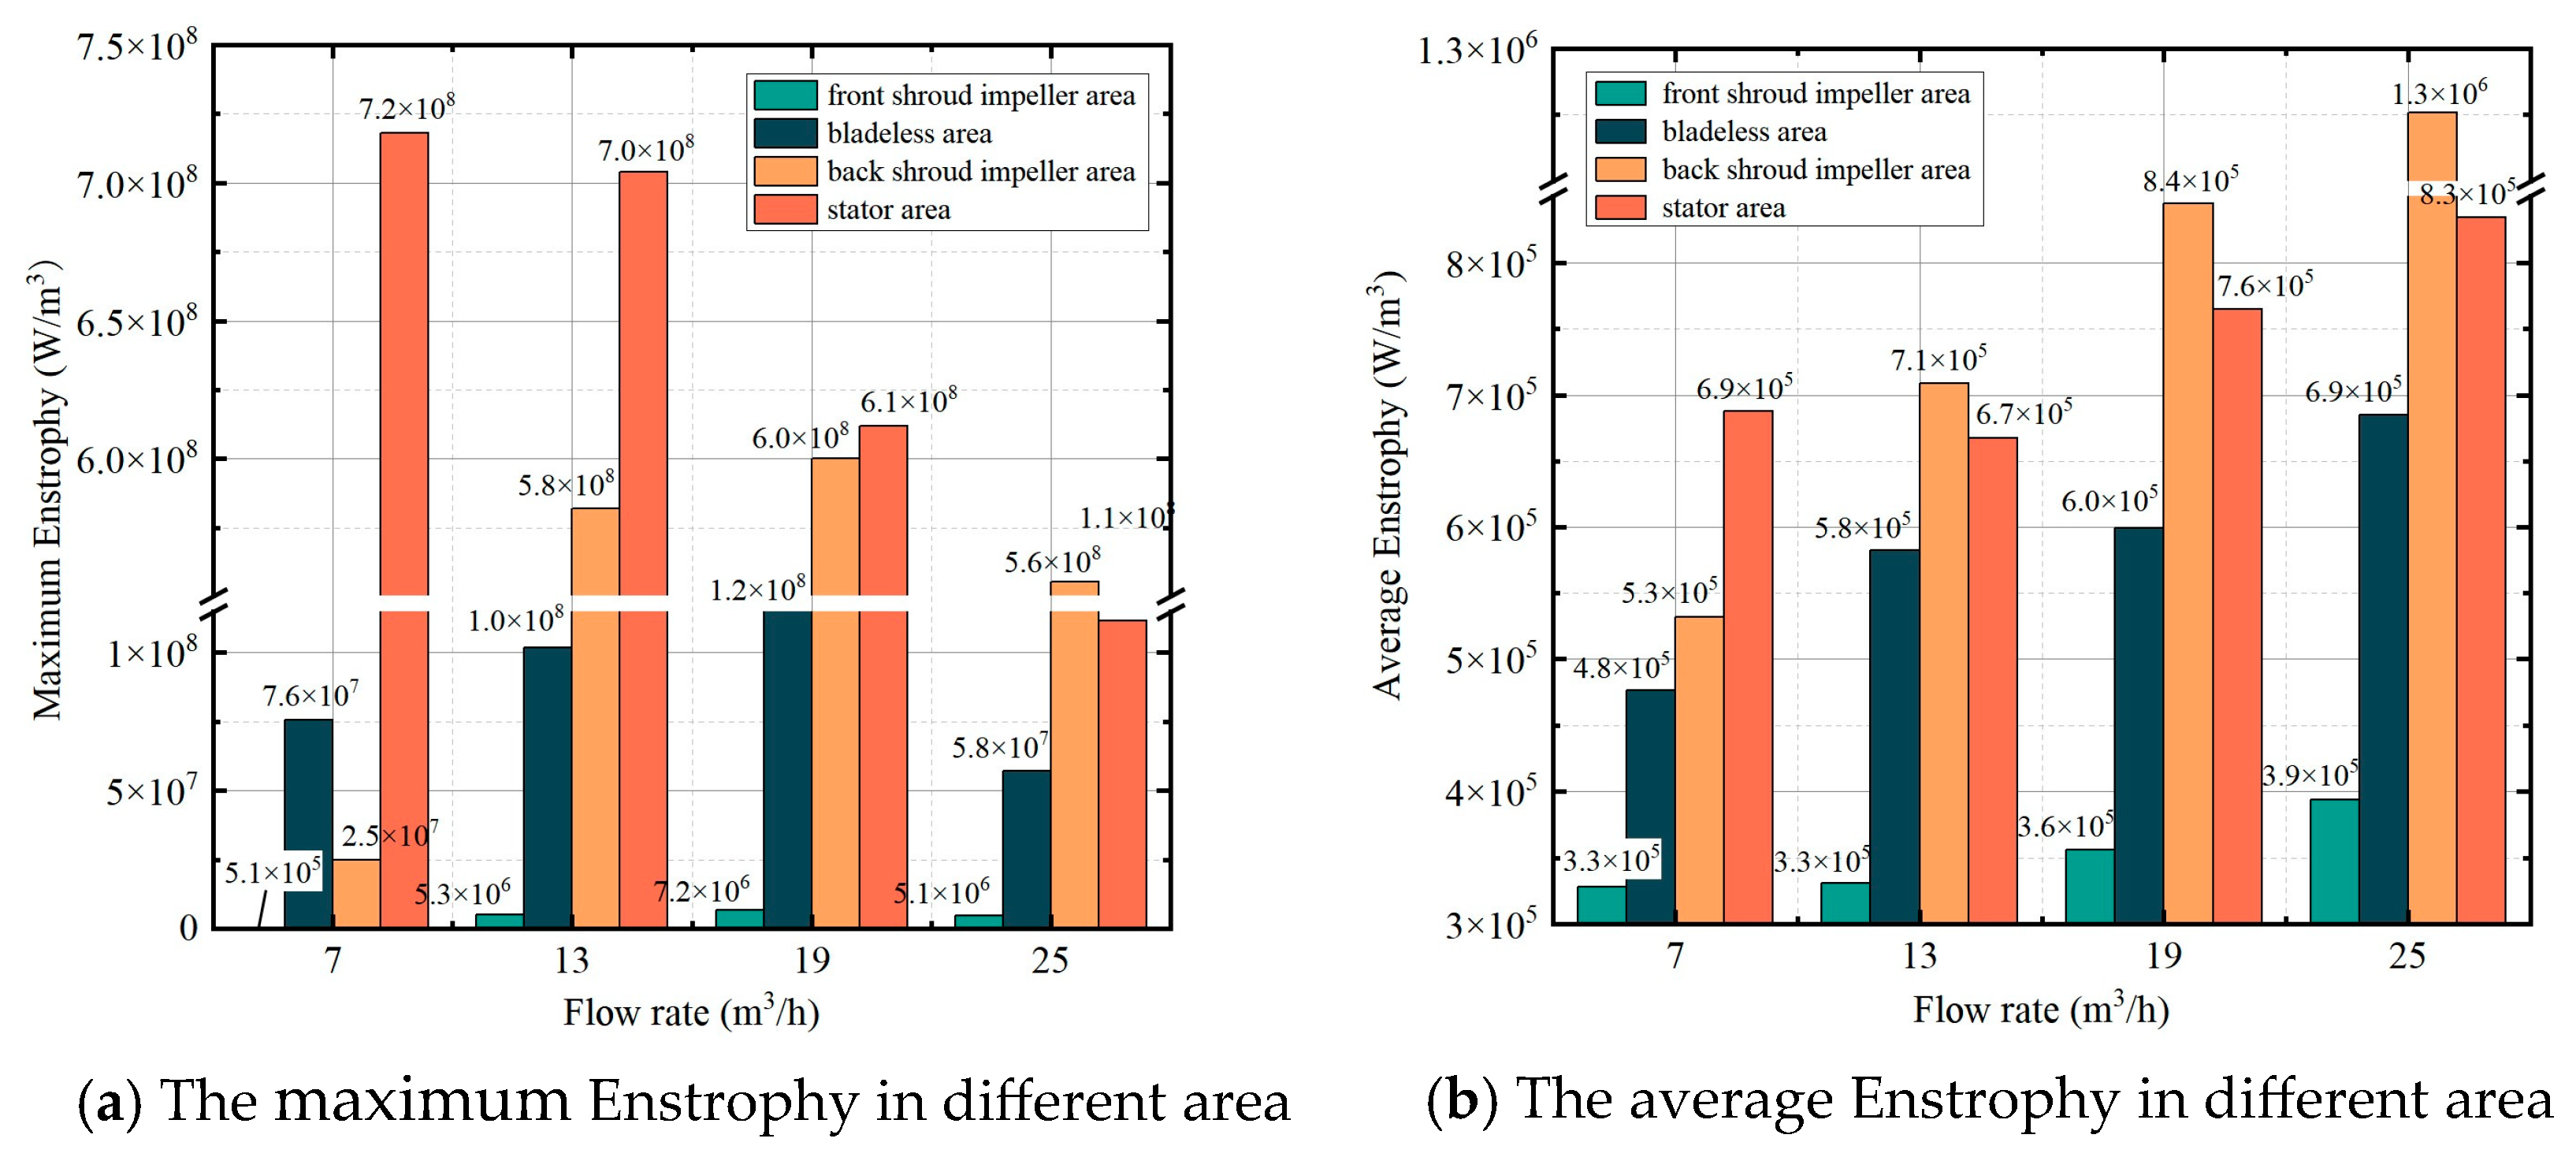
Enstrophy presents a variation law of “decreasing peak value and increasing mean value”. At the low flow rate of 7 m3/h, the maximum Enstrophy reaches 7.2 × 10⁸ W/m3, which is the peak among all operating conditions. As the flow rate increases, the peak value decreases by 81.9%, while the spatially averaged Enstrophy of the full flow domain rises by 62.3%. This is attributed to the fact that the high-Enstrophy regions disperse from the local stator–rotor gap to the entire domains of the impeller and stator at an elevated flow rate, generating a more uniform dissipation distribution and facilitating the micro-scale mixing of solid–liquid phases. The detailed variation characteristics are shown in Figure 18.
Combined with Table 2 and Contour in Figure 16, Figure 17 and Figure 18, as the flow rate increases from 0.54 Q to 1.92 Q, the average full-domain shear rate rises by 97.9% and the average Enstrophy increases by 62.3%. The global coupling effect of shear and vortex energy is continuously enhanced. Correspondingly, the Cv value of outlet mud decreases steadily from 19.1% to 12.8%, with a reduction of 33.5%, indicating a significant improvement in mud mixing uniformity. The quantitative correlation demonstrates that the increased shear rate induced by higher flow rates simultaneously promotes the global growth of Lamb vortex energy and Enstrophy. This strengthens the synergistic effects of mesoscopic blending and microscopic dispersion, thereby improving the overall mixing uniformity of the mud.

3.2.2. Coupling Influence of Particle Concentration on Shear Rate, Lamb Vortex Energy and Enstrophy

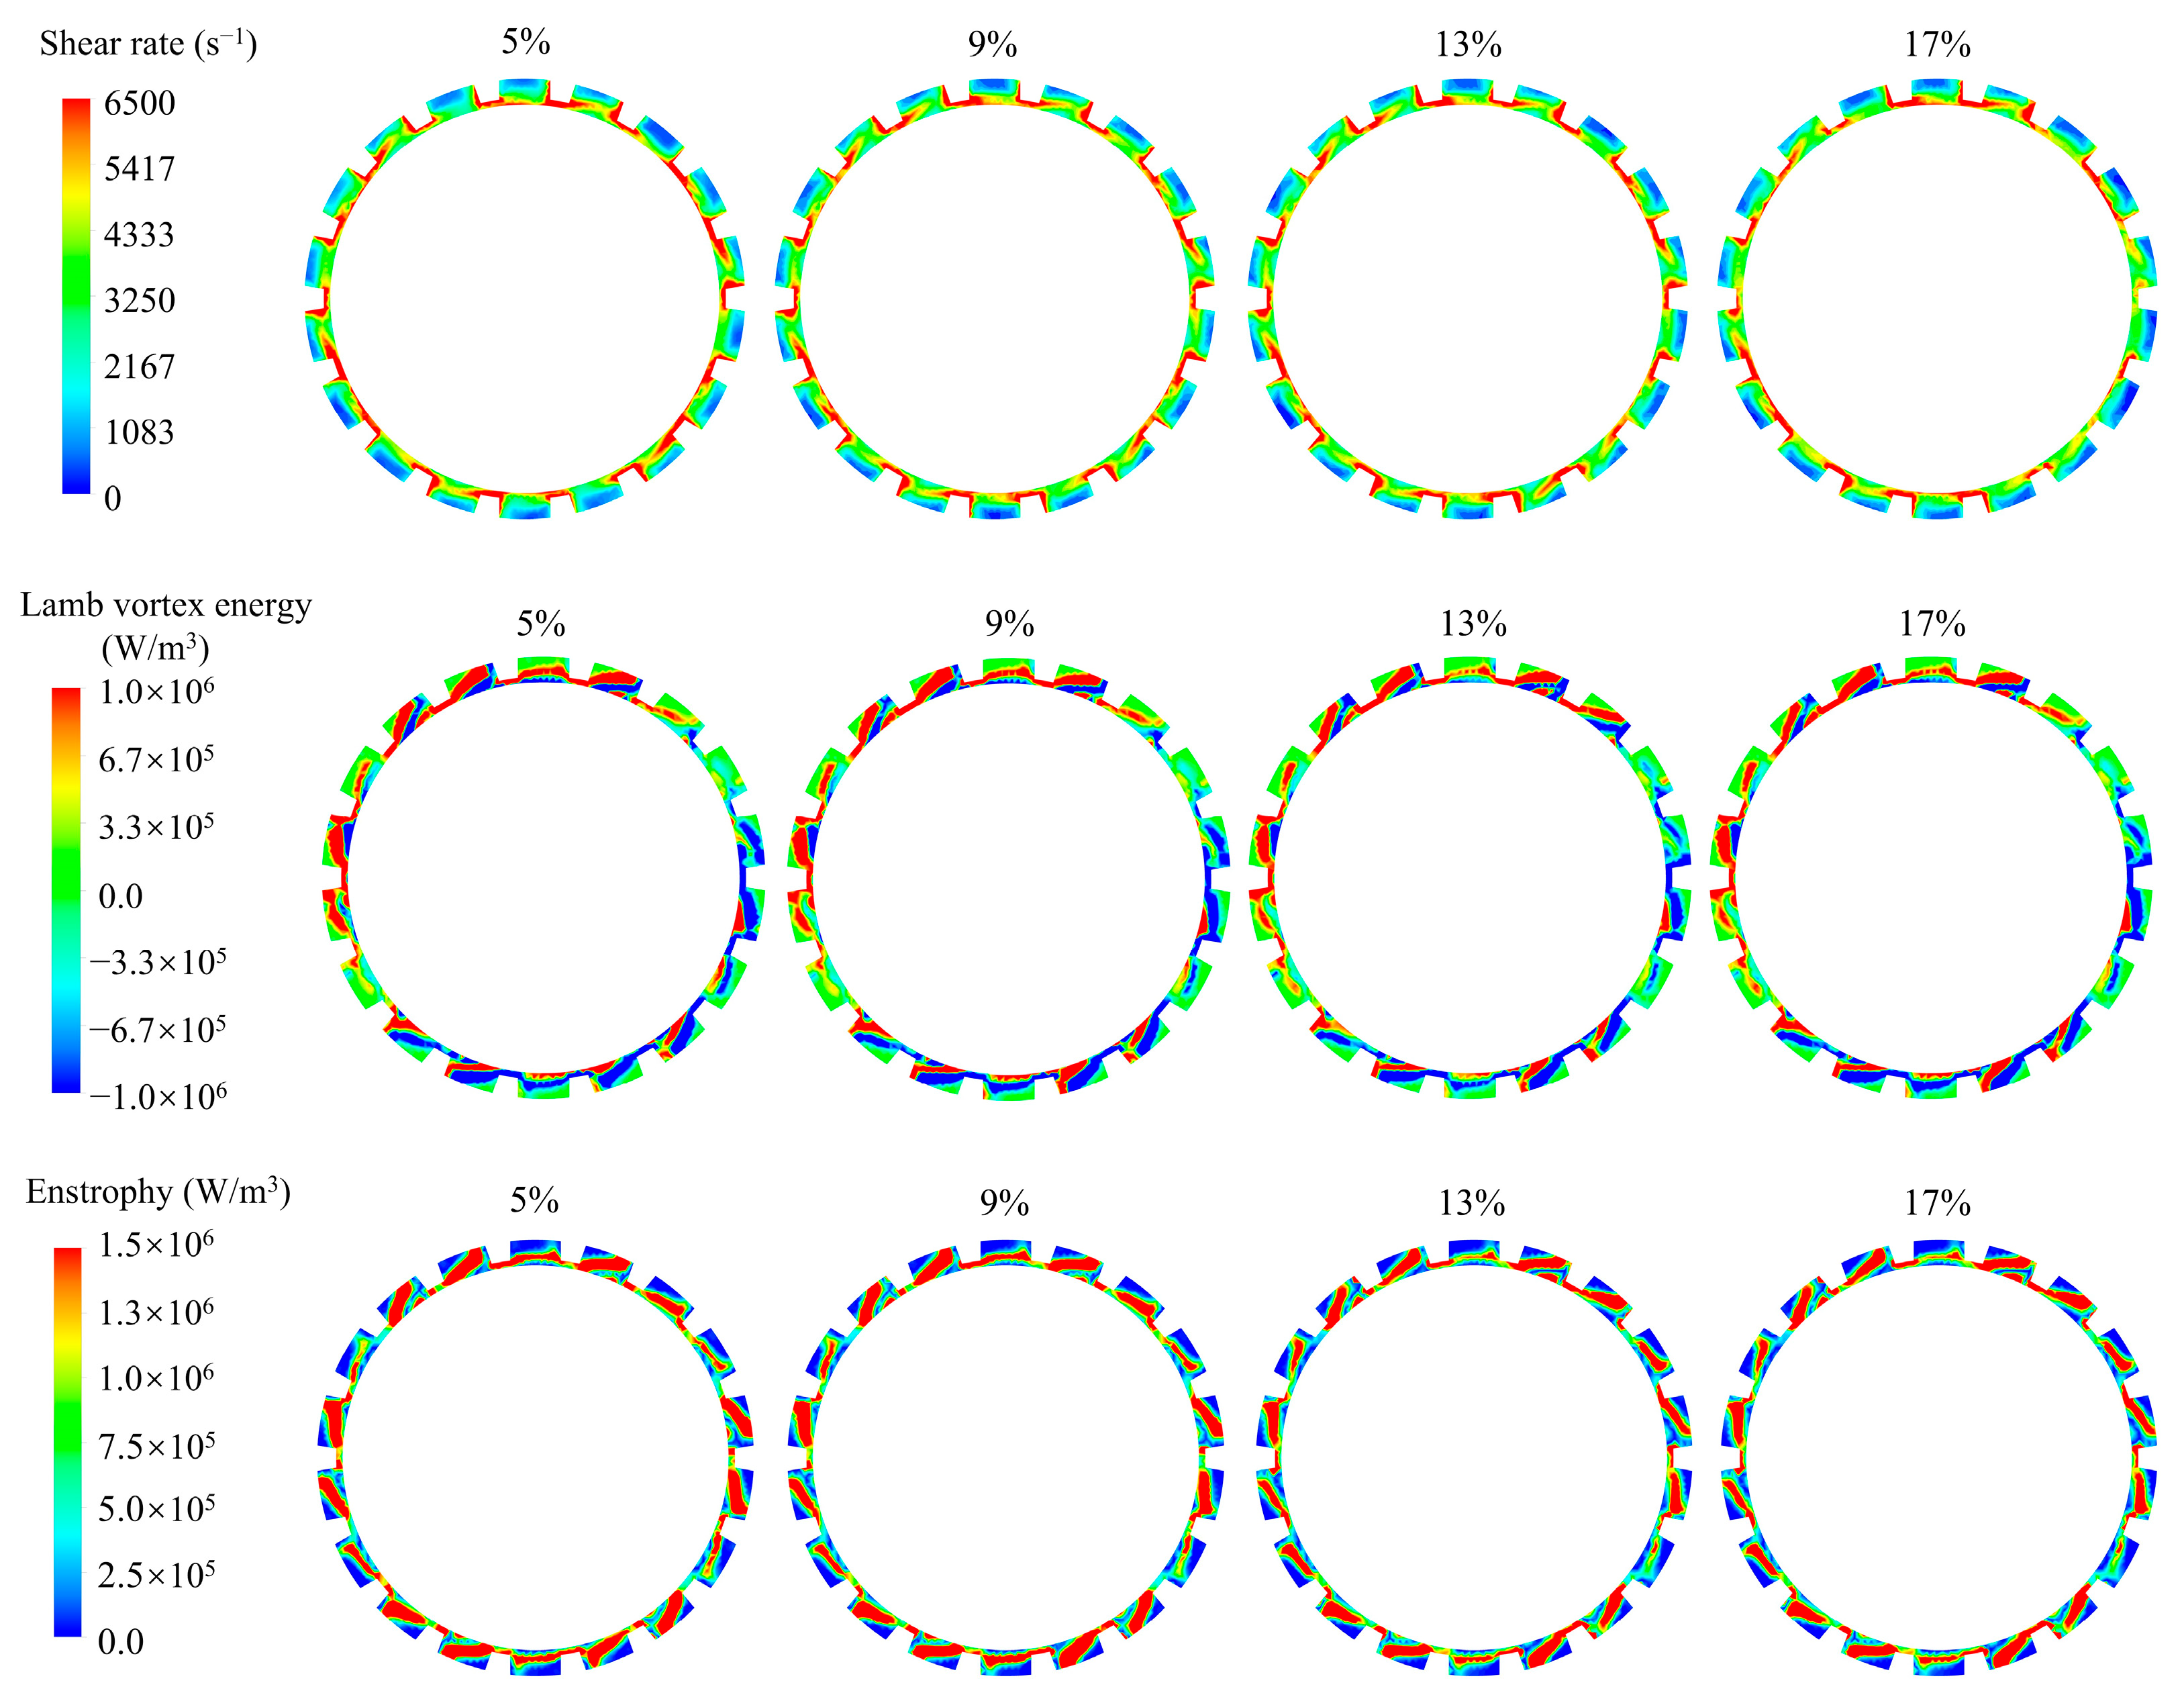
Four solid volume fractions ranging from 5% to 17% were set to investigate the synergistic regulation mechanism of particle concentration on three core energy parameters, namely shear rate, Lamb vortex energy and Enstrophy, as shown in Figure 19. Variations in particle concentration do not change the core distribution positions of the high-value regions for the three parameters, but aggravate the inhomogeneity of flow field distribution. Statistical results indicate that when the particle concentration increases from 5% to 17%, the area of the high-shear-rate zone in the stator–rotor gap decreases by 42.6%. The high-shear bands originally distributed uniformly along the circumferential direction of the stator gradually contract to the local region at the gap outlet, and the shear effect at the stator leading edge weakens continuously. Meanwhile, the coverage of high Lamb vortex energy regions in the stator domain shrinks, and the differentiation between positive and negative vortex energy is significantly intensified. The overall Enstrophy presents an upward trend, suggesting that the increased particle quantity in high-dissipation regions elevates the viscous dissipation of the liquid phase. Consequently, the global shear mixing performance of the stator is continuously weakened.
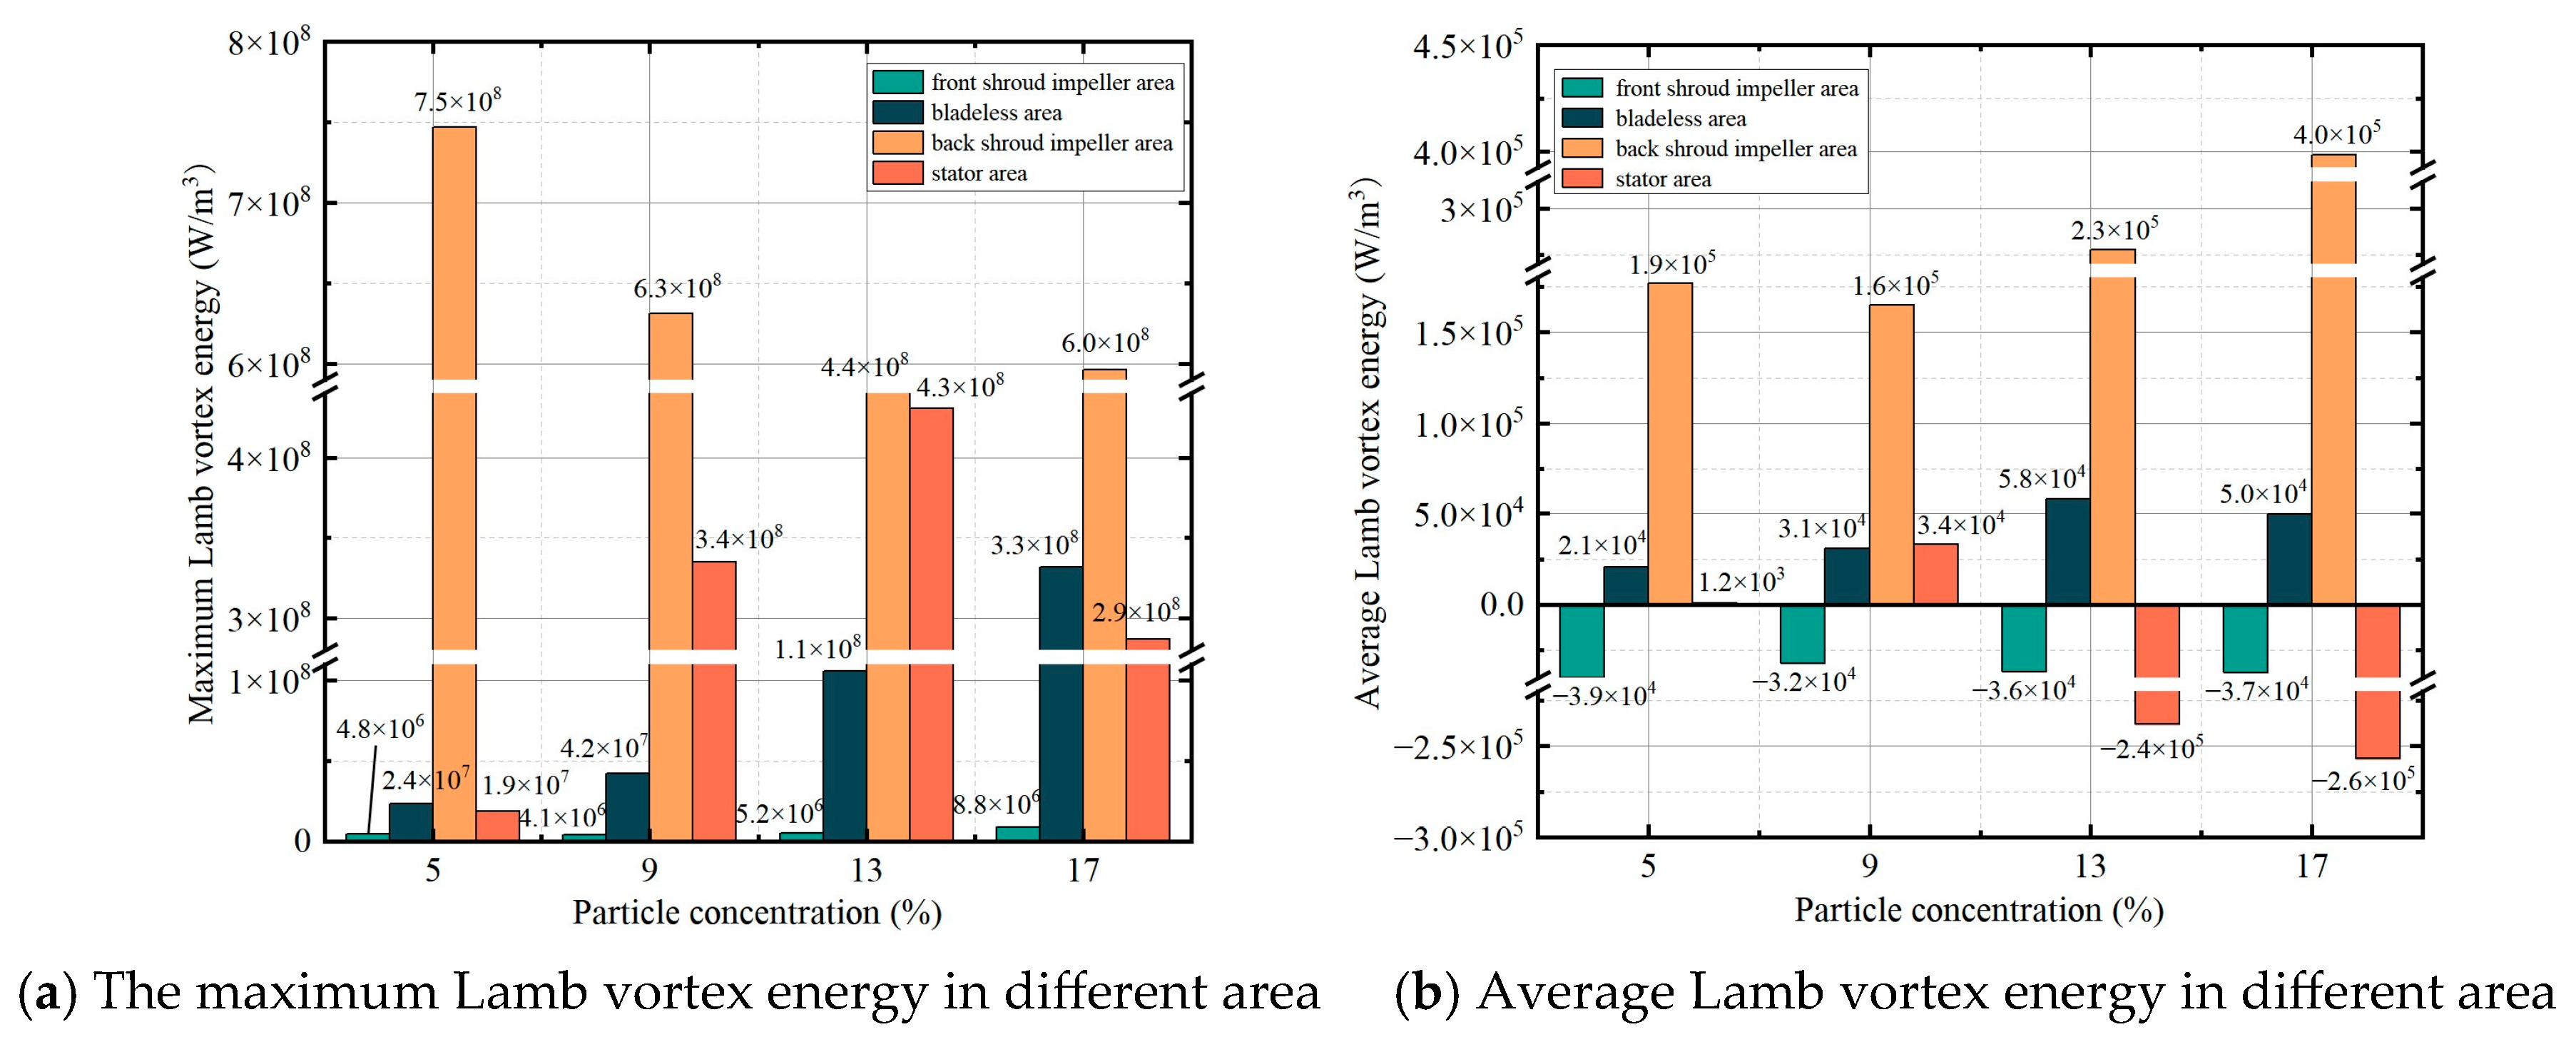
The energy parameters at three cross-sections of the impeller domain exhibit significant axial differentiation with increasing particle concentration, as shown in Figure 20, Figure 21 and Figure 22. For the front shroud and bladeless region, the high-value zones of shear rate and Lamb vortex energy continuously shrink and decline in magnitude. This is because solid particles suppress turbulent fluctuation in the front impeller region; near-wall particles reduce the velocity gradient and large-scale vortex generation. Only the inner boss of the bladeless region maintains a stable high Enstrophy zone due to flow recirculation. Compared with the above regions, parameters at the rear shroud decrease slightly. Enstrophy concentrates toward the blade pressure surface, and the proportion of high-dissipation zones rises from 28.3% to 47.9%. Affected by centrifugal force and wall friction, particles accumulate locally and aggravate flow inhomogeneity. This enhances the viscous dissipation of small-scale boundary-layer vortices, shifting the core energy dissipation of the impeller domain entirely toward the rear shroud under high particle concentrations.
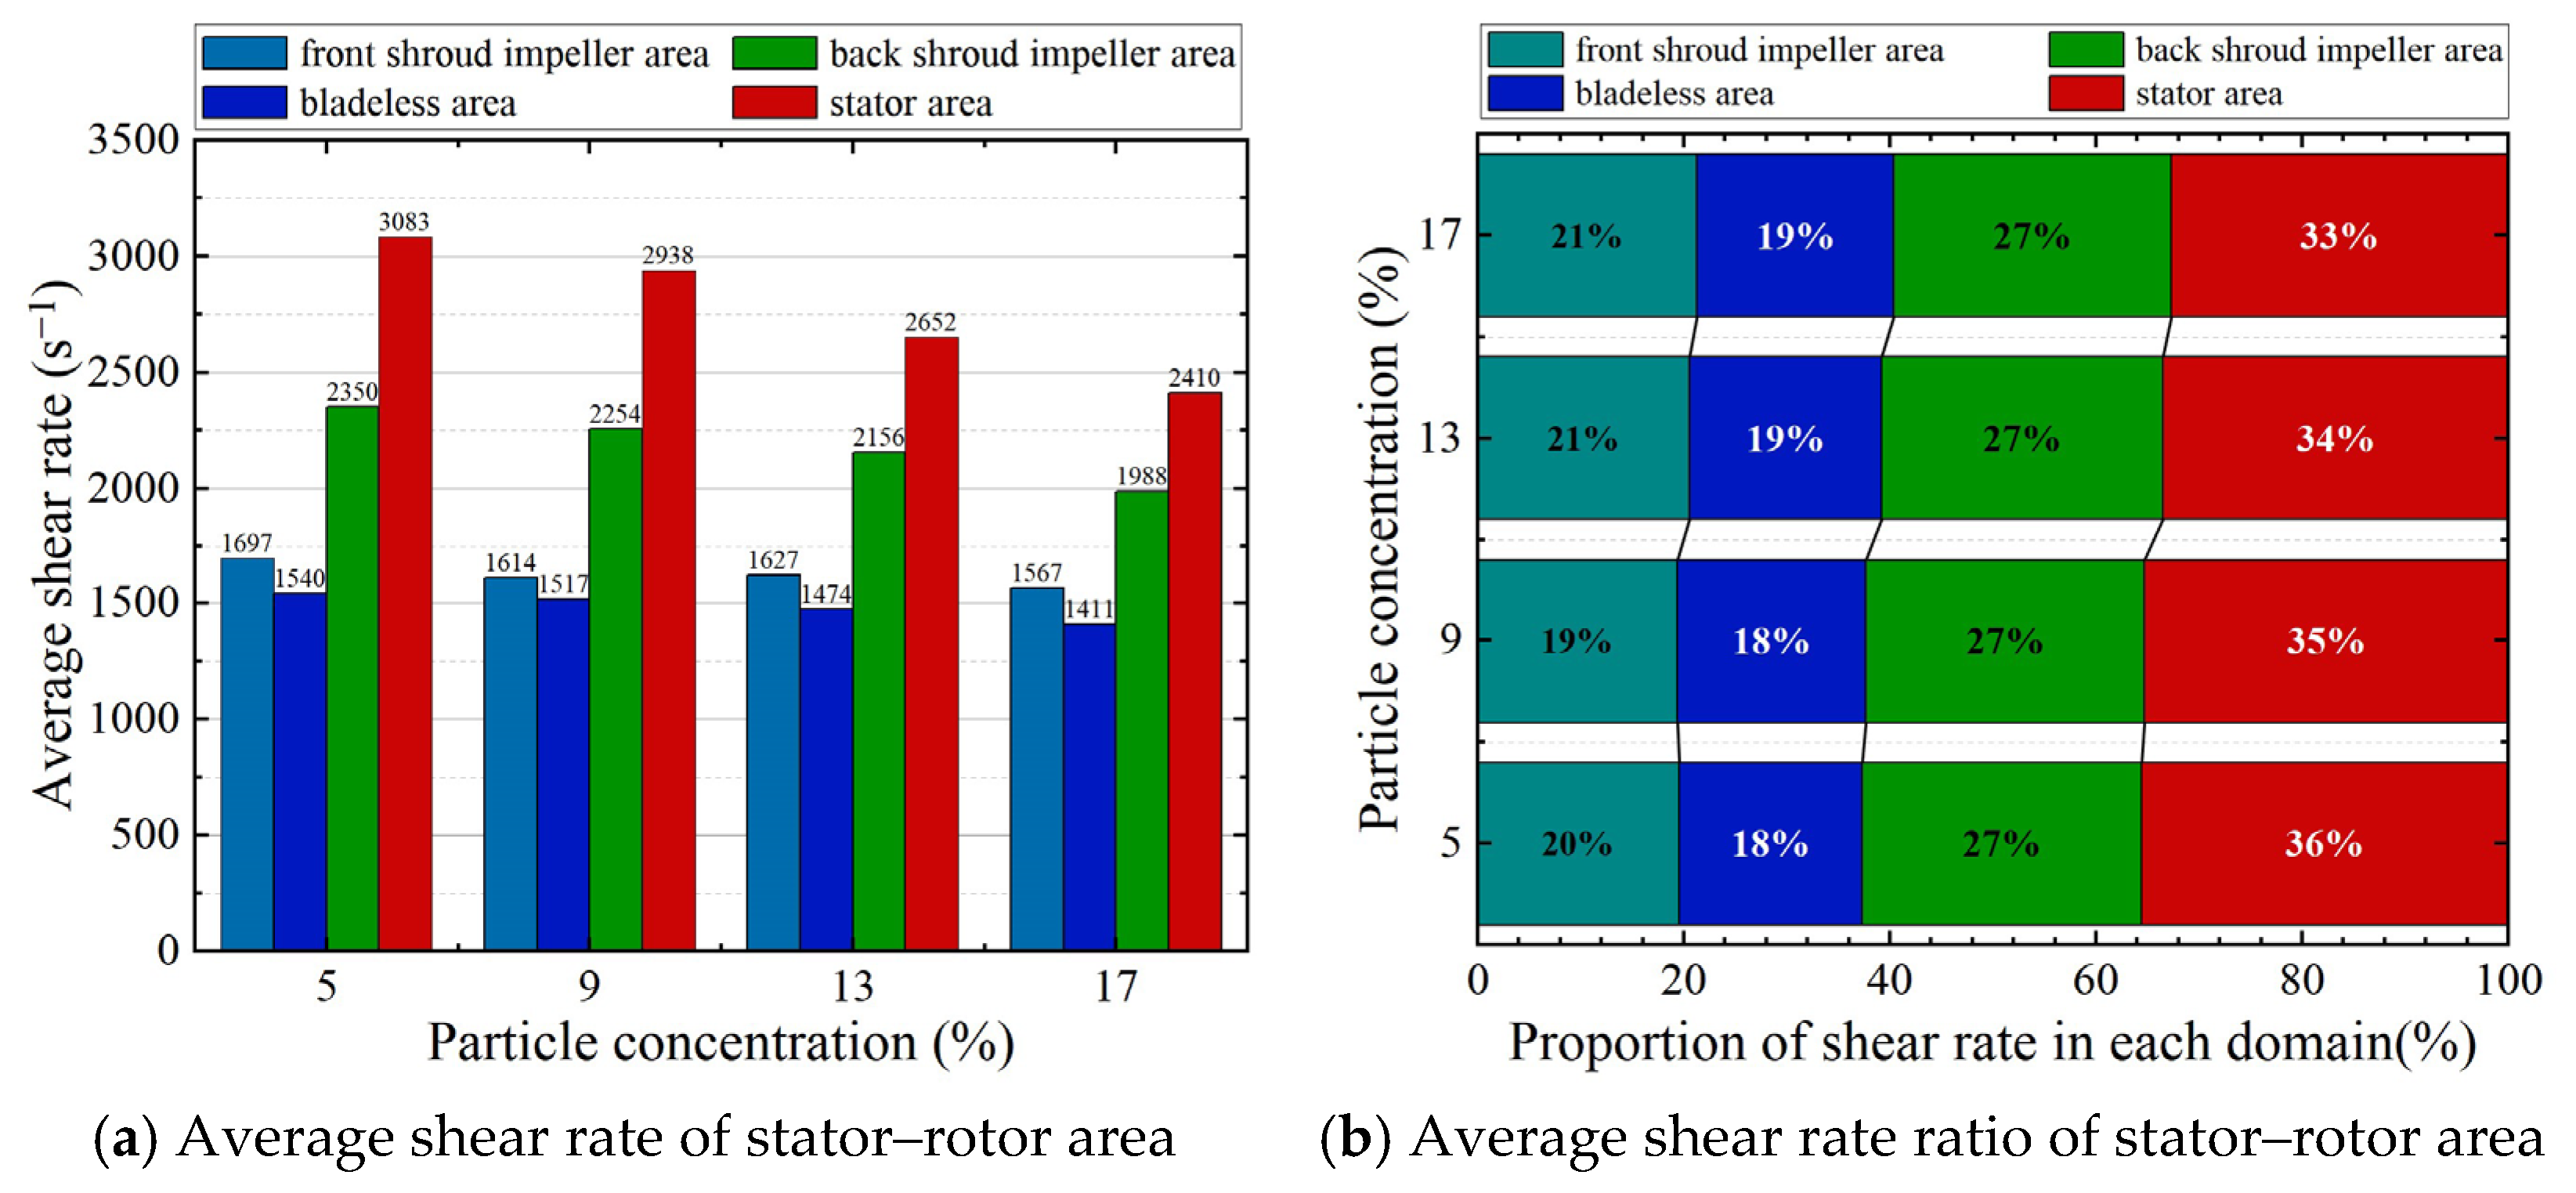
The shear rate decreases significantly with increasing particle concentration, with a more pronounced reduction in the stator area. As the concentration rises from 5% to 17%, the average shear rate of the full flow domain decreases from 3083 s−1 to 2410 s−1, a total reduction of 21.8%. The maximum reduction in shear rate in the stator domain reaches 9.73%, which is much higher than the range of 1.49–7.79% in the impeller domain. For every 4% increase in particle concentration, the proportion of shear rate in the stator domain decreases by 1 percentage point. The core shear area shifts from the stator area to the impeller area, weakening the shear function of the stator. The above variation characteristics are presented in Figure 23.
Increasing particle concentration globally suppresses Lamb vortex energy and induces its redistribution across flow domains. As the concentration rises from 5% to 17%, the average Lamb vortex energy of the full flow area decreases by 38.7%, and the area of high-vortex-energy regions shrinks continuously. At low concentrations, the back shroud impeller area possesses the maximum vortex energy of 7.5 × 10⁸ W/m3. When the concentration increases to 13%, the stator area dominates the flow field with a peak vortex energy of 4.4 × 10⁸ W/m3. Additionally, the vortex energy in the bladeless area grows steadily, rendering the overall vortex distribution more uniform. The above variation characteristics are illustrated in Figure 24.
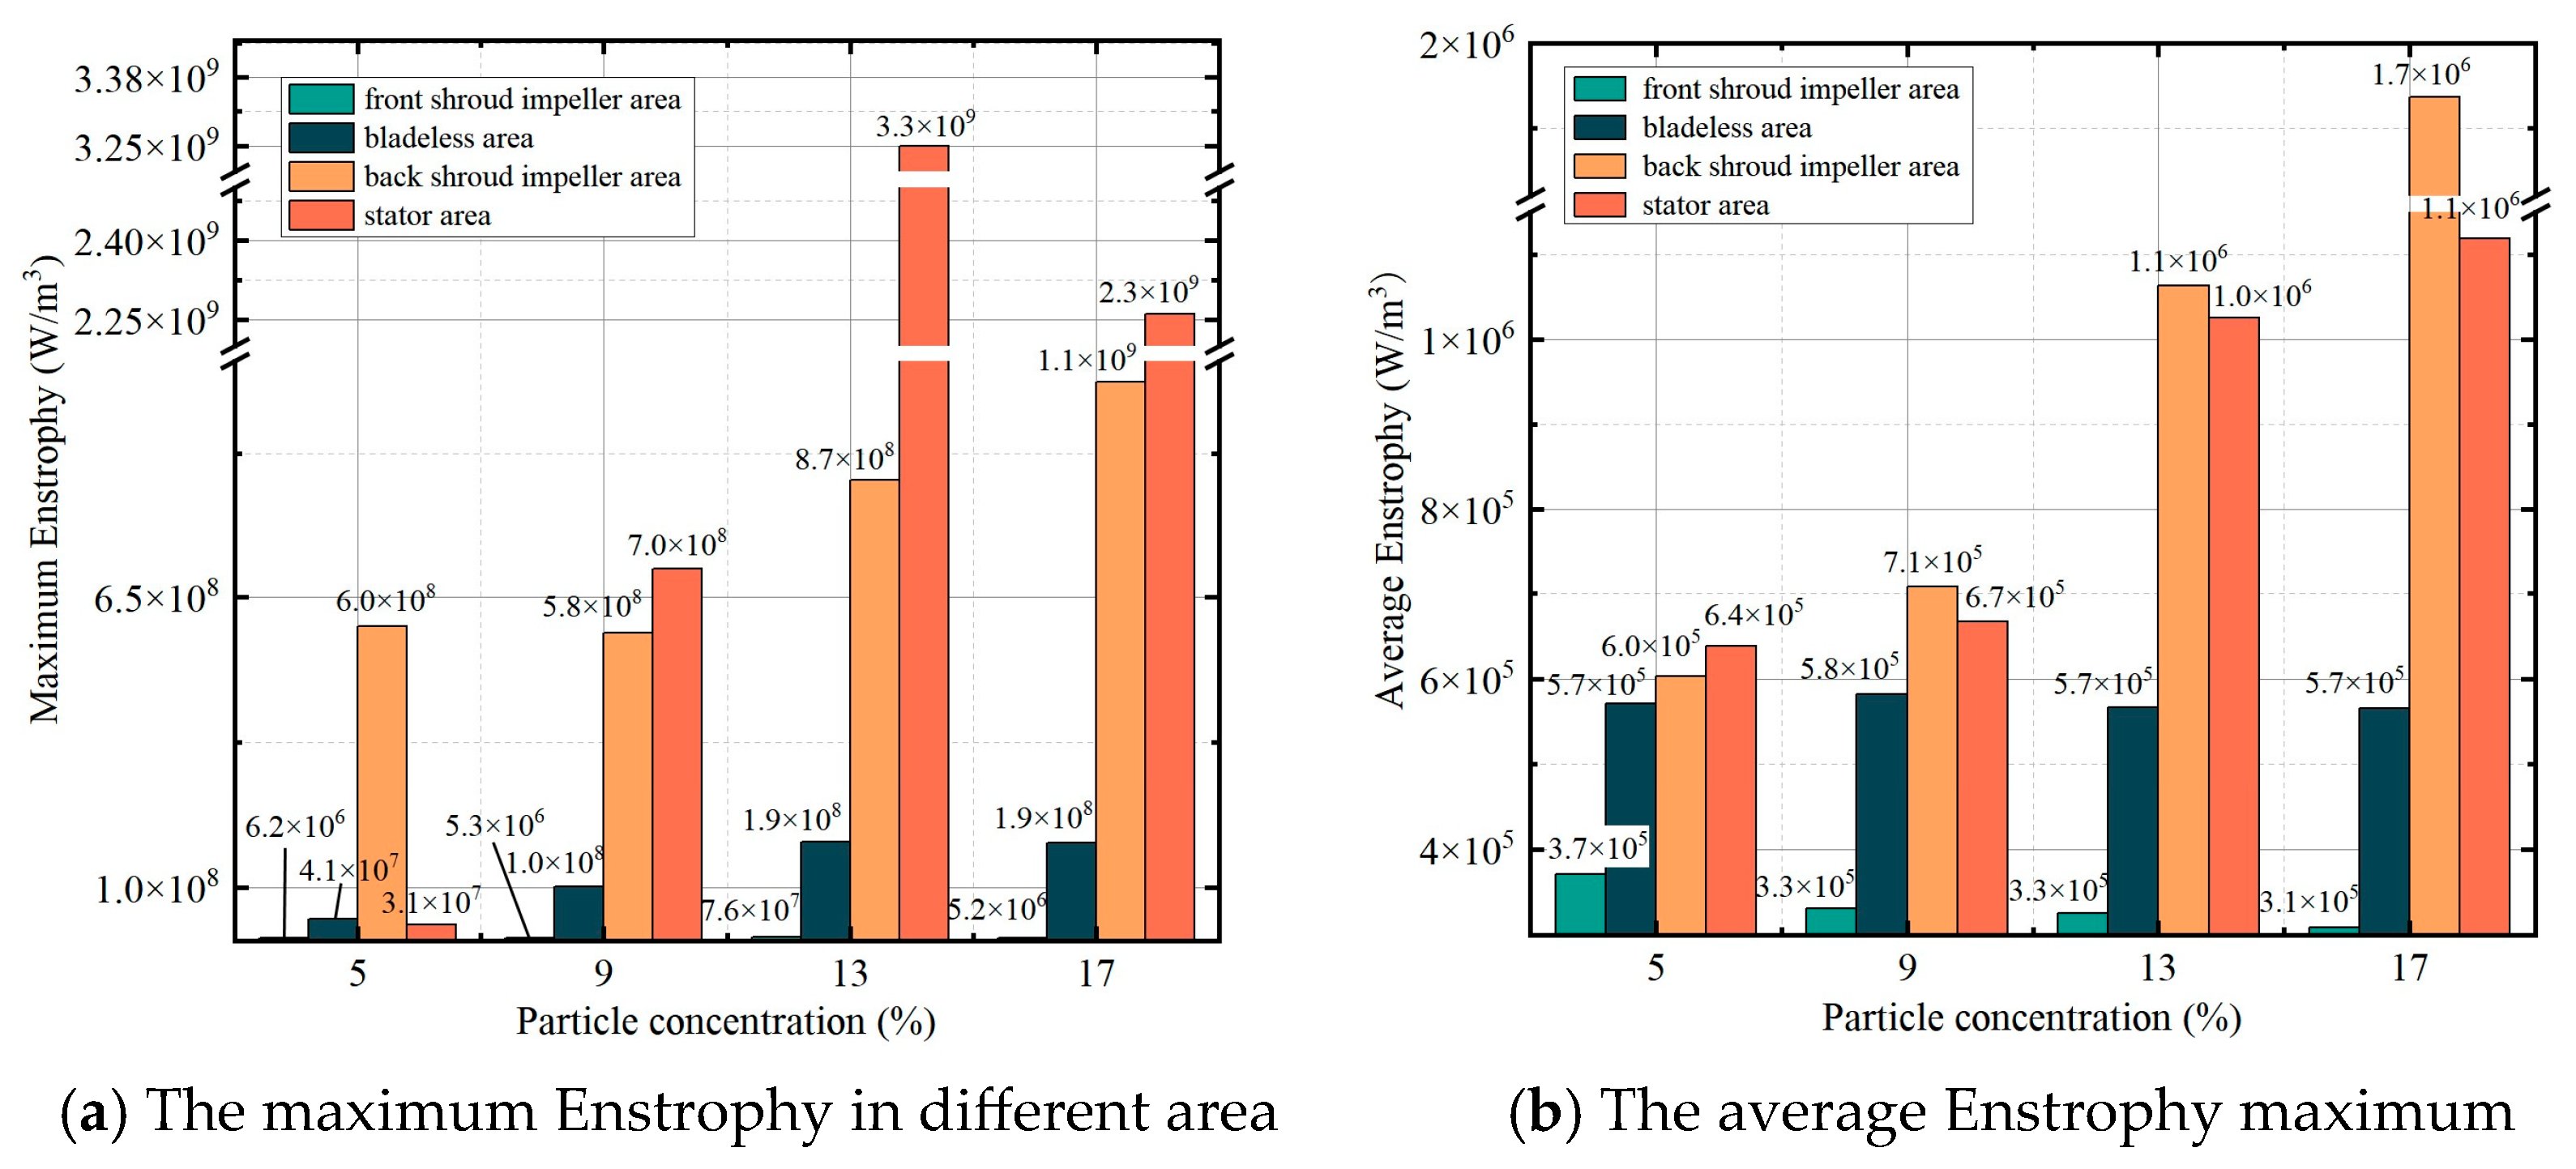
Enstrophy increases significantly with rising particle concentration, showing an opposite trend to the above two parameters. As the solid concentration increases from 5% to 17%, the spatially averaged Enstrophy of the full flow area rises by 47.2%, and the maximum Enstrophy in the stator area reaches 3.3 × 10⁹ W/m3 at the concentration of 13%. Although particles suppress the generation of large-scale vortices, they increase the effective viscosity of the fluid and induce numerous small-scale dissipative vortices, thereby enhancing viscous dissipation. Under high-concentration conditions, the combined proportion of Enstrophy in the stator area and rear shroud impeller area exceeds 76%, forming the core dissipation regions. The detailed variation rules are shown in Figure 25.
Combined with Table 3 and Figure 23, Figure 24 and Figure 25, as the solid volume fraction increases from 5% to 17%, the average full-domain shear rate decreases by 23.8% and the average Lamb vortex energy declines by 38.7%, while the average Enstrophy rises by 47.2%. Correspondingly, the Cv value of outlet mud increases continuously from 11.6% to 24.2% with an increment of 108.6%, indicating a dramatic deterioration of mud mixing uniformity. This demonstrates that the shear breaking capacity and mesoscopic mixing capacity of Lamb vortex energy serve as the essential prerequisites for uniform mud mixing under a high solid concentration. The enhanced microscopic dissipation of Enstrophy alone cannot compensate for the insufficient shear performance and large-scale vortex mixing, failing to break particle agglomeration. Therefore, coordinated improvement of these energy parameters is critical to achieve optimal mixing performance, which provides a theoretical basis for the structural optimization of mixers and on-site operating regulations.

3.3. Internal Driving Mechanism of Shear Rate–Lamb Vortex Energy–Enstrophy

3.3.1. Internal Correlation Theory of Shear–Vortex Energy Coupling

Shear rate, Lamb vortex energy and Enstrophy all originate from the velocity gradient of flow fields and possess rigorous derived relationships in fluid mechanics. As a quantitative indicator of fluid strain rate, shear rate directly characterizes the magnitude of the flow velocity gradient and acts as the dominant driving factor for vorticity generation. Both vorticity ω = × u and shear rate belong to the components of the velocity gradient tensor, presenting a linear positive correlation. Lamb vortex energy is defined as the divergence of the Lamb vector ω × V , which reflects the work capacity of vortex force induced by the coupling of vorticity and flow velocity. Its magnitude is directly determined by the total vorticity generated and driven by shear rate. Enstrophy ε ω 2 , correlated with the coupling effect of viscosity and vorticity, characterizes the kinetic energy dissipation. It dominates the energy cascade from large-scale to small-scale vortices and governs the microscopic mixing process, with its value proportional to the square of vorticity and indirectly quantified and driven by shear rate. These three parameters form a complete energy transfer chain: vorticity generation induced by shear, vortex energy transformation, and viscous dissipation. This serves as the core dynamic mechanism for solid–liquid two-phase mixing.

3.3.2. Quantitative Correlation Analysis of Shear Rate and Vortex Energy

The original 4 × 4 test groups were expanded to 6 × 6 groups to acquire six valid data points for pairwise parametric analysis. The mean shear rate, peak Lamb vortex energy and averaged Enstrophy were statistically extracted for three impeller cross-sections and the stator region. In this analysis, the domain maximum of Lamb vortex energy was adopted and scaled by 1/1000, while the mass-weighted average Enstrophy of the flow domain was processed with a scaling factor of 1/10. This treatment eliminates the statistical interference caused by magnitude differences among physical parameters. Subsequently, Pearson correlation analysis and univariate regression analysis were employed to quantitatively characterize the driving effect of shear rate on the two vortex energy indexes.
The Pearson correlation coefficient is calculated as:
r x y = i = 1 n ( x i x ¯ ) ( y i y ¯ ) i = 1 n ( x i x ¯ ) 2 i = 1 n ( y i y ¯ ) 2
where: rxy denotes the Pearson correlation coefficient between variable x and variable y, ranging from −1 to 1. A value closer to 1 in absolute magnitude indicates a stronger linear correlation; xi and yi are the i-th sample values of the two variables, respectively; x ¯ and y ¯ represent the sample mean of the two variables; and n is the total number of samples. A significance level of P < 0.001 is adopted as the criterion for extremely significant correlation.
For characterizing the linear response relationship between Lamb vortex energy and shear rate, a univariate linear regression model was established as follows:
Λ = a γ ˙ + b
where: Λ represents the Lamb vortex energy; γ ˙ is the shear rate, a is the regression coefficient, and b is the constant term.
For the nonlinear response characteristics between Enstrophy and shear rate, a quadratic regression model was established:
Ω = c γ ˙ 2 + d γ ˙ + e
where: Ω represents Enstrophy; c and d are regression coefficients; and e is the constant term.
Based on the sample data under all operating conditions, fitting was performed in two categories following the principles of linear fitting between shear rate and Lamb vortex energy as well as quadratic fitting between shear rate and Enstrophy. The core regression models are obtained as follows:
Univariate linear regression equation of shear rate and Lamb vortex energy under variable flow conditions:
Λ = 11.72 γ ˙ 18520 ,   R 2 = 0.623 ,   P > 0.05
Univariate quadratic regression equation of shear rate and Enstrophy under variable flow conditions:
Ω = 0.0128 γ ˙ 2 + 48.12 γ ˙ + 50200 ,   R 2 = 0.984 ,   P < 0.001
Univariate linear regression equation between shear rate and Lamb vortex energy under variable concentration conditions:
Λ = 2.87 γ ˙ + 215.6 ,   R 2 = 0.748 ,   P > 0.05
Univariate quadratic regression equation of shear rate and Enstrophy under variable concentration conditions:
Ω = 0.0812 γ ˙ 2 + 341.2 γ ˙ + 365000 ,   R 2 = 0.971 ,   P < 0.001
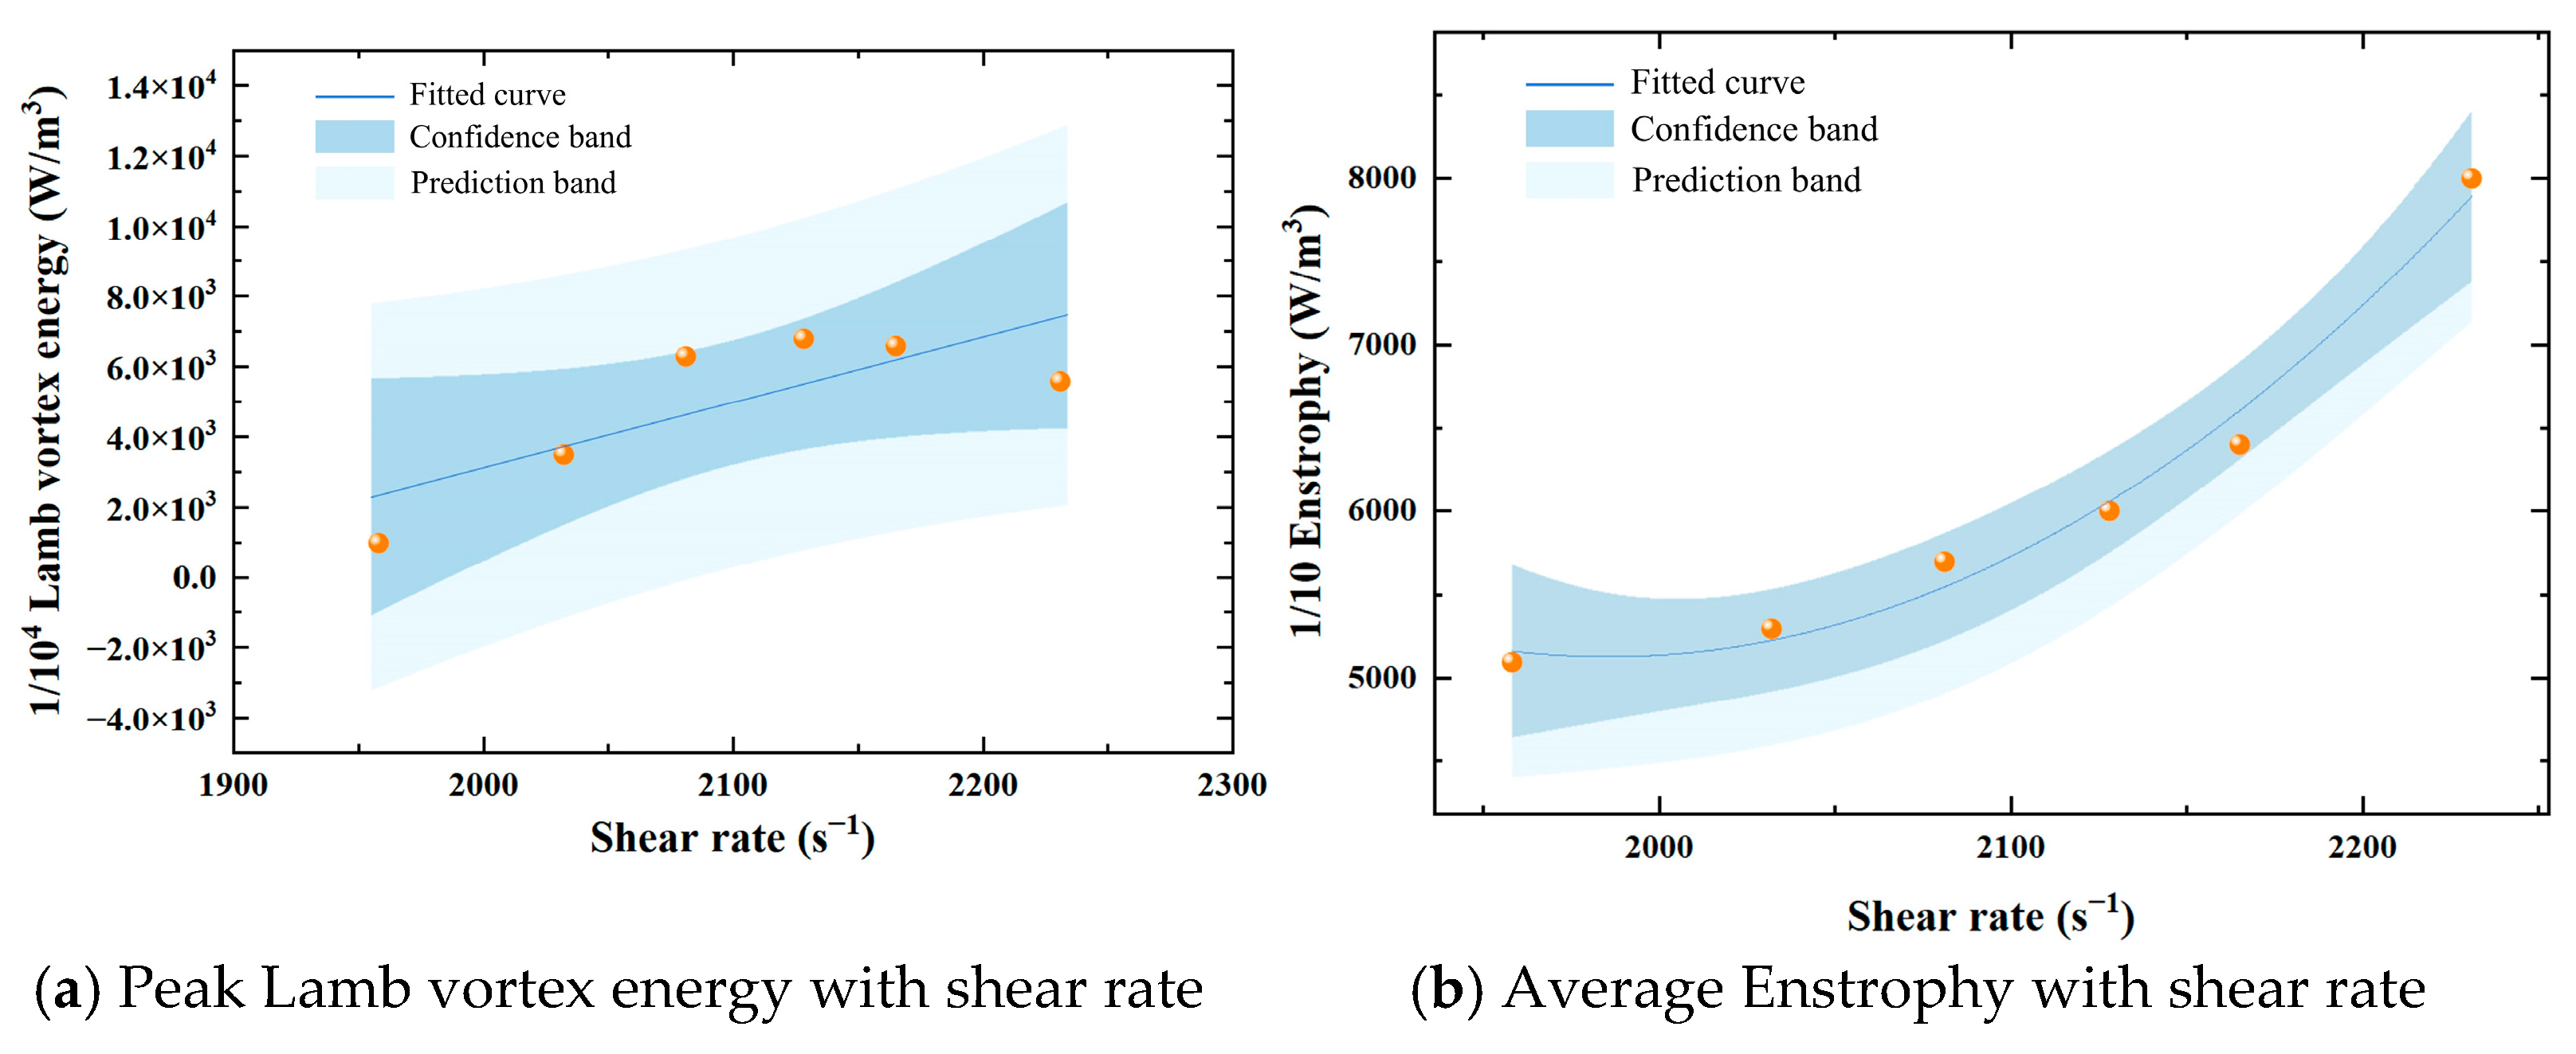
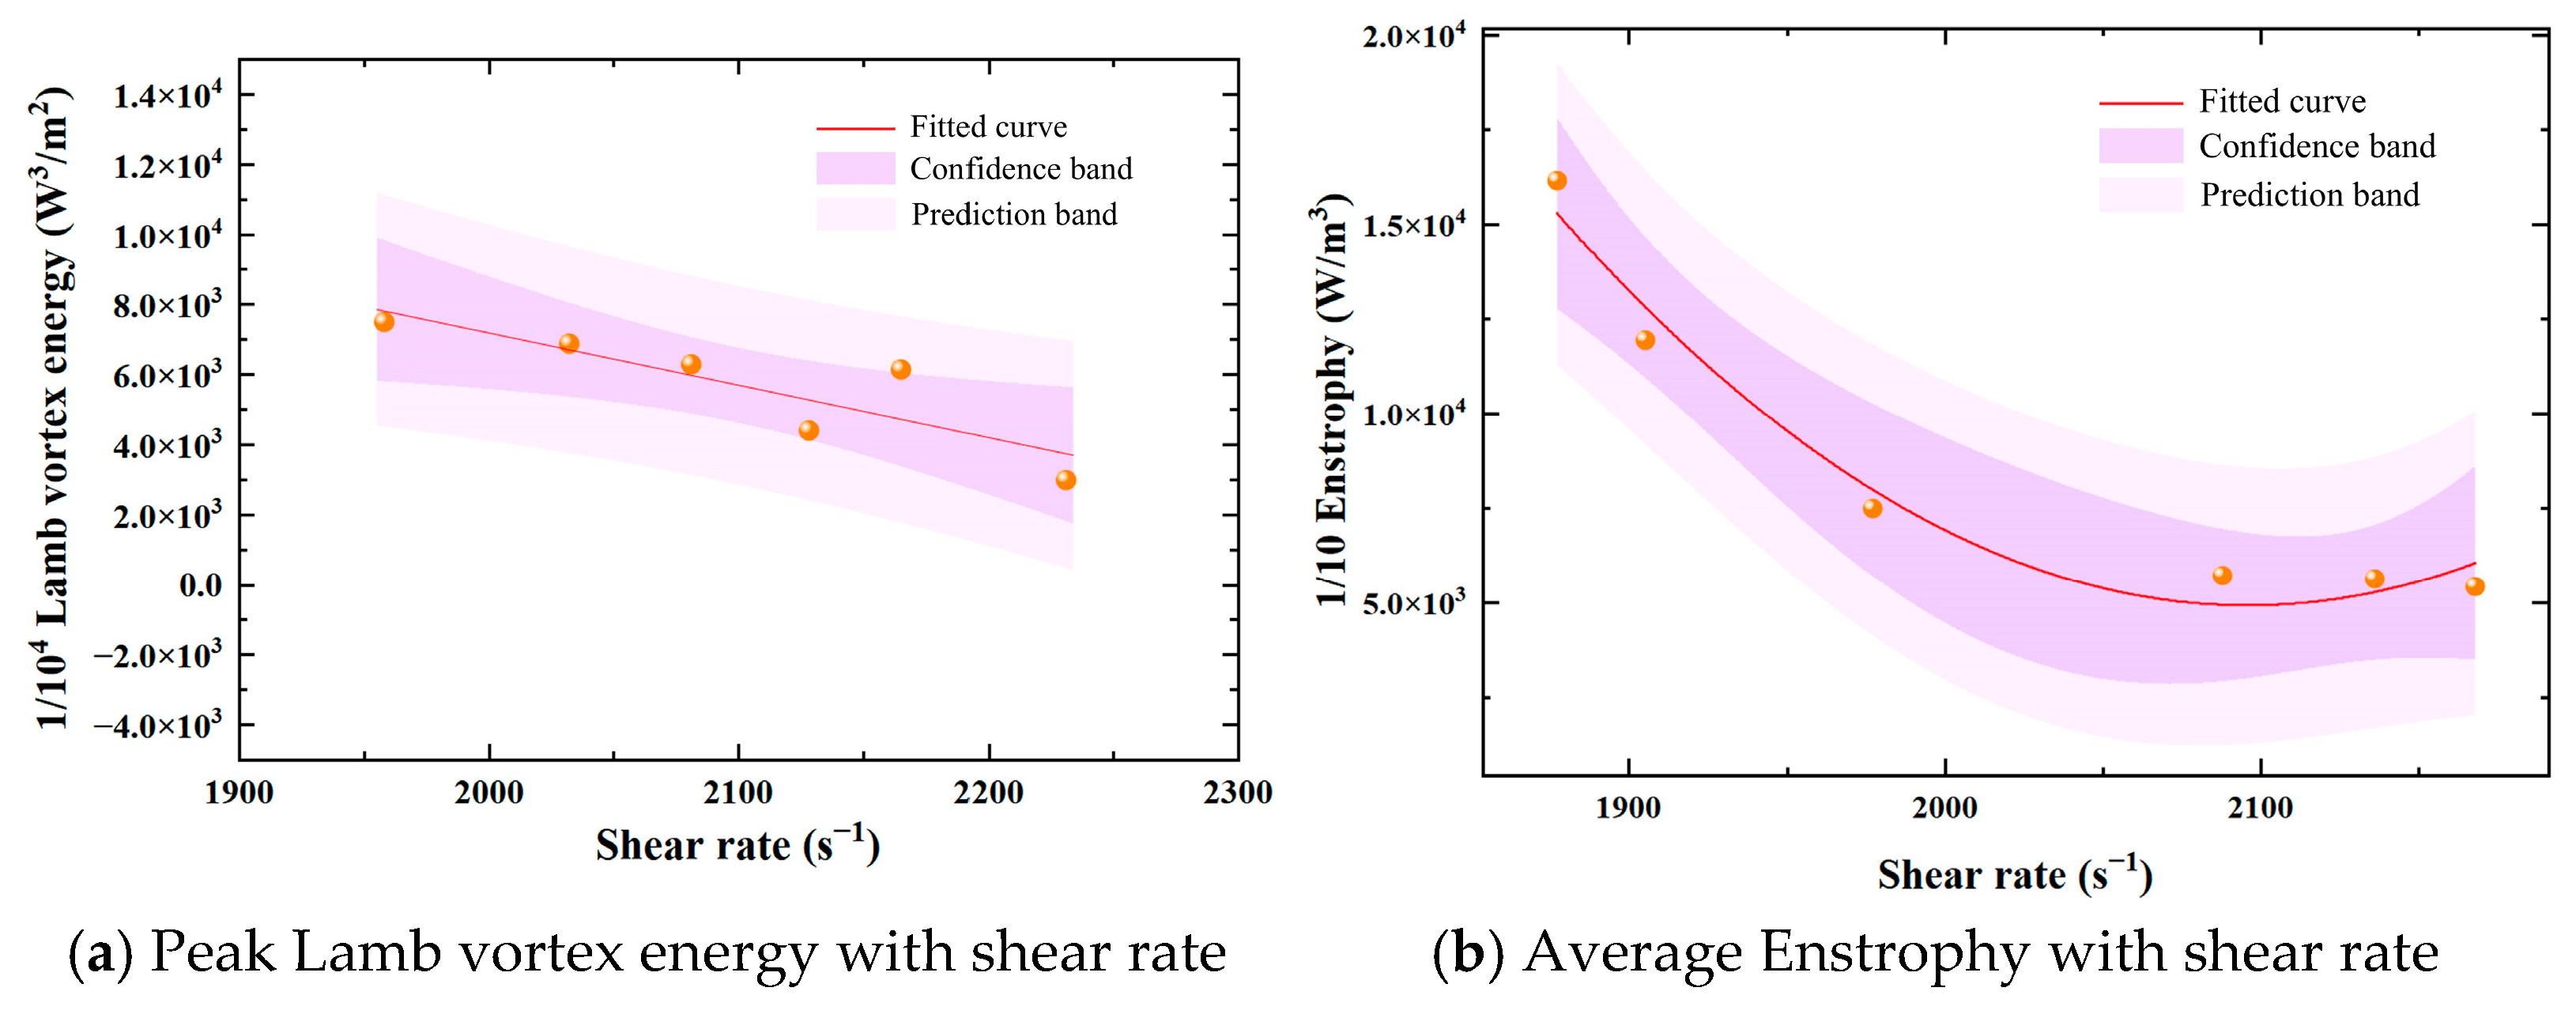
Statistical results show that the correlation coefficient between shear rate and Lamb vortex energy is 0.789, presenting a moderate positive correlation. The correlation coefficient between shear rate and Enstrophy is −0.985, indicating an extremely significant negative correlation. Essential differences exist in their coupling laws under variable flow and variable concentration conditions, which should be analyzed independently for each working condition.
Under variable flow rate conditions, as the flow rate increases, the shear rate rises from 1958 s−1 to 2231 s−1, with an increment of 13.9%. An extremely significant nonlinear correlation exists between shear rate and Enstrophy, and the coefficient of determination R2 reaches 0.984. The Enstrophy increases from 5 × 10⁴ W/m3 to 8 × 10⁴ W/m3, representing a growth rate of 56.9%, which indicates an intense nonlinear driving effect, as illustrated in Figure 26b. The linear correlation between shear rate and Lamb vortex energy is weak. The Lamb vortex energy rises first and then declines with the increase in shear rate, demonstrating that excessively high or low flow velocity inhibits vortex formation. The Lamb vortex energy reaches its peak value of 6.8 × 10⁷ W/m3 at the 1.2 Q condition with a shear rate of 2128 s−1, and the fitting curve is presented in Figure 26a.
Under variable solid concentration conditions, the shear rate decreases from 2168 s−1 to 1877 s−1 as the solid phase concentration increases, with a reduction of 13.4%. An extremely significant nonlinear correlation is observed between shear rate and Enstrophy, and the coefficient of determination R2 reaches 0.971. As the shear rate declines, the Enstrophy rises from 5.45 × 10⁴ W/m3 to 1.6175 × 10⁵ W/m3, corresponding to an increase of 196.8%, which indicates a prominent nonlinear reverse driving effect, as shown in Figure 27b. The correlation significance between shear rate and Lamb vortex energy is weak, suggesting that the formation of vortices is markedly influenced by particle concentration. Overall, the Lamb vortex energy presents a decreasing trend with the reduction in shear rate and reaches the trough value of 4.4 × 10⁷ W/m3 at the solid concentration of 17%, and the fitting curve is displayed in Figure 27a.
In summary, shear rate acts as the core governing parameter for Enstrophy, exhibiting an intense nonlinear driving effect under both variable flow rates and variable solid concentration conditions. By contrast, affected significantly by fluid residence time and particle inertial effects, Lamb vortex energy presents a weak linear correlation with shear rate. The linear model further demonstrates that the vortex generation capacity is distinctly influenced by flow velocity and solid particle concentration.

3.4. Performance Comparison Between Optimized Mixer and First-Generation Mixer and Its Engineering Application Value

The comparison of core structural parameters between the two generations of high-shear mixers is listed in Table 1. The first-generation mixer is not equipped with a stator, while the optimized mixer is newly fitted with a stator to form a 2 mm shear gap, which realizes the upgrading of the shear system. Meanwhile, the impeller diameter is reduced from 204 mm to 122 mm, and the volute diameter decreases from 250 mm to 180 mm. The overall volume of the equipment is reduced by 62.7%, achieving miniaturization and lightweight design. To meet the flow demand, the axial dimension is enlarged, the bladeless area is expanded, and the flow capacity is enhanced. Key structural parameters such as the blade shear angle and the height of the bladeless zone are synchronously optimized, which effectively reduces the flow dead zone and invalid energy loss. This provides a structural foundation for strengthening the coupling effect of shear and vortex energy and adapting to in situ installation in deep water.
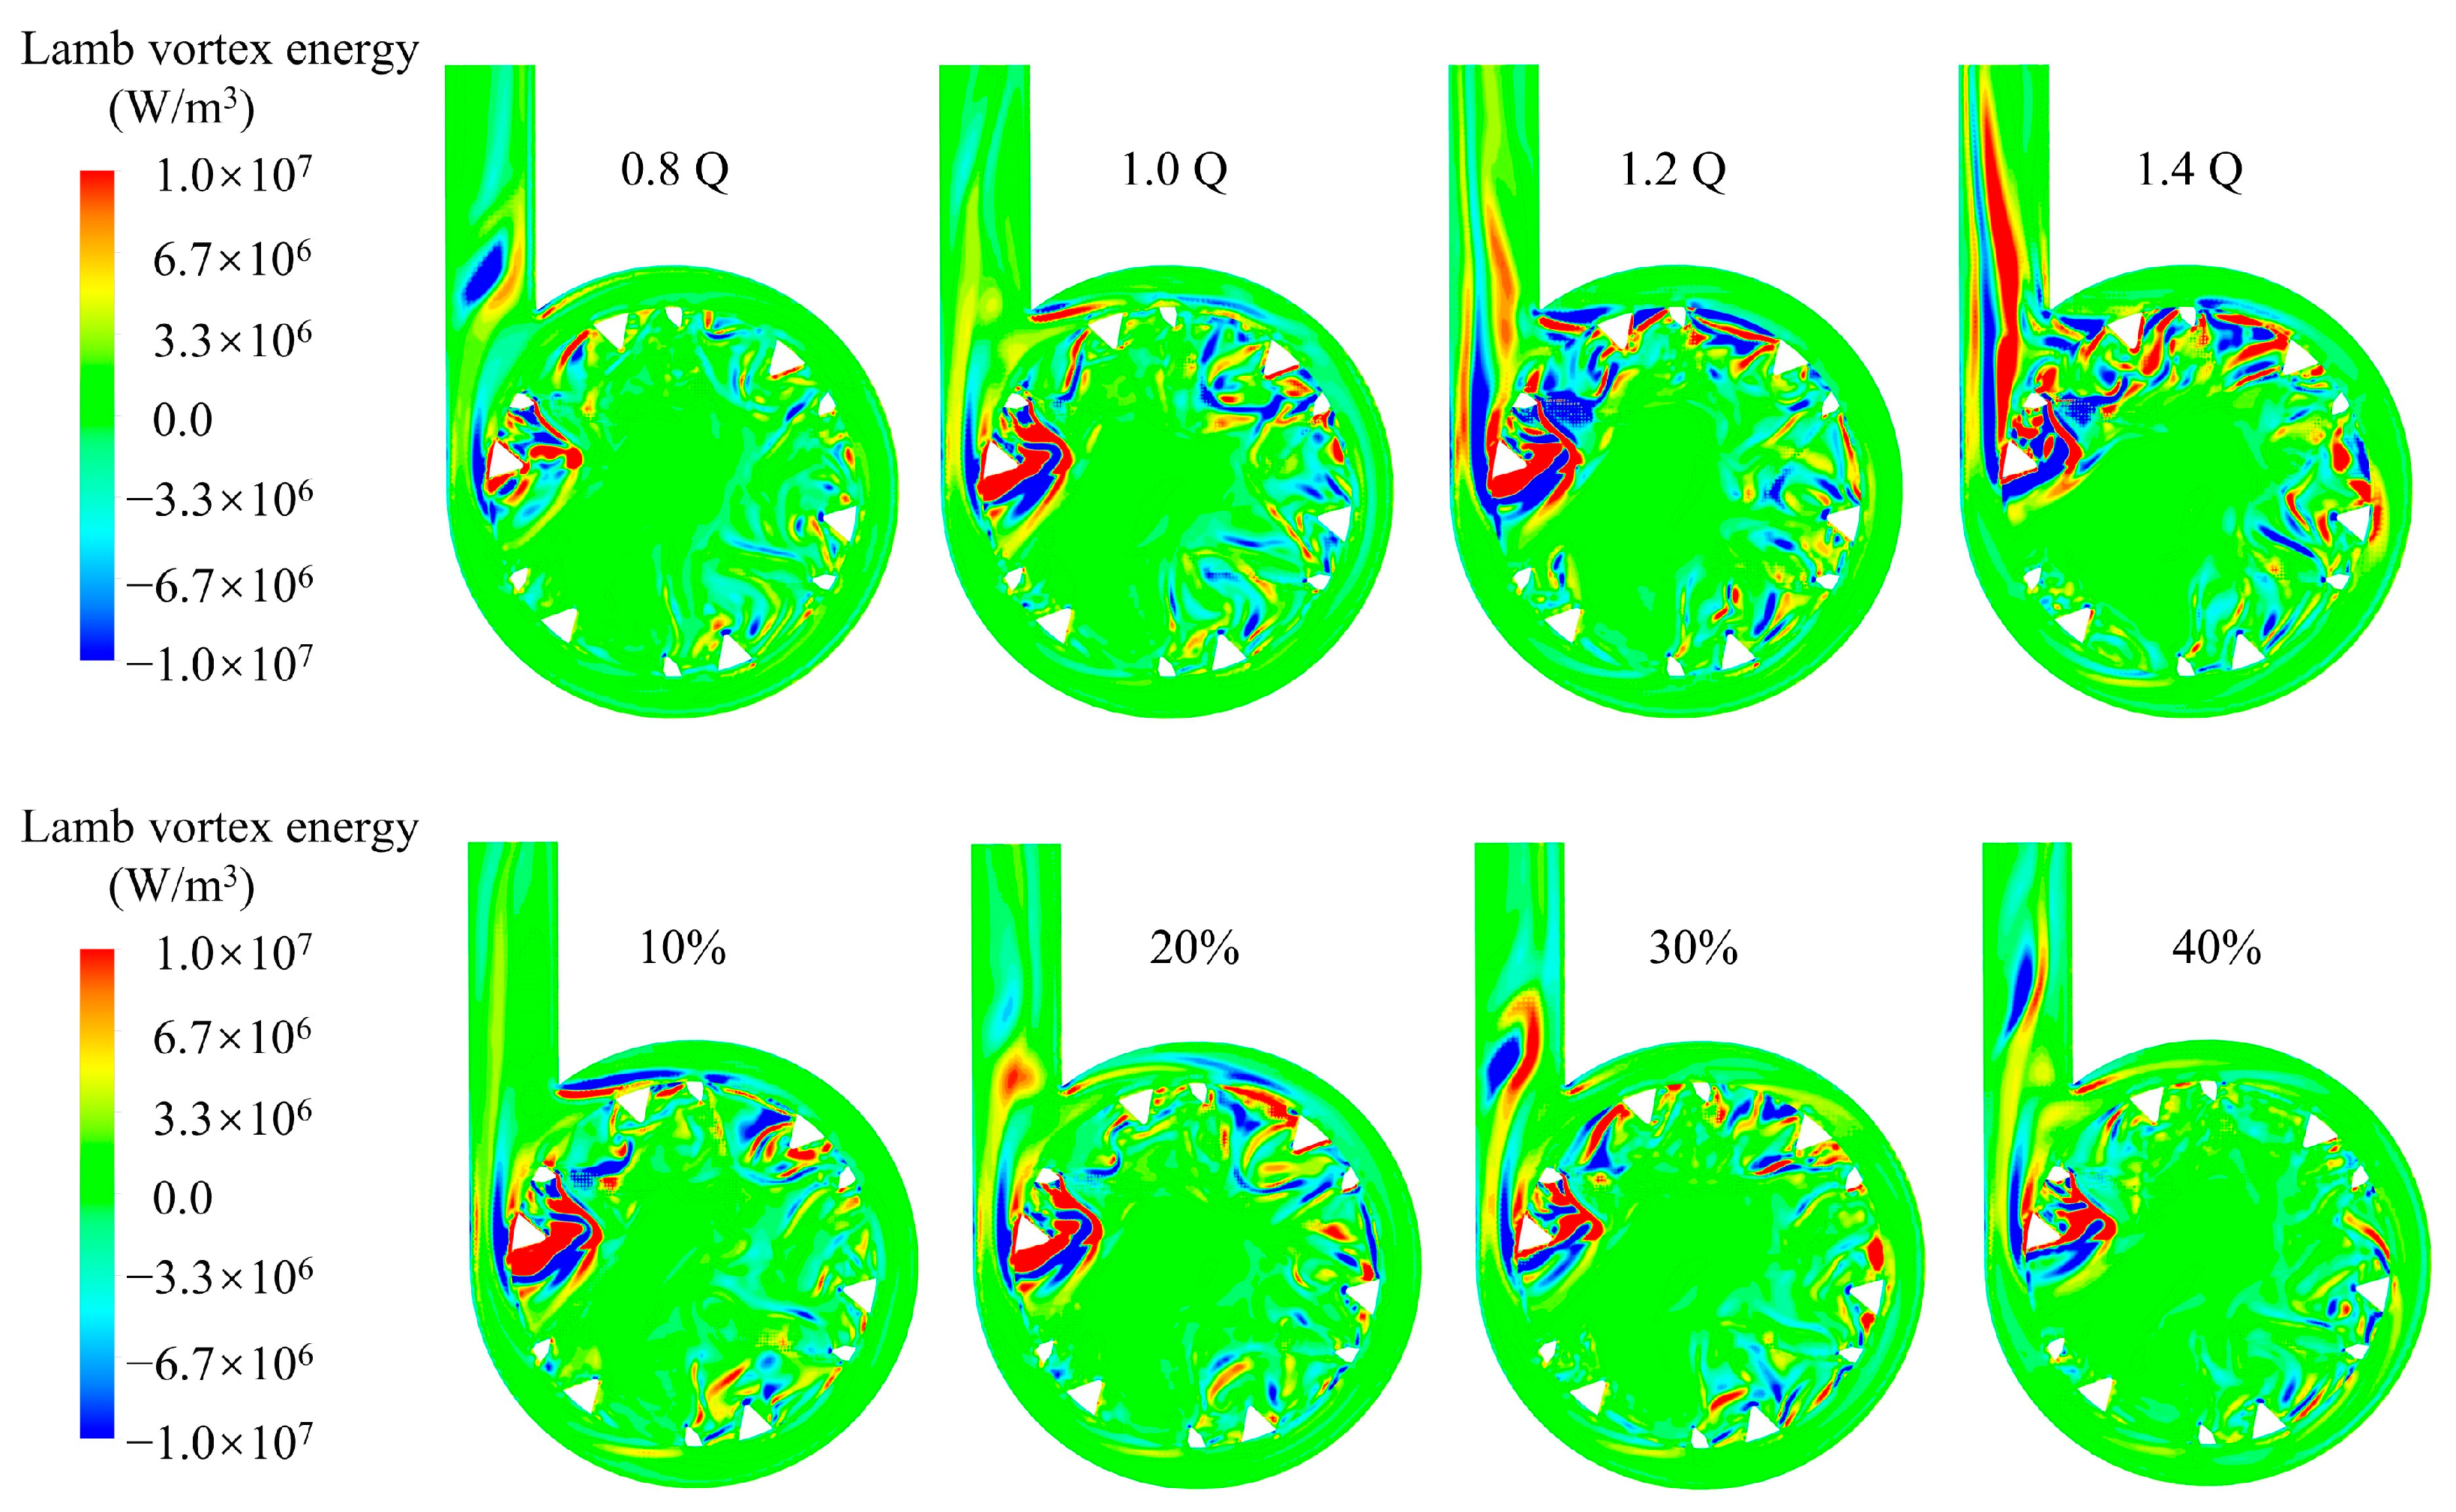
As illustrated in Figure 28, for the first-generation mixer, the high-value regions of Lamb vortex energy are sporadically distributed only in the blade wake and volute tongue with an agglomerated patch morphology. The inhomogeneity of spatial distribution over the entire flow field reaches 37.6%. In this structure, the Lamb vortex energy dissipates in a disordered manner. Despite the high vortex intensity, the energy utilization efficiency remains low, accompanied by weak shear performance, which fails to generate continuous mesoscopic mixing. As presented in Figure 11, for the optimized mixer, the high Lamb vortex energy regions are completely overlapped with the high-shear zones inside the rotor–stator gap, forming a continuous annular distribution along the circumferential direction. The coverage area of high-value regions increases by 71.5%, the overall flow field inhomogeneity decreases to 15.2%, and the Lamb vortex energy is enhanced by 8.6%. The intense shear within the rotor–stator gap synchronously drives vorticity generation, and the closed structure suppresses the fluid short-circuit flow, thereby significantly improving the global swirling mixing capacity.
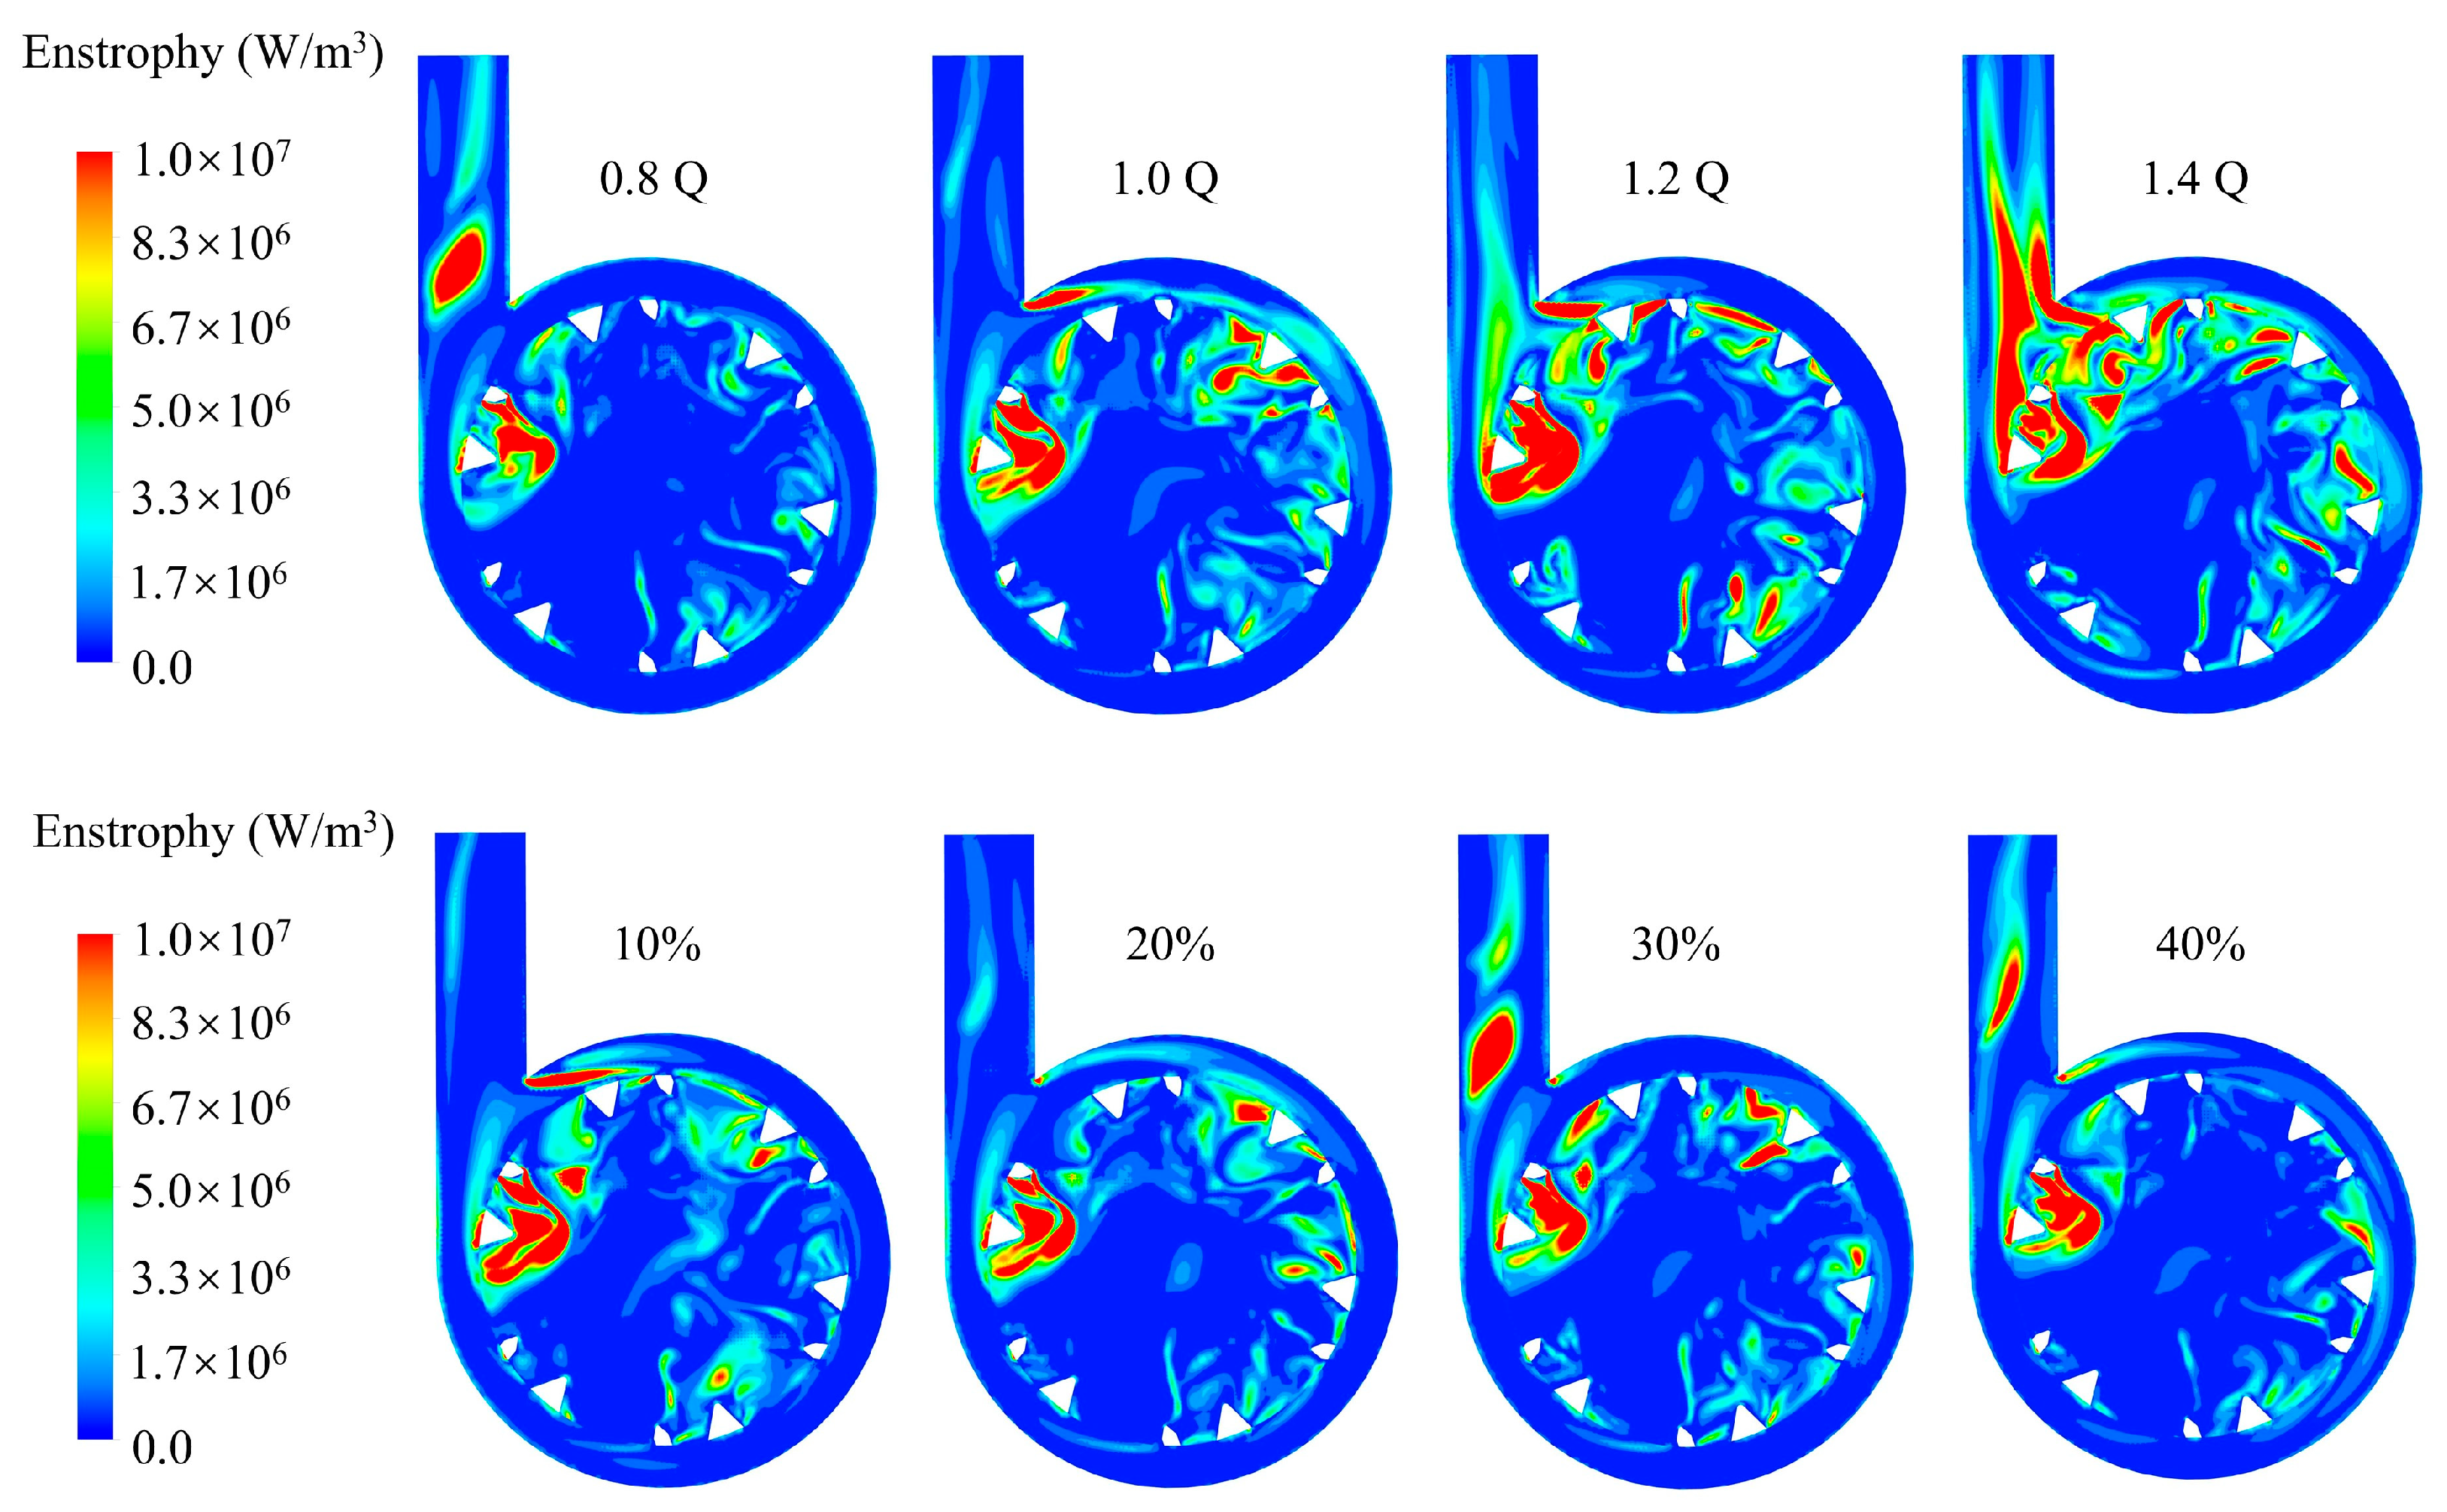
As illustrated in Figure 29, for the first-generation mixer, the high-Enstrophy regions are only locally concentrated at the blade tips and volute tongue, with a low coincidence degree with the high-shear zones. Shear energy cannot be effectively converted into the viscous dissipation energy required for microscopic hydration, leading to insufficient dissipation levels in most flow channels. As shown in Figure 18, for the optimized mixer, the circumferential coincidence degree between the high-Enstrophy regions, high-shear-rate zones, and high Lamb vortex energy zones reaches 94%, forming a complete energy transfer chain. Enstrophy diffuses from the gaps to the entire flow field, with the average Enstrophy increased by 18.9% and the peak Enstrophy increased by 11.1%. The combined rotor–stator structure promotes the cascade transfer of turbulent energy, enhances the microscopic mass transfer at the solid–liquid interface, and provides an energy guarantee for the full hydration of particles.
Both the first-generation and optimized high-shear mixers were tested under standard operating conditions: a volumetric flow rate of 13 m3/h, solid particle concentration of 9%, and rotational speed of 2900 rpm. The comparative key performance parameters are summarized in Table 3.
Table 3. Comparison of core performance between the first-generation and the optimized mixer.
Core PerformanceFirst-Generation MixerOptimized MixerOptimization Amplitude
Peak shear rate (s−1)12,01017,092+42.3%
Area-averaged shear rate (s−1)16172081+28.7%
Peak Lamb vortex energy (W/m3)5.8 × 1086.3 × 108+8.6%
Mean Enstrophy (W/m3)4.82 × 1055.73 × 105+18.9%
Peak Enstrophy (W/m3)6.3 × 1087 × 108+11.1%
Spraycoefficient of variation Cv (%)37.615.2−59.6%
The optimized miniaturized high-shear mixer equipped with a stator breaks through the technical bottleneck of in situ mixing and blending equipment for deepwater drilling, and adapts to the narrow installation space on the seabed. It maintains excellent mixing performance under high solid-phase operating conditions. The uniformity of mud mixing is improved over 50%, which effectively guarantees the safety of deepwater and deep hydrocarbon resource exploitation and enhances the production efficiency. The major structural optimizations include the addition of a modular stator to form an intensive shear gap, the modification of blade profile and shear angle, and the downsizing of the radial dimensions of the impeller and volute. These improvements realize the compact structural upgrading of the mixer.

4. Conclusions

This study focuses on the high-shear mixing equipment for deepwater drilling mud, based on the Eulerian solid–liquid two-phase flow numerical simulation method. Breaking through the limitation of the traditional single-energy perspective, an improved turbulent shear rate calculation model and a triple-energy-coupling analysis method (shear rate–Lamb vortex energy–Enstrophy) are adopted to systematically investigate the particle dispersion characteristics and energy conversion laws in the mixer under a variable flow rate and variable solid-phase concentration conditions. The performance differences between the first-generation mixer and the optimized mixer are compared and analyzed after the structural optimizations, including the addition of a stator, the optimization of the rotor–stator gap to 2 mm, the adjustment of the blade shear angle from 45° to 14.2°, and the miniaturization of radial dimensions. The intrinsic mechanism of mud mixing driven by the shear–vortex energy coupling is revealed, realizing the synergistic balance between shear mixing quality and efficiency. The main conclusions are as follows:
(1) Solid particles exhibit directional aggregation characteristics inside the mixer, which are mainly distributed in the volute domain, blade pressure surface and rear cover plate impeller domain. An increase in flow rate can significantly improve the treatment efficiency and output per unit time, whereas it aggravates particle segregation at the outlet section. When the solid phase concentration rises from 5% to 17%, the coefficient of variation (Cv) of outlet mud increases from 11.6% to 24.2%, indicating a remarkable deterioration of mixing uniformity. The stator structure and rotor–stator shear gap serve as the core factors regulating particle dispersion and flow field energy distribution. Under high-concentration conditions, the core shear region transfers from the stator domain to the impeller domain.
(2) The high-value regions of shear rate, Lamb vortex energy and Enstrophy inside the mixer are highly overlapped, and are mainly concentrated in the rotor–stator gap domain. The energy parameters in the impeller domain near the rear cover plate are significantly higher than those in other flow regions and present the most sensitive response to operating condition variations. The increase in flow rate linearly elevates the global shear rate and vortex energy, with the peak shear rate reaching 17,092 s−1. The rising solid phase concentration inhibits the generation of shear rate and Lamb vortex energy, whereas it enhances Enstrophy dissipation by increasing fluid viscosity, resulting in an obvious operating-condition-dependent distribution of flow energy. A weak positive correlation exists between shear rate and Lamb vortex energy, while a significant negative correlation is observed between shear rate and Enstrophy. This indicates that the vortex structure is strongly affected by flow velocity, and viscous dissipation has an extremely close correlation with particle concentration.
(3) By adding a closed-type stator structure, the optimized mixer establishes a stable and strong shear gap, which transforms the energy dissipation from the localized concentration at the volute tongue of the first-generation mixer to a uniform circumferential distribution over the entire flow field. The peak shear rate is increased by 42.3%, the peak values of Lamb vortex energy and Enstrophy are increased by 8.6% and 11.1% respectively, and the Cv value of the outlet mud is decreased by 59.6%. On the premise of reducing energy consumption, the optimized mixer further balances the shear quality and mixing efficiency of the mixer.
In summary, the uniformity and rheological stability of the mud mixture are improved by more than 50%, and the energy consumption for mixing is reduced by more than 15%. This effectively reduces the rate of solid phase sedimentation and complex downhole accidents, and adapts to the narrow space and efficient operation requirements of subsea in situ mixing. The optimized equipment provides reliable equipment support for deepwater drilling operations. However, this study still has certain limitations: only steady-state numerical simulation is carried out, and the effects of temperature, fluid viscosity, and long-term equipment wear on the energy-coupling mechanism are not considered, and there is a lack of on-site durability tests of full-scale prototypes. In the future, transient flow field and multi-physical field coupling analysis can be carried out to further explore the energy conversion mechanism under extreme working conditions, and on-site sea trials and structural durability optimization can be carried out to further expand the application scope of the equipment in deep-sea drilling engineering. The energy-coupling analysis method and structural optimization scheme constructed in this study can provide core theoretical and technical support for the design and upgrading of deep-sea drilling mixing equipment.

Author Contributions

Conceptualization, Y.P.; software L.K. and L.Z.; validation, L.K., J.Z. and L.Z.; formal analysis, Y.P. and X.L.; visualization, L.K. and J.Z.; methodology, L.K. and Y.L.; investigation, Y.P. and L.K.; funding acquisition, Y.P.; writing original draft, Y.P., L.K., X.L. and L.Z.; writing and editing, Y.P.; review and editing, Y.P. and J.Z.; supervision, Y.P. All authors have read and agreed to the published version of the manuscript.

Funding

This study was supported by the National Natural Science Foundation of China Youth Fund [52304004], State Key Laboratory of Oil and Gas Reservoir Geology and Exploitation Special Open Fund—Sichuan Province Geothermal Resources Development and Comprehensive Utilization Industry–Education Integration Demonstration Project [CDUT-CJRH2025], Central Guiding Local Science and Technology Development Special Project in Sichuan Province [2024ZYD0122], Organized scientific research major project of Tianfu Yongxing Laboratory [2023KJGG13], The Ministry of Education’s Industry University Cooperation Collaborative Education Project [231106517275657], and National Science and Technology Major Project of China [2024ZD1406500].

Data Availability Statement

The original contributions presented in this study are included in the article. Further inquiries can be directed to the corresponding author.

Conflicts of Interest

The authors declare no conflicts of interest.

References

  1. Chen, Q.; Deng, Q.; Tan, L.C.; Qi, G.; Zhang, J. Status and Prospects of Dual-Gradient Drilling Technologies in Deep-Water Wells. Front. Energy Res. 2022, 10, 920178. [Google Scholar] [CrossRef] [Scilit]
  2. Qi, R.R.; Lu, H.F.; Sha, Z.B. Dual-Gradient Drilling and Riserless Mud Recovery Technology: A Review of Principles, Progress, and Challenges. J. Mar. Sci. Eng. 2026, 14, 535. [Google Scholar] [CrossRef] [Scilit]
  3. Yang, D.Q.; Khan, M.A.; Liao, B.; Shi, X.; Lv, K.; Sun, J.; Liu, C.; Li, M.-C. Cellulose nanofibers as anti-sagging agents in water-based drilling fluids. Int. J. Biol. Macromol. 2025, 322, 146779. [Google Scholar] [CrossRef] [Scilit] [PubMed]
  4. Knez, D.; Khalilidermani, M. A Review of Different Aspects of Off-Earth Drilling. Energies 2021, 14, 7351. [Google Scholar] [CrossRef] [Scilit]
  5. Badr, S.B.; Mohammed, B.; Mohamed, M.; Patil, S.; Mohamed, A.; Elkatatny, S. Effect of Arenite, Calcareous, Argillaceous, and Ferruginous Sandstone Cuttings on Filter Cake and Drilling Fluid Properties in Horizontal Wells. Geofluids 2019, 2019, 1956715. [Google Scholar] [CrossRef] [Scilit]
  6. Debnath, M.; Salem, K.S.; Naithani, V.; Musten, E.; Hubbe, M.A.; Pal, L. Soft mechanical treatments of recycled fibers using a high-shear homogenizer for tissue and hygiene products. Cellulose 2021, 28, 7981–7994. [Google Scholar] [CrossRef] [Scilit]
  7. Ping, X.L.; Zhang, J.Q.; Han, G.Q.; Chang, J.; Wang, H. Study on the Multiphase Flow Behavior in Jet Pump Drainage and Natural Gas Hydrate Production Wells with Combined Depressurization and Thermal Stimulation Method. Energies 2024, 17, 3842. [Google Scholar] [CrossRef] [Scilit]
  8. Zhang, J.L.; Xu, S.Q.; Wei, L. High shear mixers: A review of typical applications and studies on power draw, flow pattern, energy dissipation and transfer properties. Chem. Eng. Process. Process Intensif. 2012, 57–58, 25–41. [Google Scholar] [CrossRef] [Scilit]
  9. Huang, S.; Su, X.H.; Qiu, G.Q. Transient numerical simulation for solid-liquid flow in a centrifugal pump by DEM-CFD coupling. Eng. Appl. Comput. Fluid Mech. 2015, 9, 411–418. [Google Scholar] [CrossRef] [Scilit]
  10. Li, Y.; Li, Z.Y.; Liang, K.S. Simulation and Experimental Study of Degradation of Polymetallic Nodules in Deep-Sea Multi-Stage Lifting Motor Pump. J. Mar. Sci. Eng. 2022, 11, 24. [Google Scholar] [CrossRef] [Scilit]
  11. Guo, J.H.; Liu, Y.D.; Shan, G.X.; Li, H.; Li, W.; Qin, H.; Xia, J.; Wu, J.; Zhang, J. The structure-effect relationship between inline high shear mixers and micromixing: Experiment and CFD simulation. Chem. Eng. Sci. 2023, 272, 118605. [Google Scholar] [CrossRef] [Scilit]
  12. Yang, X.H.; Guo, J.H.; Zhao, S.C.; Xia, J.; Zhang, J. High shear mixer works as a heat exchanger enhancing the liquid–liquid direct contact heat transfer. Int. J. Heat Mass Transf. 2023, 200, 123547. [Google Scholar] [CrossRef] [Scilit]
  13. Ma, K.K.; Guo, J.H.; Zhao, S.C.; Zhang, J. An experimental study of localized flow pattern, strain rate and turbulence kinetic energy dissipation rate of in-line teethed high shear mixer with different rotor and stator structures. Chem. Eng. Sci. 2024, 287, 287119742. [Google Scholar] [CrossRef] [Scilit]
  14. Sisodia, S.M.; Rajak, K.D.; Pathak, K.A.; Guria, C. An improved estimation of shear rate for yield stress fluids using rotating concentric cylinder Fann viscometer. J. Pet. Sci. Eng. 2014, 125, 125247–125255. [Google Scholar] [CrossRef] [Scilit]
  15. Boston, M.L.; Derksen, J.; Majumder, A. An optimisation framework for minimising power consumption, dead volume, and shear rate of mixing tanks containing shear-thinning fluids utilising CFD. Chem. Eng. Res. Des. 2025, 223, 223263–223279. [Google Scholar] [CrossRef] [Scilit]
  16. Vashisth, V.; Kumar, V. Effect of stator geometries on flow fields and mixing performance for viscous fluids. Chem. Eng. Process.-Process Intensif. 2022, 180, 108595. [Google Scholar] [CrossRef] [Scilit]
  17. Zhao, S.C.; Li, W.; Zhang, J.L. Investigation of the temporal and spatial flow features within the high-shear mixer by modal decomposition techniques. AIChE J. 2022, 69, e17967. [Google Scholar] [CrossRef] [Scilit]
  18. Ma, K.K.; Guo, J.H.; Wu, J.J.X.; Zhao, S.; Zhang, J. Hydrodynamic investigation of an inline teethed high shear mixer across fluid viscosity ranges. Chem. Eng. Sci. 2026, 324, 123364. [Google Scholar] [CrossRef] [Scilit]
  19. Xing, B.J.; Liu, Y.D.; Li, W.; Liu, G.; Zhang, J. Particles deagglomeration kinetics driven by high-shear and model prediction in a high shear mixer. Chem. Eng. J. 2026, 531, 174018. [Google Scholar] [CrossRef] [Scilit]
  20. Truesdell, C.A. The Kinematics of Vorticity; Indiana University Press: Bloomington, IN, USA, 1954. [Google Scholar]
  21. Wu, J.; Lu, X.; Zhuang, L. Integral force acting on a body due to local flow structures. J. Fluid Mech. 2007, 576, 265–286. [Google Scholar] [CrossRef] [Scilit]
  22. Tang, X.; Liu, Z.; Zhao, M.; Yang, H.; Jiang, W.; Wang, Y.; Chen, D. Analysis of Unsteady Flow Characteristics of Centrifugal Pump under Part Load Based on DDES Turbulence Model. Shock Vibration 2021, 2021, 9970800. [Google Scholar] [CrossRef] [Scilit]
  23. Wang, Y.Q.; Li, C. Research on the flow characteristics and energy variation characteristics of the outlet passage of a two-way flow pump device based on Liutex and energy balance equation method. Energy 2025, 318, 134805. [Google Scholar] [CrossRef] [Scilit]
  24. Tarodiya, R.; Gandhi, B.K. Numerical simulation of a centrifugal mud pump handling solid-liquid mixture: Effect of solids on flow field and performance. Adv. Powder Technol. 2019, 30, 2225–2239. [Google Scholar] [CrossRef] [Scilit]
  25. Wang, H.Y.; Yang, X.J.; Wang, D.X.; Du, J.; Yuan, F.; Yu, W. A systematic review of typical applications, correlation characteristics, and new research methods for stator rotor mixers. Chem. Eng. Res. Des. 2025, 221, 60–80. [Google Scholar] [CrossRef] [Scilit]
  26. Ji, L.L.; He, S.L.; Li, Y.K.; Li, W.; Shi, W.; Li, S.; Yang, Y.; Yang, Y.; Gao, Y.; Agarwal, R.K. Investigation of energy loss mechanism of shroud region in A mixed-flow pump under stall conditions. Proc. Inst. Mech. Eng. 2023, 237, 1235–1250. [Google Scholar] [CrossRef] [Scilit]
  27. Ning, C.; Li, T.L.; Yuan, S.Q.; Tao, X.; Wang, Y. Unsteady flow mechanism and energy loss analysis of double-tongue volute in a novel dishwasher pump: Role of blade outlet diameter. Chem. Eng. Sci. 2026, 328, 123725. [Google Scholar] [CrossRef] [Scilit]
  28. Pei, J.; Deng, Q.F.; Wang, W.J.; Sun, J.; Peng, W. Investigation on energy dissipation mechanism in a double-suction centrifugal pump based on Rortex and enstrophy. Eng. Appl. Comput. Fluid Mech. 2023, 17, 2261532. [Google Scholar] [CrossRef] [Scilit]
  29. Hamman, C.W.; Klewicki, J.C.; Kirby, R.M. On the Lamb vector divergence in Navier–Stokes flows. J. Fluid Mech. 2008, 610, 261–284. [Google Scholar] [CrossRef] [Scilit]
  30. He, L.J.; Zhou, Z.; Li, Z.; Yang, J.; Zhang, F.; Meng, X.; You, W.; Zhao, C. Investigation on the influence of droplets on the flow characteristics and energy separation in vortex tube based on CFD analysis. Int. J. Refrig. 2025, 177, 1–14. [Google Scholar] [CrossRef] [Scilit]
  31. Liu, C.Q.; Gao, Y.H.; Tian, S.L.; Dong, X. Rortex-A new vortex vector definition and vorticity tensor and vector decompositions. Phys. Fluids 2018, 30, 035103. [Google Scholar] [CrossRef] [Scilit]
  32. Wilcox, D.C. Turbulence Modeling for CFD, 3rd ed.; DCW Industries: La Canada, CA, USA, 1977. [Google Scholar]
  33. Wang, L.K.; Lu, J.L.; Liao, W.L.; Zhao, Y.; Wang, W. Numerical Simulation of the Tip Leakage Vortex Characteristics in a Semi-Open Centrifugal Pump. Appl. Sci. 2019, 9, 5244. [Google Scholar] [CrossRef] [Scilit]
  34. Luo, X.; Cao, S.F.; Pei, Y.J.; Xiao, X.; Wang, L.; Xue, Z.; Yang, C. Energy Conversion Characteristics of an In-Line Mixing Pump in Solid–Liquid Two-Phase Dynamic Mixing. Arab. J. Sci. Eng. 2023, 48, 16953–16971. [Google Scholar] [CrossRef] [Scilit]
  35. Kartushinsky, A.; Tisler, S.; Oliveira, J.; van der Geld, C. Eulerian-Eulerian modelling of particle-laden two-phase flow. Powder Technol. 2016, 301, 999–1007. [Google Scholar] [CrossRef] [Scilit]
  36. Wang, J.Q.; Huang, Y.S.; Zhang, R.Z.; Zhou, L. Numerical and experimental study of homogenization mechanism of high shear rotor-stator mixer. Can. J. Chem. Eng. 2024, 102, 4216–4229. [Google Scholar] [CrossRef] [Scilit]
  37. Menter, F.R. Two-equation eddy-viscosity turbulence models for engineering applications. AIAA J. 2012, 32, 1598–1605. [Google Scholar] [CrossRef] [Scilit]
  38. Menter, F.R. Performance of popular turbulence model for attached and separated adverse pressure gradient flows. AIAA J. 2012, 30, 2066–2072. [Google Scholar] [CrossRef] [Scilit]
  39. Nguyen, D.; Rasmuson, A.; Björn, I.N.; Thalberg, K. CFD simulation of transient particle mixing in a high shear mixer. Powder Technol. 2014, 258, 324–330. [Google Scholar] [CrossRef] [Scilit]
Figure 1. Schematic of the arrangement of the mud high-shear mixer in situ on the seabed.
Machines 14 00432 g001
Figure 2. Schematic of the first generation high-shear mixer.
Machines 14 00432 g002
Figure 3. Watershed division diagram.
Machines 14 00432 g003
Figure 4. Layout image of the monitoring section.
Machines 14 00432 g004
Figure 5. Mesh of the whole flow channel and key components of the high-shear mixer.
Machines 14 00432 g005
Figure 6. Variations of head and key energy indicators with mesh number.
Machines 14 00432 g006
Figure 7. Experimental platform of solid–liquid two-phase flow mixing.
Machines 14 00432 g007
Figure 8. Comparison of experimental and simulation results.
Machines 14 00432 g008
Figure 9. Contour of SVF under different flow rates.
Machines 14 00432 g009aMachines 14 00432 g009b
Figure 10. Contour of particle volume fraction on the 45° cross-section under different flow rates.
Machines 14 00432 g010
Figure 11. Contour of particle volume fraction under different particle concentrations.
Machines 14 00432 g011
Figure 12. Contour of shear rate, Lamb vortex energy and Enstrophy distribution in stator domain on cross-section 2 under different flow rates.
Machines 14 00432 g012
Figure 13. Contour of shear rate under different flow rates in the impeller area.
Machines 14 00432 g013
Figure 14. Contour of Lamb vortex energy under different flow rates in the impeller area.
Machines 14 00432 g014
Figure 15. Contour of Enstrophy under different flow rates in the impeller area.
Machines 14 00432 g015
Figure 16. The variation of average shear rate with flow rates of stator–rotor.
Machines 14 00432 g016
Figure 17. The variation of Lamb vortex energy with the increase in flow rate in the area.
Machines 14 00432 g017
Figure 18. Changes in Enstrophy with the increase in flow in the area.
Machines 14 00432 g018
Figure 19. Contour of shear rate, Lamb vortex energy and Enstrophy in the stator area of cross-section 2 under different particle concentrations.
Machines 14 00432 g019
Figure 20. Contour of shear rate in the impeller area under different particle concentrations.
Machines 14 00432 g020
Figure 21. Contour of Lamb vortex energy in the impeller area under different particle concentrations.
Machines 14 00432 g021
Figure 22. Contour of Enstrophy in the impeller area under different particle concentrations.
Machines 14 00432 g022
Figure 23. Variation of average shear rate with particle concentration in stator–rotor area.
Machines 14 00432 g023
Figure 24. The variation of Lamb vortex energy with the increase in particle concentration in the area.
Machines 14 00432 g024
Figure 25. Changes in Enstrophy with the increase in particle concentration in the area.
Machines 14 00432 g025
Figure 26. Changes in energy with the increase in flow rate in the area.
Machines 14 00432 g026
Figure 27. Changes in energy with the increase in particle concentration in the area.
Machines 14 00432 g027
Figure 28. Contour of Lamb vortex energy for the first-generation mixer under different flow rates and particle concentrations.
Machines 14 00432 g028
Figure 29. Contour of Enstrophy for the first-generation mixer under different flow rates and particle concentrations.
Machines 14 00432 g029
Table 1. Main geometric parameters of the first-generation and optimized high-shear mixers.
ItemsParametersItemsParameters
First GenerationOptimizedFirst GenerationOptimized
Inlet diameter Din (mm)8238Bladeless area height h (mm)614
Outlet diameter Dout (mm)5038Stator inter diameter d0 (mm)/126
Impeller diameter d (mm)204122Stator outer diameter d1 (mm)/138
Blade width W (mm)78Stator–rotor gap δ (mm)/2
Blade thickness B (mm)1412Volute diameter D (mm)250180
Blades number N (mm)66Blade shear angle α (°)4514.2
Table 2. Coefficient of variation of solid phase uniformity under different working conditions.
Working ConditionFlow RateParticle Concentration
0.54 QQ1.46 Q1.92 Q5%9%13%17%
Cv (%)19.115.213.212.811.615.218.724.2
Disclaimer/Publisher’s Note: The statements, opinions and data contained in all publications are solely those of the individual author(s) and contributor(s) and not of MDPI and/or the editor(s). MDPI and/or the editor(s) disclaim responsibility for any injury to people or property resulting from any ideas, methods, instructions or products referred to in the content.