Article

Lidar–Vision Depth Fusion for Robust Loop Closure Detection in SLAM Systems
by
Bingzhuo Liu
1,2,*,
Panlong Wu
1,
Rongting Chen
3,4,
Yidan Zheng
3,4 and
Mengyu Li
3,4
1
School of Automation, Nanjing University of Science and Technology, Xiaolingwei Street 200, Nanjing 210094, China
2
Jiangsu Institute of Automation, Shenghu Road 18, Lianyungang 222061, China
3
Engineering Research Center of the Ministry of Education for Intelligent Control System and Intelligent Equipment, Yanshan University, Qinhuangdao 066004, China
4
Key Laboratory of Intelligent Control and Neural Information Processing, Ministry of Education, Yanshan University, Qinhuangdao 066004, China
*
Author to whom correspondence should be addressed.
Machines 2026, 14(3), 282; https://doi.org/10.3390/machines14030282
Submission received: 17 November 2025 / Revised: 4 January 2026 / Accepted: 5 January 2026 / Published: 3 March 2026

Abstract

Loop Closure Detection (LCD) is a key component of Simultaneous Localization and Mapping (SLAM) systems, responsible for correcting odometric drift and maintaining global consistency in localization and mapping. However, single-modality LCD methods suffer from inherent limitations: LiDAR-based approaches are affected by point cloud sparsity, limiting feature representation in unstructured environments, while vision-based methods are sensitive to illumination and weather variations, reducing robustness. To address these issues, this paper presents a LiDAR–vision multimodal fusion LCD algorithm. Spatiotemporal alignment between LiDAR point clouds and images is achieved through extrinsic calibration and timestamp interpolation to ensure cross-modal consistency. Harris corner detection and BRIEF descriptors are employed to extract visual features, and a LiDAR-projected sparse depth map is used to complete depth information, mapping 2D features into 3D space. A hybrid feature representation is then constructed by fusing LiDAR geometric triangle descriptors with visual BRIEF descriptors, enabling efficient loop candidate retrieval via hash indexing. Finally, an improved RANSAC algorithm performs geometric verification to enhance the robustness of relative pose estimation. Experiments on the KITTI and NCLT datasets show that the proposed method achieves average F1 scores of 85.28% and 77.63%, respectively, outperforming both unimodal and existing multimodal approaches. When integrated into a SLAM framework, it reduces the Absolute Error (ATE) RMSE by 11.2–16.4% compared with LiDAR-only methods, demonstrating improved loop detection accuracy and overall system robustness in complex environments.

1. Introduction

As mobile robots and autonomous driving systems continue to expand into complex environments, the requirements for accuracy and robustness in long-term autonomous navigation using Simultaneous Localization and Mapping (SLAM) systems have become increasingly stringent [1]. Odometry, as the fundamental pose estimation module of SLAM, is susceptible to cumulative drift caused by sensor noise, environmental dynamics, and data association errors [2,3]. Without timely correction, this drift can lead to map distortion and trajectory deviation, ultimately resulting in navigation failure. Loop Closure Detection (LCD) serves as a global constraint mechanism by identifying when a robot revisits a previously mapped location, making it a key technique for correcting accumulated errors and maintaining global consistency between the map and trajectory [4].
Existing loop closure detection methods can be categorized into three types according to sensor modality: LiDAR-based, vision-based, and multi-sensor fusion approaches. LiDAR-based methods rely on high-precision 3D geometric information, exhibiting strong stability under varying illumination and in textureless scenes. Representative works such as Scan Context by Kim et al. [5], Scan Context++ by Kim et al. [6], and Contour Context by Jiang and Shen [7] construct global descriptors to enable fast matching. However, due to the inherent sparsity of LiDAR point clouds, these methods struggle to represent spatial features adequately in long-range or unstructured environments, which may result in missed loop detections [8]. Vision-based methods, such as DBoW2 proposed by Galvez-López and Tardos [9], leverage the rich texture and color information of images to distinguish between visually similar scenes, yet they are highly sensitive to illumination changes and seasonal variations, often suffering from a significant drop in matching accuracy under strong lighting, rain, or other adverse weather conditions [10].
Each single-sensor modality has its limitations in specific environments. Nevertheless, LiDAR and vision sensors are inherently complementary: LiDAR provides stable, illumination-invariant 3D geometric structures, while cameras capture fine-grained texture details to distinguish similar structures [11,12]. Most existing fusion methods operate at the feature level, where image and point cloud features are independently extracted and then aligned or associated via homomorphic transformation [13], projection [14], or attention mechanisms [15] to achieve cross-modal integration. In contrast, decision-level fusion methods combine independent detection results from different sensors to avoid false matches caused by single-sensor noise, effectively leveraging their respective advantages to enhance overall robustness [16,17].
To address these challenges, this paper proposes a LiDAR-vision depth fusion algorithm for loop closure detection in SLAM systems. The proposed approach aims to tightly couple geometric structure and visual texture information by integrating spatiotemporal alignment, sparse depth completion for visual keypoints, hybrid geometric-texture feature fusion, and an improved RANSAC-based geometric verification strategy. By establishing reliable cross-modal geometric associations and enforcing robust consistency constraints, the proposed method enhances loop detection accuracy and robustness in complex, long-term, and mixed indoor–outdoor environments.
The main contributions of this work are summarized as follows:
  • Spatiotemporal Alignment and Depth Completion Framework: A unified process is designed to achieve spatial alignment of LiDAR point clouds and camera images via extrinsic calibration, handle sampling rate discrepancies through timestamp interpolation, and complete depth estimation of visual keypoints using neighborhood search. This enables the construction of 3D visual features as a foundation for cross-modal fusion.
  • Hybrid Feature Descriptor Construction: A fusion descriptor combining LiDAR geometric triangle descriptors (representing spatial topology) and visual BRIEF descriptors (representing local texture) is developed. Efficient loop candidate retrieval is achieved via hash indexing, balancing matching efficiency and discriminability. An improved RANSAC-based geometric verification method is further introduced to suppress noise and reduce false matches.
  • Comprehensive Evaluation on Public Datasets: Extensive experiments are conducted on the KITTI and NCLT datasets to validate the proposed algorithm’s effectiveness across urban, mixed indoor–outdoor, and seasonally varying environments, demonstrating its potential as a robust solution for long-term autonomous navigation in SLAM systems.

2. Related Work

In this section, we review representative studies closely related to our work, including LiDAR-only descriptors, vision-only descriptors, and LiDAR–vision fusion-based approaches. A high-level comparison of these methods, in terms of sensor modality, feature representation, and main limitations, is summarized in Table 1.

2.1. Loop Closure Detection Based on Single Modality

LiDAR-based loop closure detection methods can generally be divided into two categories: direct point cloud matching and feature descriptor matching. Direct matching methods such as ICP [18] and NDT [19] estimate relative poses by iteratively optimizing point correspondences, but their high computational cost makes them unsuitable for real-time applications. Descriptor-based methods extract global or local features to reduce data dimensionality and have become the mainstream approach. Among global descriptor methods, Scan Context [5] projects 3D point clouds into an azimuth–radial grid and encodes the maximum height in each cell to achieve rotation-invariant matching. Scan Context++ [6] further improves robustness by introducing sub-descriptors to handle translation and rotation sensitivity, but its adaptability to non-spherical LiDARs remains limited. Local descriptor methods such as LinK3D [20] and BoW3D [8] employ a Bag-of-Words (BoW) framework that utilizes local geometric features for fast retrieval. However, in sparse regions, feature redundancy can lead to false detections. Map Closure [21] constructs LiDAR density maps for loop detection, showing strong viewpoint robustness, but compressing 3D structures into 2D maps leads to loss of spatial information and incomplete scene representation [22].
Vision-based loop closure detection, typically formulated as Visual Place Recognition (VPR), identifies revisited locations through image feature matching. Among local feature methods, SURF [23] achieves scale and rotation invariance but is computationally expensive. ORBcombines FAST corner detection and BRIEF descriptors, balancing efficiency and robustness, and is widely used in systems such as ORB-SLAM [1]. Global feature methods such as HOG [24] and PHOG [25] capture image gradient distributions to describe structural information but are sensitive to local detail changes. To improve efficiency, researchers have proposed Bag-of-Words (BoW) models such as DBoW2 [9], which use K-means clustering to build a visual vocabulary and TF–IDF weighting to enhance discriminability for fast retrieval. However, BoW models suffer from a fixed vocabulary problem, limiting generalization to unseen scenes. FAB-MAP 2.0 [26] introduces probabilistic modeling of word co-occurrence to improve large-scale adaptability, but its reliance on SURF features leads to slow extraction, restricting real-time performance.

2.2. LiDAR-Vision Fusion for Loop Closure Detection

Multimodal fusion methods combine LiDAR geometric information with visual texture to overcome the limitations of single modalities. According to the fusion level, these methods can be categorized as feature-level fusion and decision-level fusion. Decision-level fusion methods, such as MSF-SLAM [16], integrate LiDAR and visual loop closure results through logical operations (e.g., OR fusion). Although this improves robustness, it fails to fully exploit cross-modal feature correlations and remains vulnerable to false detections caused by a single modality. iBTC [27] introduces binary visual descriptors to assist LiDAR matching and achieves real-time performance but lacks deep feature-level interaction.
Feature-level fusion methods have received greater attention. CoRAL [12] generates elevation maps from LiDAR data and fuses them with projected RGB image features, aggregating multimodal representations via a NetVLAD layer. However, this approach depends heavily on deep learning and large amounts of labeled data. MinkLoc++ [28] designs a specialized feature extraction module that jointly learns point cloud and image features to generate multimodal descriptors, but it is sensitive to calibration errors. BEV Fusion [11] projects image features onto a bird-eye-view (BEV) plane for fusion with LiDAR BEV features, though projection bias can occur in non-flat terrains. Additionally, some approaches incorporate attention mechanisms [29] to model cross-modal dependencies, but their high computational complexity limits their use on embedded platforms.
In summary, existing fusion approaches still face challenges such as low cross-modal alignment accuracy, insufficient feature fusion depth, and limited robustness. To address these problems, this paper proposes a LiDAR-vision deep fusion loop closure detection algorithm that integrates spatiotemporal alignment, depth completion, hybrid descriptor construction, and improved RANSAC-based geometric verification, providing a novel solution for enhancing loop closure detection performance.

3. Method

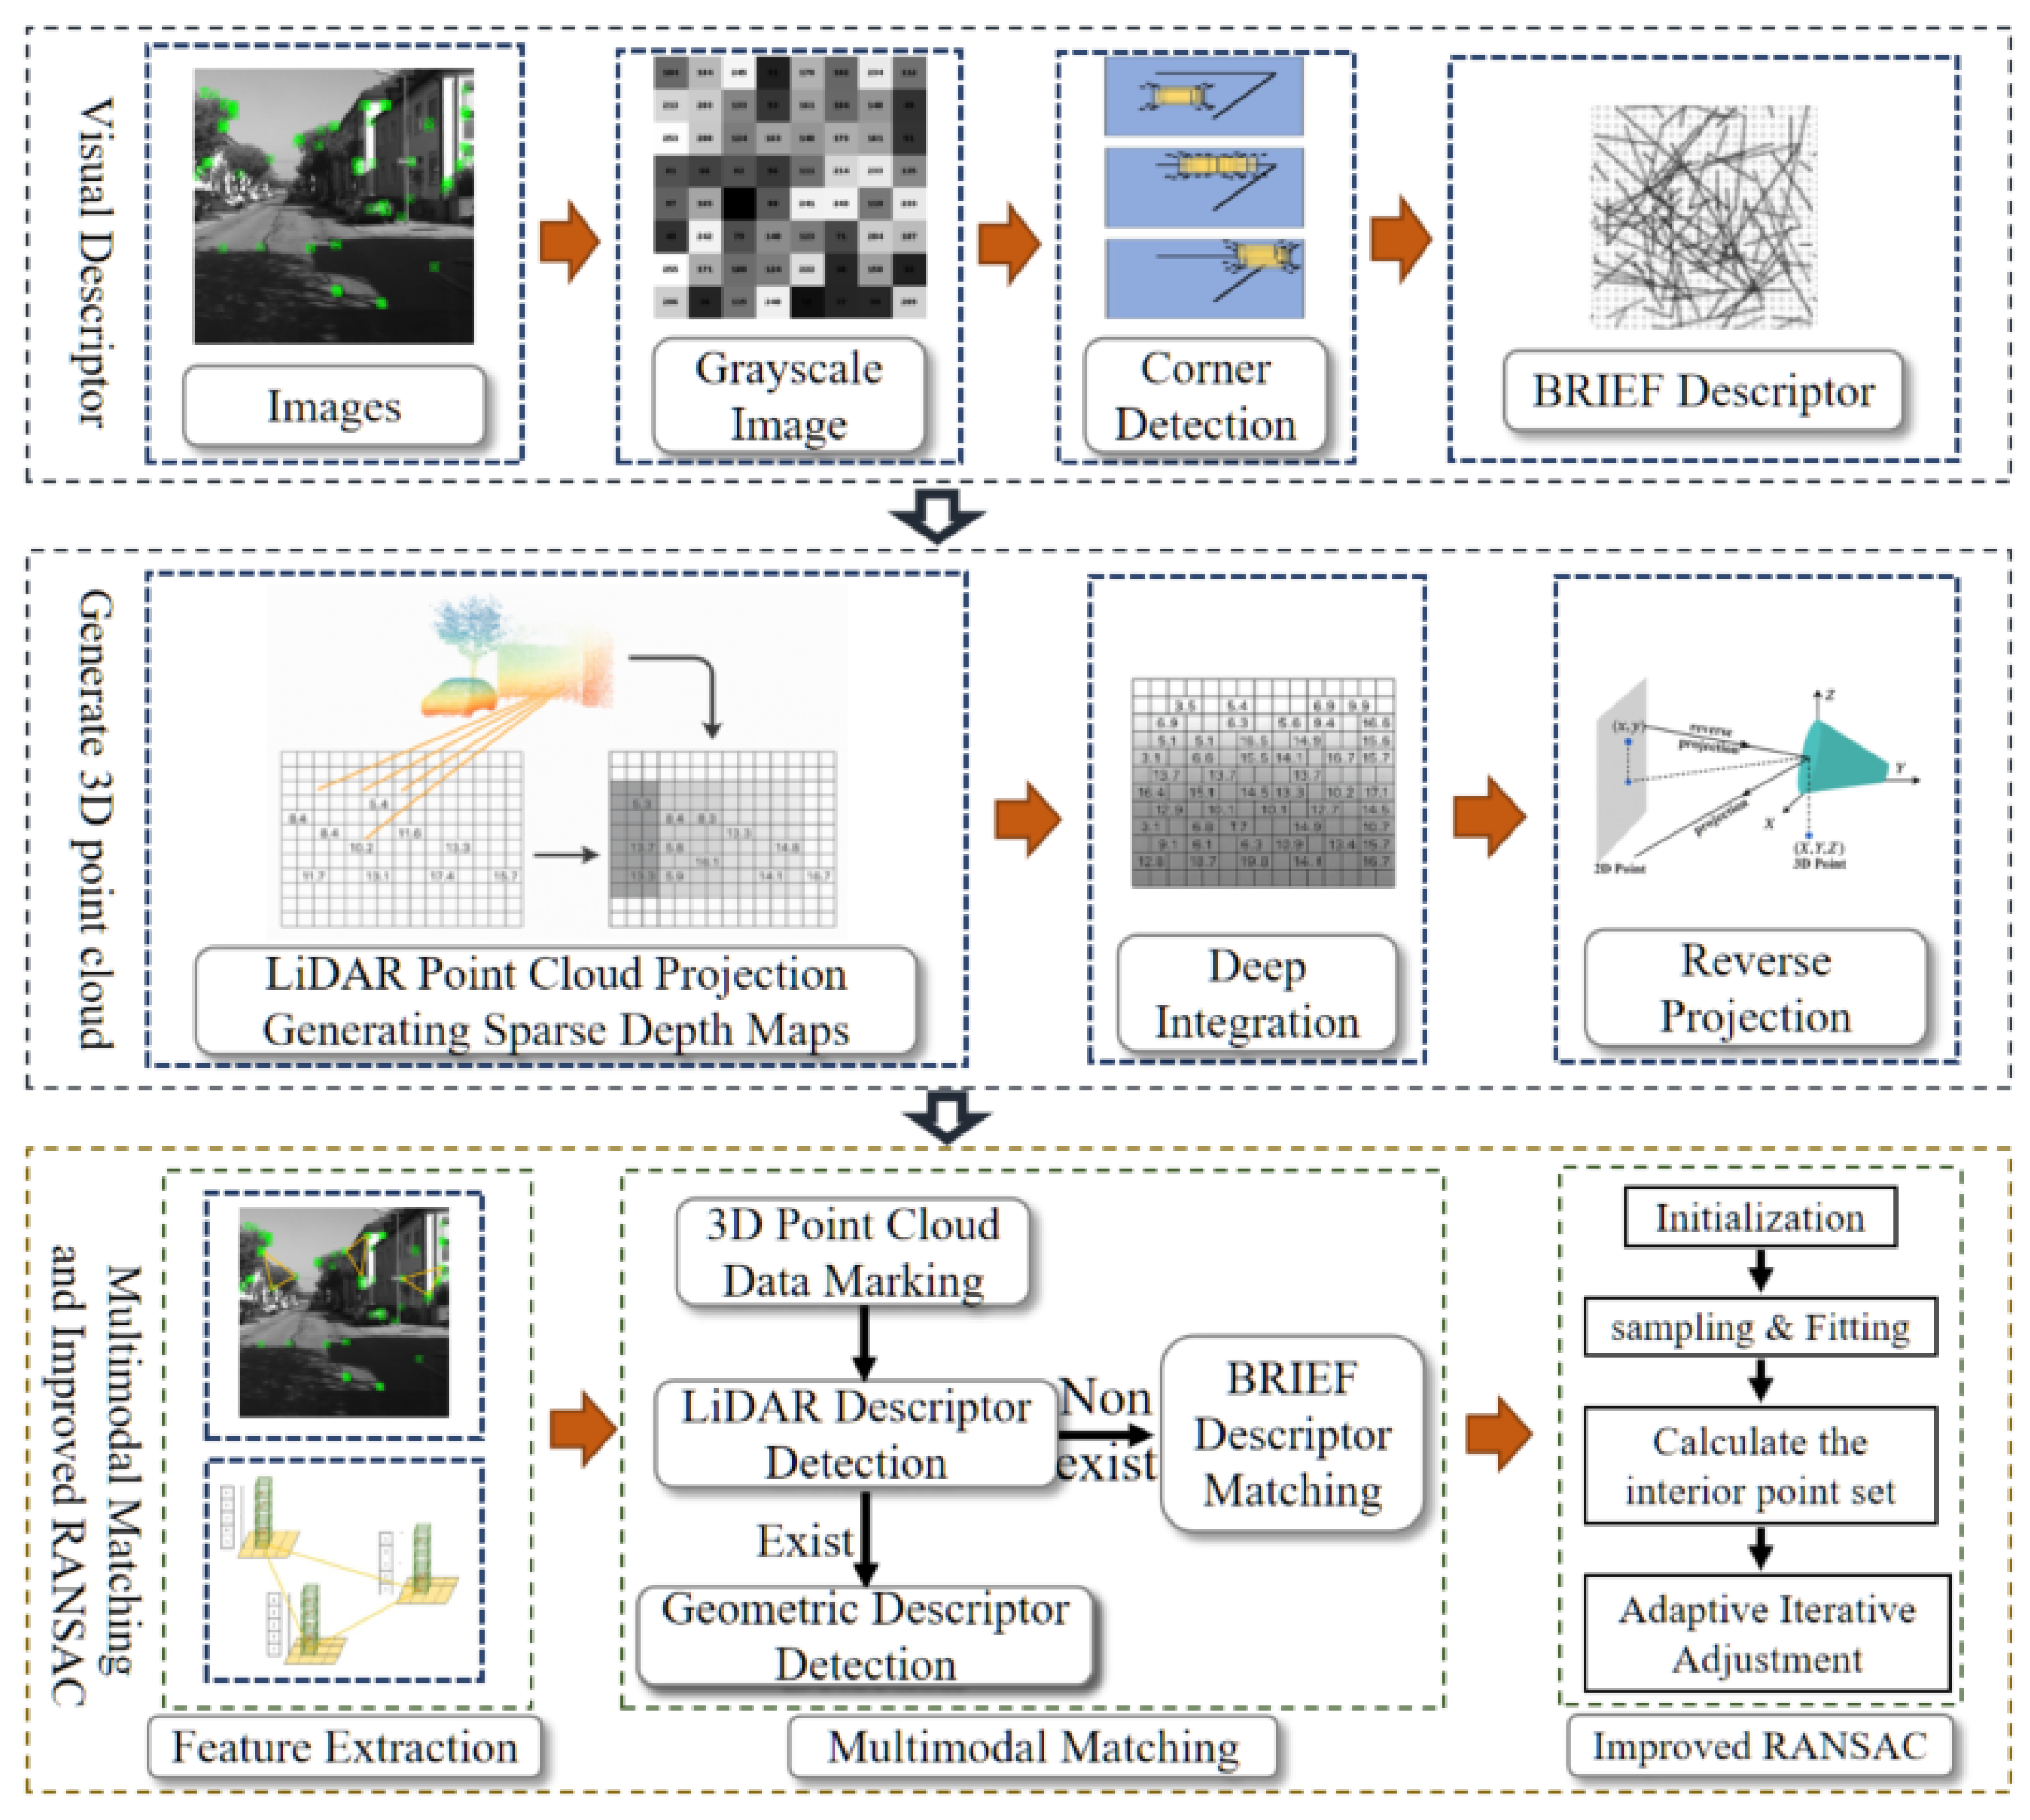
Figure 1 illustrates the algorithm workflow. First, Harris corners are detected from input images with BRIEF descriptors extracted. Depth information of keypoints is obtained via LiDAR point cloud projection to generate a sparse depth map, where invalid depths are completed to form a fused depth map, which is then back-projected into 3D space. Triangular descriptors with binary descriptors are constructed based on LiDAR and visual keypoints, where LiDAR geometric features provide stable structural constraints, while visual texture descriptors complement potential discriminability loss in structurally homogeneous scenes. For matching, LiDAR geometric descriptors are used whenever reliable triangular structures can be constructed from neighboring LiDAR keypoints. When such geometric descriptors are unavailable or unreliable, visual BRIEF descriptors are employed as complementary cues. An improved RANSAC algorithm is applied for geometric verification, incorporating a matching error weighting mechanism to enhance matching accuracy and robustness of transformation estimation.

3.1. Visual Feature Extraction and Depth Completion

Harris corner detection identifies corners by analysing grey-level changes within local windows [30]. For each detected Harris keypoint, N random pairs of pixels ( p a , p b ) are sampled within its neighborhood, and a binary test is defined as:
τ ( p a , p b ) = 1 , I ( p a ) < I ( p b ) 0 , I ( p a ) I ( p b )
where I ( p ) denotes the grey-scale intensity of pixel p. The concatenation of all N binary tests forms the BRIEF descriptor, which is compact in storage and enables efficient matching.
After projecting LiDAR points onto the image plane to obtain a sparse depth map, the generated depth map contains many blank areas, requiring depth completion for visual keypoints. This process begins with spatiotemporal alignment of the LiDAR and camera data. Because LiDAR and camera operate at different sampling frequencies, for each image frame, two LiDAR scans with timestamps closest to the image are found, and linear interpolation is applied to obtain the interpolated LiDAR point cloud at the image timestamp, ensuring temporal consistency. Given the extrinsic calibration parameters, each LiDAR point P l = [ x l , y l , z l ] T is transformed into the camera coordinate system P c = [ x c , y c , z c ] T as:
P c = R l c · P l + t l c
where R l c and t l c are the rotation matrix and translation vector from LiDAR to camera, respectively.
For depth completion, a neighborhood search is applied: a sparse depth map records the LiDAR-derived depth for each pixel. For keypoints without valid depth, the nearest valid depth pixel within a 5 × 5 window is found and assigned to the keypoint; if no valid value exists, the keypoint is discarded to prevent invalid matches.
According to the pinhole camera model, each keypoint with completed depth d k is back-projected into 3D space as a visual keypoint P v = [ x v , y v , z v ] T :
x v = ( u k c x ) · d k f x , y v = ( v k c y ) · d k f y , z v = d k
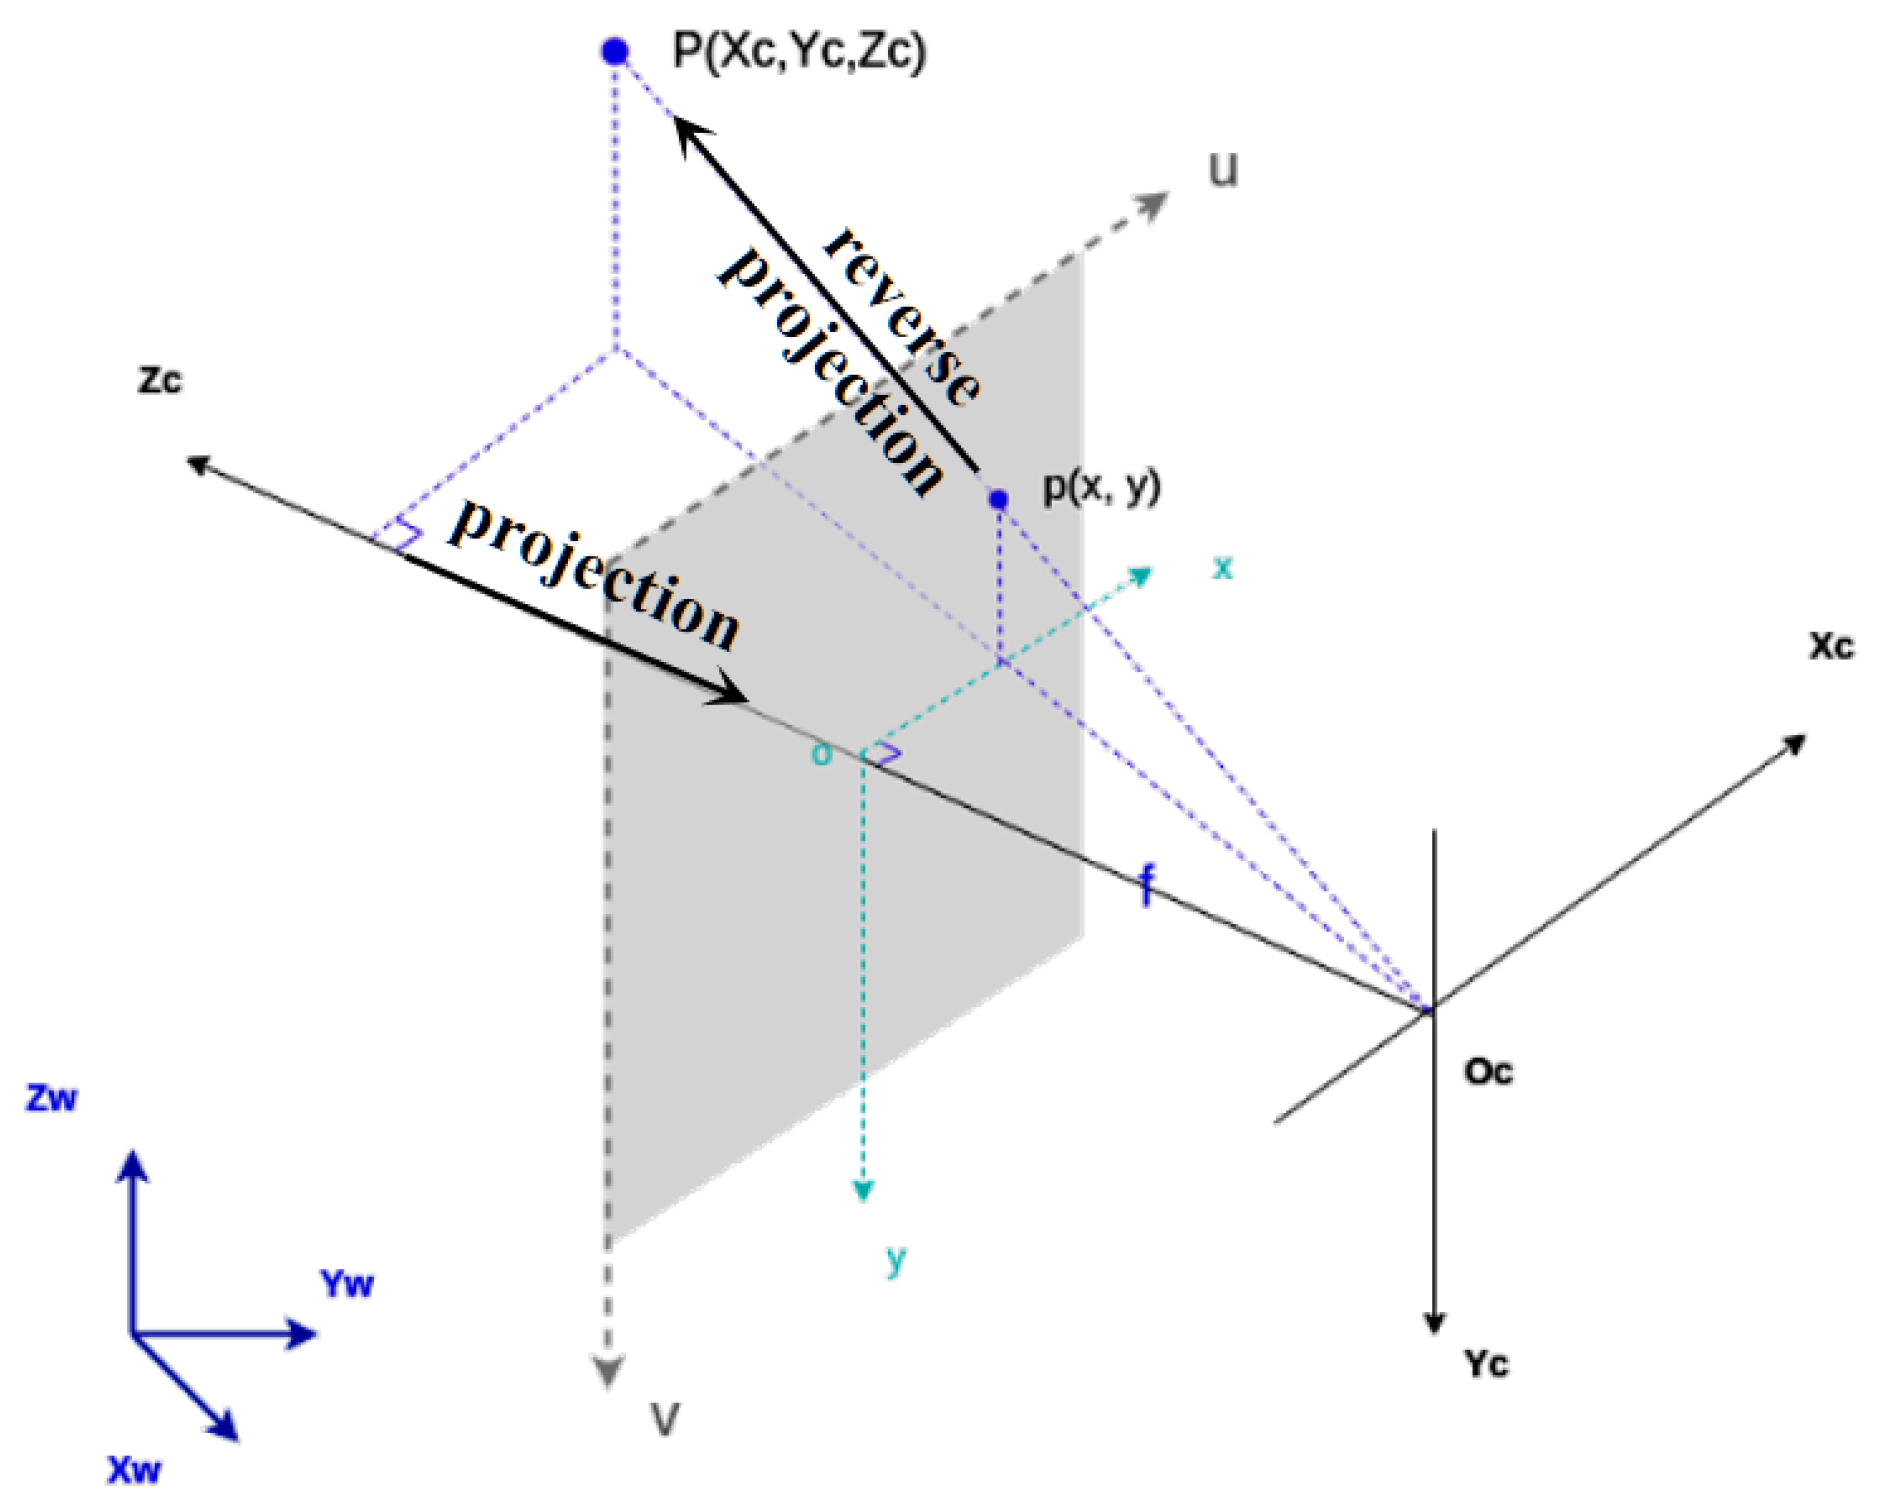
where ( u k , v k ) denote the pixel coordinates, and ( f x , f y , c x , c y ) are the intrinsic parameters of the camera. Figure 2 illustrates the back-projection process that lifts a 2D visual keypoint from the image plane into 3D space using the pinhole camera model and depth information. It is worth noting that the proposed method is not intended to recover the exact physical depth of every visual keypoint. Instead, depth completion and validation are designed to provide a reliable geometric basis for subsequent matching and loop closure detection, while preventing unreliable depth values from propagating into later stages. Visual keypoints without valid depth are discarded, and final correspondences are further filtered through geometric consistency verification. This conservative design prioritizes robustness in loop detection rather than dense or precise depth recovery.

3.2. Multimodal Feature Fusion and Matching

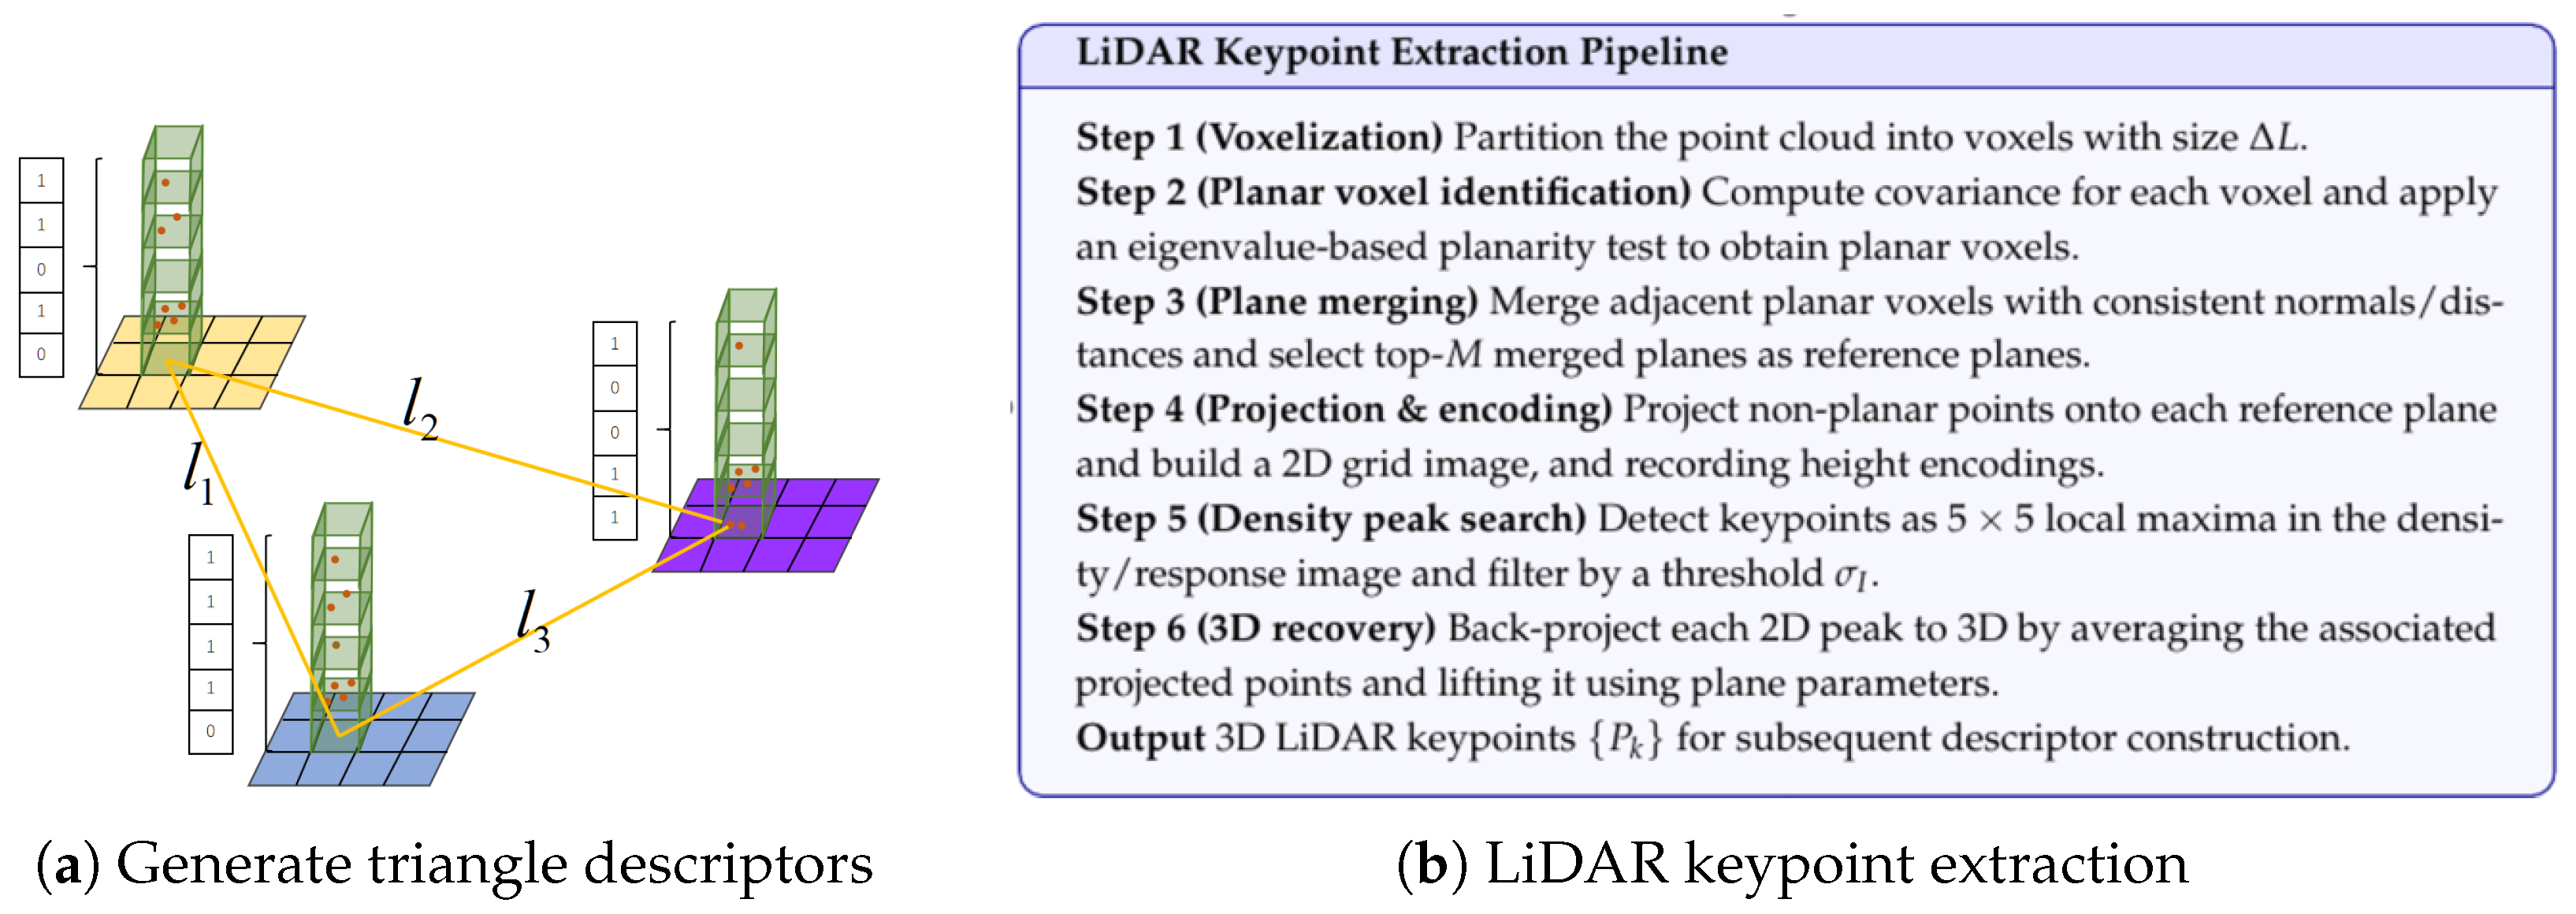
To tightly couple LiDAR geometric structures with visual texture cues, we construct triangular descriptors from both LiDAR keypoints and 3D visual keypoints, respectively. As illustrated in Figure 3a, for each keypoint, two neighboring keypoints are selected to form a triangle, and the three side lengths ( l 1 , l 2 , l 3 ) are computed to encode its local spatial topology. For LiDAR triangles, each vertex additionally records a height encoding derived from the projection-based representation, yielding a compact geometric descriptor. For visual triangles, the same triangular construction is applied to 3D visual keypoints, while the BRIEF descriptors associated with the triangle vertices are retained to represent local texture information. In this way, geometric and appearance cues are unified under a consistent triangular topology for subsequent retrieval and matching.
For LiDAR keypoint extraction, we adopt a plane-assisted projection strategy, as shown in Figure 3b. Specifically, consecutive LiDAR scans are first accumulated into submaps and voxelized to improve robustness and computational efficiency. Planar voxels are then identified according to the proportion of planar points and merged into larger planar regions. For the remaining non-planar voxels, points are projected onto their adjacent planes along the plane normals to generate projection images. LiDAR keypoints are finally detected as local density maxima in these images, and the resulting keypoints are denoted as L k . This projection-and-density scheme produces stable and well-distributed keypoints, which further support the height encoding and triangular descriptor construction in Figure 3b. This design allows the proposed method to maintain matching robustness in scenarios where geometric features alone exhibit reduced discriminability. The hash key for the constructed LiDAR and visual triangle descriptors is computed as
Hash ( L ) = Hash ( l 1 , l 2 , l 3 ) = Int . Hash ( l ¯ 1 , l ¯ 2 , l ¯ 3 ) = Mod [ Mod ( l ¯ 3 · p + l ¯ 2 ) · p , B ] + l ¯ 1 · p
where l ¯ = l / 0.1 , p is a large prime number and B denotes the hash table size. For each triangular descriptor in the current frame, the hash key is calculated to retrieve similar descriptors from the hash table. The top 50 candidate loop frames are selected based on descriptor similarity (using height-encoded Hamming distance for LiDAR and BRIEF Hamming distance for vision).

3.3. Improved RANSAC-Based Geometric Verification

Traditional RANSAC estimates the transformation matrix by randomly sampling point pairs and using a fixed threshold to determine inliers, which makes it sensitive to noise and mismatches [31]. To improve robustness, a weighted error mechanism is introduced. For each candidate correspondence pair { p i , q i } i = 1 N , the transformation T = [ R | t ] S E ( 3 ) maximizing the weighted inlier count is found as
T = arg max T i = 1 N w i · 1 T ( p i ) q i < σ
where w i is a weight function defined as
w i = exp T ( p i ) q i 2 2 σ 2
and σ is a decay parameter controlling the influence of error magnitude on the weight. This soft weighting allows each correspondence to contribute proportionally to its residual, improving stability in noisy data. The parameter σ controls the sensitivity of the weighted inlier function. In this work, σ is empirically selected based on the typical scale of geometric errors in the system and is chosen to be of the same order of magnitude as the RANSAC inlier threshold δ . In practice, σ is set within the range of 0.2–0.3 and kept constant across all experiments.
Finally, validated loop constraints are incorporated into the SLAM pose graph for global optimization. In the graph, nodes represent robot keyframe poses T i S E ( 3 ) , and edges represent odometry and loop constraints. The optimization objective is formulated as
min T i ( i , j ) L odom e odom ( T i , T j ) 2 + ( i , j ) L loop e loop ( T i , T j , T i j ) 2
where L odom and L loop denote the sets of odometry and loop-closure edges, respectively, and e odom and e loop are the corresponding error terms. This optimization corrects accumulated drift and ensures global pose consistency within the SLAM system.

4. Experiments

4.1. Experimental Setup and Datasets

We evaluated the proposed algorithmic framework on two publicly available datasets: the KITTI dataset [32] and the NCLT dataset [33]. For the KITTI dataset, sequences 00, 02, 05, 07, and 08 were selected, which contain 10 Hz 64-line LiDAR point clouds and 10 Hz camera image data. For the NCLT dataset, sequences NCLT1 (2012-01-15), NCLT2 (2012-05-26), NCLT3 (2012-11-04), and NCLT4 (2012-12-01) were used, which contain 10 Hz 32-line LiDAR point clouds and 5 Hz camera image data. In the experiments, we compared our method with four representative algorithms: the density-map-based Map Closure [21], the BEV contour–based Contour Context [7], the bag-of-words–based DBoW2 [9], and the binary feature–aided fusion method iBTC [27]. All experiments were conducted on a consumer-grade desktop computer running Ubuntu 20.04, equipped with an Intel(R) Core(TM) i5-12400 CPU and 16 GB RAM.
The evaluation metrics used to assess loop closure detection performance include Precision, Recall, and F1-score, which are defined as Precision = TP / ( TP + FP ) , Recall = TP / ( TP + FN ) , and F 1 = 2 × ( Precision × Recall ) / ( Precision + Recall ) , respectively. Here, TP denotes the number of correctly detected loops (true positives), FP denotes the number of false loop detections (false positives), and FN denotes the number of missed loops (false negatives).

4.2. Results on the KITTI Dataset

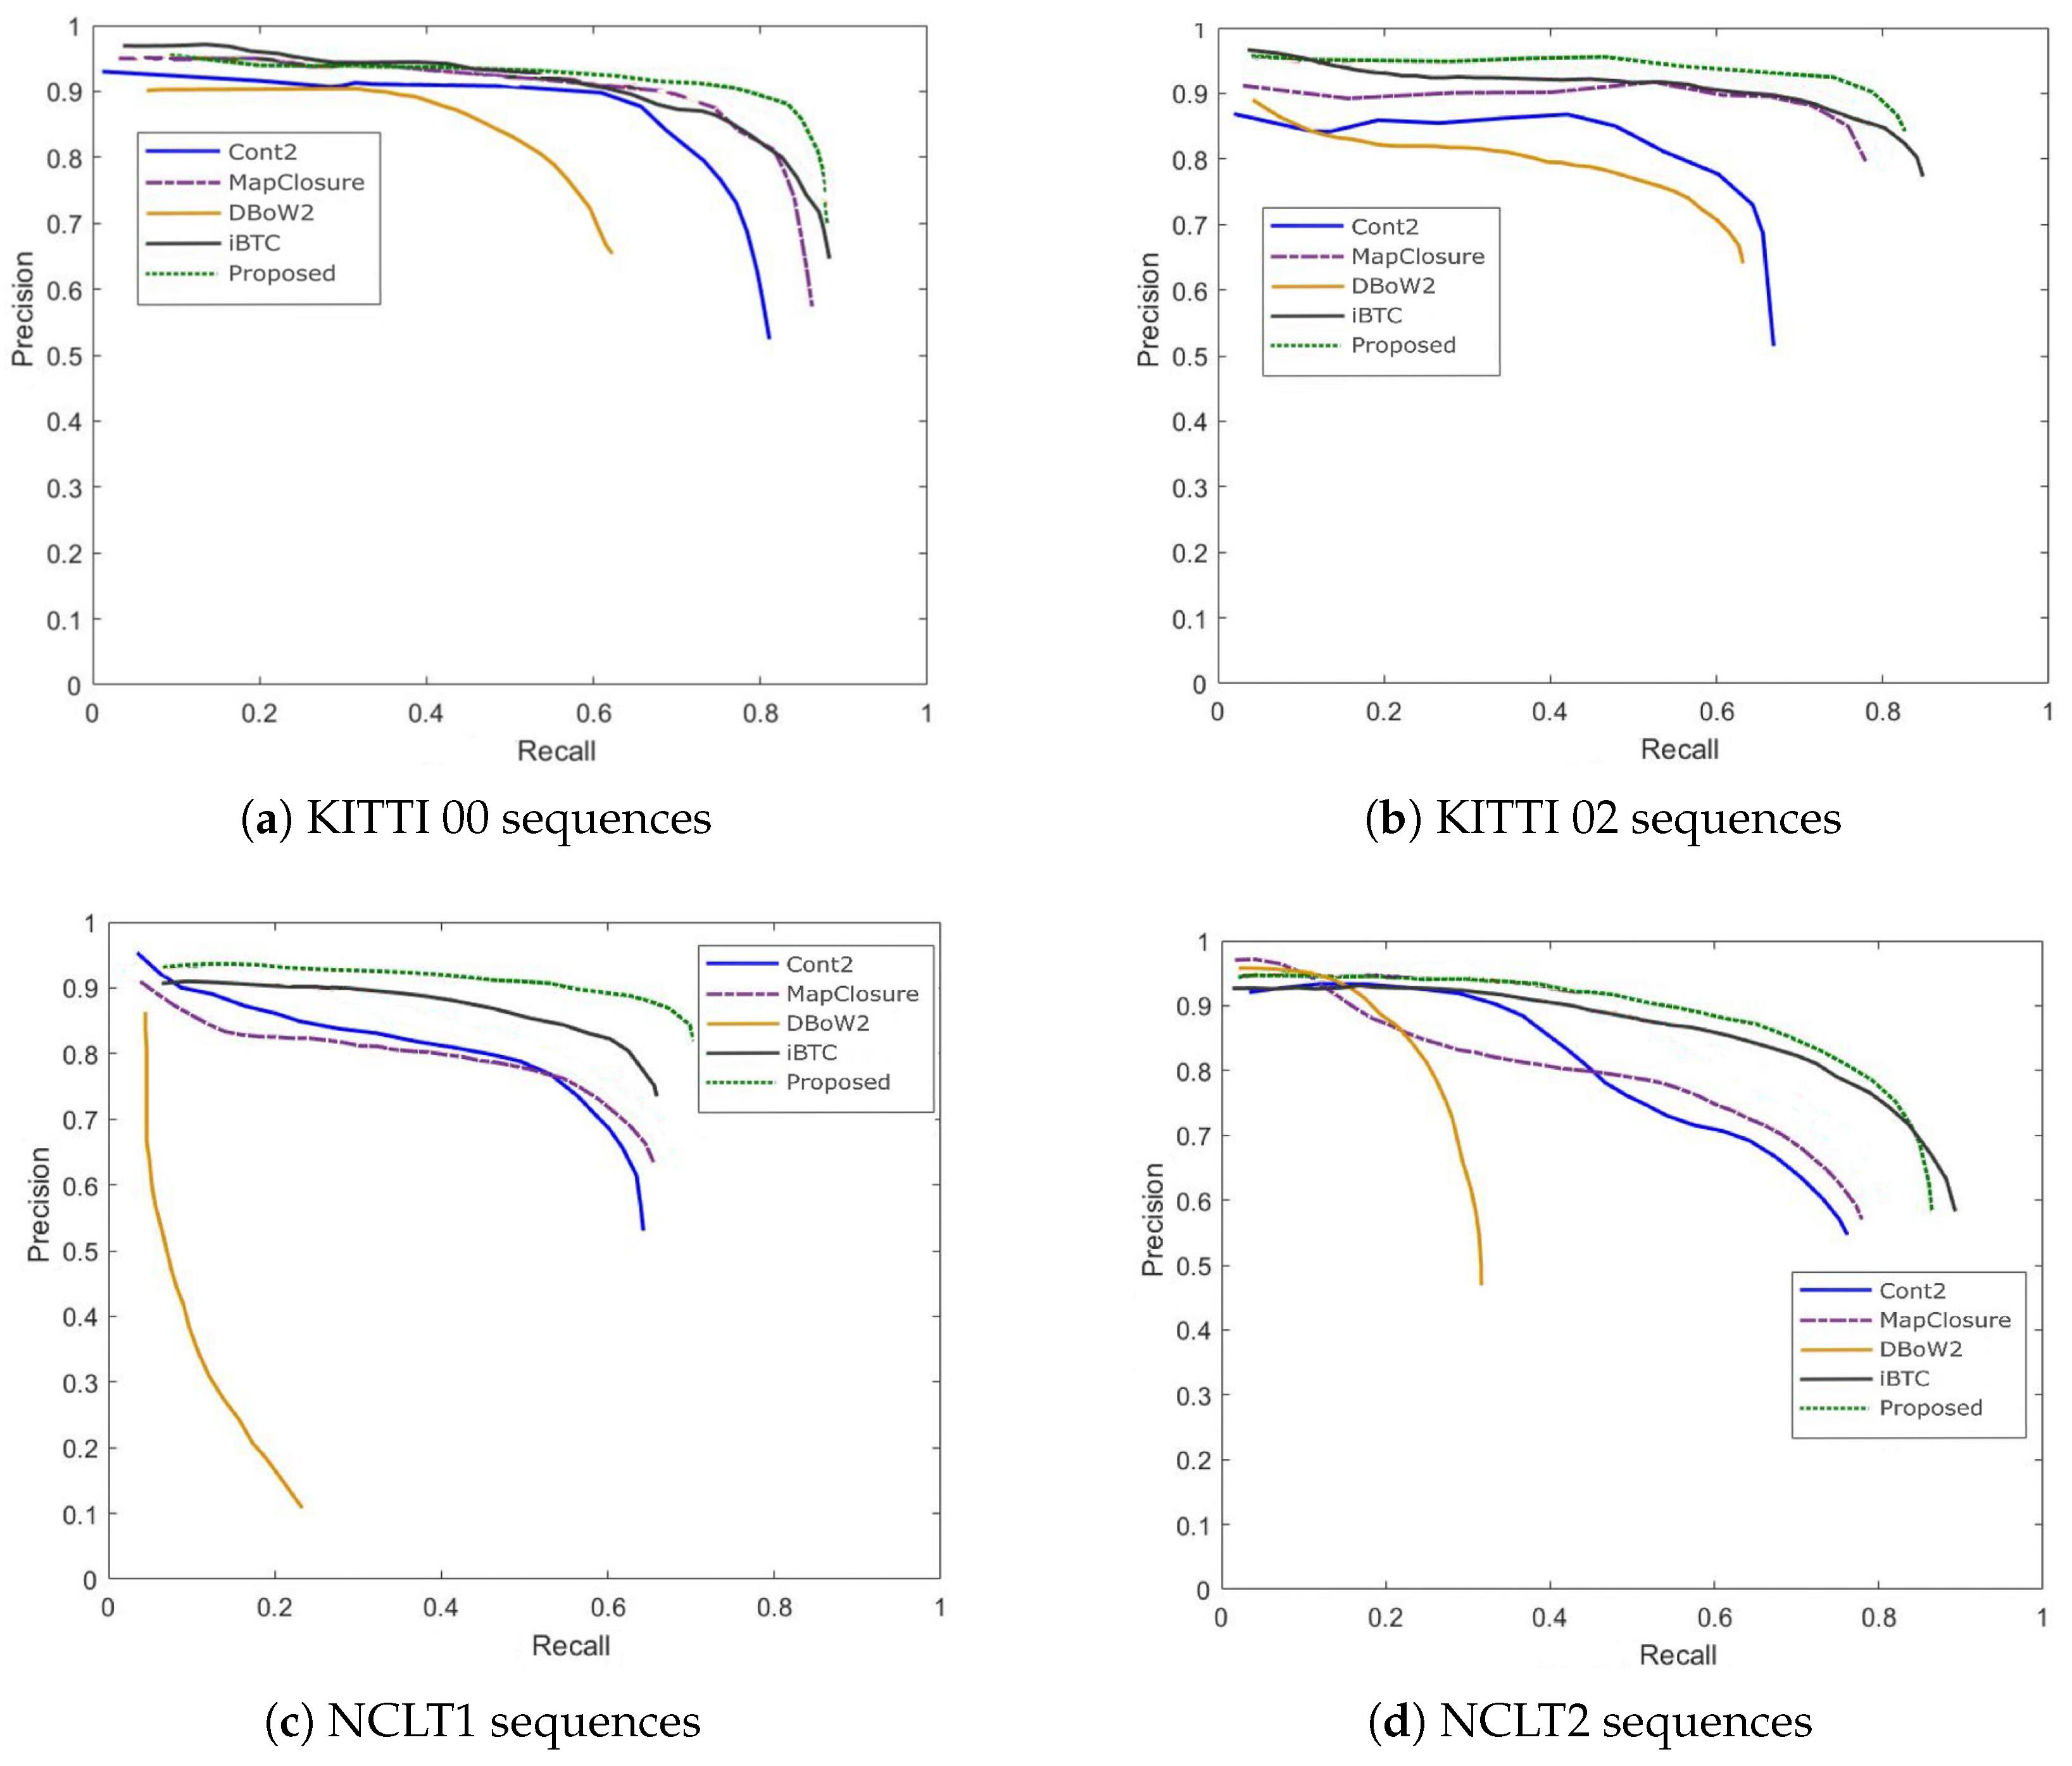
Table 2 compares the F1-scores of various algorithms on KITTI00, KITTI02, and KITTI05 sequences. The proposed algorithm achieves the highest F1-score across all three sequences, with an average of 85.28%, showing significant improvements over the LiDAR-only Map Closure and vision-only DBoW2. This is attributed to enhanced cross-modal feature correlation via depth completion, which leverages multi-sensor advantages to boost detection accuracy and robustness. Figure 4a,b presents the Precision-Recall (PR) curves for each sequence. The proposed algorithm exhibits a larger enclosed area in most cases, maintaining higher precision at the same recall rate, thus outperforming others in loop closure detection performance.
Table 3 demonstrates the impact of incorporating vision into the original algorithm. It shows that the proposed algorithm, after fusing vision, increases the number of detections across all four sequences by an average of 5.25, with the maximum similarity improved by 0.38% on average. This verifies that LiDAR-vision fusion enhances the robustness of loop closure detection. For instance, in the KITTI02 sequence with extensive tree occlusion (resulting in incomplete LiDAR point cloud features), the algorithm successfully detects more loops by supplementing visual textures.
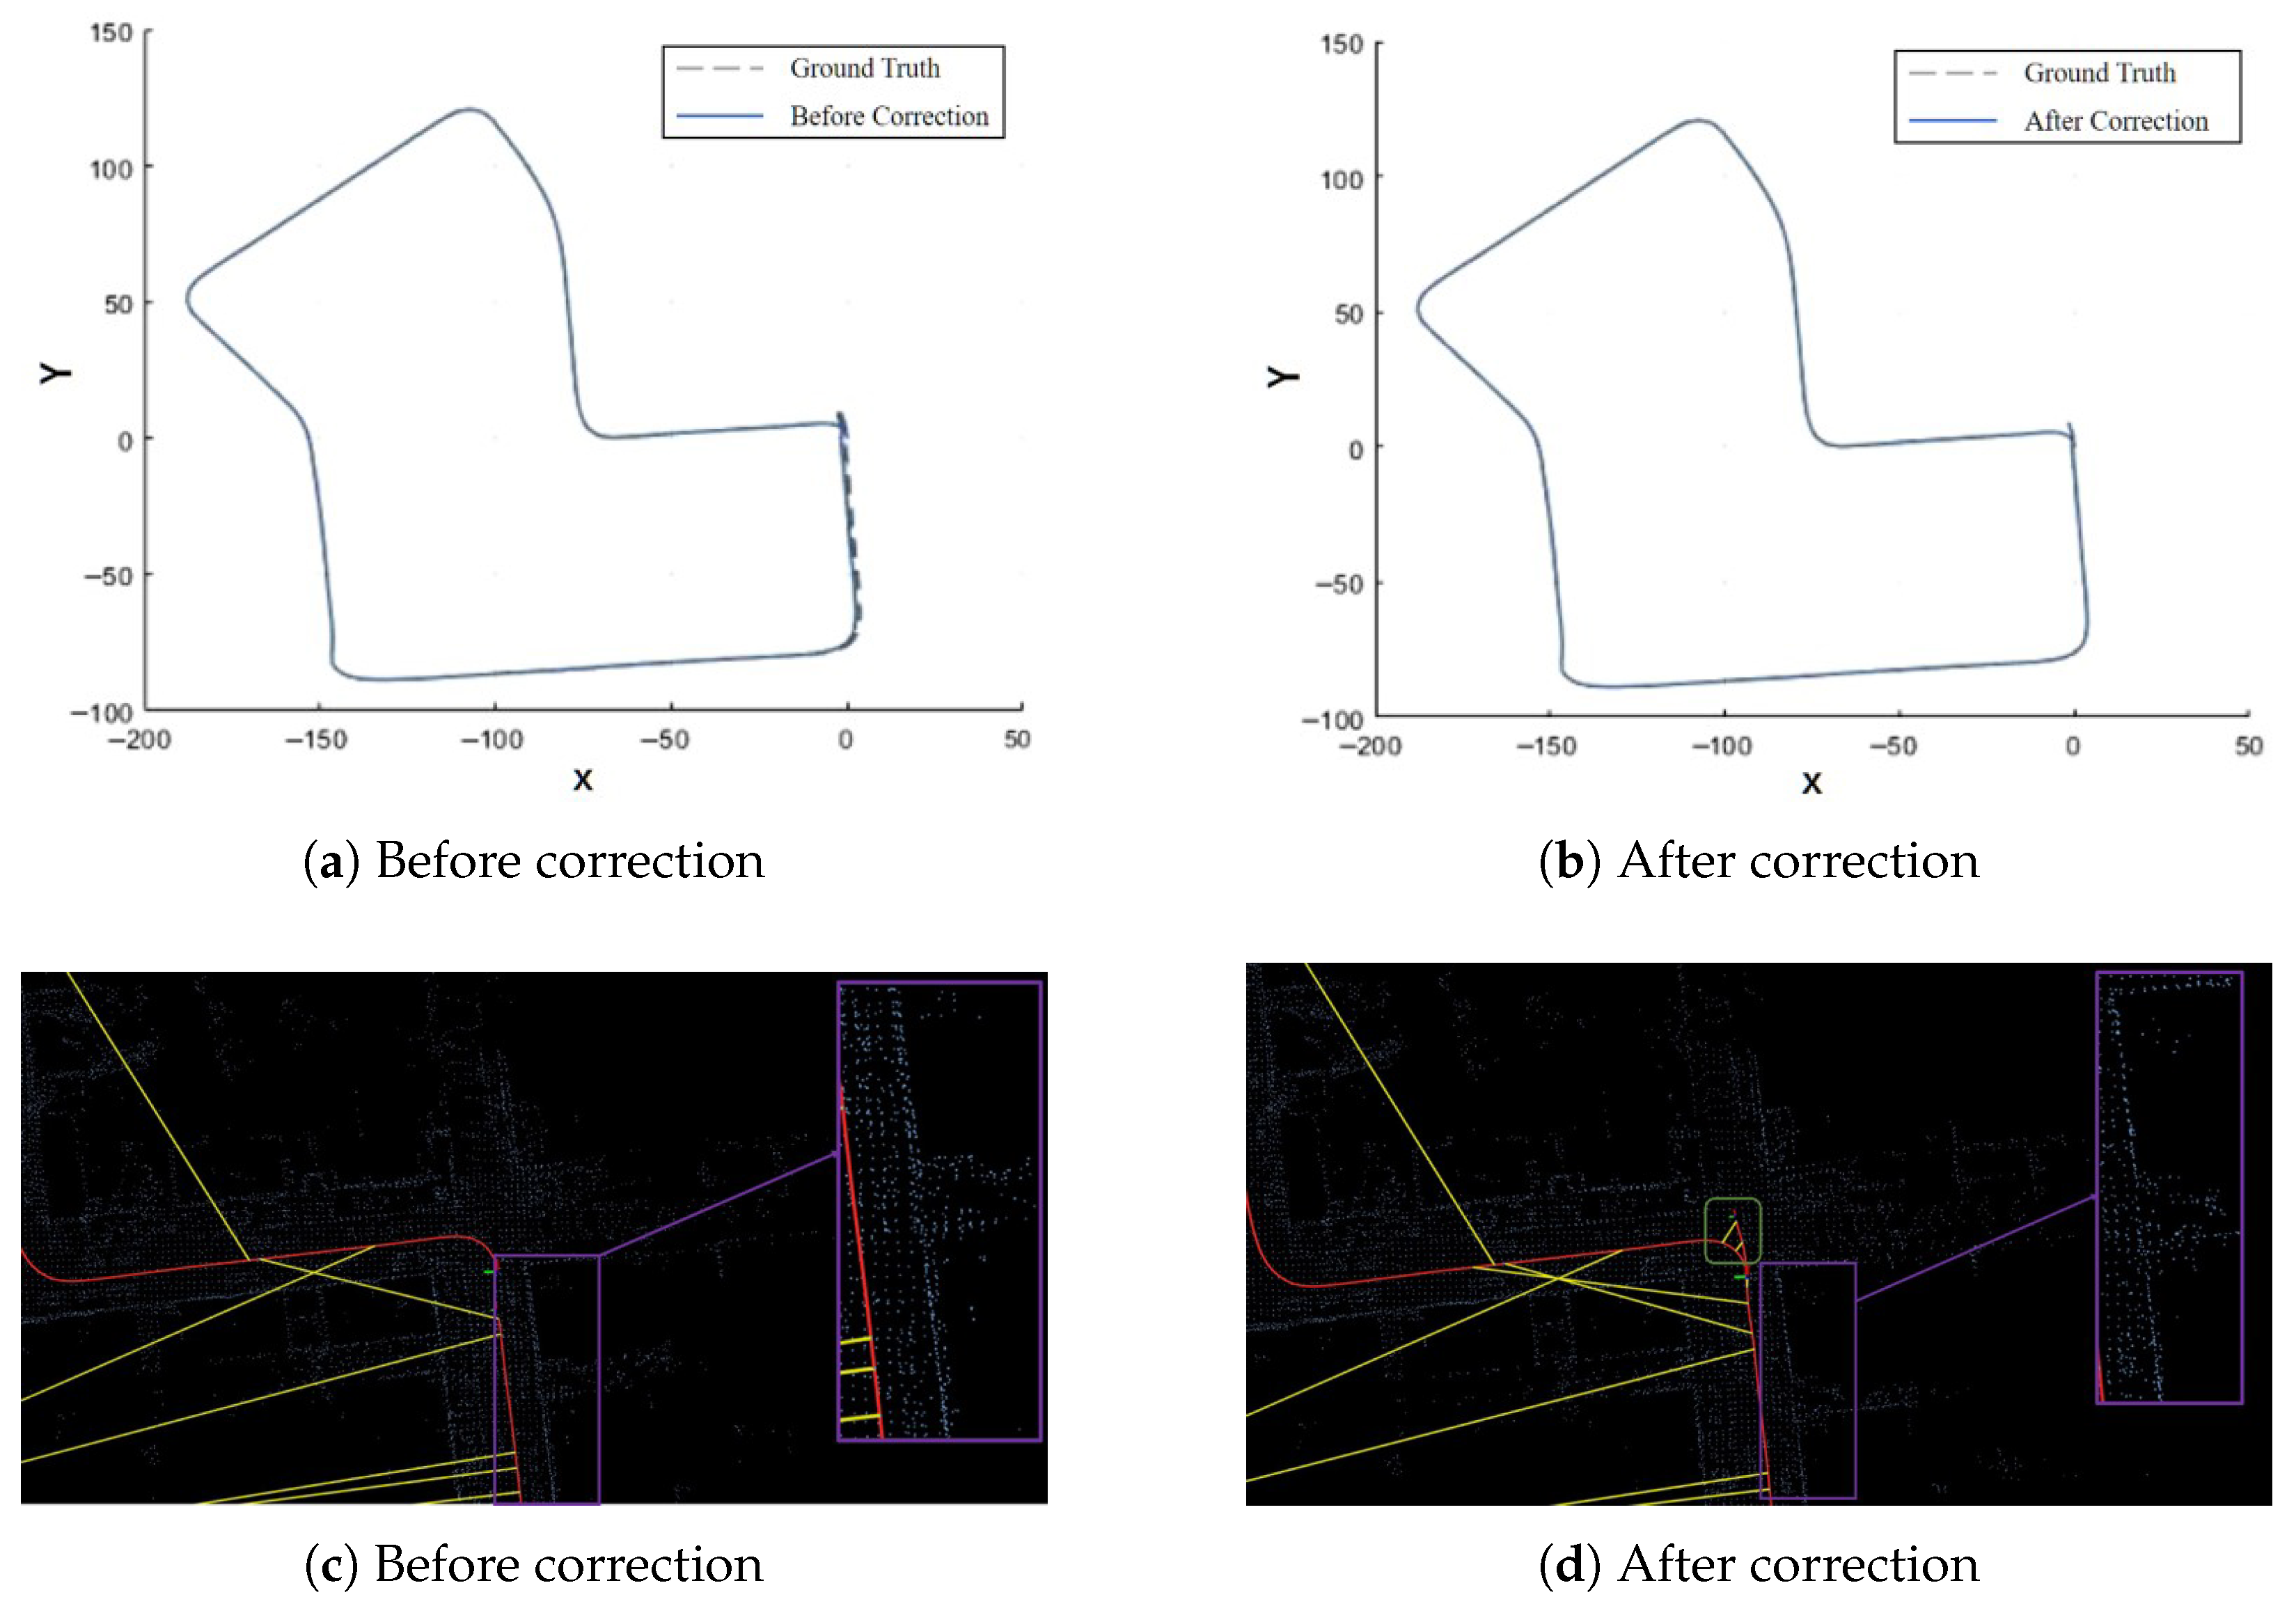
Table 4 reports the comparison of Absolute Trajectory Error (ATE) before and after loop closure correction on the KITTI07 sequence, when the proposed method is integrated into the SLAM system. Figure 5a,b illustrate the estimated motion paths before and after loop closure correction, respectively. After correction, the estimated path shows improved alignment with the ground truth, particularly in the loop region where the start and end points coincide. Quantitatively, the cumulative drift is effectively suppressed: the endpoint offset is reduced from approximately 0.8 m before correction to about 0.4 m after correction. Figure 5c,d further compare the local maps constructed before and after loop closure correction on the KITTI07 sequence. The uncorrected map exhibits noticeable ghosting effects (e.g., blurred building boundaries), whereas the corrected map presents clearer and more consistent structural details.
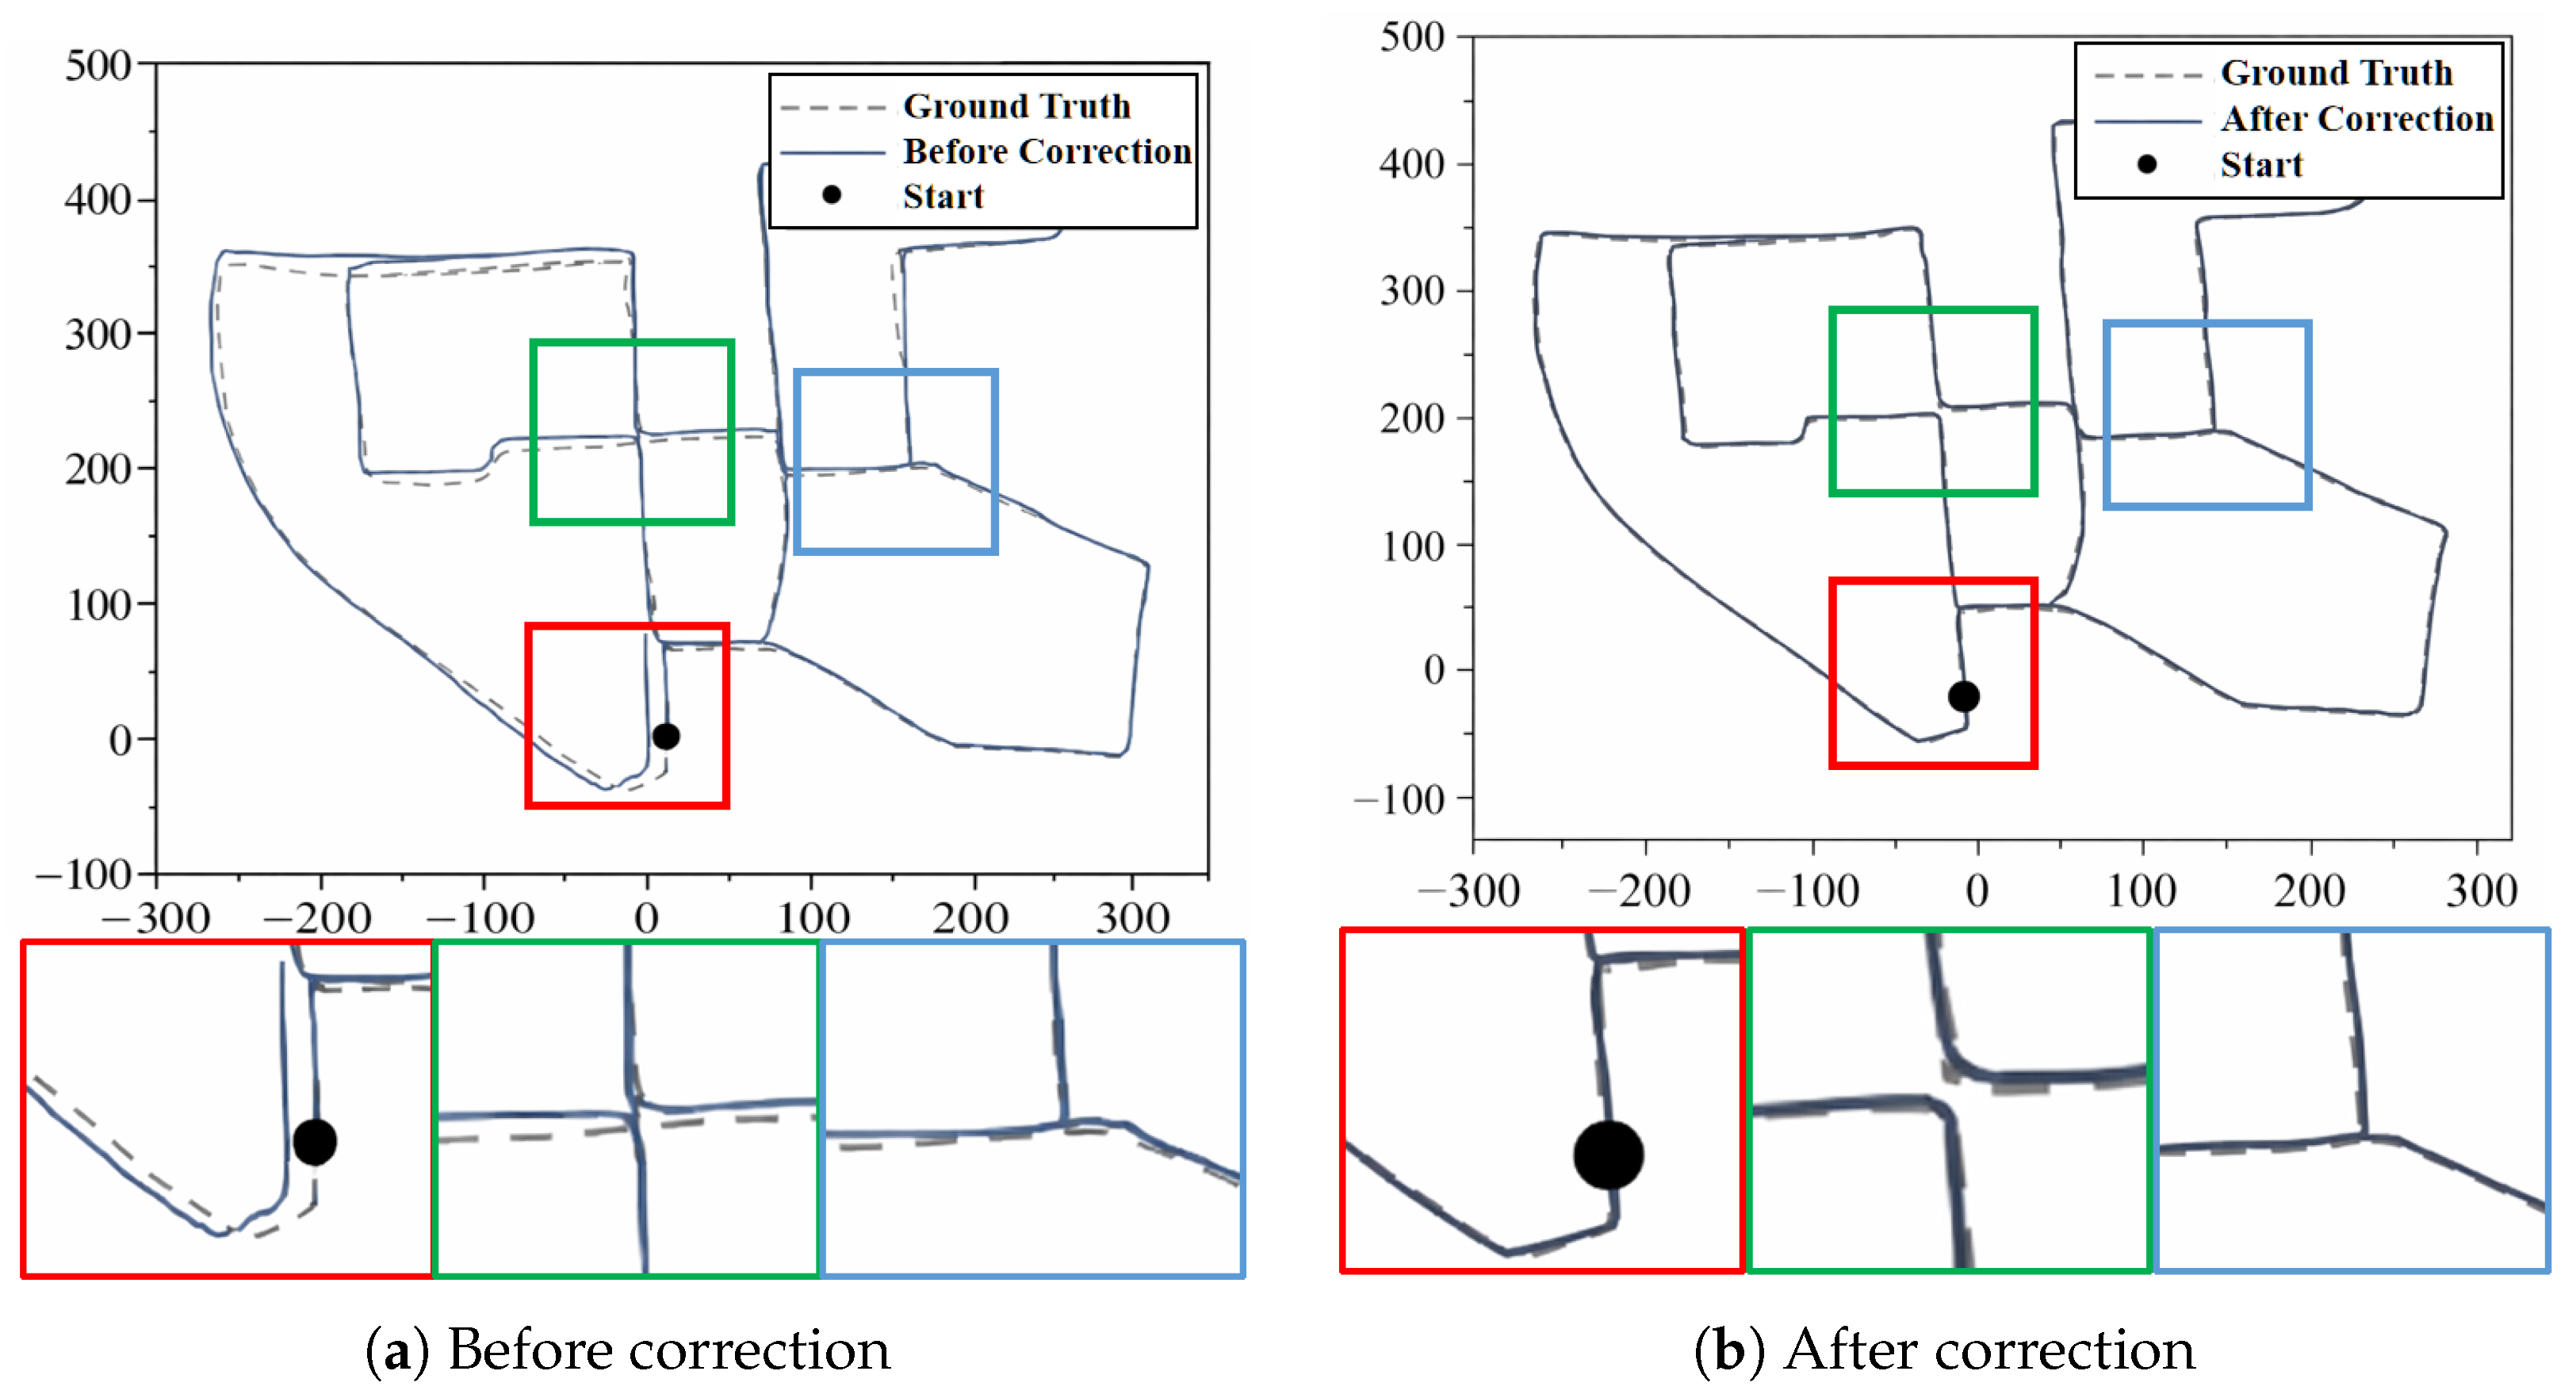
In addition, qualitative results on the KITTI00 sequence are provided to further demonstrate the effectiveness of the proposed loop closure detection method. Figure 6a shows the estimated motion path before loop closure correction, along with three zoomed-in regions highlighting local misalignments. Figure 6b presents the corrected motion path with the same local regions enlarged. After loop closure correction, the accumulated drift is significantly reduced, and the local structures exhibit improved alignment and continuity, indicating enhanced global consistency of the estimated motion path.

4.3. Results on the NCLT Dataset

The NCLT dataset includes diverse indoor–outdoor mixed environments (e.g., campus corridors, outdoor lawns) and significant seasonal variations, imposing greater challenges on the robustness of loop closure detection algorithms. Table 5 compares the F1-scores of different methods on the NCLT1 and NCLT2 sequences, while Figure 4c,d shows their corresponding Precision–Recall (PR) curves. As shown in Table 5 and Figure 4, the proposed algorithm achieves the highest F1-scores across both sequences, with an average of 77.63%. This represents an improvement of 10.16% over the LiDAR-only Map Closure method and 47.75% over the vision-only DBoW2 approach. Compared with the multimodal iBTC method, the proposed algorithm achieves an additional 3.61% increase in average F1-score. This performance gain is mainly attributed to the enhanced RANSAC-based geometric verification and the complementary use of visual texture information, which together improve robustness under noisy and challenging conditions. For instance, the NCLT2 sequence contains winter snow scenes, where LiDAR point clouds are heavily affected by reflections from snow surfaces. In such cases, visual texture cues effectively complement LiDAR geometric features during verification, helping suppress false matches and improve detection reliability. Notably, the proposed method achieves an F1-score of 0.7884 on the NCLT2 sequence, significantly outperforming all other methods. This result demonstrates enhanced robustness in challenging scenes, where complementary visual texture cues compensate for the reduced discriminability of LiDAR geometric features.
Table 6 presents the comparison of loop closure detection performance on the NCLT dataset before and after removing the visual modality from the proposed algorithm. As shown, integrating visual information leads to consistent improvements across all four sequences, with an average increase of 42.75 detected loops and an average rise of 0.56% in maximum similarity.These results confirm the algorithm’s enhanced capability for loop recognition in complex environments. For example, in the NCLT1 sequence, where dense tree occlusions cause sparse LiDAR point clouds and incomplete geometric features, the proposed method successfully identifies more loop closures by incorporating visual texture cues. This demonstrates the effectiveness of LiDAR–vision fusion in improving detection completeness and robustness under challenging outdoor conditions.
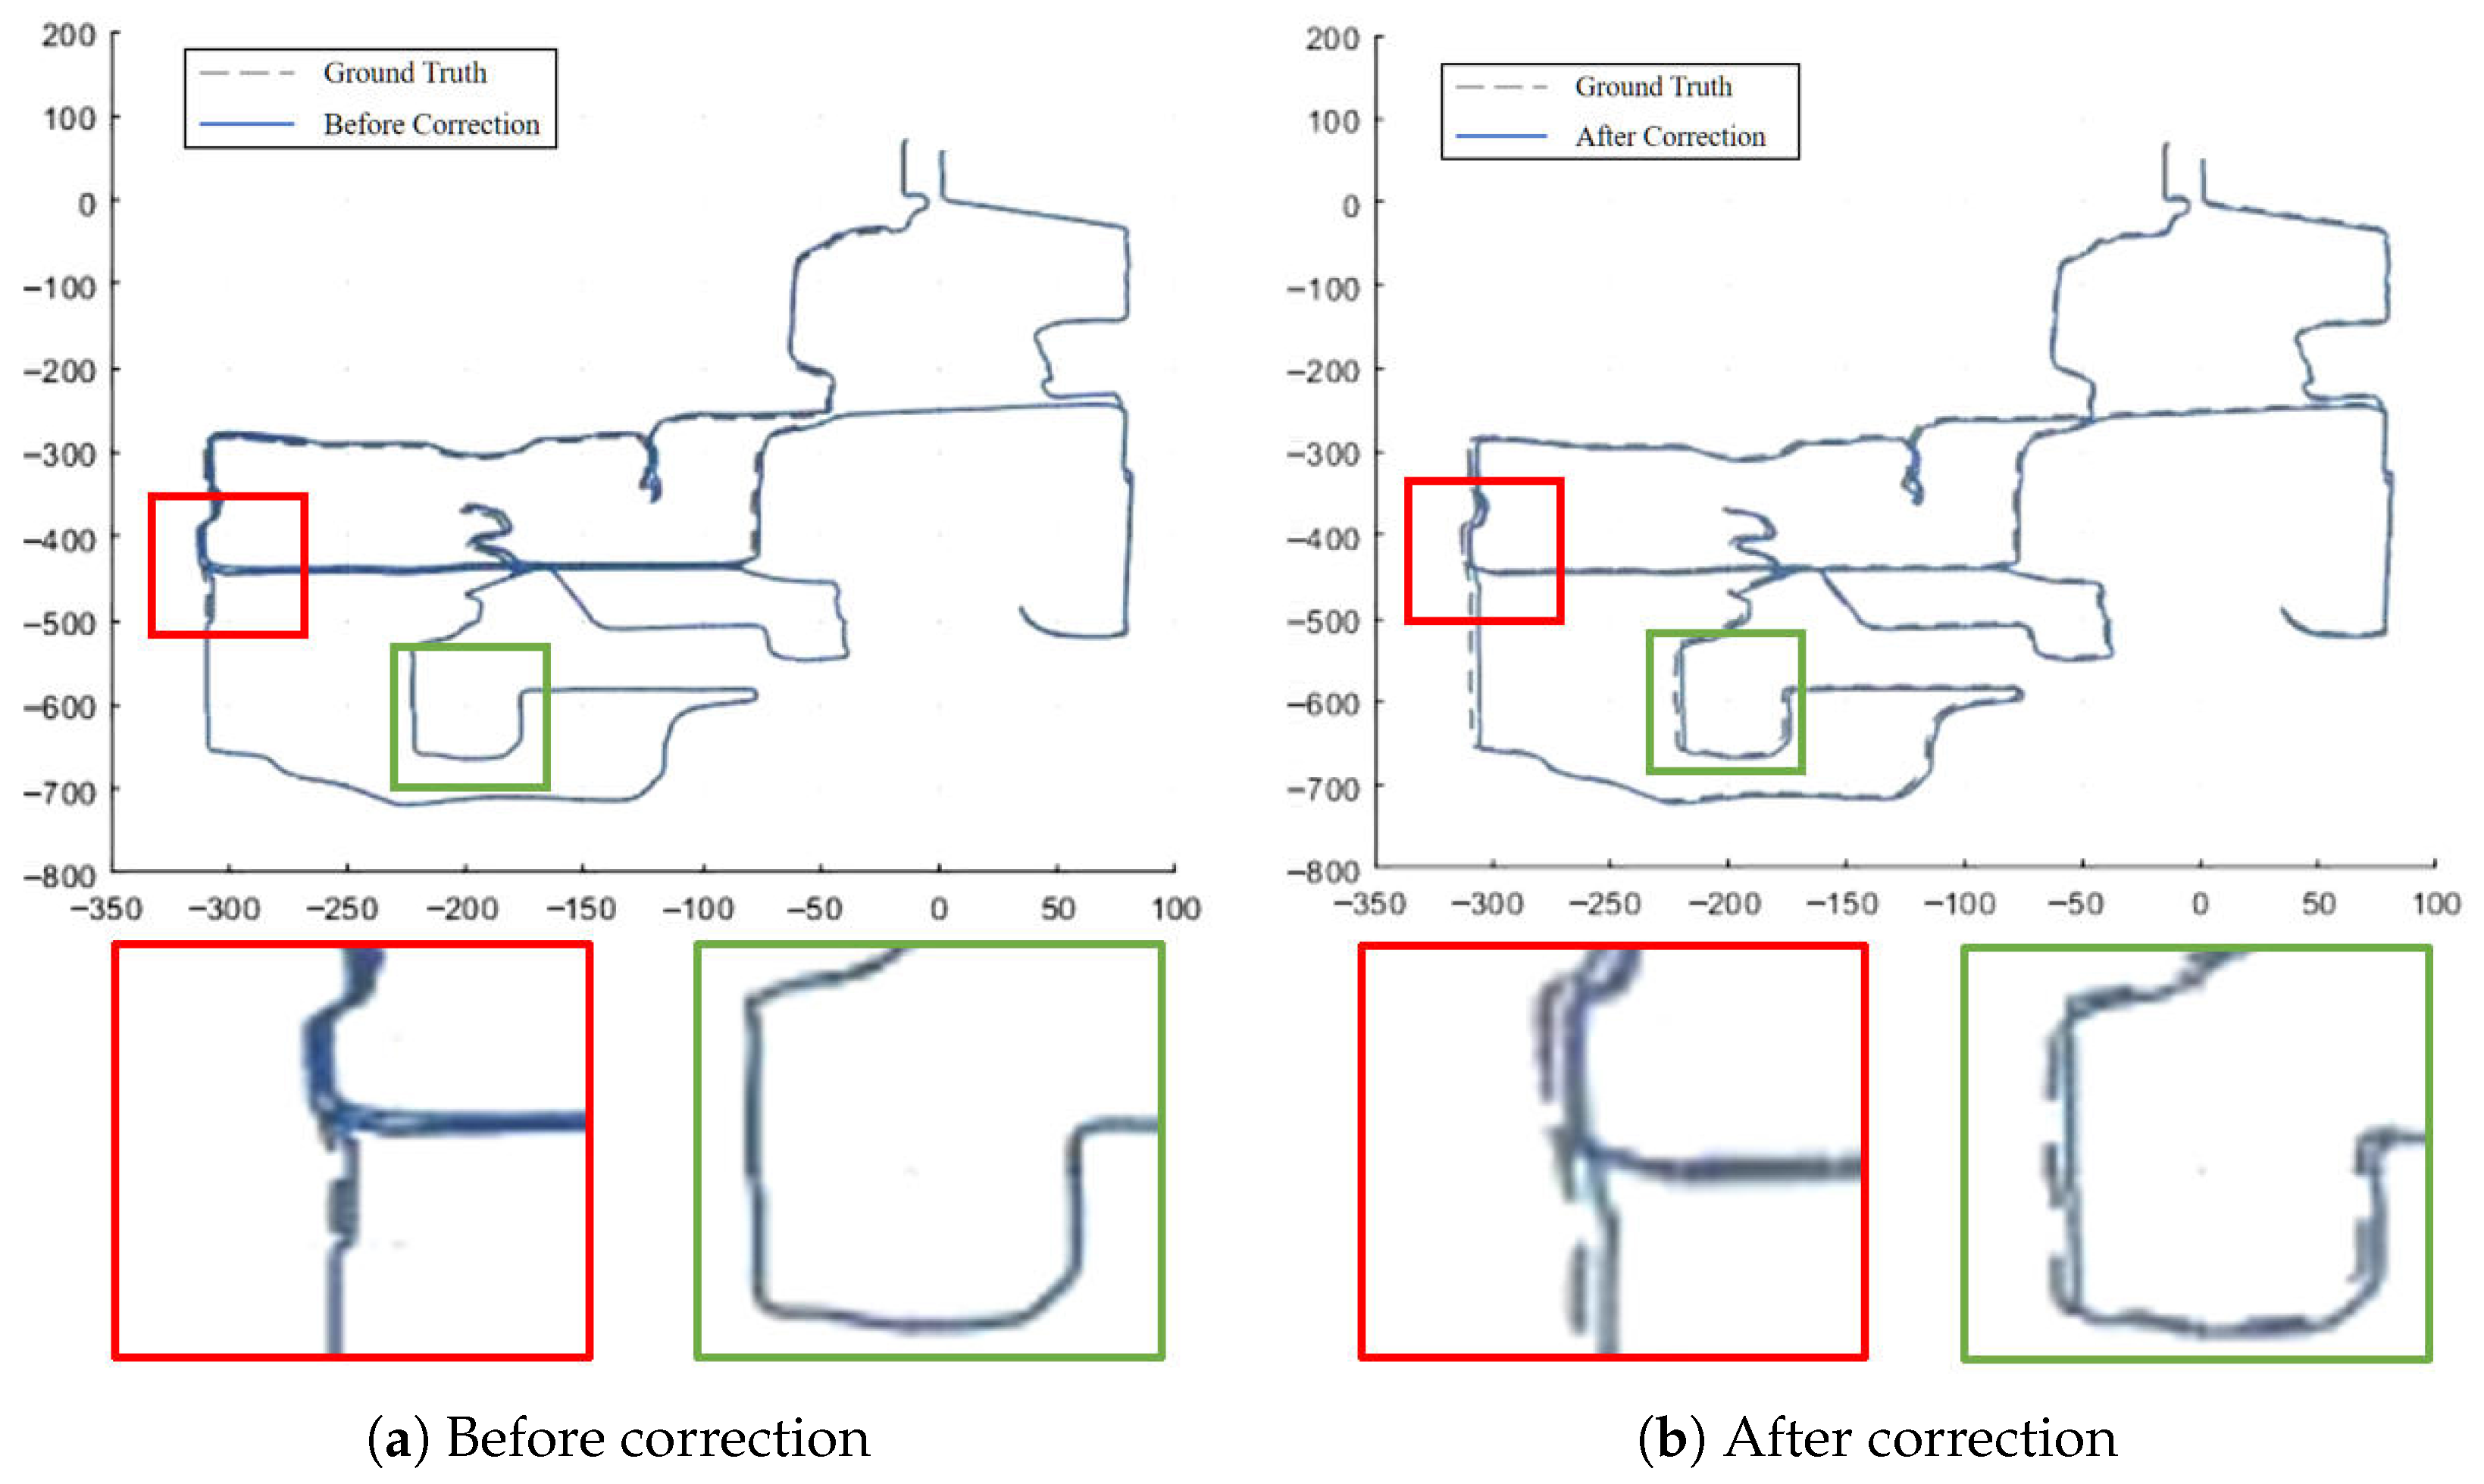
Table 7 compares the ATE before and after loop closure correction on the NCLT4 sequence, and Figure 7 illustrates the corresponding motion path comparison.The NCLT4 sequence includes long indoor corridors (textureless regions) as well as open outdoor areas, posing significant challenges for loop closure detection. By leveraging LiDAR–vision fusion, the proposed algorithm effectively addresses both the lack of LiDAR features in indoor textureless regions and the visual matching errors caused by strong illumination in outdoor scenes. After applying loop closure correction, the motion path deviation in the indoor corridor section is reduced from approximately 1.2 m before correction to 0.8 m after correction, indicating that the proposed method significantly improves pose accuracy and consistency in mixed indoor–outdoor environments.

4.4. Runtime Analysis

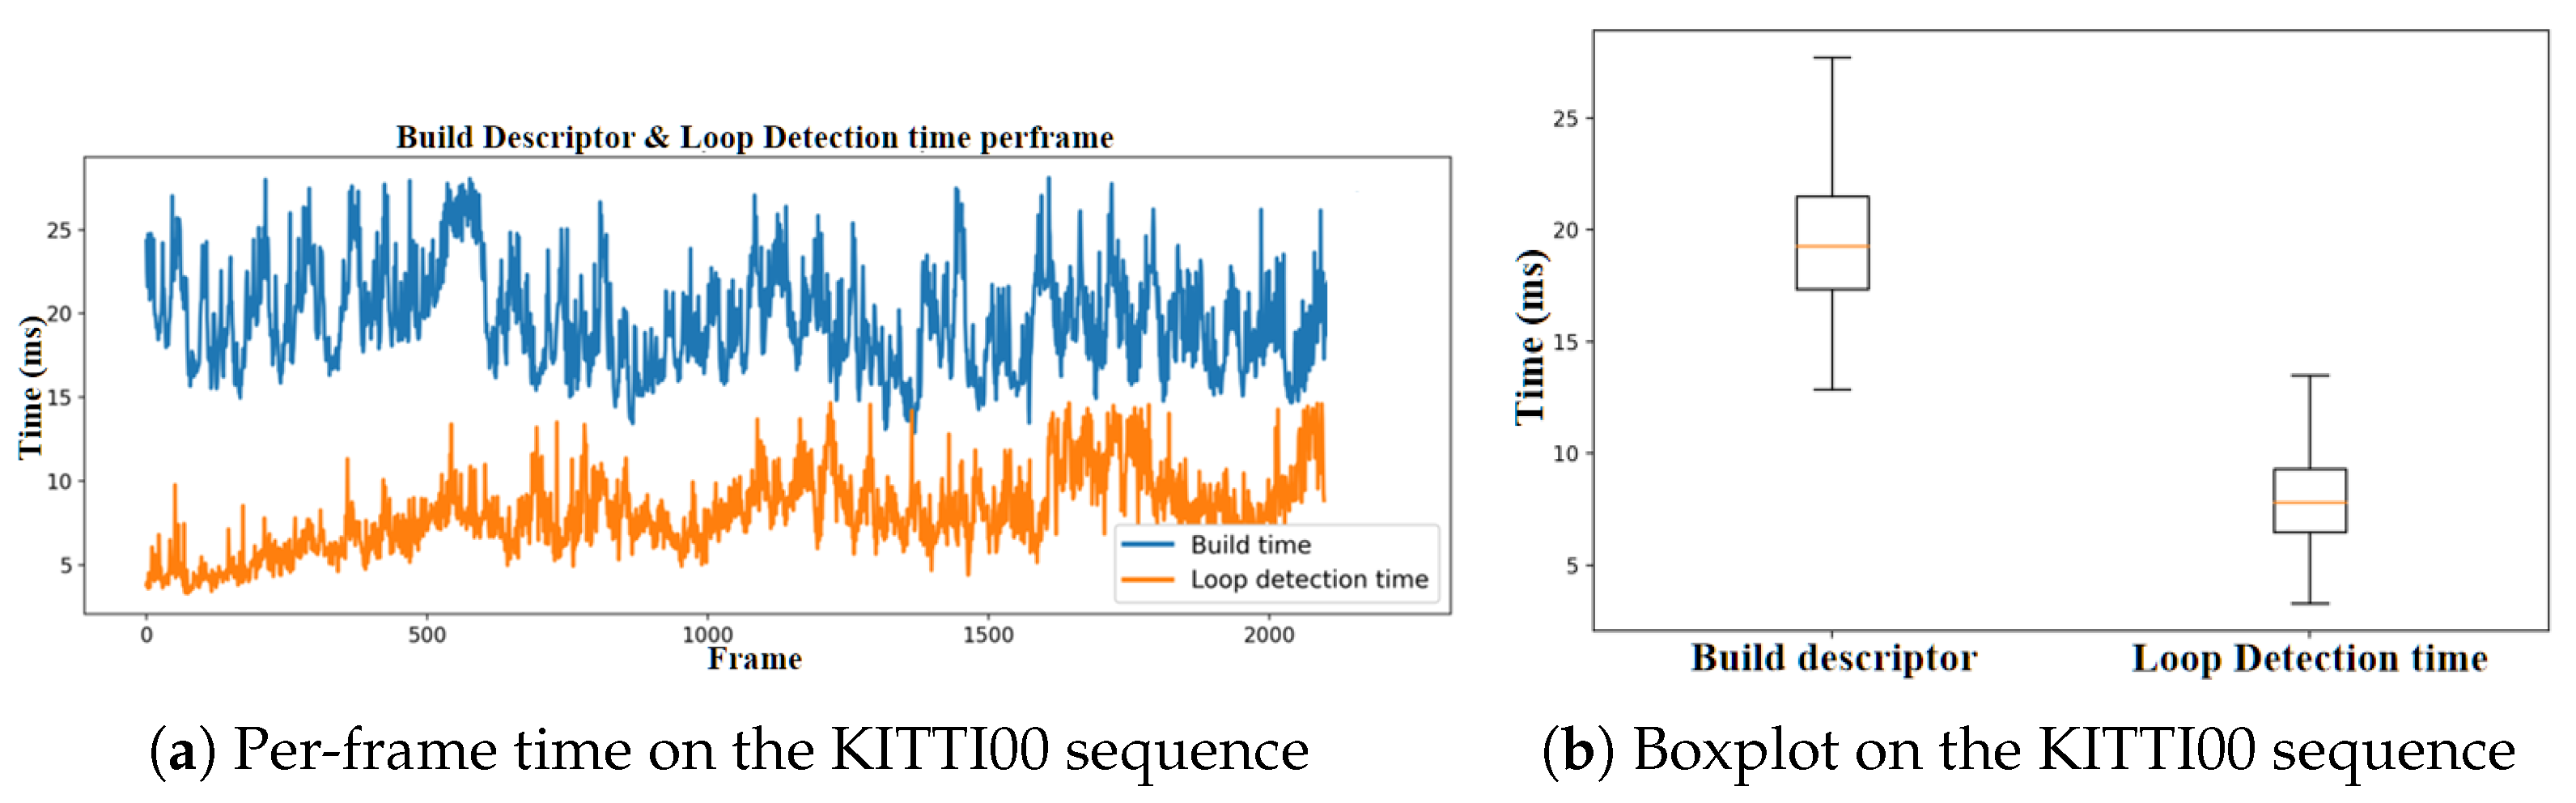
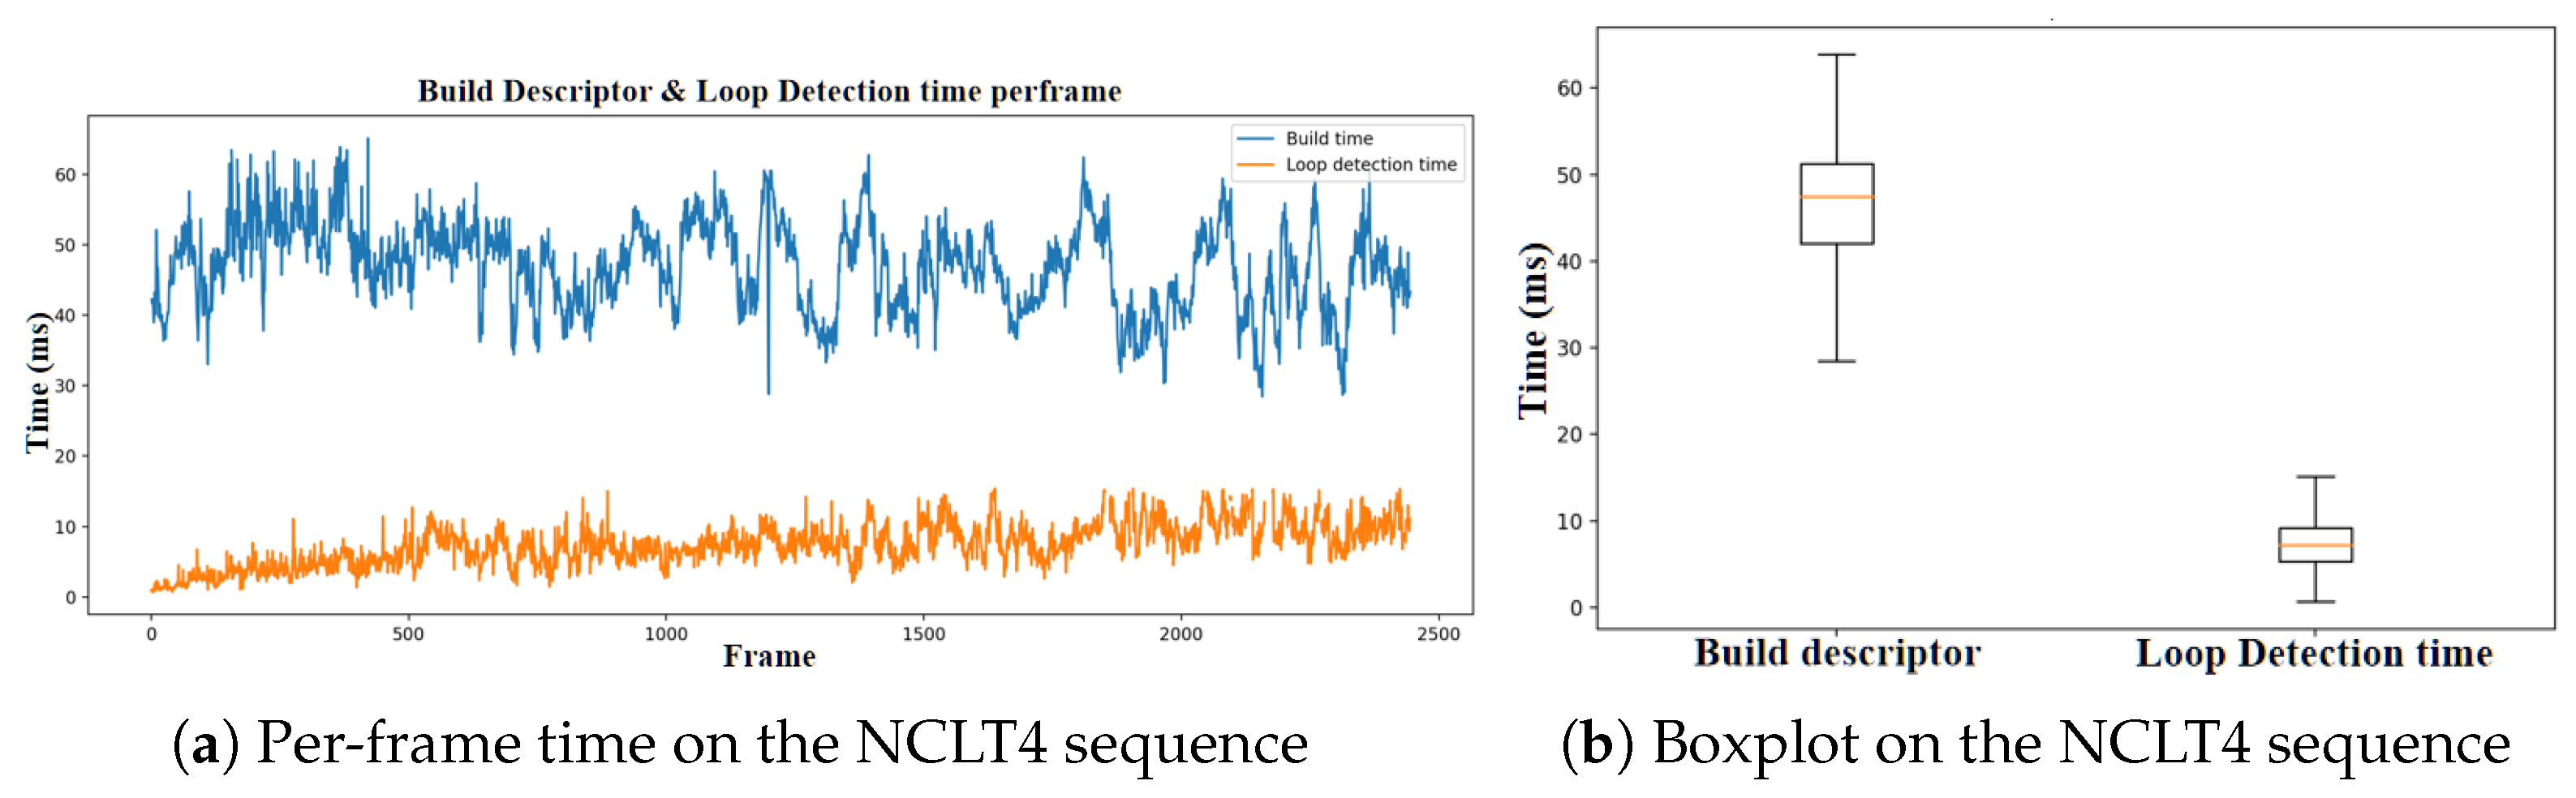
Figure 8 and Figure 9 present the per-frame runtime statistics of the proposed method on the KITTI00 and NCLT4 sequences, respectively. On the KITTI00 sequence, descriptor construction requires approximately 15–25 ms per frame, while loop closure detection consumes about 5–15 ms per frame. On the more challenging NCLT4 sequence, the descriptor construction time increases to around 30–60 ms per frame, whereas the loop closure detection time remains comparable to that on KITTI.
The higher average computational cost on the NCLT dataset can be attributed to several factors. First, NCLT contains mixed indoor–outdoor environments with lower platform speed, leading to denser point clouds and more complex local structures. Second, compared with KITTI scenes that are dominated by planar structures (e.g., roads and building facades), NCLT environments include a larger proportion of non-planar elements such as trees, vegetation, and complex buildings, which increases the number of effective points and the difficulty of descriptor construction. In contrast, the loop closure detection stage exhibits similar runtime across both datasets, indicating stable retrieval efficiency. Overall, the proposed method is able to meet real-time requirements in practical SLAM systems.

5. Conclusions

This paper proposes a LiDAR–vision depth fusion algorithm for loop closure detection in SLAM systems, addressing the limitations of single-modality methods and shortcomings of existing fusion approaches. The key findings of this work are summarized as follows:
  • A tightly coupled LiDAR–vision fusion framework is developed, which achieves effective geometry–texture association through spatiotemporal alignment, depth completion, hybrid feature fusion, and improved RANSAC-based geometric verification.
  • Quantitative evaluations on public datasets demonstrate the effectiveness of the proposed approach. On the KITTI dataset, the proposed method achieves an average F1-score of 85.28%, outperforming LiDAR-only, vision-only baselines, and representative multimodal methods.
  • On the more challenging NCLT dataset, which features long-term operation, seasonal changes, and mixed indoor–outdoor environments, the proposed method attains an average F1-score of 77.63%, demonstrating improved robustness in scenarios where geometric or visual cues alone become unreliable.
Despite these advantages, the proposed method does not explicitly model dynamic objects and is primarily designed for loop closure detection based on stable and repeatable structural elements in the environment. Dynamic objects typically introduce inconsistent geometric correspondences and are therefore implicitly suppressed by sparse geometric descriptor construction and robust RANSAC verification. However, performance in highly dynamic environments remains a limitation of the current approach. Future research directions include:
  • Investigating dynamic feature filtering strategies to explicitly handle highly dynamic environments.
  • Exploring adaptive depth fusion mechanisms to improve robustness under sparse or noisy depth observations.
  • Optimizing computational efficiency to further enhance real-time performance and facilitate deployment on embedded robotic platforms.

Author Contributions

Conceptualization, R.C. and M.L.; methodology, B.L.; software, R.C. and Y.Z.; validation, B.L. and M.L.; formal analysis, B.L. and P.W.; investigation, B.L. and R.C.; resources, B.L.; data curation, R.C. and M.L.; writing—original draft preparation, Y.Z. and M.L.; writing—review and editing, B.L., Y.Z. and M.L.;visualization, R.C. and M.L.; supervision, B.L. and P.W.; project administration, B.L. and P.W. All authors have read and agreed to the published version of the manuscript.

Funding

This research received no external funding.

Data Availability Statement

Data are contained within the article.

Conflicts of Interest

The authors declare no conflicts of interest.

References

  1. Mur-Artal, R.; Montiel, J.M.M.; Tardós, J.D. ORB-SLAM: A Versatile and Accurate Monocular SLAM System. IEEE Trans. Robot. 2015, 31, 1147–1163. [Google Scholar] [CrossRef]
  2. Qin, T.; Li, P.; Shen, S. VINS-Mono: A Robust and Versatile Monocular Visual-Inertial State Estimator. IEEE Trans. Robot. 2018, 34, 1004–1020. [Google Scholar] [CrossRef]
  3. Peng, R.; Gong, C.; Zhao, S. Multi-Sensor Information Fusion with Multi-Scale Adaptive Graph Convolutional Networks for Abnormal Vibration Diagnosis of Rolling Mill. Machines 2025, 13, 30. [Google Scholar] [CrossRef]
  4. Wen, S.; Long, Y.; Li, P.; Wang, B.; Qiu, T.Z. Semantic Constellation Place Recognition Algorithm Based on Scene Text. IEEE Trans. Instrum. Meas. 2025, 74, 1–9. [Google Scholar] [CrossRef]
  5. Kim, G.; Kim, A. Scan Context: Egocentric Spatial Descriptor for Place Recognition Within 3D Point Cloud Map. In Proceedings of the 2018 IEEE/RSJ International Conference on Intelligent Robots and Systems (IROS), Madrid, Spain, 1–5 October 2018; pp. 4802–4809. [Google Scholar]
  6. Kim, G.; Choi, S.; Kim, A. Scan Context++: Structural Place Recognition Robust to Rotation and Lateral Variations in Urban Environments. IEEE Trans. Robot. 2022, 38, 1856–1874. [Google Scholar] [CrossRef]
  7. Jiang, B.; Shen, S. Contour Context: Abstract Structural Distribution for 3D LiDAR Loop Detection and Metric Pose Estimation. In Proceedings of the 2023 IEEE International Conference on Robotics and Automation (ICRA), London, UK, 29 May–2 June 2023; pp. 8386–8392. [Google Scholar]
  8. Cui, Y.; Chen, X.; Zhang, Y.; Dong, J.; Wu, Q.; Zhu, F. BoW3D: Bag of Words for Real-Time Loop Closing in 3D LiDAR SLAM. IEEE Robot. Autom. Lett. 2023, 8, 2828–2835. [Google Scholar] [CrossRef]
  9. Galvez-López, D.; Tardos, J.D. Bags of Binary Words for Fast Place Recognition in Image Sequences. IEEE Trans. Robot. 2012, 28, 1188–1197. [Google Scholar] [CrossRef]
  10. Wen, S.; Tao, S.; Liu, X.; Babiarz, A.; Yu, F.R. CD-SLAM: A Real-Time Stereo Visual–Inertial SLAM for Complex Dynamic Environments With Semantic and Geometric Information. IEEE Trans. Instrum. Meas. 2024, 73, 1–8. [Google Scholar] [CrossRef]
  11. Liu, Z.; Tang, H.; Amini, A.; Yang, X.; Mao, H.; Rus, D.L.; Han, S. BEVFusion: Multi-Task Multi-Sensor Fusion with Unified Bird’s-Eye View Representation. In Proceedings of the 2023 IEEE International Conference on Robotics and Automation (ICRA), London, UK, 29 May–2 June 2023; pp. 2774–2781. [Google Scholar]
  12. Pan, Y.; Xu, X.; Li, W.; Cui, Y.; Wang, Y.; Xiong, R. CORAL: Colored structural representation for bi-modal place recognition. In Proceedings of the 2021 IEEE/RSJ International Conference on Intelligent Robots and Systems (IROS), Prague, Czech Republic, 27 September–1 October 2021; pp. 2084–2091. [Google Scholar]
  13. Vora, S.; Lang, A.H.; Helou, B.; Beijbom, O. PointPainting: Sequential Fusion for 3D Object Detection. In Proceedings of the 2020 IEEE/CVF Conference on Computer Vision and Pattern Recognition (CVPR), Seattle, WA, USA, 13–19 June 2020; pp. 4603–4611. [Google Scholar]
  14. Zhao, L.; Zhou, H.; Zhu, X.; Song, X.; Li, H.; Tao, W. LIF-Seg: LiDAR and Camera Image Fusion for 3D LiDAR Semantic Segmentation. IEEE Trans. Multimed. 2024, 26, 1158–1168. [Google Scholar] [CrossRef]
  15. Bai, X.; Hu, Z.; Zhu, X.; Huang, Q.; Chen, Y.; Fu, H.; Tai, C.L. TransFusion: Robust LiDAR-Camera Fusion for 3D Object Detection with Transformers. In Proceedings of the 2022 IEEE/CVF Conference on Computer Vision and Pattern Recognition (CVPR), New Orleans, LA, USA, 18–24 June 2022; pp. 1080–1089. [Google Scholar] [CrossRef]
  16. Lv, X.; He, Z.; Yang, Y.; Nie, J.; Dong, Z.; Wang, S.; Gao, M. MSF-SLAM: Multi-Sensor-Fusion-Based Simultaneous Localization and Mapping for Complex Dynamic Environments. IEEE Trans. Intell. Transp. Syst. 2024, 25, 19699–19713. [Google Scholar] [CrossRef]
  17. Zhao, X.; Wen, C.; Manoj Prakhya, S.; Yin, H.; Zhou, R.; Sun, Y.; Xu, J.; Bai, H.; Wang, Y. Multimodal Features and Accurate Place Recognition With Robust Optimization for Lidar–Visual–Inertial SLAM. IEEE Trans. Instrum. Meas. 2024, 73, 1–16. [Google Scholar] [CrossRef]
  18. Besl, P.; McKay, N.D. A method for registration of 3-D shapes. IEEE Trans. Pattern Anal. Mach. Intell. 1992, 14, 239–256. [Google Scholar] [CrossRef]
  19. Biber, P.; Strasser, W. The normal distributions transform: A new approach to laser scan matching. In Proceedings of the Proceedings 2003 IEEE/RSJ International Conference on Intelligent Robots and Systems (IROS 2003) (Cat. No.03CH37453), Las Vegas, Nevada, USA, 27 October–1 November 2003; Volume 3, pp. 2743–2748. [Google Scholar]
  20. Cui, Y.; Zhang, Y.; Dong, J.; Sun, H.; Chen, X.; Zhu, F. LinK3D: Linear Keypoints Representation for 3D LiDAR Point Cloud. IEEE Robot. Autom. Lett. 2024, 9, 2128–2135. [Google Scholar]
  21. Gupta, S.; Guadagnino, T.; Mersch, B.; Vizzo, I.; Stachniss, C. Effectively Detecting Loop Closures using Point Cloud Density Maps. In Proceedings of the 2024 IEEE International Conference on Robotics and Automation (ICRA), Yokohama, Japan, 13–17 May 2024; pp. 10260–10266. [Google Scholar]
  22. Pirotti, F.; Ravanelli, R.; Fissore, F.; Masiero, A. Implementation and assessment of two density-based outlier detection methods over large spatial point clouds. Open Geospat. Data Softw. Stand. 2018, 3, 14. [Google Scholar] [CrossRef]
  23. Bay, H.; Tuytelaars, T.; Van Gool, L. SURF: Speeded Up Robust Features. In Proceedings of the Computer Vision—ECCV 2006; Leonardis, A., Bischof, H., Pinz, A., Eds.; Springer: Berlin/Heidelberg, Germany, 2006; pp. 404–417. [Google Scholar]
  24. Dalal, N.; Triggs, B. Histograms of oriented gradients for human detection. In Proceedings of the 2005 IEEE Computer Society Conference on Computer Vision and Pattern Recognition (CVPR’05), San Diego, CA, USA, 20–26 June 2005; Volume 1, pp. 886–893. [Google Scholar]
  25. Bai, Y.; Guo, L.; Jin, L.; Huang, Q. A novel feature extraction method using Pyramid Histogram of Orientation Gradients for smile recognition. In Proceedings of the 2009 16th IEEE International Conference on Image Processing (ICIP), Cairo, Egypt, 7–10 November 2009; pp. 3305–3308. [Google Scholar]
  26. Cummins, M.; Newman, P. Appearance-only SLAM at large scale with FAB-MAP 2.0. Int. J. Robot. Res. 2011, 30, 1100–1123. [Google Scholar]
  27. Zou, Z.; Zheng, C.; Yuan, C.; Zhou, S.; Xue, K.; Zhang, F. iBTC: An Image-Assisting Binary and Triangle Combined Descriptor for Place Recognition by Fusing LiDAR and Camera Measurements. IEEE Robot. Autom. Lett. 2024, 9, 10858–10865. [Google Scholar] [CrossRef]
  28. Komorowski, J.; Wysoczańska, M.; Trzcinski, T. MinkLoc++: Lidar and Monocular Image Fusion for Place Recognition. In Proceedings of the 2021 International Joint Conference on Neural Networks (IJCNN), Shenzhen, China, 18–22 July 2021; pp. 1–8. [Google Scholar]
  29. Zeng, Y.; Zhang, D.; Wang, C.; Miao, Z.; Liu, T.; Zhan, X.; Hao, D.; Ma, C. LIFT: Learning 4D LiDAR Image Fusion Transformer for 3D Object Detection. In Proceedings of the 2022 IEEE/CVF Conference on Computer Vision and Pattern Recognition (CVPR), New Orleans, LA, USA, 18–24 June 2022; pp. 17151–17160. [Google Scholar]
  30. Harris, C.G.; Stephens, M.J. A Combined Corner and Edge Detector. In Proceedings of the Alvey Vision Conference, Manchester, UK, 31 August–2 September 1988. [Google Scholar]
  31. Fischler, M.A.; Bolles, R.C. Random sample consensus: A paradigm for model fitting with applications to image analysis and automated cartography. Commun. ACM 1981, 24, 381–395. [Google Scholar] [CrossRef]
  32. Geiger, A.; Lenz, P.; Stiller, C.; Urtasun, R. Vision meets robotics: The KITTI dataset. Int. J. Rob. Res. 2013, 32, 1231–1237. [Google Scholar]
  33. Carlevaris-Bianco, N.; Ushani, A.K.; Eustice, R.M. University of Michigan North Campus long-term vision and lidar dataset. Int. J. Robot. Res. 2015, 35, 1023–1035. [Google Scholar] [CrossRef]
Figure 1. Framework of the LiDAR–Vision Fusion Loop Closure Detection Algorithm.
Machines 14 00282 g001
Figure 2. Back-projection of 2D visual keypoints into 3D space under the pinhole camera model.
Machines 14 00282 g002
Figure 3. Pipeline illustration of LiDAR keypoint extraction and triangular descriptor construction.
Machines 14 00282 g003
Figure 4. Comparison of PR Curves on the KITTI and NCLT Dataset.
Machines 14 00282 g004
Figure 5. Motion path comparison before and after loop closure correction on the KITTI07 sequence. Subfigures (a,b) show the estimated motion paths before and after loop closure correction, respectively. Subfigures (c,d) present comparisons of local motion paths and mapping results. In these subfigures, the red lines denote the estimated motion paths, while the yellow lines indicate frame-to-frame matching correspondences, including both correct and incorrect matches. Local details are further highlighted using purple bounding boxes.
Machines 14 00282 g005
Figure 6. Motion path before and after loop closure correction on the KITTI00 sequence. Local trajectory details are highlighted using red, green, and blue bounding boxes.
Machines 14 00282 g006
Figure 7. Motion path Comparison Before and After Loop Closure Correction on NCLT4 Sequence. Local trajectory details are highlighted using red, and green bounding boxes.
Machines 14 00282 g007
Figure 8. Per-frame runtime analysis of descriptor construction and loop closure detection on the KITTI00 sequence. (a) shows the per-frame runtime trends of descriptor construction and loop closure detection with respect to the frame ID, while (b) presents the corresponding boxplots, illustrating the runtime distribution of descriptor construction and loop closure detection.
Machines 14 00282 g008
Figure 9. Per-frame runtime analysis of descriptor construction and loop closure detection on the NCLT4 sequence.
Machines 14 00282 g009
Table 1. Representative loop closure detection methods.
MethodModalityRepresentation
SC/SC++LiDARGlobal geometric descriptor
BoW3DLiDARBoW LiDAR fertures
Map ClosureLiADRDensity image BEV representation
HOG/PHOGVisionStatistics of gradient orientation distribution in images
DBoW2VisionBoW visual features
iBTCLiDAR + VisionBinary geometric descriptor
CoRAL/MinkLoc++LiDAR + VisionCNN-based method
BEVFusionLiDAR + VisionFused BEV features
ProposedLiDAR + VisionGeometry–texture hybrid
Table 2. Comparison of F1-Scores of Different Algorithms on KITTI Sequences.
MethodKITTI00KITTI02KITTI05Average
Cont20.76220.68400.76780.7380
Map Closure0.81370.80150.80520.8068
DBoW20.65370.64970.75970.6877
iBTC0.81280.82500.80560.8145
Proposed0.85610.84150.86080.8528
Table 3. Comparison of Loop Closure Detection Results on KITTI Sequences.
Dataset SequenceProposed Method
/Without Visual
Proposed
Method
Detected
Loops
Max
Similarity
Detected
Loops
Max
Similarity
KITTI003510.9723590.979
KITTI021540.9531670.956
KITTI052520.9482550.951
KITTI081670.9611690.961
Table 4. Comparison of ATE Before and After Loop Closure Correction on the KITTI07 Sequence (m).
MaxMeanMedianMinRMSE
Before Correction0.8320.7280.7250.4620.667
After Correction0.7870.6910.6290.4670.630
Table 5. Comparison of F1-Scores of Different Algorithms on NCLT Sequences.
MethodNCLT1NCLT2Average
Cont20.64080.67060.6557
Map Closure0.65670.69270.6747
DBoW20.19080.40690.2989
iBTC0.70310.77720.7402
Proposed0.76420.78840.7763
Table 6. Comparison of Loop Closure Detection Results on NCLT Sequences.
Dataset SequenceProposed Method
/Without Visual
Proposed
Method
Detected
Loops
Max
Similarity
Detected
Loops
Max
Similarity
NCLT18210.9058870.907
NCLT26230.8916610.905
NCLT33880.9134120.919
NCLT44110.9104350.929
Table 7. Comparison of ATE Before and After Loop Closure Correction on the NCLT4 Sequence(m).
MaxMeanMedianMinRMSE
Before Correction1.3521.2541.2820.9911.092
After Correction1.2151.0581.0370.9420.928
Disclaimer/Publisher’s Note: The statements, opinions and data contained in all publications are solely those of the individual author(s) and contributor(s) and not of MDPI and/or the editor(s). MDPI and/or the editor(s) disclaim responsibility for any injury to people or property resulting from any ideas, methods, instructions or products referred to in the content.